Steam vs. Dry Reformer: Experimental Study on a Solid Oxide Fuel Cell Short Stack


Department of Engineering, University of Perugia, via G. Dranti 1/4A, 06125 Perugia, Italy
*
Author to whom correspondence should be addressed.
Catalysts 2018, 8(12), 599; https://doi.org/10.3390/catal8120599
Submission received: 30 September 2018
/
Revised: 14 November 2018
/
Accepted: 15 November 2018
/
Published: 2 December 2018
(This article belongs to the Special Issue Solid Oxide Fuel Cells – The Low Temperature Challenge)
Abstract
:Solid Oxide Fuel Cell (SOFC) systems operating with methane usually are equipped with an external reformer to produce syngas. The conventional applied technology is steam methane reforming. Recent studies, instead, are presenting dry reforming as potential alternative. Advantages come from the substitution of steam with CO2 to be handled in the system, representing a potential strategy of CO2 reuse. This study compares, the performance of a SOFC short stack operating with dry reforming and with steam reforming mixtures respectively. Results show that higher performances can be obtained under same operating conditions, due to the high concentration of syngas (that has low content of inert species) produced via dry reforming. The analysis of different dry reforming concentrations shows that the amount of methane seems to be more relevant, in terms of voltage performances, than high hydrogen concentration. Among tested dry reforming compositions, the most performing exhibits an improvement of at least 5% in produced voltage in the range 150–375 mA cm−2 with respect to mixture produced by steam reforming (S/C ratio of 2.5). It was also proved that this performance enhancement does not imply greater thermal stresses, since stack temperature slightly reduces and lower temperature variations arise at anode and cathode when operating current varies.
1. Introduction
One of the potential path to increase the efficiency of the energy system is the deployment of distributed production of energy with particular attention to high efficient cogeneration systems. In the range of micro systems (<100 kW) the most promising technology is the Solid Oxide Fuel Cell (SOFC) due to the high conversion efficiency and flexibility towards fuel composition [1]. SOFC systems integrate a high temperature fuel processing unit. To optimize temperature equilibrium and control, the SOFC stack and the fuel processor are integrated in a so called hot box where fuel is introduced and off gases are exiting the unit. Heat recovery is optimized inside the hotbox. Natural gas is transformed in the system into a mixture of hydrogen and carbon monoxide (i.e., syngas) before entering the SOFC stack. According to the conventional steam methane reforming (SMR) technology, steam is mixed with methane so that hydrogen is recovered from both species according to the following reaction (1):
The product of the reaction is a mixture of hydrogen and carbon monoxide with higher concentration of the first compound. Thermodynamic conditions and system peculiarities are main cause for composition variation, with a predominant effect produced by steam content in the reactants. The increase in the steam to carbon ratio (S/C) moves the reaction to the products but, at the same time, increases the dilution of active species, H2 and CO, of the produced syngas into unreacted steam. An advancement of SMR process is represented by Sorption-Enhanced Steam Methane Reforming (SE-SMR), already investigated by the authors at both material development and process optimization levels [2,3,4]. This technique, in the frame of pre-combustion CCS technologies, consists in the in-situ adsorption of the CO2 produced during a steam reforming reaction by means of regenerable adsorbents. Consequently, reaction thermodynamic limits are shifted and methane conversion increases at same operating temperature; conversely thermal energy, also at high temperature (up to 850–900 °C) according to the sorbent material typology, is needed for the sorbent regeneration phase. An alternative interesting reaction is dry reforming of methane (DRM). According to Equation (2) methane reacts with carbon dioxide, under a 1:1 molar ratio, to produce an equimolar hydrogen and carbon monoxide mixture as syngas.
Dry reforming is an extremely interesting reaction from the environmental point of view, since it allows the conversion of captured CO2 (e.g., from fossil CO2 sources), thus constituting a carbon capture and utilization technology (CCU), in a hydrogen-rich gas under high conversion rates (according to catalyst performance) [5,6,7]. With regards to the CO2 bio-source, DRM can be considered as implementation process of biogas, that is already a mixture of methane and carbon dioxide, notwithstanding any upgrading process [8,9]. With respect to other reforming processes, as steam reforming coupled to CO-shift or partial oxidation, DRM provides a higher concentration of active species in the produced syngas and avoids the use of distilled water or oxygen/air, necessary for steam reforming and partial oxidation respectively. Thus, in a Circular Economy view, it contributes to resources preservation as well as the valorization of CO2. Conversely, DRM is highly endothermic, but such a penalty can be overcome in case waste heat is made available by upstream processes, as possible in the integration in energy systems (as the application here investigated) and in particular processes of carbon-intensive industry (e.g., steel) where hydrogen is needed. Despite described potentialities, the development and commercialization of dry reforming technology is slowed mainly due to critical issues on catalysts, such as sintering and deactivation, caused by carbon deposition. In steam reforming process, such risk is reduced through the introduction of steam. Numerous metals such as Ni, Co and noble metals have been used as activator of DRM reaction and literature reports achieved results and open challenges [2,5,10,11]. Thermodynamic studies [12,13,14] indicate as best operating condition for the reaction high temperature (up to 900–1000 °C) and low pressure (1 bar). In particular, high pressure enhances both carbon and steam production. Increase of CO2 has a positive effect on methane conversion with drawback on carbon dioxide one. Peculiarities of DRM are extremely interesting if combined with SOFC technology. Compared to low temperature fuel cells, SOFC can operate directly with syngas and no upgrade of the fuel is required. In addition, during operation SOFC produces high temperature heat that can be used to supply thermal energy to the DRM reactor. Those aspects can be found also in the state of art of SOFC system that integrates external steam methane reforming, but DRM technology has the additional advantage of higher system efficiencies and no use of steam with a significate simplification of the process and, consequently, of the system. For the case of DRM coupling to SOFC, here investigated, the system analysis previously performed by the authors [15] certifies the advantage of using dry reforming compared to steam reforming technology in SOFC systems. The new presented design, based on a two stacks integration strategy with partial recirculation of off anode exhausts from one stack into the DRM reactor, achieves 65% efficiency, 6.4 percentage points higher than equivalent system based on steam reforming reactor. Also the thermal integration of DRM reactor and SOFC stack is provided. Specifically, aiming to allow the recovery of waste heat, a temperature of the dry reforming process in the 700–750 °C range, so lower than conventional operating values, is imposed. It implies the development of customized catalysts to face coking issues, addressed also by the authors in a separate study under review. In DRM coupling to SOFC, the produced syngas directly feeds the stack due to the high operating temperatures and the presence of catalyst (Ni) at the SOFC anode side. It allows CO to be converted in hydrogen through shift reaction (3).
Peculiarities of the reactions have a relevant effect on system design. Specifically, the recirculation of off gasses requires a separation process that involves water in steam reforming configuration and carbon dioxide in dry reforming one. It is important to highlight that stack off gasses are constituted by carbon dioxide, steam and, in minor part, unreacted hydrogen. An important advantage of dry reforming, compared to steam reforming, is that once steam is separated from system off gasses, usually thanks to condensation, both hydrogen and carbon dioxide can be recirculated obtaining an additional advantage at system level. In particular, carbon dioxide is a reactant for the dry reformer and recirculation plays an important role in reactor equilibrium. The integration of DRM in SOFC system is reported in literature also considering integrated SOFC-gas turbine power system [5,6]. In particular, Wu et al. [5] implemented recirculation of anodic off-gasses into a dry reforming reactor, achieving a total power efficiency of 52.51% and an increase of CO2 concentration in plant off gasses. Kushi [7] analyzed, by means of numerical study, an integrated hotbox containing dry reforming reactor, SOFC stack and combustor. The calculations focus on thermal equilibrium and show how same operating temperature of steam reforming could be maintained also in dry reforming design. Literature reports also few experimental studies on the operation of SOFC with dry reforming mixtures. In general, main issue of this technology is degradation caused by carbon deposition [8,9,10,11,12] on SOFC anode. Therefore, the optimization of DRM operating conditions has to be investigated also in consideration of the effect of reformate composition on SOFC degradation. The catalytic activity of SOFC anode for dry reforming reaction was assessed in [13], where experimental results identify an optimal temperature window above 620 °C for methane conversion. In [14], both steam and dry reforming compositions were studied in a single cell planar SOFC operating at 750 °C. Despite higher voltage obtained for steam reforming composition, dry reforming mixture achieved higher fuel utilization. In the same study, a short durability study demonstrates how internal dry reforming, already addressed by Cordigliano and Fragiacomo [16,17] and Zhu et al. [18] in case of biogas and methane feeding, is disadvantageous compared to external process. Durability studies of SOFC cell operating in dry reforming configuration are reported also in Papadam et al. [19] were stable conditions are reported for both low (650 °C) and high (850 °C) operating temperature over more than 200 h. Finally, in our previous study [20] a performance assessment of dry reforming composition was tested in a SOFC short stack to support strategies for the integration of an external dry reforming reactor in a SOFC cogeneration system. The present study, focusing the attention on the stack, presents, for the first time, an experimental comparison between SOFC operation when fed with steam reforming and dry reforming mixtures. The use of reformate gas produced via dry reforming was demonstrated to be a more efficient and cleaner option. Different compositions were tested on a short stack simulating syngas produced by steam and dry reforming. Experimental results show how dry reforming compositions are more efficient than steam reforming ones. Comparing equivalent gas mixtures in terms of chemical inputs (same number of equivalent hydrogen moles as defined in the following according to Equation (5)), the dry reforming ones allowed an increase in SOFC operating voltages up to 4.9%, if compared to steam reforming compositions. With the aim of supporting dry reforming SOFC design, the study focuses on the thermal equilibrium of the system highlighting additional advantages in terms of thermal stability and integration potentialities. Specifically, dry reforming compositions produce lower temperature variations mitigating thermal shocks to stack materials.
2. Results and Discussion
Details on experimental test campaign and SOFC stack design are reported in following paragraph. Results in terms of cell voltage as function of current density are reported in Figure 1. Cell voltage is calculated as average among the six cells of the stack. Voltage value is averaged also over time. In details, each reported value is the average calculated in a period of five minutes sampled at 1 Hz. Such time interval is taken at the end of the one hour test. Such approach offers reliable values calculated over a wide range of samples. The calculated distribution of sampled values, in fact, is below 0.2% for voltages and below 0.01% for temperatures. Error bar could not be reported in all the graphs. As expected, all curves show a decrease in voltage when current increases due to polarization losses. Steam reforming compositions have lower values if compared with dry reforming ones, with higher value of the curve at S/C = 2 with respect to the one at S/C = 2.5. The role of steam concentration seems dominant reducing voltage values even if hydrogen concentration reaches the highest value for these compositions. Lower performances of SMR are related to the dilution of the active species, H2 and CO, into diluents such as CO2 and H2O. Moreover compared to compositions A1 and A3 with similar amount of diluent (see Table 1) the DRM compositions have higher concentration of CH4 in the active species. Methane gives a higher contribution to the reaction with a potential contribution equivalent to 4 hydrogen (see H2eq definition in following paragraph). Methane contribution in the DRM compensate the dilution concentration with a final result of higher performances of all DRM mixture compared to SMR ones.
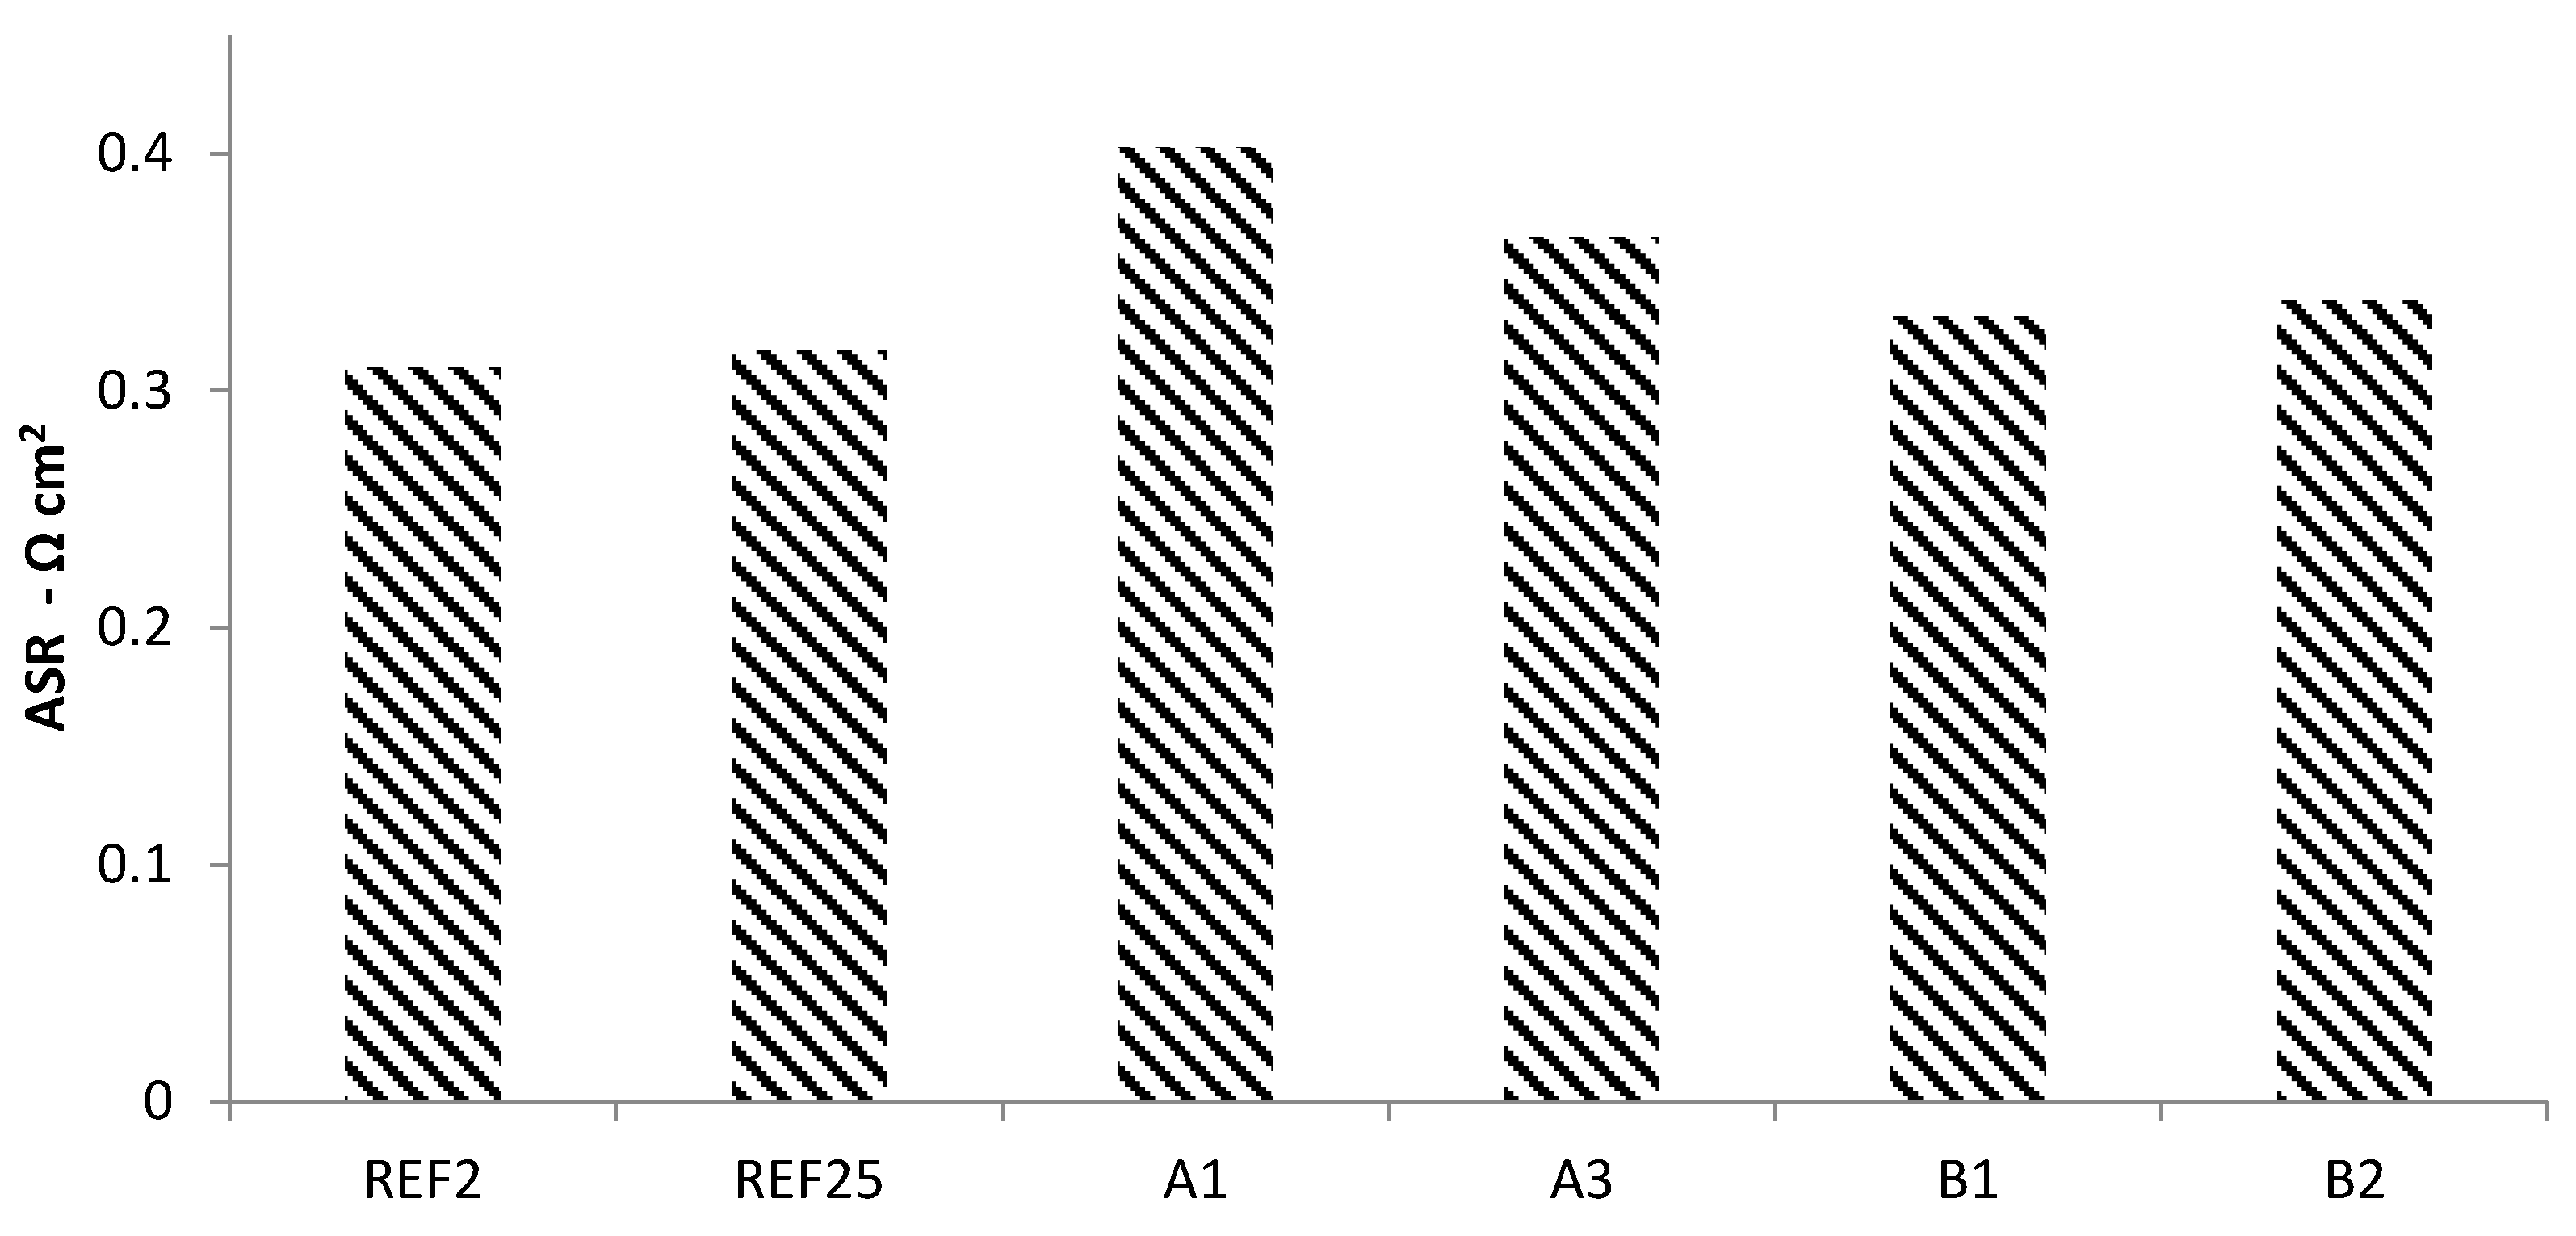
Regarding dry reforming compositions, A1 is the best performing composition, A3 and B1 have very similar values, while B2 is the less performing. Compared to the other compositions, A1 has higher amount of methane while the level of concentration of active species is like to A3. If we compare A3 with B1 they have very different DF values but, again, comparable amounts of methane concentration, lower than A1 but higher than B2. Methane concentration, therefore, seems a relevant parameter to evaluate composition performances. We can also extend such consideration to steam reforming compositions where methane concentrations are again coherent with the previous assumption. In addition, it is interesting to analyze also the voltage variation as function of current density. By applying linear regression to these values, the slope of each voltage curve was calculated. It can be defined, as absolute value, as the Area Specific Resistance (ASR) of the cells in the stack and permits to evaluate the effect of composition on the polarization losses. Results are reported in Figure 2. It is interesting to note that we have a different indication compared to voltage values. Dry reforming compositions, in fact, have higher ASR values, i.e., higher losses, if compared to steam reforming ones, even if the differences are minimal. A possible explanation, already discussed elsewhere [21], may come from a positive effect on ASR of total gas flow entering the anode, as reported in Figure 3. The increase in gas flows has a general positive effect mainly related to the reduction of diffusion losses under polarization conditions. For what above, we can conclude that dry reforming compositions provide enhanced performance in terms of produced power density, due to an increase in Open Circuit Voltage (OCV) proportional to the methane concentration in the feeding mixtures.
Figure 4 reports stack efficiency for each investigated composition. Efficiency is calculated as follows (4):
where Vs is stack voltage, I is total current, m and LHV are mass flow and low heating value of each fuel gas. Note that the curves have not linear behaviors, like voltages, because the tests are designed with the same H2eq and not same inlet energy in terms of LHV. Considering the efficiency equation, all curves have same current but different voltage values and different inlet energy amounts. Composition A1 provides also the highest efficiency.
With regards to the short-stack thermal behavior, temperature trends measured at cathode and anode outlet are depicted respectively in Figure 5 and Figure 6. Cathodic temperature is related mainly to air flow and, therefore, current density: air flow is the same for all compositions. This means that the variation is mainly related to the power losses during operation. With the increase of current density there is an increase in temperature and, even if utilization of oxidant is very low, air variation does not completely compensate the internal thermal losses. From minimum to maximum current density there is an increase of 10 °C in temperature. The effect of composition is very low and only A1 and B2 mixtures exhibit a difference coherently with the voltage trends.
For what concerns anodic outlet, the variation of temperature among compositions is mainly related to anodic inlet flow rate, its composition and, consequently, the occurred internal reactions. The concentration of methane is the main factor. Due to the presence of nickel, methane reacts in the anode following both steam and dry reforming reactions, which are highly endothermic and reduce gas temperature. For all compositions, the global result consists in a temperature increase with current; it is due to the dominant role played by heat produced by polarization losses compared to the chemical reactions contribution. Due to chemical contribution to the equilibrium, curves reported in Figure 6 are not linear due to the dominant chemical contribution at low current density.
After SOFC operation with each specific mixture, a polarization curve with reference composition was performed as indicated in section “Materials and Methods”. These additional tests aim to evaluate the effect of the dry reforming compositions on the materials before and after each test. Figure 7 reports the result of such analysis. Values are reported, for each current density, as percentage decay of voltage average with respect to the reference polarization performed after the start-up. Negative values indicate voltage degradation, while positive ones indicate an increase in performances.
For all reported polarization the variation in term of voltage is very low, smaller than 2%. It isn’t possible to identify a linear behavior, indicating an increase in internal resistance, but it is important to notice that absolute values are higher for the last tested concentration. This means that for sure there was no fast degradation related to the tested compositions and that all the considerations on previous results are consistent and not caused by previous used mixtures.
3. Materials and Methods
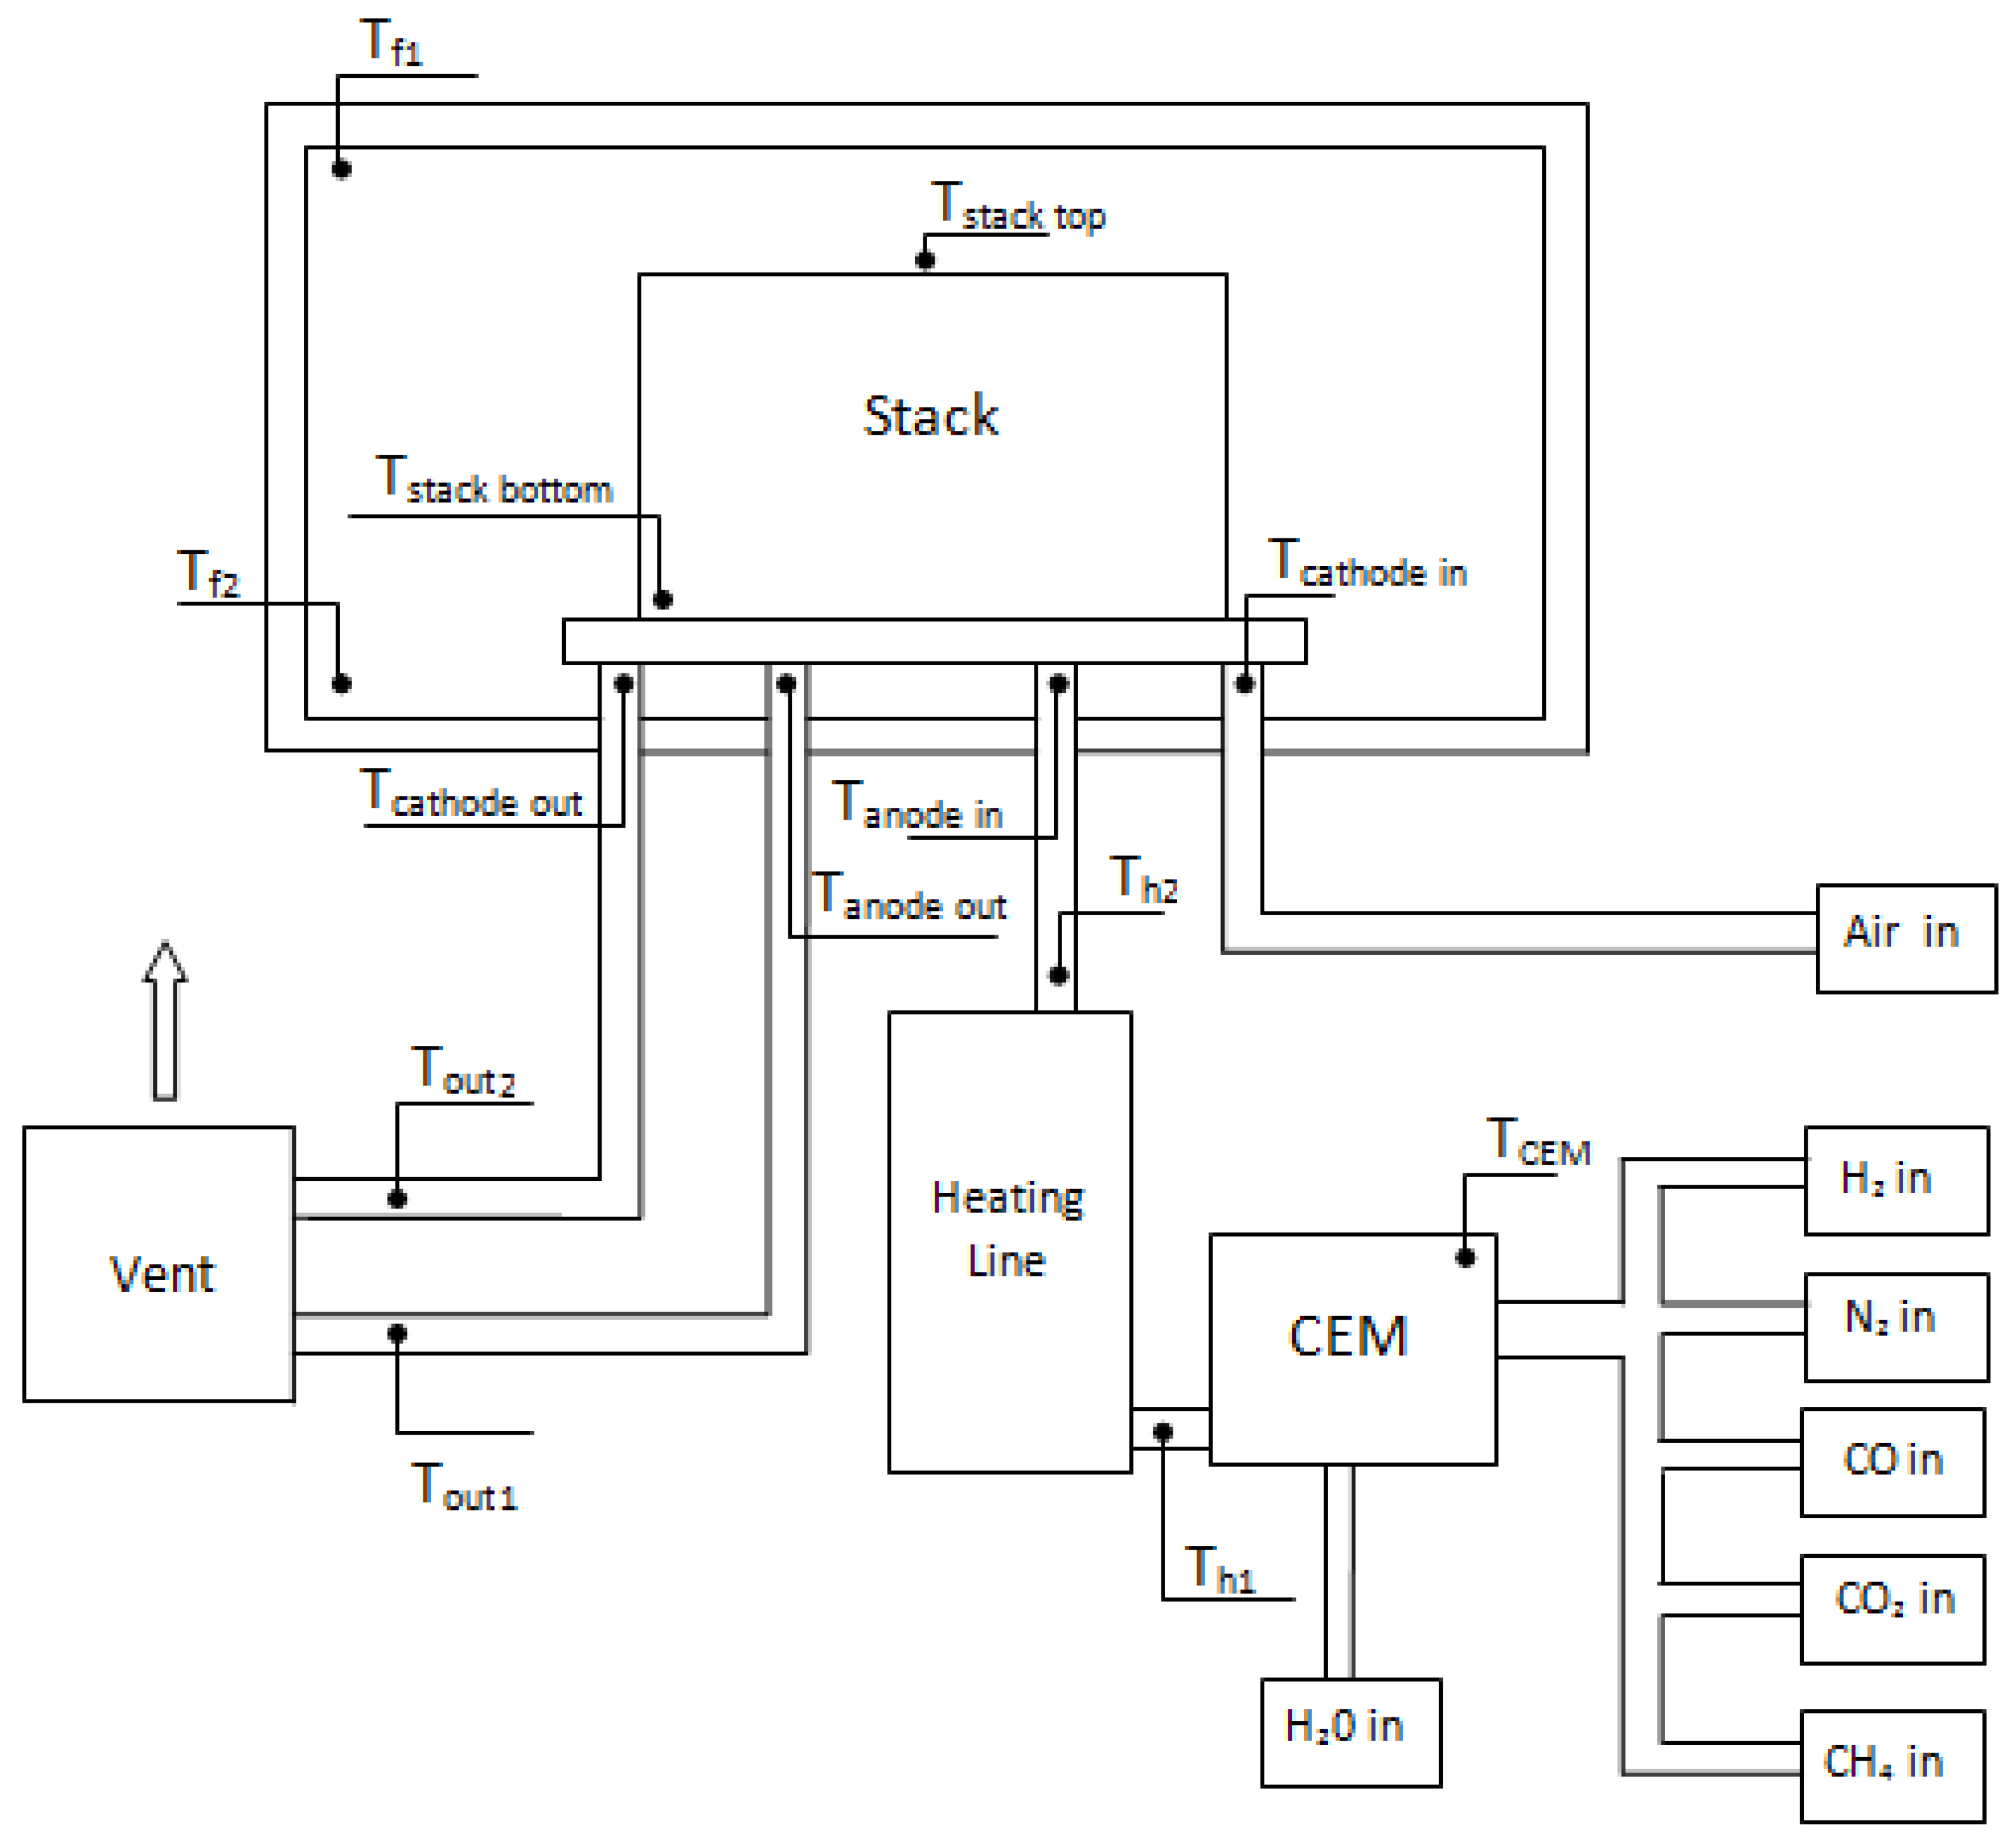
The experimental runs were performed in a Solid Oxide Fuel Cell short stack supplied by SOLIDPower. The stack is composed of six planar single cells of 80 cm2 of active area each. Standard nickel and Yttrium Stabilized Zirconia (Ni-YSZ) anode-supported cells are used, on which a barrier layer and a Lanthanum Strontium Cobalt Ferrite (LSCF) composite cathode are deposited and sintered. The stack is based on metallic cassettes, coated, low-cost ferritic alloy shaped by standard sheet metal forming processes [22]. To follow start-up specific procedure and operate a complete test planning, the stack is integrated in a test rig where temperature, gas flows and current are controlled and measured. Detailed description of the test rig can be found in literature [23,24]. No thermocouple could be placed inside the stack, but two thermocouples are located in the furnace close to the stack. Moreover, four additional thermocouples are placed inside the pipes, specifically two in the inlets, anodic and cathodic, and two in the outlet, anodic and cathodic. Figure 8 reports the simplified scheme of the test rig, included thermocouples position.
The test rig allows to feed the anode with a composition of pure gasses such as H2, CO, CO2, H2O and CH4. Thus, mixing such gasses, it is possible to reproduce outlet compositions from a dry or a steam reformer. With the purpose of comparing steam and dry process, six gas mixtures where selected, four simulating dry reforming compositions and two simulating steam reforming ones. Gas compositions are reported in Table 1 where molar concentrations of pure gasses are reported with the addition of: (i) dilution factor (DF) calculated as the sum of inert gasses, CO2 and H2O, on the total flow; (ii) molar ration between H2 and CO concentration (H2/CO). The two steam reforming compositions were obtained, with a thermodynamic model based on Gibbs equilibrium, simulating reformer operation at 700 °C; they differ for the steam to carbon ration (S/C). In detail, compositions 1 and 2 relate to S/C of 2 and 2.5 respectively. As expected, an increase in steam composition and a reduced amount of methane arise for S/C 2.5. A greater steam content entering the reformer permits a higher conversion of methane but, at the same time, a higher concentration of water in the off gasses.
Regarding the dry reforming compositions, mixtures 3 and 4 relate to a system model design deeply described in a previous study [15]. Specifically, A1 refers to a DRM reactor temperature of 809 °C and A3 to a higher temperature of 960 °C, while a constant CH4/CO2 ratio of 0.6 was set according to [15,20] at the reactor inlet. Compositions 5 and 6 where obtained from a previous experimental activity performed by the authors on dry reforming reactor deeply described elsewhere in [20], with reactor temperatures of 700 °C and 750 °C respectively, chosen compatibly with the SOFC/DRM reactor thermal integration, and under an equimolar CH4-CO2 mixture (CH4/CO2 = 1) at the reactor inlet. As expected, all dry reforming compositions have a reduced amount of steam. Mixtures 3 and 4, obtained by simulation under different operating conditions, e.g., CH4/CO2 < 1, have CO2 concentrations significantly higher (with consequent high DF values). Moreover, specifically for composition 3, also higher concentration of methane and lower concentration of hydrogen are detected with respect to the other mixtures. Experimental compositions, instead, are characterized by an equilibrium between hydrogen and carbon monoxide concentrations. In all tests air was used as oxidant at the cathode. Finally, a reference anodic composition was used to evaluate any performance decrease on stack performance. Such a composition is derived from start-up procedure and is a dry mixture of hydrogen (103 Nl h−1) and nitrogen (69 Nl h−1) for the anode, while the cathode is fed with 1434 Nl h−1 of air.
The experimental planning is designed varying both current density and gas flows, to perform tests at constant utilization coefficients, i.e., the utilization of fuel, Uf, and the utilization of oxidant, Uox. Utilization of fuel is defined as follows (5):
where A is the total current, N the number of cells (six in this case), F is the Faraday constant and H2eq is defined according to Equation (6) as follows:
where H2, CO and CH4 are hydrogen, carbon monoxide and methane molar flow rates respectively. Utilization of fuel is a well-known parameter used in fuel cells technology and, in this case, the definition includes also additional fuel species (CO, CH4) beyond that hydrogen. Such modification is carried out considering the contribution, in terms of electrons in the electrochemical reaction, that the additional fuels species can provide through direct and indirect reactions. H2eq is an established parameter in literature [20,25]. Utilization of oxidant is defined as expressed by Equation (7):
where Air is the molar flow of air in the cathode. Once Uf and Uox are defined it is possible to easily calculate gas compositions for a specific value of current. For each composition reported in Table 1 five constant utilization tests were designed and gas flows were calculated after selection of the constant parameters (Uf = 0.8, Uox = 0.15) and five current values: 12, 18, 24, 30 and 36 A. Such current values correspond to current density distribution between 150 and 450 mA cm−2 that is the typical operation area of a SOFC stack. Also the Uf and Uox chosen values are close to the ones used in real systems to obtain high efficiency and temperature control of the stack. A total of 30 constant utilization tests were calculated and the complete test planning is reported in Table 2. Due to constrains of the test rig two tests, strikethrough in the table, could not be performed. It hasn’t effect on the relevance of the results.
To get stable results both for voltage and temperature measurements, each test condition at same current and gas flow was kept for one hour. At each composition change a polarization curve was performed under reference composition. The aim of such polarization curves is to evaluate if any degradation occurs during the test planning. Those tests allow to evaluate if the investigated composition caused any rapid degradation effect on the stack materials, improving the quality of the study. In this way, it is possible to distinguish any performance deterioration phenomena on the performances from the gas mixture effect, which is the aim of the study. Polarization curves were performed after one hour of operation at open circuit voltage conditions (OCV) under reference composition, varying current from OCV up to 34 A, with 1 A width step kept for one minute. Once maximum current was achieved, same procedure was performed in reverse mode down to OCV. All the tests, constant utilization and polarization curves, were performed maintaining the stack operating temperature at 750 °C.
4. Conclusions
The experimental study revealed that dry compositions can be used with higher performances in a SOFC short stack. Evidence shows that while high concentration of steam, like in steam reforming operation, strongly reduces performances, the substitution of H2O with CO2 causes less decay as diluent into the gasmix. In this case, lower dilution of the active species, H2 and CO, into diluents (such as CO2 and H2O) and, for similar dilution (see mixtures A1 and A3 in Table 1), the higher concentration of CH4 (which according to Equation (v) significantly impacts on parameter) result in higher performances. This positive effect overcomes the negative impact on the ASR due to the lower total gas flows of dry reforming mixtures compared to SMR ones. It results in an improvement in produced voltage of 4.9% (with reference to REF25) in the range 150–375 mA cm−2 when the SOFC short-stack is fed with A1 composition. Moreover, higher amount of methane in the dry reforming mix permits: (i) higher efficiency over 56% at low currents with a mean increment, in the range 150–375 mA cm−2, of 4 percentage points (corresponding to about 8%) with respect to REF25 mixture; (ii) lower temperature variation at both anode and cathode outlet from minimum to maximum operating current values, proving that the performance enhancement doesn’t imply greater thermal stresses. No fast degradation effect was revealed after the tests. In the future, an endurance test will be performed to provide a complete analysis of the long-term effect on material stability, especially for what concerns carbon deposition.
Author Contributions
G.C. and L.B. conceived and designed the study; G.C. performed the experimental test; G.C. and G.B. analyzed the data; G.C. wrote the paper.
Funding
This research was funded by EUROPEAN UNION’S HORIZON 2020 research and innovation program under project Net-Tools, Grant Agreement-736648.
Conflicts of Interest
The authors declare no conflict of interest.
References
- Lo Faro, M.; Antonucci, V.; Antonucci, P.L.; Aricó, A.S. Fuel flexibility: A key challenge for SOFC technology. Fuel 2012, 102, 554–559. [Google Scholar] [CrossRef]
- Barelli, L.; Bidini, G.; Corradetti, A.; Desideri, U. Production of hydrogen through the carbonation–calcination reaction applied to CH4/CO2 mixtures. Energy 2007, 32, 834–843. [Google Scholar] [CrossRef]
- Barelli, L.; Bidini, G.; Gallorini, F. SE-SR with sorbents based on calcium aluminates: Process optimization. Appl. Energy 2015, 143, 110–118. [Google Scholar] [CrossRef]
- Barelli, L.; Bidini, G.; Di Michele, A.; Gallorini, F.; Petrillo, C.; Sacchetti, F. Synthesis and test of sorbents based on calcium aluminates for SE-SR. Appl. Energy 2014, 127, 81–92. [Google Scholar] [CrossRef]
- Wu, W.; Chen, S.A.; Hwang, J.J.; Hsu, F.T. Optimization and control of a stand-alone hybrid solid oxide fuel cells/gas turbine system coupled with dry reforming of methane. J. Process Control 2017, 54, 90–100. [Google Scholar] [CrossRef]
- Wu, W.; Chen, S.-A.; Chiu, Y.-C. Design and Control of an SOFC/GT Hybrid Power Generation System with Low Carbon Emissions. Ind. Eng. Chem. Res. 2016, 55, 1281–1291. [Google Scholar] [CrossRef]
- Kushi, T. Heat balance of dry reforming in solid oxide fuel cell systems. Int. J. Hydrogen Energy 2017, 42, 11779–11787. [Google Scholar] [CrossRef]
- Girona, K.; Laurencin, J.; Fouletier, J.; Lefebvre-Joud, F. Carbon deposition in CH4/CO2 operated SOFC: Simulation and experimentation studies. J. Power Sources 2012, 210, 381–391. [Google Scholar] [CrossRef]
- Baldinelli, A.; Barelli, L.; Bidini, G. Performance characterization and modelling of syngas-fed SOFCs (solid oxide fuel cells) varying fuel composition. Energy 2015, 90, 2070–2084. [Google Scholar] [CrossRef]
- Pillai, M.; Lin, Y.; Zhu, H.; Kee, R.J.; Barnett, S.A. Stability and coking of direct-methane solid oxide fuel cells: Effect of CO2 and air additions. J. Power Sources 2010, 195, 271–279. [Google Scholar] [CrossRef]
- Shiratori, Y.; Ijichi, T.; Oshima, T.; Sasaki, K. Internal reforming SOFC running on biogas. Int. J. Hydrogen Energy 2010, 35, 7905–7912. [Google Scholar] [CrossRef]
- Lanzini, A.; Guerra, C.; Leone, P.; Santarelli, M.; Smeacetto, F.; Fiorilli, S.; Gondolini, A.; Mercadelli, E.; Sanson, A.; Brandon, N.P. Influence of the microstructure on the catalytic properties of SOFC anodes under dry reforming of methane. Mater. Lett. 2016, 164, 312–315. [Google Scholar] [CrossRef]
- Guerra, C.; Lanzini, A.; Leone, P.; Santarelli, M.; Brandon, N.P. Optimization of dry reforming of methane over Ni/YSZ anodes for solid oxide fuel cells. J. Power Sources 2014, 245, 154–163. [Google Scholar] [CrossRef]
- Kushi, T. Performance and durability evaluation of dry reforming in solid oxide fuel cells. Int. J. Hydrogen Energy 2016, 41, 17567–17576. [Google Scholar] [CrossRef]
- Barelli, L.; Ottaviano, P.A. Solid oxide fuel cell technology coupled with methane dry reforming: A viable option for high efficiency plant with reduced CO2 emissions. Energy 2014, 71, 118–129. [Google Scholar] [CrossRef]
- Corigliano, O.; Fragiacomo, P. Numerical modeling of an indirect internal CO2 reforming solid oxide fuel cell energy system fed by biogas. Fuel 2017, 196, 352–361. [Google Scholar] [CrossRef]
- Corigliano, O.; Fragiacomo, P. Numerical simulations for testing performances of an Indirect Internal CO2 Reforming Solid Oxide Fuel Cell System fed by biogas. Fuel 2017, 196, 378–390. [Google Scholar] [CrossRef]
- Zhu, T.; Yang, Z.; Han, M. Performance evaluation of solid oxide fuel cell with in-situ methane reforming. Fuel 2015, 161, 168–173. [Google Scholar] [CrossRef]
- Papadam, T.; Goula, G.; Yentekakis, I.V. Long-term operation stability tests of intermediate and high temperature Ni-based anodes’ SOFCs directly fueled with simulated biogas mixtures. Int. J. Hydrogen Energy 2012, 37, 16680–16685. [Google Scholar] [CrossRef]
- Barelli, L.; Bidini, G.; Cinti, G.; Gallorini, F.; Pöniz, M. SOFC stack coupled with dry reforming. Appl. Energy 2017, 192, 498–507. [Google Scholar] [CrossRef]
- Barelli, L.; Bidini, G.; Cinti, G.; Ottaviano, A. Study of SOFC-SOE transition on a RSOFC stack. Int. J. Hydrogen Energy 2017, 42, 26037–26047. [Google Scholar] [CrossRef]
- Wuillemin, Z.; Ceschini, S.; Antonetti, Y.; Beetschen, C.; Modena, S.; Montinaro, D.; Cornu, T.; Bucheli, O.; Bertoldi, M. High-performance SOFC stacks tested under different reformate compositions A0901 High-performance SOFC stacks tested under different reformate compositions. In Proceedings of the 11th European SOFC and SOE Forum, Lucerne, Switzerland, 1–4 July 2014. [Google Scholar]
- Penchini, D.; Cinti, G.; Discepoli, G.; Sisani, E.; Desideri, U. Characterization of a 100 W SOFC stack fed by carbon monoxide rich fuels. Int. J. Hydrogen Energy 2013, 38, 525–531. [Google Scholar] [CrossRef]
- Penchini, D.; Cinti, G.; Discepoli, G.; Desideri, U. Theoretical study and performance evaluation of hydrogen production by 200 W solid oxide electrolyzer stack. Int. J. Hydrogen Energy 2014, 39, 9457–9466. [Google Scholar] [CrossRef]
- Papurello, D.; Lanzini, A.; Fiorilli, S.; Smeacetto, F.; Singh, R.; Santarelli, M. Sulfur poisoning in Ni-anode solid oxide fuel cells (SOFCs): Deactivation in single cells and a stack. Chem. Eng. J. 2016, 283, 1224–1233. [Google Scholar] [CrossRef] [Green Version]
Figure 1.
Stack performances in terms of Voltage vs. Current density for the compositions under study.
Figure 1.
Stack performances in terms of Voltage vs. Current density for the compositions under study.

Figure 2.
Area Specific Resistance (ASR) of the analyzed compositions.

Figure 3.
Total flow variation as function of Current density for the studied compositions.

Figure 4.
Stack efficiency for different gas compositions as function of current density.

Figure 5.
Cathodic outlet temperatures as function of current density.

Figure 6.
Anode outlet temperatures as function of current density.

Figure 7.
Voltage degradation during polarization curves.

Figure 8.
Scheme of the test rig.


Table 1.
Gas composition used for the experimental planning.
| H2 | CO | CO2 | CH4 | H2O | DF | H2/CO | ||
|---|---|---|---|---|---|---|---|---|
| 1 | REF2@700 | 62.79% | 13.32% | 5.71% | 1.59% | 16.58% | 22.29% | 4.71 |
| 2 | REF25@700 | 59.52% | 11.02% | 6.61% | 0.85% | 22.00% | 28.61% | 5.40 |
| 3 | A1 | 25.00% | 37.00% | 21.00% | 11.00% | 6.00% | 27.00% | 0.68 |
| 4 | A3 | 31.00% | 43.00% | 14.00% | 6.00% | 6.00% | 20.00% | 0.72 |
| 5 | B1 | 41.31% | 44.46% | 4.38% | 5.46% | 4.38% | 8.77% | 0.93 |
| 6 | B2 | 44.35% | 46.24% | 3.55% | 2.31% | 3.55% | 7.10% | 0.96 |
Table 2.
Test planning.
| H2eq | H2eq | Uf | Uox | H2 | CO | CO2 | CH4 | H2O | Air | I | J | |
|---|---|---|---|---|---|---|---|---|---|---|---|---|
| Nl h−1 | mL min−1 cm−2 | Nl h−1 | Nl h−1 | Nl h−1 | Nl h−1 | g h−1 | Nl h−1 | A | mA cm−2 | |||
| REF2@700 | 38 | 1.31 | 0.80 | 0.15 | 28.65 | 6.08 | 2.61 | 0.73 | 6.08 | 477.89 | 12 | 150 |
| REF2@700 | 56 | 1.96 | 0.80 | 0.15 | 42.98 | 9.12 | 3.91 | 1.09 | 9.11 | 716.83 | 18 | 225 |
| REF2@700 | 75 | 2.61 | 0.80 | 0.15 | 57.31 | 12.16 | 5.21 | 1.45 | 12.15 | 955.77 | 24 | 300 |
| REF2@700 | 94 | 3.27 | 0.80 | 0.15 | 71.63 | 15.20 | 6.51 | 1.81 | 15.19 | 1194.71 | 30 | 375 |
| REF2@700 | 113 | 3.92 | 0.80 | 0.15 | 85.96 | 18.23 | 7.82 | 2.18 | 18.23 | 1433.66 | 36 | 450 |
| REF25@700 | 38 | 1.31 | 0.8 | 0.15 | 30.29 | 5.61 | 3.36 | 0.43 | 8.99 | 477.89 | 12 | 150 |
| REF25@700 | 56 | 1.96 | 0.8 | 0.15 | 45.44 | 8.41 | 5.05 | 0.65 | 13.49 | 716.83 | 18 | 225 |
| REF25@700 | 75 | 2.61 | 0.8 | 0.15 | 60.59 | 11.22 | 6.73 | 0.87 | 17.98 | 955.77 | 24 | 300 |
| REF25@700 | 94 | 3.27 | 0.8 | 0.15 | 75.74 | 14.02 | 8.41 | 1.08 | 22.48 | 1194.71 | 30 | 375 |
| A1 | 38 | 1.31 | 0.80 | 0.15 | 8.88 | 13.14 | 7.46 | 3.91 | 1.71 | 477.89 | 12 | 150 |
| A1 | 56 | 1.96 | 0.80 | 0.15 | 13.31 | 19.70 | 11.18 | 5.86 | 2.57 | 716.83 | 18 | 225 |
| A1 | 75 | 2.61 | 0.80 | 0.15 | 17.75 | 26.27 | 14.91 | 7.81 | 3.42 | 955.77 | 24 | 300 |
| A1 | 94 | 3.27 | 0.80 | 0.15 | 22.19 | 32.84 | 18.64 | 9.76 | 4.28 | 1194.71 | 30 | 375 |
| A3 | 38 | 1.31 | 0.8 | 0.15 | 11.90 | 16.51 | 5.38 | 2.30 | 1.85 | 477.89 | 12 | 150 |
| A3 | 56 | 1.96 | 0.8 | 0.15 | 17.86 | 24.77 | 8.06 | 3.46 | 2.78 | 716.83 | 18 | 225 |
| A3 | 75 | 2.61 | 0.8 | 0.15 | 23.81 | 33.03 | 10.75 | 4.61 | 3.70 | 955.77 | 24 | 300 |
| A3 | 94 | 3.27 | 0.8 | 0.15 | 29.76 | 41.28 | 13.44 | 5.76 | 4.63 | 1194.71 | 30 | 375 |
| A3 | 113 | 3.92 | 0.8 | 0.15 | 35.71 | 49.54 | 16.13 | 6.91 | 5.55 | 1433.66 | 36 | 450 |
| B1 | 38 | 1.31 | 0.80 | 0.15 | 14.45 | 15.55 | 1.53 | 1.91 | 1.23 | 477.89 | 12 | 150 |
| B1 | 56 | 1.96 | 0.80 | 0.15 | 21.67 | 23.32 | 2.30 | 2.86 | 1.85 | 716.83 | 18 | 225 |
| B1 | 75 | 2.61 | 0.80 | 0.15 | 28.90 | 31.10 | 3.07 | 3.82 | 2.46 | 955.77 | 24 | 300 |
| B1 | 94 | 3.27 | 0.80 | 0.15 | 36.12 | 38.87 | 3.83 | 4.77 | 3.08 | 1194.71 | 30 | 375 |
| B1 | 113 | 3.92 | 0.80 | 0.15 | 43.34 | 46.65 | 4.60 | 5.73 | 3.69 | 1433.66 | 36 | 450 |
| B2 | 38 | 1.31 | 0.8 | 0.15 | 16.72 | 17.43 | 1.34 | 0.87 | 1.07 | 477.89 | 12 | 150 |
| B2 | 56 | 1.96 | 0.8 | 0.15 | 25.07 | 26.14 | 2.01 | 1.31 | 1.61 | 716.83 | 18 | 225 |
| B2 | 75 | 2.61 | 0.8 | 0.15 | 33.43 | 34.86 | 2.68 | 1.74 | 2.15 | 955.77 | 24 | 300 |
| B2 | 94 | 3.27 | 0.8 | 0.15 | 41.79 | 43.57 | 3.35 | 2.18 | 2.69 | 1194.71 | 30 | 375 |
| B2 | 113 | 3.92 | 0.8 | 0.15 | 50.15 | 52.28 | 4.01 | 2.62 | 3.22 | 1433.66 | 36 | 450 |
© 2018 by the authors. Licensee MDPI, Basel, Switzerland. This article is an open access article distributed under the terms and conditions of the Creative Commons Attribution (CC BY) license (http://creativecommons.org/licenses/by/4.0/).
Share and Cite
MDPI and ACS Style
Barelli, L.; Bidini, G.; Cinti, G. Steam vs. Dry Reformer: Experimental Study on a Solid Oxide Fuel Cell Short Stack. Catalysts 2018, 8, 599. https://doi.org/10.3390/catal8120599
AMA Style
Barelli L, Bidini G, Cinti G. Steam vs. Dry Reformer: Experimental Study on a Solid Oxide Fuel Cell Short Stack. Catalysts. 2018; 8(12):599. https://doi.org/10.3390/catal8120599
Chicago/Turabian StyleBarelli, Linda, Gianni Bidini, and Giovanni Cinti. 2018. "Steam vs. Dry Reformer: Experimental Study on a Solid Oxide Fuel Cell Short Stack" Catalysts 8, no. 12: 599. https://doi.org/10.3390/catal8120599
Note that from the first issue of 2016, this journal uses article numbers instead of page numbers. See further details here.