NiFeOx as a Bifunctional Electrocatalyst for Oxygen Reduction (OR) and Evolution (OE) Reaction in Alkaline Media


1
Department of Chemical Engineering, KTH Royal Institute of Technology, SE-100 44 Stockholm, Sweden
2
Material Physics, KTH Royal Institute of Technology, SCI, S-164 40 Kista, Sweden
3
Division of Physical Chemistry, Department of Chemistry, The Ångström Laboratory, Uppsala University, P.O. Box 523, SE-75120 Uppsala, Sweden
*
Author to whom correspondence should be addressed.
Catalysts 2018, 8(8), 328; https://doi.org/10.3390/catal8080328
Submission received: 29 June 2018
/
Revised: 31 July 2018
/
Accepted: 8 August 2018
/
Published: 10 August 2018
(This article belongs to the Section Electrocatalysis)
Abstract
:This article reports the two-step synthesis of NiFeOx nanomaterials and their characterization and bifunctional electrocatalytic activity measurements in alkaline electrolyte for metal-air batteries. The samples were mostly in layered double hydroxide at the initial temperature, but upon heat treatment, they were converted to NiFe2O4 phases. The electrochemical behaviour of the different samples was studied by linear sweep voltammetry and cyclic voltammetry on the glassy carbon electrode. The OER catalyst activity was observed for low mass loadings (0.125 mg cm−2), whereas high catalyst loading exhibited the best performance on the ORR side. The sample heat-treated at 250 °C delivered the highest bi-functional oxygen evolution and reduction reaction activity (OER/ORR) thanks to its thin-holey nanosheet-like structure with higher nickel oxidation state at 250 °C. This work further helps to develop low-cost electrocatalyst development for metal-air batteries.

1. Introduction
Bifunctional oxygen evolution (OE) and oxygen reduction (OR) reactions are the anodic and cathodic half-cell reactions taking place in the air electrode during charging and discharging of the Metal-Air Batteries (MAB). These reactions are also the backbone of regenerative fuel cells, electrolysers, and photo-electrochemical cells converting electrical energy into chemical energy or vice versa, which could be drawn back when there is a need [1]. The OE and OR reactions involve the two-electron or four-electron transfer reactions that are hindered by significant overpotentials and slow kinetics. In order to overcome these limitations, the OE and OR reactions should employ an active catalyst to accelerate the reactions. Platinum group metal (PGM) elements Pt, Ir, and Ru are known as the best catalysts for these reactions [2,3,4]. However, these PGM elements’ availability, stability, and cost are prohibitive to commercialize on a broader scale [3,5].
In this scenario, transition metal oxides based on perovskites, pyrochlores, layered double hydroxide (LDH), and spinels are promising candidates for oxygen reduction and evolution reactions. Because of their structural robustness, cost, accessibility, ease and mode of synthesis, desirable activity, low electrical resistance, and thermodynamic stability in the aqueous alkaline electrolyte [5,6], they are preferred as alternatives for both reactions. Among these different structures, spinel-based oxides pose superior OE and OR performances, due to their mixed valence states [7]. Another important class of materials is LDH, which are ionically conducting-mixed valence compounds with layered structure. These LDH phases are more active than the spinel or rock salt type structures due to the fact they are readily oxidizable to metal hydroxide/oxyhydroxide interphase that is highly active for the OE reaction [8]. There have been different LDH phases such as Ni-Fe, Ni-Co, Co-Fe, Ni-Ni, Ni-Mn, Mn-Co, Co-Mn, and Co-Ni, which were reported as efficient OER catalysts in alkaline media [8,9,10,11]. These LDH phases are easily convertible to different oxide or spinel phases upon the removal of intercalated anions. These oxides and LDH have the mixed valency state that provides them donor-acceptor chemisorption sites for reversible oxygen adsorption [12]. Besides the electron, conduction between mixed valence of spinels enables high conductivity and dramatically changes the bond strength of surface–intermediate species [12,13]. Spinels (AB2O4) with earth abundant transition metals (Fe, Co, Ni, Cu, and Mn) are considered to be good options compared to the noble metals [14]. The substitution of the B site ion or using different A and B combinations are tuned to surface redox sites and metal-oxygen bonds to give a desirable state, subsequently leading to superior performance. Recently, several transition metal oxide (A2+A3+2O4) spinels and mixed transition metal oxide (A2+B3+2O4) spinels have been reported as either bifunctional or single OE or OR electrocatalysts in an alkaline environment, such as cobaltites, ferrites, and manganates [15,16,17]. Among them, inverse spinel type-NiFe2O4 gained tremendous interest owing to its low cost, environmental friendliness, widespread availability, activity, high conductivity, and stability. However, the electrocatalyst activity varies by structure, valence, composition, and morphology, which in its turn depends on synthesis methods and conditions [18]. The crystallinity, phase, and crystallite size and oxidation state of the metal center could be varied during the preparation, for example by calcination at different temperatures [19].
The most commonly used synthesis methods are conventional solid-state, vapor phase deposition, and solution-based. The solid-state method consumes a lot of energy and time to produce the micro-sized particles. Even though the vapor phase deposition could produce an ultra-pure atomic thick-porous structure, its mass production will be expensive and time-consuming [17]. The solution-based methods are easily scalable and low temperature-driven, and morphological control is also possible. These methods include sol-gel, co-precipitation, hydrothermal, micro-emulsion, microwave, and electrochemical synthesis. Among them, hydrothermal synthesis has several desirable features: low cost, non-toxic chemicals, high purity homogeneous phase, uniform sized nanoparticle, and preferentially oriented crystal facets [20,21,22]. This method could be used to synthesize Ni ferrite nanoparticles with the increased surface area and surface properties.
Herein, we prepared Ni and Fe oxide phases through the urea-assisted hydrothermal method, and the samples were sintered within a temperature range of 100 to 600 °C. The samples were characterized using XRD (X-ray Diffraction), TEM (Transmission Electron Microscopy), N2 adsorption isotherm, and Raman and X-ray photoelectron spectroscopy (XPS). Electrochemical performance such as bifunctional activity, as well as the electrode kinetics, were studied using Cyclic Voltammetry (CV) and linear sweep voltammetry (LSV) coupled with RDE (Rotating Disk electrode) in alkaline electrolyte.
2. Results and Discussions
Ni-Fe carbonate hydroxide was synthesized using the urea assisted-hydrothermal method. After the hydrothermal synthesis, the centrifuged products were further subjected to calcination to result in the final product (Ni-ferrite). The reaction sequence is given in the following Equations (1)–(3)
CO(NH2)2 + 2H2O → 2NH4+ + CO32−
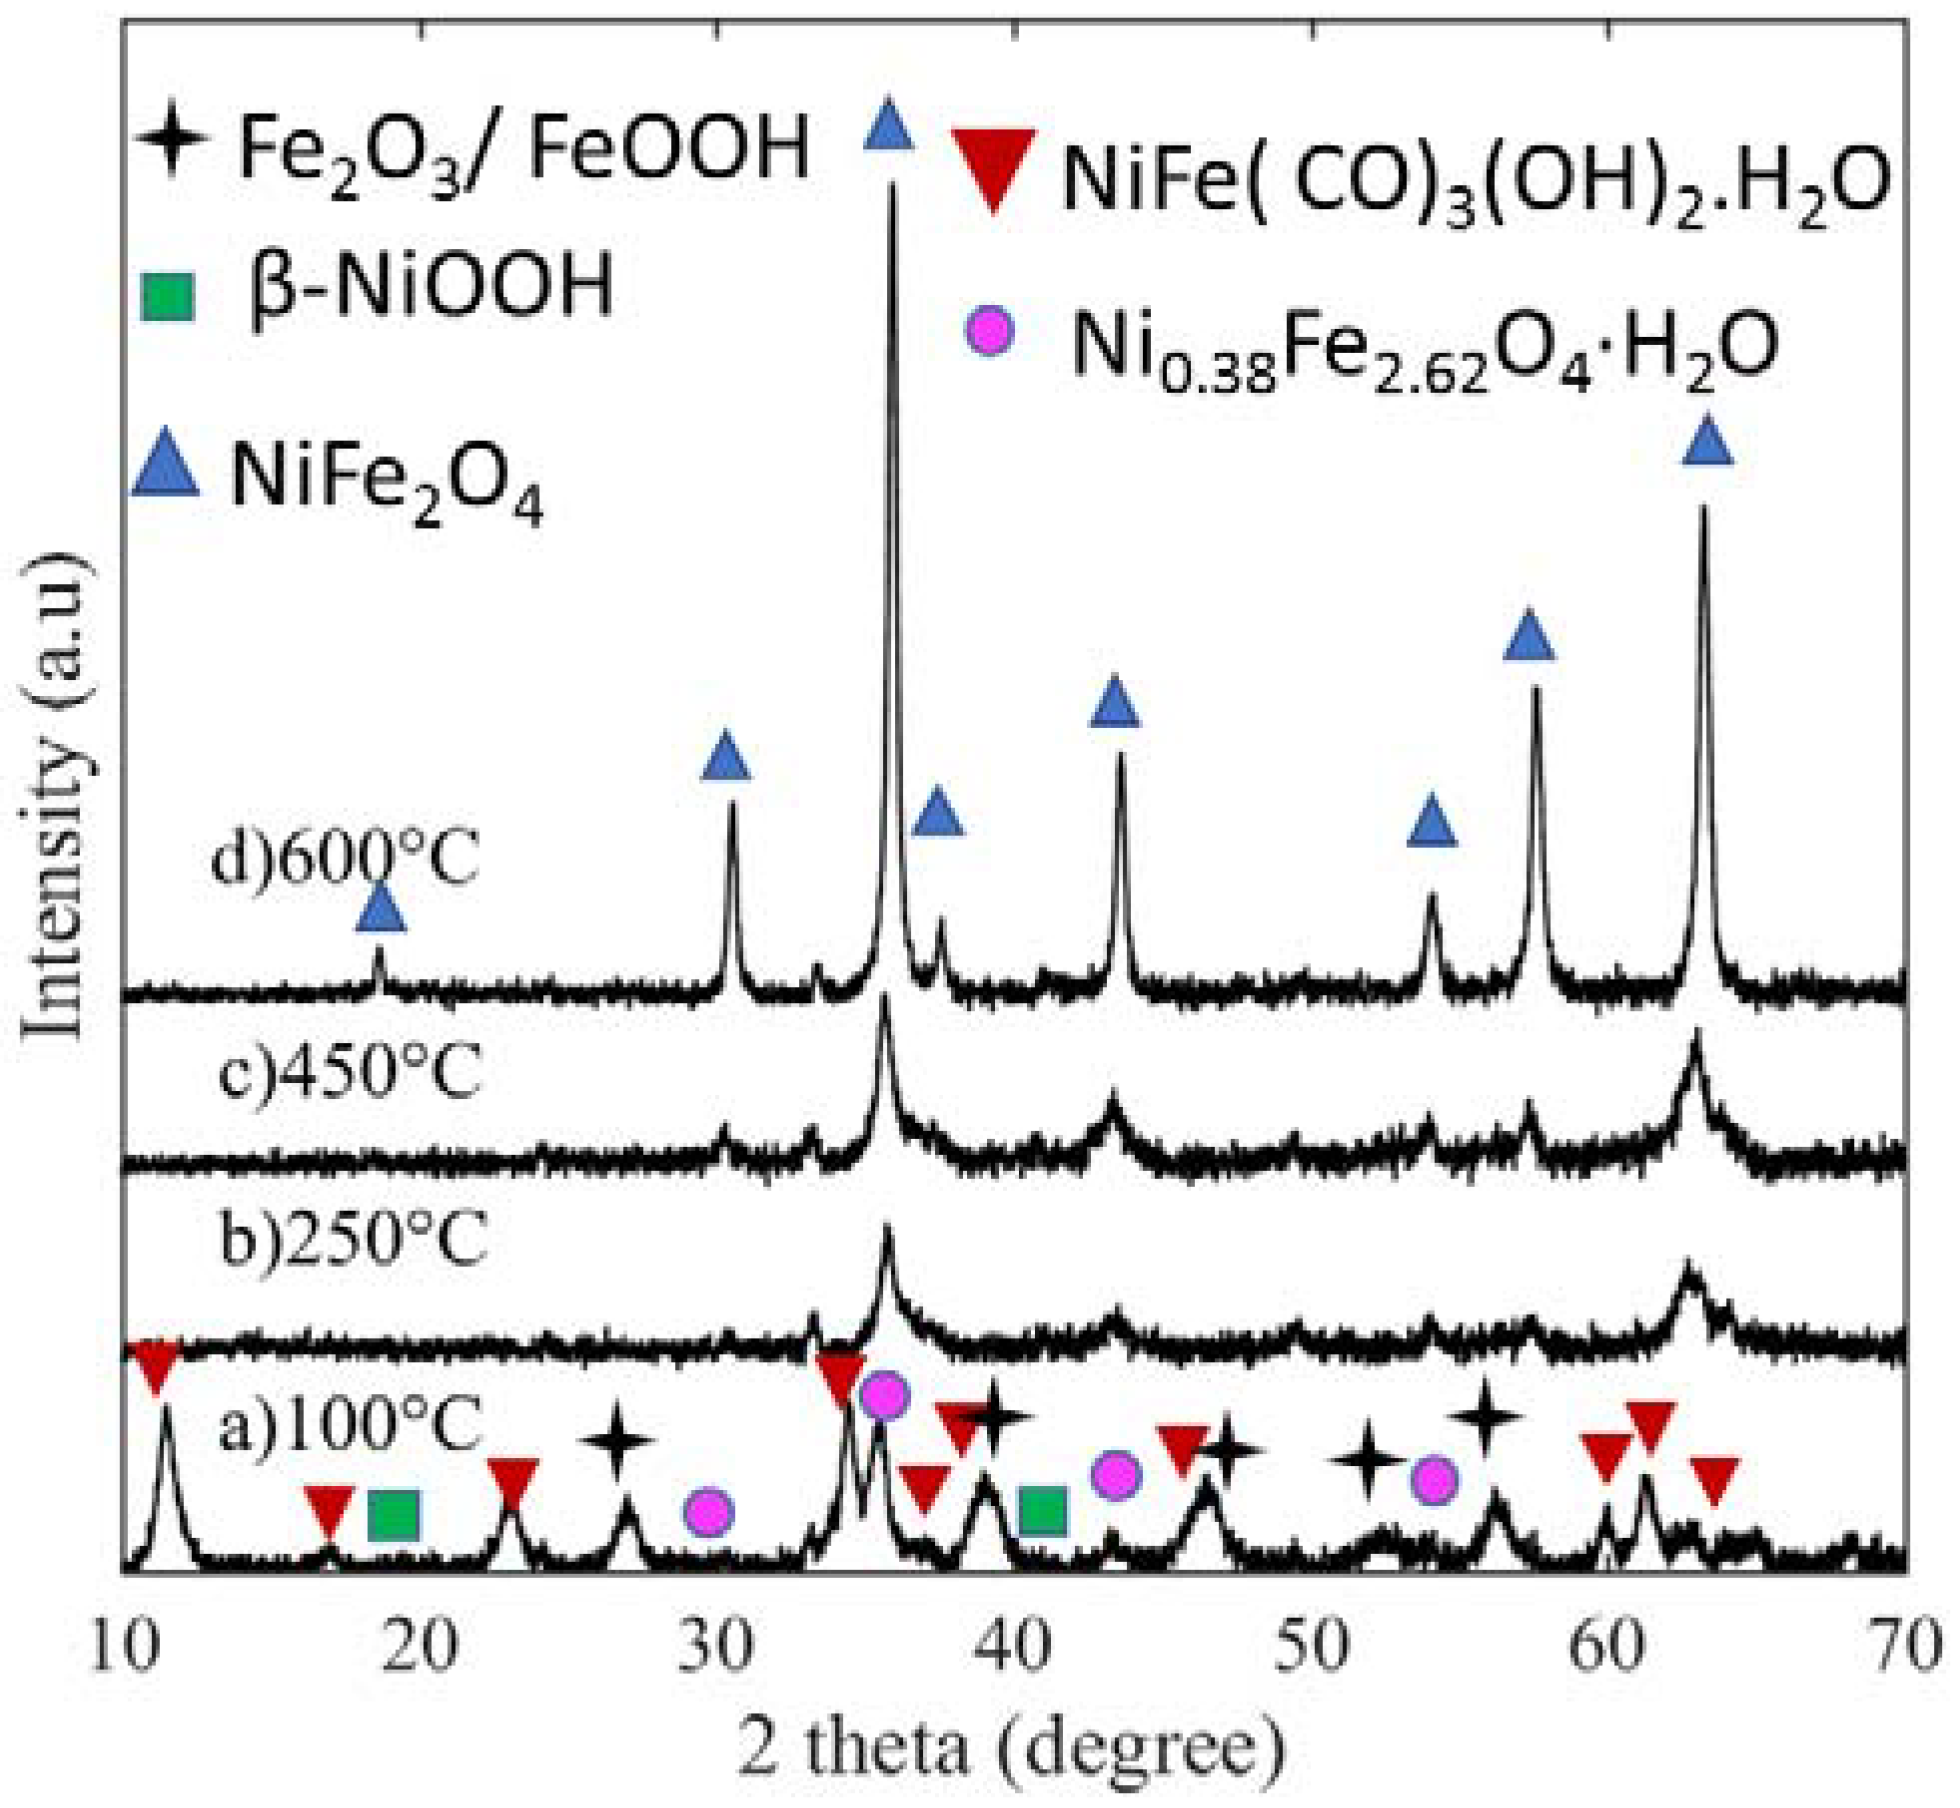
The crystalline phase evolution of NiFe oxides is shown in Figure 1 as a function of calcination temperature, in which the patterns listed from (a) to (d) correspond to 100, 250, 450, and 600 °C calcined samples, respectively. At 100 °C, the sample has three major phases: namely, nickel iron hydroxide hydrate (Ni0.38Fe2.62O4·H2O, PDF 00-056-1344), layered double hydroxide carbonate phase (Ni0.75Fe0.25(CO3)0.125(OH)2. 0.38 H2O, PDF 00-040-0215), and Iron Oxide Hydrate phase (β-Fe2O3H2O, PDF 00-003-0440). Further, there are two minor phases: NiOOH and FeOOH. When the temperature is further raised to 250 °C, water and carbon dioxide are liberated, as shown in Equations (1) and (2) from the layered carbonate and hydroxide (LDH) phases leading to the formation of spinel nickel ferrite (NiFe2O4 JCPDS74-2081). Further calcination at 450 and 600 °C results in more crystalline NiFe2O4. The measured Scherrer crystallite size for 100, 250, 450, and 600 °C calcined samples is given in Table 1. The crystallite size is measured at 11.52°, 003 orientation of LDH phase. For the remaining samples, crystallite sizes are measured at ≈35.90°, (311) orientation of nickel ferrite. The peaks at 35.9°and 65.3° correspond to (311) and (440) crystal orientations of inverse nickel ferrite (NiFe2O4) for those samples calcined at 250, 450, and 600 °C. The intensities of the peaks at (311) and (440) suggest that an increase in calcination temperature increased both the (311) and the (440) crystal facets. Thus, calcination temperature has a direct effect on phase, crystallinity, and crystallite size.
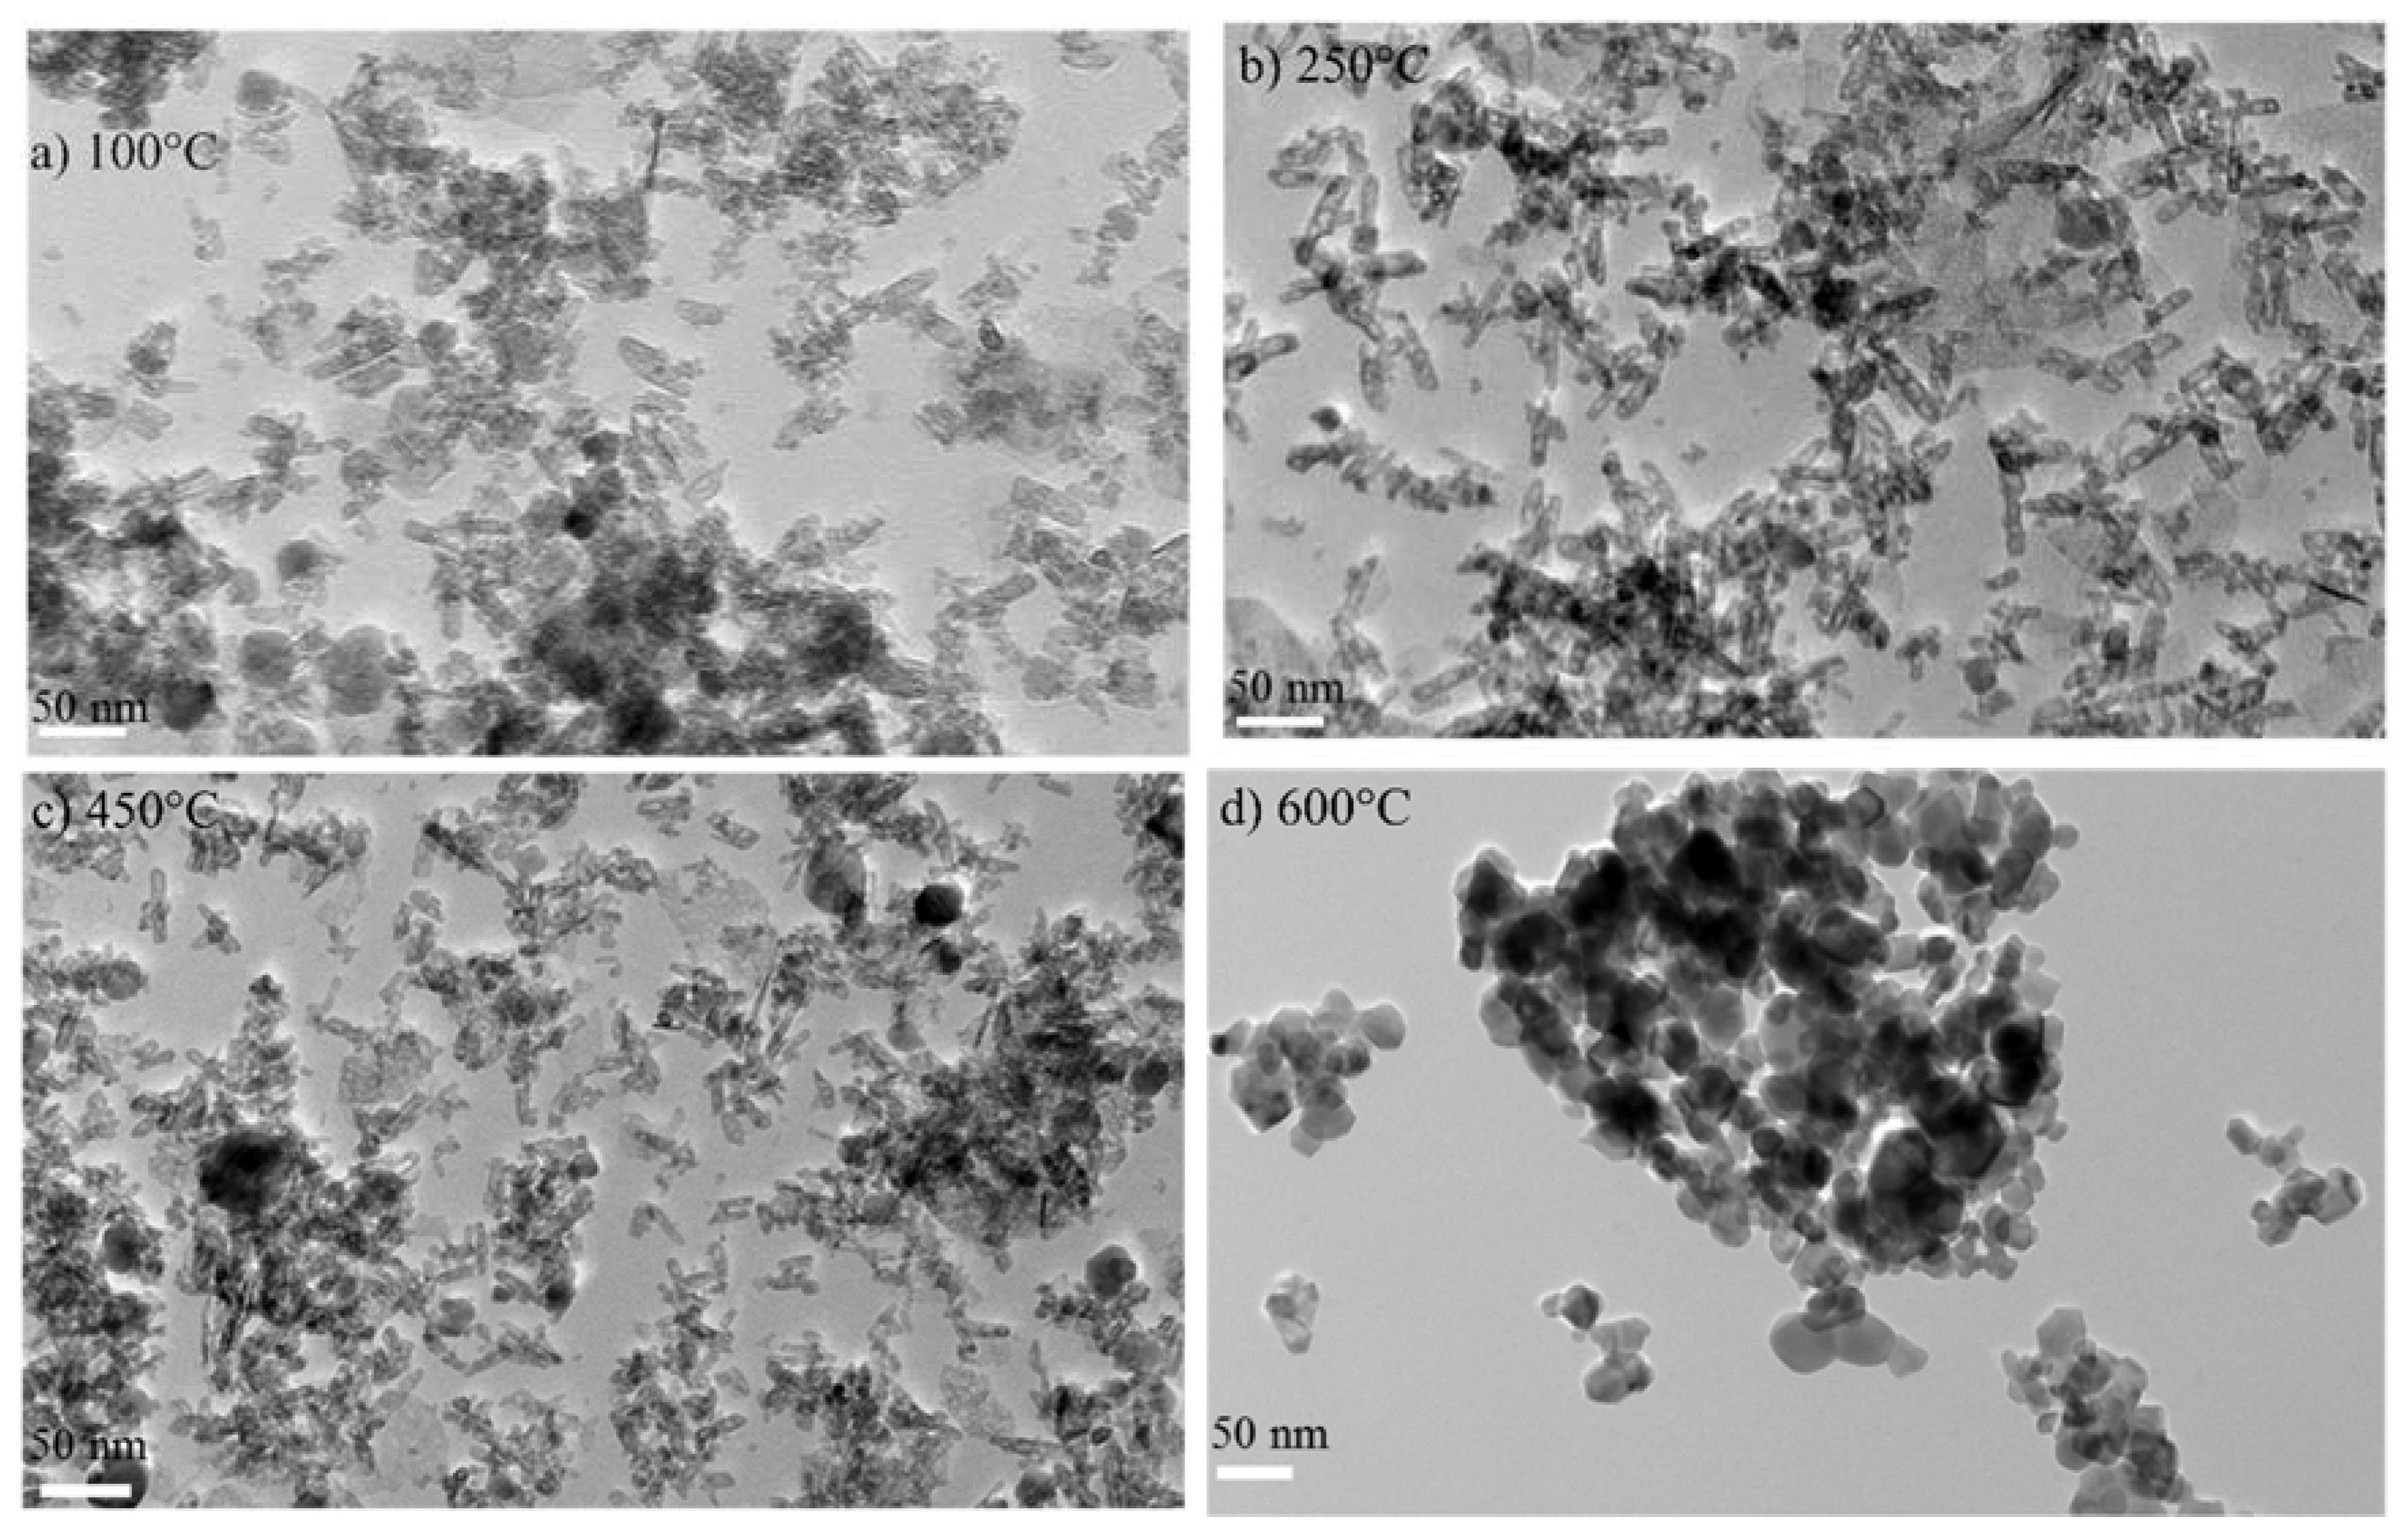
Using this synthesis approach, well-crystallized nanoparticles were prepared starting from 250 °C. To further understand the calcination temperature effect on the samples morphology, TEM measurement was performed, as shown in Figure 2a–d. As observed from Figure 2a–c, the majority of the particles are in nanorod morphology and some of them in thin platelet and oblong structure at 100 to 450 °C. However, at 250 and 450 °C the particles start forming cavities and agglomeration to form bigger particles. At 600 °C, the particle morphology is completely changed into clunches having both spherical and cubic structures with different edges, confirming the XRD results, where the crystallite size changes from 13.85 to 10.89 nm for the samples at 100 and 250 °C, respectively and increases to 13.53 nm at 450 °C and then finally, it grows to 26.66 nm at 600 °C. The anomalous change especially at 250 °C is due to the decarbonization and dehydration causes the crystallite size to shrink which is also responsible for the observed cavities in the TEM image (Figure 2b). The TEM result shows that in most of the samples, the particles have well dispersed-nanorod structures which are favourable catalytic active sites for oxygen redox reaction [23].
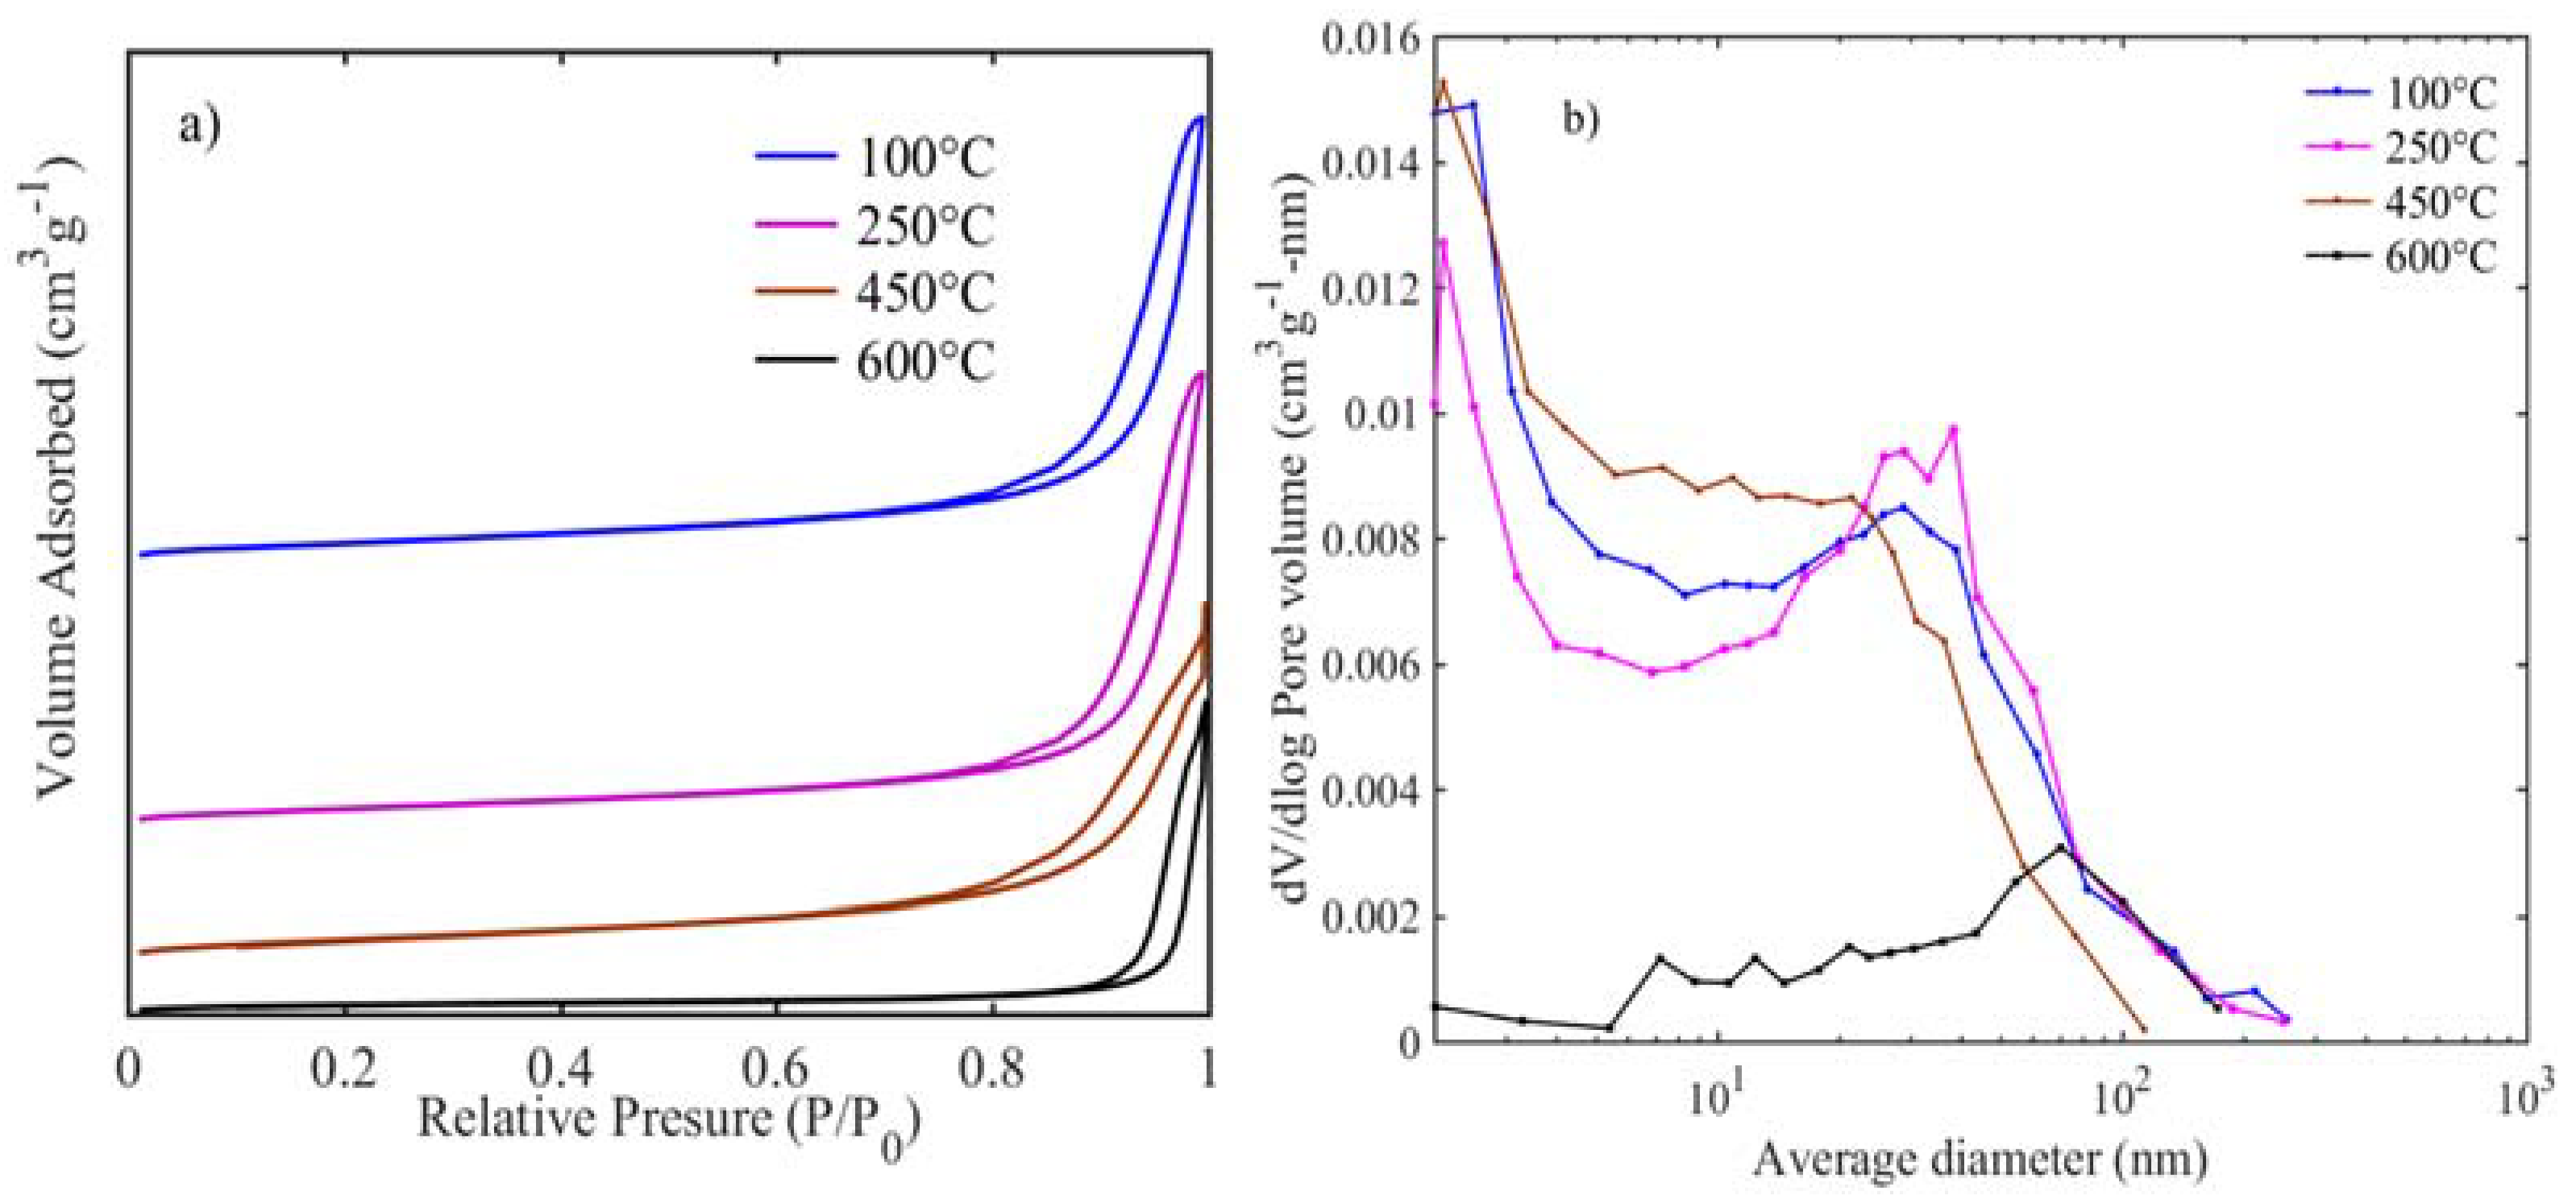
Usually, electrocatalytic activity is directly related to the accessible surface area for the oxygen redox reaction [24]. BET surface area, pore volume, and pore size distribution results are presented in Figure 3 and Table 1. All the samples are of the type-IV isotherm (Figure 3a) with H3 hysteresis loop, which is typical for aggregates of micro/mesoporous particles [25]. Upon increasing the calcination temperature, an increase in hysteresis between adsorption-desorption is observed with relative pressures moving more towards unity. The highest surface area (131 m2 g−1) is exhibited for the sample calcined at 100 °C, and when the calcination temperature increases to 250 °C, it results in a similar surface area of 127 m2 g−1. Thus, the decarbonization and dehydration have not altered the surface and porous nature of the samples. Further increase in calcination temperature results in a surface area of 118 m2 g−1 at 450 °C, which is dramatically reduced to 40 m2 g−1 at 600 °C. This confirms that the increase in crystallite size as observed in the TEM and decrease in BET areas are consistent with the calcination-induced nanoparticle growth [26]. Average pore size distribution for samples at 100–450 °C (Figure 3b) shows pores are in a bi-modal size that have less than 2 nm micropores and mesopores between 10–50 nm, while for the sample heat-treated at 600 °C, most of the pores are in the meso to macropore range (10–60 nm). The pore size distributions for those samples calcined at 100–450 are similar to layered and pillared solids, while the sample at 600 °C is similar to porous ceramics [27]. Likewise, the pore volumes tend to decrease substantially with the increase in heat-treatment. Therefore XRD, TEM, and BET results reveal that the nano-sized, rod-like, and high surface area NiFeOx catalyst surfaces are easily accessible by the oxygen and hydroxide ion for the desirable gas-liquid interface oxygen redox reactions.
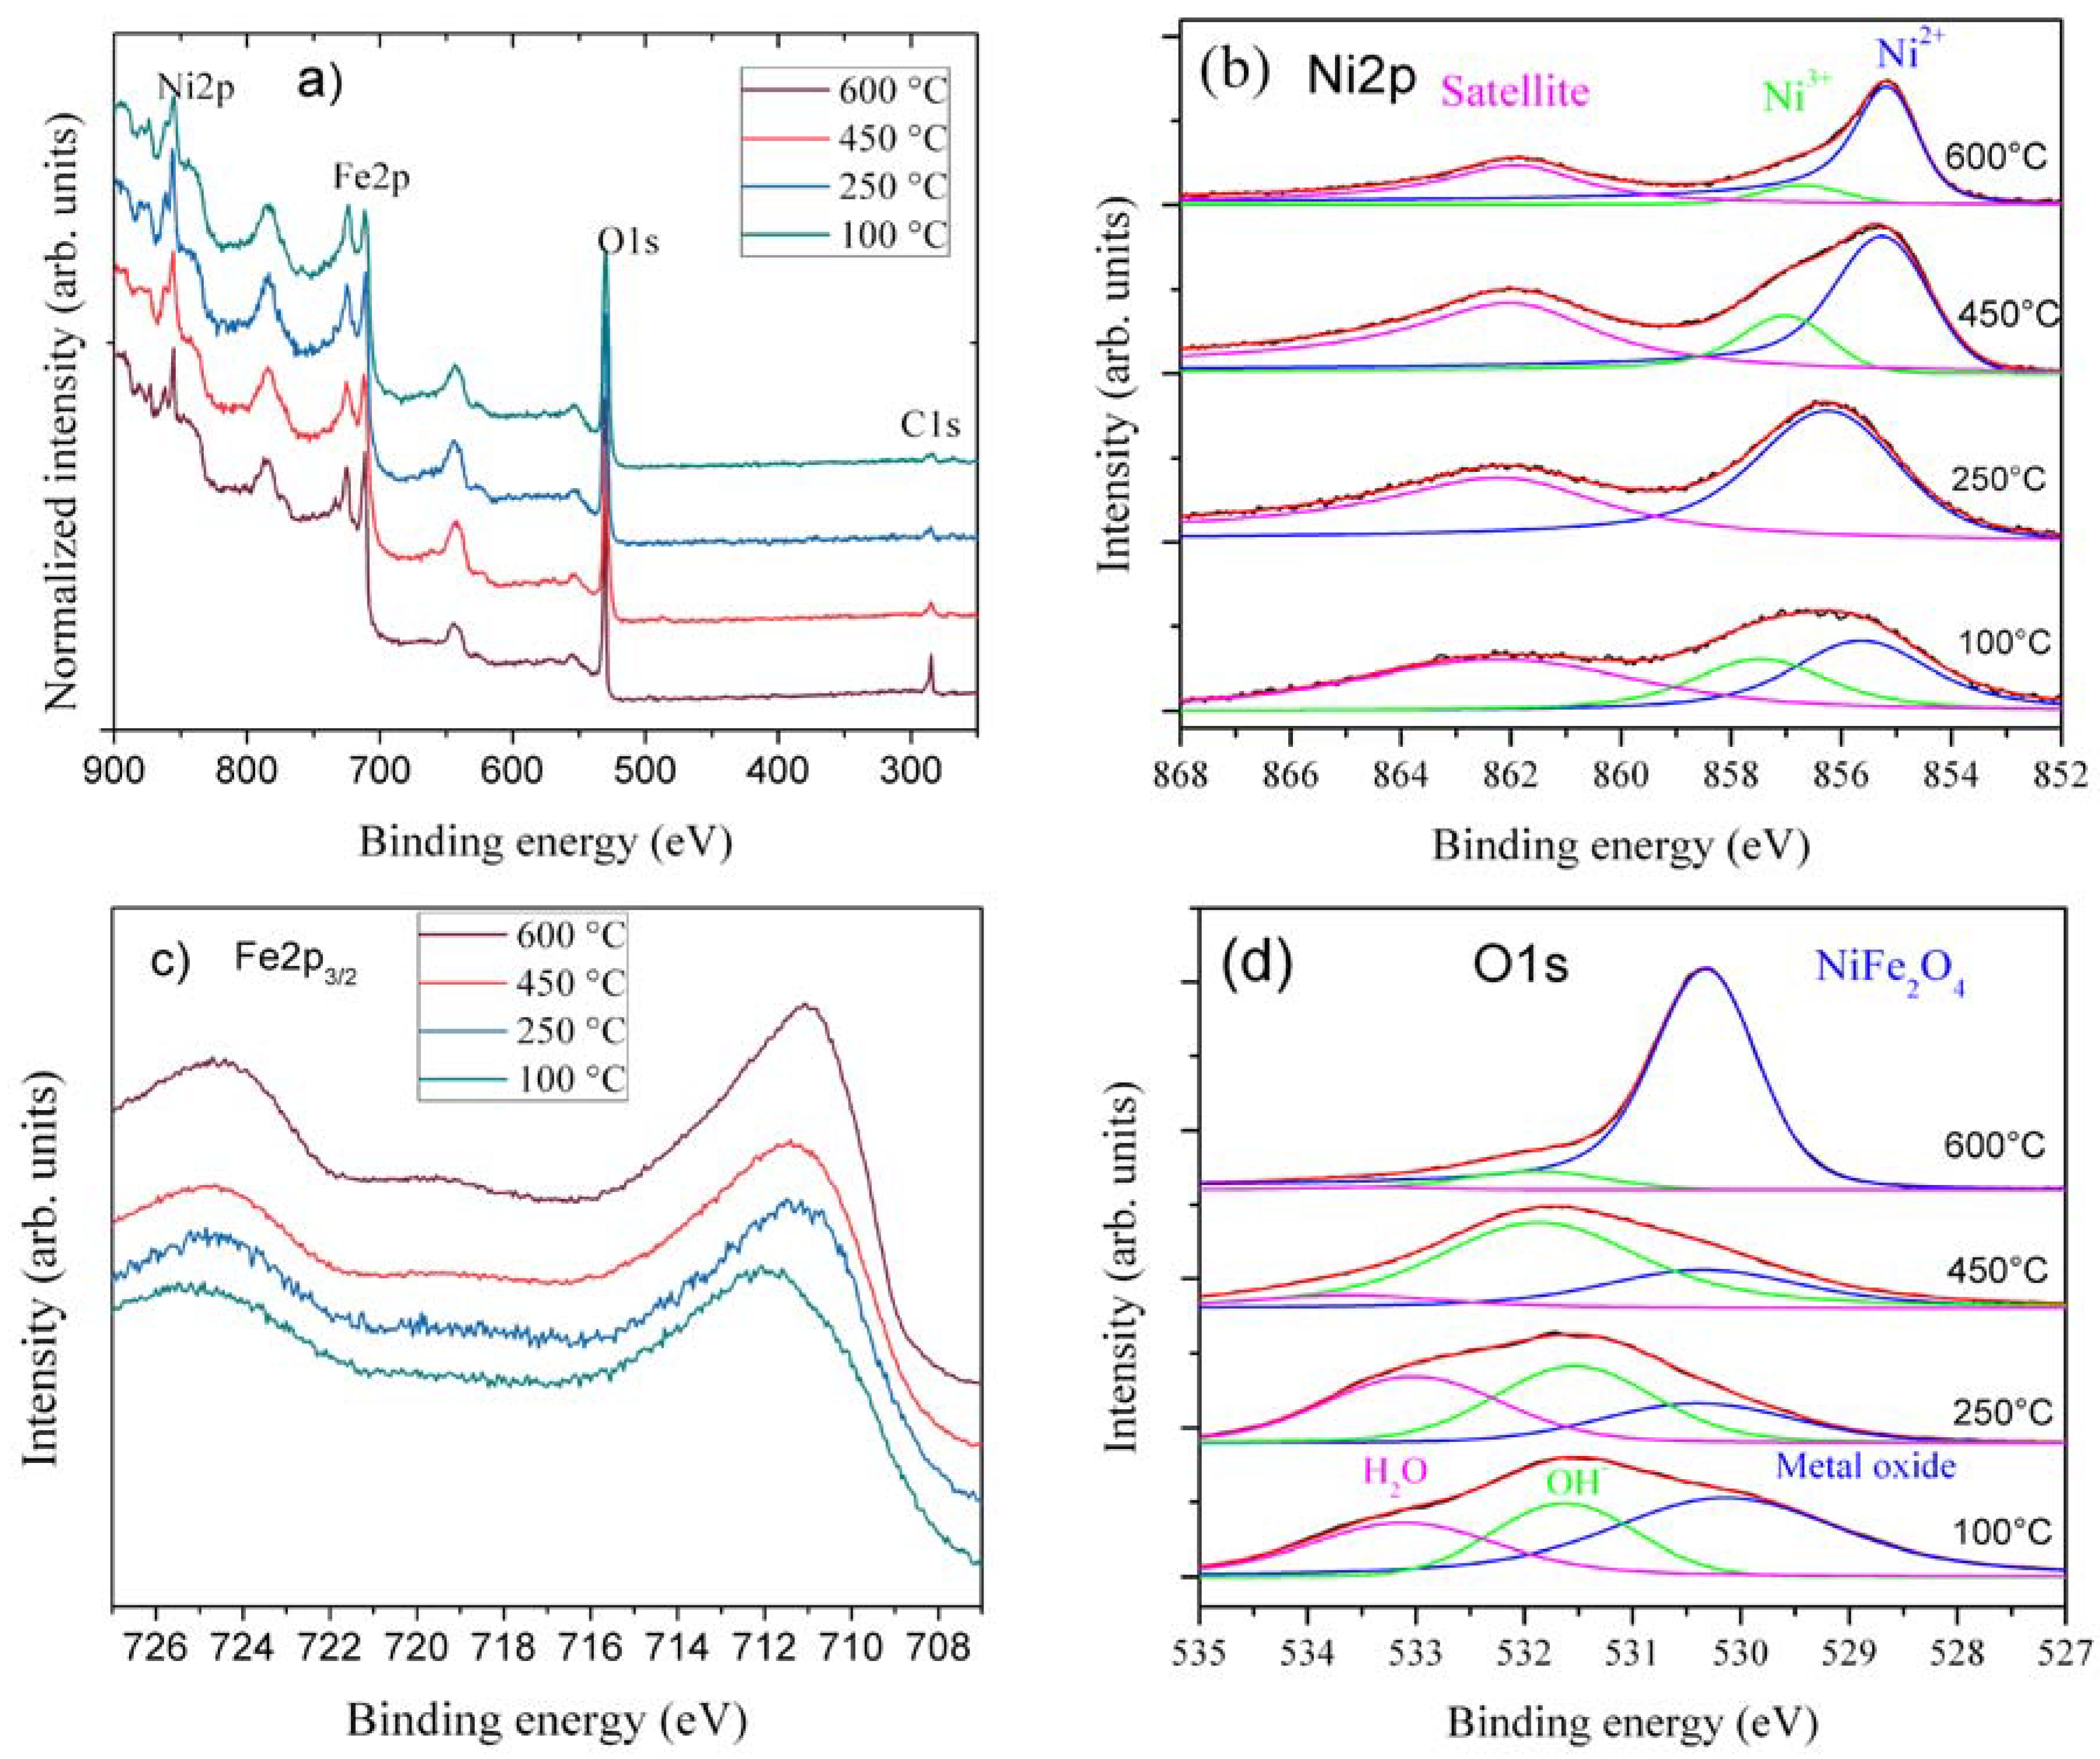
The surface oxidation state of the samples is analyzed using XPS with focus on Ni2p, Fe2p, O1s, and C1s regions. Figure 4a–d shows the wide spectra and close up spectra of Fe2p, Ni2p, and O1s from all four samples. Peak deconvolutions of Ni2p and O1s are shown in Figure 4b,d. The wide spectra show minimal carbon presence, except at 600 °C (Figure 4a). The relative Ni2p intensity decreases at higher temperatures. O1s, Fe2p, and Ni2p are broad at lower temperature calcinations, while they sharpen at higher temperatures. This is in agreement with the sharper and pure phase formation at higher temperatures in XRD. Ni2p spectra show broad and multiple split peaks spanning 859 to 854 eV, confirming different metal oxidation states and co-ordinations in the lattice. However, at higher temperatures, Ni peaks narrow and move to lower binding energy. At 100 °C, samples have both octahedral arising from Ni(OH)2 and NiFe(CO)3(OH)2, and tetrahedral coordination from NiOOH, while at 250–450 °C, calcination leads to more tetrahedral coordination in the lattice. This indicates that in low-temperature spinel, Ni2+ ions tend to be both in the octahedral and tetrahedral coordination, as they are in inverse spinels, while at 600 °C, Ni ions solely go to octahedral coordination [28], as shown in Figure 4b. The relative intensities of peak deconvoluted-ration (Table S1) of Ni2+/Ni3+ and O1S also confirm that more metal oxide with spinel structure forms at high temperatures. The Ni peak shapes are similar to those reported by the authors of [29]. Fe2p3/2 spectra from the four samples are presented in Figure 4c. There are no dramatic variations in line shape and peak position. At 100 °C, spectra are closer to Fe2O3 [30,31]; they also have slight additional intensity at higher binding energy from the NiFe(CO)3(OH)2. The 250 and 450 °C samples spectra are gradually shifted from the 100 °C spectrum towards the 600 °C spectrum. The 600 °C calcined sample spectrum resembles the Fe2p spectrum from NiFe2O4 [28]. O1s spectra of different samples are shown in Figure 4d, which substantially supports the distinction between the calcined samples. At 100 °C, there are three peaks: metal oxide, hydroxide, and H2O [30]. The metal oxide peak can be assigned to Fe2O3, since it is one of the starting materials and is observed in XRD. Both OH− and H2O groups are also part of the phases observed in XRD. Further heating up to 250 °C decreases the metal oxide peak and coincides with Fe2O3 conversion into the spinel phase. At 400–650 °C, there is only metal-oxide peak confirming that almost all water and hydroxide has been removed and the NiFe2O4 phase dominates. However, the peak position shift to low binding energy at low temperatures coincides with the observed peak shift in Fe and Ni spectra. Therefore, the XPS results suggest multiple oxidation state and surface functional groups are present at low temperatures, particularly at 250 °C. A surface rich in oxygen functional groups will enhance the electrocatalytic activity of the water oxidation [32,33].
To understand the type of surface groups present in the NiFeOx, Raman spectroscopy was performed and shown in Figure S4. Figure S4a shows the Raman spectra of 100–250 °C heat-treated samples. At 100 °C, samples have shown the characteristic peaks of CO32−, M-OH, and MII-O-MIII [34]. When the heat treatment increased to 250 °C, it resulted in characteristic signals of NiFe2O4 and LDH phases. Noticeably, the highly intensive M-OH signal is observed at 295 cm−1. This observation, together with XPS results, confirms that more Ni hydroxide phases are formed on the surface of 250 °C sample. Figure S4b shows the 450–600 °C heat-treated samples’ Raman spectra. The temperature increase causes the disappearance of M-OH and CO32−. The mixture of Ni and iron oxide phases is observed at 450 °C. The XPS Ni2p spectra showed two types of Ni oxidation states at 450 °C, whereas at 600 °C the Raman spectra shown in Figure S4b is similar to commercial NiFe2O4 [35]. Thus, the low-temperature samples have a wide range of surface functional groups, which is beneficial for redox reactions.
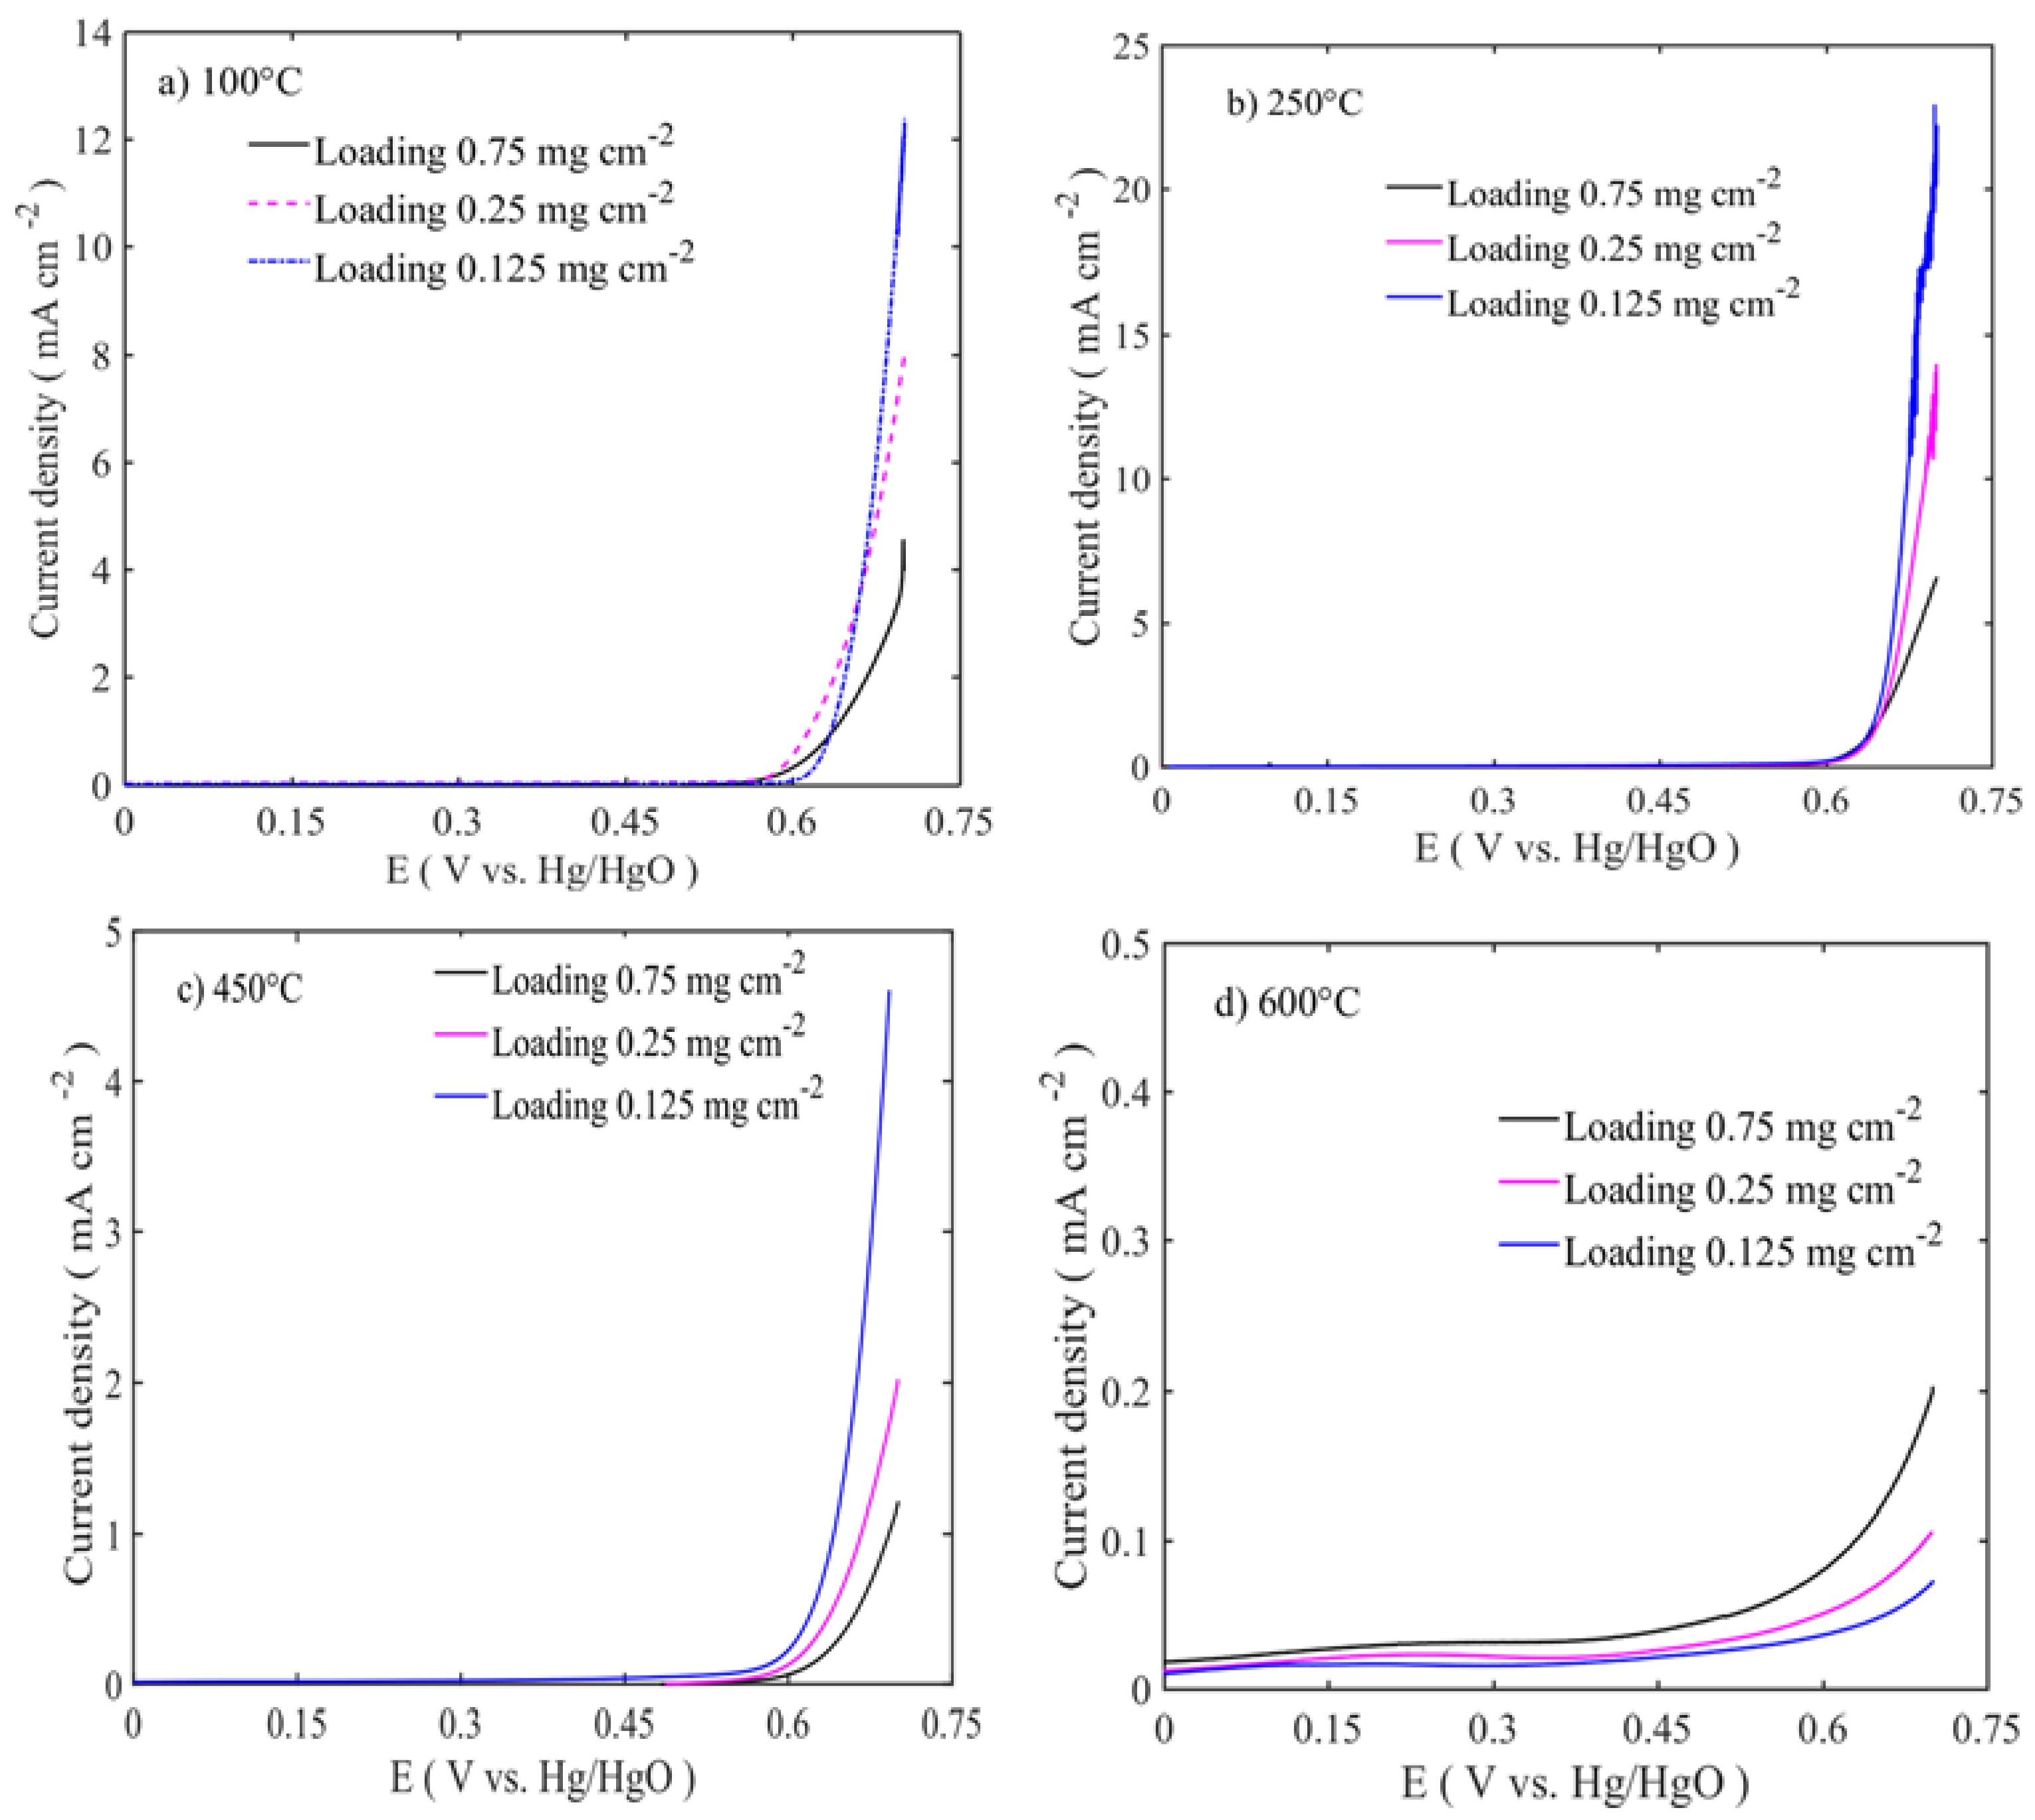
The electrocatalytic activities of the catalysts were assessed by linear sweep voltammetry (LSV) with the rotation rate of 1600 rpm, as shown in Figure 5 and Figure 6. The polarization curves were iRu corrected using the current interruption method. In order to observe the effect of the catalyst loading on the electrochemical activity, three different catalyst loadings were chosen: 0.125, 0.25, and 0.75 mg cm−2. The best performing catalyst for OER is the sample calcined at 250 °C with a catalyst loading of 0.125 mg cm−2. The activity trends are in the following order: 250 °C > 100 °C > 450 °C > 600 °C, as shown in Figure 4. The increased catalyst loading has greatly influenced the OER activity and the onset potential. The OER onset potentials of the samples calcined between 100 and 450 °C are low for the ones with the highest loadings. However, in the case of 600 °C calcined sample, the OER onset potential is high for the lowest loading. This might be due to the different nature of the sample surface, morphology, and phase formations. As shown in the TEM image in Figure 2a,b, low temperature-treated particles have the large number of edges and cavities, where these active sites are easily accessible, while at high temperatures, the particles are agglomerated with the active sites that are blocked and have the lower number of edge sites. At the same time, thin catalyst layer accommodates better metal center accessibility, resulting in enhanced OER activity. The highest catalyst activity on the OER side is 23 mA cm−2 at 0.7 V vs. Hg/HgO is for the lowest catalyst loading at 0.125 mg cm−2. The activity at 0.7 V vs. Hg/HgO changes from 23 to 8 and 5 mA cm−2, respectively, when the loading is increased to 0.25 and 0.75 mg cm−2. Figure S1 shows the cyclic voltammetry of the sample at 250 °C, where there are two well-defined peaks associated with Ni metal center oxidation to 3+. The following oxidation reactions are given [34,36]:
- Step 1(surface oxidation)NiII − FeIII + OH−sol ↔ (OH−)ie − NiIII − FeIII + e−
- Step 2 (hydroxide adsorption)(OH−)ie − NiIII − Fe III + OH−sol ↔ (OH−)ie − NiIII − FeIII − OH−ads + e−
- Step 3 (charge transfer)(OH−)ie − NiIII − FeIII − OH−ads + OH−sol ↔ (OH−)ie − NiIII − FeIII+ ½ O2 + H2O + e−
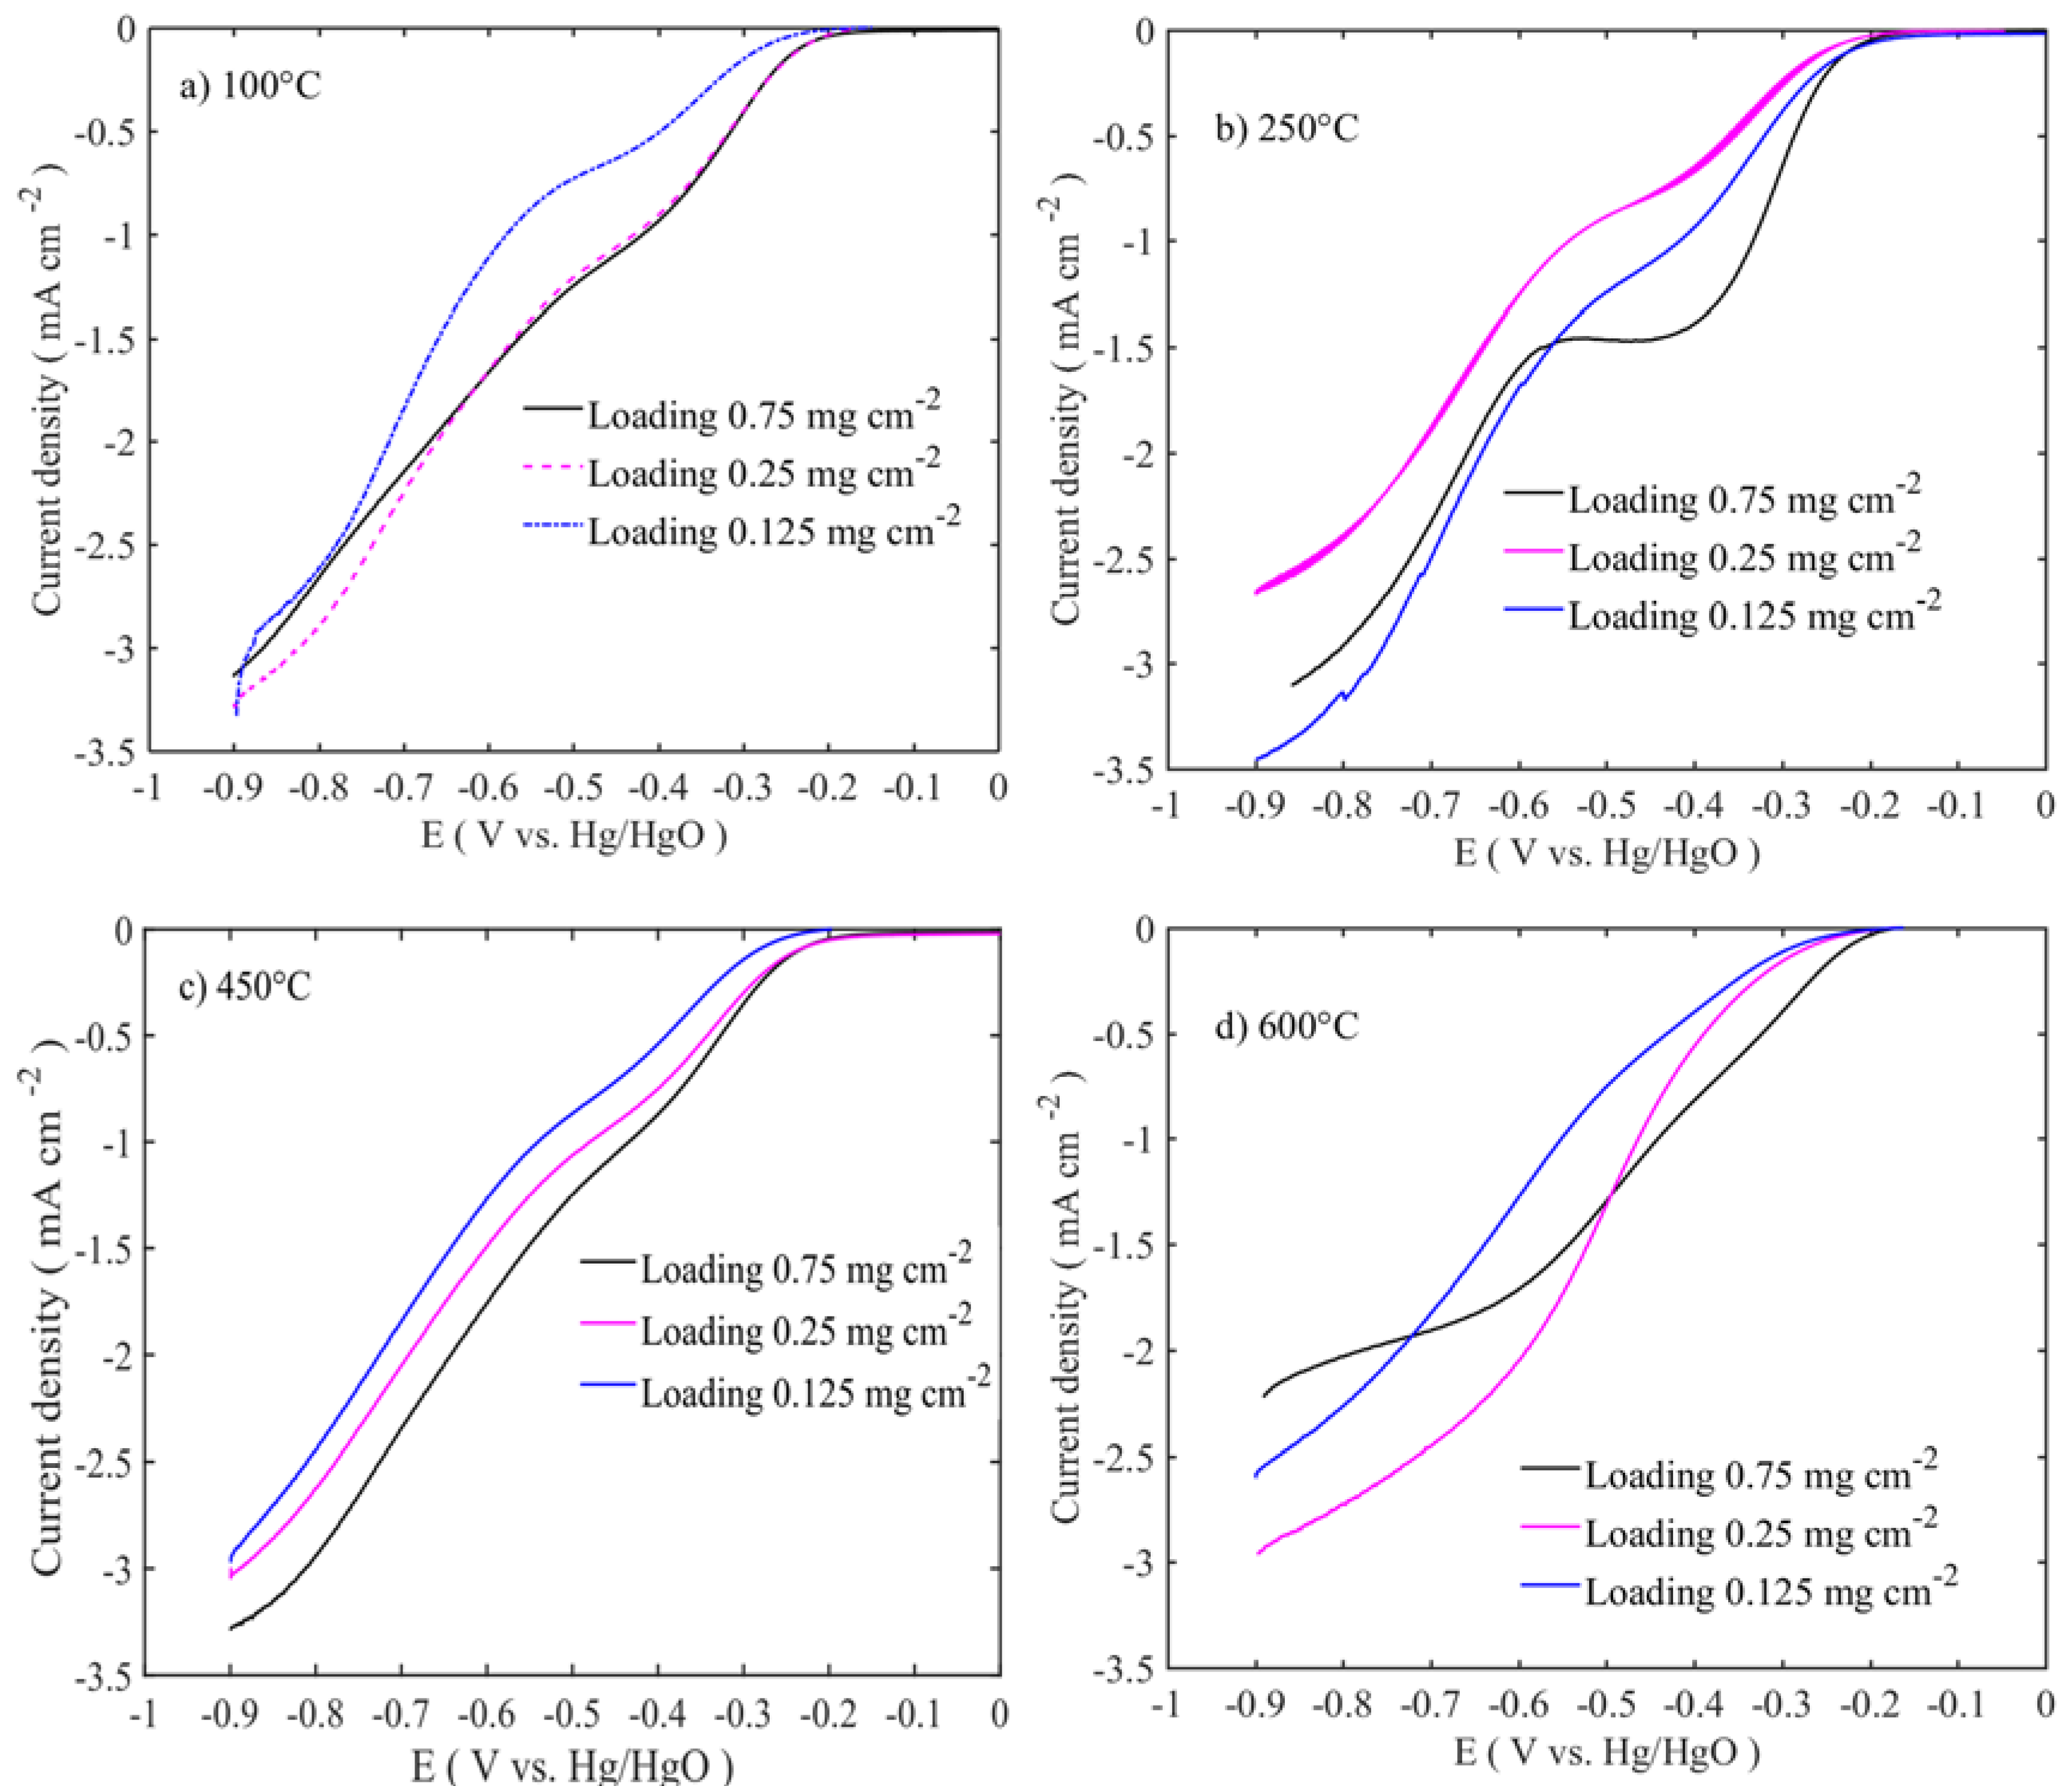
During the first step, Ni2+ is oxidized to Ni3+ accompanied with hydroxide ion intercalation into inter-layer space, followed by partial charge shift to Fe3+ from Ni3+, resulting in more than 3+ oxidation states [37]. It was reported that Fe-O bond contraction occurs at the mixed hydroxide (NiFeOOH) after nickel hydroxide oxidation to oxyhydroxide state, which gives optimal adsorption energies for OER intermediaries (OH. O, OOH) [38]. This results in the hydroxide adsorption on the iron active site (step 2). After this, one electron transfer is followed by oxygen evolution (rate determining step-rds). As also shown by the XPS results, the different Ni ions are easily oxidized to higher states, while Fe3+ enhances hydroxide adsorption and thus results in high OER activities at 100–250 °C. On the ORR side, catalyst loading has a diametrically opposite effect, since the activity reduces as the loading is decreased and the ORR onset potential starts at more negative potentials (Figure 6a,d). Apart from this, different heat-treated catalysts have similar current density performances at the ORR side. Except for 600 °C calcined catalysts, all the catalysts show dual sigmoidal potential-current characteristics. This arises due to the differences in the underlining oxygen reduction mechanisms. Catalyst activity and selectivity are altered by catalyst loadings. Lower loading prefers more HO2− generation than higher loadings [39]. At 450 °C and 600 °C, heated catalysts have shown poorer performance on both OER and ORR activities due to the reduced surface area and accessible volume. Comparing the different loadings, lowest loadings for OER and the highest loadings for ORR are favourable for better catalytic activity. This suggests that on the OER side, thin catalyst layer exposes more active catalyst sites to the electrolyte and increases the mass transport of electroactive species. On the ORR side, catalyst conductivity and reaction mechanism might be altered based on catalyst loading.
To further understand the reaction mechanism, Tafel slopes are calculated from the polarization curve of Figure 5 and Figure 6 and the potential region between 0.6 to 0.63 V vs. Hg/HgO, which are shown in Table 2. The Tafel slope trends are similar to the catalyst activity trends in Figure 5. The lowest OER Tafel slope is 39.4 mV decade−1, which corresponds to the 250 °C calcined sample, while the highest slope is 581 mV decade−1, and it corresponds to 600 °C calcined sample. The lowest Tafel slope confirms the superior catalyst activity in the 100–250 °C calcined samples, and the highest Tafel slope at 600 °C heat treatment shows the poor catalytic activity. For the 250 °C calcined sample, the low Tafel slope (39–54 mV decade−1), which is related to 2.3 (2RT/3F)-2.3RT/F and could be attributed to O-O bond formation, is the RDS for the OER. For the high temperature-treated samples (450–600 °C), the higher OER Tafel slope means that the water adsorption is the rds [40]. These changes in Tafel slopes also confirm that the surfaces and electronic structures of the electrode interphases are different, and the adsorption-desorption kinetics of oxygen species involved in the reaction are also different, as evidenced in XPS and Raman study [41]. The ORR Tafel slopes are calculated from the potential region between −0.35 to −0.45 V vs. Hg/HgO. The lower calcined samples (100–450 °C) show higher Tafel values (≈120 mV decade−1), which are equivalent to 2.3 (2RT/F). For the 600 °C calcined sample, the Tafel slope is reduced to 70–100 mV decade−1 for the different loadings. These low values in low-temperature calcined samples suggest the superior kinetics of the catalysts. The Tafel slope values, however, corresponding to different temperatures and loadings, do not follow uniform trends.
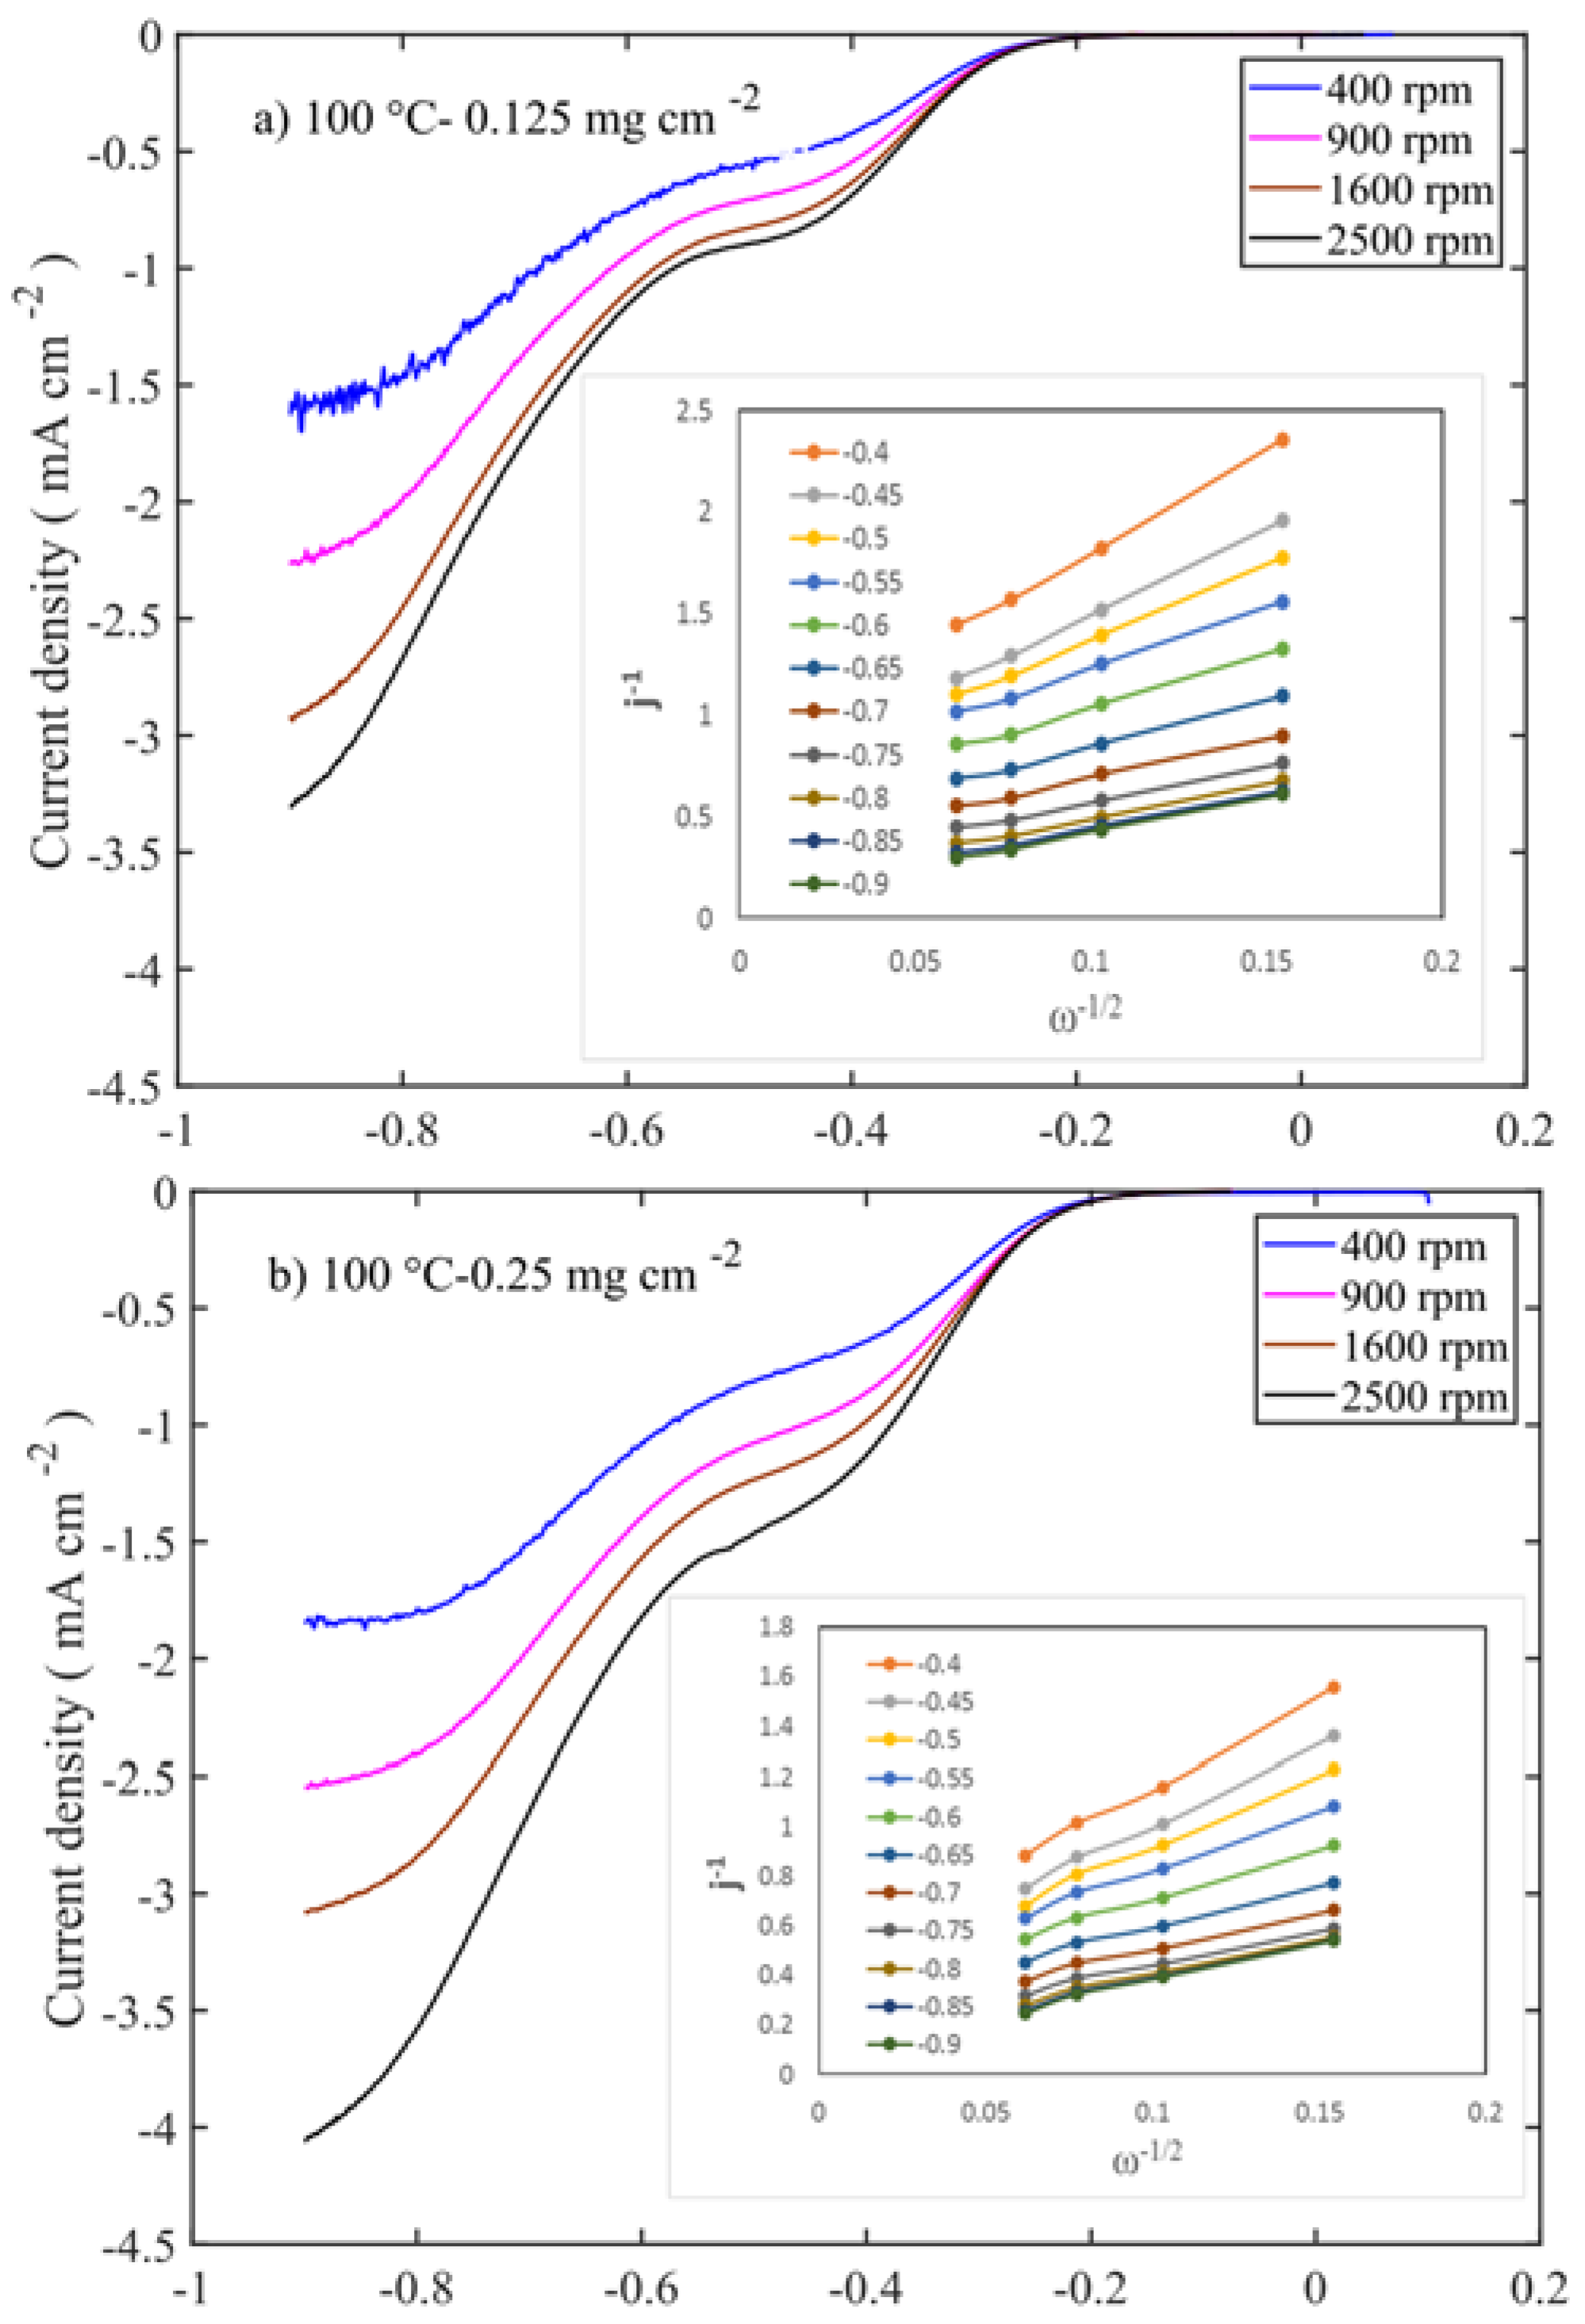
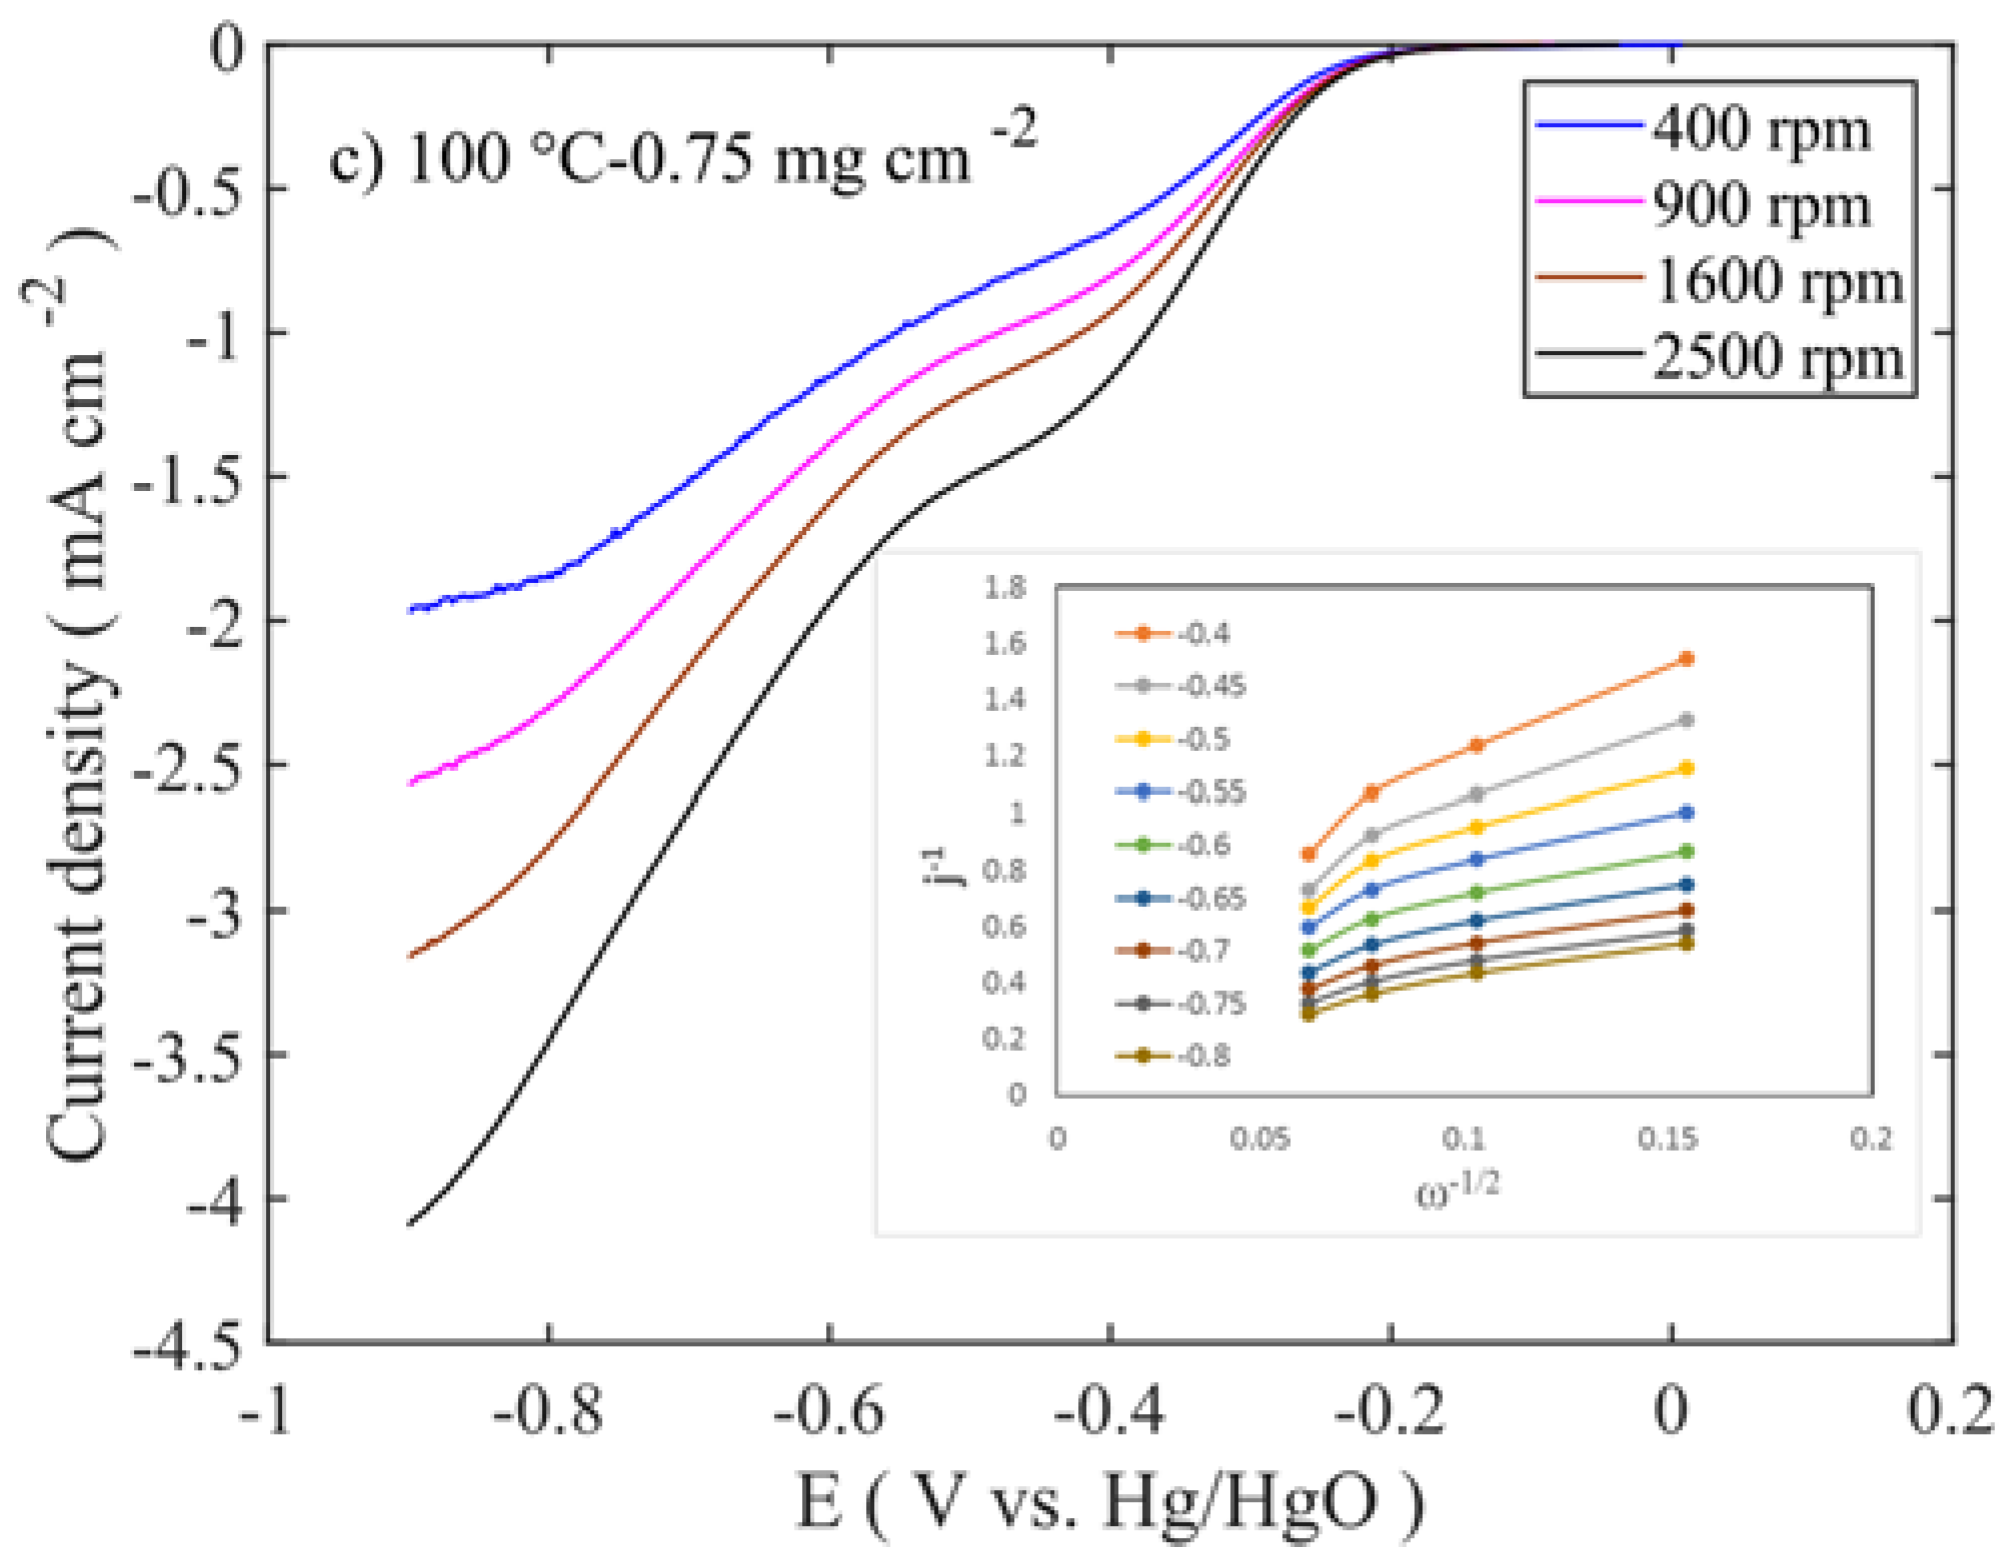
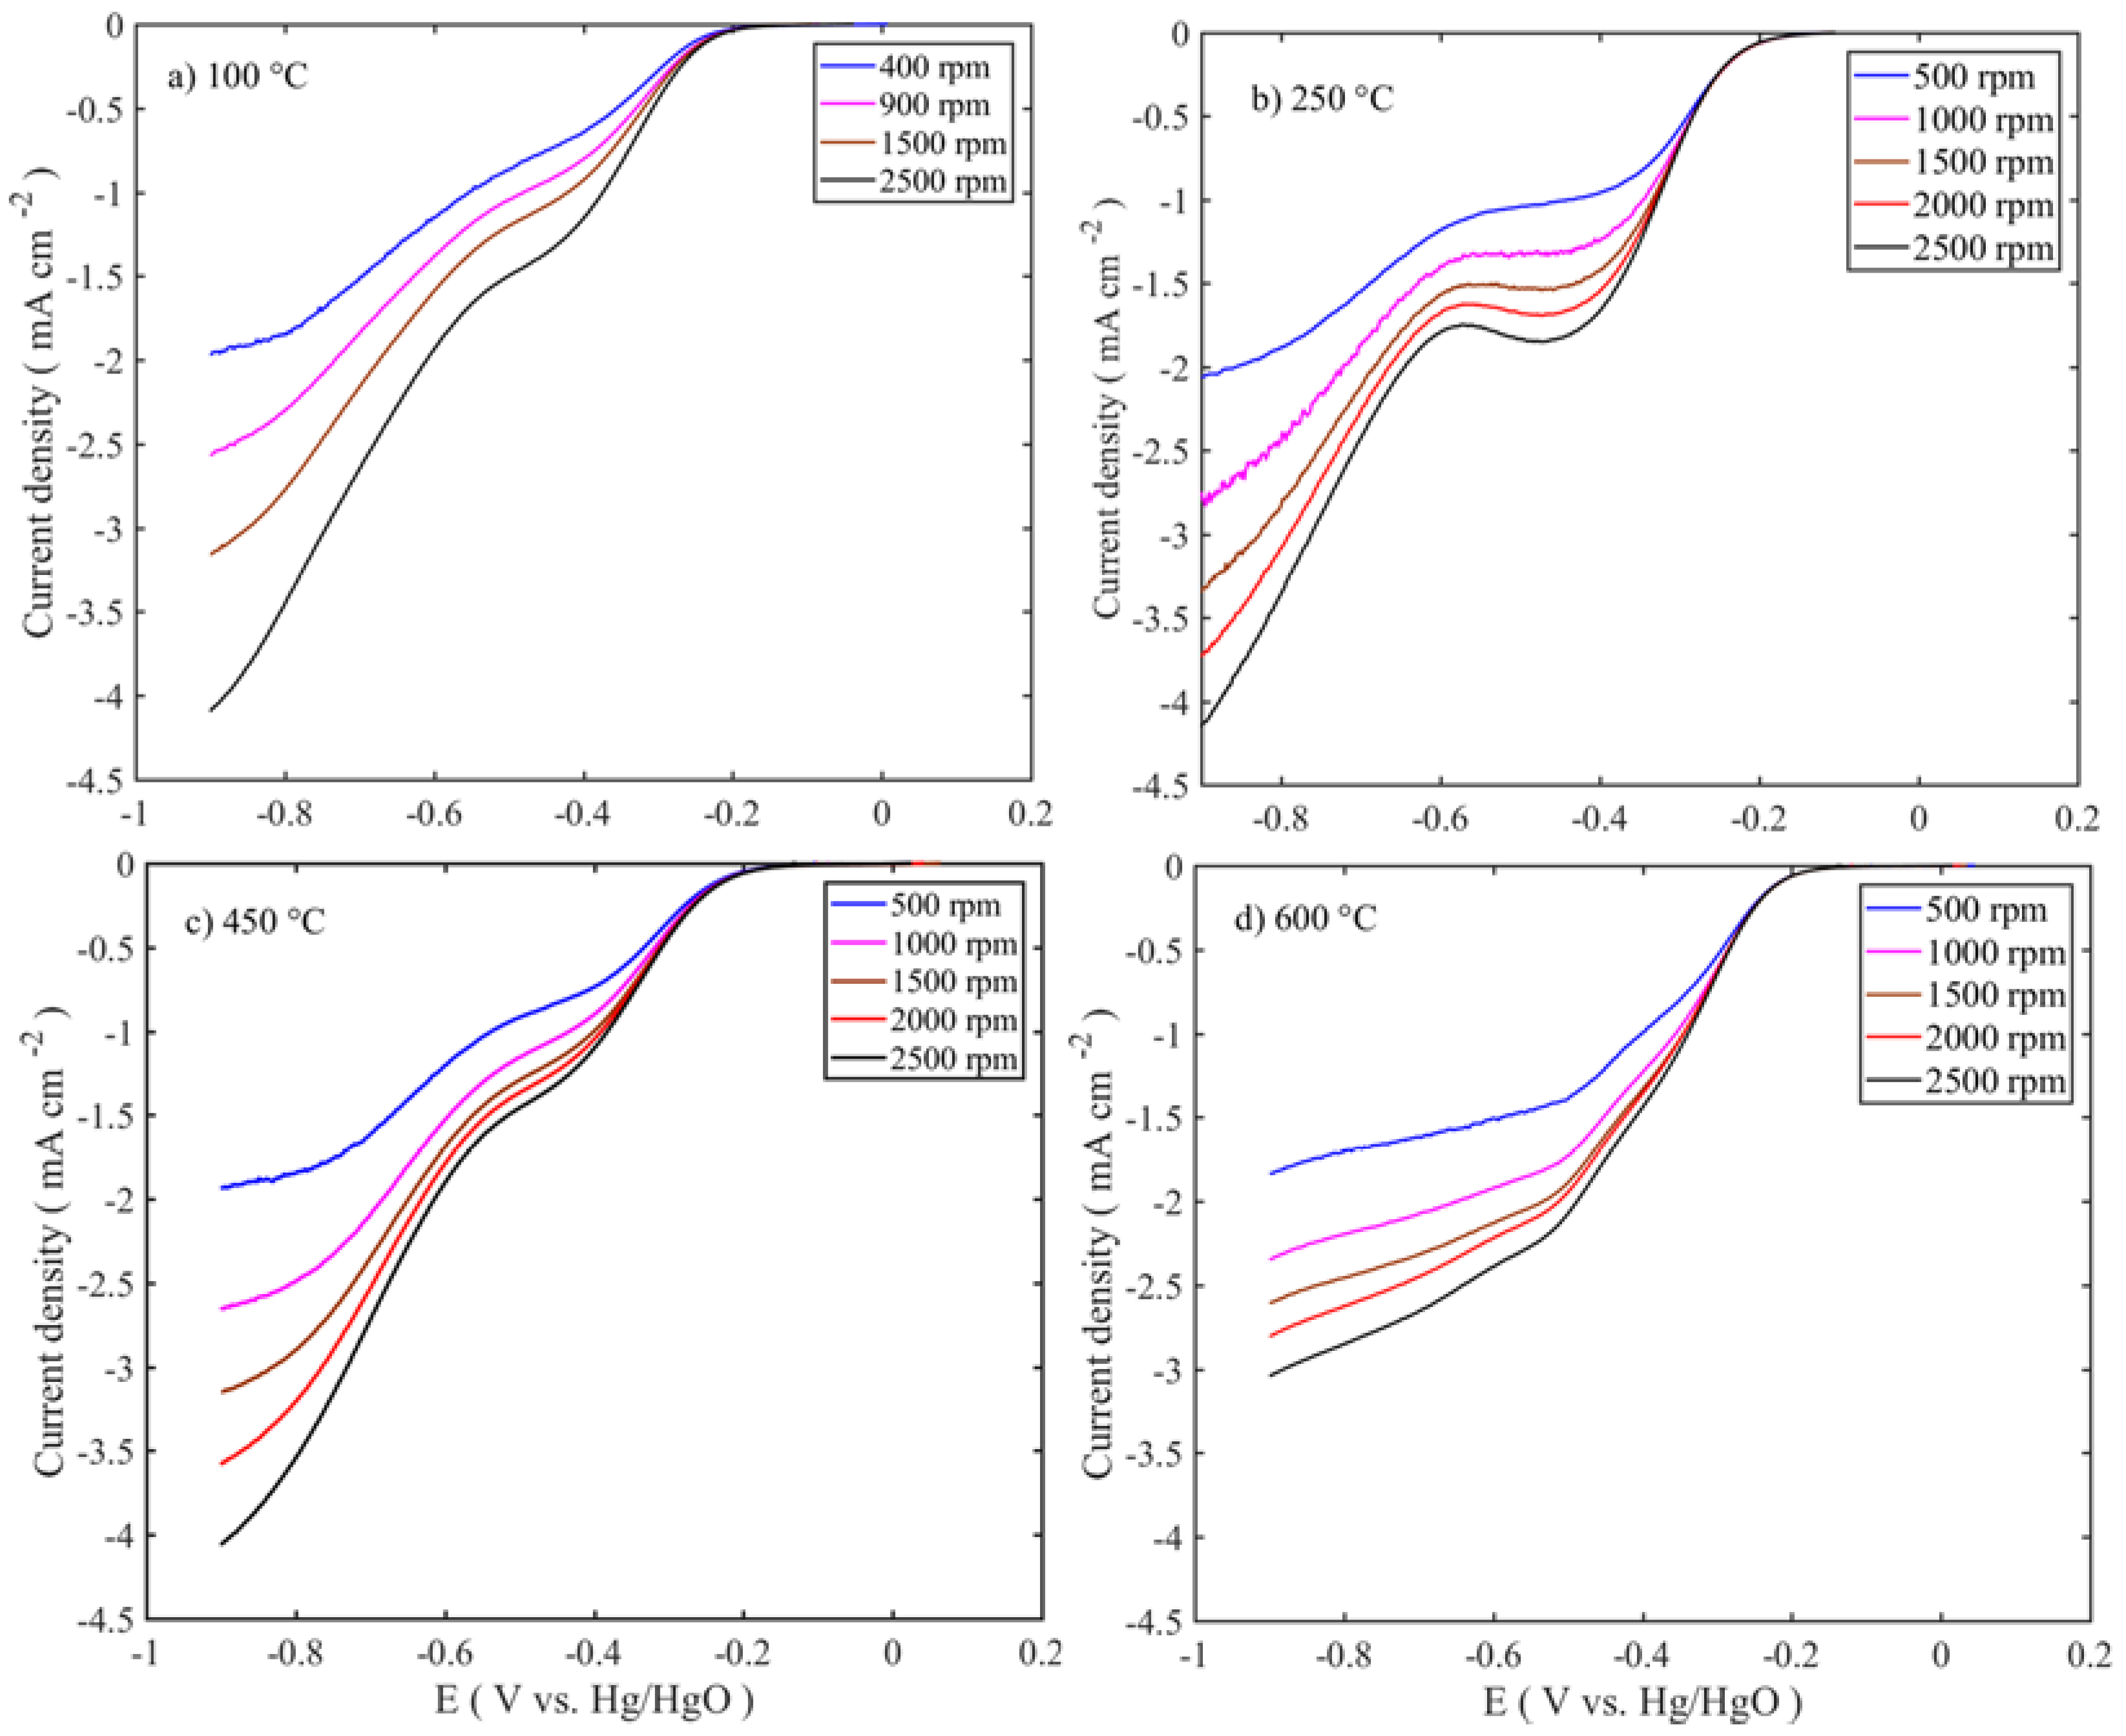
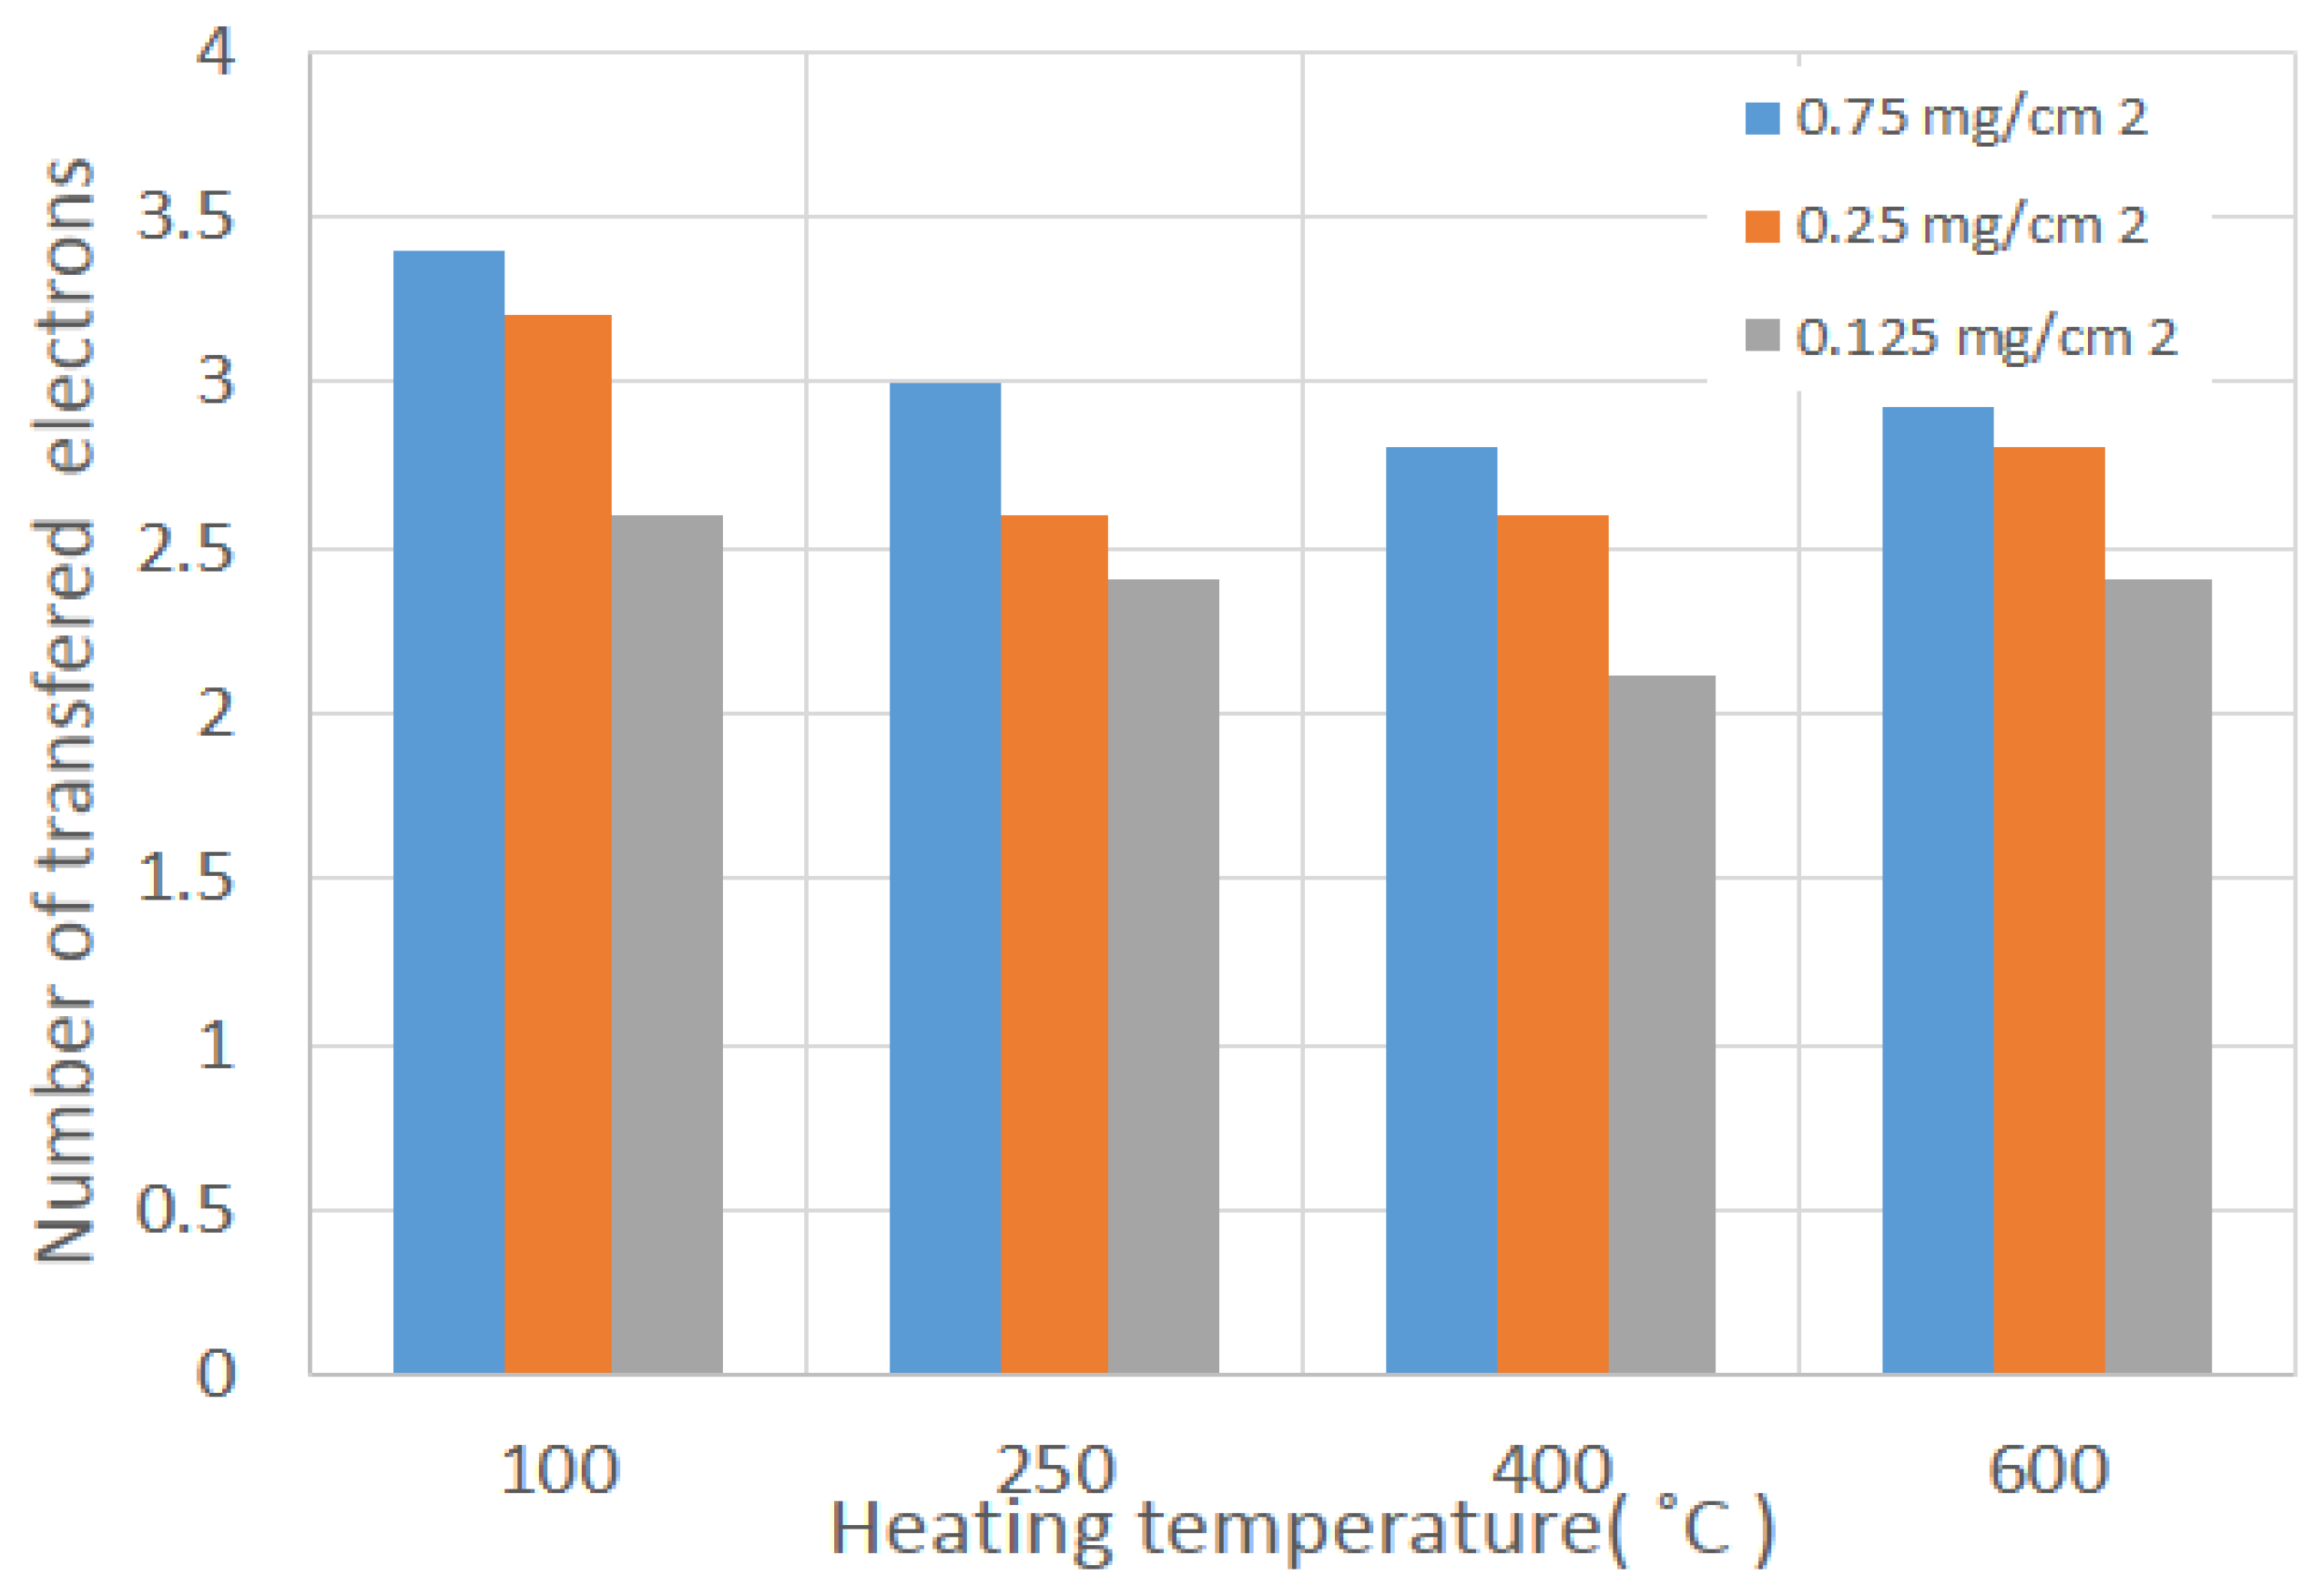
To evaluate the oxygen reduction activity of the catalysts, RDE experiments were carried out in 0.1 M KOH at different rotations (400–2500 rpm). The intrinsic activities of the catalysts are related to the number of electrons transferred during the oxygen reduction reaction, which were determined using the Koutecky-Levich equation. Figure 7 shows the LSV and Levich (inset Figure) curves for those at 100 °C calcined samples at different mass loadings. Figure 8 shows the LSV trend of the calcined samples at different temperatures and for single mass loadings (0.75 mg cm−2). The other sample responses are given in supplementary information (Figure S2). All the voltammograms exhibit the bi-sigmoidal shape. However, the polarization curve for the sample calcined at 600 °C tends to change to a single sigmoidal shape at higher loadings. The high ORR activities are observed at 100–250 °C sample, similar to those of the OER, and the activities are in the following order: 250 °C > 100 °C > 450 °C > 600 °C. The diffusion-limited current density (jl) of the samples shows an increase with the rotation rate. The highest diffusion-limited current densities are observed for the samples with 0.25 and 0.75 mg cm−2 mass loadings, which are calcined at 100 and 250 °C, respectively (Figure 8a,b and Figure S2e,h). Even though the former sample is a layered double hydroxide phase and the latter is a spinel oxide, their performances are at similar levels. This suggests that the properties like high surface area, smaller-crystallite size, and pore volume (≈130 m2 g−1 and 0.80 cm3 g−1) directly contribute to the enhancement of electrocatalytic activity. While the surface area and the pore volume for the 600 °C sample are 40 m2 g−1 and 0.40 cm3 g−1, which are one-third and half of the values of those corresponding to the samples calcined at 100–250 °C, this 450–600 °C catalyst activity is therefore much lower. Comparison of the different loadings shows that 0.75 mg cm−2 delivers the highest diffusion-limited current density (Figure 8), which is opposite to the OER performance. This suggests that thin layer enhances the OER, while in the ORR, thick layer is required to decompose the HO2−. The linear curves of the Levich plots confirm that in all the samples, oxygen reduction proceeds through the first order reaction kinetics. Number of transferred electrons in ORR is calculated from the slope of the Levich plot. The number of transferred electrons in relation to the potential for all the samples is presented in Supplementary Figure S5. In Levich plot, slopes are high in positive potential, whereas slopes are low in negative potential. This translates into a higher number of electrons being transferred in negative potential. Figure 9 shows the number of transferred electrons, particularly at −0.7 V vs. Hg/HgO. The highest intrinsic activity is 3.4 e− transfer, which corresponds to the 100 °C calcined sample with 0.75 mg cm−2 mass loadings. Contrary to this, the lowest intrinsic activity is 2.7 e− transfer, which corresponds to the 600 °C calcined sample with 0.75 mg·cm−2. This trend confirms that lower catalyst loadings are more selective to hydrogen peroxide generation, as also reported in the literature [39]. Thus, high surface area, smaller particles, and different phase formations enhance the ORR activities.
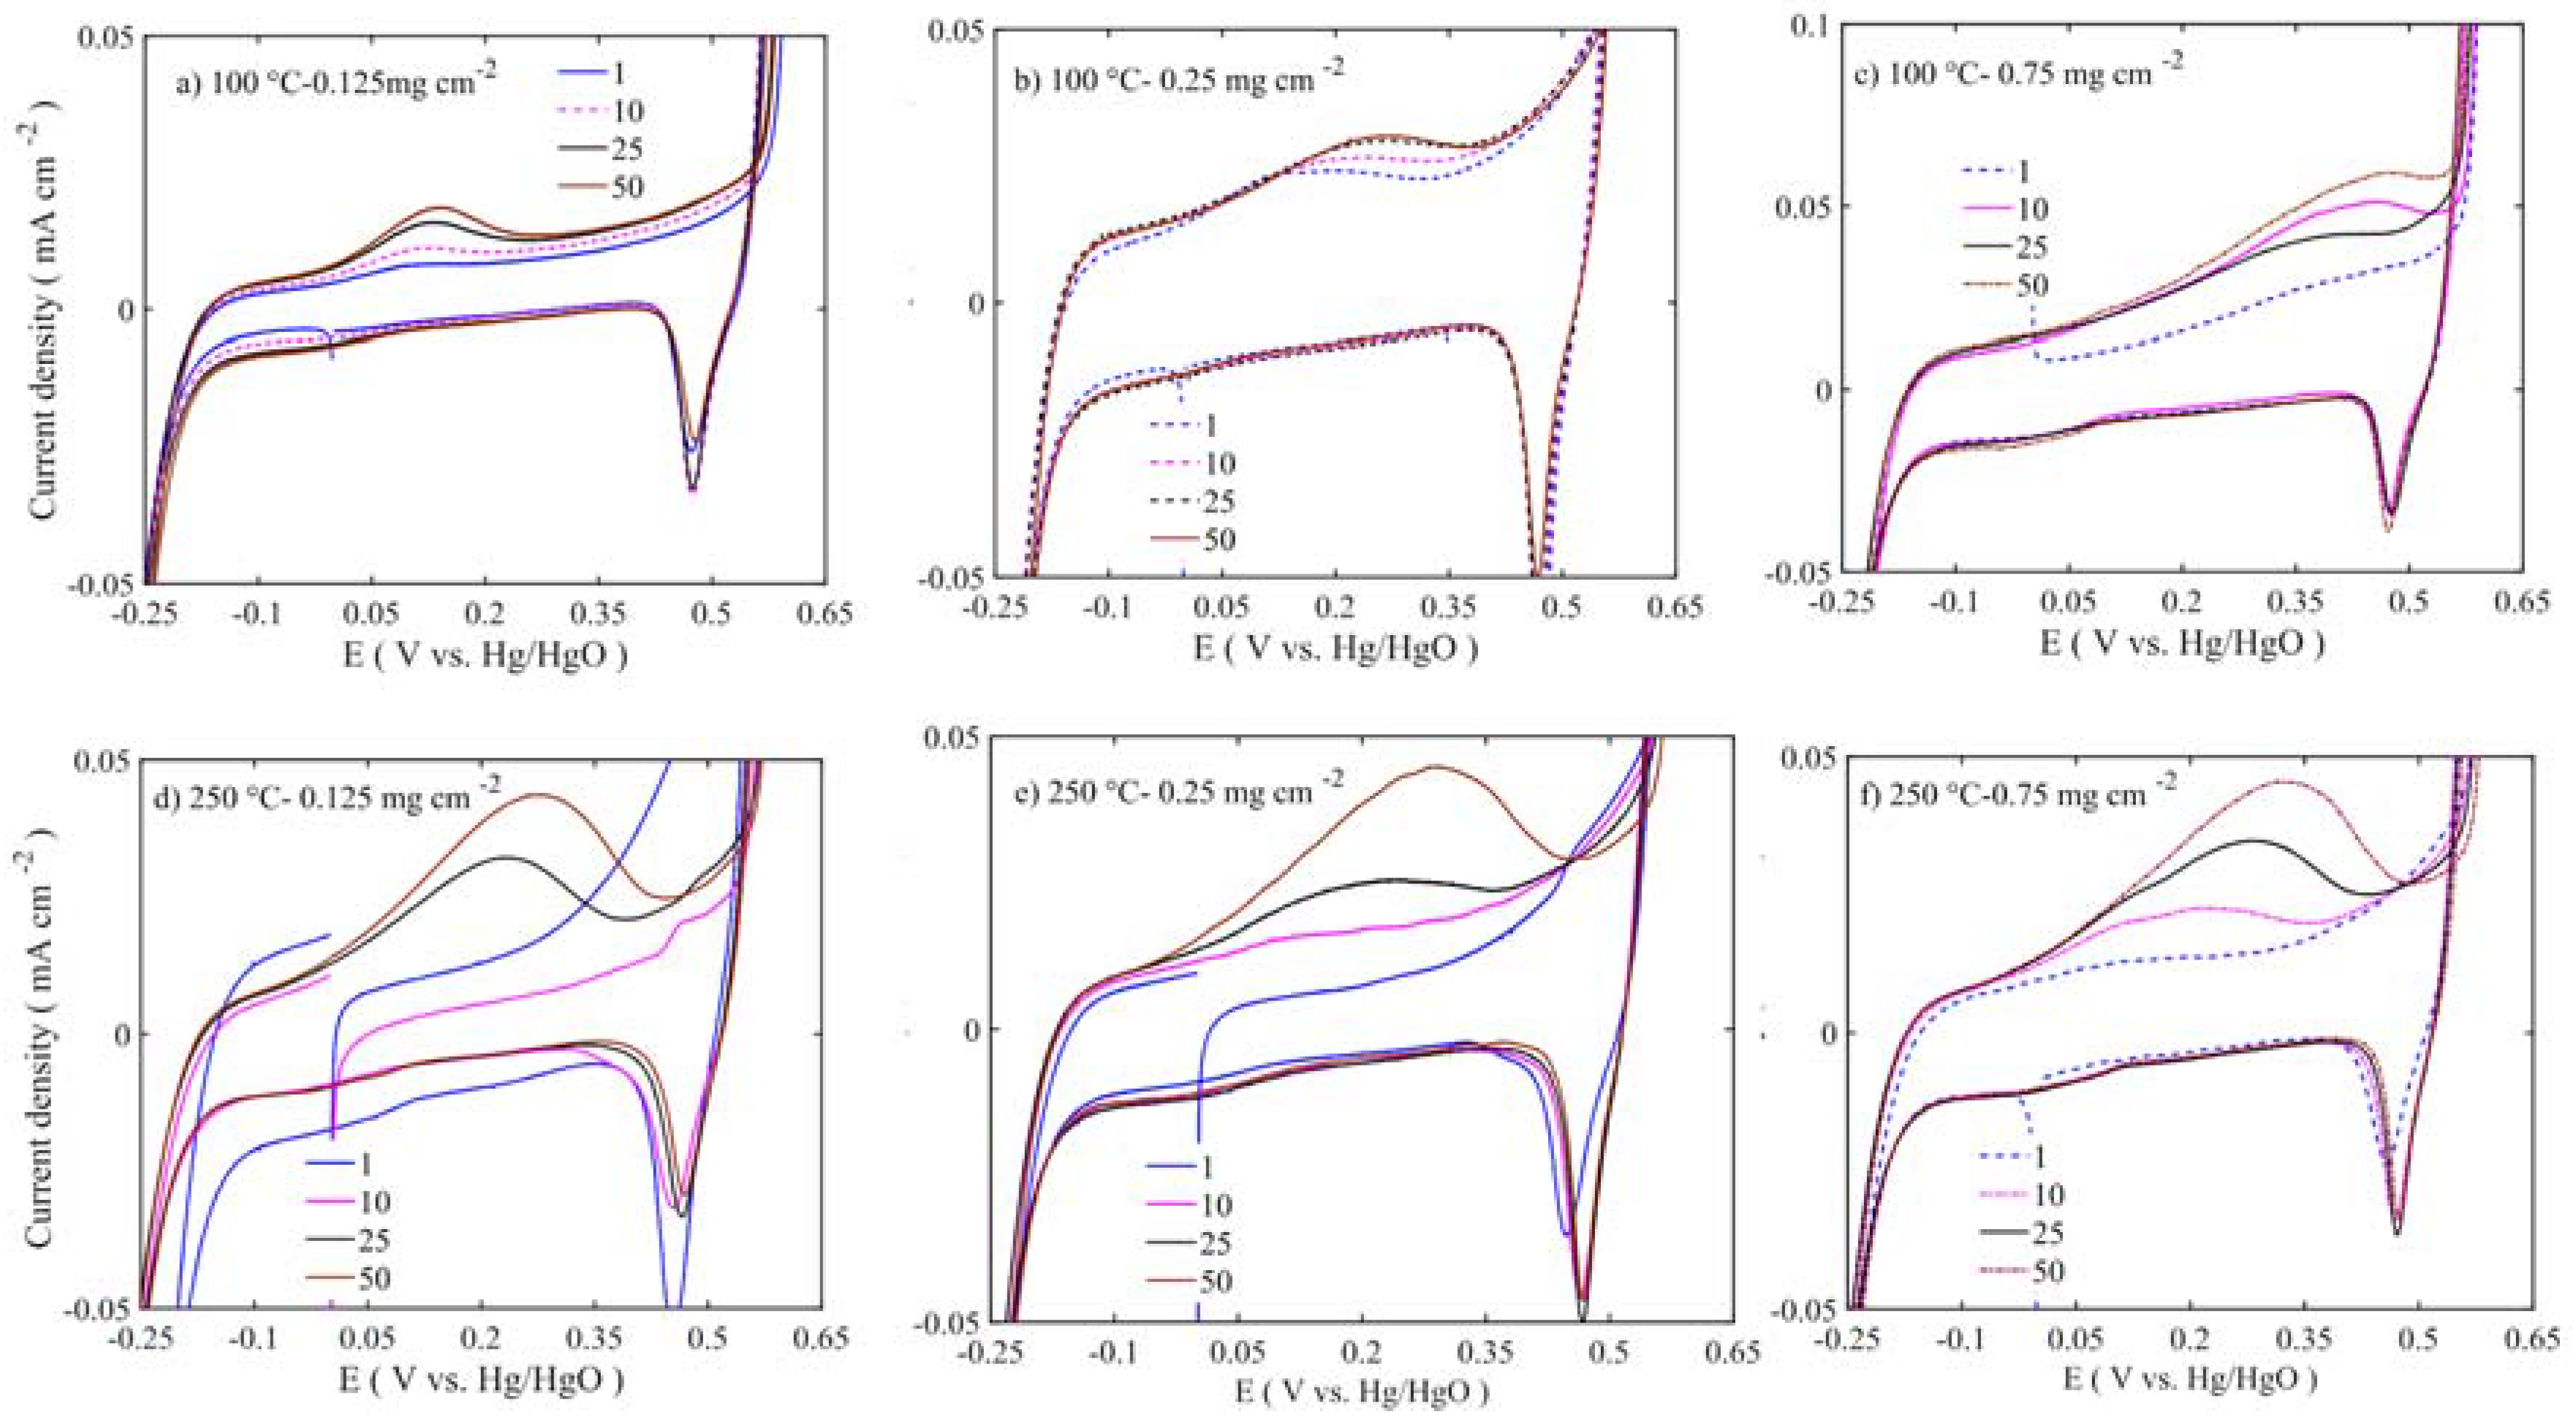
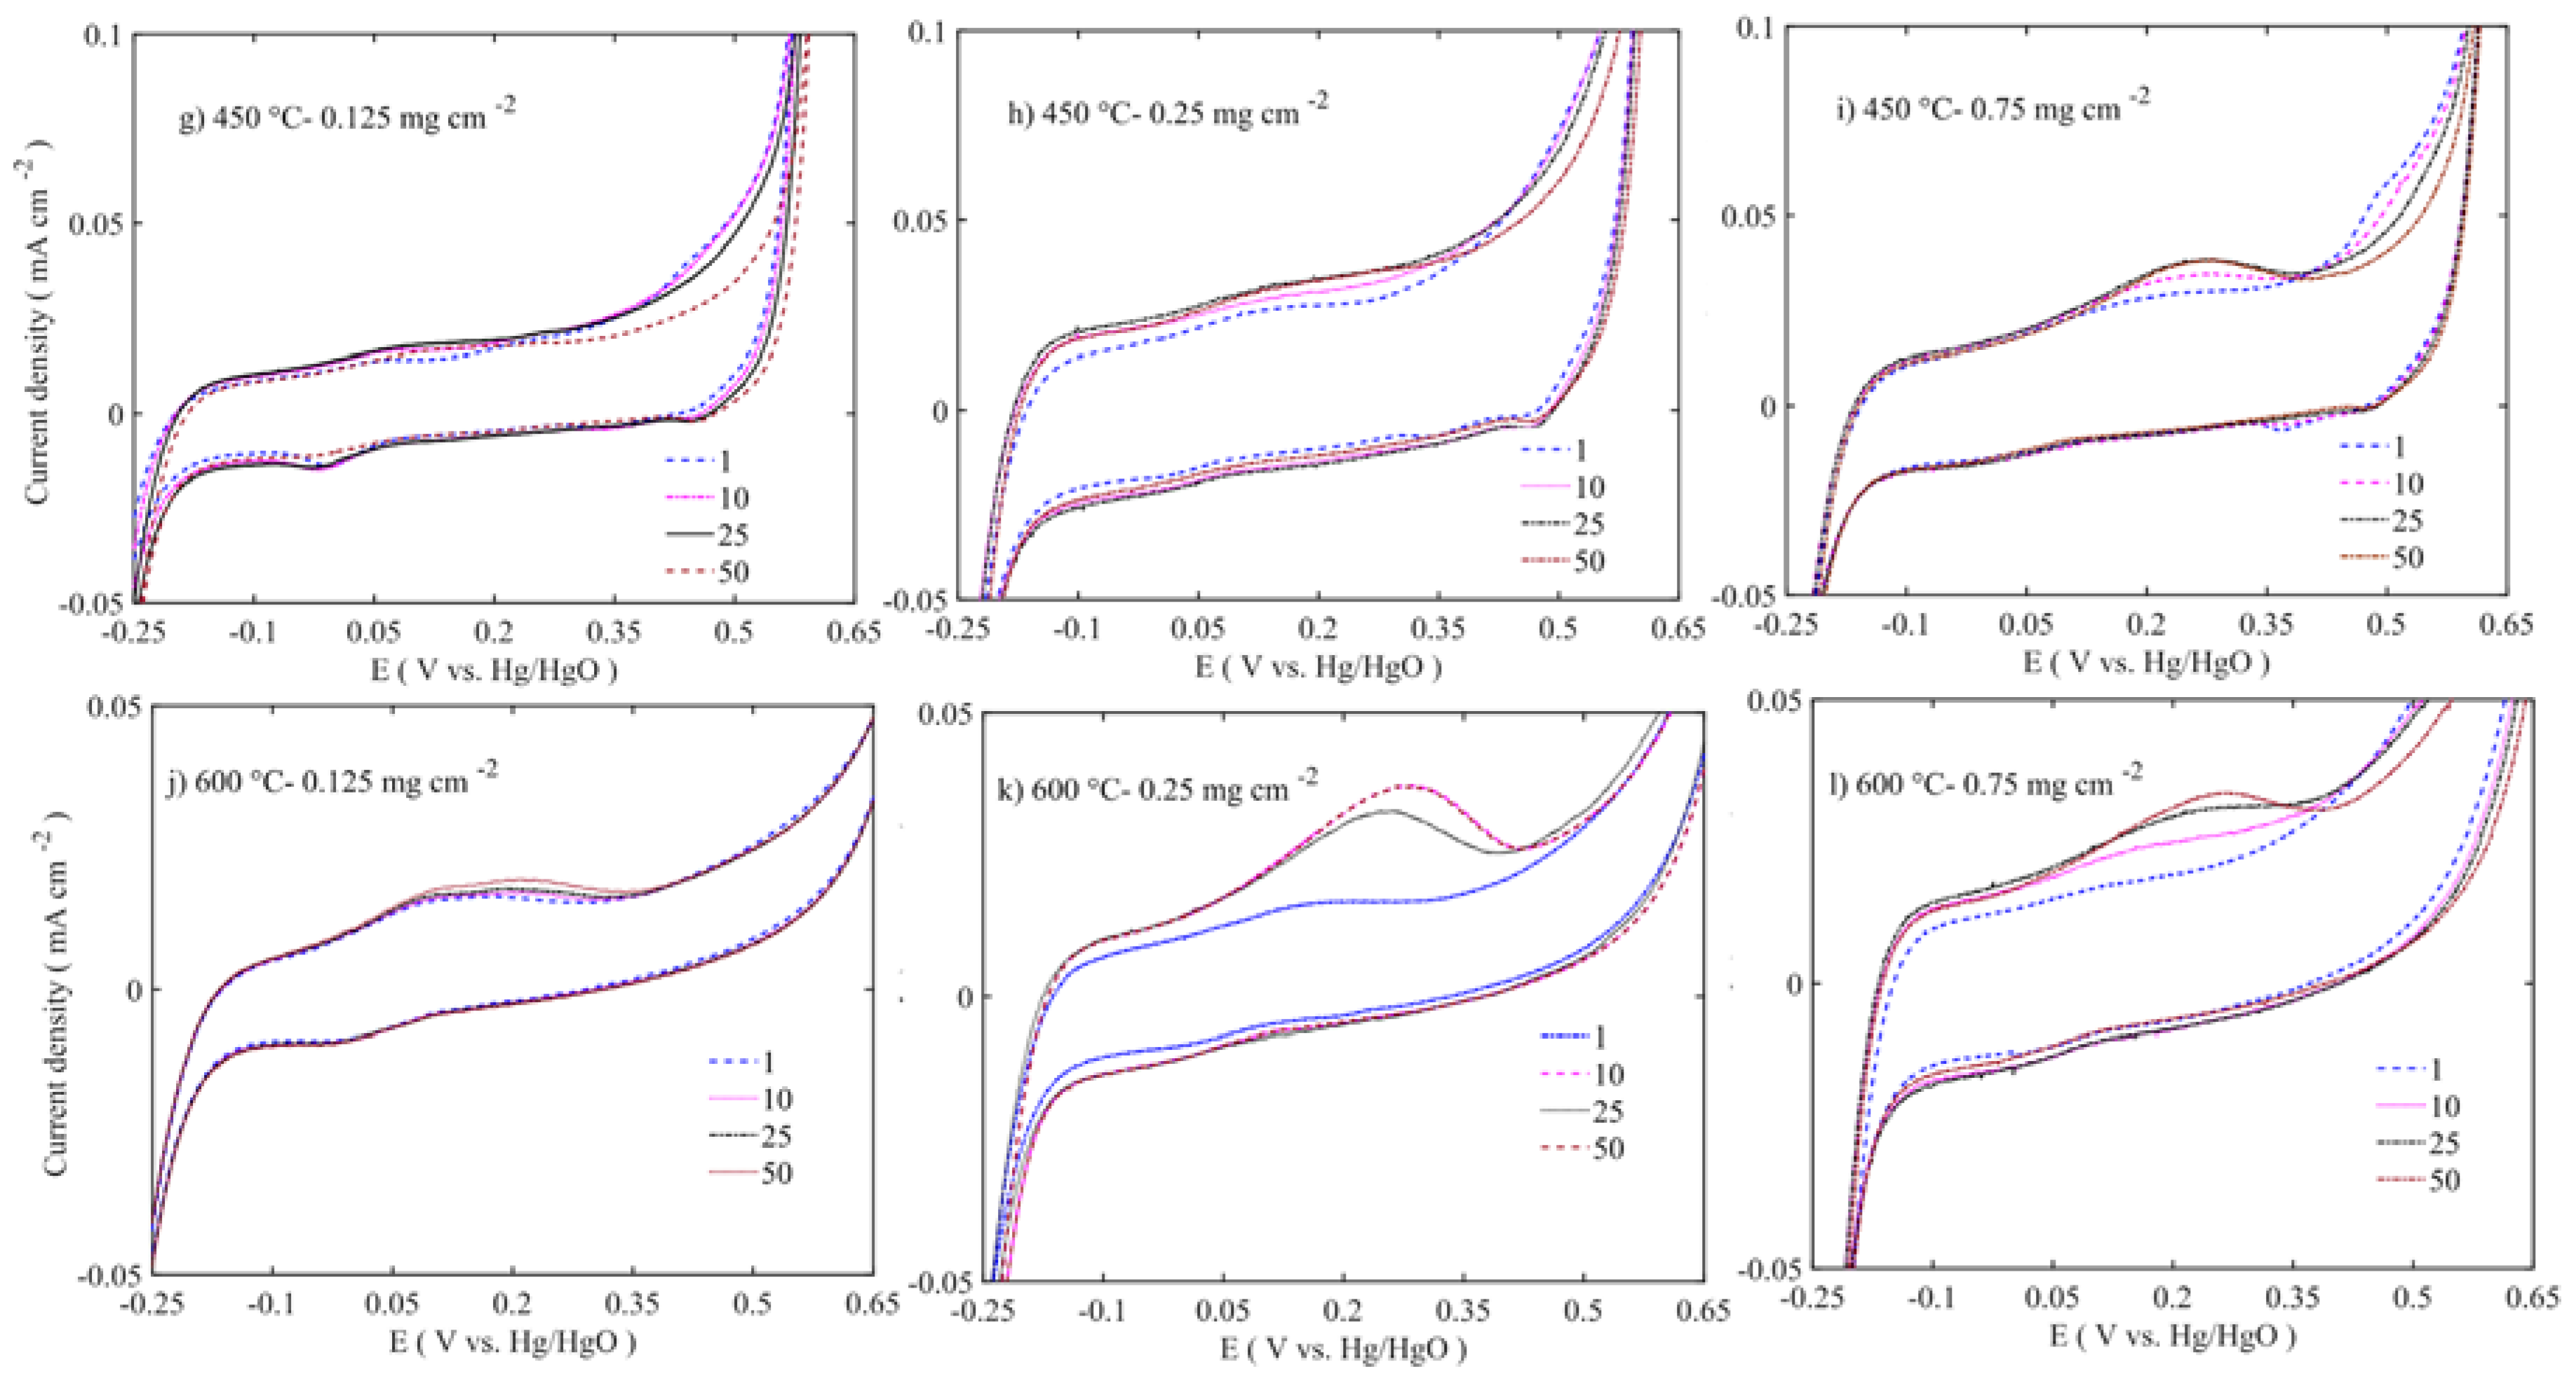
Electrochemical stability of the catalyst is very important and determines the cost and cycling behaviour of the metal-air battery. The catalysts were subjected to 50 consecutive potential sweeps in OER and ORR regions between −0.9 and 0.7 V vs. Hg/HgO, and the corresponding results are presented in Figure 10 and Figure S3. As discussed in the earlier section, the highest catalytic activities at the OER side are for 250 °C calcined samples at low catalyst loadings (Figure 10a and Figure S3), while at the ORR side, the same material exhibited high activity at high loadings (Figure 10c). The ORR activities for all the samples are stable up to 50 cycles. The current densities are moreover stable around −2.5–3.5 mA cm−2 at 50 cycles. However, on the OER side, each sample’s behaviour differs dramatically, as shown in Figure S3. At low catalyst loadings (0.125 mg cm−2), the performance drop is quite significant. In the 100 °C calcined samples, OER current density drops from 12 mA cm−2 at the 1st cycle to 2.3 mA cm−2 at 50th cycle (Figure S3a). At 250 °C calcined sample, their activity drops from 21 mA cm−2 at first cycle to 4 mA cm−2 at 50th cycle (Figure 9a). The samples calcined at high temperatures (450–600 °C) are shown in Figure S3g,j and exhibit low OER current density and less dramatic current density drop, even at low catalyst loading (0.125 mg cm−2). At high catalyst loadings (0.25–0.75 mg cm−2), they show negligible OER activity and more constant current density throughout the 50 cycles. Figure 11 to Figure 12 show enlargements of the Ni redox activity and stability. It is shown that the Ni2+ oxidizes into Ni3+ at 0.175 to 0.3 V vs. Hg/HgO [42], while the reduction takes place at 0.475 V with depressed peak around 0 V. During the first cycle, the area under the curve is smaller. Regarding the 50 cycles, the area evolves and the oxidation peak shifts to higher potential. The increased oxidation peak does not translate into higher OER activity. At lower loadings, the oxidation peak is around 0.175 V vs. Hg/HgO, whereas at higher loading the peak position moves closer to 0.4 V vs. Hg/HgO. This suggests that the internal mass transfer resistance increase might cause this shift. However, all the Ni3+ reduction peaks are at 0.475 V located at the same position across the different loadings. This peak shift moves the OER activity to higher overpotential. The samples calcined at 450–600 °C have shown depressed Ni oxidation and reduction peaks (Figure 12). However, there are two consecutive oxidation and reduction peaks for the 450 °C calcined sample. At 600 °C, one oxidation peak is visible, with the reduction peak completely disappearing. Thus, in low-temperature samples (100–250 °C), more Ni ions are easily oxidized from nickel hydroxide to nickel oxyhydroxide phase, while in 450–600 °C samples there is not enough oxidizable nickel to contribute to the OER activity. As the XPS results also corroborated that multivalent nickel ions were not present at 600 °C, the Ni oxidation peak shift and area under peak increase are related to structural changes occurring along the potential cycles [38]. These changes also alter the stability and activity of the catalyst.
Comparison of the activities of bifunctional oxygen electrodes with the noble and non-noble catalysts is shown in Table 3. The oxygen electrode potential difference (ΔE) is calculated from the difference between the potentials at 10 mA cm−2 current density for OER and −1 mA cm−2 for ORR. The oxygen electrode overpotential (0.33 V) on OER for the catalyst at low-temperatures (100–250 °C) is on par with noble metal catalyst and non-noble transition metal oxide catalysts in OER direction (Table 3), while in the ORR direction, overpotential is very high due to the limited activities of the NiFeOx. Most of the reported catalysts either have a large amount of carbon additives such as CNT and CNF or special additives such as some doping elements. However, our NiFeOx catalysts still have shown superior performance, since they possess high OER current and better kinetics. The ORR side needs to be improved by engineering the electrode composition to get higher activities.
3. Experimental
Spinel Ni ferrite was synthesized by the hydrothermal method. 5 mM of cobalt chloride hexahydrate (CoCl2·6H2O), 10 mM of nickel chloride hexahydrate (NiCl3·6H2O), and 35 mM of urea (CO(NH2)2) were dissolved in 80 mL DI water. The solution was transferred to 100 mL Teflon-lined stainless-steel autoclave. The autoclave was maintained at 100 °C for 48 h and was naturally cooled down to room temperature. The product was washed and centrifuged successively in DI water and ethanol. The obtained particles were dried and calcined at different temperatures (100, 250, 450, and 600 °C at a rate of 2 °C min−1).
The synthesized samples were identified using the Siemens Bruker D5000 Diffractometer with a Cu Kα radiation source (BRUKER AXS GmbH, Karlsruhe, Germany) (λ = 0.154 nm) at 40 kV and 30 mA in a 2θ range of 10–70°. The sample morphology was analyzed by JEOL JEM-2100F transmission electron microscope (JEOL Ltd., Musashino, Akishima, Tokyo, Japan). Surface area and porosimetry analysis were carried-out in Micromeritics ASAP 2010 (Micromeritics, Communications Drive, Norcross, GA, USA).
X-ray photoelectron spectroscopy (XPS) was performed in a PHI Quantum 2000 scanning XPS microprobe (Physical electronics (Phi), Chanhassen, MN, USA) using monochromated Al Kα radiation. The spot size was 0.1 × 0.1 µm2, and the energy resolution was set to 0.3 eV. The intensity of each peak is the integrated area above the background.
All the electrochemical experiments were carried out in a three-electrode setup on a VMP-3 Biologic potentiostat (Bio-Logic Science Instruments, Seyssinet-Pariset, France) with a glassy carbon (GC) electrode (0.125 cm2) as the working electrode substrate, Hg/HgO as the reference electrode, and Pt mesh as the counter electrode. The working electrode was prepared [25] by ultrasonication using the following composition: 70 w.% catalyst, 15 w.% carbon (Timrex HSAG 300, Timcal Ltd., Bodio, Switzerland), and 15 w.% nafion in a 0.9 to 0.1 ratio of water/isopropyl alcohol mixture. The following inks were drop-cast onto the GC electrode at different mass loadings to the catalyst (0.125, 0.25, and 0.75 mg cm−2). The experiments were performed in 0.1 M KOH electrolyte. The electrodes were activated prior to the experiment by running 15 cycles of cyclic voltammogram in 0.1 to −0.9 V vs. Hg/HgO at N2 saturation. The cyclic voltammetry (CV) experiments were performed at O2 saturation in the range of 0.70 V to −0.90 V vs. Hg/HgO. The RDE experiments were performed at a rotation speed of 500 to 2500 rpm. The well-known Koutecky–Levich equation was used to calculate the number of electrons involved in the oxygen reduction reaction [25].
4. Conclusions
The NiFeOx-based porous electrocatalysts were synthesized using the hydrothermal assisted-calcination method. The use of heat treatment on the catalyst resulted in uniform, well dispersed nanorod structures with high surface areas and pore volumes. The XRD patterns show the mixed phases at 100 °C and pure spinel phases at calcination temperatures between 250 and 600 °C. The XPS spectra for 100 and 600 °C agreed well with XRD results, while the XPS at 250–450 °C showed the existence of mixed chemical state and heterogeneous distribution of Ni ions in the spinel structure. Among the different thermal treatments, the calcination at 250 °C resulted in the highest activity with a current density of 23 mA cm−2 in OER at 0.7 V and a small Tafel slope of 41 mV decade−1, while on the ORR side, the activity followed a quasi 4 e− pathway and a had Tafel slope of 124 mV decade−1. Furthermore, the catalyst loading vs. activity trend shows that the thinner catalyst (0.125 mg cm−2) promotes a higher rate of oxygen evolution than the thicker counterpart (0.75 mg cm−2). However, on the ORR side, the thicker catalyst achieved more electron transfer per oxygen molecule than the thinner catalyst. The bifunctional potentiodynamic cycling shows stable performance on the ORR side and fairly stable activity on the OER side after 50 cycles. The improved activity is suggested to be a result of the thin elongated-nanoparticles and the mixed oxidation state of Ni according to the results of TEM, XPS, and Raman. These features of the NiFeOx support developing a low-cost electrocatalyst for metal-air batteries.
Supplementary Materials
The following are available online at https://www.mdpi.com/2073-4344/8/8/328/s1.
Author Contributions
A.R.P. and Y.K. conceived and designed the experiments; A.R.P. performed the experiments; A.R.P. analyzed the data, and wrote the paper; Y.K. and M.G. supervised A.R.P. M.G. and M.B.J. ran the XPS and analyzed that data. A.R.P. managed all the experiments and wrote the article as the corresponding author.
Funding
This work is supported by the Swedish Energy Agency and the project number: 39078-1
Acknowledgments
This work is supported by the Swedish Energy Agency.
Conflicts of Interest
The authors declare no conflict of interest.
References
- Gorlin, Y.; Jaramillo, T.F. A bifunctional nonprecious metal catalyst for oxygen reduction and water oxidation. J. Am. Chem. Soc. 2010, 132, 13612–13614. [Google Scholar] [CrossRef] [PubMed]
- Chen, J.; Lim, B.; Lee, E.P.; Xia, Y. Shape-controlled synthesis of platinum nanocrystals for catalytic and electrocatalytic applications. Nano Today 2009, 4, 81–95. [Google Scholar] [CrossRef]
- Morozan, A.; Jousselme, B.; Palacin, S. Low-platinum and platinum-free catalysts for the oxygen reduction reaction at fuel cell cathodes. Energy Environ. Sci. 2011, 4, 1238–1254. [Google Scholar] [CrossRef]
- Lee, Y.; Suntivich, J.; May, K.J.; Perry, E.E.; Shao-Horn, Y. Synthesis and activities of rutile IrO2 and RuO2 nanoparticles for oxygen evolution in acid and alkaline solutions. J. Phys. Chem. Lett. 2012, 3, 399–404. [Google Scholar] [CrossRef] [PubMed]
- Chen, D.; Chen, C.; Baiyee, Z.M.; Shao, Z.; Ciucci, F. Nonstoichiometric oxides as low-cost and highly-efficient oxygen reduction/evolution catalysts for low-temperature electrochemical devices. Chem. Rev. 2015, 115, 9869–9921. [Google Scholar] [CrossRef] [PubMed]
- Osgood, H.; Devaguptapu, S.V.; Xu, H.; Cho, J.; Wu, G. Transition metal (Fe, Co, Ni, and Mn) oxides for oxygen reduction and evolution bifunctional catalysts in alkaline media. Nano Today 2016, 11, 601–625. [Google Scholar] [CrossRef]
- Grimaud, A.; Carlton, C.E.; Risch, M.; Hong, W.T.; May, K.J.; Shao-Horn, Y. Oxygen evolution activity and stability of Ba6Mn5O16, Sr4Mn2CoO9, and Sr6Co5O15: The influence of transition metal coordination. J. Phys. Chem. C 2013, 117, 25926–25932. [Google Scholar] [CrossRef]
- Anantharaj, S.; Karthick, K.; Kundu, S. Evolution of layered double hydroxides (LDH) as high performance water oxidation electrocatalysts: A review with insights on structure, activity and mechanism. Mater. Today Energy 2017, 6, 1–26. [Google Scholar] [CrossRef]
- Anantharaj, S.; Karthick, K.; Venkatesh, M.; Simha, T.V.S.V.; Salunke, A.S.; Ma, L.; Liang, H.; Kundu, S. Enhancing electrocatalytic total water splitting at few layer Pt-NiFe layered double hydroxide interfaces. Nano Energy 2017, 39, 30–43. [Google Scholar] [CrossRef]
- Trotochaud, L.; Young, S.L.; Ranney, J.K.; Boettcher, S.W. Nickel–iron oxyhydroxide oxygen-evolution electrocatalysts: The role of intentional and incidental iron incorporation. J. Am. Chem. Soc. 2014, 136, 6744–6753. [Google Scholar] [CrossRef] [PubMed]
- Corrigan, D.A. The catalysis of the oxygen evolution reaction by iron impurities in thin film nickel oxide electrodes. J. Electrochem. Soc. 1987, 134, 377–384. [Google Scholar] [CrossRef]
- Hamdani, M.; Singh, R.; Chartier, P. Co3O4 and co-based spinel oxides bifunctional oxygen electrodes. Int. J. Electrochem. Sci. 2010, 5, 556–577. [Google Scholar]
- Hu, L.; Wu, L.; Liao, M.; Hu, X.; Fang, X. Electrical transport properties of large, individual NiCo2O4 nanoplates. Adv. Funct. Mater. 2012, 22, 998–1004. [Google Scholar] [CrossRef]
- Yan, Y.; Xia, B.Y.; Zhao, B.; Wang, X. A review on noble-metal-free bifunctional heterogeneous catalysts for overall electrochemical water splitting. J. Mater. Chem. A 2016, 4, 17587–17603. [Google Scholar] [CrossRef] [Green Version]
- Zhao, Q.; Yan, Z.; Chen, C.; Chen, J. Spinels: Controlled preparation, oxygen reduction/evolution reaction application, and beyond. Chem. Rev. 2017, 117, 10121–10211. [Google Scholar] [CrossRef] [PubMed]
- Bian, W.; Yang, Z.; Strasser, P.; Yang, R. A CoFe2O4/graphene nanohybrid as an efficient bi-functional electrocatalyst for oxygen reduction and oxygen evolution. J. Power Sources 2014, 250, 196–203. [Google Scholar] [CrossRef]
- Yuan, C.; Wu, H.B.; Xie, Y.; Lou, X.W. Mixed transition-metal oxides: Design, synthesis, and energy-related applications. Angew. Chem. Int. Ed. 2014, 53, 1488–1504. [Google Scholar] [CrossRef] [PubMed]
- Du, J.; Chen, C.; Cheng, F.; Chen, J. Rapid synthesis and efficient electrocatalytic oxygen reduction/evolution reaction of CoMn2O4 nanodots supported on graphene. Inorg. Chem. 2015, 54, 5467–5474. [Google Scholar] [CrossRef] [PubMed]
- Wu, N.-L.; Liu, W.-R.; Su, S.-J. Effect of oxygenation on electrocatalysis of La0.6Ca0.4CoO3−x in bifunctional air electrode. Electrochim. Acta 2003, 48, 1567–1571. [Google Scholar] [CrossRef]
- Lyons, M.E.G.; Doyle, R.L.; Browne, M.P.; Godwin, I.J.; Rovetta, A.A.S. Recent developments in electrochemical water oxidation. Curr. Opin. Electrochem. 2017, 1, 40–45. [Google Scholar] [CrossRef]
- Srivastava, M.; Chaubey, S.; Ojha, A.K. Investigation on size dependent structural and magnetic behavior of nickel ferrite nanoparticles prepared by sol–gel and hydrothermal methods. Mater. Chem. Phys. 2009, 118, 174–180. [Google Scholar] [CrossRef]
- Dolcet, P.; Diodati, S.; Zorzi, F.; Voepel, P.; Seitz, C.; Smarsly, B.; Mascotto, S.; Nestola, F.; Gross, S. Very fast crystallisation of MFe2O4 spinel ferrites (M=Co, Mn, Ni, Zn) under low temperature hydrothermal conditions: A time-resolved structural investigation. Green Chem. 2018, 20, 2257–2268. [Google Scholar] [CrossRef]
- Prabu, M.; Ketpang, K.; Shanmugam, S. Hierarchical nanostructured nico2o4 as an efficient bifunctional non-precious metal catalyst for rechargeable zinc-air batteries. Nanoscale 2014, 6, 3173–3181. [Google Scholar] [CrossRef] [PubMed]
- Ko, J.S.; Chervin, C.N.; Vila, M.N.; DeSario, P.A.; Parker, J.F.; Long, J.W.; Rolison, D.R. Electroanalytical assessment of the effect of Ni:Fe stoichiometry and architectural expression on the bifunctional activity of nanoscale NiyFe1–yOx. Langmuir 2017, 33, 9390–9397. [Google Scholar] [CrossRef] [PubMed]
- Paulraj, A.R.; Kiros, Y. La0.1Ca0.9MnO3/Co3O4 for oxygen reduction and evolution reactions (ORER) in alkaline electrolyte. J. Solid State Electrochem. 2018, 22, 1697–1710. [Google Scholar] [CrossRef]
- Krishnan, V.; Bottaro, G.; Gross, S.; Armelao, L.; Tondello, E.; Bertagnolli, H. Structural evolution and effects of calcium doping on nanophasic LaCoO3 powders prepared by non-alkoxidic sol-gel technique. J. Mater. Chem. 2005, 15, 2020–2027. [Google Scholar] [CrossRef]
- ALOthman, Z. A review: Fundamental aspects of silicate mesoporous materials. Materials 2012, 5, 2874–2902. [Google Scholar] [CrossRef]
- Jaffari, G.H.; Rumaiz, A.K.; Woicik, J.C.; Shah, S.I. Influence of oxygen vacancies on the electronic structure and magnetic properties of NiFe2O4 thin films. J. Appl. Phys. 2012, 111, 093906. [Google Scholar] [CrossRef]
- Wanger, C.D.; Riggs, W.M.; Davis, L.E.; Moulder, J.F.; Muilenberg, G.E. Handbook of X-ray Photoelectron Spectroscopy; Physical Electronics Division, Perkin-Elmer Corp.: Eden Prairie, MN, USA, 1979; 190p. [Google Scholar]
- Soldemo, M.; Lundgren, E.; Weissenrieder, J. Oxidation of Fe(110) in oxygen gas at 400 °C. Surf. Sci. 2016, 644, 172–179. [Google Scholar] [CrossRef]
- Yamashita, T.; Hayes, P. Analysis of XPS spectra of Fe2+ and Fe3+ ions in oxide materials. Appl. Surf. Sci. 2008, 254, 2441–2449. [Google Scholar] [CrossRef]
- Burke, M.S.; Zou, S.; Enman, L.J.; Kellon, J.E.; Gabor, C.A.; Pledger, E.; Boettcher, S.W. Revised oxygen evolution reaction activity trends for first-row transition-metal (oxy)hydroxides in alkaline media. J. Phys. Chem. Lett. 2015, 6, 3737–3742. [Google Scholar] [CrossRef] [PubMed]
- Trasatti, S. Electrocatalysis in the anodic evolution of oxygen and chlorine. Electrochim. Acta 1984, 29, 1503–1512. [Google Scholar] [CrossRef]
- Oliver-Tolentino, M.A.; Vázquez-Samperio, J.; Manzo-Robledo, A.; González-Huerta, R.d.G.; Flores-Moreno, J.L.; Ramírez-Rosales, D.; Guzmán-Vargas, A. An approach to understanding the electrocatalytic activity enhancement by superexchange interaction toward oer in alkaline media of Ni–Fe LDH. J. Phys. Chem. C 2014, 118, 22432–22438. [Google Scholar] [CrossRef]
- Louie, M.W.; Bell, A.T. An investigation of thin-film ni–fe oxide catalysts for the electrochemical evolution of oxygen. J. Am. Chem. Soc. 2013, 135, 12329–12337. [Google Scholar] [CrossRef] [PubMed]
- Castro, E.B.; Gervasi, C.A. Electrodeposited Ni–Co-oxide electrodes:Characterization and kinetics of the oxygen evolution reaction. Int. J. Hydrogen Energy 2000, 25, 1163–1170. [Google Scholar] [CrossRef]
- Zhao, Q.; Yang, J.; Liu, M.; Wang, R.; Zhang, G.; Wang, H.; Tang, H.; Liu, C.; Mei, Z.; Chen, H.; et al. Tuning electronic push/pull of ni-based hydroxides to enhance hydrogen and oxygen evolution reactions for water splitting. ACS Catal. 2018, 5621–5629. [Google Scholar] [CrossRef]
- Klaus, S.; Cai, Y.; Louie, M.W.; Trotochaud, L.; Bell, A.T. Effects of fe electrolyte impurities on Ni(OH)2/NiOOH structure and oxygen evolution activity. J. Phys. Chem. C 2015, 119, 7243–7254. [Google Scholar] [CrossRef]
- Zhang, G.; Wei, Q.; Yang, X.; Tavares, A.C.; Sun, S. Rrde experiments on noble-metal and noble-metal-free catalysts: Impact of loading on the activity and selectivity of oxygen reduction reaction in alkaline solution. Appl. Catal. B Environ. 2017, 206, 115–126. [Google Scholar] [CrossRef]
- Thenuwara, A.C.; Cerkez, E.B.; Shumlas, S.L.; Attanayake, N.H.; McKendry, I.G.; Frazer, L.; Borguet, E.; Kang, Q.; Remsing, R.C.; Klein, M.L.; et al. Nickel confined in the interlayer region of birnessite: An active electrocatalyst for water oxidation. Angew. Chem. Int. Ed. 2016, 55, 10381–10385. [Google Scholar] [CrossRef] [PubMed]
- Bockris, J.O.; Otagawa, T. Mechanism of oxygen evolution on perovskites. J. Phys. Chem. 1983, 87, 2960–2971. [Google Scholar] [CrossRef]
- Qiu, J.; Villemure, G. Anionic clay modified electrodes: Electrochemical activity of nickel(II) sites in layered double hydroxide films. J. Electroanal. Chem. 1995, 395, 159–166. [Google Scholar] [CrossRef]
- Chervin, C.N.; DeSario, P.A.; Parker, J.F.; Nelson, E.S.; Miller, B.W.; Rolison, D.R.; Long, J.W. Aerogel architectures boost oxygen-evolution performance of NiFe2Ox spinels to activity levels commensurate with nickel-rich oxides. ChemElectroChem 2016, 3, 1369–1375. [Google Scholar] [CrossRef]
- Qian, L.; Lu, Z.; Xu, T.; Wu, X.; Tian, Y.; Li, Y.; Huo, Z.; Sun, X.; Duan, X. Trinary layered double hydroxides as high-performance bifunctional materials for oxygen electrocatalysis. Adv. Energy Mater. 2015, 5, 1500245. [Google Scholar] [CrossRef]
- Alegre, C.; Modica, E.; Di Blasi, A.; Di Blasi, O.; Busacca, C.; Ferraro, M.; Aricò, A.S.; Antonucci, V.; Baglio, V. Nico-loaded carbon nanofibers obtained by electrospinning: Bifunctional behavior as air electrodes. Renew. Energy 2018, 125, 250–259. [Google Scholar] [CrossRef]
- Alegre, C.; Modica, E.; Aricò, A.S.; Baglio, V. Bifunctional oxygen electrode based on a perovskite/carbon composite for electrochemical devices. J. Electroanal. Chem. 2018, 808, 412–419. [Google Scholar] [CrossRef]
- Luo, Z.; Irtem, E.; Ibáñez, M.; Nafria, R.; Martí-Sánchez, S.; Genç, A.; de la Mata, M.; Liu, Y.; Cadavid, D.; Llorca, J.; et al. Mn3O4@CoMn2O4–CoxOy nanoparticles: Partial cation exchange synthesis and electrocatalytic properties toward the oxygen reduction and evolution reactions. ACS Appl. Mater. Interfaces 2016, 8, 17435–17444. [Google Scholar] [CrossRef] [PubMed]
Figure 1.
Diffractograms of the NiFe oxides at the different annealing temperatures.

Figure 2.
TEM of Ni Fe oxide at different temperatures (a) 100 °C; (b) 250 °C; (c) 450 °C and (d) 600 °C.
Figure 2.
TEM of Ni Fe oxide at different temperatures (a) 100 °C; (b) 250 °C; (c) 450 °C and (d) 600 °C.

Figure 3.
N2 adsorption-desorption isotherm (a) and corresponding pore size distributions (b) of Ni Fe oxide at the different temperatures.
Figure 3.
N2 adsorption-desorption isotherm (a) and corresponding pore size distributions (b) of Ni Fe oxide at the different temperatures.

Figure 4.
XPS spectra of (a) whole range, (b) Ni 2p, (c) Fe 2p, and (d) O1s energy region from 100–600 °C calcined samples.
Figure 4.
XPS spectra of (a) whole range, (b) Ni 2p, (c) Fe 2p, and (d) O1s energy region from 100–600 °C calcined samples.

Figure 5.
OER activity of Ni Fe oxides with sweep rate of 5 mV s−1 at 1600 rpm at three different mass loadings (a) 100; (b) 250 °C; (c) 450 °C, and (d) 600 °C.
Figure 5.
OER activity of Ni Fe oxides with sweep rate of 5 mV s−1 at 1600 rpm at three different mass loadings (a) 100; (b) 250 °C; (c) 450 °C, and (d) 600 °C.

Figure 6.
ORR activity of Ni Fe oxides with a sweep rate of 5 mV s−1 at 1600 rpm at three different mass loadings (a) 100; (b) 250 °C; (c) 450 °C, and (d) 600 °C.
Figure 6.
ORR activity of Ni Fe oxides with a sweep rate of 5 mV s−1 at 1600 rpm at three different mass loadings (a) 100; (b) 250 °C; (c) 450 °C, and (d) 600 °C.

Figure 7.
RDE curves of 100 °C calcined samples’ in 0.1 M KOH with 5 mV s−1 at different rotation rates (400–2500 rpm) with three different mass loadings (a) 0.125, (b) 0.25, and (c) 0.75 mg cm−2.
Figure 7.
RDE curves of 100 °C calcined samples’ in 0.1 M KOH with 5 mV s−1 at different rotation rates (400–2500 rpm) with three different mass loadings (a) 0.125, (b) 0.25, and (c) 0.75 mg cm−2.


Figure 8.
RDE curves of 0.75 mg cm−2 NiFe samples calcined at different temperatures in 0.1 M KOH with 5 mV s−1 at different rotation rates (400–2500 rpm) (a) 100; (b) 250 °C; (c) 450 °C, and (d) 600 °C.
Figure 8.
RDE curves of 0.75 mg cm−2 NiFe samples calcined at different temperatures in 0.1 M KOH with 5 mV s−1 at different rotation rates (400–2500 rpm) (a) 100; (b) 250 °C; (c) 450 °C, and (d) 600 °C.

Figure 9.
Summary of the number of transferred electrons for different heat-treatment temperatures and mass loadings.
Figure 9.
Summary of the number of transferred electrons for different heat-treatment temperatures and mass loadings.

Figure 10.
Electrochemical stability of Ni Fe oxide at 250 °C calcined sample with three different mass loadings (a) 0.125, (b) 0.25, and (c) 0.75 mg cm−2.
Figure 10.
Electrochemical stability of Ni Fe oxide at 250 °C calcined sample with three different mass loadings (a) 0.125, (b) 0.25, and (c) 0.75 mg cm−2.

Figure 11.
Enlarged view of the electrochemical stability curve of the samples calcined at 100 °C (a–c) and 250 °C; (d–f) in different loadings of 0.125–0.75 mg cm−2.
Figure 11.
Enlarged view of the electrochemical stability curve of the samples calcined at 100 °C (a–c) and 250 °C; (d–f) in different loadings of 0.125–0.75 mg cm−2.

Figure 12.
Enlarged view of the electrochemical stability curve of the samples calcined at 250 °C (g–i) and 250 °C; (j–l) in different loadings of 0.125–0.75 mg cm−2.
Figure 12.
Enlarged view of the electrochemical stability curve of the samples calcined at 250 °C (g–i) and 250 °C; (j–l) in different loadings of 0.125–0.75 mg cm−2.


Table 1.
N2 isotherm characteristics of the Ni Fe oxide at different temperatures.
| Sample | Crystallite Size from XRD * (nm) | Specific Area Ф (m2 g−1) | Mean Pore Diameter Ф (nm) | Pore Volume Ф (cm3 g −1) |
|---|---|---|---|---|
| 100 °C | 13.85 | 131 | 23 | 0.81 |
| 250 °C | 10.59 | 127 | 25 | 0.82 |
| 450 °C | 13.53 | 118 | 15 | 0.51 |
| 600 °C | 26.66 | 40 | 56 | 0.41 |
* For 100 °C sample calculated at 2θ − 11.5°; 250 to 600 °C calculated at 2θ ≈ 35.7° Ф Calculated from N2 adsorption-desorption curve.
Table 2.
Tafel characteristics of the Ni Fe oxide at the different temperatures.
| Tafel Slope (mV Decade−1) | ||||||
|---|---|---|---|---|---|---|
| OER | ORR | |||||
| Loading (mg cm−2) | 0.125 | 0.25 | 0.75 | 0.125 | 0.25 | 0.75 |
| 100 °C | 59.1 | 94.5 | 98 | 47 | 98 | 126 |
| 250 °C | 39.4 | 41 | 54 | 126 | 124 | 84 |
| 450 °C | 70 | 70 | 75 | 95 | 116 | 121 |
| 600 °C | 581 | 461 | 331 | 106 | 81 | 76 |
Table 3.
Comparison of bifunctional oxygen electrode activities of NiFeOx with precious metal and non-precious oxide catalysts.
Table 3.
Comparison of bifunctional oxygen electrode activities of NiFeOx with precious metal and non-precious oxide catalysts.
| Catalysts | Tafel Slope (mV Decade−1) | OER E(V) at 10 mA cm−2 | E(V) at −1 mA cm−2 of ORR | ΔE (V) | Reference | |
|---|---|---|---|---|---|---|
| OER | ORR | |||||
| 100 °C | 59 | 47 | 1.56 | 0.29 | 1.26 | This work |
| 250 °C | 39 | 126 | 1.54 | 0.54 | 1.00 | This work |
| 450 °C | 70 | 95 | - | 0.47 | - | This work |
| 600 °C | 581 | 106 | - | 0.42 | - | This work |
| Aerogel-NiFe2O4 | 57 | 1.59 | [43] | |||
| Aerogel-NiFe2O4 | 1.69 | 0.73 | 0.98 | |||
| Ambigel-NiFe2O4(Ni/Fe 2:1) | 1.62 | 0.73 | 0.91 | [24] | ||
| NiFeCo-LDH | 93 | 1.57 | 0.63 | 1.05 | [44] | |
| NiCo-loaded CNF | 1.64 | 0.87 | 0.76 | [45] | ||
| Pd/KB(50µg cm−2) | 1.68 | 0.84 | 0.84 | [46] | ||
| 20% Ir/C | 1.61 | 0.92 | [1] | |||
| 20% Pt/C | 2804 | 60 | 2.02 | 1.01 | ||
| 20% Ru/C | 1.62 | 1.16 | ||||
| MnO | 1.77 | 1.04 | [47] | |||
| Co3O4 | 110 | 124 | 1.71 | 1.07 | ||
| Co3O4/CoMn2O4 | 106 | 95 | 1.75 | 1.10 | [43] | |
| CoO-Co/CNF | 1.67 | 0.86 | 0.81 | [45] | ||
© 2018 by the authors. Licensee MDPI, Basel, Switzerland. This article is an open access article distributed under the terms and conditions of the Creative Commons Attribution (CC BY) license (http://creativecommons.org/licenses/by/4.0/).
Share and Cite
MDPI and ACS Style
Paulraj, A.R.; Kiros, Y.; Göthelid, M.; Johansson, M.B. NiFeOx as a Bifunctional Electrocatalyst for Oxygen Reduction (OR) and Evolution (OE) Reaction in Alkaline Media. Catalysts 2018, 8, 328. https://doi.org/10.3390/catal8080328
AMA Style
Paulraj AR, Kiros Y, Göthelid M, Johansson MB. NiFeOx as a Bifunctional Electrocatalyst for Oxygen Reduction (OR) and Evolution (OE) Reaction in Alkaline Media. Catalysts. 2018; 8(8):328. https://doi.org/10.3390/catal8080328
Chicago/Turabian StylePaulraj, Alagar Raj, Yohannes Kiros, Mats Göthelid, and Malin B. Johansson. 2018. "NiFeOx as a Bifunctional Electrocatalyst for Oxygen Reduction (OR) and Evolution (OE) Reaction in Alkaline Media" Catalysts 8, no. 8: 328. https://doi.org/10.3390/catal8080328
Note that from the first issue of 2016, this journal uses article numbers instead of page numbers. See further details here.