Destruction of Toluene, Naphthalene and Phenanthrene as Model Tar Compounds in a Modified Rotating Gliding Arc Discharge Reactor

 ,
,
Abstract
:1. Introduction
2. Results and Discussions
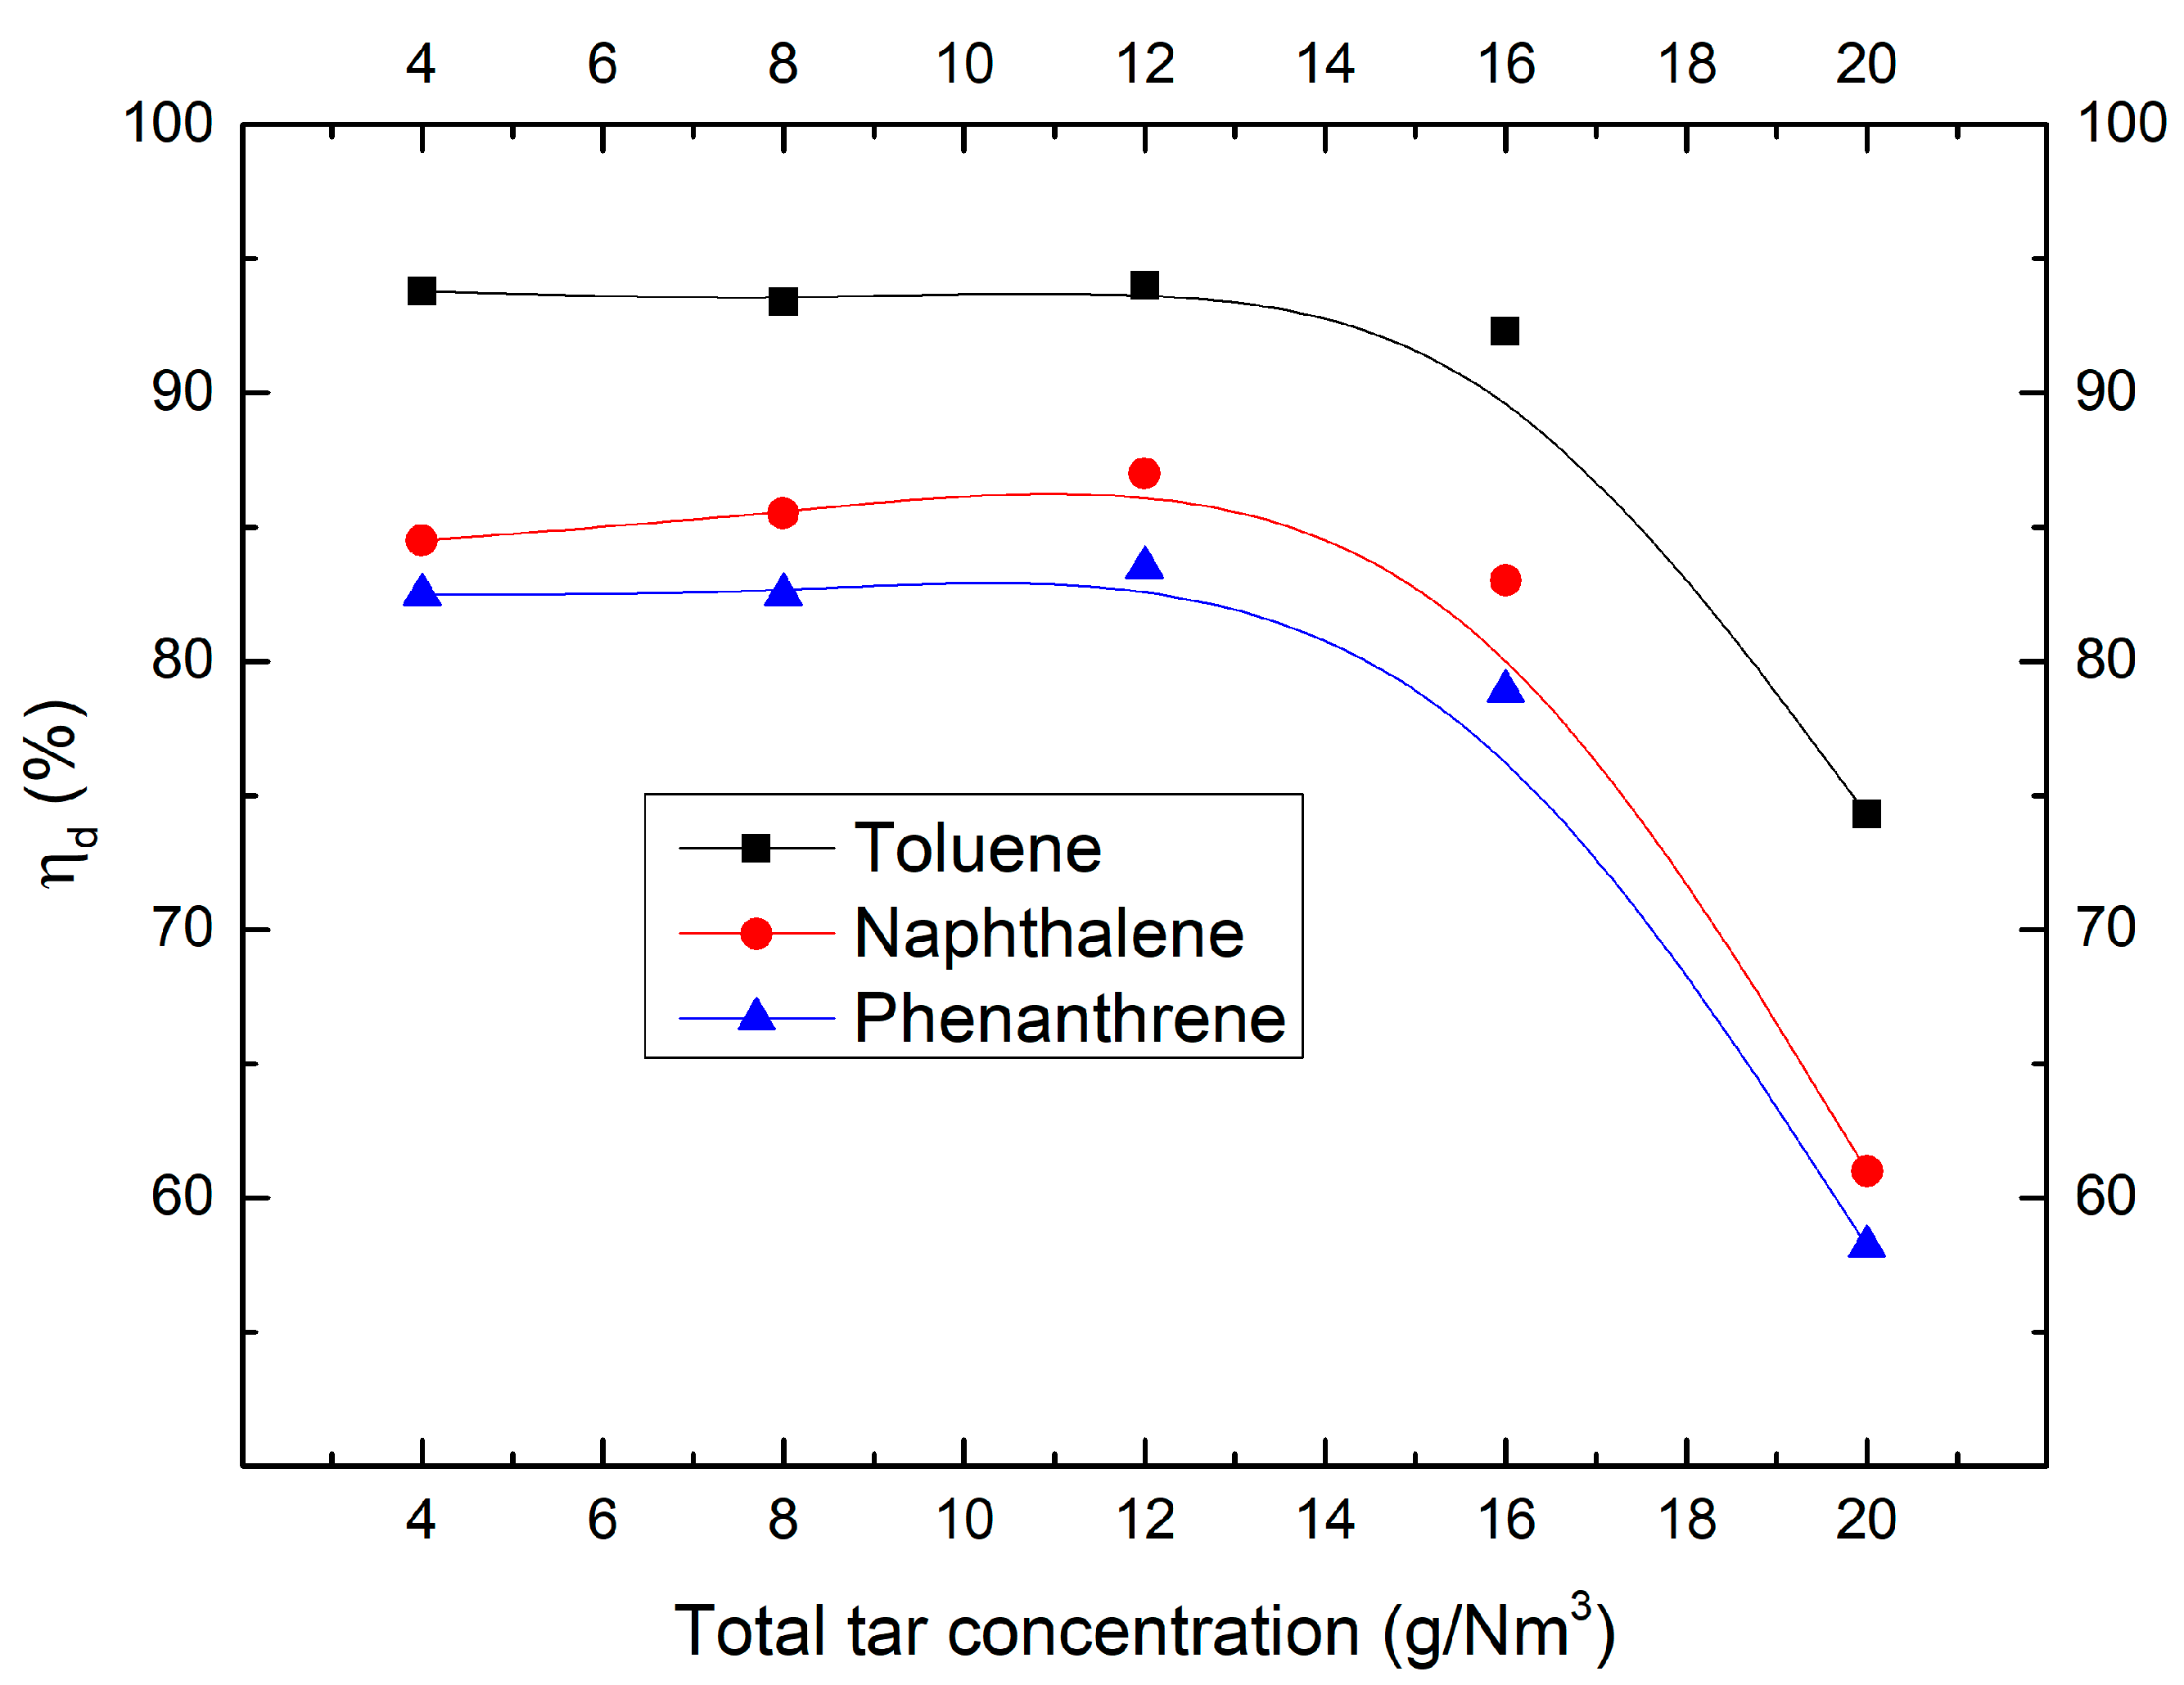
2.1. Effect of Tar Concentration
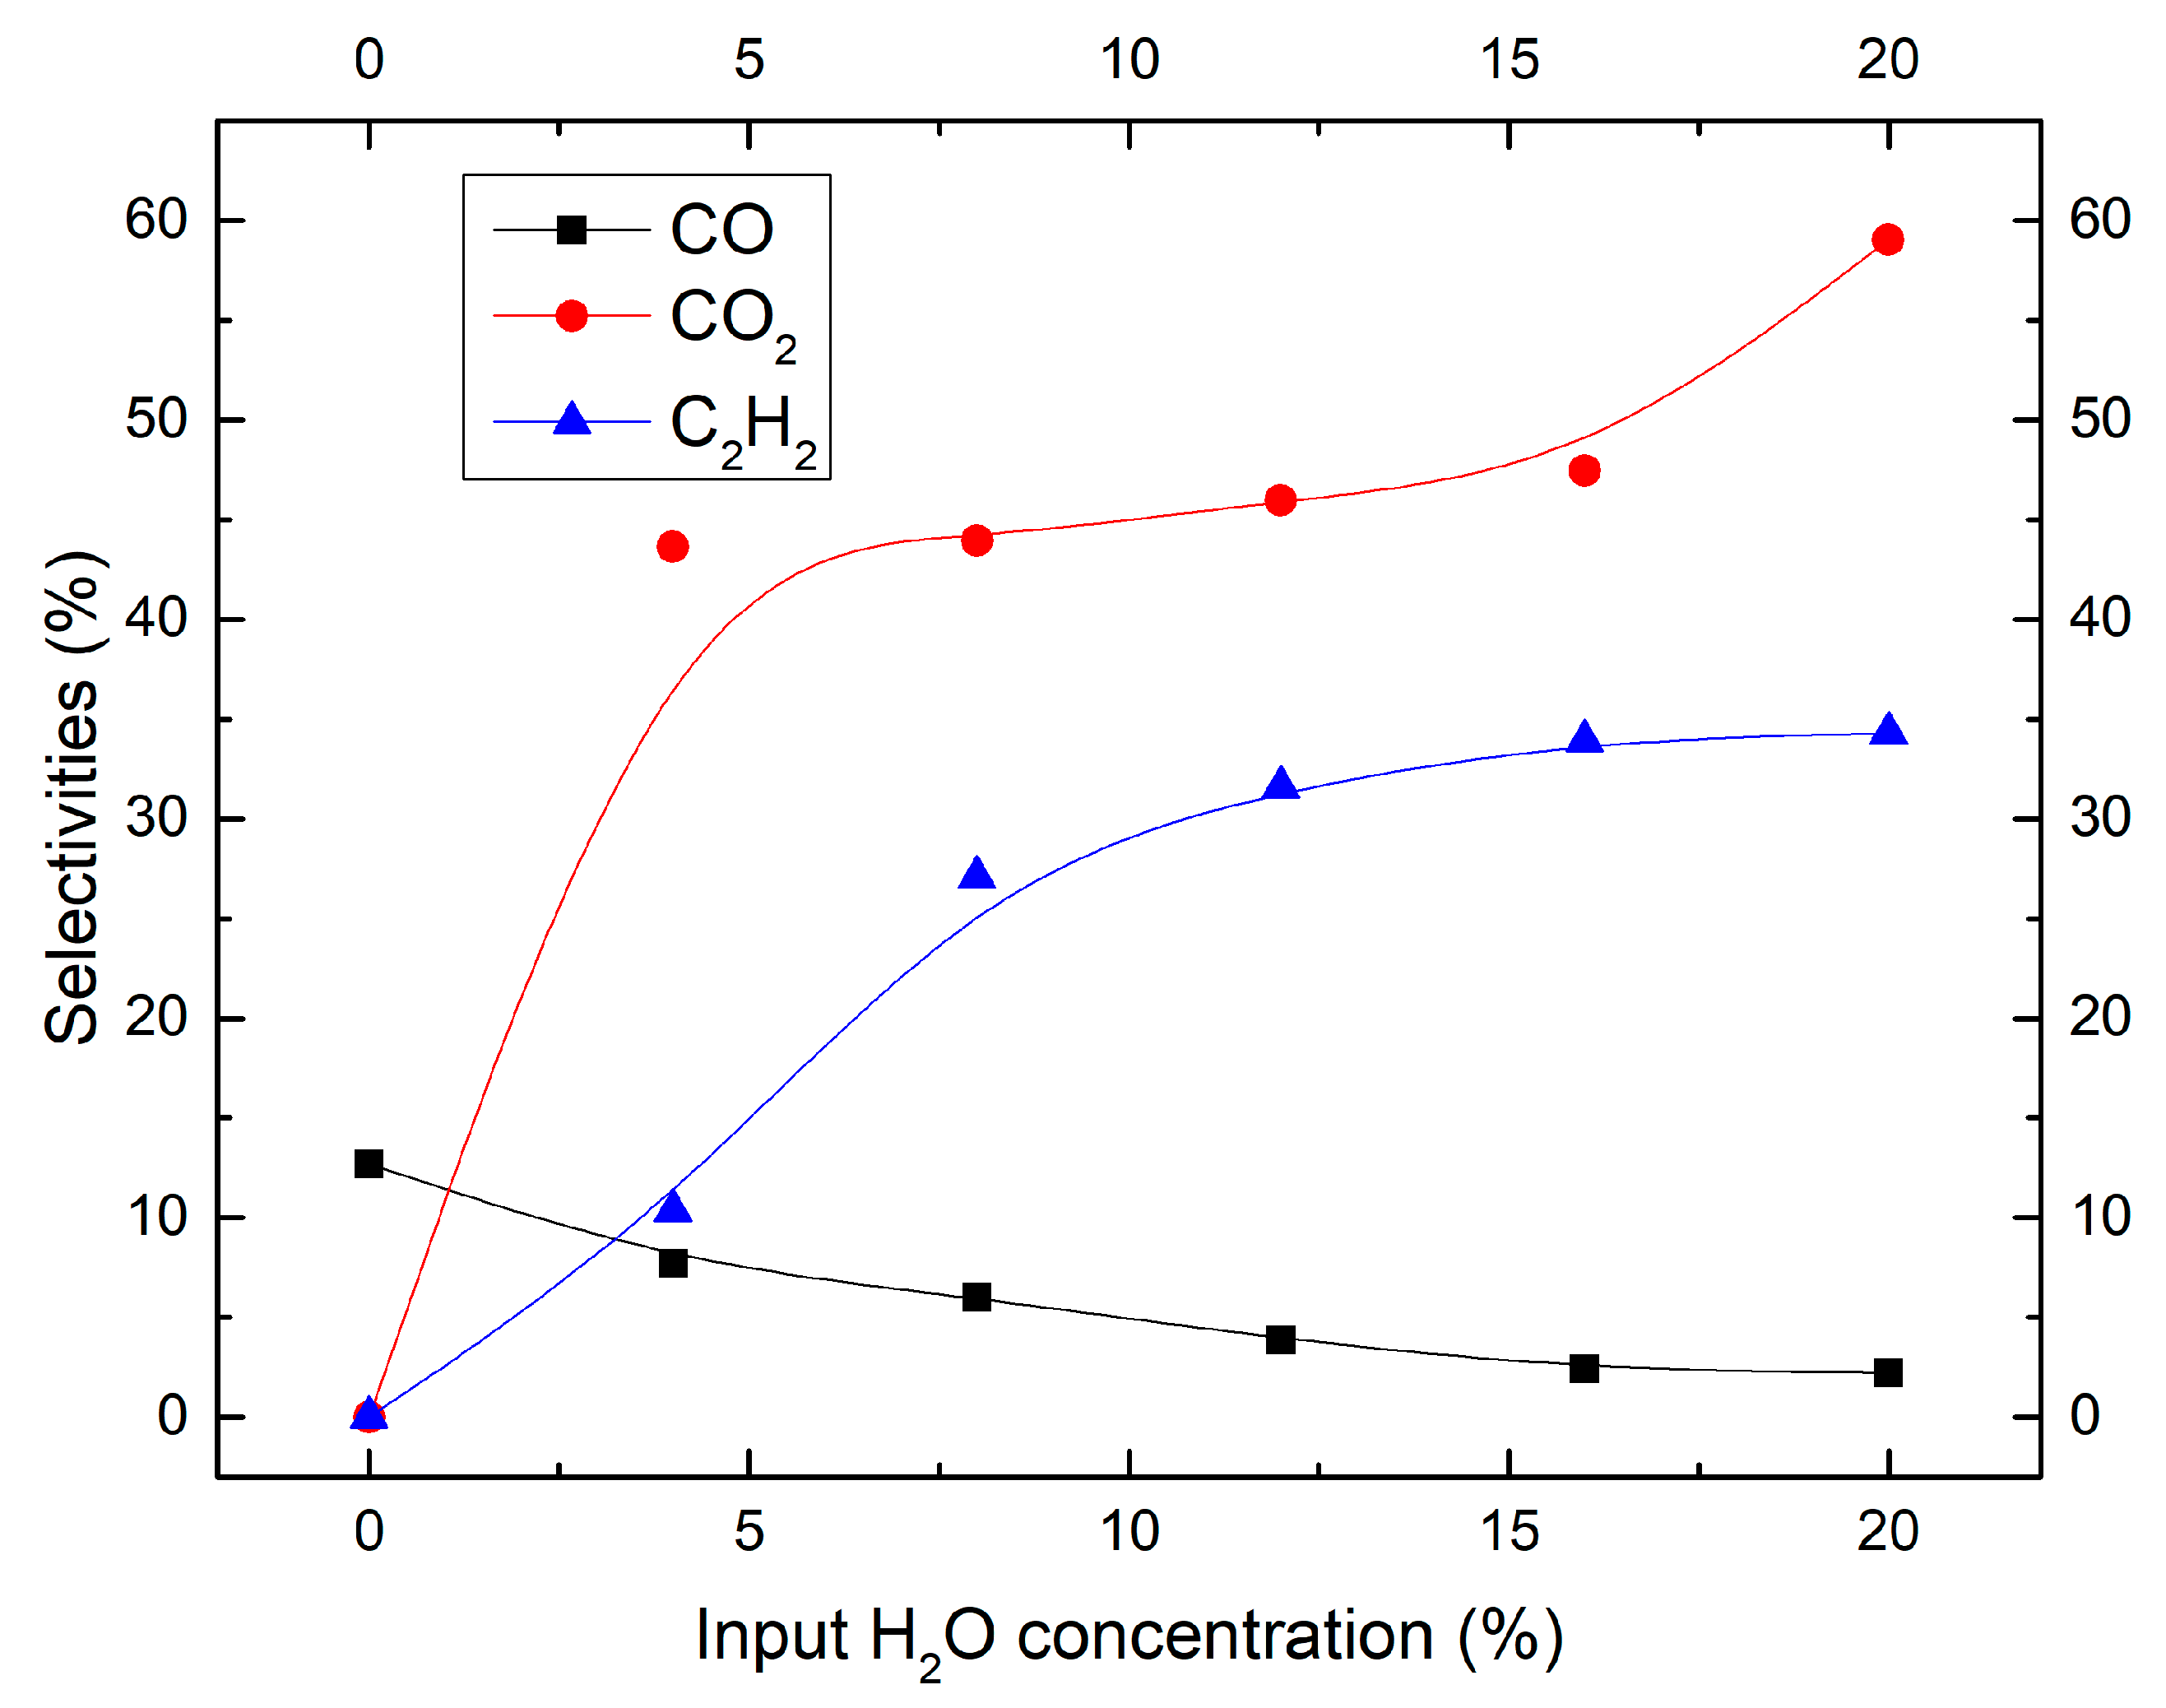
2.2. Effect of Moisture Content
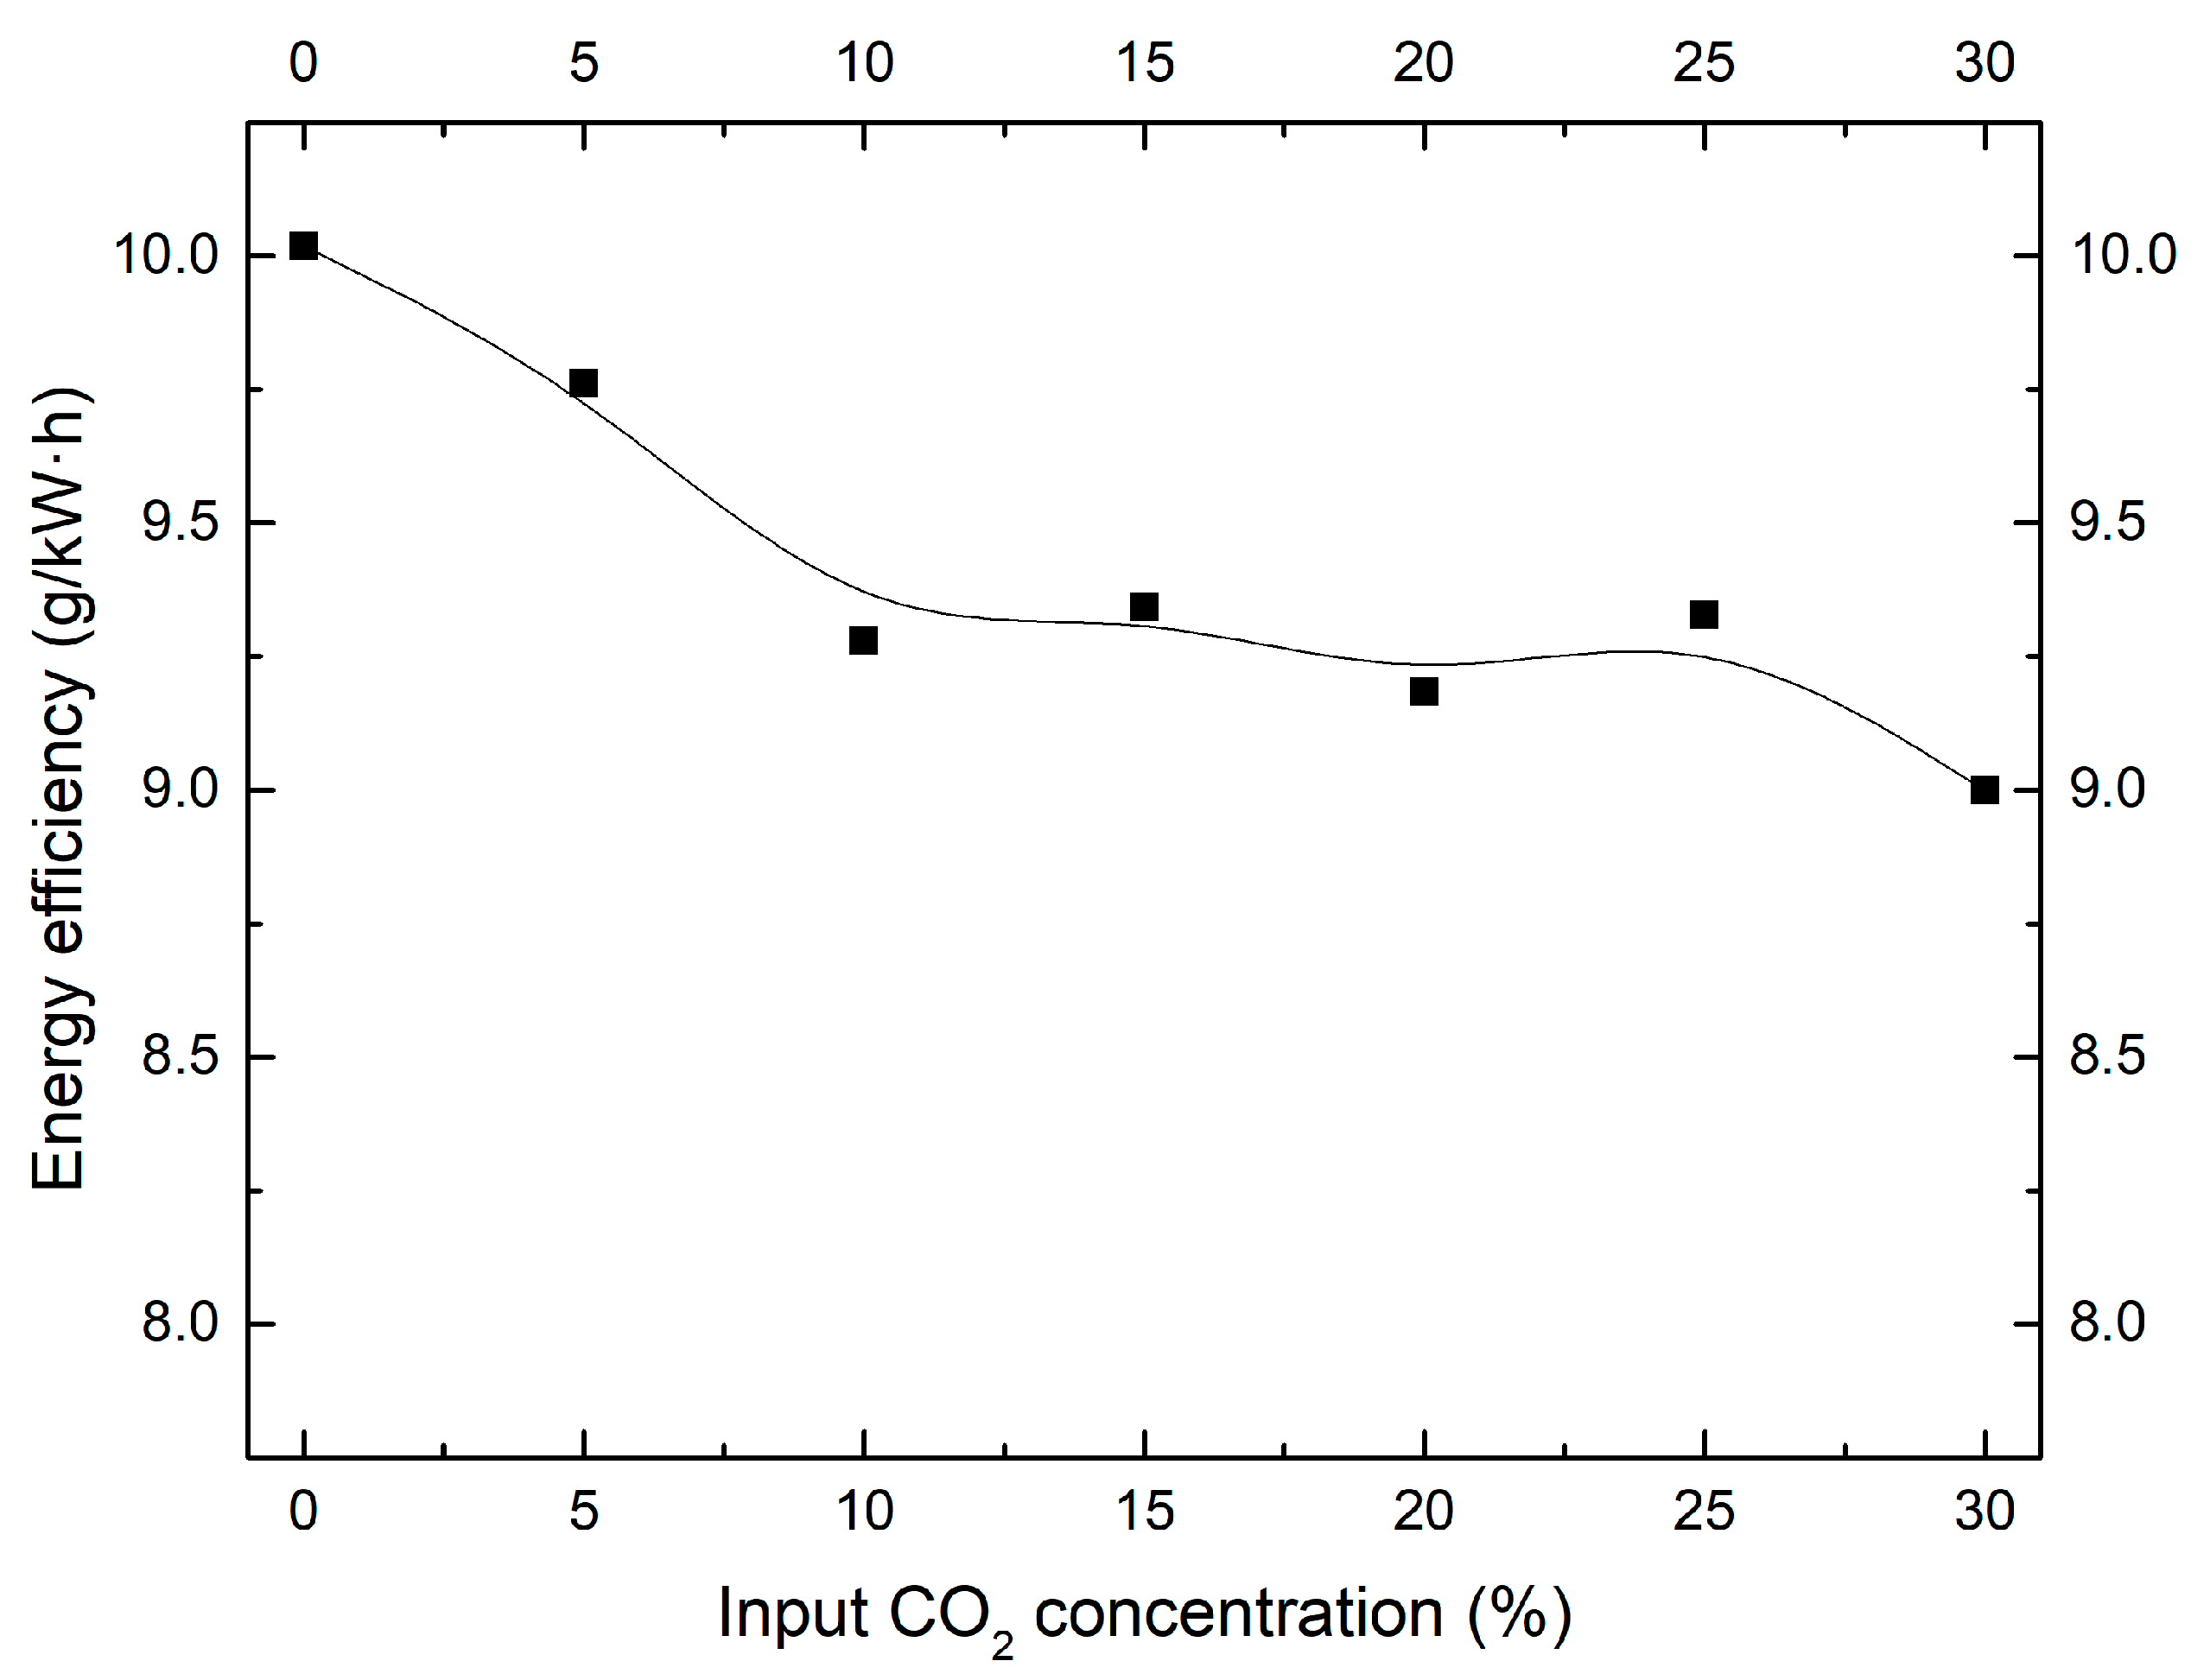
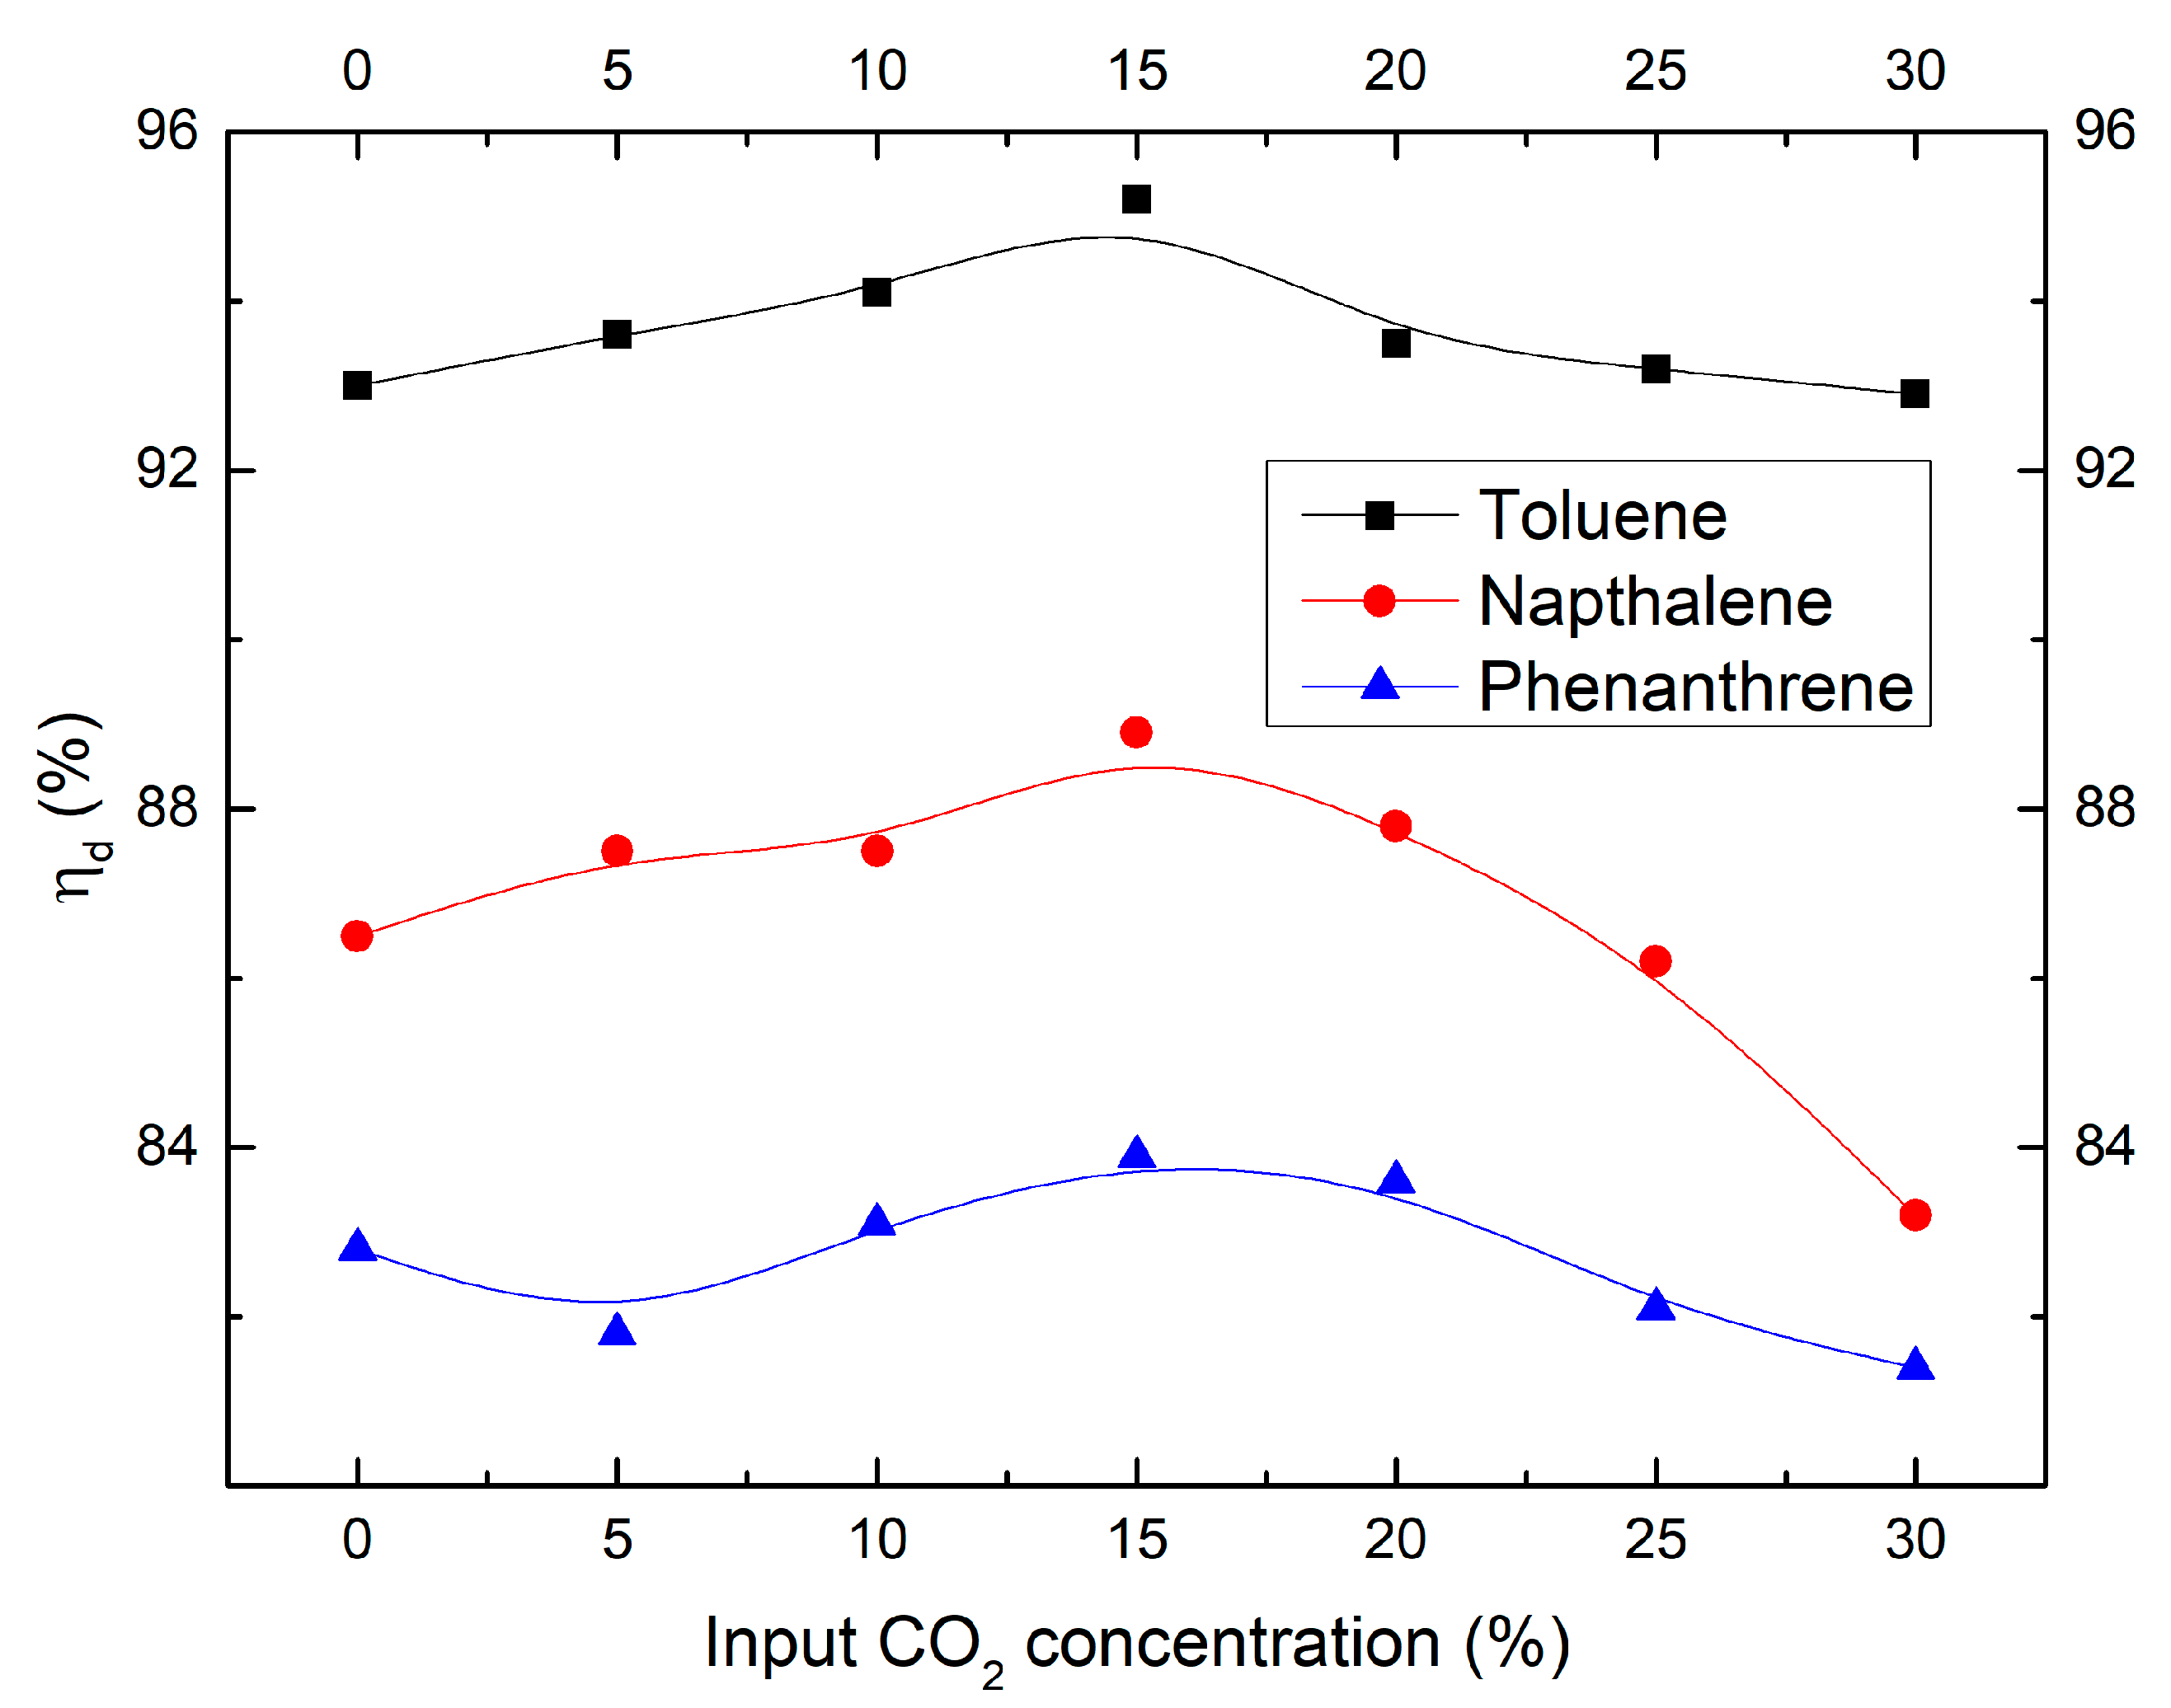
2.3. Effect of CO2 Concentration
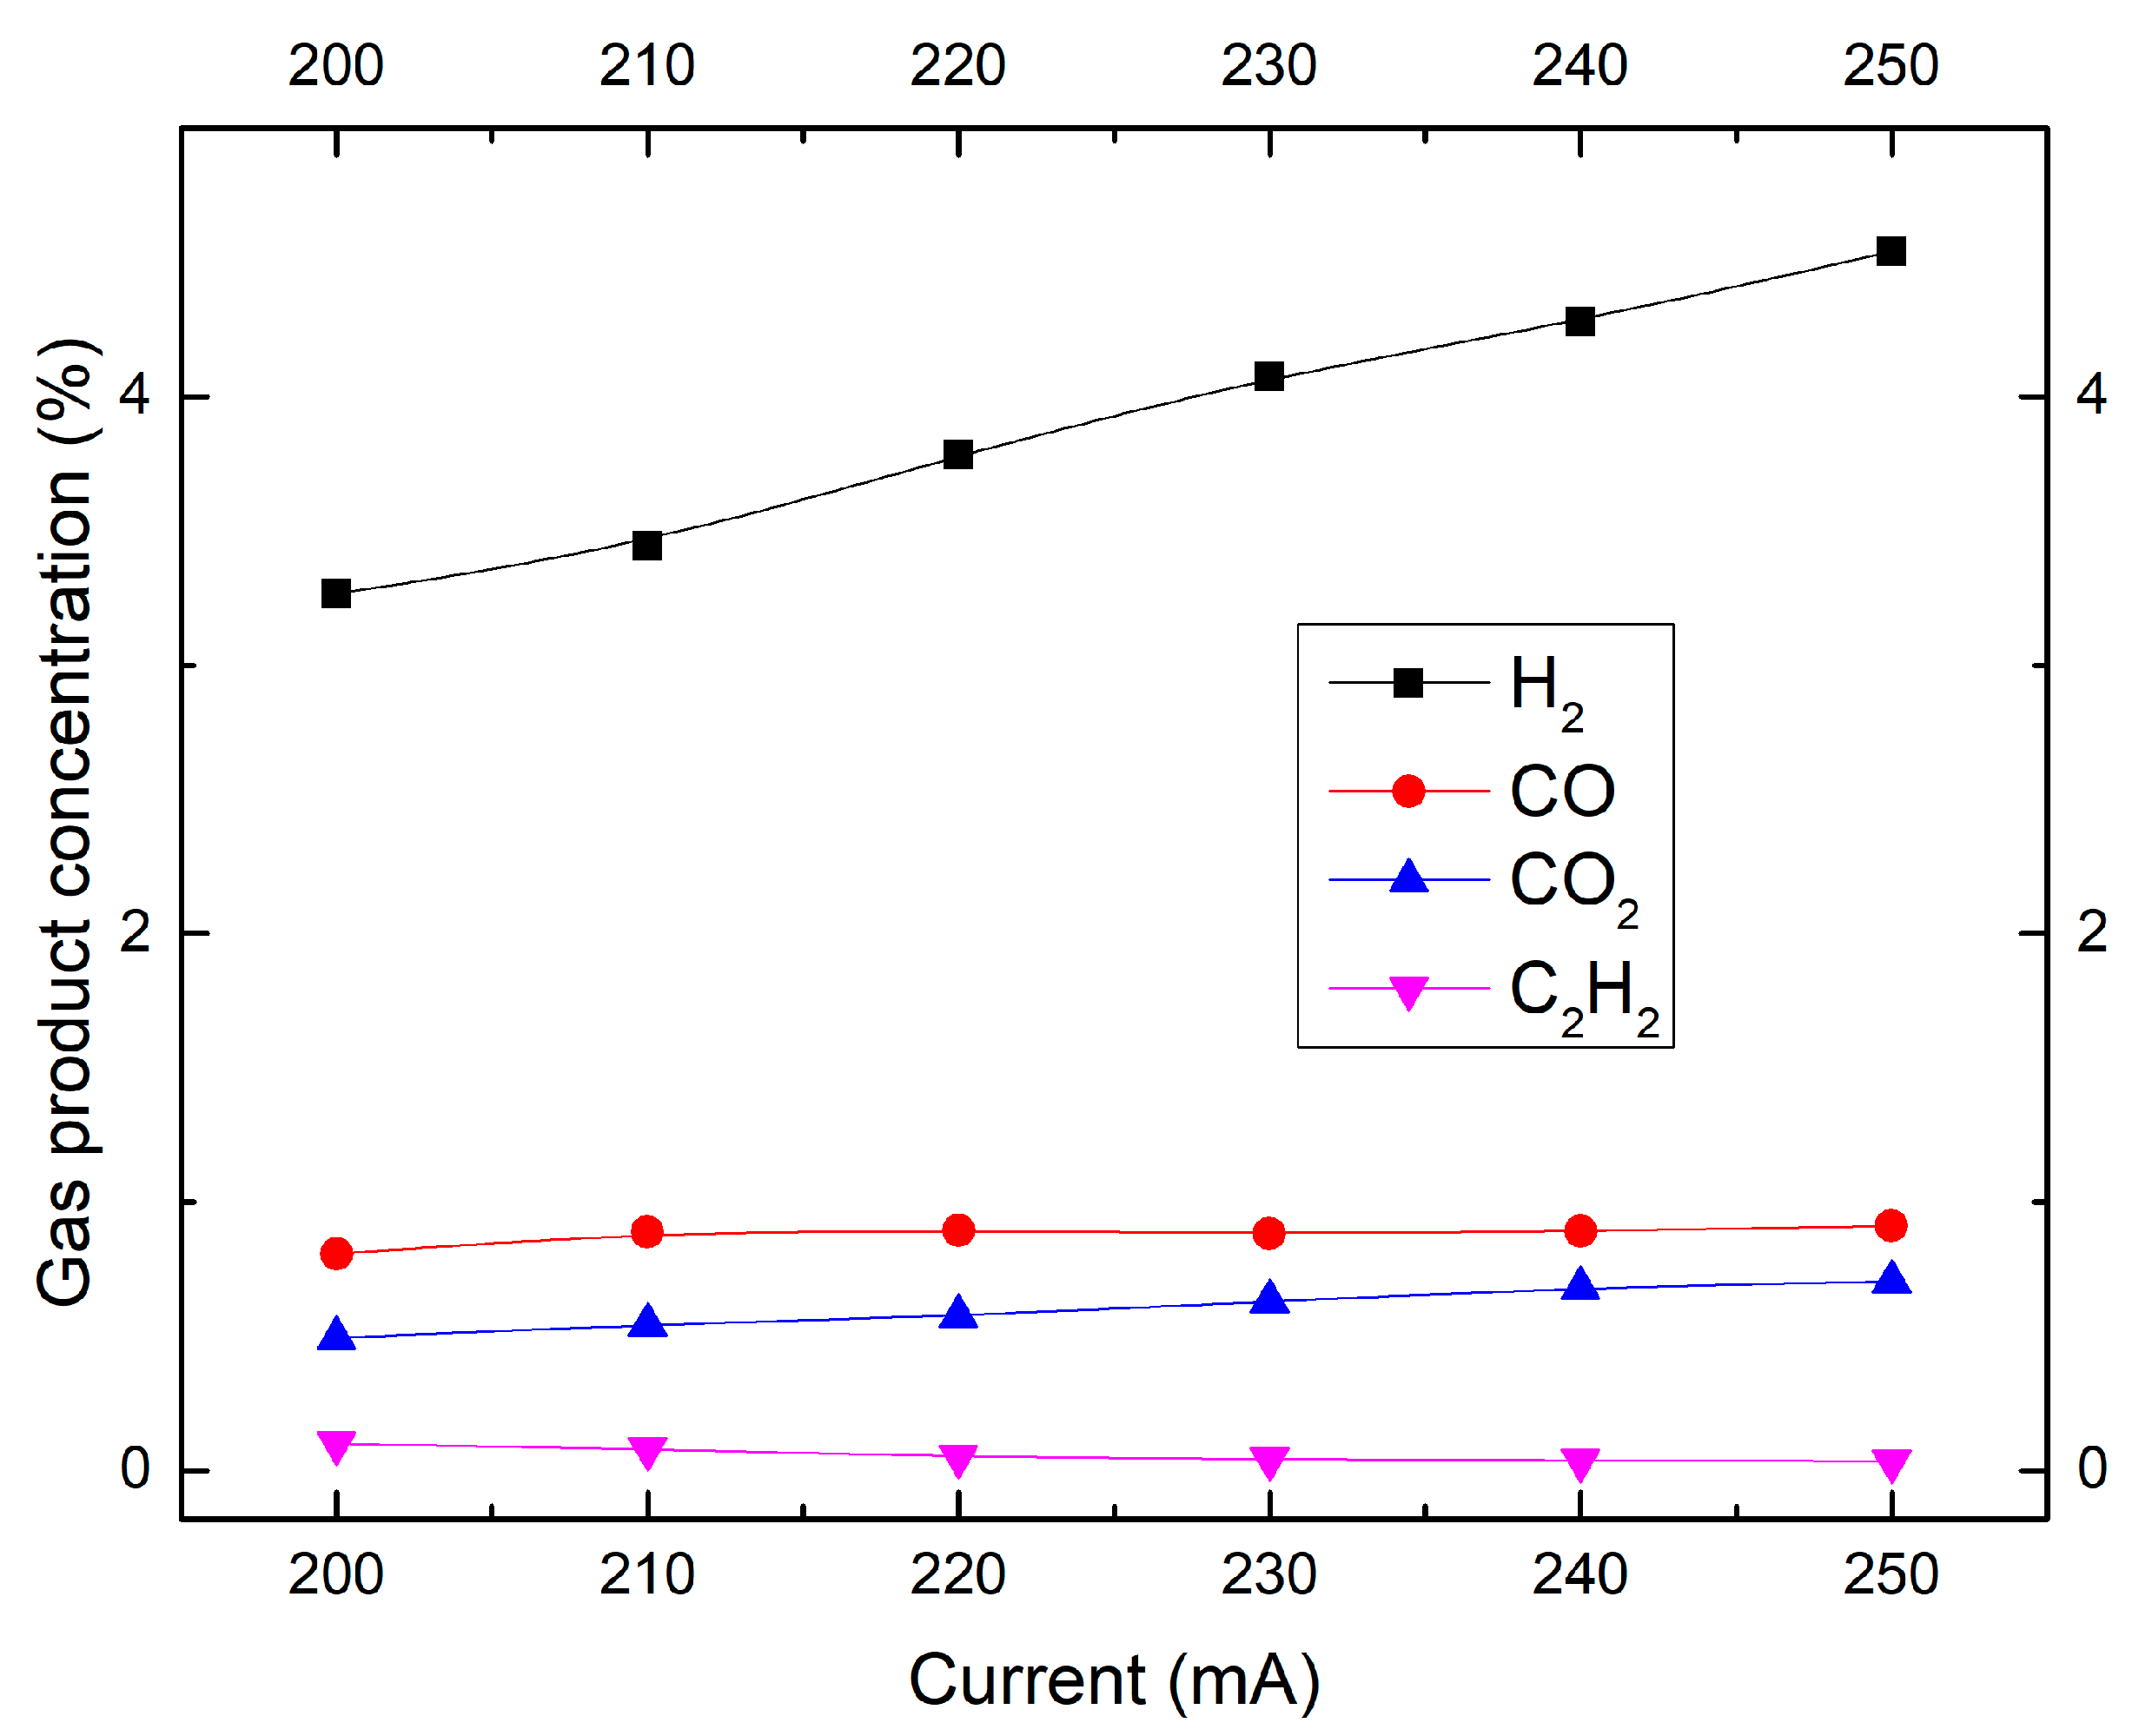
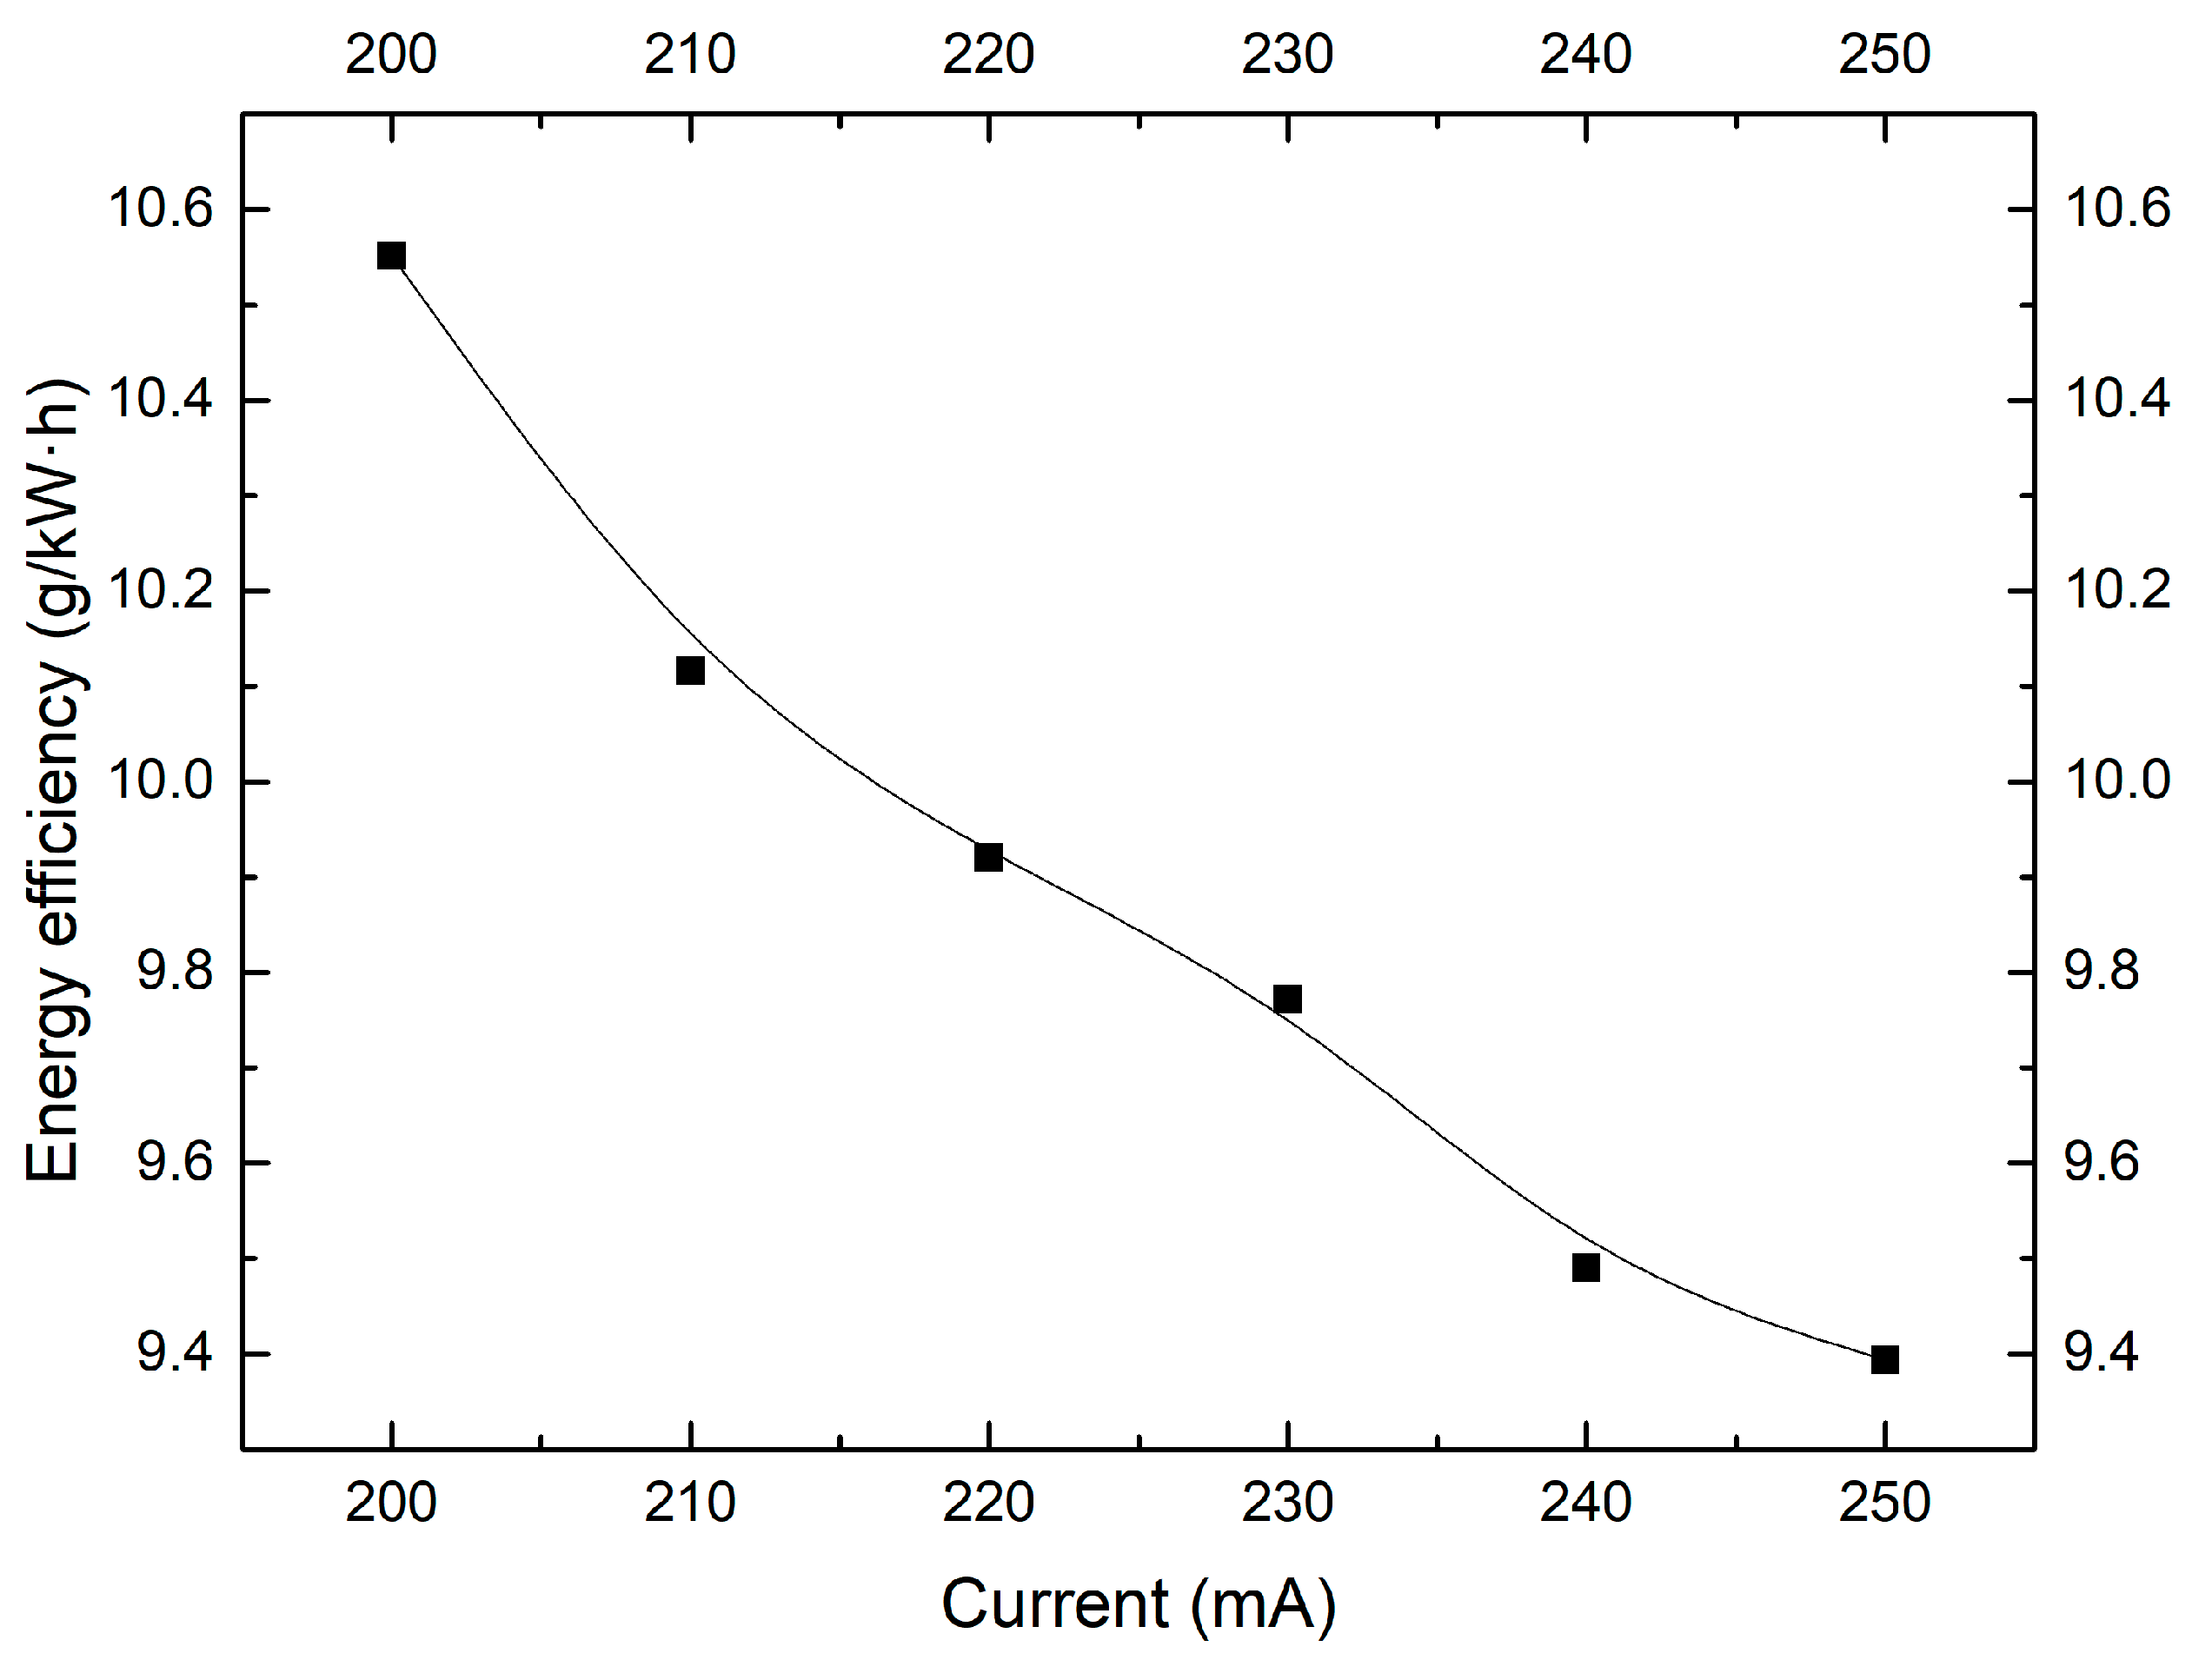
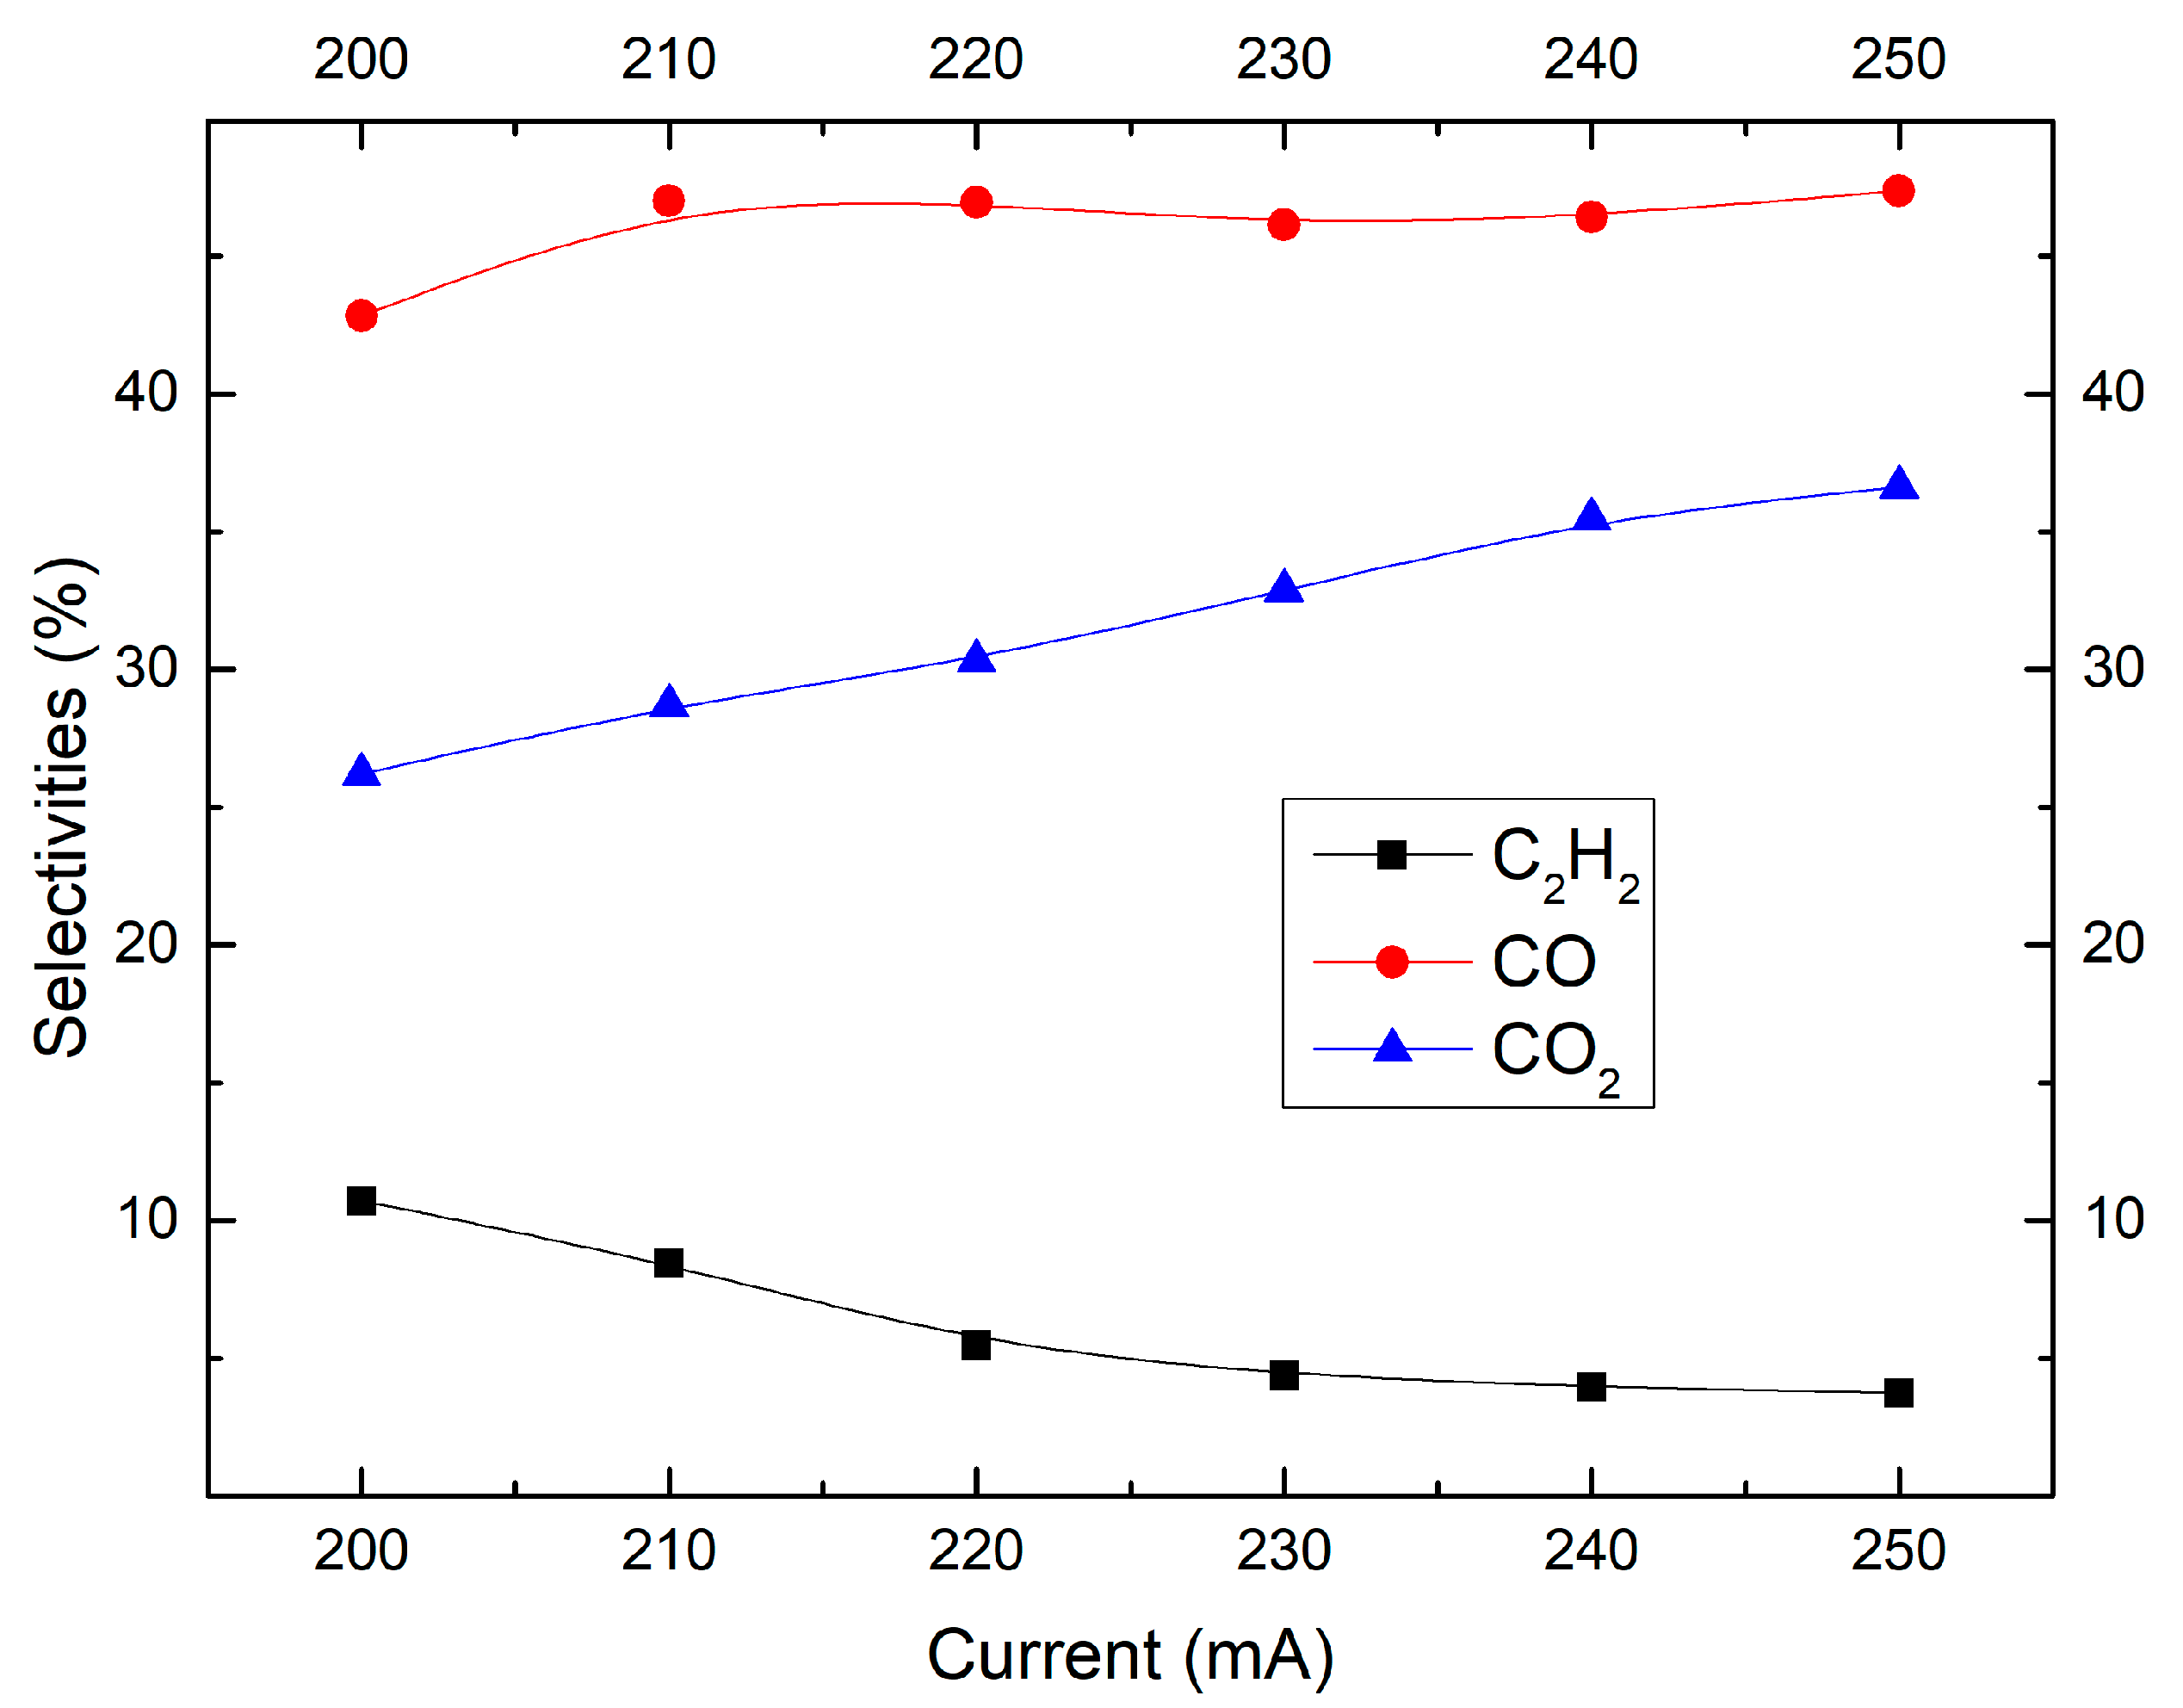
2.4. Effect of Discharge Current
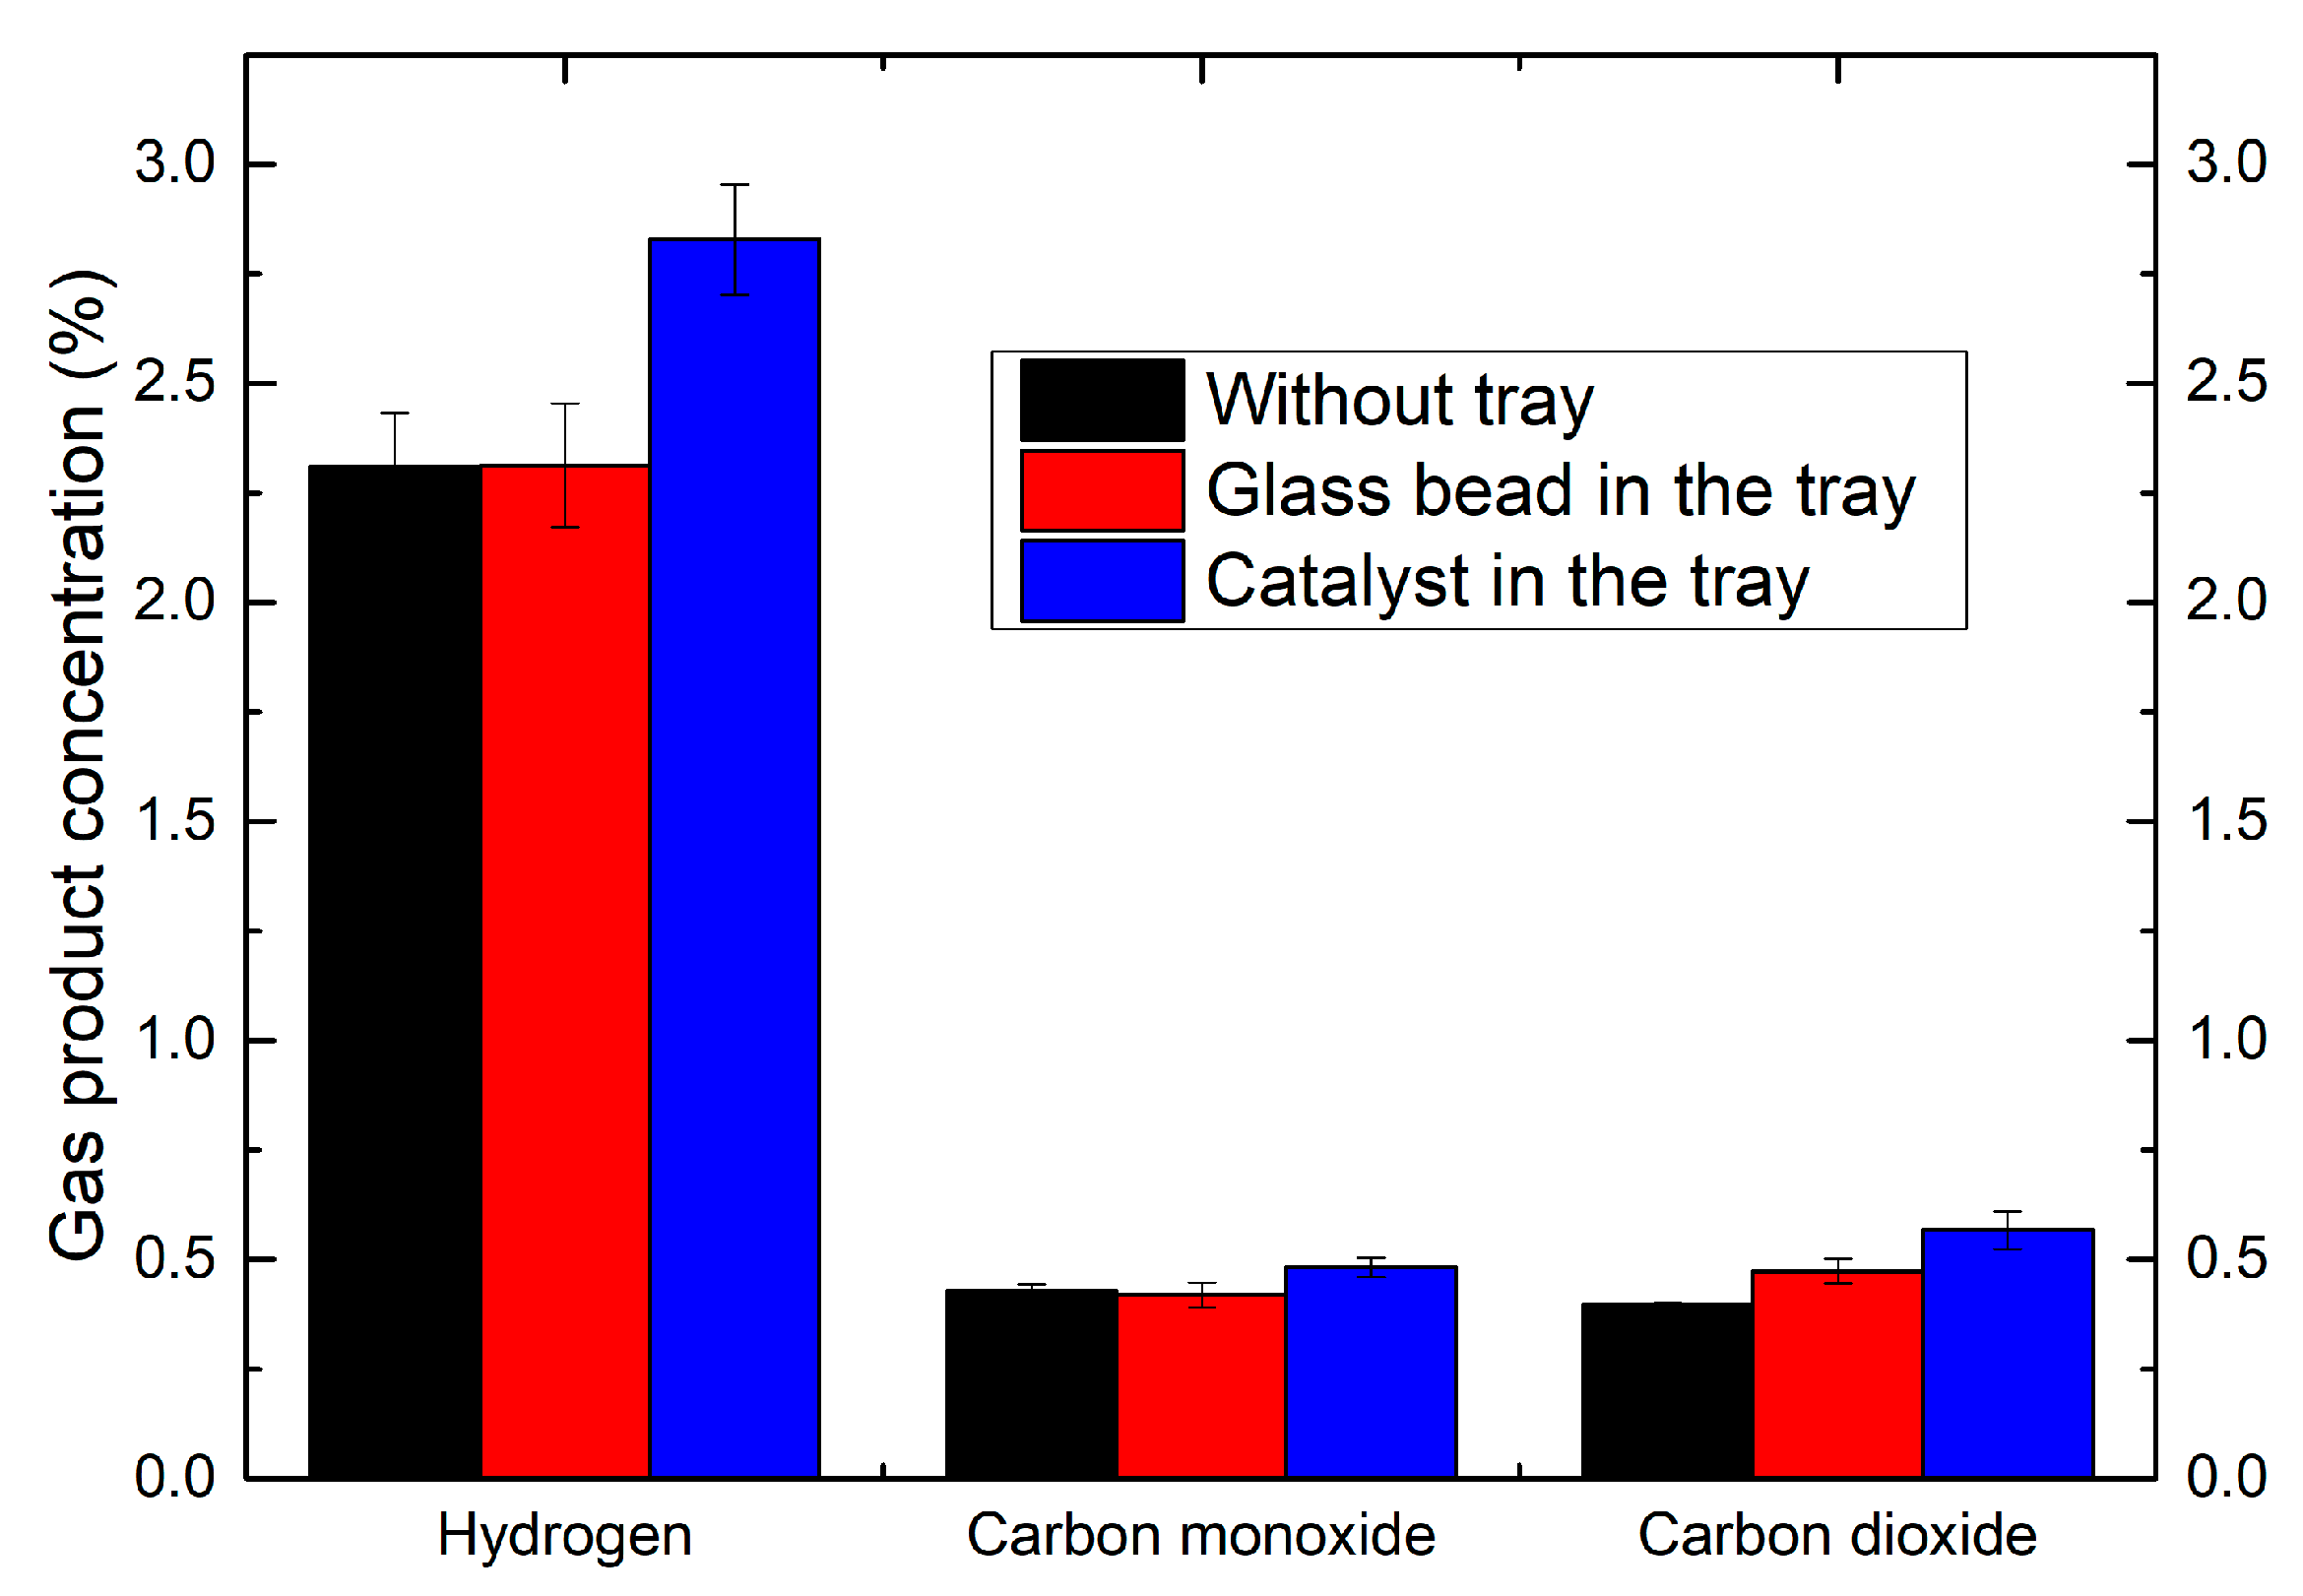
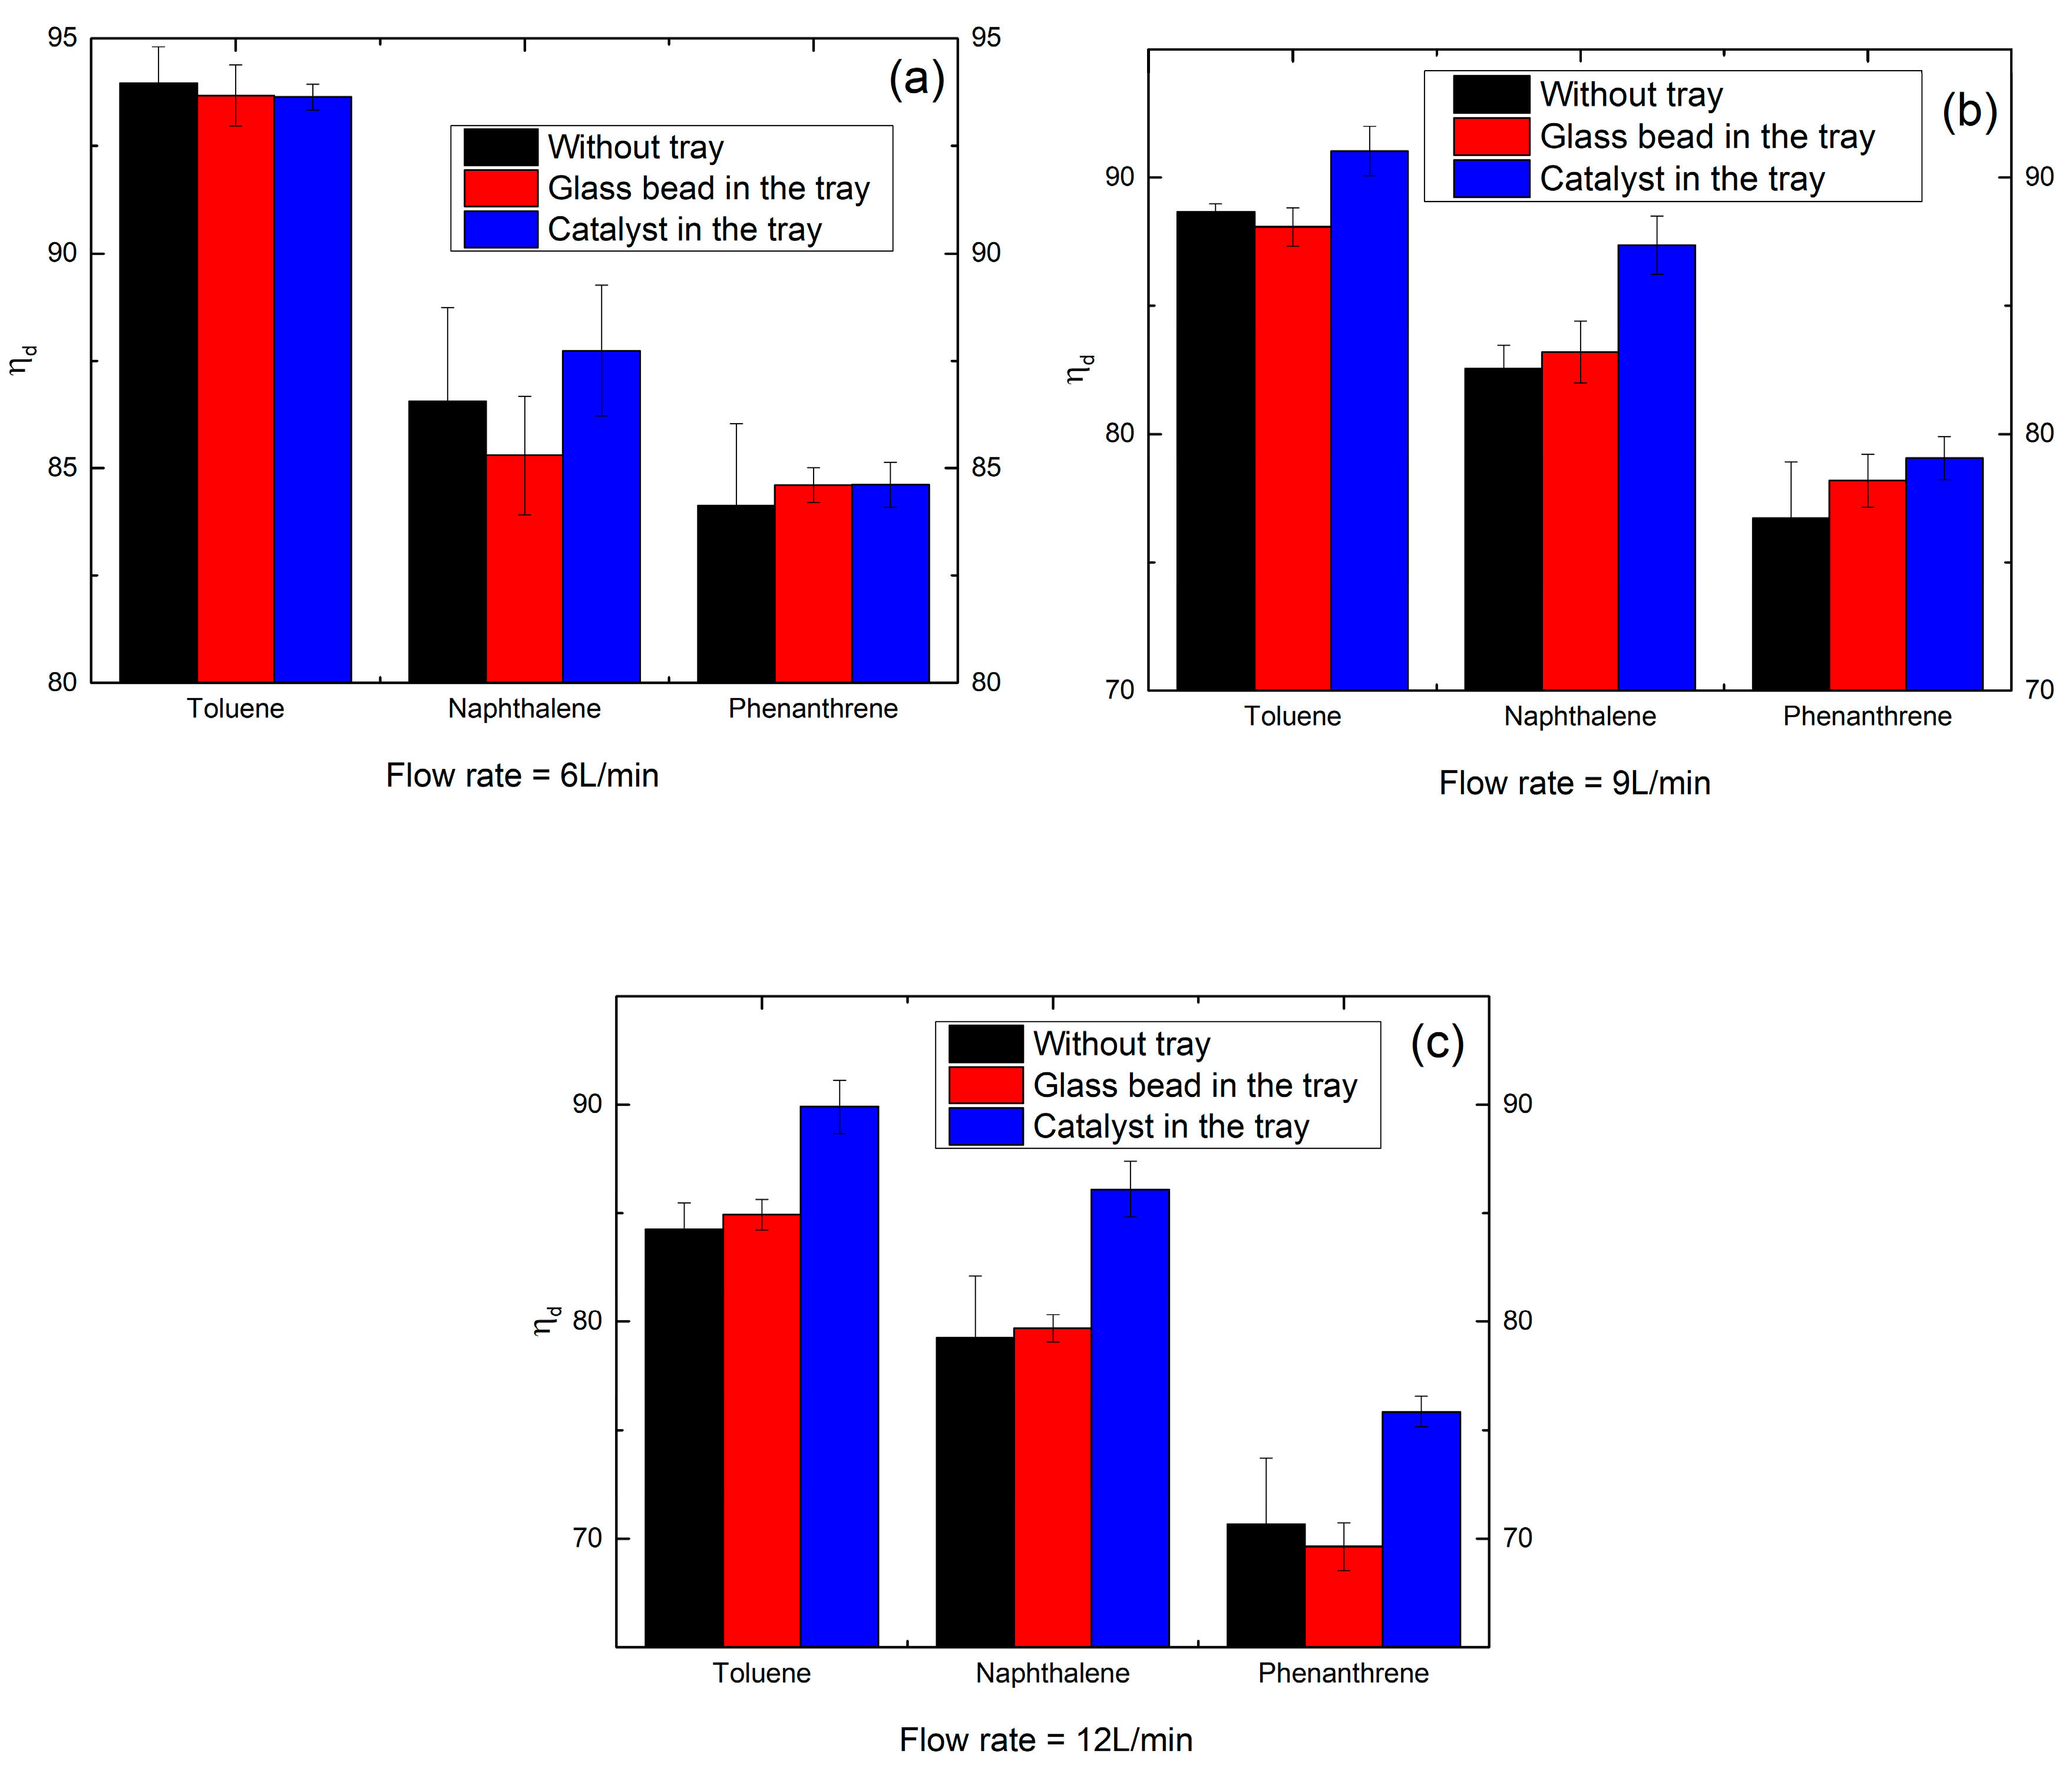
2.5. Effect of the Coupling of Catalyst with Plasma
2.6. Liquid By-Products Analysis
3. Experimental
3.1. Experimental Setup
3.2. Catalyst Preparation
3.3. Reaction Performance Parameters
4. Conclusions
Author Contributions
Acknowledgments
Conflicts of Interest
References
- Sun, J.; Wang, Q.; Wang, W.; Song, Z.; Zhao, X.; Mao, Y.; Ma, C. Novel treatment of a biomass tar model compound via microwave-metal discharges. Fuel 2017, 207, 121–125. [Google Scholar] [CrossRef]
- Wnukowski, M.; Jamróz, P. Microwave plasma treatment of simulated biomass syngas: Interactions between the permanent syngas compounds and their influence on the model tar compound conversion. Fuel Process. Technol. 2018, 173, 229–242. [Google Scholar] [CrossRef]
- Luo, H.; Bao, L.; Wang, H.; Kong, L.; Sun, Y. Microwave-assisted in-situ elimination of primary tars over biochar: Low temperature behaviors and mechanistic insights. Bioresource Technol. 2018, 267, 333–340. [Google Scholar] [CrossRef] [PubMed]
- Arena, U. Process and technological aspects of municipal solid waste gasification. A review. Waste Manag. 2012, 32, 625–639. [Google Scholar] [CrossRef] [PubMed]
- Baratieri, M.; Baggio, P.; Bosio, B.; Grigiante, M.; Longo, G.A. The use of biomass syngas in IC engines and CCGT plants: A comparative analysis. Appl. Therm. Eng. 2009, 29, 3309–3318. [Google Scholar] [CrossRef] [Green Version]
- Han, J.; Kim, H. The reduction and control technology of tar during biomass gasification/pyrolysis: An overview. Renew. Sustain. Energy Rev. 2008, 12, 397–416. [Google Scholar] [CrossRef]
- Guan, G.; Kaewpanha, M.; Hao, X.; Wang, Z.; Cheng, Y.; Kasai, Y.; Abudula, A. Promoting effect of potassium addition to calcined scallop shell supported catalysts for the decomposition of tar derived from different biomass resources. Fuel 2013, 109, 241–247. [Google Scholar] [CrossRef]
- Zhu, F.; Li, X.; Zhang, H.; Wu, A.; Yan, J.; Ni, M.; Zhang, H.; Buekens, A. Destruction of toluene by rotating gliding arc discharge. Fuel 2016, 176, 78–85. [Google Scholar] [CrossRef]
- Medeiros, H.S.; Pilatau, A.; Nozhenko, O.S.; Da Silva Sobrinho, A.S.; Petraconi Filho, G. Microwave Air Plasma Applied to Naphthalene Thermal Conversion. Energy Fuels 2016. [Google Scholar] [CrossRef]
- Devi, L.; Ptasinski, K.J.; Janssen, F.J.J.G. Pretreated olivine as tar removal catalyst for biomass gasifiers: Investigation using naphthalene as model biomass tar. Fuel Process. Technol. 2005, 86, 707–730. [Google Scholar] [CrossRef]
- Liu, S.; Mei, D.; Wang, L.; Tu, X. Steam reforming of toluene as biomass tar model compound in a gliding arc discharge reactor. Chem. Eng. J. 2017, 307, 793–802. [Google Scholar] [CrossRef]
- Świerczyński, D.; Libs, S.; Courson, C.; Kiennemann, A. Steam reforming of tar from a biomass gasification process over Ni/olivine catalyst using toluene as a model compound. Appl. Catal. B Environ. 2009, 74, 211–222. [Google Scholar] [CrossRef]
- Tursun, Y.; Xu, S.; Wang, G.; Wang, C.; Xiao, Y. Tar formation during co-gasification of biomass and coal under different gasification condition. J. Anal. Appl. Pyrolysis 2015, 111, 191–199. [Google Scholar] [CrossRef]
- Jess, A. Mechanisms and kinetics of thermal reactions of aromatic hydrocarbons from pyrolysis of solid fuels. Fuel 1996, 75, 1441–1448. [Google Scholar] [CrossRef]
- Saleem, F.; Zhang, K.; Harvey, A. Role of CO2 in the Conversion of Toluene as a Tar Surrogate in a Nonthermal Plasma Dielectric Barrier Discharge Reactor. Energy Fuels 2018, 32, 5164–5170. [Google Scholar] [CrossRef]
- Richardson, Y.; Blin, J.; Julbe, A. A short overview on purification and conditioning of syngas produced by biomass gasification: Catalytic strategies, process intensification and new concepts. Prog. Energy Combust. Sci. 2012, 38, 765–781. [Google Scholar] [CrossRef]
- Nunnally, T.; Tsangaris, A.; Rabinovich, A.; Nirenberg, G.; Chernets, I.; Fridman, A. Gliding arc plasma oxidative steam reforming of a simulated syngas containing naphthalene and toluene. Int. J. Hydrogen Energy 2014, 39, 11976–11989. [Google Scholar] [CrossRef]
- Chun, Y.N.; Kim, S.C.; Yoshikawa, K. Destruction of anthracene using a gliding arc plasma reformer. Korean J. Chem. Eng. 2011, 28, 1713–1720. [Google Scholar] [CrossRef]
- Ashok, J.; Kawi, S. Steam reforming of toluene as a biomass tar model compound over CeO2 promoted Ni/CaO–Al2O3 catalytic systems. Int. J. Hydrogen Energy 2013, 38, 13938–13949. [Google Scholar] [CrossRef]
- Nair, S.A.; Pemen, A.J.M.; Yan, K.; Gompel, F.M.V.; Leuken, H.E.M.V.; Heesch, E.J.M.V.; Ptasinski, K.J.; Drinkenburg, A.A.H. Tar removal from biomass-derived fuel gas by pulsed corona discharges. Fuel Process. Technol. 2003, 84, 161–173. [Google Scholar] [CrossRef]
- Pemen, A.J.M.; Nair, S.A.; Yan, K.; Heesch, E.J.M.V.; Ptasinski, K.J.; Drinkenburg, A.A.H. Pulsed Corona Discharges for Tar Removal from Biomass Derived Fuel Gas. Plasmas Polym. 2003, 8, 209–224. [Google Scholar] [CrossRef]
- Sun, J.; Wang, Q.; Wang, W.; Wang, K. Exploiting the Photocatalytic Effect of Microwave–Metal Discharges for the Destruction of a Tar Model Compound. Energy Fuels 2018, 32, 241–245. [Google Scholar] [CrossRef]
- Jamróz, P.; Kordylewski, W.; Wnukowski, M. Microwave plasma application in decomposition and steam reforming of model tar compounds. Fuel Process. Technol. 2018. [Google Scholar] [CrossRef]
- Wnukowski, M. Decomposition of Tars in Microwave Plasma—Preliminary Results. J. Ecol. Eng. 2014, 15, 23–28. [Google Scholar]
- Materazzi, M.; Lettieri, P.; Mazzei, L.; Taylor, R.; Chapman, C. Reforming of tars and organic sulphur compounds in a plasma-assisted process for waste gasification. Fuel Process. Technol. 2015, 137, 259–268. [Google Scholar] [CrossRef]
- Materazzi, M.; Lettieri, P.; Mazzei, L.; Taylor, R.; Chapman, C. Tar evolution in a two-stage fluid bed–plasma gasification process for waste valorization. Fuel Process. Technol. 2014, 128, 146–157. [Google Scholar] [CrossRef]
- Lim, M.; Chun, Y. Light Tar Decomposition of Product Pyrolysis Gas from Sewage Sludge in a Gliding Arc Plasma Reformer. Environ. Eng. Res. 2012, 17, 89–94. [Google Scholar] [CrossRef] [Green Version]
- Yang, Y.C.; Chun, Y.N. Naphthalene destruction performance from tar model compound using a gliding arc plasma reformer. Korean J. Chem. Eng. 2011, 28, 539–543. [Google Scholar] [CrossRef]
- Tippayawong, N.; Inthasan, P. Investigation of Light Tar Cracking in a Gliding Arc Plasma System. Int. J. Chem. React. Eng. 2010. [Google Scholar] [CrossRef]
- Du, C.M.; Yan, J.H.; Cheron, B. Decomposition of toluene in a gliding arc discharge plasma reactor. Plasma Sources Sci. Technol. 2007, 16, 791–797. [Google Scholar] [CrossRef]
- Snoeckx, R.; Bogaerts, A. Plasma technology—A novel solution for CO2 conversion. Chem. Soc. Rev. 2017, 46, 585–586. [Google Scholar] [CrossRef]
- Pemen, A.J.M.; van Paasen, S.V.B.; Yan, K.; Nair, S.A.; van Heesch, E.J.M.; Ptasinski, K.J.; Neeft, J.P.A. Conditioning of biomass derived fuel gas using plasma techniques. In Proceedings of the 12th European Conference on Biomass for Energy, Industry and Climate Protection, Amsterdam, The Netherlands, 17–21 June 2002. [Google Scholar]
- Nunnally, T.P.; Gutsol, A.; Fridman, A. Dissociation of H2S in non-equilibrium gliding arc ‘tornado’ discharge. Int. J. Hydrogen Energy 2009, 34, 7618–7625. [Google Scholar] [CrossRef]
- Fridman, A.; Nester, S.; Kennedy, L.A.; Saveliev, A.; Mutaf-Yardimci, O. Gliding arc gas discharge. Prog. Energy Combust. Sci. 1999, 25, 211–231. [Google Scholar] [CrossRef]
- Zhang, H.; Zhu, F.; Li, X.; Cen, K.; Du, C.; Tu, X. Rotating Gliding Arc Assisted Water Splitting in Atmospheric Nitrogen. Plasma Chem. Plasma Process. 2016, 36, 813–834. [Google Scholar] [CrossRef]
- Zhu, F.; Zhang, H.; Yang, J.; Yan, J.; Ni, M.; Li, X. Plasma-assisted Toluene Destruction in Simulated Producer Gas. Chem. Lett. 2017, 46, 1341–1343. [Google Scholar] [CrossRef]
- Materazzi, M.; Lettieri, P.; Taylor, R.; Chapman, C. Performance analysis of RDF gasification in a two-stage fluidized bed–plasma process. Waste Manag. 2016, 47, 256–266. [Google Scholar] [CrossRef]
- Ma, W.; Han, L.; Zhang, L.; Lu, W. Thermal-reforming of toluene over core-shell Ni/γ-Al2O3 catalysts. In Proceedings of the IEEE International Conference on Materials for Renewable Energy & Environment, Chengdu, China, 19–21 August 2014. [Google Scholar]
- Chun, Y.N.; Kim, S.C.; Yoshikawa, K. Decomposition of benzene as a surrogate tar in a gliding arc plasma. Environ. Prog. Sustain. 2013, 32, 837–845. [Google Scholar] [CrossRef]
- Gao, J.; Zhu, J.; Ehn, A.; Aldén, M.; Li, Z. In-Situ Non-intrusive Diagnostics of Toluene Removal by a Gliding Arc Discharge Using Planar Laser-Induced Fluorescence. Plasma Chem. Plasma Process. 2017, 37, 433–450. [Google Scholar] [CrossRef]
- Yan, X.; Li, X.D.; Zhu, F.S.; Kong, X.Z.; Yan, J.H. Decomposition of naphthalene as tar model compound from the gasification of municipal solid waste by rotating gliding arc plasma. Chem. Ind. Eng. Prog. 2018, 37, 1174–1180. [Google Scholar]
- Qian, N.; Zhang, L.; Ma, W.; Zhao, X.; Han, L.; Lu, W. Core–Shell Al2O3-Supported Ni for High-Performance Catalytic Reforming of Toluene as a Model Compound of Tar. Arab. J. Sci. Eng. 2014, 39, 6671–6678. [Google Scholar] [CrossRef]


| No | Retention Time (min) | Species | Area Percentage (%, the Area Percent of Input Naphthalene is 1000%) under Typical Atmosphere | Area Percentage (%, the Area Percent of Input Naphthalene is 1000%) when 15% CO2 Exists |
|---|---|---|---|---|
| 1 | 6.590 | Ethylbenzene | 0.9 | 0.9 |
| 2 | 6.865 | Phenylethyne | 17.2 | 15.3 |
| 3 | 7.109 | Styrene | 0.7 | 1 |
| 4 | 8.222 | Benzaldehyde | <0.1 | 0.7 |
| 5 | 8.477 | Phenol | <0.1 | 0.4 |
| 6 | 8.572 | Benzonitrile | 0.7 | 0.8 |
| 7 | 9.383 | Indene | 11.3 | 16 |
| 8 | 9.685 | Phenol, 2-methyl- | <0.1 | 0.3 |
| 9 | 11.791 | Cyclobuta[de]naphthalene | 0.9 | 1.1 |
| 10 | 12.085 | Naphthalene, 2-methyl- | 1.1 | 1.3 |
| 11 | 12.240 | Naphthalene, 1-methyl- | 0.7 | 1.3 |
| 12 | 12.538 | Benzene, 2,4-pentadiynyl- | 0.2 | 0.7 |
| 13 | 12.775 | Biphenyl | 1.3 | 1.2 |
| 14 | 13.354 | Acenaphthylene | 39.8 | 16.2 |
| 15 | 13.813 | Bibenzyl | 0.4 | 1.7 |
| 16 | 14.269 | Fluorene | 27.9 | 23.4 |
| 17 | 16.040 | 4H-Cyclopenta[def]phenanthrene | 1.0 | 0.9 |
| 18 | 16.622 | Fluoranthene | 2.9 | 1.1 |
| 19 | 16.847 | Pyrene | 5.9 | 1.1 |
| Monocyclic Products | |||
 Ethylbenzene |  Phenylethyne |  Styrene |  Benzaldehyde |
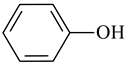 Phenol |  Benzonitrile | 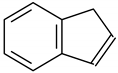 Indene | 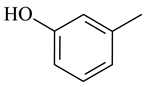 Phenol, 2-methyl- |
 Benzene, 2,4-pentadiynyl- | |||
| Bicyclic Products | |||
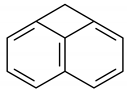 Cyclobuta[de]naphthalene | 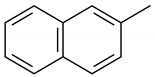 Naphthalene, 2-methyl- | 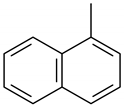 Naphthalene, 1-methyl- | 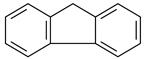 Fluorene |
 Biphenyl | 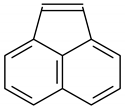 Acenaphthylene | 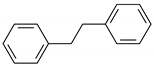 Bibenzyl | |
| Tricyclic and Quadruple Products | |||
 4H-Cyclopenta[def]phenanthrene | 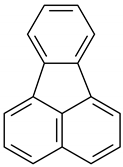 Fluoranthene | 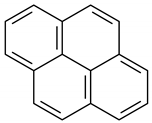 Pyrene | |
© 2018 by the authors. Licensee MDPI, Basel, Switzerland. This article is an open access article distributed under the terms and conditions of the Creative Commons Attribution (CC BY) license (http://creativecommons.org/licenses/by/4.0/).
Share and Cite
Kong, X.; Zhang, H.; Li, X.; Xu, R.; Mubeen, I.; Li, L.; Yan, J. Destruction of Toluene, Naphthalene and Phenanthrene as Model Tar Compounds in a Modified Rotating Gliding Arc Discharge Reactor. Catalysts 2019, 9, 19. https://doi.org/10.3390/catal9010019
Kong X, Zhang H, Li X, Xu R, Mubeen I, Li L, Yan J. Destruction of Toluene, Naphthalene and Phenanthrene as Model Tar Compounds in a Modified Rotating Gliding Arc Discharge Reactor. Catalysts. 2019; 9(1):19. https://doi.org/10.3390/catal9010019
Chicago/Turabian StyleKong, Xiangzhi, Hao Zhang, Xiaodong Li, Ruiyang Xu, Ishrat Mubeen, Li Li, and Jianhua Yan. 2019. "Destruction of Toluene, Naphthalene and Phenanthrene as Model Tar Compounds in a Modified Rotating Gliding Arc Discharge Reactor" Catalysts 9, no. 1: 19. https://doi.org/10.3390/catal9010019