Abstract
This study investigates the role of oxygen vacancy on Fe-doped CeO2 catalyst activity for soot oxidation. The oxygen vacancy was assessed through Ce3+ content. The Fe content was varied between 0 and 30% for two catalyst preparation methods, co-precipitation (CP) and solution combustion synthesis (SCS). X-ray photoelectron spectroscopy indicates that ceria exists as both Ce4+ and Ce3+, while iron is present only as Fe3+. The catalyst’s activity was evaluated by ignition (T10) and combustion (T50) temperatures using thermogravimetric analysis. Optimum Fe contents yielding the highest activity were found to be 10% and 5% for CP and SCS catalysts, respectively. The surface area and morphology showed a moderate effect on catalyst activity, because catalytic soot oxidation involves solid–solid contact. More importantly, regardless of the fabrication method, it was found that Ce3+ content, which is closely related to oxygen vacancies, plays the most important role in affecting the catalyst activity.
1. Introduction
Particulate matters or PM (consisting primarily of soot) can cause serious environmental and health problems, such as lung cancer [1,2,3]. Particulate matters or PM emission can be controlled by processing the exhaust gas through a diesel particulate filters (DPF). DPF with a monolithic geometry have been used to capture and oxidize fine carbon particles [4]. The desired temperature of soot combustion is above 600 °C, but the temperature of exhaust gas is around 200–500 °C [5,6,7]. It is necessary to introduce catalysts to effectively decrease the soot oxidation temperature and improve the reactor efficiency. Usually, the catalyst is coated on the monolith wall of the DPF [4,5,6,7,8,9,10,11]. After a period of soot deposition, a pressure drop may occur through the DPF, making it necessary to regenerate the DPF periodically [11].
The desired catalysts for soot oxidation should have high activity and suitable stability but low cost, which makes ceria-based catalyst particularly attractive [12,13,14,15]. Ceria-based catalysts have been applied on DPF to study their catalytic activity for soot oxidation [16,17,18,19]. Ceria has been found to act as an active oxygen producer to promote the formation of reactive oxygen species and transfer them to soot-catalyst interface to oxidize soot, which is described in the active oxygen-assisted oxidation mechanism [12,15]. The oxygen species can be transferred between the oxidized state Ce4+ and reduced state Ce3+ [1,2,20,21,22], thus forming oxygen vacancies through Ce4+ to Ce3+ reduction, and adsorbing gaseous oxygen via Ce3+ to Ce4+.
The activity of ceria-based catalysts can be further improved through doping other metal additives into the ceria lattice, in order to enhance the oxygen storage capability (OSC) and oxygen mobility [15,22]. Transition metal doping has been reported to produce more active sites over the catalyst surface and promote catalytic soot oxidation [20,23,24,25]. Iron, in particular, is prominent because it can improve the catalyst activity due to its good redox ability—the oxygen species can alternate between Fe3+ and Fe2+ [2,15,26]. The mechanism of iron-doped ceria catalysts has been investigated by Zhang et al. [20], indicating that the redox cycle of iron played an important role in this reaction. Fe3+ can provide its bonded active oxygen to oxidize soot, along with its reduction to Fe2+. Fe2+ can then be re-oxidized to Fe3+ with the interaction of Ce [15,20]. The number of active Fe-O-Ce sites can vary due to different ratios of iron doping, as iron doping can distort the fluorite lattice and create oxygen vacancies to varying degrees. Thus, the ratio of iron doping in ceria affects the catalyst activity and need be optimized with reaction conditions.
As the catalytic soot oxidation is a surface sensitive reaction, the contact points between soot and catalyst particles have a great impact on activity [1]. Nano-sized materials result in a high surface-to-volume ratio and make their chemical and physical properties more size and shape dependent [27,28,29]. More specifically, the quantum size effects and higher surface areas make these nanostructured catalysts possess more potential contact points between soot and catalyst particles while their meso-scale pores (with diameters between 2 and 50 nm) can promote the oxygen diffusion through catalysts [27]. To enhance the interactions between soot and catalyst, different morphologies of ceria-based catalysts have been fabricated by several preparation methods [30,31,32,33,34,35,36]. It is found that different morphologies exhibit distinct catalytic activity, which is strongly dependent on their physical and chemical surface properties [15]. Among these preparation methods, the co-precipitation (CP) method has been widely used for catalyst preparation due to the formation of higher surface area and smaller crystal size [20]. Alternatively, solution combustion synthesis (SCS) is a time effective and energy saving method to produce nano-sized porous catalysts [37]. Herein, these two preparation methods have been chosen in this study to investigate the morphologies influence on catalyst activity.
Different iron doping ratios and morphologies would change the surface properties and oxygen vacancies of catalysts, which has influence on catalyst activity [38]. Kattal et al. found that increasing oxygen vacancies induces more active oxygen for CeO2-La2O3 catalyst for soot oxidation [39]. MnOx-CeO2 mixed oxides were also investigated for soot oxidation, while it was suggested that an improved mobility and transformation of oxygen vacancies both promote the catalyst activity [40]. Another study using Ag-CeO2 catalysts showed that an approprite Ag incorporation (5% wt.%) in CeO2 is cruicial in creating surface oxygen vacancies and helps O2− generation [41]. By contrast, an investigation of ZrOx-CeO2 catalyst revealed that formation of excessive surface oxygen vacancies hardly benefits the soot oxidation under low concentrations of O2 (1% O2/N2 at 500 mL/min), because of the production of low active O2− sites [42]. The above-mentioned studies showed a relation between oxygen vacancy and catalyst activity. However, the effect of oxygen vacancy on soot oxidation by altering the catalyst morphologies along with different Fe doping ratios is still poorly understood. Therefore, this study aims at investigating the role of oxygen vacancy on catalyst activity through varying the Fe doping ratio and tailoring the catalyst morphology.
2. Results and Discussion
2.1. Characterization
The crystal structure of all catalysts was studied by X-ray powder diffraction (XRD). The XRD patterns of iron-doped cerium oxide catalysts prepared by SCS and CP methods are depicted in Figure 1. The main diffraction peaks could be attributed to (111) (200) (220) (311) (222) (400) (331) (420) planes, referring to a typical face-centered cubic fluorite structure matching the spectra for pure cerium oxide (JCPDS NO. 34-0394) [43]. The characteristic peaks shifted to higher 2 diffraction angle with iron doping, and no peaks of Fe2O3 were observed, suggesting the uniform incorporation of iron into cerium oxide lattice and the formation of solid solution, thus the catalyst could be represented by FexCe100−x [2,26,39,44,45]. Arguably, Aneggi et al. [46] reported that it was possible that only a small amount of Fe dissolves into the ceria lattice. Barbato et al. [47] found that Fe2O3 could be encapsulated by ceria, making it undetectable by XRD. Further investigation on the exact formulation of the iron-doped ceria catalyst is needed. The absence of characteristic peaks of iron oxide could also result from the absence of iron oxide on the surface or from the crystal being too small to be detected by XRD.
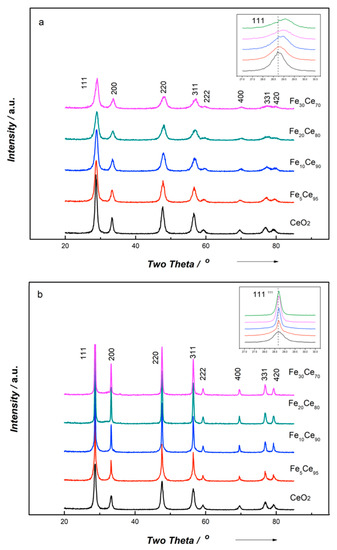
Figure 1.
Powder X-ray diffraction patterns of (a) the co-precipitation method and (b) the solution combustion synthesis method.
The textural properties of the catalysts are listed in Table 1; the crystal size was calculated using the Scherrer equation, while the unit lattice parameter was calculated by Bragg’s law using the strongest peak (111). From Table 1, it is clear that CP catalysts lead to smaller crystal size than for SCS catalysts. In addition, compared to pure ceria, iron doping results in smaller crystal size for CP catalyst, but a much higher crystal size for SCS catalyst. Table 1 also shows that the lattice parameter slightly decreases with more iron doping. This is because of the smaller iron atoms (Fe3+-0.64 Å, Fe2+-0.74 Å) substituting larger ceria sites (0.97 Å) in the lattice to form Ce-Fe-O solid solution [26]. These results also indicated the incorporation of iron into ceria lattice.

Table 1.
Textural properties of as-derived catalysts.
As shown in Table 1, catalysts made using the CP method reveal a higher surface area than those made by the SCS method. Fe10Ce90-CP and Fe5Ce95-SCS yielded the highest specific surface area within their preparation method, and Fe10Ce90-CP showed the largest surface area (94 m2g−1) among them all. Accordingly, the introduction of iron enlarged the surface area of the CP catalyst. For SCS catalysts, only 5% iron doping showed slight increase of surface area compared to pure CeO2, but other ratios of doping led to a surface area decrease. It was also noticed that the surface area greatly dropped with greater than 20% iron doping, especially for the SCS method. The pore diameters of both CP and SCS catalysts are around 3–5 nm.
Scanning electron microscopy (SEM) was performed to explore the surface morphologies of catalysts. In Figure 2, both pictures clearly show the nanoparticle morphologies: the CP method produced uniform spherical morphology with some agglomeration, while the catalyst made by the SCS method reported a spongy structure. The spherical morphology for the CP method was a result of the precipitants’ nucleation, and these small particles yielded a higher surface area. The foamy and highly porous spongy structure is a more unpredictable structure than that made from the SCS method, which was due to the combustion procedure, in which the reacting precursor releases lots of gaseous products in a short time. Moreover, these bigger openings got from this morphology can be large enough (around 250 nm diameter) for soot particles (typical size around 25 nm) to penetrate, thus creating more contact points between soot and catalyst particles.
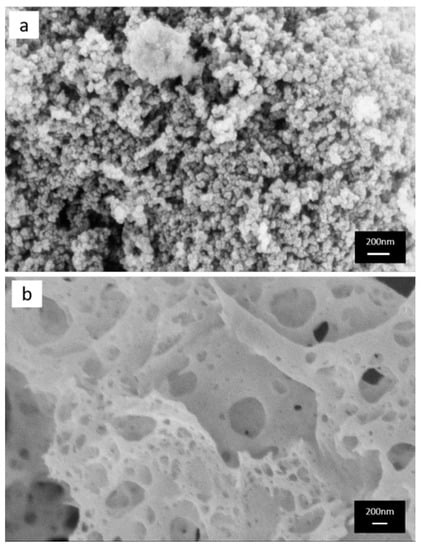
Figure 2.
FE-SEM images of (a) the co-precipitation method and (b) the solution combustion synthesis method.
X-ray photoelectron spectroscopy (XPS) analysis was undertaken to study the surface properties of catalysts in terms of their oxidation state and surface oxygen vacancies. Figure 3 shows the Ce 3d spectra of all catalysts. The Ce 3d spectra could be curve-fitted into eight peaks corresponding to the spin-orbit splitting of Ce 3d5/2 and Ce 3d3/2, which were labelled as “u” and “v”, respectively [48]. The peaks labelled as v0, v2, v3, u0, u2, u3, with binding energy (BE) around 882, 888, 898, 900, 907, 916 eV, correspond to the Ce4+ species, and peaks labelled as v1, u1, with binding energy of 884 and 902 eV, are ascribed to Ce3+ species. The analysis of XPS spectra suggested that Ceria existed as both Ce3+ and Ce4+, but primarily in Ce4+ state. When Ce4+ transferred to Ce3+, oxygen vacancies associated with Ce3+ could be generated to potentially adsorb oxygen and provide it for soot oxidation. Therefore, the existence of Ce3+ becomes important to indicate the generation of oxygen vacancies [2,26]. The calculations of integrated peak areas were used to get a quantitative analysis of a selected element. In this way, the ratio of Ce3+ area to total area including Ce3+ and Ce4+ was applied to estimate the ratio of Ce3+; the results are given in Table 2. From Table 2, all Ce3+ percentages are around 20%, CP catalysts are between 19–25%, and SCS catalysts are between 17–27%. Ce3+ content has a similar trend for both CP and SCS catalysts, which is that Ce3+ goes up to a maximum value and then goes down. The maximum Ce3+ value for CP catalysts is 24.9% with 10% iron doping, and is 27.1% with 5% iron doping for SCS catalysts. Among all catalysts, Fe5Ce95-SCS gives the highest Ce3+ percentage, higher than Fe10Ce90-CP. Therefore, it can be deduced that Fe5Ce95-SCS has the highest concentration of oxygen vacancies.
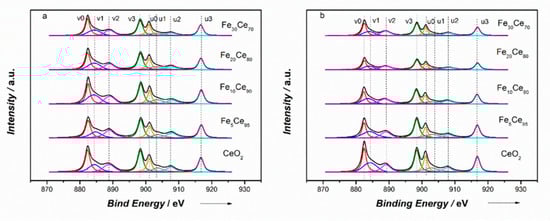
Figure 3.
XPS spectra of Ce3d: (a) Co-precipitation method, (b) solution combustion synthesis method.
Table 2.
Curve fitting results of Ce3d and O1s on obtained catalysts.
The Fe 2p spectra in Figure 4 show the characteristic Fe 2p3/2 and Fe 2p3/1 peaks at binding energy of 711 and 724 eV, respectively. Two satellites peaks at 718 and 733 eV can be slightly distinguished. These peaks indicate the existence of Fe3+. The binding energy of Fe 2p decreased with more iron doping, further confirming that the Fe3+ was incorporated into CeO2 lattice and formed a solid solution, as shown by the XRD results.
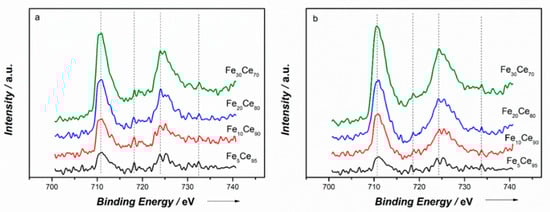
Figure 4.
XPS spectra of Fe2p: (a) Co-precipitation method, (b) solution combustion synthesis method.
The O1s spectra showed two distinct peaks in Figure 5. The peak at higher binding energy (531.7 eV) referred to the surface oxygen species , and the peak at lower binding energy (529.5 eV) is attributed to the lattice oxygen [33]. As Fe is added into CeO2, the main peak shifted to higher binding energy, suggesting the chemical environment of lattice oxygen changed due to the incorporation of Fe [49]. The surface oxygen species are critical for soot oxidation because they can become active and react with soot particles. The ratio of surface oxygen concentration to lattice oxygen concentration can be estimated by the integrated peak areas of and , and the results are shown in Table 2. For the CP method, percentage-/ + ) increased to a maximum point (37.5%) at 10% iron doping, and then decreased. SCS catalysts showed similar behavior, where it reached a maximum value (39.0%) at 5% iron doping. Fe5Ce95–SCS led to the highest surface oxygen concentration. These results agree well with concentration percentage of Ce3+.
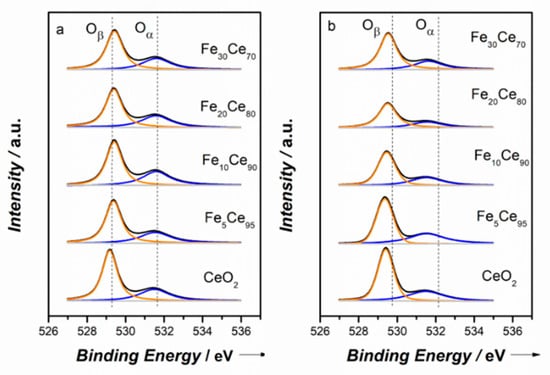
Figure 5.
XPS spectra of O1s: (a) Co-precipitation method, (b) solution combustion synthesis method.
Raman spectroscopy was conducted to study the oxygen vacancies and active sites within the catalysts. Figure 6 shows the Raman spectra of FexCe100−x catalysts made by CP and SCS methods. The prominent band at ~463cm−1 could be assigned to the first-order scattering F2g symmetric oxygen active mode around Ce4+ with a CeO2 fluorite structure [50], which is in agreement with the XRD and XPS results. All catalysts’ spectra are identical to that of pure CeO2, further indicating that iron has been incorporated into the CeO2 lattice. Compared to the Raman spectra of pure CeO2, the F2g band shifted to lower frequency and broadened with an increase in iron doping, suggesting the lattice distortion is due to the incorporation of iron into CeO2 fluorite lattice [35]. The intensity (I) of the Raman spectra decreased with increasing iron doping, indicating the structure change due to Fe incorporation and lower ceria content [26]. No peaks of Fe2O3 were observed, which is possibly due to the much weaker bands of Fe2O3 than CeO2 and the formation of solid solution. Two weak bands at 261 and 596 cm−1 were characteristic bands of second order scattering, which can represent the oxygen vacancies in the lattice [20]. The low intensity of oxygen vacancies showed in Raman spectra was because the sample was not outgassed, the intensity would be higher if the sample was outgassed at high temperature [44].
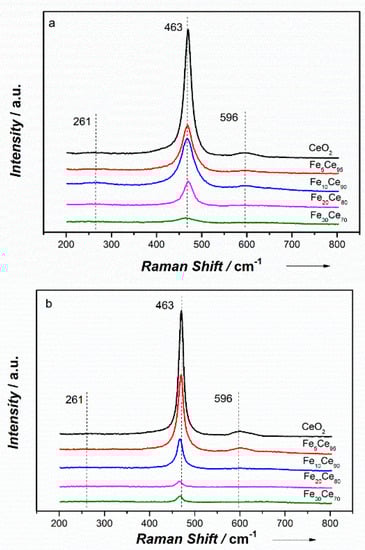
Figure 6.
Raman spectra of (a) the co-precipitation method (b) the solution combustion synthesis method.
The 596 cm−1 band exhibits the oxygen vacancies caused by Ce3+; thus, the value of I596/I463 (as shown in Table 2) becomes important to evaluate the oxygen vacancies or amount of defects in the catalysts. Catalysts made by the two methods (CP and SCS) showed similar trend of I596/I463 with increasing iron content; that is, increase first until a maximum is reached, and then drop down. This is because Fe prefers to occupy Ce sites in CeO2, and thus the oxygen vacancy concentration increases with more Fe doping. However, when the amount of Fe exceeded a critical value, Fe becomes interstitial in CeO2 lattice, thus decreasing oxygen vacancy concentration [51]. The results showed that Fe10Ce90-CP and Fe5Ce95-SCS reached optimum I596/I463 value within their preparation method. Fe5Ce95-SCS obtained the maximum I596/I463 value, indicating the highest oxygen vacancies.
Temperature-programmed reduction with hydrogen (H2-TPR) was applied to investigate the catalysts’ reducibility. Figure 7 shows the overall TPR results for catalysts with different iron contents prepared by CP and SCS methods. Figures S1 and S2 in Supplementary Data show the deconvoluted TPR results for CP and SCS catalysts. Four peaks were identified in Figure 7, and represent the reductions of (1) surface oxygen of ceria, (2) Fe2O3 to Fe3O4, (3) Fe3O4 to FeO, and (4) bulk oxygen of ceria. The Supplementary Data also includes the amount of H2 which was used for each of the four reduction processes.
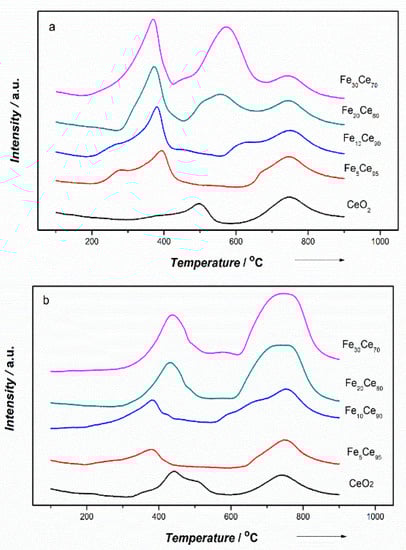
Figure 7.
H2-TPR results of (a) the co-precipitation method and (b) the solution combustion synthesis method.
The trends corresponding to the reduction of surface oxygen of ceria (for these peaks at the lowest temperature) are similar for CP and SCS catalysts. Addition of 5% iron in ceria significantly shifts the reduction peak to a lower temperature: from 450–480 °C for pure ceria to 300–320 °C for Fe-ceria catalysts. However, Fe content beyond 5% has little effect on peak shifting for either catalyst. These peaks, corresponding to the reduction of bulk oxygen in ceria, do not show a clear temperature shift when the Fe content is increased in both CP and SCS catalysts, remaining at about 750 °C. The comparison between these effects of Fe doping on shifting the reduction temperatures of two different catalysts likely indicates, adding iron in ceria (of both CP and SCS catalysts) changes the activity of surface oxygen, rather that of the bulk oxygen, more significantly.
The reduction of Fe2O3 to Fe3O4 shows no peak shifting (located at 375 °C) when the Fe content increases to 10% for either the SCS or CP catalysts. For Fe content beyond 20%, the peak shifts to a higher temperature (~450 °C) for the SCS catalyst, whereas it remains at about 375 °C for the CP catalyst. Finally, the most important difference between these two catalysts exists during the reduction of Fe3O4 to FeO. For the SCS catalyst, the peak for this reduction process remains at 670–700 °C, irrespective of the Fe content. However, a peak shift towards a lower temperature occurs with increasing the Fe content for the CP catalyst, i.e., ~670 °C (similar to SCS) for the 5% Fe, ~625 °C for the 10% Fe, and 550–575 °C for the 20 and 30% Fe, respectively. In summary, the effects of Fe doping on the reduction of iron oxides are more significant when the Fe content is greater than 20%. During the catalyst fabrication, at a low Fe content (<10%), Fe is most likely present in a solid solution of ceria, whereas at a high Fe content (>20%), Fe atoms can aggregate and lead to the formation of iron oxides.
In Tables S1 and S2 of the Supplementary Material, the total amount of H2 consumption increases when the Fe content increases, from ~1 mmol/g for pure ceria to ~3 mmol/g for the 30% Fe. Notably, the increased H2 consumption results from the increasing contributions of these two iron oxide reductions, which account for more than 70% of the total H2 consumption for the Fe content beyond 20%. It is noteworthy that single-phase iron oxides were not observed by XRD. This may be attributed to the formation of a very limited amount of iron oxides in the catalyst. In addition, the XRD spectrometer used in this study is more efficient for detecting catalyst surface properties. Iron oxides distributed in the bulk ceria catalyst are hard to identify. Herein, for a higher ratio of iron doping, the CP catalysts could have a co-existence of solid solution and aggregated iron oxide phases. However, for the SCS catalysts, no reduction peaks of iron oxides were observed, which is likely due to the absence of iron oxide or a limited amount of iron oxide.
2.2. Activity Study
Thermogravimetric analysis (TGA) experiments were carried out to investigate the catalyst activity for soot oxidation. Tight contact conditions were used to study the influence of iron doping ratio and morphology on catalyst activity. The result of soot conversion as a function of temperature is shown in Figure 8. Tight contact condition was used to explore the intrinsic activity of the catalysts because soot and catalysts were ground together to produce more contact points [22]. The activity of the catalyst was evaluated by the ignition temperature (T10) and combustion temperature (T50). T10 and T50 for tight contact conditions are summarized in Table 3. For comparison, non-catalytic soot oxidation was also conducted at the same reaction conditions.
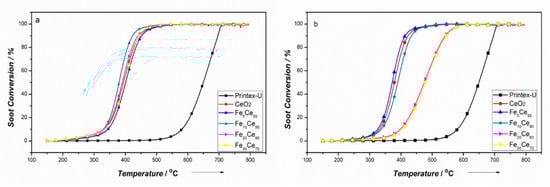
Figure 8.
Soot conversion of tight contact condition: (a) Co-precipitation method, (b) solution combustion synthesis method.
Table 3.
T10 and T50 for catalysts in tight contact condition.
From Figure 8, it is obvious that soot oxidation temperatures decreased significantly when adding catalyst compared to non-catalytic soot oxidation. Different iron doping ratios and morphologies have distinct effects on catalyst activity. CP and SCS catalysts showed similar trend of T10 and T50 with different iron doping ratio, which decreased first to a threshold then began to increase. The minimum temperature in T10 and T50 for CP catalysts are T10~328 °C and T50~378 °C with 10% iron doping, and for SCS catalysts, they are T10~324 °C and T50~372 °C with 5% iron doping. It is noted that when doping ratio exceeded 20% for SCS catalysts, the catalyst activity greatly reduced (decreased by about 70 °C). Comparing CP to SCS catalysts, it is interesting to find that SCS catalyst performed better than CP catalyst with low Fe doping (<5%) despite their lower surface area. However, this situation changed when Fe content increased from 10% to 30%, CP catalysts became better performing than SCS catalysts of the same composition. This makes the surface area not the determining factor for catalytic soot oxidation. Although this reaction is surface sensitive, what matters most is the contact between solid soot and catalyst particles, making the available surface for contact points become important. As seen from Table 1, the pore size of CP and SCS catalysts are around 3–5 nm, which is too small for soot particles (around 25 nm) to go through. Although SCS catalysts had a spongy structure with lower surface area, many openings (~250 nm) resulted from the combustion process could easily let soot particles penetrate in to increase the contact points and possibly provide more adsorbed oxygen to the contact points and facilitate the oxygen diffusion through the catalyst [22]. However, when the iron content exceeds 20%, the Brunauer–Emmett–Teller (BET) surface area for SCS catalysts degrade significantly (only 2–3 m2g−1). This makes the available contact points become very limited, resulting in a reduced activity performance.
XRD results showed that Fe was successfully incorporated into CeO2 lattice for both CP and SCS catalysts. For CP catalysts, the crystal size decreased with introduction of iron, implying that iron incorporation could inhibit crystal growth. In this way, the smaller crystal size and higher surface area can benefit oxygen diffusion and increase contact points. On the contrary, XRD pattern showed that crystal size grew with more Fe doping for SCS catalysts. Crystal growth can be an obstacle for good catalytic performance. The spherical structure of CP catalysts (shown in SEM image), resulting from the nucleation of the precipitates, can explain their higher surface area.
XPS results indicate that 10%-CP and 5%-SCS iron doping had the highest Ce3+ and Oα ratios on the surface among their own preparation method, which meant that the oxygen vacancies were maximized at these ratios. The trend of Ce3+ and Oα ratio follows the trend of T10 and T50, and hence follows the catalyst activity. Raman results and I596/I463 values further confirmed oxygen vacancies, and Fe10Ce90-CP and Fe5Ce95-SCS showed the highest oxygen vacancies within their own preparation method. Figure 9 shows the relation between Ce3+ percentage and T10, T50. It is noticed that the activity (trough T10 and T50) is really directly dependent on Ce3+, irrespective of the preparation method. The ratio of Ce3+ can represent the availability of oxygen vacancies [50], as it is reported that higher Ce3+ concentrations indicate more oxygen vacancies on the catalyst surface [15,36,38]. Therefore, oxygen vacancies on the surface is found to be the determining factor for catalyst activity. With more Ce3+ or oxygen vacancy concentration, both T10 and T50 decreased in a similar fashion. Figure 9 shows that there is a threshold of around 20% Ce3+, below which the catalyst activity rapidly deteriorates with further decreasing Ce3+ content, as indicated by the sharp drops in T10 and T50 at low Ce3+ content (T50: 476 to 393 °C). The samples with low Ce3+ also correspond to the lowest BET surface area (2–3 m2g−1), which could also contribute to the lower activity. However, because the catalytic soot oxidation involves contact between two solids, the BET surface area is less likely to play the most important role. Thus, the lower activities associated with Fe20Ce80-SCS and Fe30Ce70-SCS are attributed more to the low Ce3+ content than the low BET surface area. Above 20% Ce3+, T10 and T50 would still decrease with increasing Ce3+ content, but at a much-reduced rate (T50: 393 to 372 °C). This meant that Ce3+ content, and hence oxygen vacancy, has a great influence on catalyst activity. More oxygen vacancies facilitate adsorbing more oxygen species from gaseous oxygen, which then diffuse through the crystalline structure to the contact point between soot and catalyst and oxidize soot. Due to the presence of Ce3+ and Ce4+, the reaction proceeds through redox mechanism. According to the mechanism study by Zhang et al. [20] redox cycle between Fe2+ and Fe3+ also participates in this soot oxidation and formed Fe-O-Ce bond, suggesting a synergetic effect of Fe and Ce interaction. When Fe3+ provided one O to oxidize soot, Fe3+ became Fe2+. The Ce4+ on the neighboring site can supply one O to Fe2+, changing it to Fe3+ through the reduction of Ce4+ to Ce3+. Then adsorbing one O from bulk could oxidize Ce3+ to Ce4+ again. The oxygen species are transferred within the catalyst lattice to reach the interface between soot and catalyst. The as-derived catalysts have different crystal structures due to various ratios of iron doping, which can cause lattice distortion and surface defects, thus changing the bond between Ce and O and creating some oxygen vacancies on the catalyst surface. This is the reason certain ratios of iron doping can improve the catalyst activity.
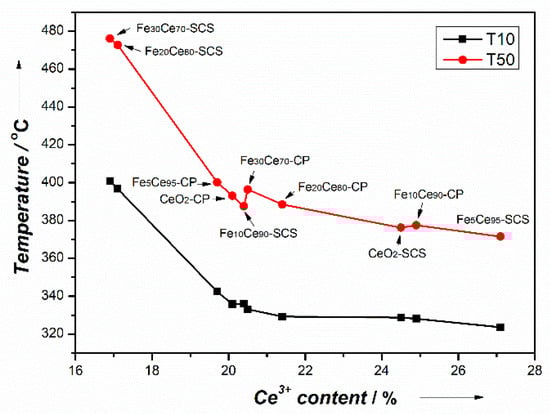
Figure 9.
Relation between Ce3+ percentage and T10, T50.
H2-TPR results showed that 10%-CP and 5%-SCS led to the highest reducibility and, therefore, the highest activity, which is in agreement with XPS and Raman results. For SCS catalysts with iron doping, more bulk oxygen becomes releasable and can be more easily transferred to surface oxygen and oxidize soot. This makes the diffusion of bulk oxygen very important for SCS catalysts. However, for CP catalysts, the bulk oxygen reduction peaks were almost unchanged, implying that the Fe doping does cannot influence the bulk oxygen reduction.
Herein, the different activities of the as-produced catalysts were due to their different morphologies, lattice distortion and changed surface properties based on various iron doping. When the Fe doping ratio was lower than 5%, SCS catalysts showed better activity towards soot oxidation regardless of their low BET surface area. This is due to their porous structure, high surface oxygen vacancy concentration and better reducibility of surface oxygen. However, when the Fe doping ratio exceeds 10%, CP catalyst performed better, which can be attributed to their relative higher surface oxygen vacancies.
3. Materials and Methods
3.1. Preparation of the Catalysts
FexCe100−x-CP (x = 5; 10; 20; and 30 in percent of molar ratio) catalysts were synthesized by co-precipitation (CP). A stoichiometric solution of iron nitrate nonahydrate (Sigma-Aldrich, CAS: 7782-61-8, 99.95% trace metals basis) and cerium nitrate hexahydrate (Sigma-Aldrich, Saint Louis, MO, USA, CAS: 10294-41-4, 99.999% trace metals basis) were dissolved separately in deionized water, then mixed together with vigorous agitation. The aqueous ammonia (Sigma-Aldrich, CAS:1336-21-6, 28–30% NH3 basis) was then gradually dropped into the above-mentioned solution under stirring conditions until pH reached 8.5, after which the solution was aged in air for one day at room temperature with constant stirring. The resultant precipitates were separated by vacuum filtration with three washes with deionized water. The obtained precipitates were dried at 100 °C for 12 h and then calcined at 500 °C for 5 h in static air. For comparison, pure cerium oxide-CeO2 was prepared using a similar procedure.
FexCe100−x-SCS (x = 5; 10; 20; and 30 in percent of molar ratio) catalysts were obtained by solution combustion synthesis (SCS). An aqueous solution of iron nitrate nonahydrate (Sigma-Aldrich, CAS: 7782-61-8, 99.95% trace metals basis), cerium nitrate hexahydrate (Sigma-Aldrich, CAS: 10294-41-4, 99.999% trace metals basis) and glycine (Sigma-Aldrich, CAS: 56-40-6) in a stoichiometric ratio was prepared under vigorous stirring at 90 °C to form the gel. Then, the gel was combusted on a heating plate. The combustion procedure is very fast, producing fine powders. The resultant sample was then calcined at 500 °C for 5 h. CeO2-SCS catalyst was developed using a similar procedure. The Fe content was examined using EDX (Energy-dispersive X-ray spectroscopy), and the results are shown in Table 4.
Table 4.
Fe contents for the 5 and 10% catalysts as determined from EDX.
3.2. Characterization of the Catalysts
X-ray powder diffraction (XRD) analysis was performed on X-ray powder diffractometer (German Bruker D4 (40 kV, 30 mA), Billerica, MA, USA, with position-sensitive detector and CuKα radiation). The XRD patterns were recorded in steps of 0.01° with a scanning rate of 5°/min from 5° to 85°. The diffraction peaks were indexed according to the Powder Data File database (PDF 2004, International Centre of Diffraction Data, Pennsylvania).
The surface area was measured by means of N2 adsorption-desorption isotherms using Beishide 3H-2000PS2 static volumetric method analyzer (Beijing, China). The surface areas of catalysts were evaluated by Brunauer-Emmett-Teller (BET) method.
The morphologies, microstructures and elemental composition of the obtained catalysts were characterized by a Field-emission scanning electron microscope (FE-SEM, Zeiss MERLIN with Gemini-II column).
X-ray photoelectron spectroscopy (XPS) measurements were carried out on ESCALab220i-XL electron spectrometer (VG Scientific Ltd., Loughborough, UK) with 300 W AlKα X-ray source equipment to investigate the oxidation states of cerium and iron, and availability of oxygen on catalyst surface. The calibration of binding energies was conducted by using C1s peaks at 284.8 eV. Spectra-fits were performed with Gaussian-Lorentzian functions by using CasaXPS software.
The Raman spectra of the catalysts were measured on a Renishaw InVia micro laser Raman spectrometer (Renishawplc, Wottonunder-Edge, UK) with a 4 mW Ar+ laser source (λex = 532 nm) with a cooled CCD detector at room temperature to differentiate chemical structures. The acquisition time was 60s and the scanning range was 100–800 cm−1.
Temperature-programmed reduction with H2 (H2-TPR) experiments was carried out to study the reducibility of the catalyst by using a Micromeritics Autochem II 2920 analyzer (Norcross, GA, USA) with a thermal conductivity detector (TCD). 30 mg catalyst was first pre-treated at 150 °C for 1 h under 40 mL/min N2 flow to remove water and other contaminants and then cooled down to room temperature. TPR analysis was conducted by heating up the sample to 1000 °C at 10 °C /min in a flow of 40 mL/min 10% H2/Ar.
3.3. Catalytic Activity Tests
Thermogravimetric analysis (TGA) of catalytic soot oxidation was conducted on a TA Instrument Q500 apparatus to investigate catalytic activity. Printex-U carbon black (Chicago, IL, USA), with particulate size of 25 nm and 100 m2g−1 surface area, was used as a model of soot. Tight contact conditions of mixed sample were obtained by grinding soot and catalyst with a weight ratio of 1:9 in an agate mortar for 10 min. For each TGA test, a weighted amount of 10 mg sample was pre-treated at 150 °C under 60 mL/min Nitrogen for 30 min to remove water and other contaminants. Then, the sample was heated up to 800 °C under 40 mL/min air with a heating rate of 10 °C /min. The thermogravimetric curves were obtained by continuously recording the mass change, along with increased temperature. Each TGA test was repeated three times to ensure the repeatability of the results. The activity of catalyst was evaluated by T10 and T50. T10 is commonly used as the ignition temperature, which is the temperature at 10% conversion of soot [1,20,22,52]. T50 is the combustion temperature, identified as the temperature when 50% of soot is oxidized [1,2,22,52].
4. Conclusions
Distinct morphologies of iron-doped ceria catalyst with different Fe doping ratios were prepared by co-precipitation and solution combustion methods, for catalyzing soot oxidation. It was confirmed by XRD that iron was incorporated in the cerium oxide lattice, although a limited amount of iron oxides may exist in the catalyst. The main conclusions of this study are:
- Irrespective of the fabrication method, the most important parameter that dictates the reaction activity (e.g., T50) is the Ce3+ content, which is closely related to the content of oxygen vacancies.
- The activity increases notably when Ce3+ content increases up to 20% (T50 from 476 °C at 17% Ce3+ down to 393 °C at 20% Ce3+). Above 20% Ce3+ content, the activity increases moderately (T50 of 372 °C at 27% Ce3+).
- For both fabrication methods, there is an optimum Fe content that gives the highest activity. For SCS catalyst, the optimum Fe content is 5%, and for CP catalyst, it is 10%.
- The pore size is mostly about 3–5 nm (both CP and SCS), which is much smaller than the 25 nm soot particles used here. This is why, although the BET surface area is greater for CP than SCS, it has only moderate effect on the activity.
- The catalyst preparation method has a profound impact on the catalyst morphology. The CP catalyst shows a dense spherical morphology, whereas the SCS catalyst has a spongy structure with large openings, around 250 nm, which can be large enough for soot particles to penetrate in and contact with the catalyst. Therefore, it can be anticipated that more soot particle can deposit on the SCS catalyst.
Supplementary Materials
The following materials are available online at https://www.mdpi.com/2073-4344/9/10/815/s1, Figure S1: Deconvoluted TPR results for CP catalysts, Figure S2: Deconvoluted TPR results for SCS catalysts, Table S1: H2 consumption of CP catalysts, Table S2. H2 consumption of CP catalysts.
Author Contributions
B.L. prepared the samples, conducted the experiments, analyzed the data and wrote this paper. J.Z.W. and E.C. led and oversaw the University of Waterloo part of this work-specifically the catalyst fabrication and experiments. A.R. provided initial consultants.
Funding
This research was funded by Natural Sciences and Engineering Research Council of Canada (NSERC) and BioFuelNet Canada.
Acknowledgments
The authors would thank the Key Laboratory of Coal Science and Technology at Taiyuan University of Technology for helping characterize the catalysts using Raman and H2-TPR spectroscopy.
Conflicts of Interest
The authors declare no conflict of interest.
References
- Andana, T.; Piumetti, M.; Bensaid, S.; Russo, N.; Fino, D.; Pirone, R. Nanostructured ceria-praseodymia catalysts for diesel soot combustion. Appl. Catal. B Environ. 2016, 197, 125–137. [Google Scholar]
- Venkataswamy, P.; Jampaiah, D.; Rao, K.N.; Reddy, B.M. Nanostructured Ce0.7Mn0.3O2−δ and Ce0.7Fe0.3O2−δ solid solutions for diesel soot oxidation. Appl. Catal. A Gen. 2014, 488, 1–10. [Google Scholar]
- Soler, L.; Casanovas, A.; Escudero, C.; Pérez-Dieste, V.; Aneggi, E.; Trovarelli, A.; Llorca, J. Ambient Pressure Photoemission Spectroscopy Reveals the Mechanism of Carbon Soot Oxidation in Ceria-Based Catalysts. ChemCatChem 2016, 8, 2748–2751. [Google Scholar]
- Bueno-López, A. Diesel soot combustion ceria catalysts. Appl. Catal. B Environ. 2014, 146, 1–11. [Google Scholar]
- Fino, D.; Bensaid, S.; Piumetti, M.; Russo, N. A review on the catalytic combustion of soot in Diesel particulate filters for automotive applications: From powder catalysts to structured reactors. Appl. Catal. A Gen. 2016, 509, 75–96. [Google Scholar]
- Neyertz, C.A.; Banus, E.D.; Miró, E.E.; Querini, C.A. Potassium-promoted Ce0.65Zr0.35O2 monolithic catalysts for diesel soot combustion. Chem. Eng. J. 2014, 248, 394–405. [Google Scholar] [CrossRef]
- Oi-Uchisawa, J.; Obuchi, A.; Wang, S.; Nanba, T.; Ohi, A. Catalytic performance of Pt/MOx loaded over SiC-DPF for soot oxidation. Appl. Catal. B Environ. 2003, 43, 117–129. [Google Scholar]
- Neeft, J.P.A.; Makkee, M.; Moulijn, J.A. Diesel particulate emission control. Fuel Process. Technol. 1996, 47, 1–69. [Google Scholar] [CrossRef]
- Burch, R. Knowledge and Know-How in Emission Control for Mobile Applications. Catal. Rev. 2004, 46, 271–334. [Google Scholar] [CrossRef]
- Russell, A.; Epling, W.S. Diesel Oxidation Catalysts. Catal. Rev. 2011, 53, 337–423. [Google Scholar]
- Eastwood, P. Critical Topics in Exhaust Gas Aftertreatment; Publisher: Washington, DC, USA, 2000. [Google Scholar]
- Bueno-López, A.; Krishna, K.; van der Linden, B.; Mul, G.; Moulijn, J.A.; Makkee, M. On the mechanism of model diesel soot-O2 reaction catalysed by Pt-containing La3+-doped CeO2: A TAP study with isotopic O2. Catal. Today 2007, 121, 237–245. [Google Scholar] [CrossRef]
- Nagai, Y.; Hirabayashi, T.; Dohmae, K.; Takagi, N.; Minami, T.; Shinjoh, H.; Matsumoto, S. Sintering inhibition mechanism of platinum supported on ceria-based oxide and Pt-oxide–support interaction. J. Catal. 2006, 242, 103–109. [Google Scholar] [CrossRef]
- Wei, Y.; Zhao, Z.; Liu, J.; Xu, C.; Jiang, G.; Duan, A. Design and Synthesis of 3D Ordered Macroporous CeO2- Supported Pt@CeO2-δ Core-Shell Nanoparticle Materials for Enhanced Catalytic Activity of Soot Oxidation. Small 2013, 9, 3957–3963. [Google Scholar] [CrossRef] [PubMed]
- Liu, S.; Wu, X.; Weng, D.; Ran, R. Ceria-based catalysts for soot oxidation: A review. J. Rare Earths 2015, 33, 567–590. [Google Scholar] [CrossRef]
- López-Haro, M.; Pérez-Omil, J.; Hernández-Garrido, J.; Trasobares, S.; Hungría, A.; Cíes, J.; Midgley, P.; Bayle-Guillemaud, P.; Martínez-Arias, A.; Bernal, S. Advanced Electron Microscopy Investigation of Ceria–Zirconia-Based Catalysts. ChemCatChem 2011, 3, 1015–1027. [Google Scholar] [CrossRef]
- Kopelent, R.; van Bokhoven, J.A.; Szlachetko, J.; Edebeli, J.; Paun, C.; Nachtegaal, M.; Safonova, O.V. Catalytically active and spectator Ce3+ in ceria-supported metal catalysts. Angew. Chem. Int. Ed. 2015, 54, 8728–8731. [Google Scholar] [CrossRef]
- Shelef, M.; McCabe, R. Twenty-five years after introduction of automotive catalysts: What next? Catal. Today 2000, 62, 35–50. [Google Scholar] [CrossRef]
- Heck, R.M.; Farrauto, R.J. Automobile exhaust catalysts. Appl. Catal. A Gen. 2001, 221, 443–457. [Google Scholar] [CrossRef]
- Zhang, Z.; Han, D.; Wei, S.; Zhang, Y. Determination of active site densities and mechanisms for soot combustion with O2 on Fe-doped CeO2 mixed oxides. J. Catal. 2010, 276, 16–23. [Google Scholar] [CrossRef]
- Setiabudi, A.; Chen, J.; Moulijn, J.A.; Mul, G.; Makkee, M. CeO2 catalysed soot oxidation: The role of active oxygen to accelerate the oxidation conversion. Appl. Catal. B Environ. 2004, 51, 9–19. [Google Scholar] [CrossRef]
- Miceli, P.; Bensaid, S.; Russo, N.; Fino, D. Effect of the morphological and surface properties of CeO2 -based catalysts on the soot oxidation activity. Chem. Eng. J. 2015, 278, 190–198. [Google Scholar] [CrossRef]
- Liu, J.; Zhao, Z.; Wang, J.; Xu, C.; Duan, A.; Jiang, G.; Yang, Q. The highly active catalysts of nanometric CeO2-supported cobalt oxides for soot combustion. Appl. Catal. B Environ. 2008, 84, 185–195. [Google Scholar] [CrossRef]
- Muroyama, H.; Hano, S.; Matsui, T.; Eguchi, K. Catalytic soot combustion over CeO2-based oxides. Catal. Today 2010, 153, 133–135. [Google Scholar] [CrossRef]
- Li, X.; Wei, S.; Zhang, Z.; Zhang, Y.; Wang, Z.; Su, Q.; Gao, X. Quantification of the active site density and turnover frequency for soot combustion with O2 on Cr doped CeO2. Catal. Today 2011, 175, 112–116. [Google Scholar] [CrossRef]
- Li, H.; Li, K.; Wang, H.; Zhu, X.; Wei, Y.; Yan, D.; Cheng, X.; Zhai, K. Soot combustion over Ce1-xFexO2-δ and CeO2/Fe2O3 catalysts: Roles of solid solution and interfacial interactions in the mixed oxides. Appl. Surf. Sci. 2016, 390, 513–525. [Google Scholar] [CrossRef]
- Thomas, J.M.; Raja, R. Mono-, Bi- and Multifunctional Single-Sites: Exploring the Interface Between Heterogeneous and Homogeneous Catalysis. Top. Catal. 2010, 53, 848–858. [Google Scholar] [CrossRef]
- An, K.; Somorjai, G.A. ChemInform Abstract: Nanocatalysis I: Synthesis of Metal and Bimetallic Nanoparticles and Porous Oxides and Their Catalytic Reaction Studies. Catal. Lett. 2015, 145, 233–248. [Google Scholar] [CrossRef]
- Agarwal, S.; Lefferts, L.; Mojet, B.L. Ceria nanocatalysts: Shape dependent reactivity and formation of OH. ChemCatChem 2013, 5, 479–489. [Google Scholar] [CrossRef]
- Yuan, Q.; Duan, H.-H.; Li, L.-L.; Sun, L.-D.; Zhang, Y.-W.; Yan, C.-H. Controlled synthesis and assembly of ceria-based nanomaterials. J. Colloid Interface Sci. 2009, 335, 151–167. [Google Scholar] [CrossRef]
- Wei, Y.; Zhao, Z.; Yu, X.; Jin, B.; Liu, J.; Xu, C.; Duan, A.; Jiang, G.; Ma, S. One-pot synthesis of core-shell Au@CeO2-[small delta] nanoparticles supported on three-dimensionally ordered macroporous ZrO2 with enhanced catalytic activity and stability for soot combustion. Catal. Sci. Technol. 2013, 3, 2958–2970. [Google Scholar] [CrossRef]
- Yamazaki, K.; Kayama, T.; Dong, F.; Shinjoh, H. A mechanistic study on soot oxidation over CeO2–Ag catalyst with ‘rice-ball’morphology. J. Catal. 2011, 282, 289–298. [Google Scholar] [CrossRef]
- Wei, Y.; Liu, J.; Zhao, Z.; Duan, A.; Jiang, G. The catalysts of three-dimensionally ordered macroporous Ce1−xZrxO2-supported gold nanoparticles for soot combustion: The metal–support interaction. J. Catal. 2012, 287, 13–29. [Google Scholar] [CrossRef]
- Zhang, G.; Zhao, Z.; Liu, J.; Jiang, G.; Duan, A.; Zheng, J.; Chen, S.; Zhou, R. Three dimensionally ordered macroporous Ce1−xZrxO2 solid solutions for diesel soot combustion. Chem. Commun. 2010, 46, 457–459. [Google Scholar] [CrossRef] [PubMed]
- Bensaid, S.; Russo, N.; Fino, D. CeO2 catalysts with fibrous morphology for soot oxidation: The importance of the soot–catalyst contact conditions. Catal. Today 2013, 216, 57–63. [Google Scholar] [CrossRef]
- Piumetti, M.; Bensaid, S.; Russo, N.; Fino, D. Nanostructured ceria-based catalysts for soot combustion: Investigations on the surface sensitivity. Appl. Catal. B Environ. 2015, 165, 742–751. [Google Scholar] [CrossRef]
- Palmisano, P.; Russo, N.; Fino, P.; Fino, D.; Badini, C. High catalytic activity of SCS-synthesized ceria towards diesel soot combustion. Appl. Catal. B Environ. 2006, 69, 85–92. [Google Scholar] [CrossRef]
- Wang, H.; Luo, S.; Zhang, M.; Liu, W.; Wu, X.; Liu, S. Roles of oxygen vacancy and Ox− in oxidation reactions over CeO2 and Ag/CeO2 nanorod model catalysts. J. Catal. 2018, 368, 365–378. [Google Scholar] [CrossRef]
- Katta, L.; Sudarsanam, P.; Thrimurthulu, G.; Reddy, B.M. Doped nanosized ceria solid solutions for low temperature soot oxidation: Zirconium versus lanthanum promoters. Appl. Catal. B Environ. 2010, 101, 101–108. [Google Scholar] [CrossRef]
- Lin, X.; Li, S.; He, H.; Wu, Z.; Wu, J.; Chen, L.; Ye, D.; Fu, M. Evolution of oxygen vacancies in MnOx–CeO2 mixed oxides for soot oxidation. Appl. Catal. B Environ. 2018, 223, 91–102. [Google Scholar] [CrossRef]
- Lee, J.H.; Lee, S.H.; Choung, J.W.; Kim, C.H.; Lee, K.-Y. Ag-incorporated macroporous CeO2 catalysts for soot oxidation: Effects of Ag amount on the generation of active oxygen species. Appl. Catal. B Environ. 2019, 246, 356–366. [Google Scholar] [CrossRef]
- Liu, S.; Wu, X.; Tang, J.; Cui, P.; Jiang, X.; Chang, C.; Liu, W.; Gao, Y.; Li, M.; Weng, D. An exploration of soot oxidation over CeO2-ZrO2 nanocubes: Do more surface oxygen vacancies benefit the reaction? Catal. Today 2017, 281, 454–459. [Google Scholar] [CrossRef]
- Tang, Y.; Qiao, H.; Wang, H.; Tao, P. Nanoparticulate Mn0.3Ce0.7O2: A novel electrocatalyst with improved power performance for metal/air batteries. J. Mater. Chem. A 2013, 1, 12512. [Google Scholar] [CrossRef]
- Sahoo, T.R.; Armandi, M.; Arletti, R.; Piumetti, M.; Bensaid, S.; Manzoli, M.; Panda, S.R.; Bonelli, B. Pure and Fe-doped CeO2 nanoparticles obtained by microwave assisted combustion synthesis: Physico-chemical properties ruling their catalytic activity towards CO oxidation and soot combustion. Appl. Catal. B Environ. 2017, 211, 31–45. [Google Scholar] [CrossRef]
- Perez-Alonso, F.J.; Granados, M.L.; Ojeda, M.; Terreros, P.; Rojas, S.; Herranz, T.; Fierro, J.L.G.; Gracia, M.; Gancedo, J.R. Chemical Structures of Coprecipitated Fe−Ce Mixed Oxides. Chem. Mater. 2005, 17, 2329–2339. [Google Scholar] [CrossRef]
- Aneggi, E.; De Leitenburg, C.; Dolcetti, G.; Trovarelli, A. Promotional effect of rare earths and transition metals in the combustion of diesel soot over CeO2 and CeO2–ZrO2. Catal. Today 2006, 114, 40–47. [Google Scholar] [CrossRef]
- Barbato, P.S.; Colussi, S.; Di Benedetto, A.; Landi, G.; Lisi, L.; Llorca, J.; Trovarelli, A. CO preferential oxidation under H2-rich streams on copper oxide supported on Fe promoted CeO2. Appl. Catal. A Gen. 2015, 506, 268–277. [Google Scholar] [CrossRef]
- Radutoiu, N.; Teodorescu, C. Satellites in Ce 3d X-Ray Photoelectron Spectroscopy of Ceria. Dig. J. Nanomater. Biostruct. (DJNB) 2013, 8, 1535–1549. [Google Scholar]
- Sudarsanam, P.; Mallesham, B.; Durgasri, D.N.; Reddy, B.M. Physicochemical characterization and catalytic CO oxidation performance of nanocrystalline Ce–Fe mixed oxides. RSC Adv. 2014, 4, 11322–11330. [Google Scholar] [CrossRef]
- Jampaiah, D.; Tur, K.M.; Ippolito, S.J.; Sabri, Y.M.; Tardio, J.; Bhargava, S.K.; Reddy, B.M. Structural characterization and catalytic evaluation of transition and rare earth metal doped ceria-based solid solutions for elemental mercury oxidation. RSC Adv. 2013, 3, 12963–12974. [Google Scholar] [CrossRef]
- Wang, W.; Zhu, Q.; Qin, F.; Dai, Q.; Wang, X. Fe doped CeO2 nanosheets as Fenton-like heterogeneous catalysts for degradation of salicylic acid. Chem. Eng. J. 2018, 333, 226–239. [Google Scholar] [CrossRef]
- Piumetti, M.; Bensaid, S.; Russo, N.; Fino, D. Investigations into nanostructured ceria–zirconia catalysts for soot combustion. Appl. Catal. B Environ. 2016, 180, 271–282. [Google Scholar] [CrossRef]
© 2019 by the authors. Licensee MDPI, Basel, Switzerland. This article is an open access article distributed under the terms and conditions of the Creative Commons Attribution (CC BY) license (http://creativecommons.org/licenses/by/4.0/).