Article

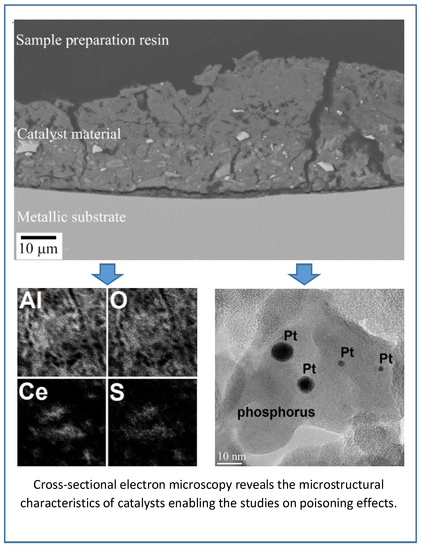
Microstructural Characteristics of Vehicle-Aged Heavy-Duty Diesel Oxidation Catalyst and Natural Gas Three-Way Catalyst

1
Faculty of Engineering and Natural Sciences, Tampere University, P.O. Box 589, FI-33014 Tampere, Finland
2
Faculty of Technology, University of Oulu, P.O. Box 4300, FI-90014 Oulu, Finland
3
Department of Applied Physics, Aalto University, P.O. Box 110, FI-00076 Aalto, Finland
4
Dinex Finland Oy, Vihtavuorentie 162, FI-41330 Vihtavuori, Finland
5
SSAB Europe Oy, Rautaruukintie 155, FI-92101 Raahe, Finland
6
Department of Physics, Chalmers University of Technology, SE-412 96 Göteborg, Sweden
*
Author to whom correspondence should be addressed.
Currently Finnish Institute of Occupational Health, P.O. Box 40, FI-00032 Työterveyslaitos, Finland.
Currently Murata Electronics Oy, Myllynkivenkuja 6, FI-01621 Vantaa, Finland.
§
Currently Sandvik Mining and Construction Oy, Pihtisulunkatu 9, FI-33310 Tampere, Finland.
Catalysts 2019, 9(2), 137; https://doi.org/10.3390/catal9020137
Submission received: 3 December 2018 / Revised: 18 January 2019 / Accepted: 18 January 2019 / Published: 1 February 2019
(This article belongs to the Special Issue Catalysts Deactivation, Poisoning and Regeneration)

Abstract

:
Techniques to control vehicle engine emissions have been under increasing need for development during the last few years in the more and more strictly regulated society. In this study, vehicle-aged heavy-duty catalysts from diesel and natural gas engines were analyzed using a cross-sectional electron microscopy method with both a scanning electron microscope and a transmission electron microscope. Also, additional supporting characterization methods including X-ray diffractometry, X-ray photoelectron spectroscopy, Fourier-transform infrared spectroscopy and catalytic performance analyses were used to reveal the ageing effects. Structural and elemental investigations were performed on these samples, and the effect of real-life ageing of the catalyst was studied in comparison with fresh catalyst samples. In the real-life use of two different catalysts, the poison penetration varied greatly depending on the engine and fuel at hand: the diesel oxidation catalyst appeared to suffer more thorough changes than the natural gas catalyst, which was affected only in the inlet part of the catalyst. The most common poison, sulphur, in the diesel oxidation catalyst was connected to cerium-rich areas. On the other hand, the severities of the ageing effects were more pronounced in the natural gas catalyst, with heavy structural changes in the washcoat and high concentrations of poisons, mainly zinc, phosphorus and silicon, on the surface of the inlet part.

Graphical Abstract

1. Introduction

Since the introduction of the first catalytic converter for automobile exhaust gas catalysis, the development and research for cleaner and lower emissions have been attractive challenges, due to ever-tightening emission standards. There have been various directions in the development of more efficient systems for exhaust gas after-treatment, from engine design to catalytic converter and fuel technology development. In the recent decades, while the reduction of petroleum car emissions has improved and promising results from diesel engine emissions have arisen, the aspect of low-emission fuels has gained more and more interest. For example, biodiesel, ethanol and natural gas are challenging the traditional fuels in transportation use for the future. Although there have been advances in the lowering of emissions of these more efficient combustion processes, the deactivation and ageing problems of the catalysts remain at a certain level [1,2,3,4,5,6,7,8,9,10,11,12]. To meet the demands for more efficient and clean engines, there is a great need to study deactivation and ageing effects of these different types of fuels with catalytic materials and other phenomena.
Catalyst ageing effects and deactivation during its lifecycle in vehicles is a very complex phenomenon. There are two main problems typically described in the studies of those catalysts: poisoning and thermal ageing of the catalyst, both of them greatly depending on the used catalyst materials and conditions of the use. Poisoning refers to blocking of active sites for catalytic reactions in the catalyst, resulting from the chemisorption of fuel and lubricant impurities onto the catalytically active sites. Thermal ageing due to high temperature conditions in the vehicle engine can cause loss of the active surface via, for example, sintering and phase transformations. In heavy-duty vehicle engines, the roles and characteristics of these problems are still quite seldom addressed in comparison to studies from smaller vehicles and/or gasoline-fueled cars [7,8,9,10,11,12,13,14].
It is well known that sulphur and phosphorus originating from fuel and/or lubricating oil decrease efficiency of diesel and natural gas oxidation catalysts, for example, [11,15,16,17,18]. For example, in the Pd-rich catalysts for methane oxidation in natural gas engine exhausts, aluminum sulphate species formed under SO2 exposure. This inhibited the CH4 oxidation reaction in a broad temperature range [18]. In the Pt-based diesel oxidation catalysts, the formation of phosphates decreased the specific surface area of the catalyst and decreased catalyst efficiency [16].
In this study, vehicle-aged catalysts were analyzed, providing insight into ageing effects on real-life catalysts. According to the authors’ knowledge, this information is mostly lacking [8]. The vehicle-aged and fresh heavy-duty catalysts from diesel and natural gas engines were analyzed using a cross-sectional electron microscopy method for both a scanning electron microscope (SEM) and (scanning) transmission electron microscope ((S)TEM) equipped with an energy dispersive spectrometer (EDS). Also, additional supporting characterization methods including X-ray diffractometry (XRD), X-ray photoelectron spectroscopy (XPS), Fourier-transform infrared (FTIR) spectroscopy and catalytic performance analyses were used to reveal the ageing effects. The fresh catalyst samples were studied in a similar manner as the vehicle-aged samples for finding out the effects of the real engine use on the structures and properties of the catalysts. Alumina was the main support material in the metallic support sheet for both catalysts, and platinum was the precious metal in the diesel oxidation catalyst together with palladium in the natural gas catalyst.

2. Results and Discussion

2.1. Diesel Oxidation Catalyst

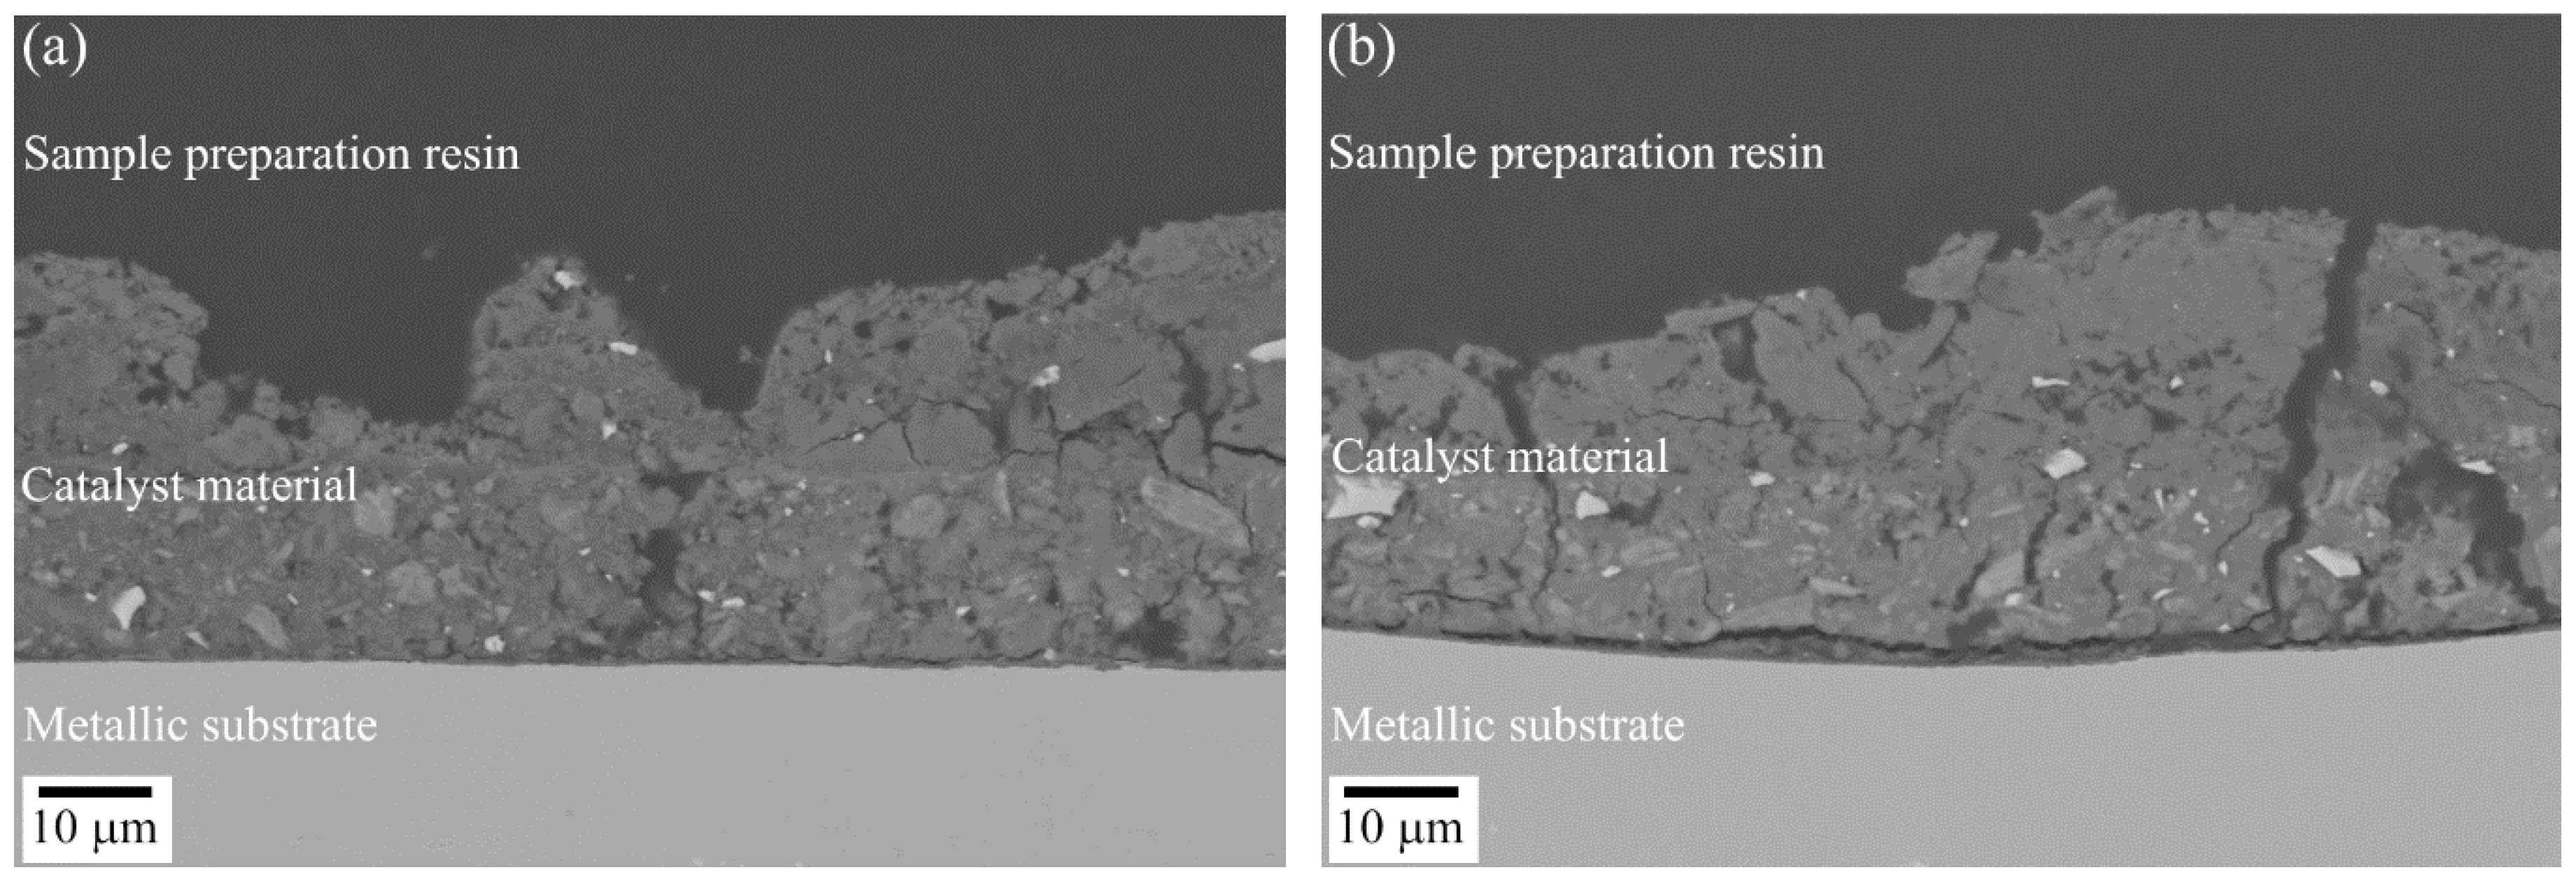
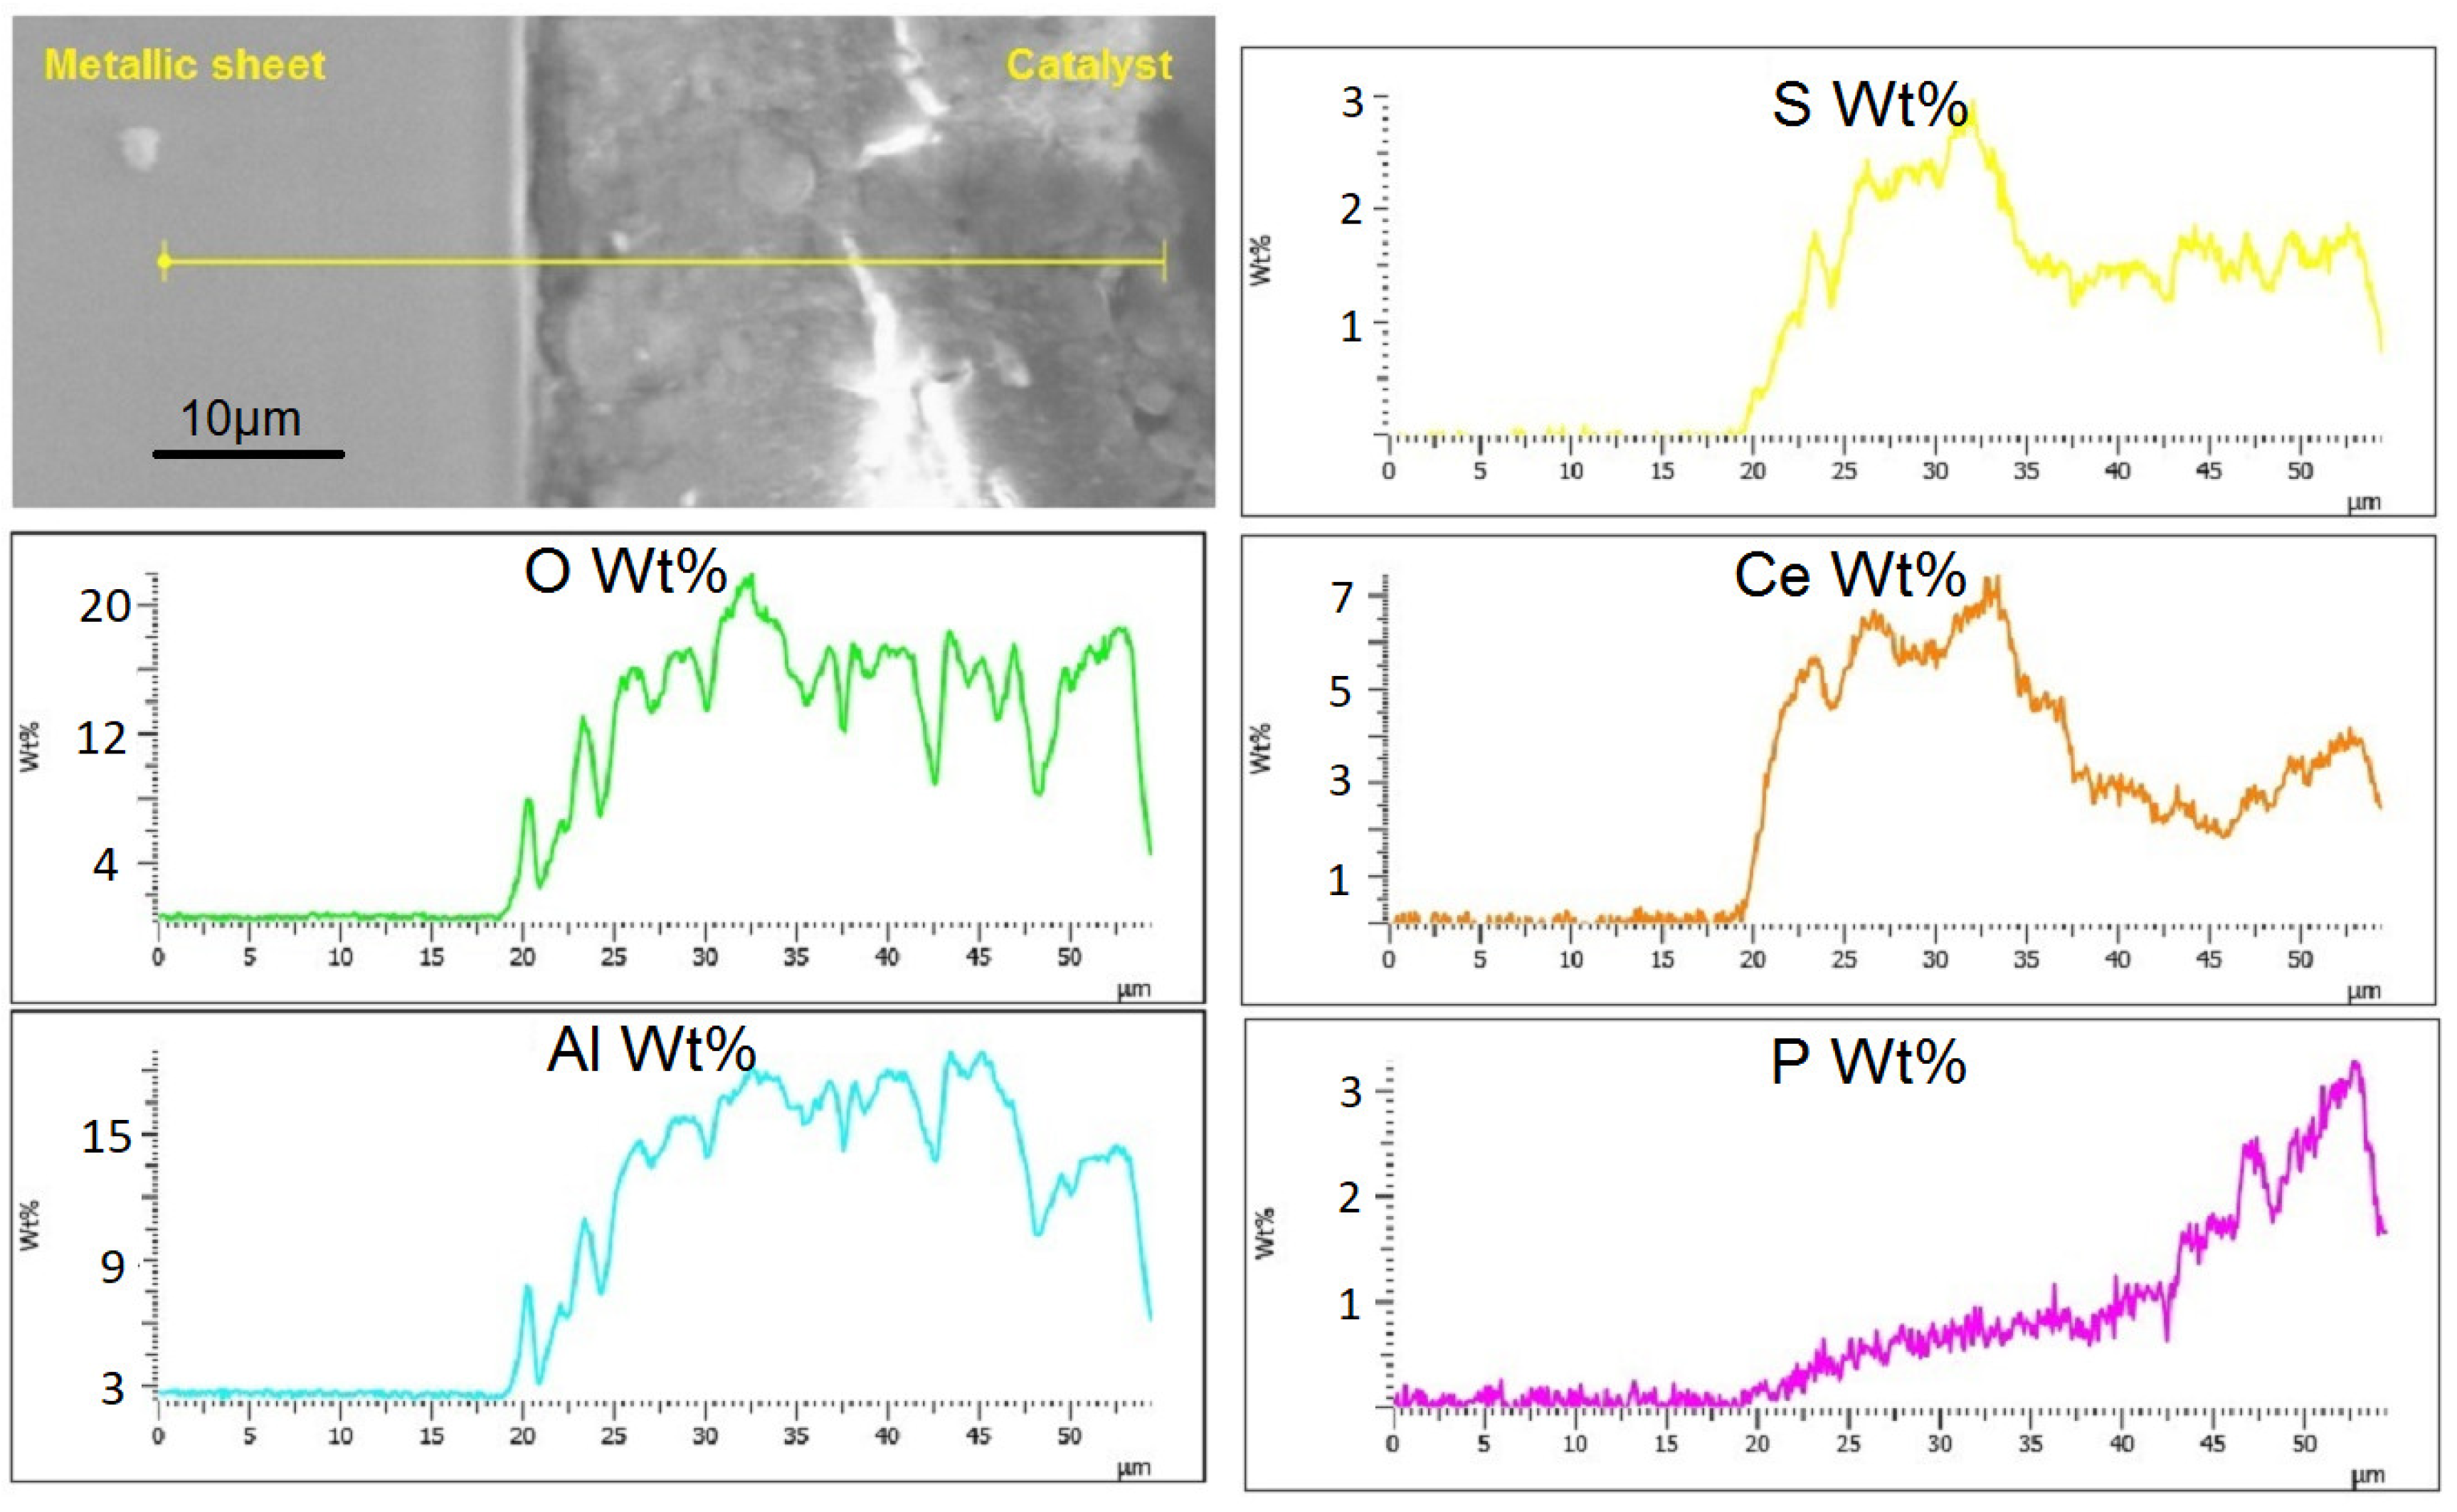
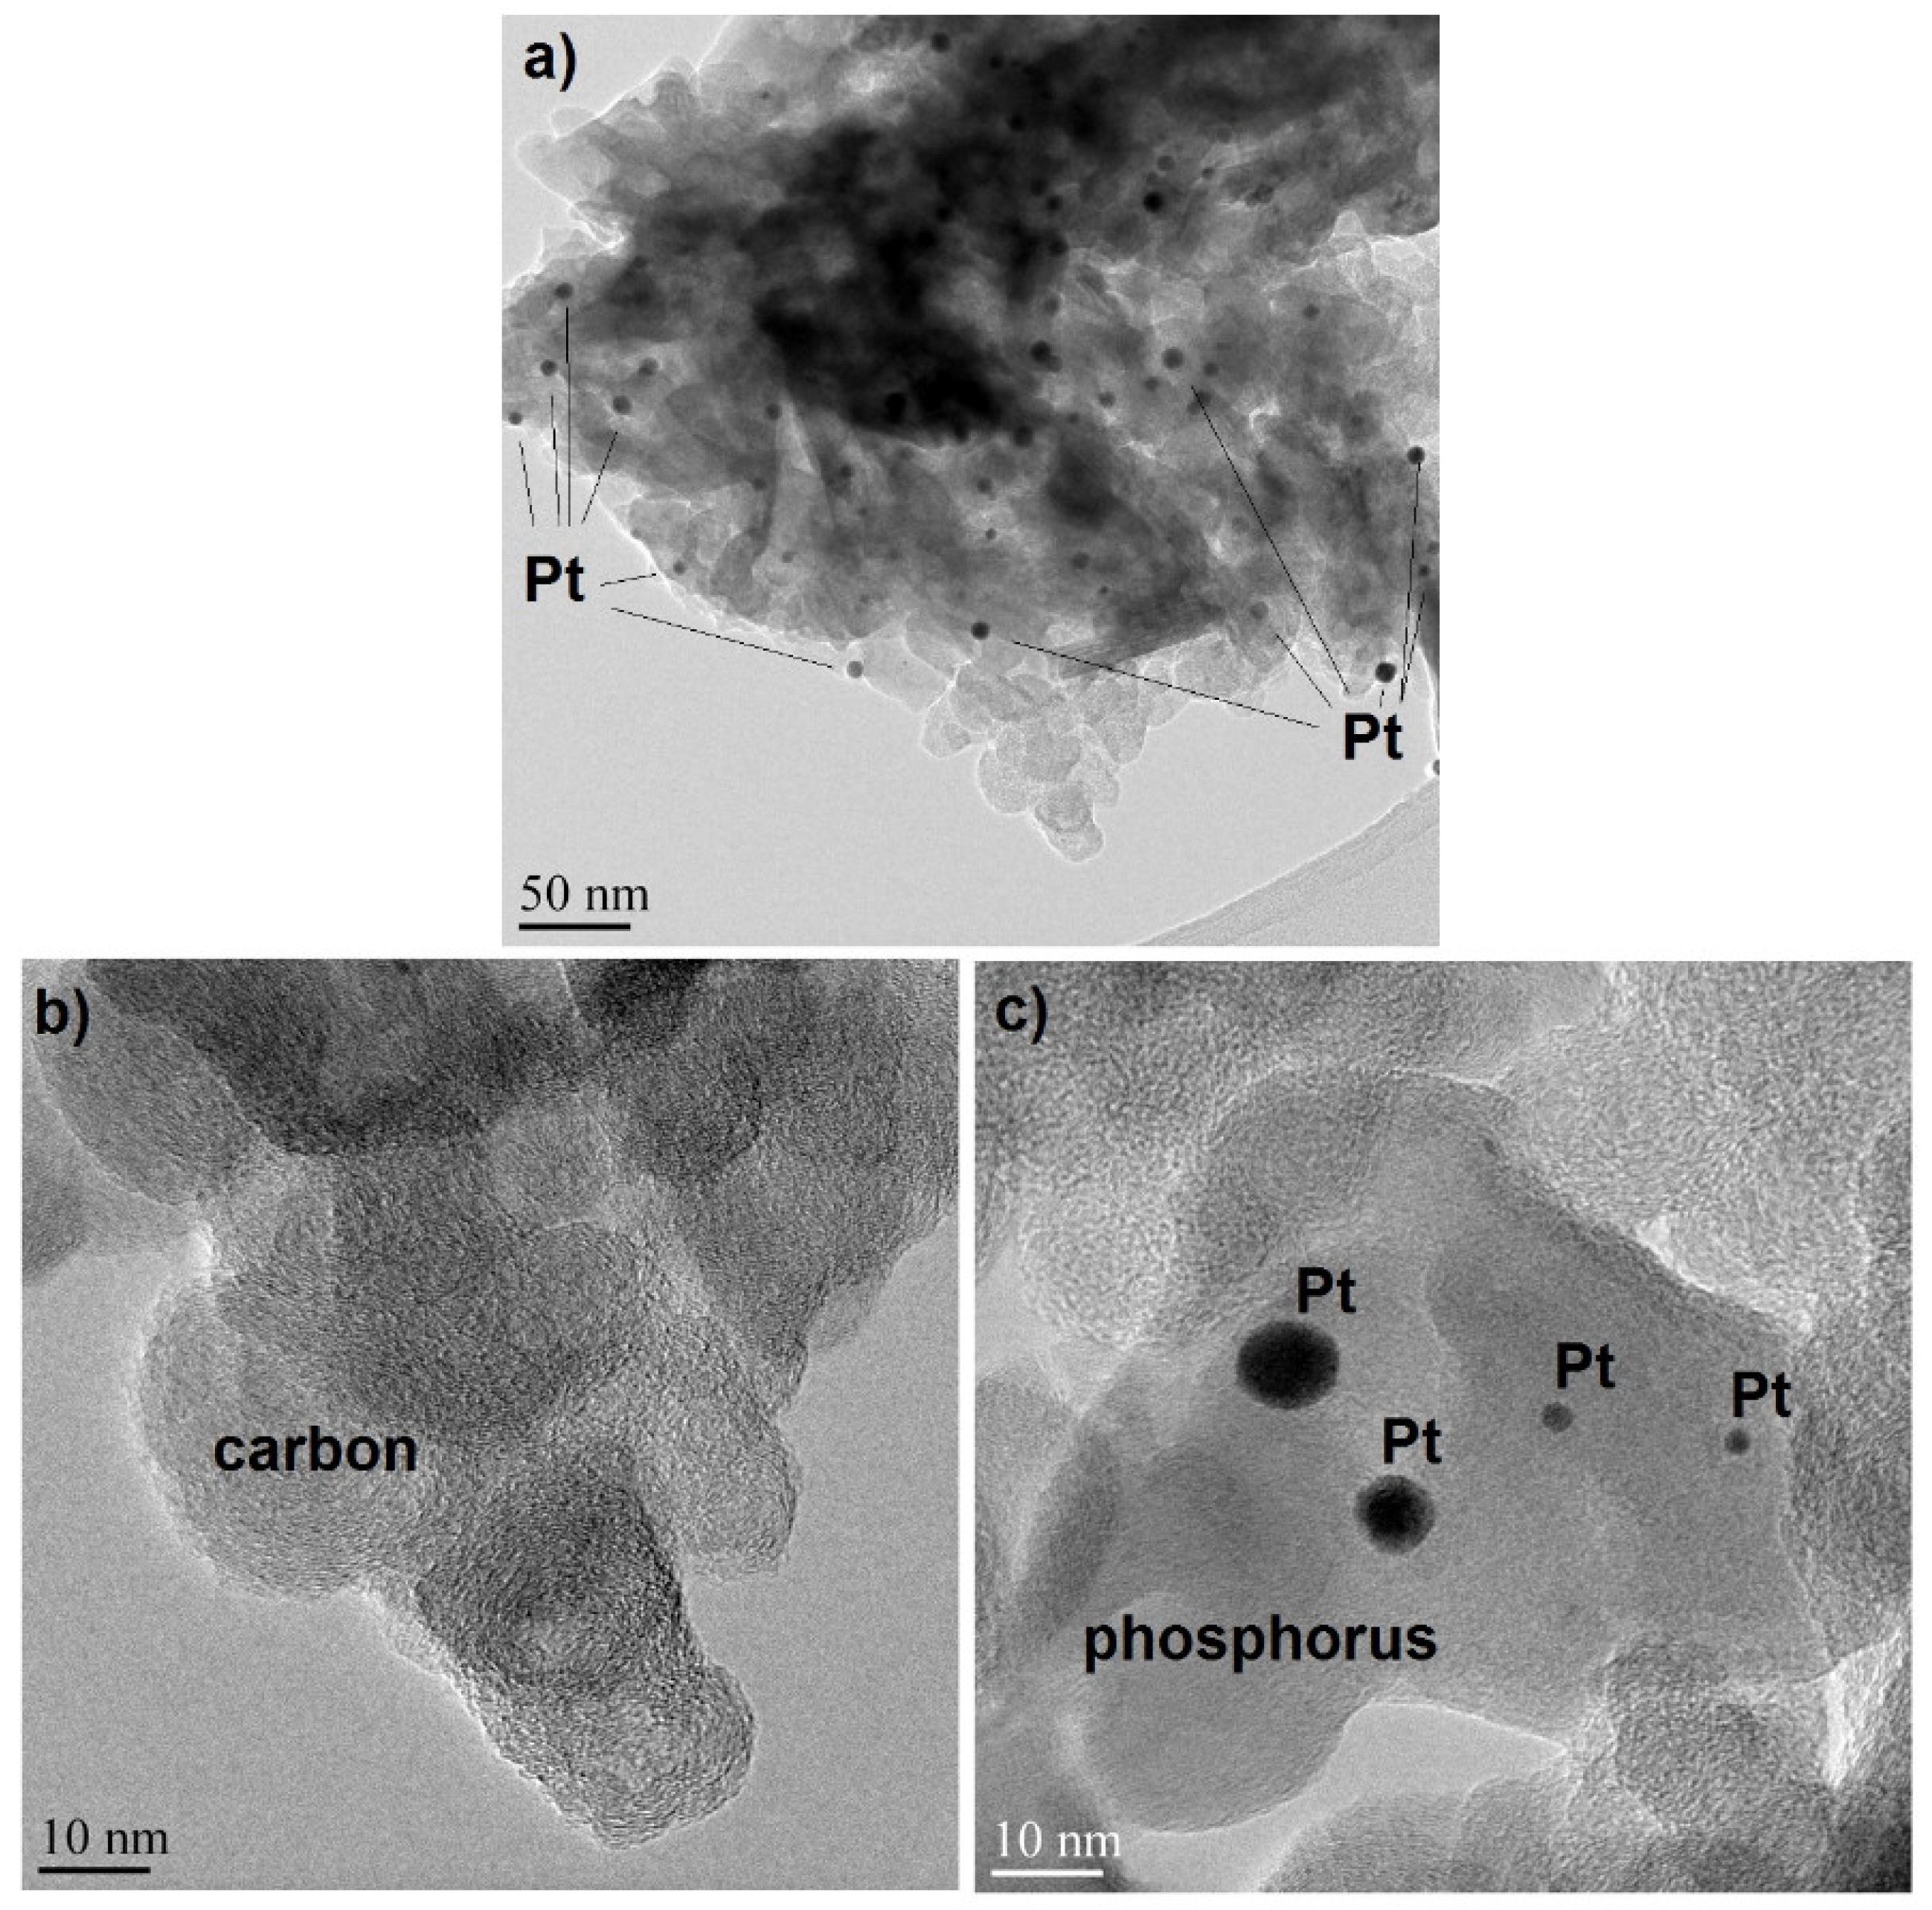
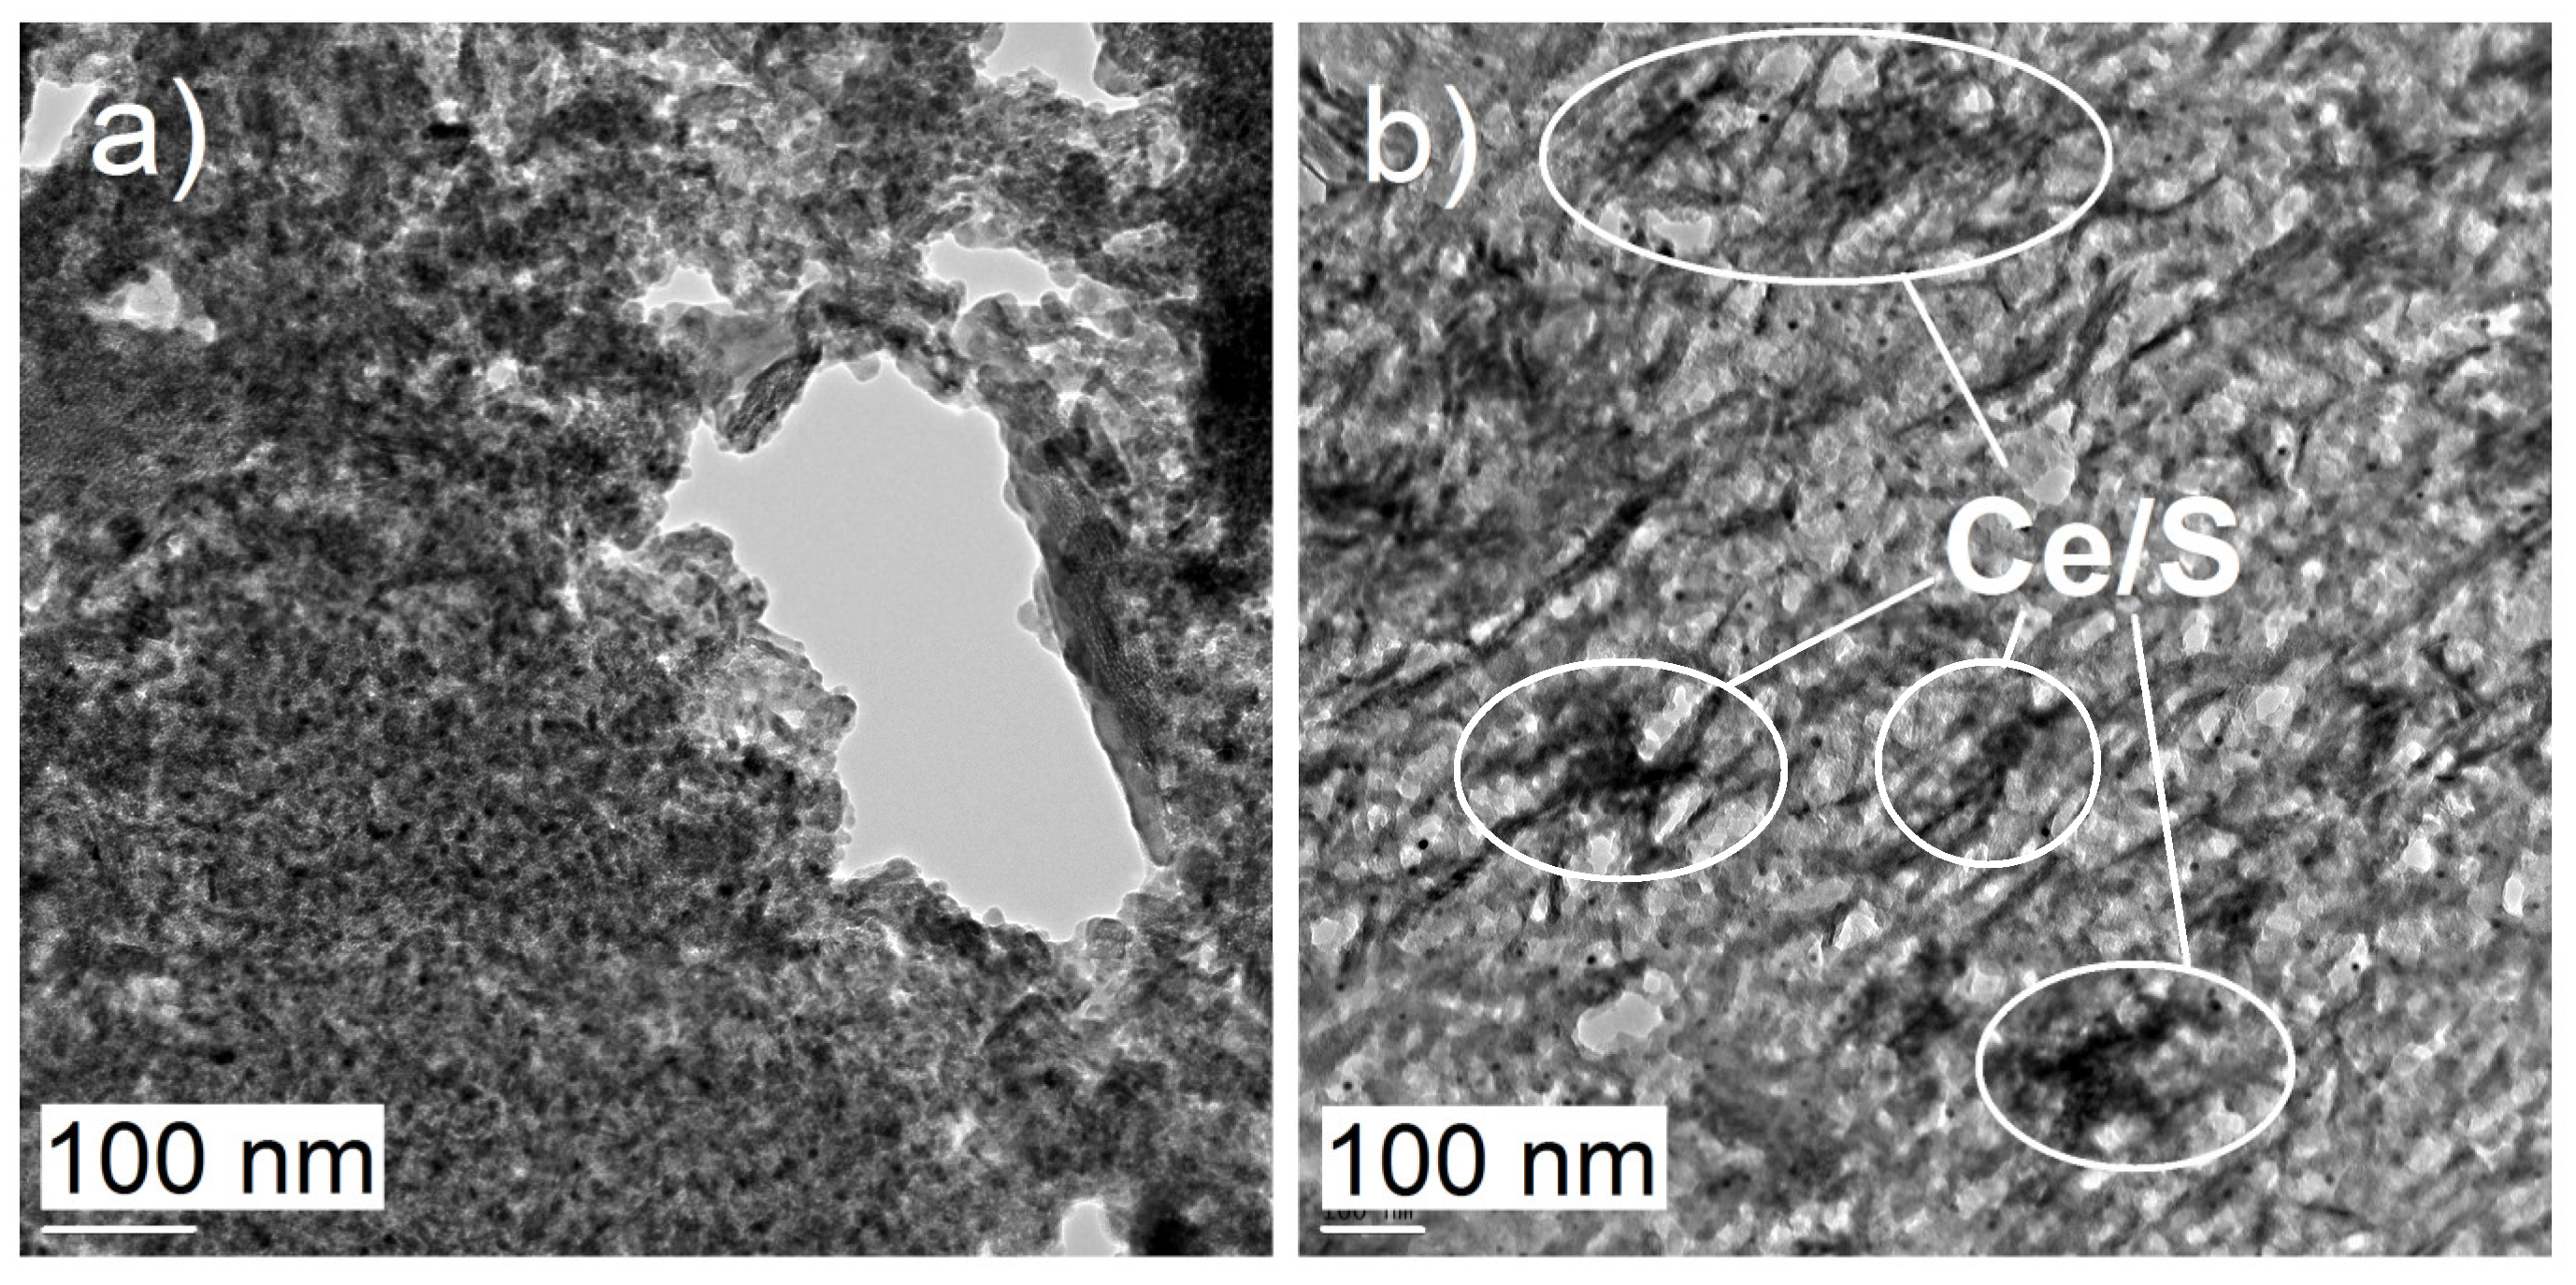
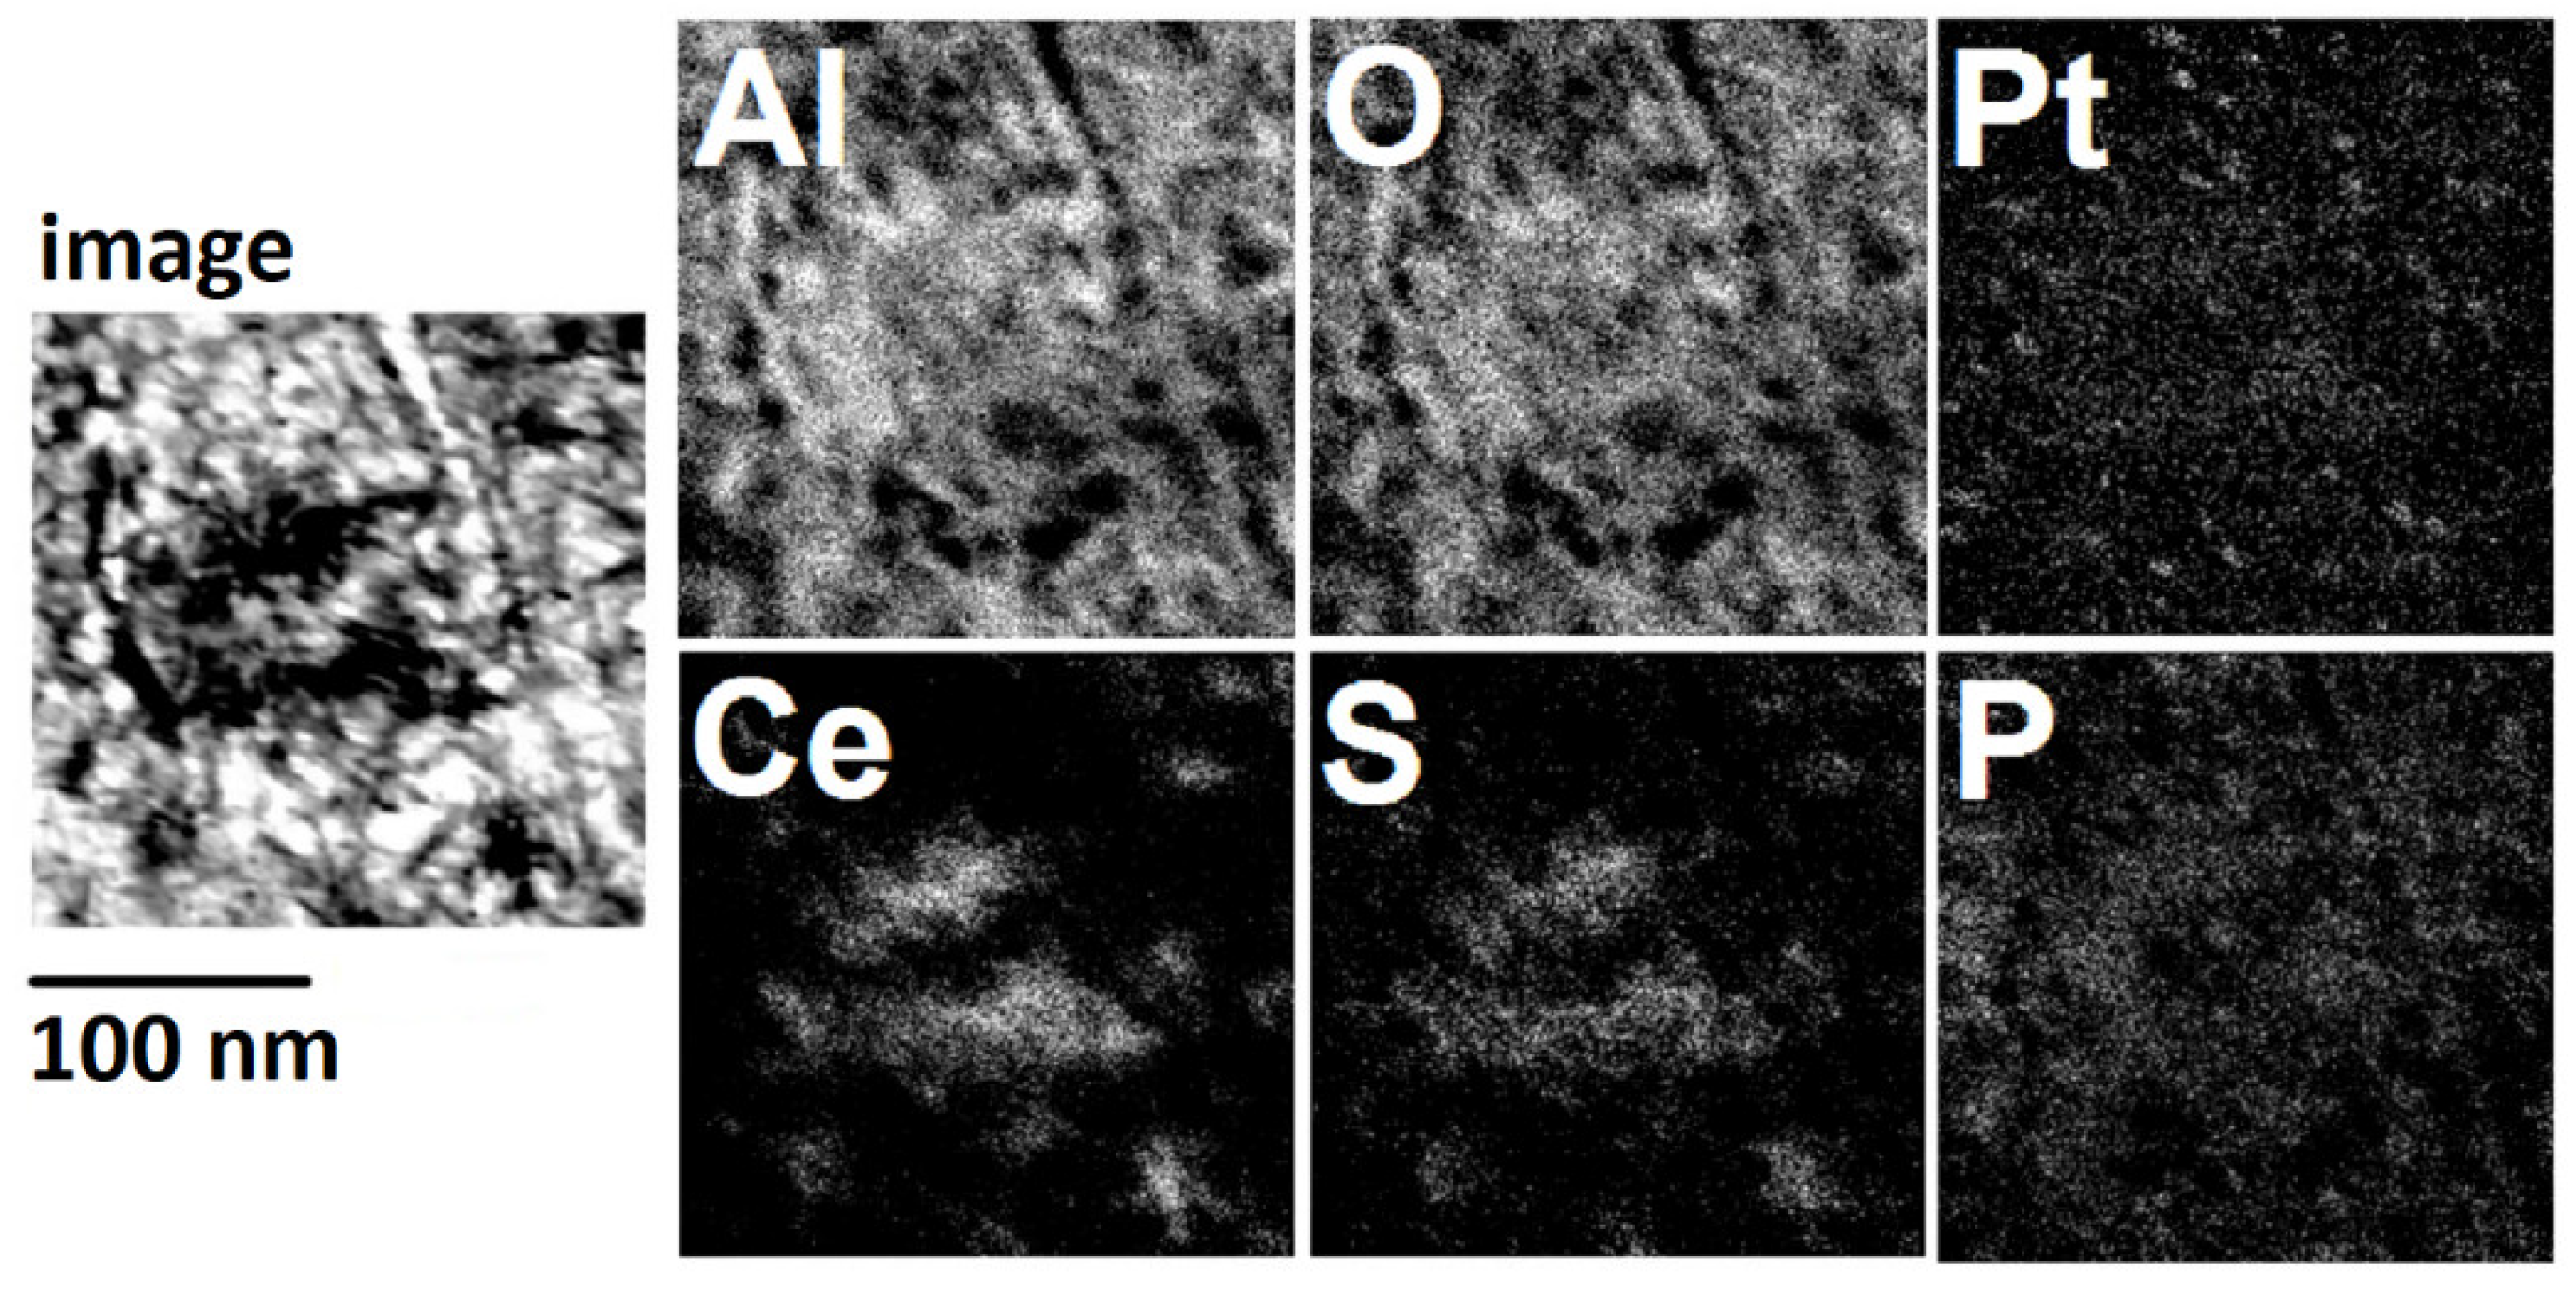
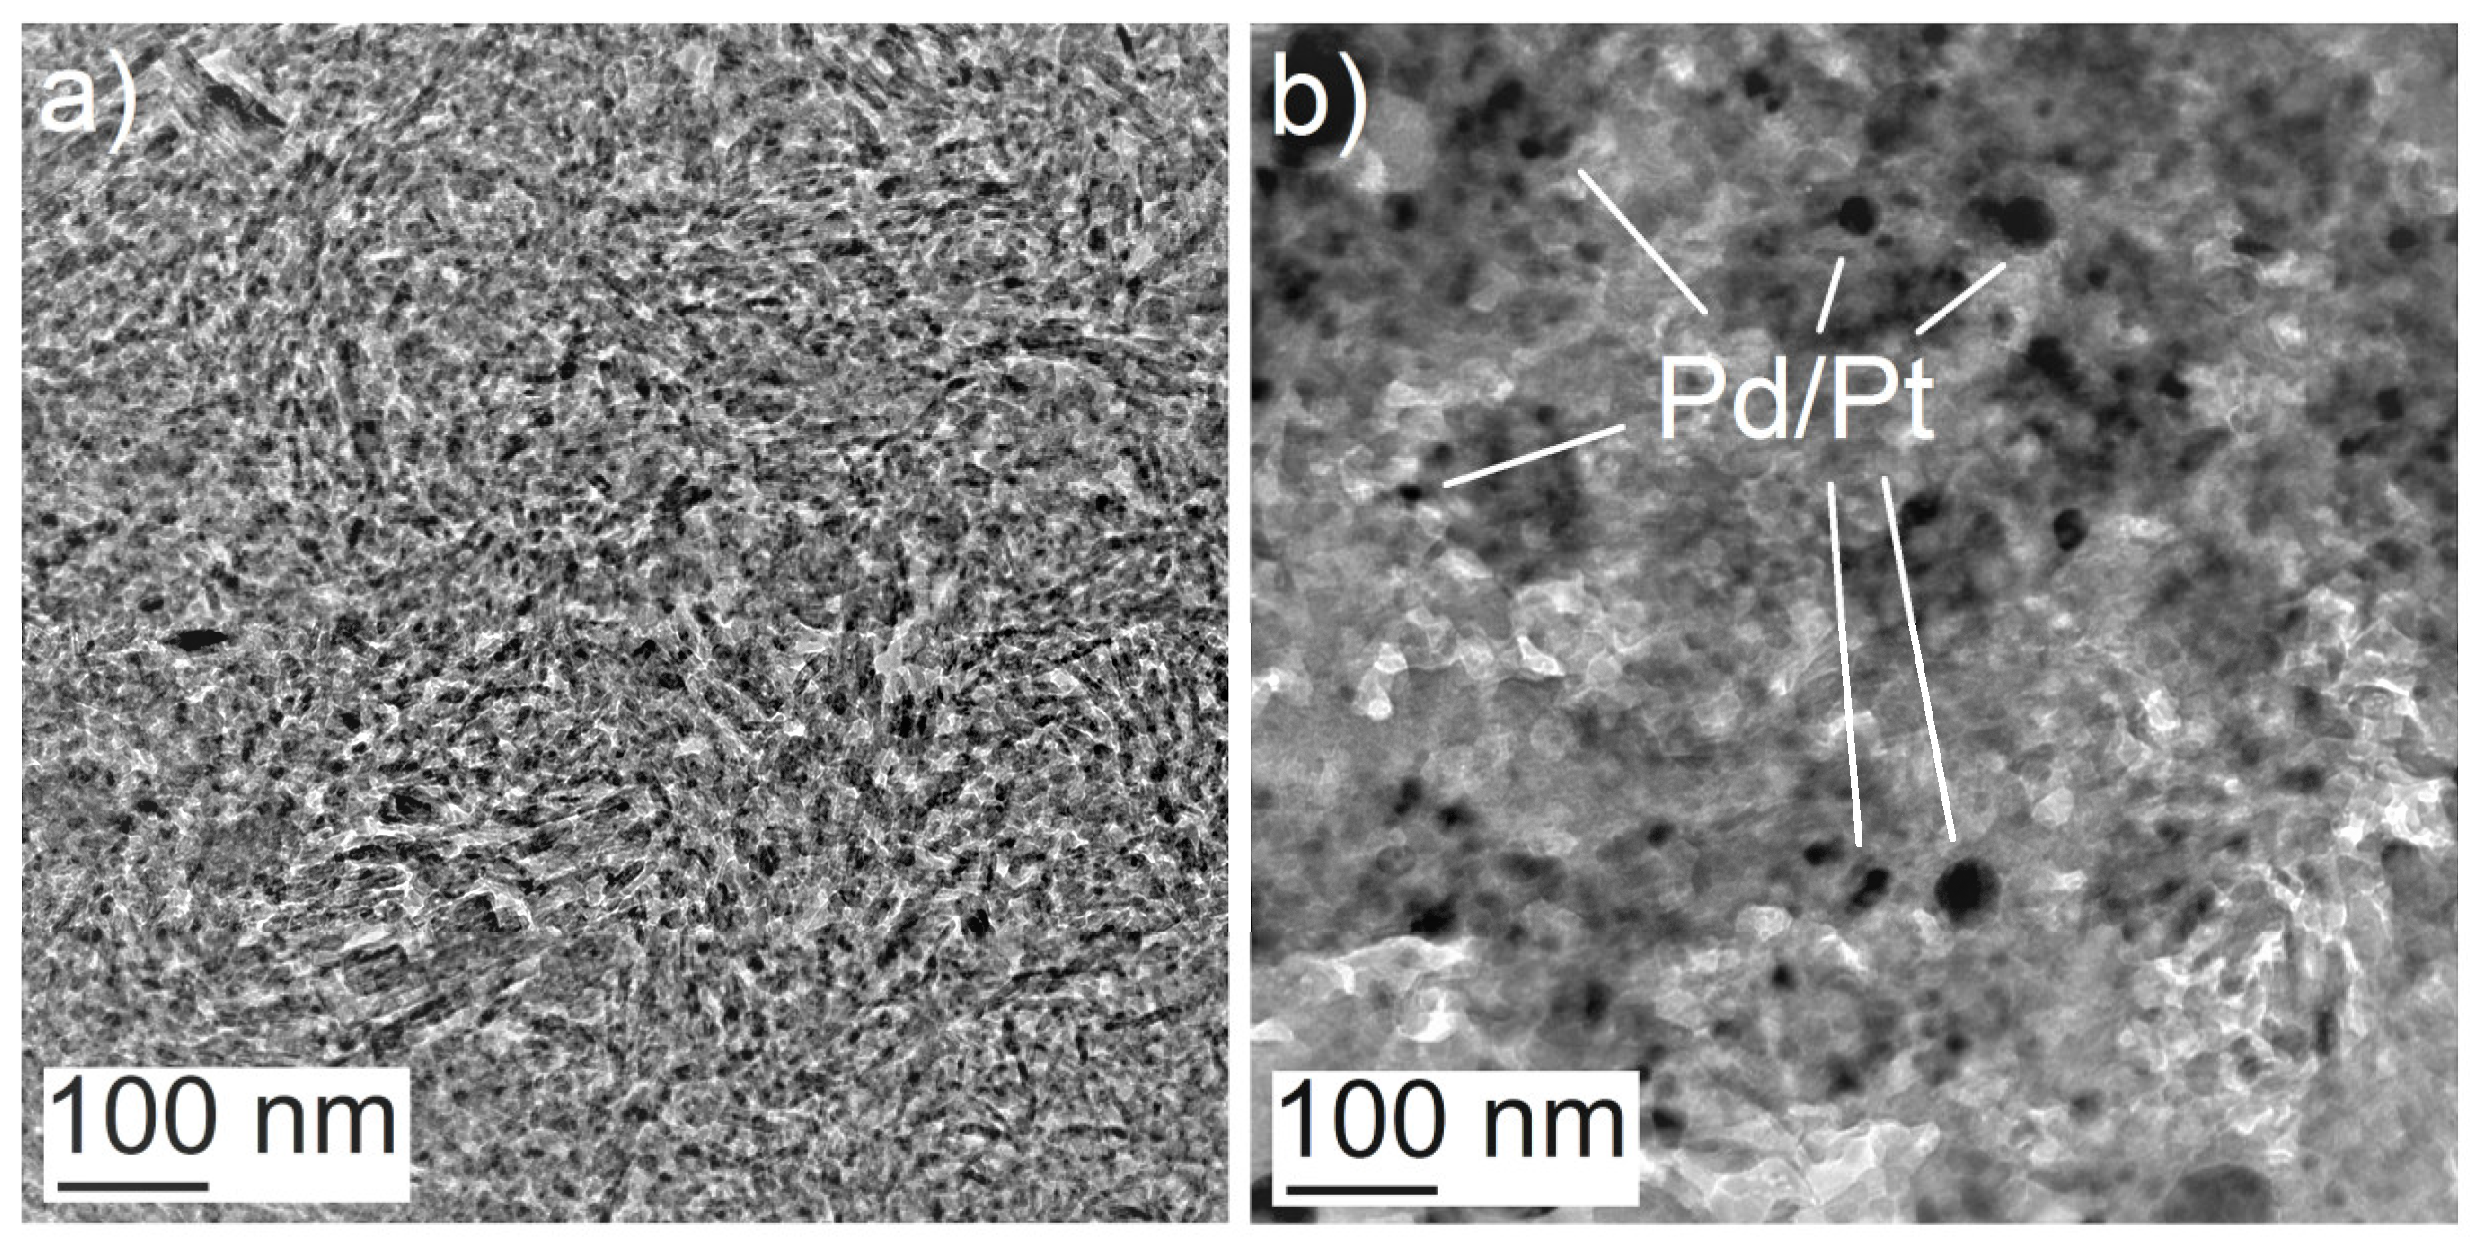
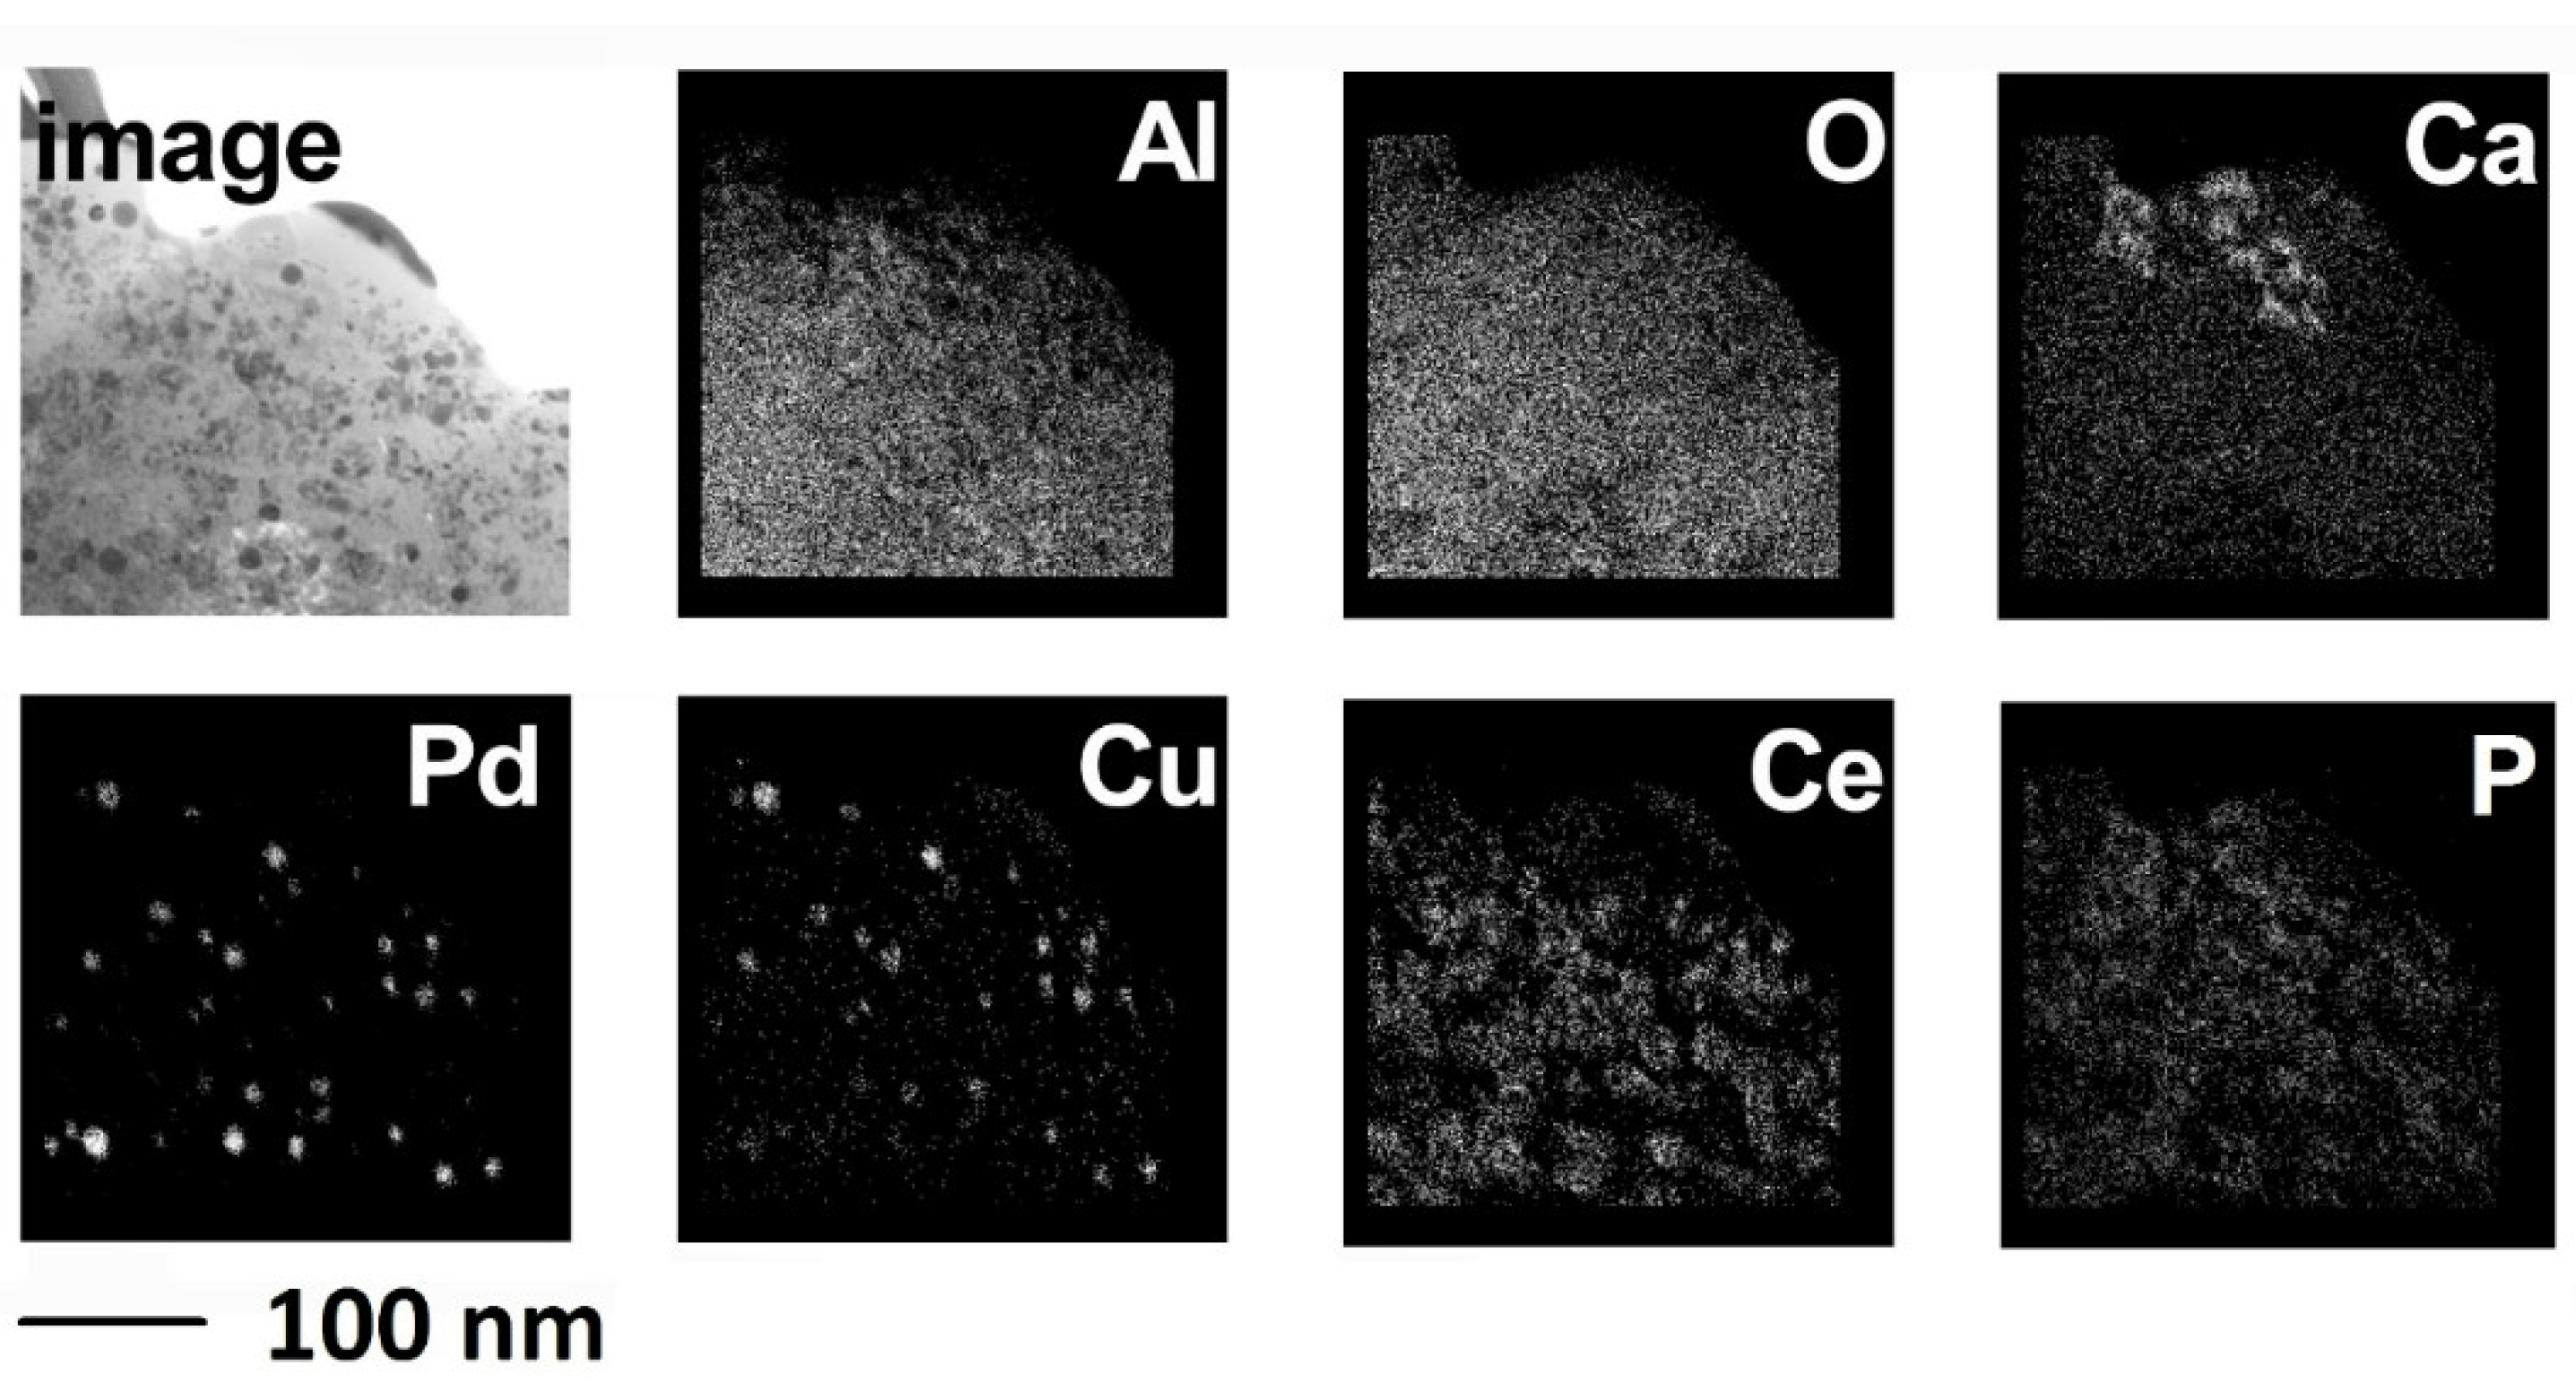
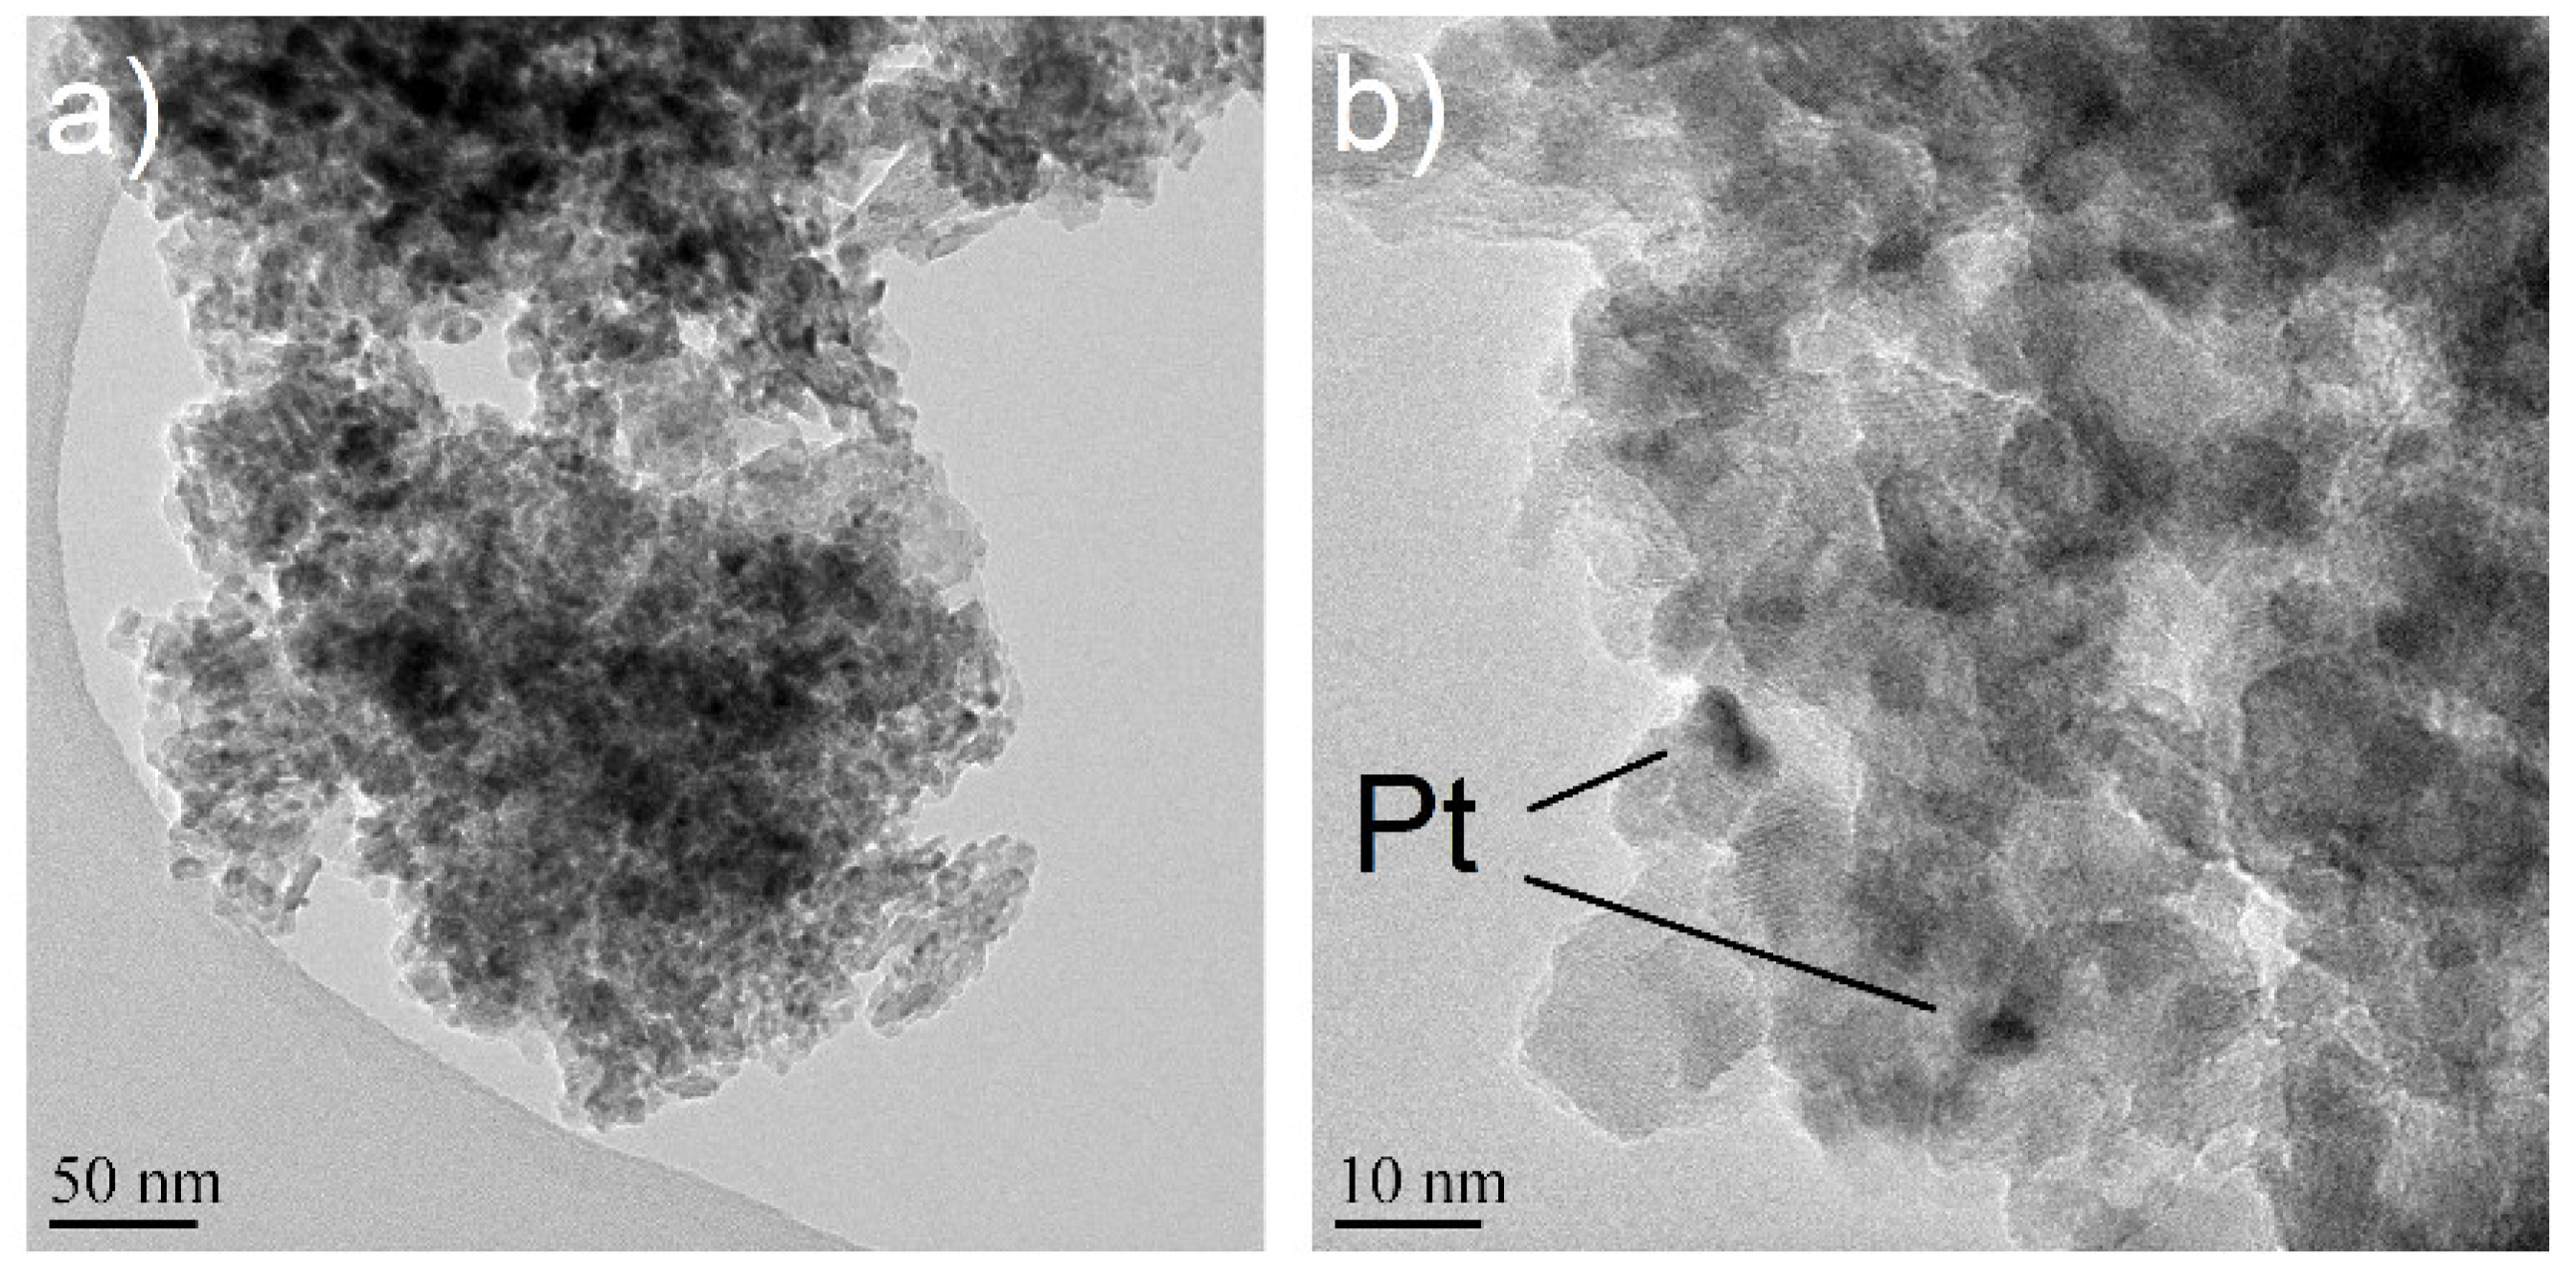
2.1.1. Electron Microscopy

The cross-sectional SEM images of the diesel oxidation catalyst in the used form are presented in Figure 1. The diesel oxidation catalyst washcoat is an alumina-based mix of metal oxides, mainly zirconium, cerium and lanthanum, supporting the platinum catalysts. Platinum is spread evenly across the layers.
The SEM-EDS line analyses of selected elements in the inlet catalyst sheet are shown in Figure 2. Both the SEM-EDS line analyses and spot analyses indicate a higher sulphur content in the inner layer of the washcoat. As can be seen from Figure 2, the sulphur content follows the content of ceria in the washcoat, indicating an attachment between S and Ce. Sulphur is a known poison for ceria [19,20,21,22,23].
Phosphorus content follows alumina (Al and O) near the surface and decreases towards the bottom layer of the washcoat. The SEM-EDS spot analyses of layers of the inlet catalyst washcoat give sulphur contents maxima of 10 wt % for the ceria-rich inner layer and 5 wt % for the outer layer containing less ceria. Phosphorus was detected, but there are challenges in the calculations due to the P Kα-peak overlapping with the Pt Mα-peak and the Zr Lα-peak in the spectrum. However, the amount of phosphorus is significantly higher in the outer rather than in the inner layer. The EDS results from the used inlet and outlet diesel oxidation catalyst layers were similar.
The EDS analyses from the TEM samples supported the SEM-EDS analyses (Figure 2). Detected poisons in the aged diesel oxidation catalyst samples, from both the inlet and outlet, were S, P, K, Ca and Zn, sulphur clearly with the highest percentage. These are typical poisons in diesel engines originating from fuels, lubricants and detergents [4]. TEM images from the fresh diesel oxidation catalyst sample (Figure 3a,b) show the fine structure of the washcoat with small Pt particles. The size of the Pt particles was <5 nm measured from the STEM images. In the used inlet sample (Figure 4a,c), the size of the platinum particles was 7.0 ± 1.9 nm (100 particles measured). Thus, the particle size increased slightly in the vehicle ageing. In addition, carbon (soot) and phosphorus were detected regularly (Figure 4b,c). Phosphorus exposure is known to cause such growth and shape effects in the noble metals [11,12].
The cross-sectional TEM images from the fresh and vehicle-aged diesel oxidation catalysts are presented in Figure 5. The cross-sectional TEM–EDS map images from selected elements for the used inlet diesel sample are shown in Figure 6. In the studied sample, sulphur and phosphorus were the only poisons with a sufficient amount to be included in the EDS map. As seen in Figure 6, ceria and sulphur cover the same area in the analysed cross-section, as also indicated in the SEM-EDS line analyses (Figure 2). These Ce- and S-rich areas are clearly detectable as darker areas in the TEM images in Figure 5b. Phosphorus covers the washcoat more evenly, following the contents of aluminium and oxygen (Figure 6), as seen in the SEM-EDS line analyses (Figure 2). Overall, the platinum particles have grown in use, and there seem to be larger Pt particles outside the Ce/S-rich area than inside this area. A possibility of the Ce/S effect on the Pt particle sintering could be an interesting topic for future investigations, while such a phenomenon has not been extensively reported.

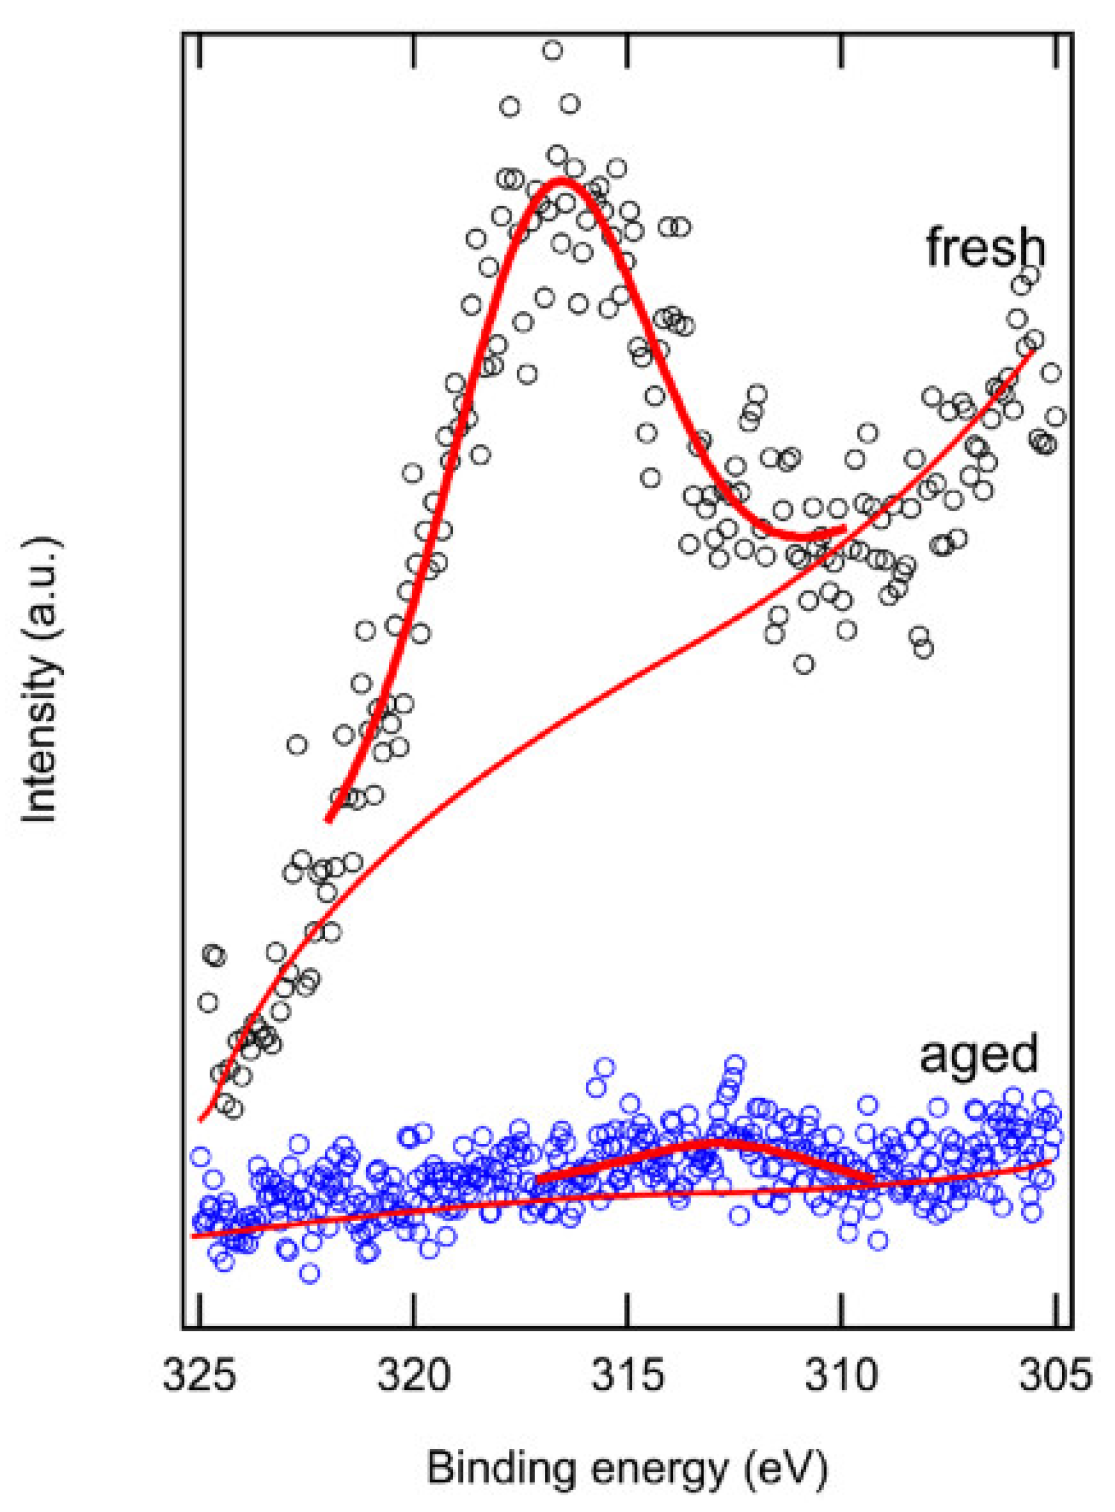
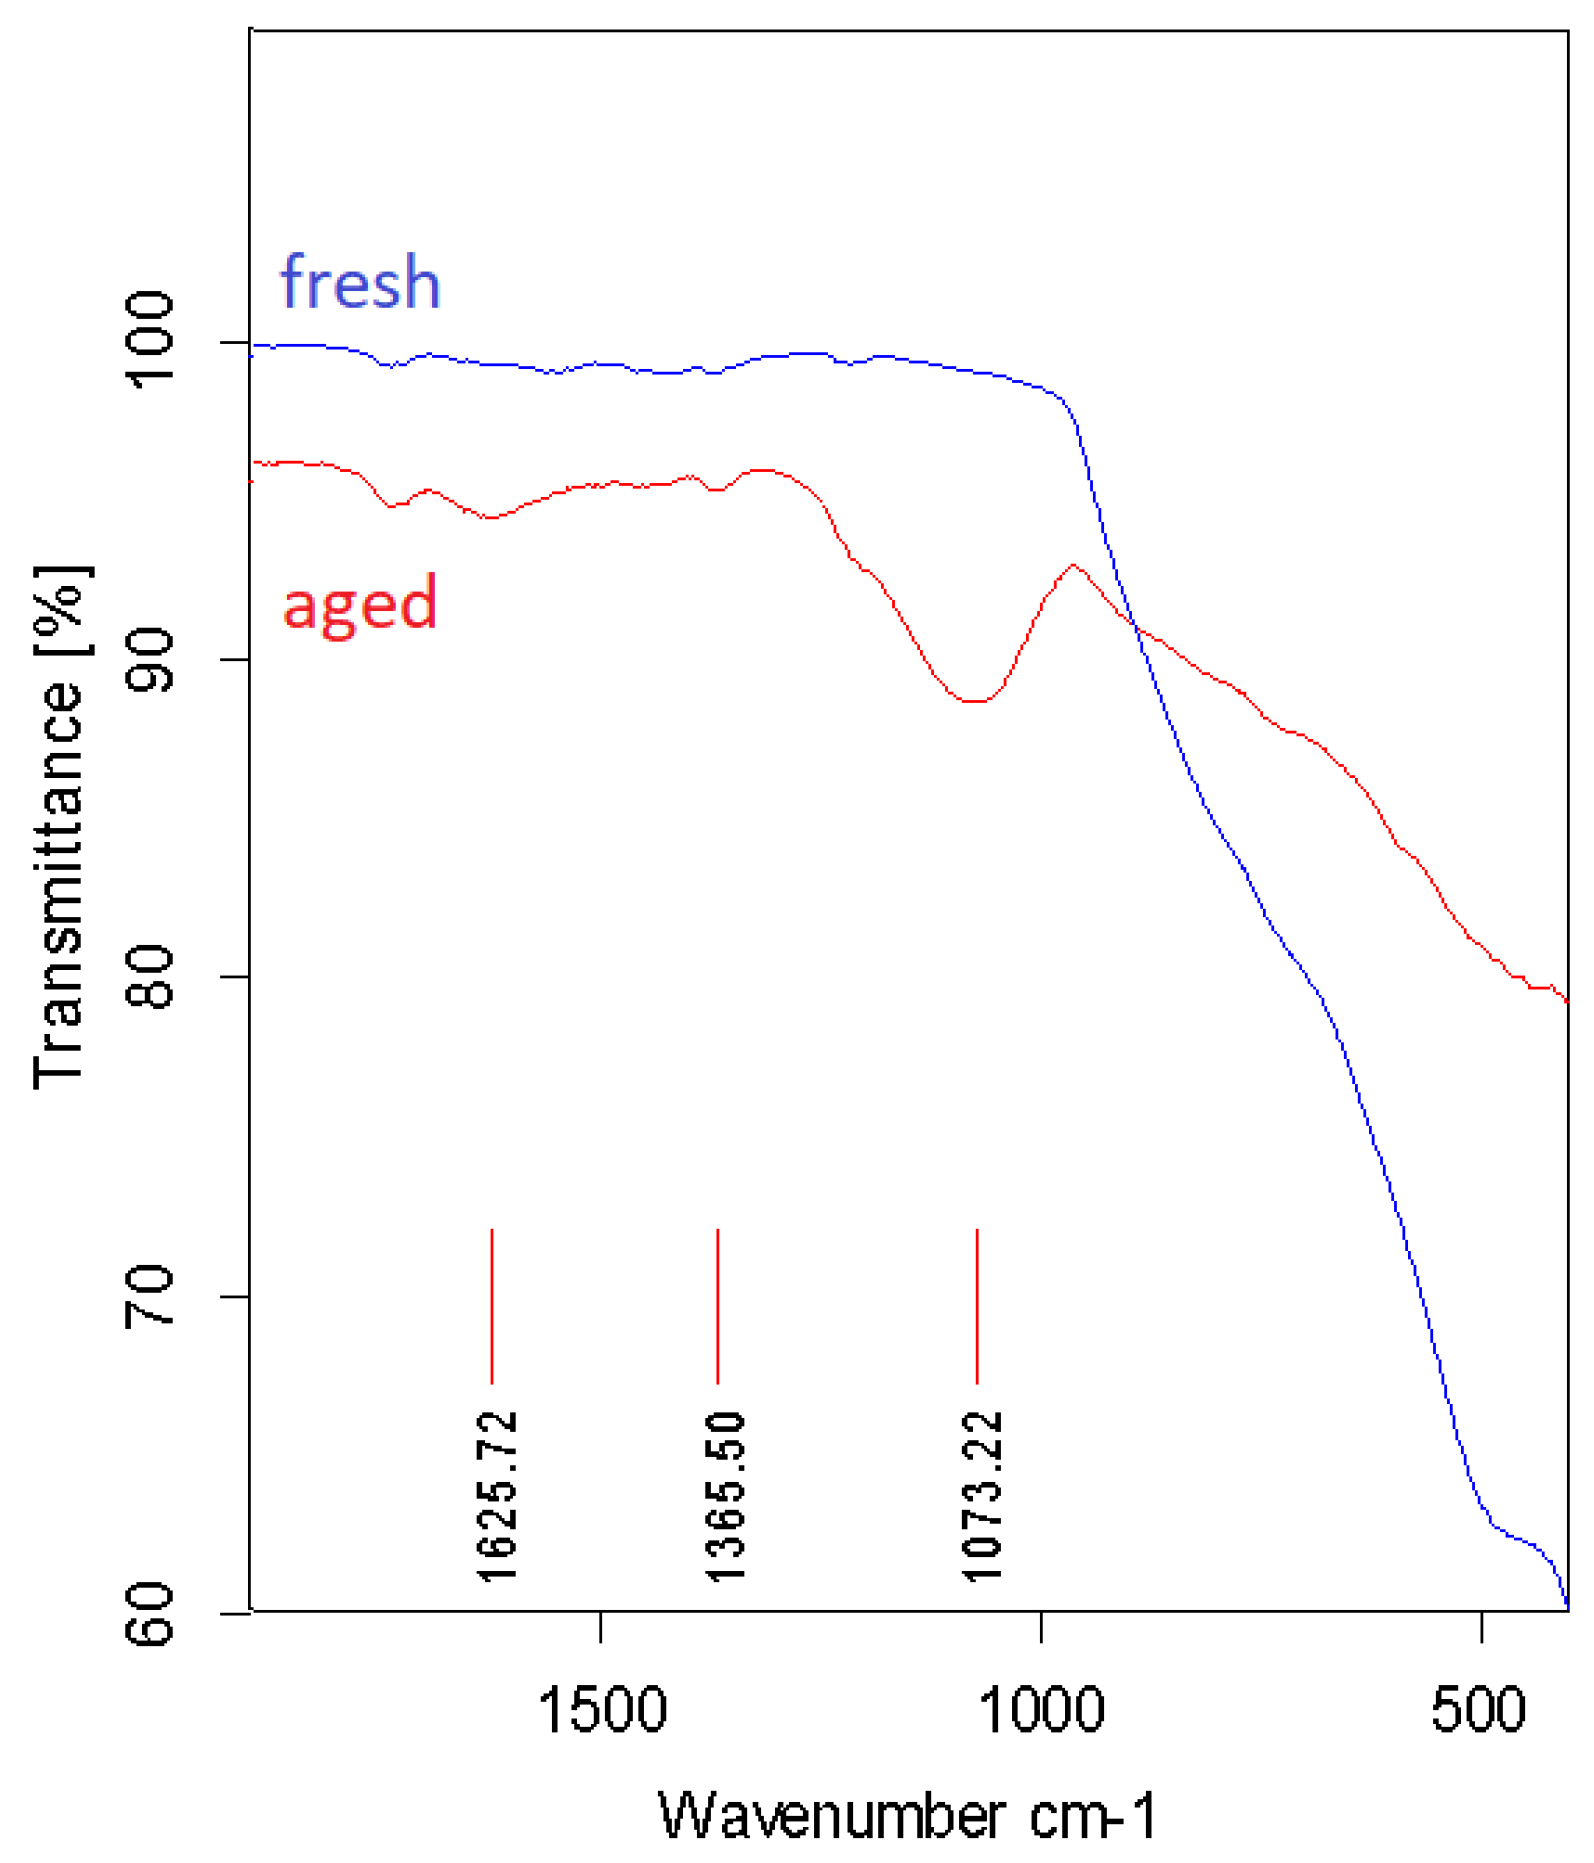
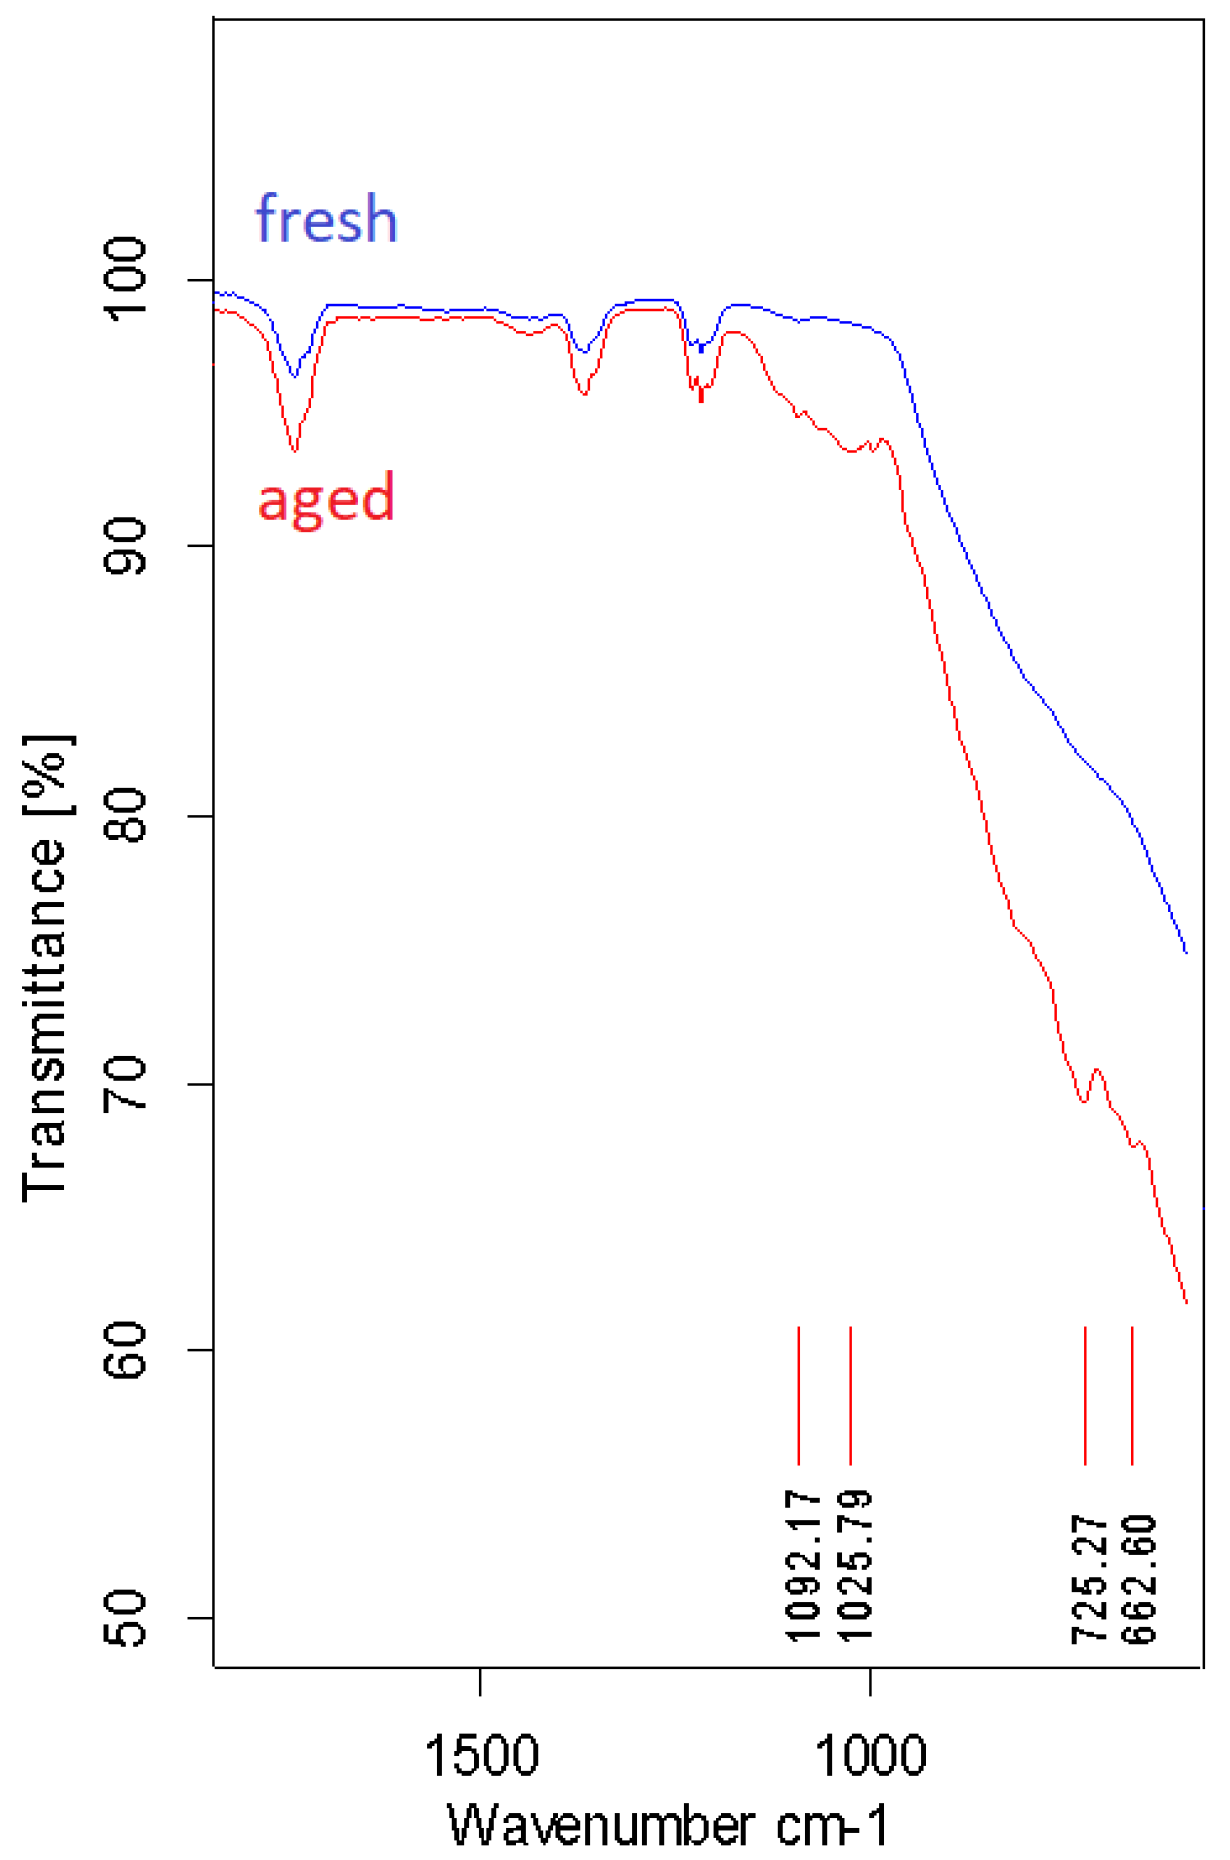
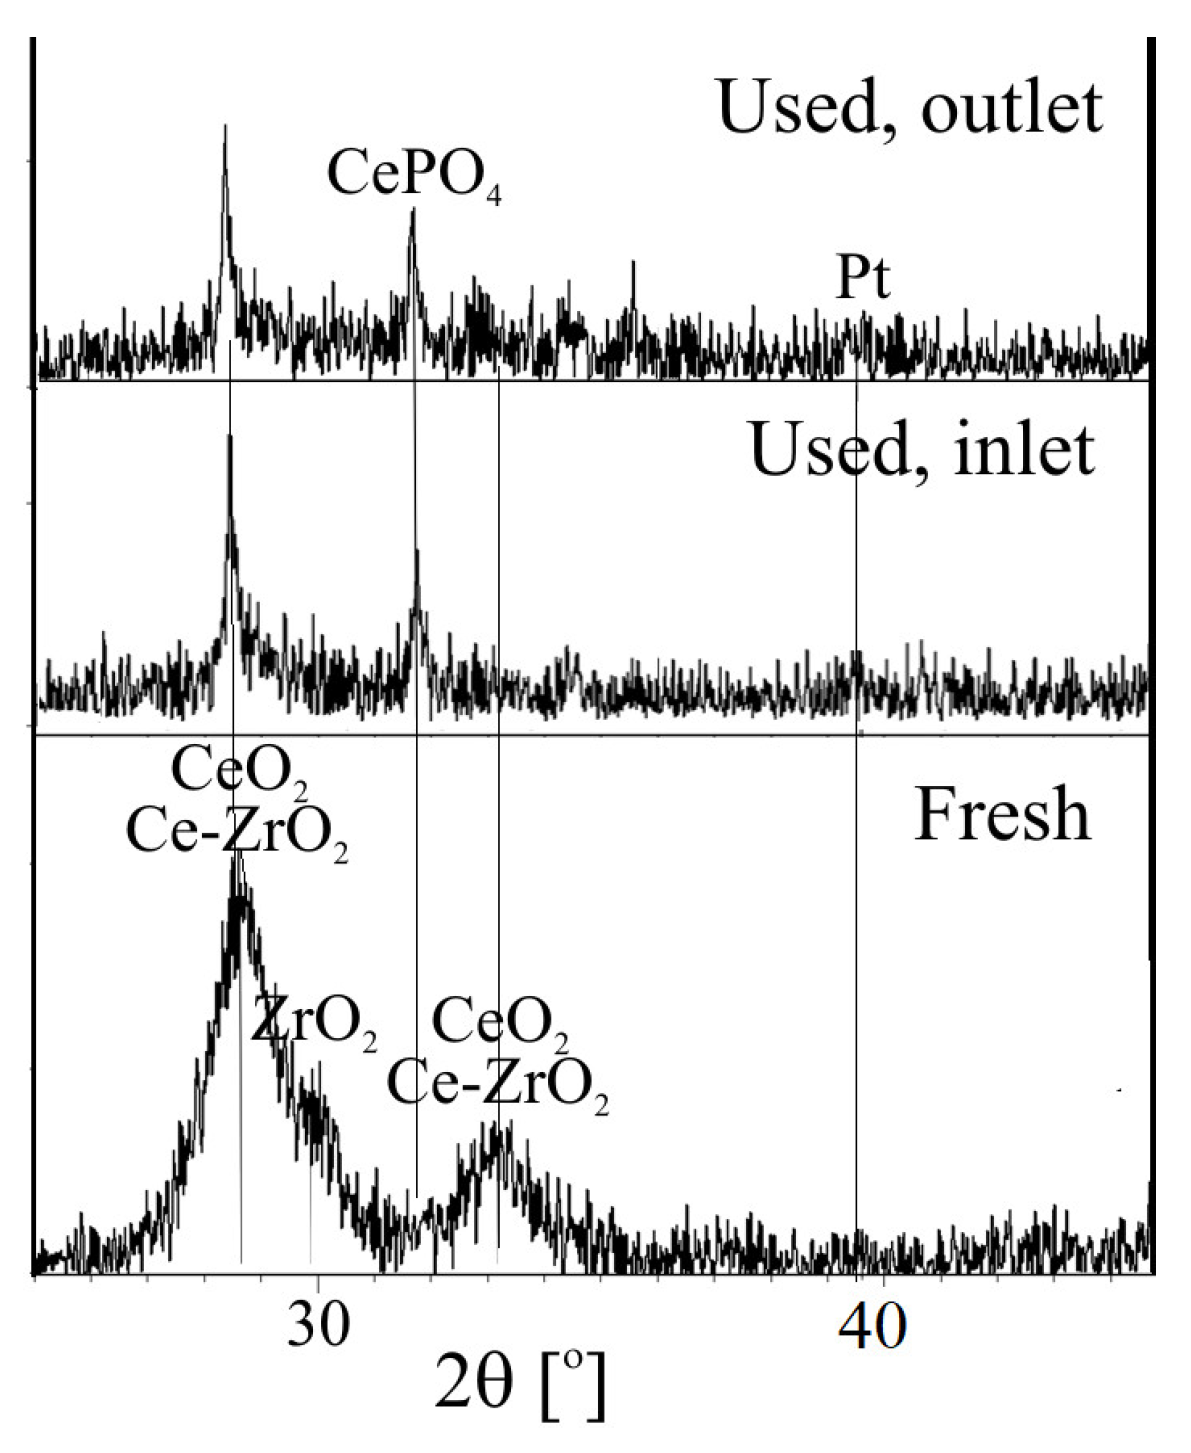
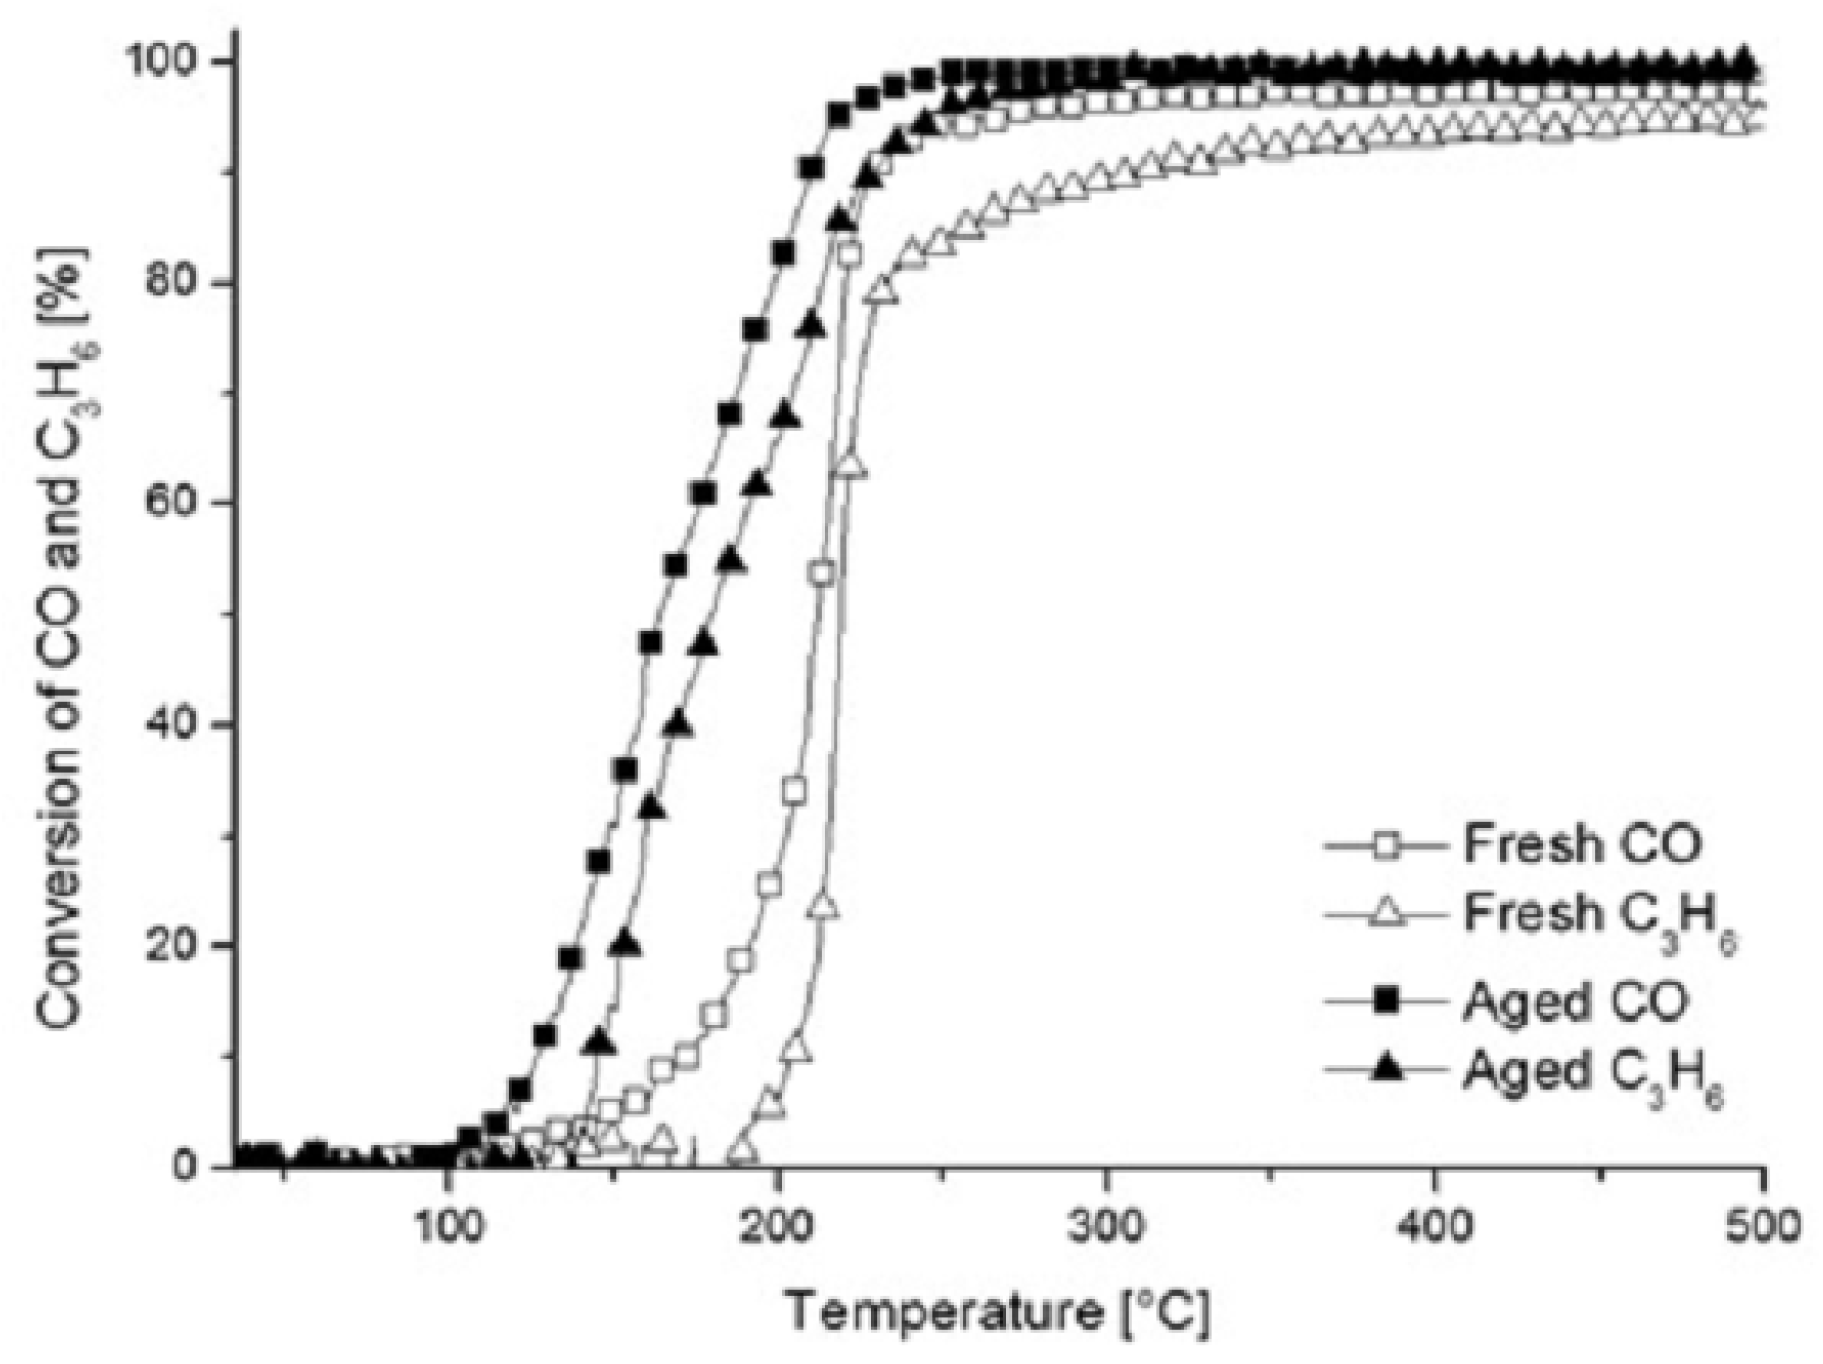
2.1.2. XRD and XPS Analysis, FTIR-ATR Measurements and Catalyst Performance Experiments

The X-ray diffraction analysis of diesel oxidation catalyst sheets is presented in Figure 7, revealing also an indication of an increase in the platinum particle size. The platinum peak was higher and sharper in the used samples. Differences between inlet and outlet samples were not observed, while both included obscure peaks arising from poisons and their compounds. This indicates that the deactivation has been effective throughout the catalyst from the inlet to the outlet.
The XPS analysis indicated that the binding energy of the platinum 3d5/2 line was 316.4 eV in the fresh sample and 312.5 eV in the aged one (Figure 8). This suggests that significant platinum reduction takes place during ageing [24]. As for catalyst poisons, survey scans showed prominent spectral lines for sulphur and phosphorus, and thus they were measured more thoroughly. The S 2p line was observed at 169.1 eV, whereas the P 2s line was located at 190.8 eV. The binding energies indicate that the poisons appear on the catalyst surface as sulphate and phosphate compounds [24]. The sulphur content was found to be 5.3 wt % and the phosphorus content 7.0 wt %.
The FTIR-ATR spectra of the vehicle-aged and fresh diesel oxidation catalysts are presented in Figure 9. Only some differences can be found between the fresh and the aged catalyst spectra, from which the three most obvious peaks (1073, 1365 and 1625 cm−1) are indicated.
The first broad peak at around 1100 cm−1 can be assigned to the sulphur species; for example, CeO2 sulphates are known to give a broad peak at ~1200 cm−1 and bulk sulphates near to 1160 cm−1. For the gas-phase SO2, the major peaks are 1151 cm−1 and 1363 cm−1, and for the gas phase, the SO3 major peaks are 1061 cm−1 and 1391 cm−1 [19]. An indication of aluminium sulphates can also be found at 1360 cm−1, 1290 cm−1, 1170 cm−1 and 1045 cm−1 [25]. The presence of phosphorus can also be considered, since the group frequency for the functional group of the phosphate ion is 1100–1000 cm−1. The broad peak at 1626 cm−1 was not clearly assigned to any of the poisons in the used diesel oxidation catalyst. According to the literature, there is a characteristic group frequency of organic nitrates at 1620–1640 cm−1 [26].
The studied gases in the catalyst performance tests were those typical for lean diesel exhaust gas. CO and C3H6 were used to compare the performance of diesel and natural gas catalyst materials. The results of the performance test are presented in Figure 10. As can be observed from the light-off curves of CO and C3H6, the aged diesel oxidation catalyst was surprisingly more active than the fresh diesel oxidation catalyst. With the aged diesel oxidation catalyst, after the very lean reaction gas mixture experiment, the colour of the catalyst was changed from black to light grey, as shown in Figure 10. The reason for this phenomenon is that the oxygen has “cleaned” the catalyst surface, by burning carbon, and therefore more active sites for CO adsorption are exposed. This can to some extent explain why the aged catalyst was more active than the fresh one. As seen in Figure 11, a lot of carbon can be found in the aged sheet. The SEM-EDS analyses from these sheets indicate a decrease in the amount of carbon in the sheet surface (from around 30 wt % of carbon in the used sheet to around 15 wt % in the performance-tested light-grey sheet).

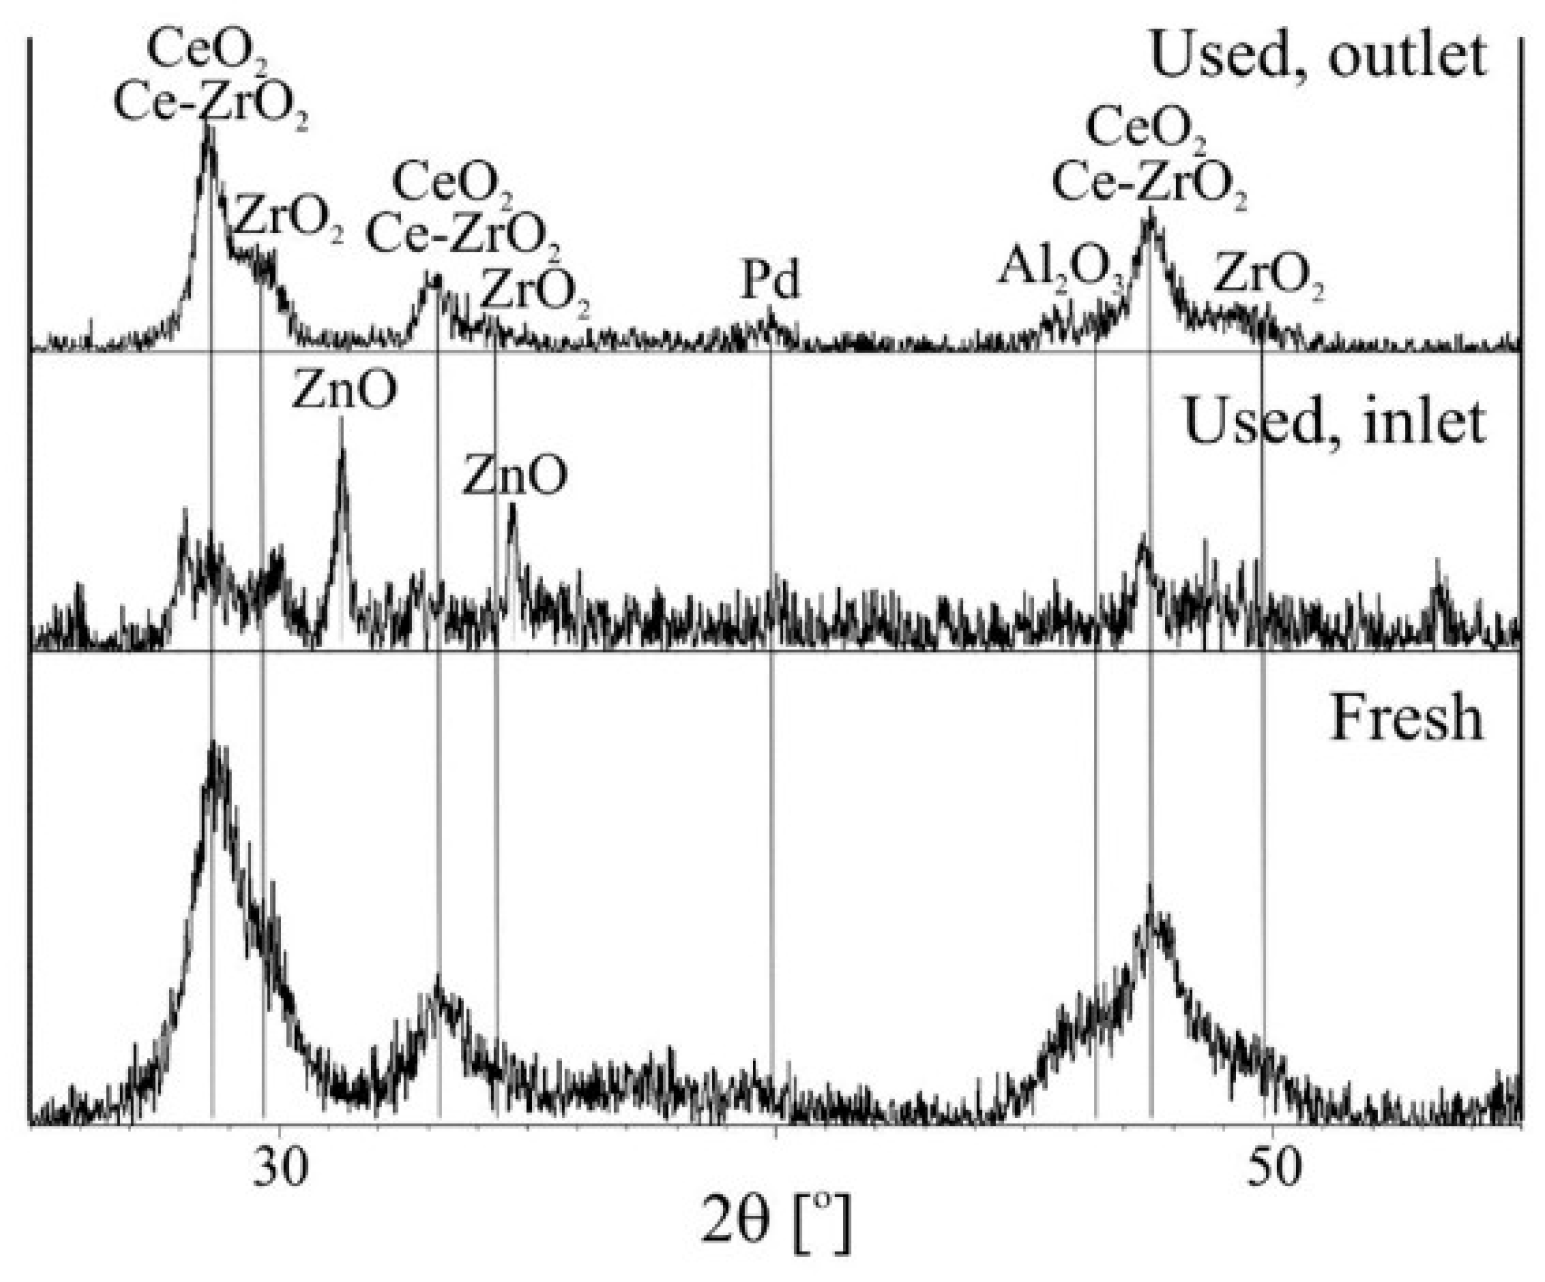
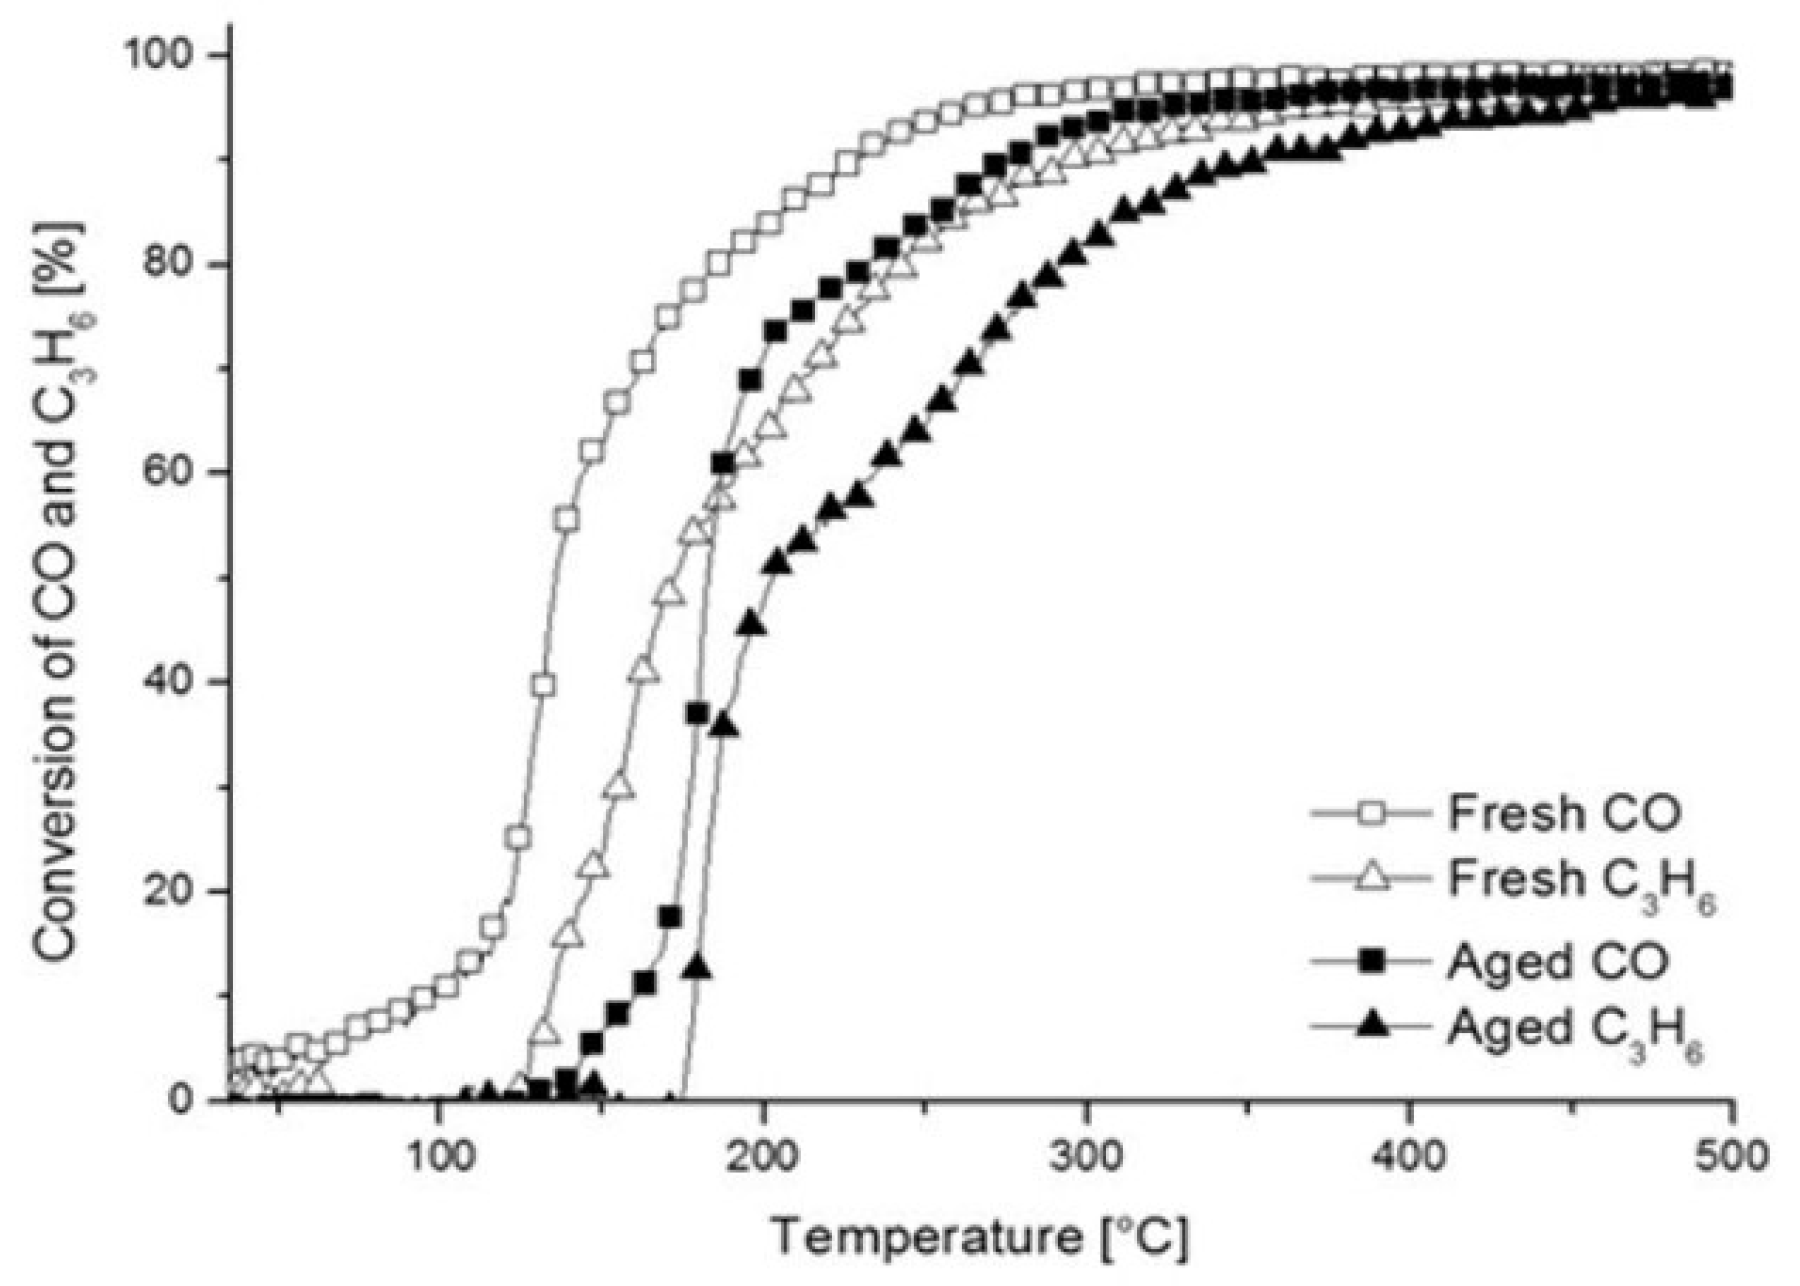
2.2. Natural Gas Catalyst

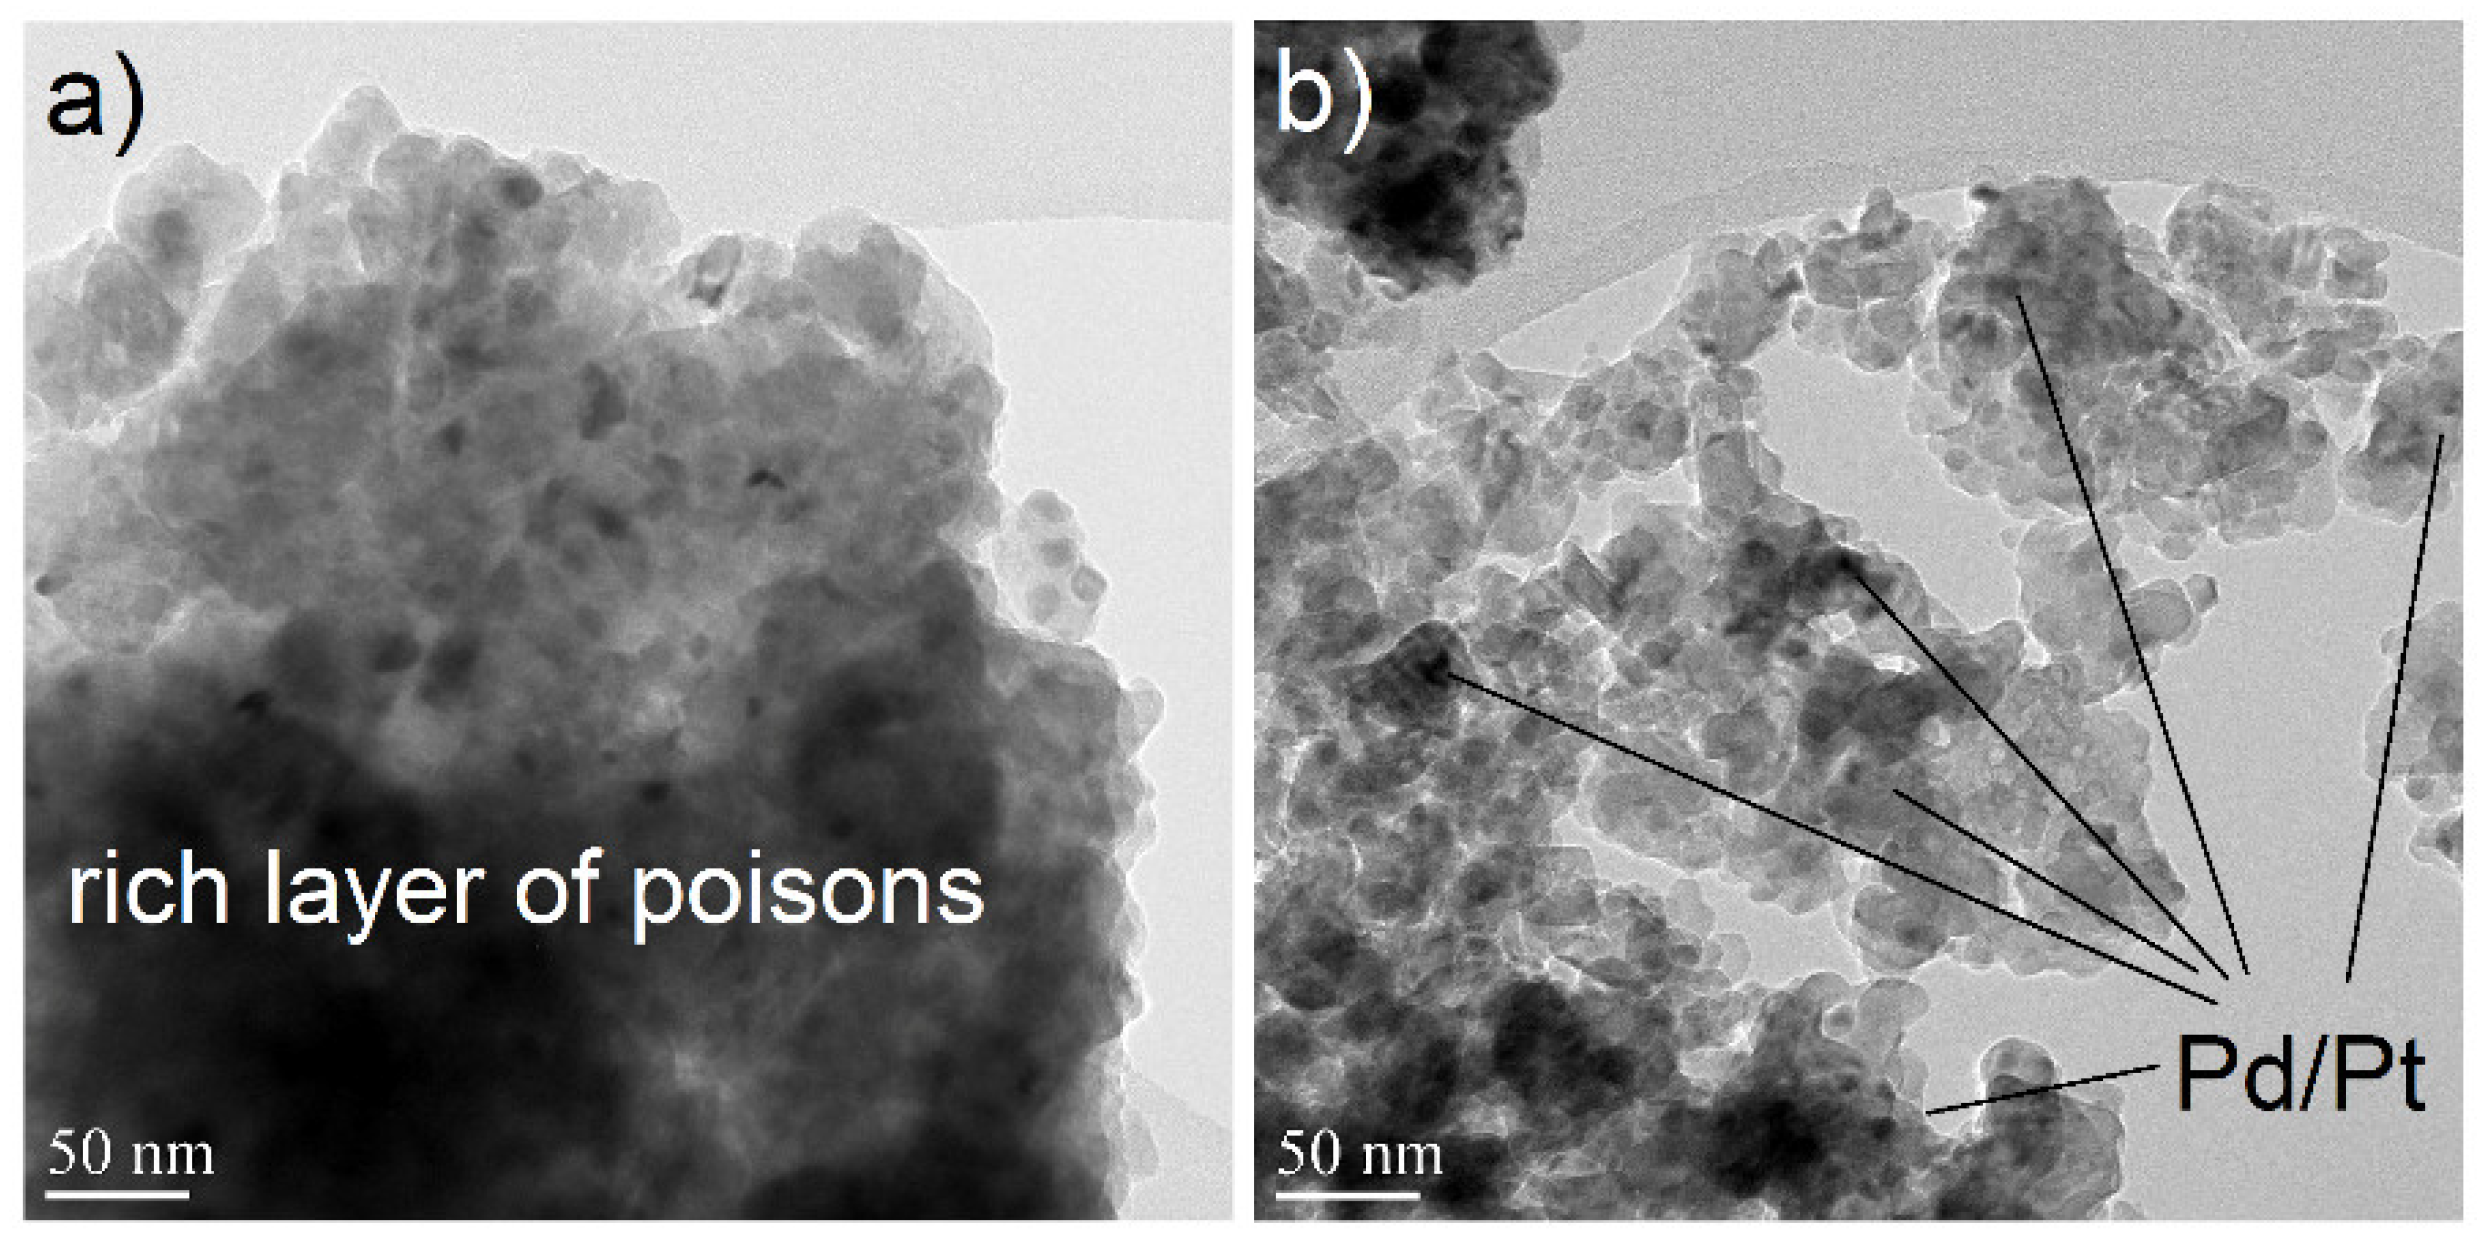
2.2.1. Electron Microscopy

The cross-sectional SEM images of natural gas catalysts in the used form are presented in Figure 12. The NG catalyst washcoat is an alumina-based mixture of metal oxides, mainly zirconium and cerium, supporting palladium and platinum catalysts.
In Figure 13, the SEM-EDS line analyses of the used inlet natural gas catalyst sheet are presented. On the top of the used inlet sample there is a porous layer containing mostly high concentrations of carbon and other poisoning elements, and this is excluded from the line analyses. Contents of poisons in the line analyses showed the presence of zinc, phosphorus and silicon throughout the washcoat. Zinc seems to attach to zirconia with contents up to 10 wt %, while silicon mainly follows the alumina content throughout the washcoat with contents of 5–12 wt %, and phosphorus is mostly in the outer layer of the catalyst with the content of 1–9 wt %. In the SEM-EDS spot analyses, a number of additional poisons were observed, mostly in the outer layer of the catalyst. These included potassium, chlorine, calcium and copper in variable contents depending on the analysed area. The natural gas outlet part did not have any poison layer, and EDS results did not show significant amounts of poisons in the outlet catalyst.
The fine structure of the fresh NG catalyst washcoat is presented in Figure 14. Detected poisons in the TEM-EDS spot analyses from aged natural gas catalyst samples (Figure 15) were S, P, K, Zn, Si, Ca and Cu in various amounts. Copper was not calculated in these analyses, since the powder sample holder is made of copper and thus gives an additional copper signal to the spectrum. The used outlet catalyst showed few or no structural changes or poisonous impurities after use (Figure 15b).
In the NG catalyst inlet part, significant noble metal particle growth was observed after the use, as seen in the cross-sectional TEM images in Figure 16a,b. In the fresh catalyst, the metal particle size was <5 nm, and after use it was 54 ± 23 nm as measured from the STEM images (100 particles measured). The structure of the used inlet catalyst had become more heterogeneous and dense compared to the fresh structure due to heavy sintering during use.
Three main poisoning elements, Ca, Cu and P, were included in the cross-sectional TEM-EDS map (Figure 17) of the inlet NG sample. One possible origin for copper can be the lubricant oil of the natural gas engine. In addition, copper seems to be mainly found together with noble metal particles (Figure 17). The presence of copper in the used catalysts needs further investigations in order to verify the occurrence of the phenomenon. High local concentrations of calcium were detected in both the EDS spot and map analyses. Pt was not included in the EDS map of the used sample due to its low amount. Again, phosphorus was spread quite evenly across the sample. The phosphorus detection has some uncertainties, due to the overlapping of Pt and Zr peaks.

2.2.2. XRD and XPS Analysis, FTIR-ATR Measurements and Catalyst Performance Experiments

The XRD patterns of the vehicle-aged and fresh natural gas catalysts are presented in Figure 18. The main components of the catalyst are cerium zirconium oxide, cerium oxide, alumina and palladium. The amount of Pt is too low to be detected by XRD. The composition of the catalyst is complex and therefore the analysis of the patterns is challenging, especially for the used samples, where several peaks remained unidentified. However, noble metal crystal growth can be detected, as indicated with the Pd peak in Figure 18 in the spectra from the inlet and outlet parts of the catalyst. The presence of poisons is obvious in the pattern of the inlet part covering the actual catalyst structure. One of the identified poisons was ZnO, and zinc was also detected by the EDS line analysis (Figure 13).
The XPS analysis indicated several catalytic poisons in the inlet end of the aged catalyst, most notably silicon (14 wt %), calcium (4.7 wt %) and phosphorus (2.6 wt %), but also potassium (0.8 wt %) and sulphur (0.14 wt %). Silicon appeared to be as SiO2, and calcium was also found to be oxidized [23]. Potassium was metallic, whereas sulphur and phosphorus were found as sulphates and phosphates, respectively [24]. The surveys on the outlet end showed almost no poisons. Only small traces of calcium (0.5 wt %) and sulphur (0.1 wt %) were found. The FTIR-ATR spectra of the vehicle-aged and fresh natural gas catalysts are presented in Figure 19. The clear differences between the fresh and the aged catalyst spectra are indicated by peaks at 1092, 1025, 725 and 662 cm−1. Peaks at around 1100–1000 cm−1 can be assigned, for example, to sulphur species of gas-phase SO3 and aluminium sulphates. Again, the phosphorus presence is possible, and also the C–S functional group frequencies can be assigned to peaks at 725 cm−1 and 662 cm−1 [19,25,26].
The studied gases in the catalyst performance tests were CO and C3H6. The results of the performance test are presented in Figure 20. For the natural gas catalyst, the fresh one was more active than the aged catalyst, as expected. Poisons and palladium crystal growth had affected the active sites of the catalyst, increasing the light-off temperature.

3. Materials and Methods

In this study, two different catalysts were studied after the vehicle ageing. Catalysts were designed and manufactured by Dinex Finland Oy. Both of the catalysts were compared to similar fresh catalysts in order to find out ageing-induced effects after use. The diesel oxidation catalyst was from a heavy-duty vehicle and it had been in service for 80,000 km. The natural gas vehicle catalyst was used for 85,000 km in a bus application, which had suffered some engine problems and thus, according to the catalyst manufacturer, had been severely poisoned during use. The catalyst support materials were mainly alumina with oxides of zirconium, lanthanum and cerium on a metallic substrate sheet. Precious metals were platinum in the diesel oxidation catalyst and palladium with platinum in the natural gas vehicle catalyst.

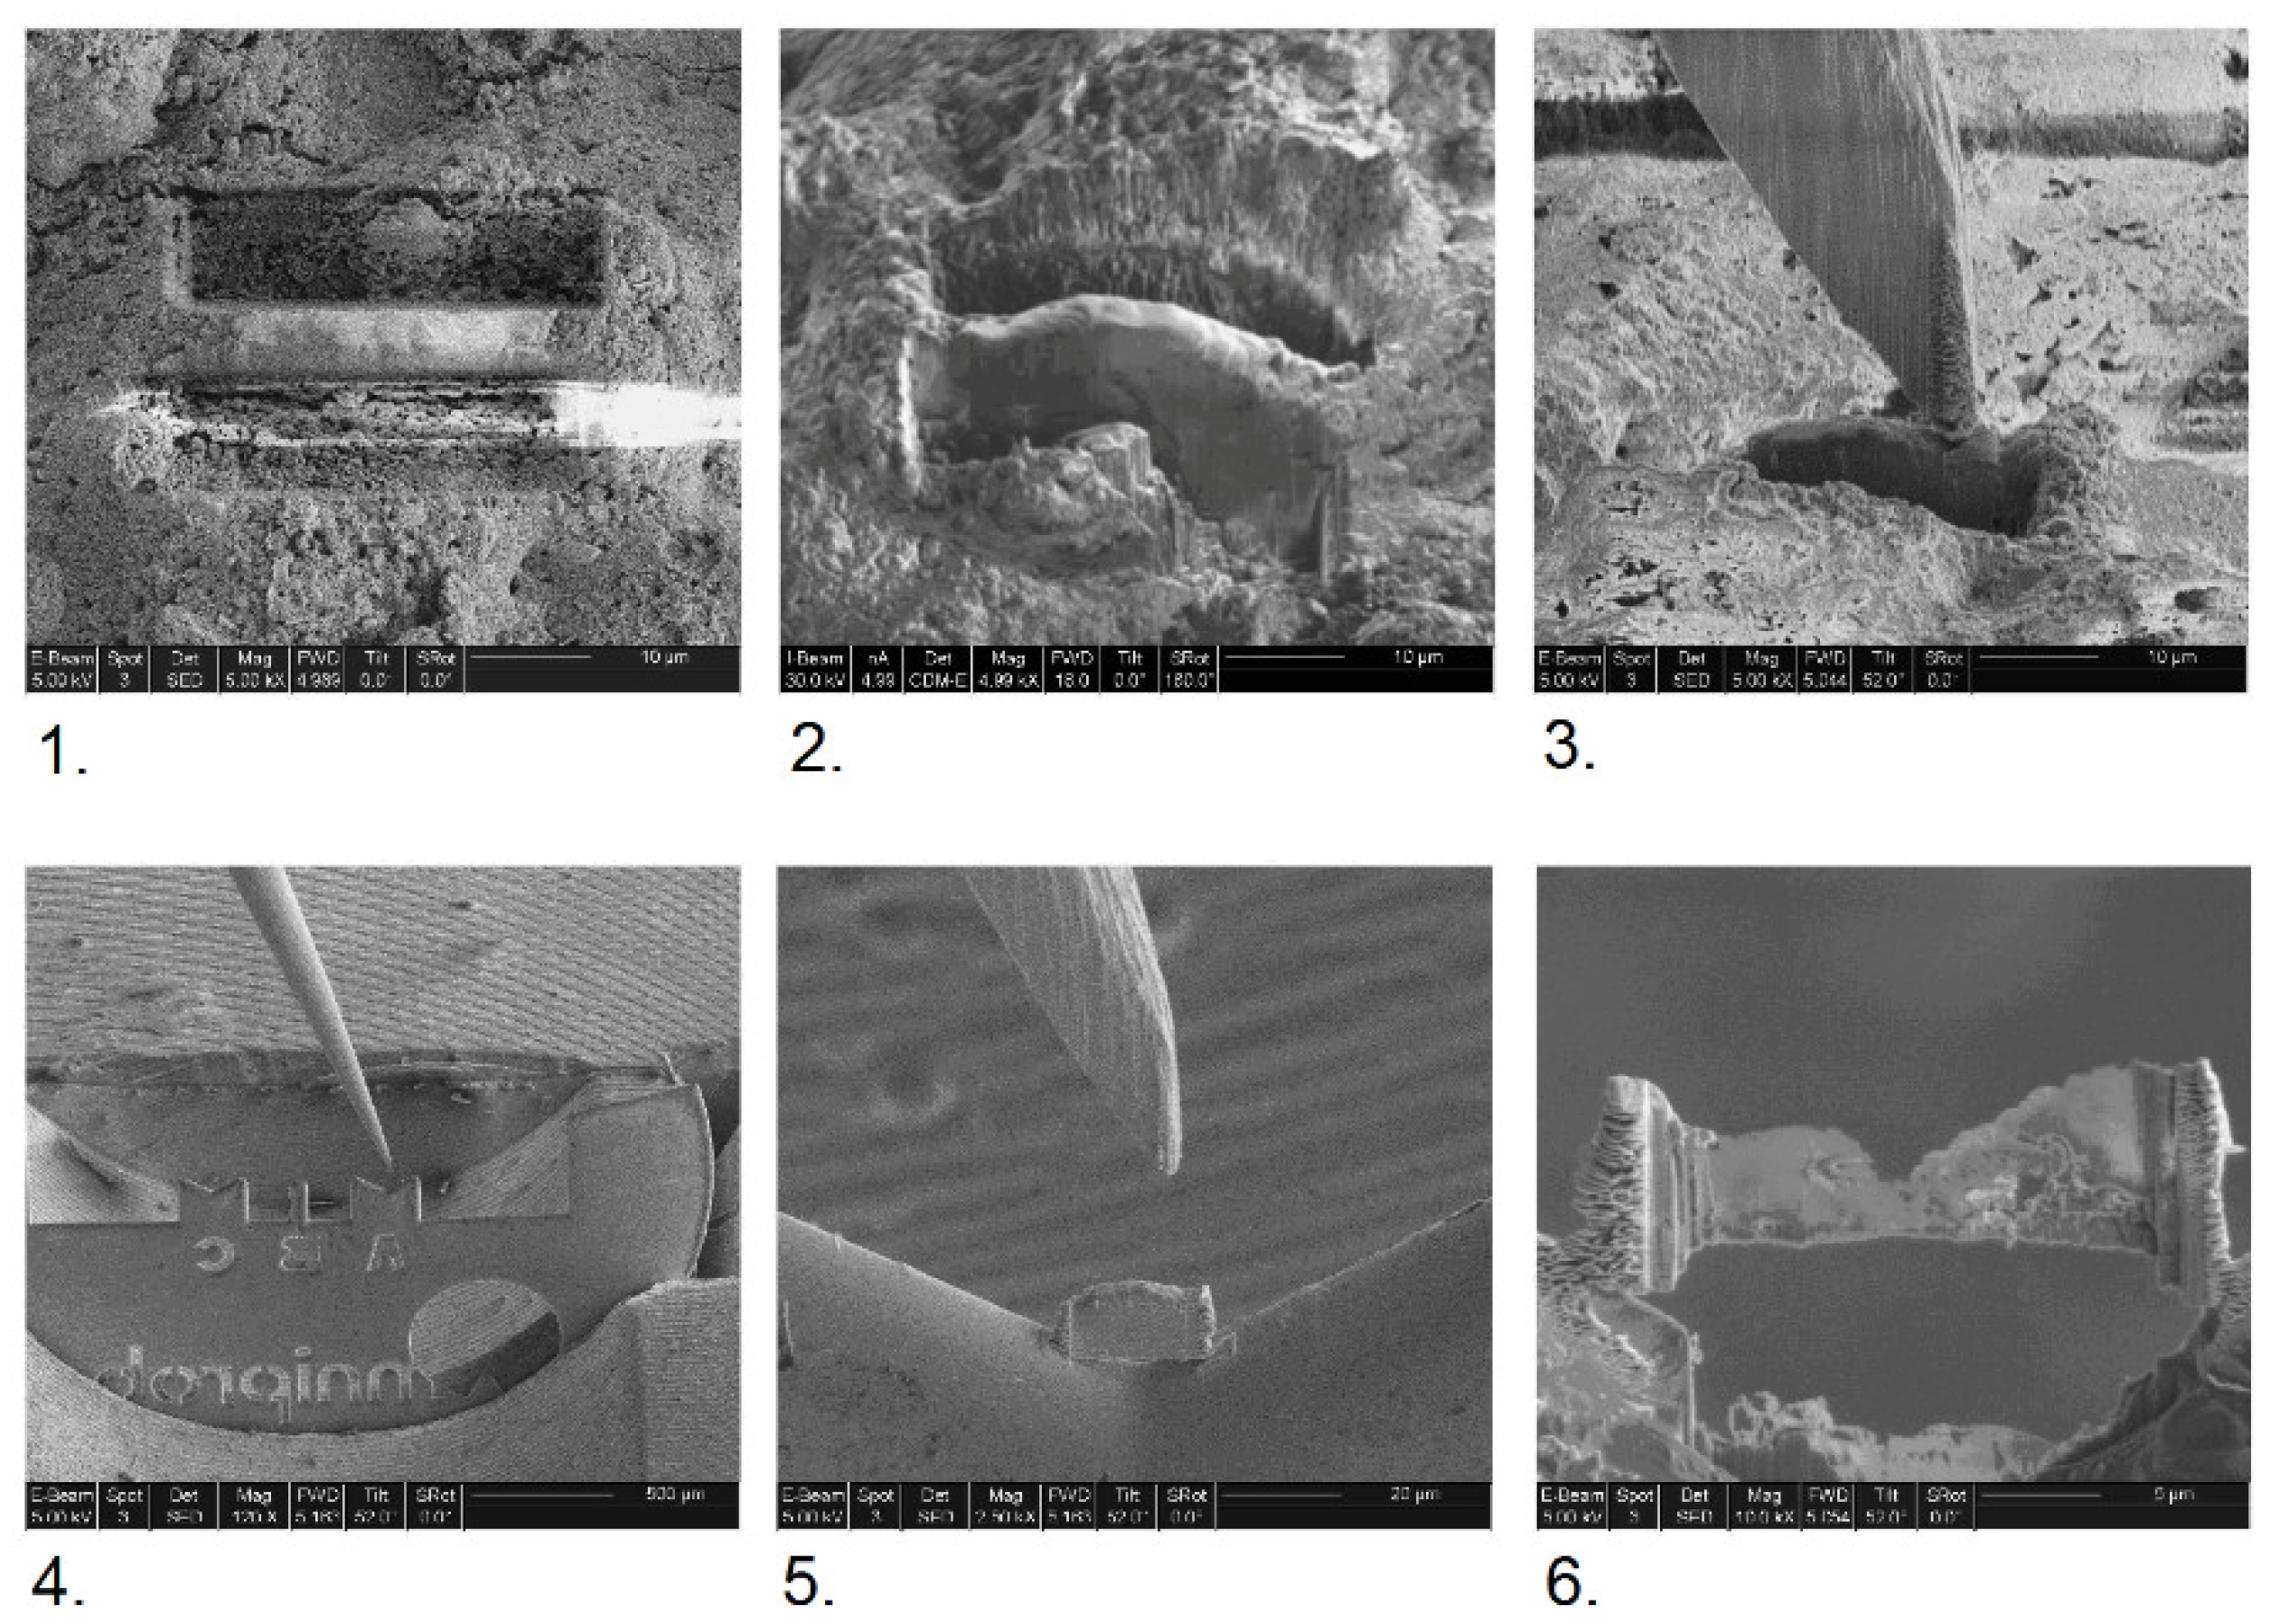
3.1. Electron Microscopy Characterization

Catalyst samples were studied with a transmission electron microscope and scanning electron microscope. The SEM analyses were carried out with field-emission SEMs (FESEMs) equipped with EDSs from Oxford Instruments (Oxford, UK). FESEMs used were: Zeiss ULTRAplus (Carl Zeiss, Oberkochen, Germany) together with EDS with INCAx-act silicon-drift detector (SDD) and Jeol JEM-7000F (Tokyo, Japan) together with EDS with XMaxN SDD. Samples for SEM-EDS analyses were prepared from the cross-sections of the metallic support sheets by mechanical grinding and polishing. Prior to SEM-EDS analyses, the polished samples were carbon-coated to avoid sample charging during SEM studies. The TEM analyses were carried out with analytical (scanning) transmission electron microscopes, JEM 2010 TEM from Jeol, equipped with an energy-dispersive spectrometer (EDS), ThermoNoran from Thermo Scientific (Waltham, MA, USA), F200 STEM from Jeol and CM200 FEG–TEM from FEI (Eindhoven, The Netherlands) equipped with an Oxford Instruments EDS system, all operated at 200 kV. Samples from catalyst powders separated from metallic catalyst sheets were prepared for TEM by crushing the powder between glass slides. The crushed powder was dispersed onto a holey carbon-covered Cu grid with ethanol.
The cross-sectional samples for TEM analyses were prepared by an in-situ lift-out technique with focused ion beam milling in an FEI Strata 235 Dual Beam. Due to the poor electrical conductivity of the ceramic matrix, the materials had to be coated with a thin carbon film to reduce any charging from the beam in the FIB system. The lift-out procedure started with depositing a 25 × 5 × 1 µm3 Pt layer to protect the material during milling. Trenches, about 10 µm deep were then milled on each side of the Pt strip (step 2, Figure 21). Membranes, with a size of approximately 20 × 10 µm2 (step 3, Figure 21), were lifted out from the materials and mounted on Cu grids (step 5, Figure 21). The membranes were then thinned to electron transparency with ion beam currents down to 50 pA. Due to the porosity of the materials, it was difficult to achieve a homogeneous thickness over large areas. Figure 21 presents SEM images of different steps of the FIB sample preparation. Image of the final stage of the preparation (step 6) shows the sample used in the TEM analyses.

3.2. Catalyst Characterization

Phase structures of catalysts were studied with an X-ray diffractometer (XRD), the Empyrean multipurpose diffractometer with PIXcel3D solid-state detector from PANalytical (Almelo, The Netherlands) using copper Kα-radiation. Phases were identified by using the database (PDF-4+ 2015) from the International Centre for Diffraction Data (Newtown Square, PA, USA). The elemental concentrations and chemical states of the studied samples were analysed by using X-ray photoelectron spectroscopy (XPS, SSX-100, Surface Science Instruments, Mountain View, CA, USA) using monochromatic aluminium Kα radiation. The samples were pretreated by vacuum for a few hours before the measurements. The equipment for the FTIR-ATR (Fourier-transform infrared–attenuated total reflectance) analyses of surface compositions was a Bruker Optics Tensor 27 (Billerica, MA, USA). The ATR diamond accessory method was used to measure the spectra in the range from 4000 cm−1 to 400 cm−1 with the resolution of 4 cm−1 of both the used inlet and fresh catalyst sheet samples.
Catalytic performance for the fresh and aged diesel as well as natural gas catalysts was measured by using laboratory-scale light-off experiments. A dry lean gas mixture was used to reveal differences between samples. The gas mixture contained 500 ppm of CO, 300 ppm of C3H6, and 12 vol % of air, balanced with N2. The measurements were carried out at atmospheric pressure in a tubular furnace with a quartz reactor. A metal sheet sample (0.53–0.55 g) was placed in the reactor tube. The gas flows were controlled by mass flow controllers (Brooks 5850TR, Brooks Instrument, Hatfield, PA, USA) and the total flow during the experiment was 1 dm3/min. The temperature of the reactor was increased from room temperature up to 500 °C with a linear heating rate of 10 °C/min. The compound concentrations in the feed and product gases were measured as a function of temperature every 5 s by a GasmetTM FTIR gas analyser (Helsinki, Finland). Oxygen concentration was determined by using a paramagnetic oxygen analyser (ABB Advanced Optima, Zürich, Switzerland).

4. Conclusions

Catalysts from a diesel engine and natural gas engine were studied both fresh and after their use in heavy-duty vehicles. Both of the catalysts had suffered poisoning- and ageing-induced microstructural changes in the support material and in the noble metals. The diesel oxidation catalyst poisons of sulphur, phosphorus and additional oil lubricant-based impurities were detected throughout the diesel oxidation catalyst, in both inlet and outlet parts. Slight platinum particle growth and poisoning-induced shape transformation to a more spherical form were observed especially in the areas of phosphorus poisoning, typically in the alumina-rich areas and on the surface of the washcoat. In addition, platinum reduction took place during ageing. The most common poison in the diesel oxidation catalyst, sulphur, was connected to cerium-rich areas in the diesel oxidation catalyst samples, forming sulphate compounds. For the natural gas oxidation catalyst, the poisoning and structural effects were only present in the inlet part of the catalyst. Significant palladium and platinum particle sintering was observed in the inlet part of the catalyst. In addition, the washcoat structure had changed severely due to the ageing. Also, the poison variety and amounts were larger in the natural gas oxidation catalyst samples, partly due to the failure history of the engine. The catalyst performance studies indicated this very well. In the real-life use of two different catalysts, the poison penetration through the catalyst varied greatly depending on the engine and fuel at hand. The diesel oxidation catalyst appeared to suffer from more thorough changes than the natural gas catalyst, which was affected only in the inlet part of the catalyst. On the other hand, the severity of the effects could be more pronounced in the natural gas oxidation catalyst with heavy structural changes, that is, densification of the washcoat and sintering of noble metals, and high concentrations of poisons in the inlet catalyst surfaces. In this study, it was highlighted that the experimental setup for investigations should be as comprehensive as possible to reveal numerous aspects of vehicle ageing of catalysts for different fuel varieties.

Author Contributions

Conceptualization, T.K. (Tomi Kanerva), M.H. and M.V.; methodology and investigation T.K. (Tomi Kanerva), M.H., T.K. (Tanja Kolli), O.H. and T.S.; writing—original draft preparation, T.K. (Tomi Kanerva), M.H. and M.V.; writing—review and editing, all; supervision, K.K., J.L., E.O., R.L.K. and M.V.

Funding

Authors acknowledge financial support from the 100th Anniversary Foundation of the Federation of Finnish Technology Industries and the Academy of Finland is thanked for funding (Decision numbers 138798 and 139187).

Acknowledgments

Gustaf Östberg is acknowledged for performing FIB sample preparations and associated TEM analyses. Maija Hoikkanen and Juha-Pekka Nikkanen are acknowledged for carrying out the FTIR-ATR measurements. This work made use of Tampere Microscopy Center facilities at Tampere University.

Conflicts of Interest

The authors declare no conflict of interest.

References

  1. DieselNet. Available online: https://www.dieselnet.com/ (accessed on 16 January 2019).
  2. Heck, R.M.; Farrauto, R.J. Automobile Exhaust catalysts. Appl. Catal. A 2001, 221, 443–457. [Google Scholar] [CrossRef]
  3. Gandhi, H.S.; Graham, G.W.; McCabe, R.W. Automotive exhaust catalysis. J. Catal. 2003, 216, 433–442. [Google Scholar] [CrossRef]
  4. Andersson, J.; Antonsson, M.; Eurenius, L.; Olsson, E.; Skoglundh, M. Deactivation of diesel oxidation catalysts: Vehicle- and synthetic ageing correlations. Appl. Catal. B 2007, 72, 71–81. [Google Scholar] [CrossRef]
  5. Argyle, M.D.; Bartholomew, C.H. Heterogeneous Catalyst Deactivation and Regeneration: A Review. Catalysts 2015, 5, 145–269. [Google Scholar] [CrossRef]
  6. Air Topics. Available online: https://www.epa.gov/environmental-topics/air-topics (accessed on 20 February 2018).
  7. Wang, D.; Epling, B.; Nova, I.; Szanyi, J. Advances in Automobile Emissions Control Catalysis. Catal. Today 2016, 267, 1–2. [Google Scholar] [CrossRef]
  8. Wiebenga, M.H.; Kim, C.H.; Schmieg, S.J.; Oh, S.H.; Brown, D.B.; Kim, D.H.; Lee, J.-H.; Peden, C.H.F. Deactivation mechanisms of Pt/Pd-based diesel oxidation catalysts. Catal. Today 2012, 184, 197–204. [Google Scholar] [CrossRef]
  9. Matam, S.K.; Otal, E.H.; Aguirre, M.H.; Winkler, A.; Ulrich, A.; Rentsch, D.; Weidenkaff, A.; Ferri, D. Thermal and chemical aging of model three-way catalyst Pd/Al2O3 and its impact on the conversion of CNG vehicle exhaust. Catal. Today 2012, 184, 237–244. [Google Scholar] [CrossRef]
  10. Honkanen, M.; Kärkkäinen, M.; Viitanen, V.; Jiang, H.; Kallinen, K.; Huuhtanen, M.; Vippola, M.; Lahtinen, J.; Keiski, R.L.; Lepistö, T. Structural characteristics of natural-gas-vehicle-aged oxidation catalyst. Top. Catal. 2013, 56, 576–585. [Google Scholar] [CrossRef]
  11. Kärkkäinen, M.; Kolli, T.; Honkanen, M.; Heikkinen, O.; Huuhtanen, M.; Kallinen, K.; Lepistö, T.; Lahtinen, J.; Vippola, M.; Keiski, R.L. The effect of phosphorus exposure on diesel oxidation catalysts Part I: Activity measurements, elementary and surface analysis. Top. Catal. 2015, 58, 961–970. [Google Scholar] [CrossRef]
  12. Honkanen, M.; Kärkkäinen, M.; Heikkinen, O.; Kallinen, K.; Kolli, T.; Huuhtanen, M.; Lahtinen, J.; Keiski, R.L.; Lepistö, T.; Vippola, M. The effect of phosphorus exposure on diesel oxidation catalysts—Part II: Characterization of structural changes by transmission electron microscopy. Top. Catal. 2015, 58, 971–976. [Google Scholar] [CrossRef]
  13. Wilburn, M.S.; Ebling, W.S. Sulfur deactivation and regeneration of mono- and bimetallic Pd-Pt methane oxidation catalysts. Appl. Catal. B 2017, 206, 589–598. [Google Scholar] [CrossRef]
  14. Kanerva, T.; Rahkamaa-Tolonen, K.; Vippola, M.; Lepistö, T. Preparation of cross-sectional transmission electron microscopy samples from vehicle-aged and fresh diesel catalysts. In Proceedings of the EUROPACAT VIII, Turku, Finland, 26–31 August 2007. [Google Scholar]
  15. Millo, F.; Rafigh, M.; Andreata, M.; Vlachos, T.; Arya, P.; Miceli, P. Impact of high sulfur fuel and de-sulfaction process on a close-coupled diesel oxidation catalyst and diesel particulate filter. Fuel 2017, 198, 58–67. [Google Scholar] [CrossRef]
  16. Väliheikki, A.; Kärkkäinen, M.; Honkanen, M.; Heikkinen, O.; Kolli, T.; Kallinen, K.; Huuhtanen, M.; Vippola, M.; Lahtinen, J.; Keiski, R.L. Deactivation of Pt/SiO2-ZrO2 diesel oxidation catalysts by sulphur, phosphorus and their combinations. Appl. Catal. B 2017, 218, 409–419. [Google Scholar] [CrossRef]
  17. Gremminger, A.; Lott, P.; Menno, M.; Casapu, M.; Grunwaldt, J.-D.; Deutschmann, O. Sulfur poisoning and regeneration of bimetallic Pd-Pt methane oxidation catalysts. Appl. Catal. B 2017, 218, 833–843. [Google Scholar] [CrossRef]
  18. Sadokhina, N.; Smedler, G.; Nylén, U.; Olofsson, M.; Olsson, L. Deceleration of SO2 poisoning on PtPd/Al2O3 catalyst during complete methane oxidation. Appl. Catal. B 2018, 236, 384–395. [Google Scholar] [CrossRef]
  19. Luo, T.; Vohs, J.M.; Gorte, R.J. An Examination of Sulfur Poisoning on Pd/Ceria Catalysts. J. Catal. 2002, 210, 397–404. [Google Scholar] [CrossRef]
  20. Majumdar, S.S.; Alexander, A.-M.; Gawade, P.; Celik, G.; Ozkan, U.S. Effect of alumina incorporation on the sulfur tolerance of the dual-catalyst aftertreatment system for reduction of nitrogen oxides under lean conditions. Catal. Today 2019, 320, 204–213. [Google Scholar] [CrossRef]
  21. Beck, D.D.; Sommers, J.W.; Dimaggio, C.L. Axial characterization of oxygen storage capacity in close-coupled lightoff and underfloor catalytic converters and impact of sulfur. Appl. Catal. B 1997, 11, 273–290. [Google Scholar] [CrossRef]
  22. Beck, D.D.; Sommers, J.W. Impact of sulfur on the performance of vehicle-aged palladium monoliths. Appl. Catal. B 1994, 6, 185–200. [Google Scholar] [CrossRef]
  23. Beck, D.D. Impact of sulfur on three-way automotive catalyst performance and catalyst diagnostics. Catal. Deactiv. 1997, 111, 21–38. [Google Scholar] [CrossRef]
  24. NIST X-ray Photoelectron Spectroscopy Database; version 4; National Institute of Standards and Technology: Gaithersburg, MD, USA, 2012. Available online: http://srdata.nist.gov/xps/ (accessed on 1 July 2016).
  25. Gracia, F.J.; Guerrero, S.; Wolf, E.E.; Miller, J.T.; Kropf, A.J. Kinetics, operando FTIR, and controlled atmosphere EXAFS study of the effect of sulfur on Pt-supported catalysts during CO oxidation. J. Catal. 2005, 233, 372–387. [Google Scholar] [CrossRef]
  26. Coates, J. Encyclopedia of Analytical Chemistry; Meyers, R.A., Ed.; John Wiley & Sons Ltd.: Chichester, UK, 2000. [Google Scholar]
Figure 1. The cross-sectional SEM image of the diesel oxidation catalyst, (a) the inlet part of the vehicle-aged catalyst and (b) the outlet part of the vehicle-aged catalyst.
Catalysts 09 00137 g001
Figure 2. SEM-EDS line analysis from the vehicle-aged diesel (inlet) catalyst.
Catalysts 09 00137 g002
Figure 3. TEM images from the fresh diesel oxidation catalyst with (a) lower and (b) higher magnification.
Catalysts 09 00137 g003
Figure 4. TEM images from (a) the vehicle-aged diesel inlet catalyst. (b) and (c) showing the carbon and phosphorus poisoned areas, respectively.
Catalysts 09 00137 g004
Figure 5. The cross-sectional TEM images of (a) the fresh diesel oxidation catalyst and (b) the vehicle-aged inlet diesel oxidation catalyst.
Catalysts 09 00137 g005
Figure 6. Cross-sectional TEM–EDS map from the vehicle-aged diesel (inlet) catalyst.
Catalysts 09 00137 g006
Figure 7. XRD patterns of the fresh and used diesel oxidation catalysts.
Catalysts 09 00137 g007
Figure 8. XPS spectra on platinum 4d5/2 lines measured from the diesel oxidation catalyst. While Shirley background subtraction has been used in the analysis, the background lines in the images have been drawn to guide the eye.
Catalysts 09 00137 g008
Figure 9. FTIR-ATR spectra of the vehicle-aged and fresh diesel oxidation catalysts.
Catalysts 09 00137 g009
Figure 10. The conversion curves of CO and C3H6 for the fresh and aged diesel oxidation catalysts. Conditions: m = 530–550 mg, 500 ppm CO, 300 ppm C3H6, and 12 vol % air, balanced with N2.
Catalysts 09 00137 g010
Figure 11. The sections of the diesel oxidation catalyst sheets: fresh, vehicle-aged and performance-tested.
Catalysts 09 00137 g011
Figure 12. The cross-sectional SEM images of the natural gas catalyst, (a) the inlet part of the vehicle-aged catalyst and (b) the outlet part of the vehicle-aged catalyst.
Catalysts 09 00137 g012
Figure 13. SEM-EDS line analysis from the vehicle-aged natural gas (inlet) catalyst.
Catalysts 09 00137 g013
Figure 14. TEM image from the fresh natural gas catalyst.
Catalysts 09 00137 g014
Figure 15. TEM images from the vehicle-aged natural gas catalyst (a) inlet, (b) outlet.
Catalysts 09 00137 g015
Figure 16. The cross-sectional TEM image of (a) the fresh natural gas catalyst and (b) the vehicle-aged inlet natural gas catalyst.
Catalysts 09 00137 g016
Figure 17. The cross-sectional TEM-EDS map of the inlet natural gas sample.
Catalysts 09 00137 g017
Figure 18. XRD patterns of the fresh and used natural gas catalysts.
Catalysts 09 00137 g018
Figure 19. FTIR-ATR spectra of the vehicle-aged and fresh natural gas catalysts.
Catalysts 09 00137 g019
Figure 20. The conversion curves of CO and C3H6 for the fresh and aged natural gas catalysts.
Catalysts 09 00137 g020
Figure 21. Focused Ion Beam sample preparation steps 1–6. Steps 1 and 2 are from the milled trenches on the surface of the catalyst. Steps 3–5 are from the lift-out and mounting procedure. Step 6 is the final thinned sample.
Catalysts 09 00137 g021

