Strong Photo-Oxidative Capability of ZnWO4 Nanoplates with Highly Exposed {0 1 1} Facets


1
School of Mathematics and Physics, Changzhou University, Jiangsu 213164, China
2
College of Physics & Electronic Information, Yunnan Normal University, Kunming 650500, China
*
Author to whom correspondence should be addressed.
Catalysts 2019, 9(2), 178; https://doi.org/10.3390/catal9020178
Submission received: 17 January 2019
/
Revised: 5 February 2019
/
Accepted: 6 February 2019
/
Published: 14 February 2019
(This article belongs to the Special Issue Nanostructured Materials for Photocatalysis)
Abstract
:ZnWO4 nanoplates with highly exposed {01} facets were synthesized via a hydrothermal technique. The phase, morphology, and optical characteristics of ZnWO4 nanoplates were characterized with scanning electron microscopy, transmission electron microscopy, X–ray diffraction, diffuse ultraviolet–visible light (UV–Vis) reflectance spectroscopy, photoluminescence (PL) spectrophotometry, and PL lifetime spectroscopy. Optical characterizations, along with the density functional calculations, confirm that the strong blue PL band of ZnWO4 nanoplates originates from the intrinsic defects in ZnWO4 nanoplates. Furthermore, photocatalytic tests show that ZnWO4 nanoplates exhibit strong photo-oxidative capability of complete mineralization of the organic pollutant (methyl orange) in water, whereas ZnWO4 nanoparticles can only cleave the organic molecules into fragments. The superior photo-oxidative capability of ZnWO4 nanoplates can be attributed to the specific chemical bonding and stereochemistry on the exposed facets. This work demonstrates that crystal facet engineering is an efficient strategy to endow ZnWO4 with strong photo-oxidative capability.
1. Introduction
Zinc tungstate (ZnWO4) is known for its use as an efficient scintillator [1], phosphor [2], photocatalyst [3], and photoelectrocatalyst [4,5]. In order to solve the serious environmental problem of organic contaminants in waste water by harnessing the solar power of sunlight, a variety of ZnWO4 nanostructures were intensively investigated as photocatalysts [6,7,8,9,10,11,12]. With the aim of significantly improving the photocatalytic activity of ZnWO4 photocatalysts, previous research activities can be divided into three classes: (i) morphology engineering by varying the morphology of ZnWO4 from nanoparticles [3,7,11], to nanorods [3,6,10,12,13], nanowires [9], and nanosheets [14]; (ii) defect engineering by doping ZnWO4 with non-metal ions (i.e., B, C, N, F [15,16,17]), transition metal ions (i.e., Sn2+, Cr3+, Mn2+, Cu2+, Bi3+, Dy3+ [18,19,20]); and (iii) coupling ZnWO4 with other semiconductors (i.e., In2S3 [21], ZnO [7], Cu2O [22]) or metals (Ag) [6]. In spite of the progress achieved in the past 20 years, no data were given to demonstrate if these ZnWO4 nanostructures can completely mineralize the fragments of organic pollutants into waste water [3,4,5,6,7,8,9,10,11,12,13,14,15,16,17,18,19,20,21,22,23]. Since the intermediates formed through the photocatalytic reactions are often more toxic than the original organic contaminants in waste water, it is critically important for the ZnWO4 photocatalysts to have such a strong photo-oxidative capability that they can completely mineralize these harmful intermediates.
Being present in many crystals, crystal facets sometimes exhibit exotic performance in photocatalysts due to different ions exposed on different facets [24,25,26,27]. For example, crystal-facet-dependent photocatalytic activities were demonstrated in Fe2O3 for water splitting [24]. Therefore, it is expected that ZnWO4 nanoplates will have quite different photocatalytic performance with respect to ZnWO4 nanoparticles. However, the profound influence of the crystal facet on the photocatalytic activity of ZnWO4 attracted little attention [4]. In our previous report, Eu2+ and Eu3+ doubly doped ZnWO4 nanoplates were synthesized, and their light-emitting properties and electronic structures were studied [28]. In this paper, we report on the synthesis and photocatalytic performances of ZnWO4 nanoplates with {01}, {100}, {010}, and {001} facets. It was found that ZnWO4 nanoplates with {01} facets can completely mineralize organic pollutant methyl orange in waste water, whilst ZnWO4 nanoplates with {010}, {001}, and {100} plates can only partially mineralize methyl orange molecules. In particular, the photo-oxidative capabilities of these ZnWO4 nanoplates were found to decrease in the sequence of {01}, {010}, {001}, and {100}. This work demonstrates that crystal facet engineering is an efficient strategy to design highly photo-oxidative ZnWO4 photocatalysts.
2. Results and Discussions
2.1. Morphology and Crystal Structure of ZnWO4 Nanoplates
The SEM micrograph, the low-resolution TEM micrograph, and the high-resolution TEM micrograph of ZnWO4 nanoplates are shown in Figure 1. As shown in Figure 1a, the length of ZnWO4 nanoplates is on the order of micrometers, and the width of ZnWO4 nanoplates ranges from 20 to 80 nm. From the SEM micrograph shown in Figure 1a, we can also estimate the thickness of ZnWO4 nanoplates. When the facets are perpendicular to the reader, the ZnWO4 nanoplates look like nanorods, whose thickness was estimated to be approximately 10 nm. Further evidence is given in Figure 1b on the formation of nanoplates. Uniform image contrast is clearly shown in Figure 1b for each nanoplate. If the synthesized ZnWO4 nanostructures were in the form of nanorods, their image contrast would be decreased gradually from the nanorod edge toward its center line because thicker areas in the nanorods appear darker [12]. Figure 1c displays the high-resolution TEM micrograph of one ZnWO4 nanoplate to reveal its lattice structure. It can also be seen in Figure 1c that the spacing between two adjacent planes was about 0.469 nm, which is in good agreement with the distance between two (100) crystal planes of ZnWO4 nanoplates. Additionally, the image contrast of the ZnWO4 nanoplate in Figure 1c is uniform.
Facets are flat faces on geometric shapes. Since they reflect the underlying symmetry of the crystal structure, the organization of naturally occurring facets in ZnWO4 nanoplates is key to the investigation of the crystal facet effect. Thus, the orientation of these nanoplates should be properly identified. The electron diffraction pattern is shown in Figure 2 for ZnWO4 nanoplates. The diffraction spots of most important crystallographic planes are labeled in Figure 2. From the Miller index of the diffraction spots, the zone axis of ZnWO4 nanoplates was determined to be [01]. In this way, the normal line of the nanoplate was determined as [01]. It is clear that this zone axis was perpendicular to the (100) crystallographic plane. Consequently, Figure 2 reveals that the highly exposed facet of the ZnWO4 nanoplate can be indexed to {01}.
In order to confirm the formation of ZnWO4 nanoplates, we recorded high-resolution SEM micrographs to show the edges of the nanoplates. The high-resolution SEM micrographs of ZnWO4 nanoplates are shown in Figure 3. As shown in Figure 3, the edges of large ZnWO4 nanoplates can be seen clearly. Detailed analysis reveals that the two largest nanoplates in Figure 3a are about 400 nm wide and 50 nm thick, whilst the largest nanoplate in Figure 3b is about 200 nm in width and 30 nm in thickness. These SEM micrographs readily prove the formation of ZnWO4 nanoplates.
Figure 4 gives the X-ray diffraction (XRD) curve (a) and energy-dispersive X-ray spectroscopy (EDX) spectrum (b) of ZnWO4 nanoplates. The open circles in Figure 4a represent the raw data, while the solid green curve represents the calculated diffractogram using the Rietveld refinement [29]. The diffraction peaks in Figure 4a agree well with those of monoclinic ZnWO4 [2,6]. On the basis of Rietveld refinement, we derived the lattice parameters as 0.4683 nm (a), 0.5747 nm (b), 0.4949 nm (c), and 90.57° (β). As listed in the JCPDF standard card No. 15–0774, the lattice parameters are 0.4691 nm (a), 0.5720 nm (b), 0.4925 nm (c), and 90.64° (β) for monoclinic ZnWO4. Thus, the XRD data in Figure 4a verified that monoclinic ZnWO4 nanoplates were formed. The EDX spectrum of ZnWO4 nanoplates is depicted in Figure 4b. The characteristic X–ray emissions of O, Zn, and W are marked in Figure 4b. The data in Figure 4b show that elements O, Zn, and W were present in the ZnWO4 nanoplates.
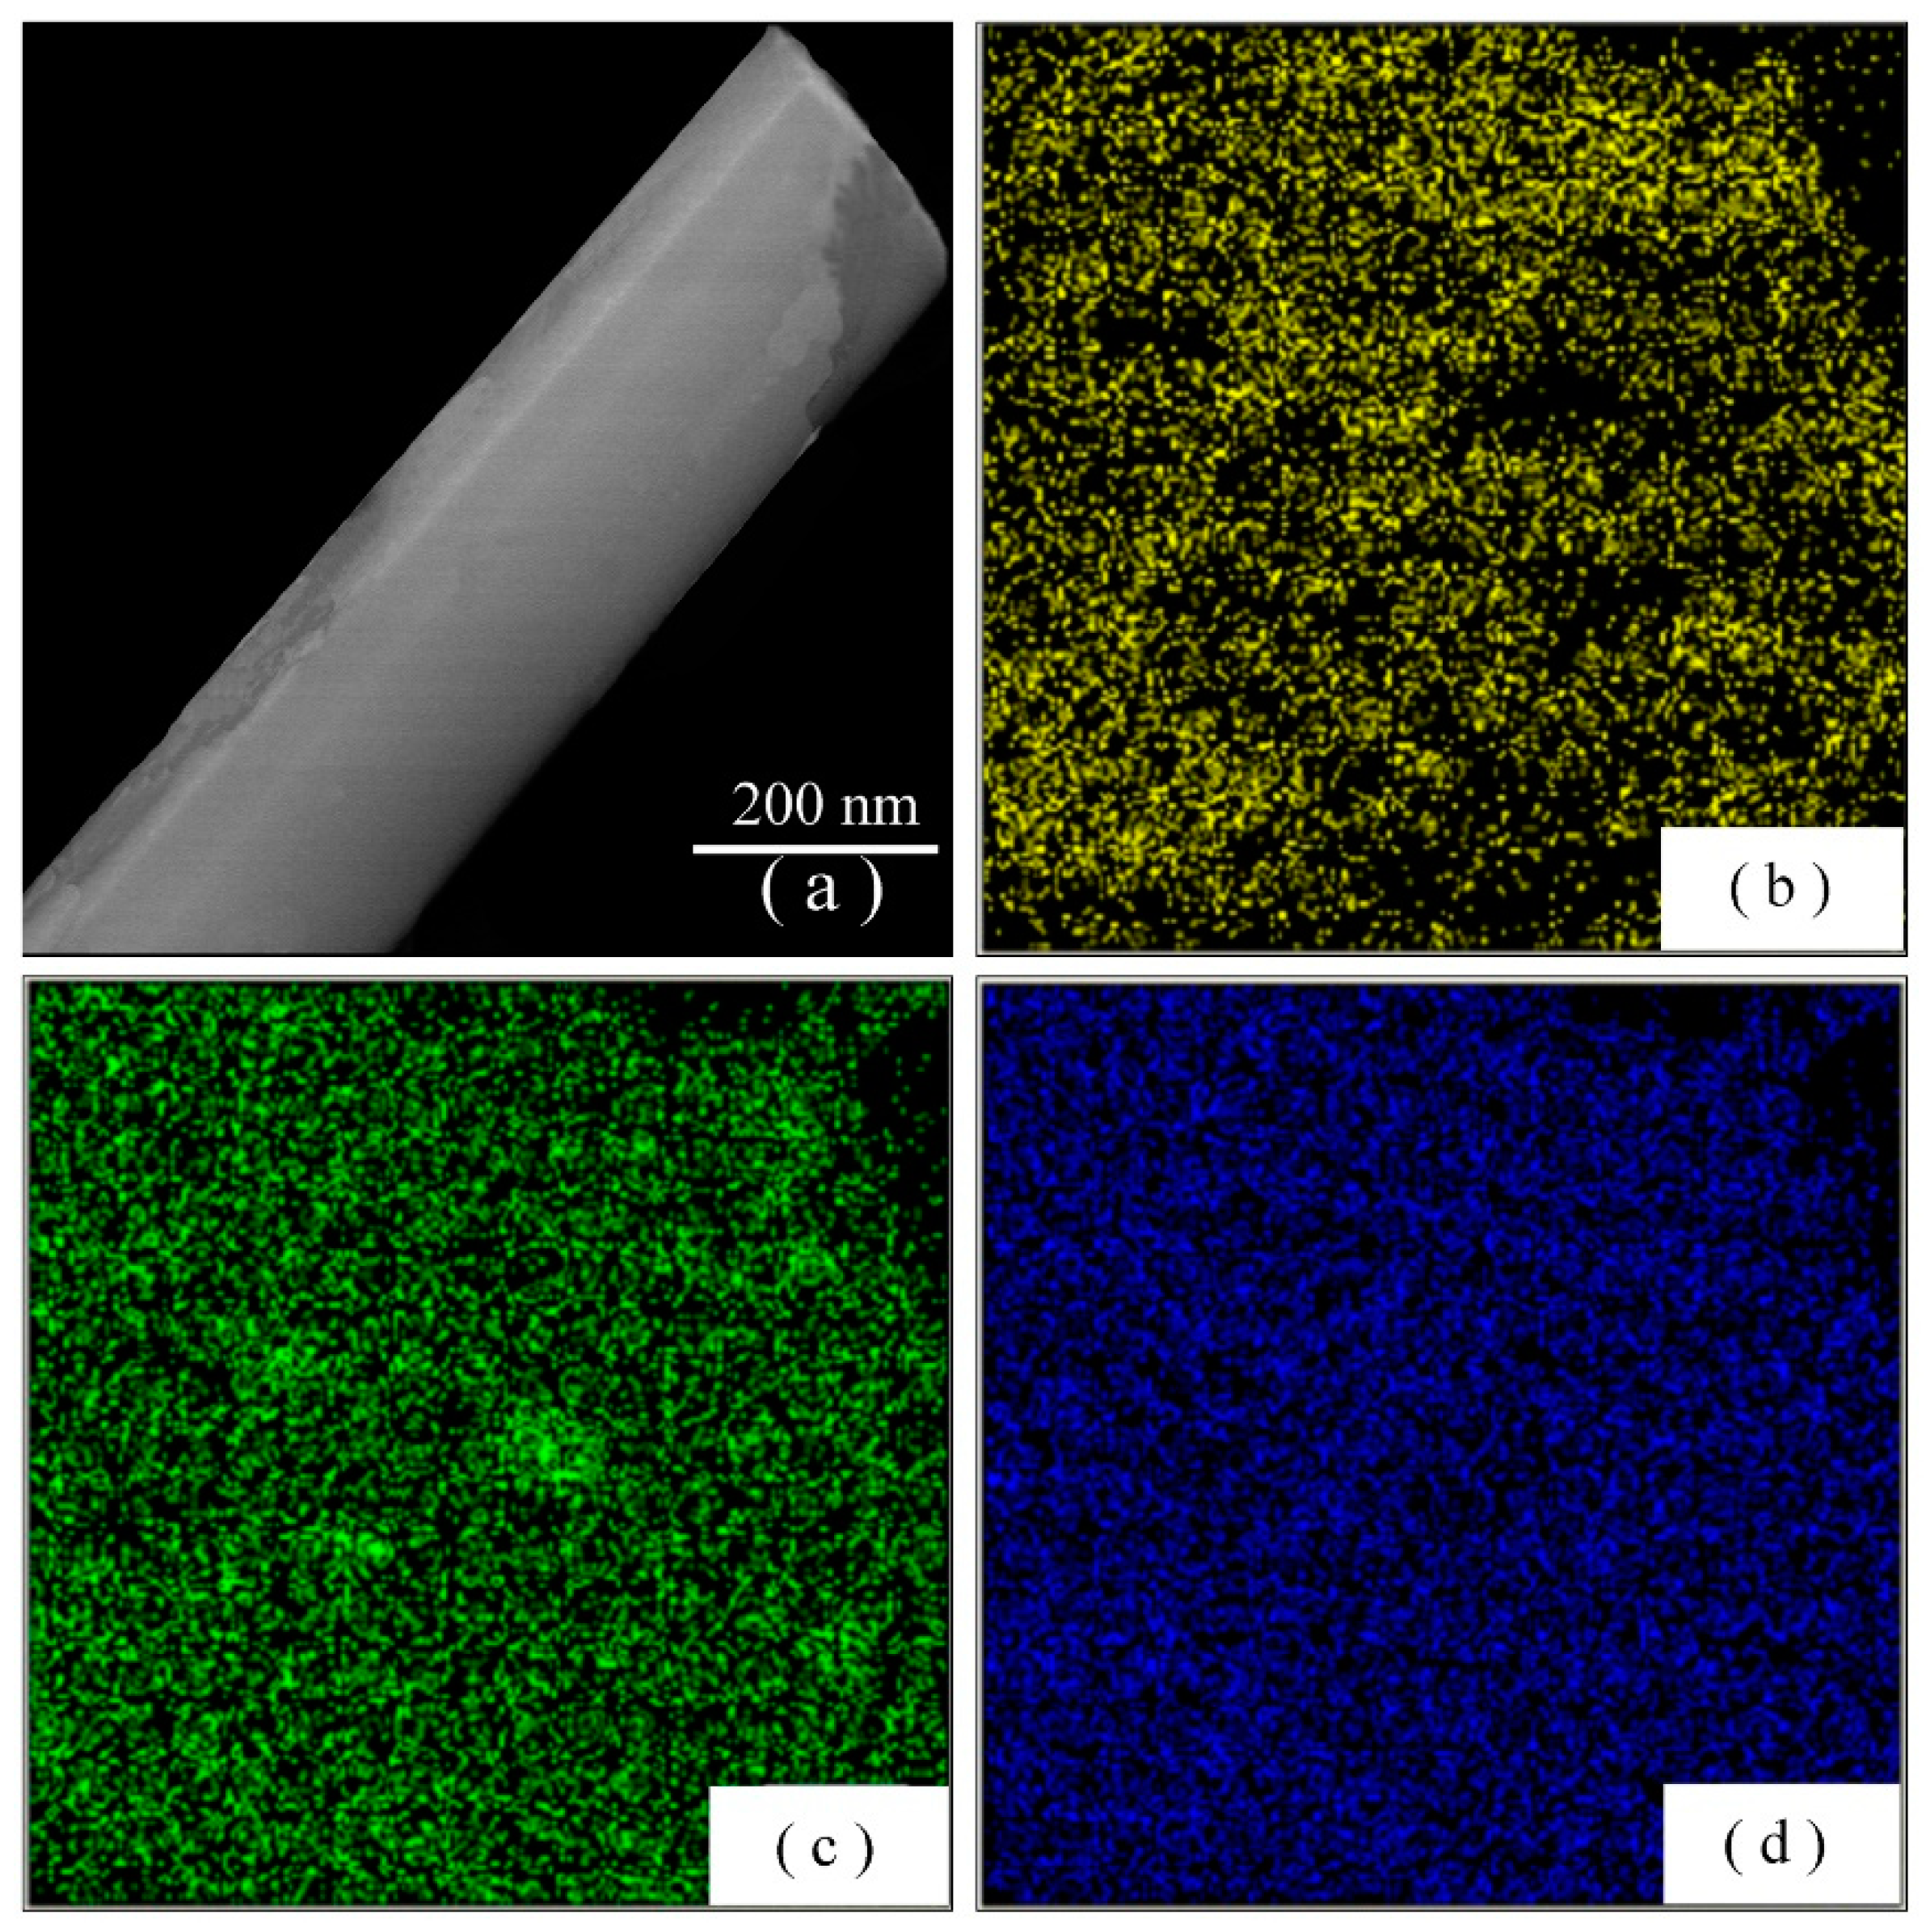
An element map is an image showing the spatial distribution of elements in a sample, and elemental mapping is carried out using EDX. Element maps are extremely useful for displaying element distributions in ZnWO4 nanoplates. Figure 5 depicts the EDX elemental maps of O, Zn, and W along one ZnWO4 nanoplate: (a) the ZnWO4 nanoplate; (b) O map; (c) Zn map; and (d) W map. As can be seen in Figure 5, the spatial distribution of each element in the ZnWO4 nanoplate was clear for the elements O, Zn, and W. We can conclude that the elements O, Zn, and W were uniformly distributed along the nanoplates.
2.2. Absorption and Photoluminescence (PL) Spectra of ZnWO4 Nanoplates
Figure 6a represents the ultraviolet–visible light (UV–Vis) absorption spectrum of ZnWO4 nanoplates. As displayed in Figure 6a, the absorption spectrum of ZnWO4 nanoplates can be divided into two absorption bands. The first absorption band ranged from 240 to 310 nm, while the second absorption band ranged from 310 to 500 nm. When compared to the absorption spectrum of single-crystal ZnWO4 [1], we can assign the first absorption band to the band-edge absorption, while the second absorption band can be assigned to the defect absorption in ZnWO4 nanoplates. On one hand, a lot of ions are unsaturated coordinatively on the surfaces of a ZnWO4 nanoplate, making it virtually impossible to synthesize defect-free ZnWO4 nanoplate. On the other hand, similar defect absorptions were recorded in ZnWO4 nanocrystals synthesized via the spray pyrolysis and dip-coating methods [2,8]. On the basis of their ab initio calculations, Kalinko et al. argued that monoclinic ZnWO4 is a kind of direct semiconductor [30]. Thus, we can estimate the band-gap value of ZnWO4 nanoplates by extrapolating the straight-line portion in its Tauc plot. The inset in Figure 6a depicts the Tauc plot of ZnWO4 nanoplates, and the direct band gap of ZnWO4 nanoplates was found to be 4.07 eV. Our derived band-gap value of ZnWO4 nanoplates is consistent with the experimental values of 3.55 eV for ZnWO4 microcrystals [2], 4.01 eV for ZnWO4 film [8], 3.79 eV for ZnWO4 nanorods, and 3.85 eV for ZnWO4 nanowires [9].
Figure 6b shows the PL spectrum of ZnWO4 nanoplates. Hollow circles in Figure 6b represent the experimental data. It is obvious that the broadband PL spectrum peaking at about 483 nm (2.57 eV) consists of one blue Gaussian component peaking at 459.5 nm (2.70 eV) and one green Gaussian component peaking at 501.3 nm (2.47 eV). The solid pink curve in Figure 6b represents the sum of the two Gaussian components. Thus, the spectral data in Figure 6b suggest that two luminescence centers were present in ZnWO4 nanoplates. Because the emission energies of the blue PL component (2.70 eV) and the green PL component (2.47 eV) were much less than the band gap (4.07 eV) of ZnWO4, band-edge recombination can be excluded as the PL origin for ZnWO4 nanoplates. It is well known that intrinsic defects in a variety of metal oxides can act as luminescence centers [31,32]. Thus, it is suggested that the two PL bands originated from two kinds of intrinsic defects in ZnWO4. The inset of Figure 6b depicts the luminescence photograph of ZnWO4 nanoplates. The strong luminescence from ZnWO4 nanoplates saturated our camera with the result of a white-colored spot in the image center. The faint halo around the spot was greenish blue. On the basis of the PL spectral data, the chromaticity coordinates of the ZnWO4 nanoplates were determined to be (0.182, 0.278) [33].
2.3. Electronic Structures of ZnWO4
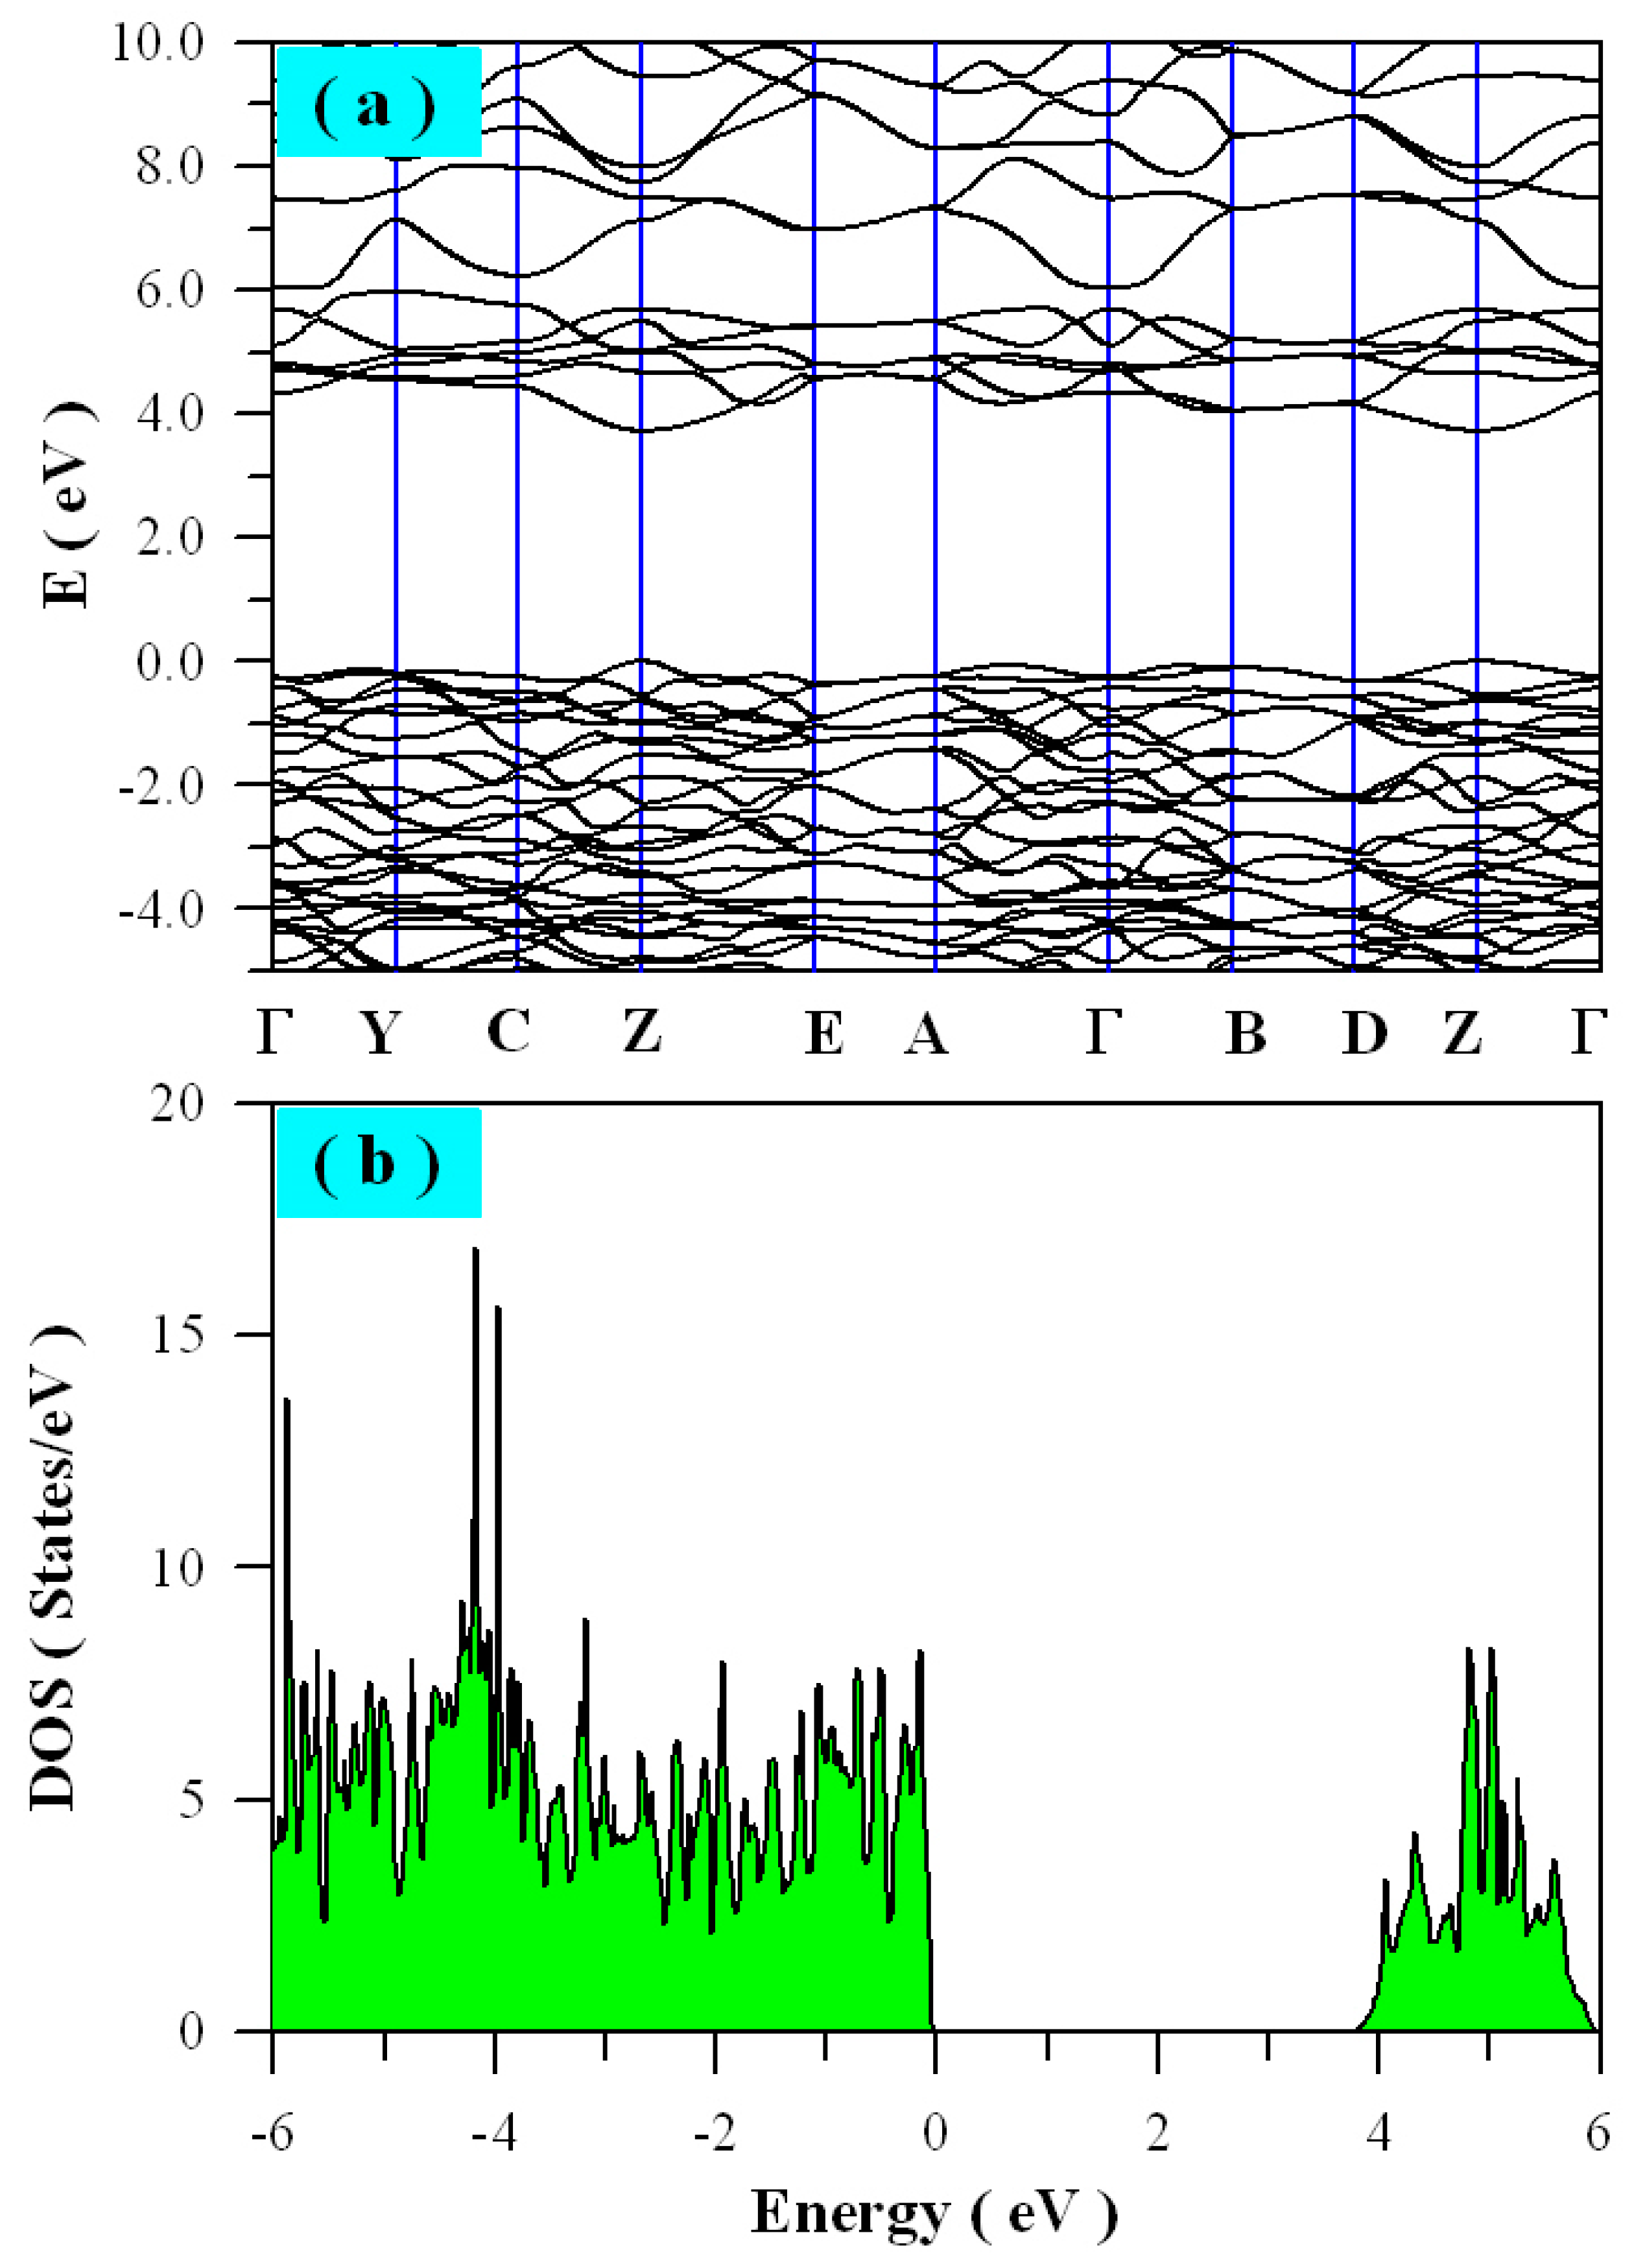
In order to understand the optical properties of ZnWO4 nanoplates, we calculated the electronic structure of perfect ZnWO4 with density functional calculations. Figure 7 represents the calculated band structures (a) and density of states (b) for perfect ZnWO4. As shown in Figure 7a, both the minimum of the conduction band (CB) and the maximum of the valence band (VB) were located at the Z point, confirming that ZnWO4 is a semiconductor with a direct band gap. Our calculated band-gap value was 3.72 eV for the perfect ZnWO4 crystal. The direct band gap indicated that ZnWO4 may be a good optical material for light absorption. Kalinko et al. performed an ab initio study of the electronic structure of ZnWO4 using the local density approximation approach, and they concluded that the direct band-gap value of ZnWO4 was 2.31 eV [30]. Moreover, Zhang et al. carried out density functional studies on the electronic structure of the ZnWO4; they also concluded that ZnWO4 is a direct semiconductor with a band-gap value of 2.9 eV [9]. It is obvious that our calculated band-gap value was closer to the optical band-gap value (4.07 eV), as shown in Figure 6a. Figure 7b demonstrates clearly that the band gap of ZnWO4 was free of any trap states. The projected density of states of ZnWO4 shows that the top valence band associated with O 2p, W 5d, and Zn 3d, among which the main contribution was O 2p. The conduction band was composed of O 2p, W 5d, and Zn 4s, among which W 5d contributed the most. Details on the projected density of states of ZnWO4 will be made available elsewhere.
Oxygen vacancies, tungsten vacancies, and zinc vacancies are the most fundamental point defects in ZnWO4 lattice. They influence not only the electronic structure and optical properties, but also the photocatalytic activity of the material because of their roles of charge trapping and recombination. For example, deep defect energy levels can be generated in the band gap of ZnWO4 by both the oxygen vacancies and the tungsten vacancies. As a contrast, zinc vacancies only create shallow defect energy levels in the band gap of ZnWO4. The DFT calculated electronic structures of oxygen-deficient ZnWO4, tungsten-deficient ZnWO4, and zinc-deficient ZnWO4 are available elsewhere [28]. Because both the species of the dangling bonds and the population density of these dangling bonds are heavily dependent on the facet, we believe that the defect states introduced by the oxygen, tungsten, and zinc vacancies play important roles in the facet-dependent photocatalysis.
2.4. Time-resolved PL Spectrum of ZnWO4 Nanoplates
Figure 8 depicts the time-resolved PL spectra of ZnWO4 nanoplates with the detection wavelength fixed at 460 nm (a) and at 500 nm (b). The decay curves in Figure 8 can be fitted with triple exponential functions as follows:
where I(t) stands for the PL intensity at time t, A is the baseline, Bi is the pre-exponential factor of the i-th decay component, and τi is the i-th decay time component. For PL emission at 460 nm, the best fit to the experimental data was obtained with the decay time constants τ1 = 0.55 ns, τ2 = 2.01 ns, and τ3 = 6.79 ns. Its average lifetime <τ>, which is calculated by adding Aiti as the weight to each lifetime component ti, was equal to 3.26 ns. In a similar way, the best fit to the experimental data was obtained with the decay time constants τ1 = 0.68 ns, τ2 = 2.47 ns, and τ3 = 7.84 ns for the detection wavelength of 500 nm. Its average lifetime <τ> was equal to 3.90 ns. It is clear that each PL decay consisted of a fast, initial decay and two slow decays. It was noted that τ1 was at the limit of the measurement capability of the instrument and, therefore, it merely represents the order of the short decay time constant [34,35]. On the atomic and molecular scale, an electron–hole pair is generated when ZnWO4 absorbs the energy of a radiant photon. Generally speaking, such a photo-generated electron and hole can form a free exciton or trapped exciton at different defect sites. Since the energy of exciting photons at 375 nm (3.3 eV) was less than the optical band gap of ZnWO4 (4.07 eV), free excitons were unlikely to be present in ZnWO4 nanoplates. Consequently, the slow decay processes were assumed to correlate with certain kinds of trapped excitons at different defects. The coexistence of τ2 and τ3 suggests that two kinds of trapped excitons were present in ZnWO4 nanoplates. In other words, there were two dominant recombination pathways in ZnWO4 nanoplates for the defect-related emissions.
2.5. Photocatalytic Activity of ZnWO4 Nanoplates
Figure 9a displays the evolution of the absorption spectrum of methyl orange solution with the UV irradiation time in the presence of ZnWO4 nanoplates. It is clear that the intensities of the strong absorption band peaking at about 463 nm and the weak absorption band peaking at about 268 nm decreased with UV irradiation time. The strong absorption band peaking at about 463 nm originated from a large conjugation system, which primarily comprised the two isolated aromatic rings with the –N=N– linkage in the methyl orange molecule. The weak absorption at about 268 nm can be attributed to the small conjugation system, which comprised the isolated aromatic rings in the methyl orange molecule [36,37]. This argument is evidenced by phenyl absorption at about 268 nm. For example, the absorption peaks of benzene (C6H6), tulene (C6H5CH3), phenol (C6H5OH), and phenylanine (C6H5NH2) are located at 254, 261, 270, and 280 nm, respectively. It can be seen in Figure 9a that the two absorption bands disappeared simultaneously upon prolonged UV irradiation, indicating the complete destruction of the large and the small conjugation systems in the organic pollutant. Thus, the data in Figure 9a demonstrate that the photo-oxidative capability of ZnWO4 nanoplates is strong enough to completely destroy both the –N=N– bonds and the aromatic rings in the methyl orange.
Figure 9b represents the evolution of the absorption spectrum of methyl orange solution with the UV irradiation time in the presence of ZnWO4 nanoparticles. Obviously, the absorption at 463 nm weakened gradually upon the photocatalytic reaction, and the absorption peak shifted from the visible to the ultraviolet region of the electromagnetic spectrum. Simultaneously, the color of the organic-dye-polluted water was gradually removed until it became colorless. It is known that the color of the organic-dye-polluted water is reduced when the –N=N– bonds are partially cleaved into –N–N–. Thus, the disappearance of the absorption at 463 nm reflects the partial cleavage of –N=N– bonds only, which is often called the decoloration of organic dye. Therefore, the decoloration of the organic-dye-polluted water guarantees neither the complete destruction of the –N=N– linkage, nor that of the aromatic rings in the fragments of the organic dye. In particular, it can be seen clearly in Figure 9b that the weak absorption band at about 258 nm was still present upon prolonged UV irradiation, suggesting that the small conjugation system in aromatic rings could not be destroyed by the photocatalytic reaction of ZnWO4 nanoparticles. Overall, the data in Figure 9b suggest that the photo-oxidative capability of ZnWO4 nanoparticles is not strong enough to destroy the separated aromatic rings in methyl orange.
To check if ZnWO4 nanoplates could completely mineralize the organics, we measured the chemical oxygen demand (COD) values of the methyl orange solutions obtained at different photocatalytic stages. Figure 10 shows the COD plots of methyl orange solution against the UV irradiation time in the presence of ZnWO4 nanoplates (a) and in the presence of ZnWO4 nanoparticles (b). As shown by plot a in Figure 10, the COD value, which was 140 for the methyl orange solution without UV irradiation, decreased monotonically to about 10 after UV irradiation for 50 min. Such a dramatic decrease in COD value indicated that the organic molecules could be completely mineralized by ZnWO4 nanoplates. On the contrary, ZnWO4 nanoparticles exhibited quite different photocatalytic behavior. As shown by plot b in Figure 10, the COD value of methyl orange solution decreased from 146 to 50 as the duration of UV irradiation increased from 0 to 50 min. This fact suggests that ZnWO4 nanoparticles could not efficiently destroy the aromatic rings in the fragments. Consequently, Figure 10 demonstrates that ZnWO4 nanoplates exhibited stronger photo-oxidative capability than ZnWO4 nanoparticles.
When compared to ZnWO4 nanoparticles, ZnWO4 nanoplates have well-defined facets. Apparently, the superior photo-oxidative capability of ZnWO4 nanoplates is closely relevant to their highly exposed facets, where the surface atomic arrangement and chemical coordination are substantially different from those of ZnWO4 nanoparticles. It is known that both the atomic arrangement and the chemical coordination on the surface can profoundly influence the adsorption of reactant molecules, the surface transfer between photo-excited electrons and the reactant molecules, and the desorption of product molecules. Therefore, the photo-oxidative capability of ZnWO4 nanostructures should be sensitive to crystal facets. This is the reason why ZnWO4 nanoplates can have quite different photo-oxidative capability from ZnWO4 nanoparticles. In principle, the photo-oxidative capability of completely mineralizing organic molecules is critically important to evaluate the photocatalytic performance of a photocatalyst. In actual fact, most previous work focused on the decoloration rate of ZnWO4 nanostructures, leaving the question of complete mineralization unattended [3,4,5,8,10,12,13,15,18,19,20,21,22,23]. The only exceptions include several reports on the photocatalytic properties of Ag/ZnWO4 nanorods [6], ZnO/ZnWO4 nanoparticles [7], AgO/ZnWO4 nanorods [9], and F-doped ZnWO4 nanorods [17]. From the UV–Vis absorption data provided in the range of 200–400 nm, we can conclude their inability to completely mineralize organic molecules [6,7,9,17]. Furthermore, Shi et al. demonstrated that ZnWO4 nanorods can only partially mineralize organic molecules via total organic carbon measurement [38]. In contrast, our work demonstrated that ZnWO4 nanoplates with highly exposed {01} facets can mineralize the organics completely, but ZnWO4 nanoparticles can only break the organic molecules into smaller fragments. These results reveal the importance of crystal facets in semiconductor photocatalysis. The concept of using crystal facet engineering to improve the quality of photocatalytic degradation (i.e., complete mineralization) is one of the basic tasks for photocatalytic applications; thus, the current results provide further advances in this concept and the material aspect of ZnWO4 nanostructures for semiconductor photocatalysis.
Normally, the degradation of bare methyl orange under UV light irradiation and in the dark should also be tested. In order to test any possible degradation of bare methyl orange in the dark, a mixture of methyl orange solution (400 mL) and ZnWO4 nanoplates (400 mg) was stored in the dark for different durations. No obvious degradation of methyl orange was recorded when the mixture was stored in the dark for 12 h. In contrast, we observed that UV light irradiation could degrade the methyl orange even without ZnWO4 nanoplates. Our tests showed that it took about 125 min for UV light irradiation to completely degrade the methyl orange. As compared to the data in Figure 9, we can conclude that ZnWO4 nanoplates exhibited efficient photocatalytic activity after the introduction of the UV light irradiation introduced the photolysis effect. Moreover, the photocatalytic performance of ZnWO4 nanoplates was compared to a known reference, i.e., TiO2 nanoparticles (P25, Degussa, Germany). Under identical conditions, TiO2 nanoparticles also exhibit strong photo-oxidative capability to completely mineralize the organic pollutant, but at a much faster speed. The reason for the higher photo-oxidative capability of TiO2 nanoparticles is that TiO2 nanoparticles have a smaller band gap (3.2 eV) to absorb more ultraviolet radiation than ZnWO4 (4.0 eV). Additionally, as the reusability of a photocatalyst after reaction is an important factor for the development of photocatalysts, the photocatalysts loaded with the pollutant were rinsed in NaOH solution (2 M) as a desorbing agent, and then rinsed with deionized water, before being dried in an oven at 120 °C for 5 h for the reusability test. All photocatalytic experiments were repeated under identical conditions. It was found that the undoped ZnWO4 nanoplates showed quite similar photocatalytic activity during the first three repeated runs with an oxidative capacity retention of 92%. The nanoplates gradually lost their maximum oxidative capacity if they were repeatedly used more than five times. Permanent loss of the oxidative capacity occurred after the photocatalysts were repeatedly used for nine runs. Obviously, the undoped ZnWO4 nanoplates have a finite lifespan. The decrease in the oxidative capacity for undoped ZnWO4 nanoplates might result from the photocorrosion effect. The large surface area and the high surface energy of ZnWO4 nanoplates make this kind of material easily photocorroded.
2.6. XPS Analysis of ZnWO4 Nanoplates
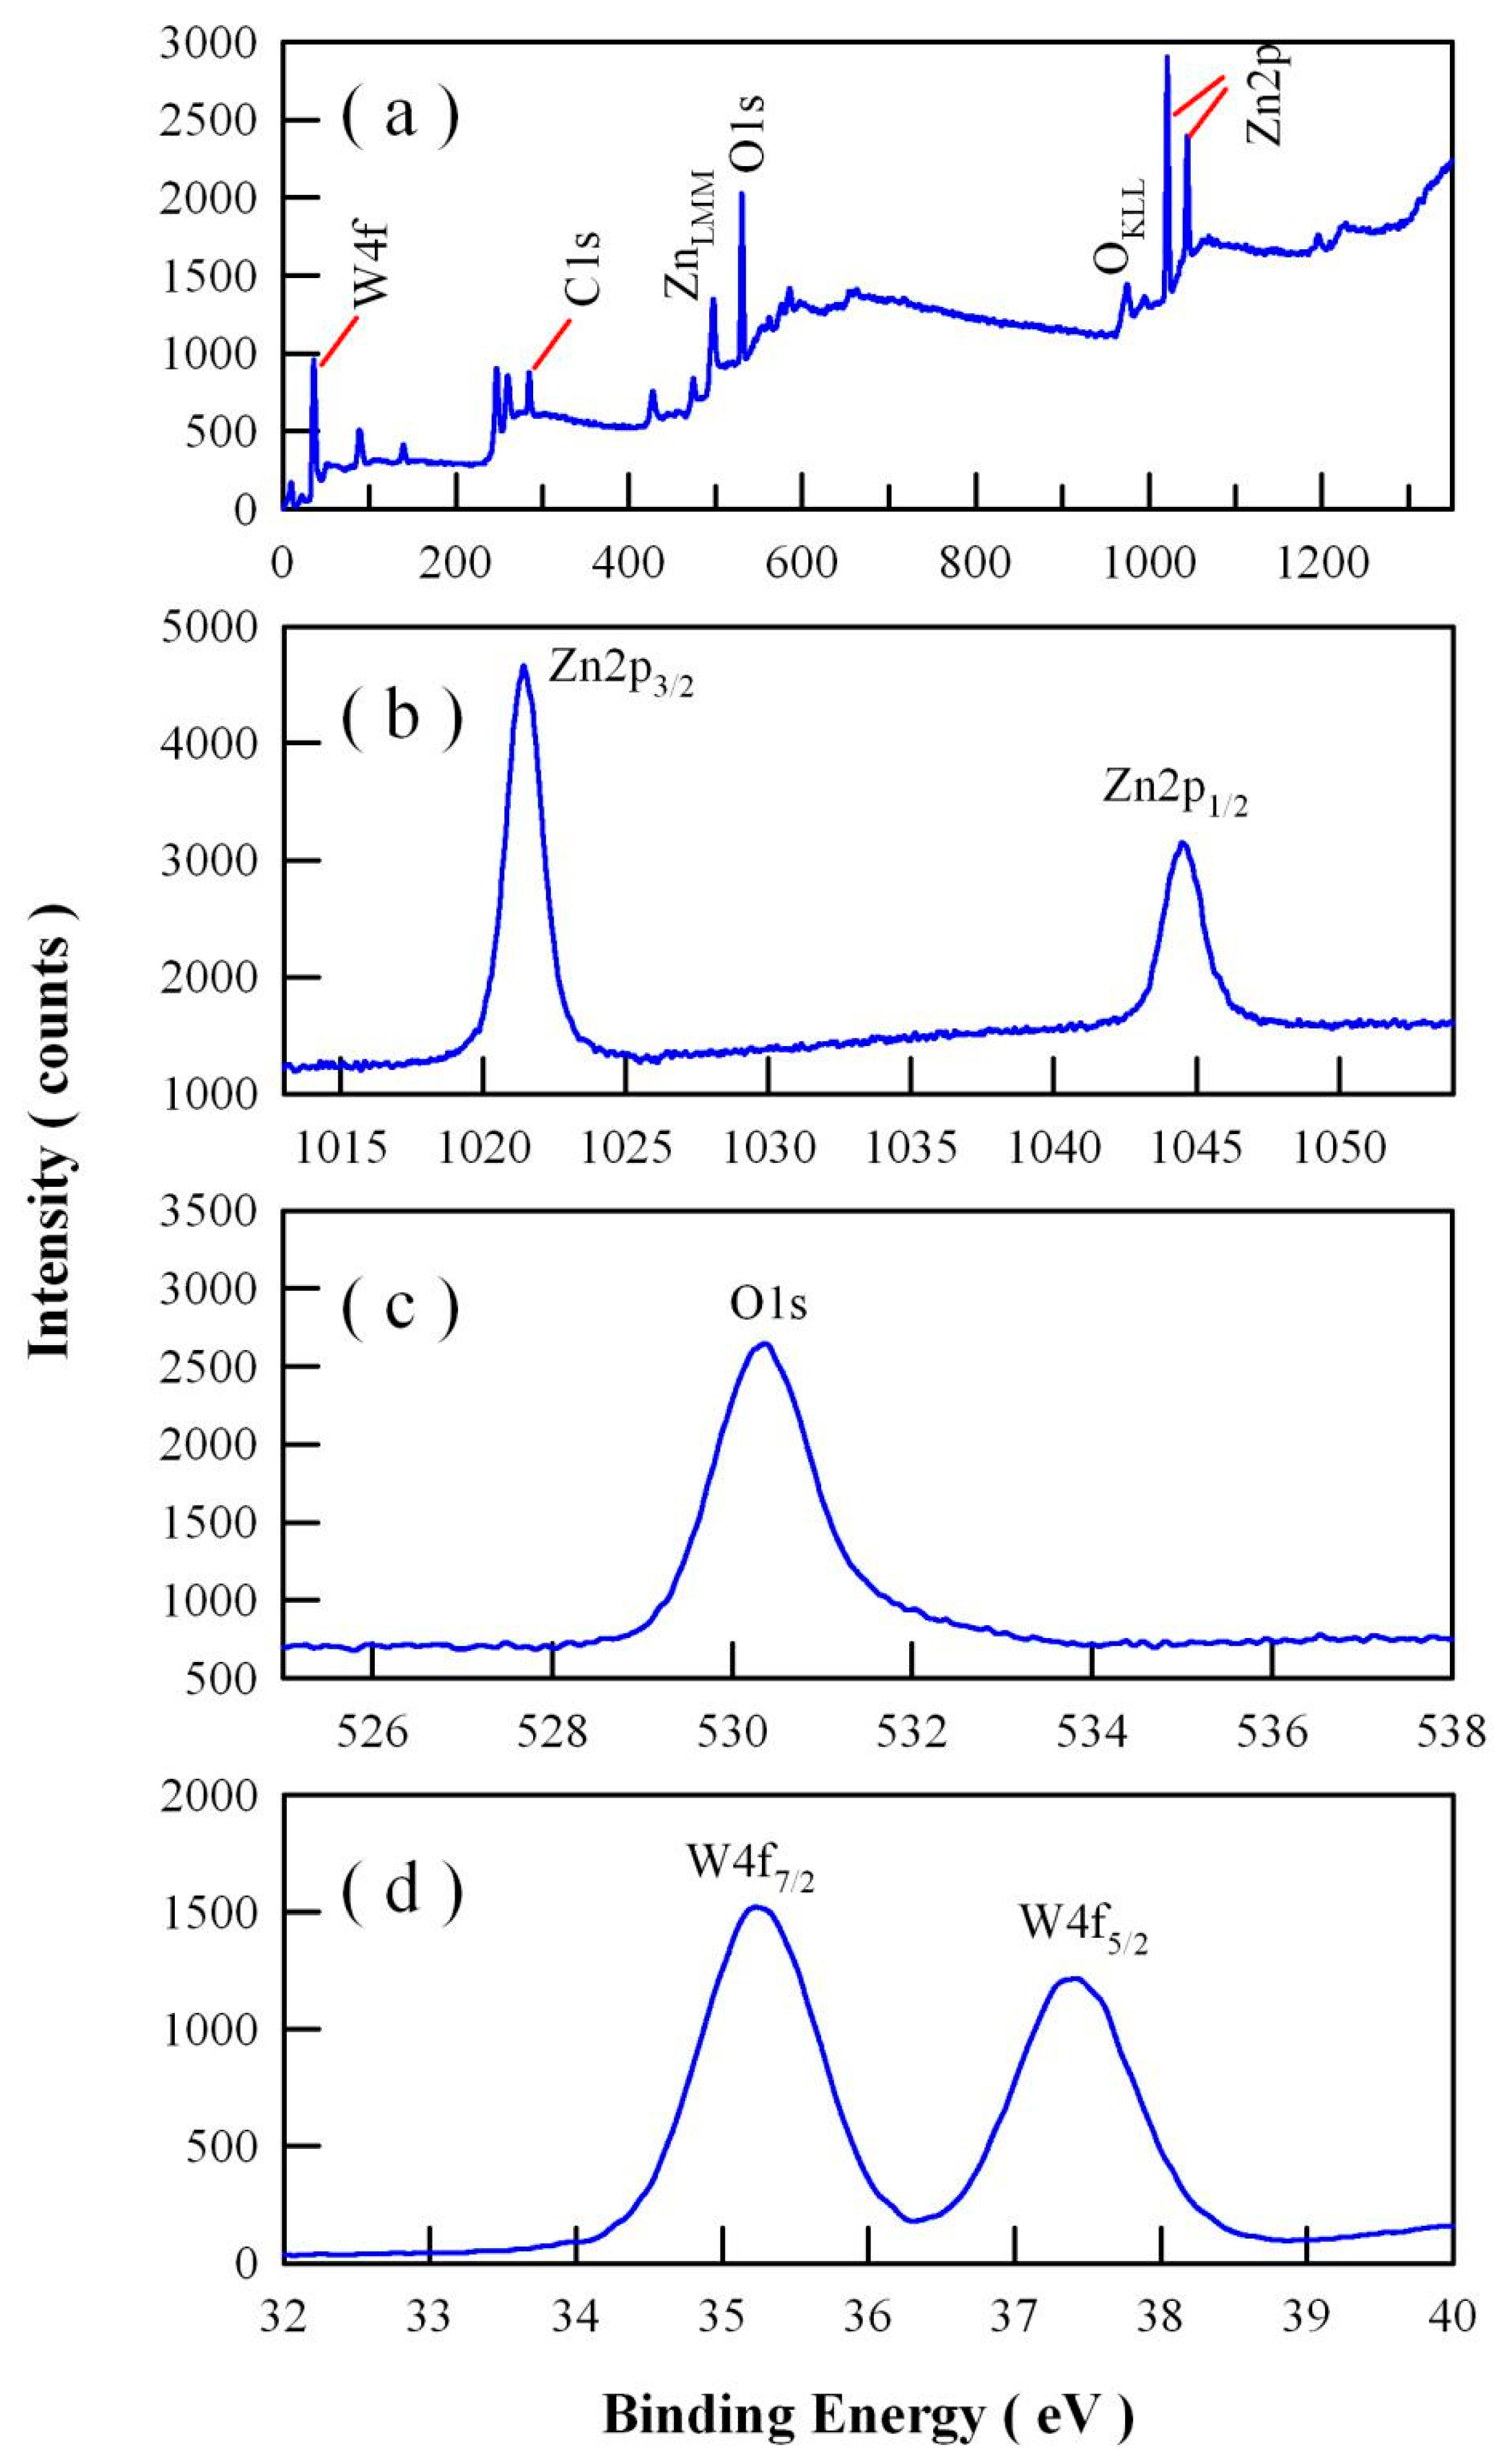
Figure 11 illustrates the XPS survey scan (a), and the XPS spectra of Zn 2p (b), O 1s (c), and W 4f (d) in ZnWO4 nanoplates. As shown in Figure 11a, the XPS survey spectrum illustrates clearly that ZnWO4 nanoplates were mainly composed of Zn, O, W, and C [15,17,20,21,22,23]. The peaks of Zn 2p1/2 and Zn 2p3/2 in Figure 11b were located at 1044.48 and 1021.43 eV, respectively, indicating that the zinc in ZnWO4 nanoplates had a +2 oxidation state. When compared to the two peaks of Zn 2p3/2 (1021.8 eV) and Zn 2p1/2 (1044.8 eV) in ZnWO4 nanofilms [4], the two peaks of ZnWO4 nanoplates were shifted by 0.03 and 0.32 eV toward the lower binding energy. As shown in Figure 11c, the XPS spectral profile of O 1s was located at 530.38 eV. The peaks of W 4f7/2 and W 4f5/2 in Figure 11d were located at 35.23 and 37.43 eV, respectively.
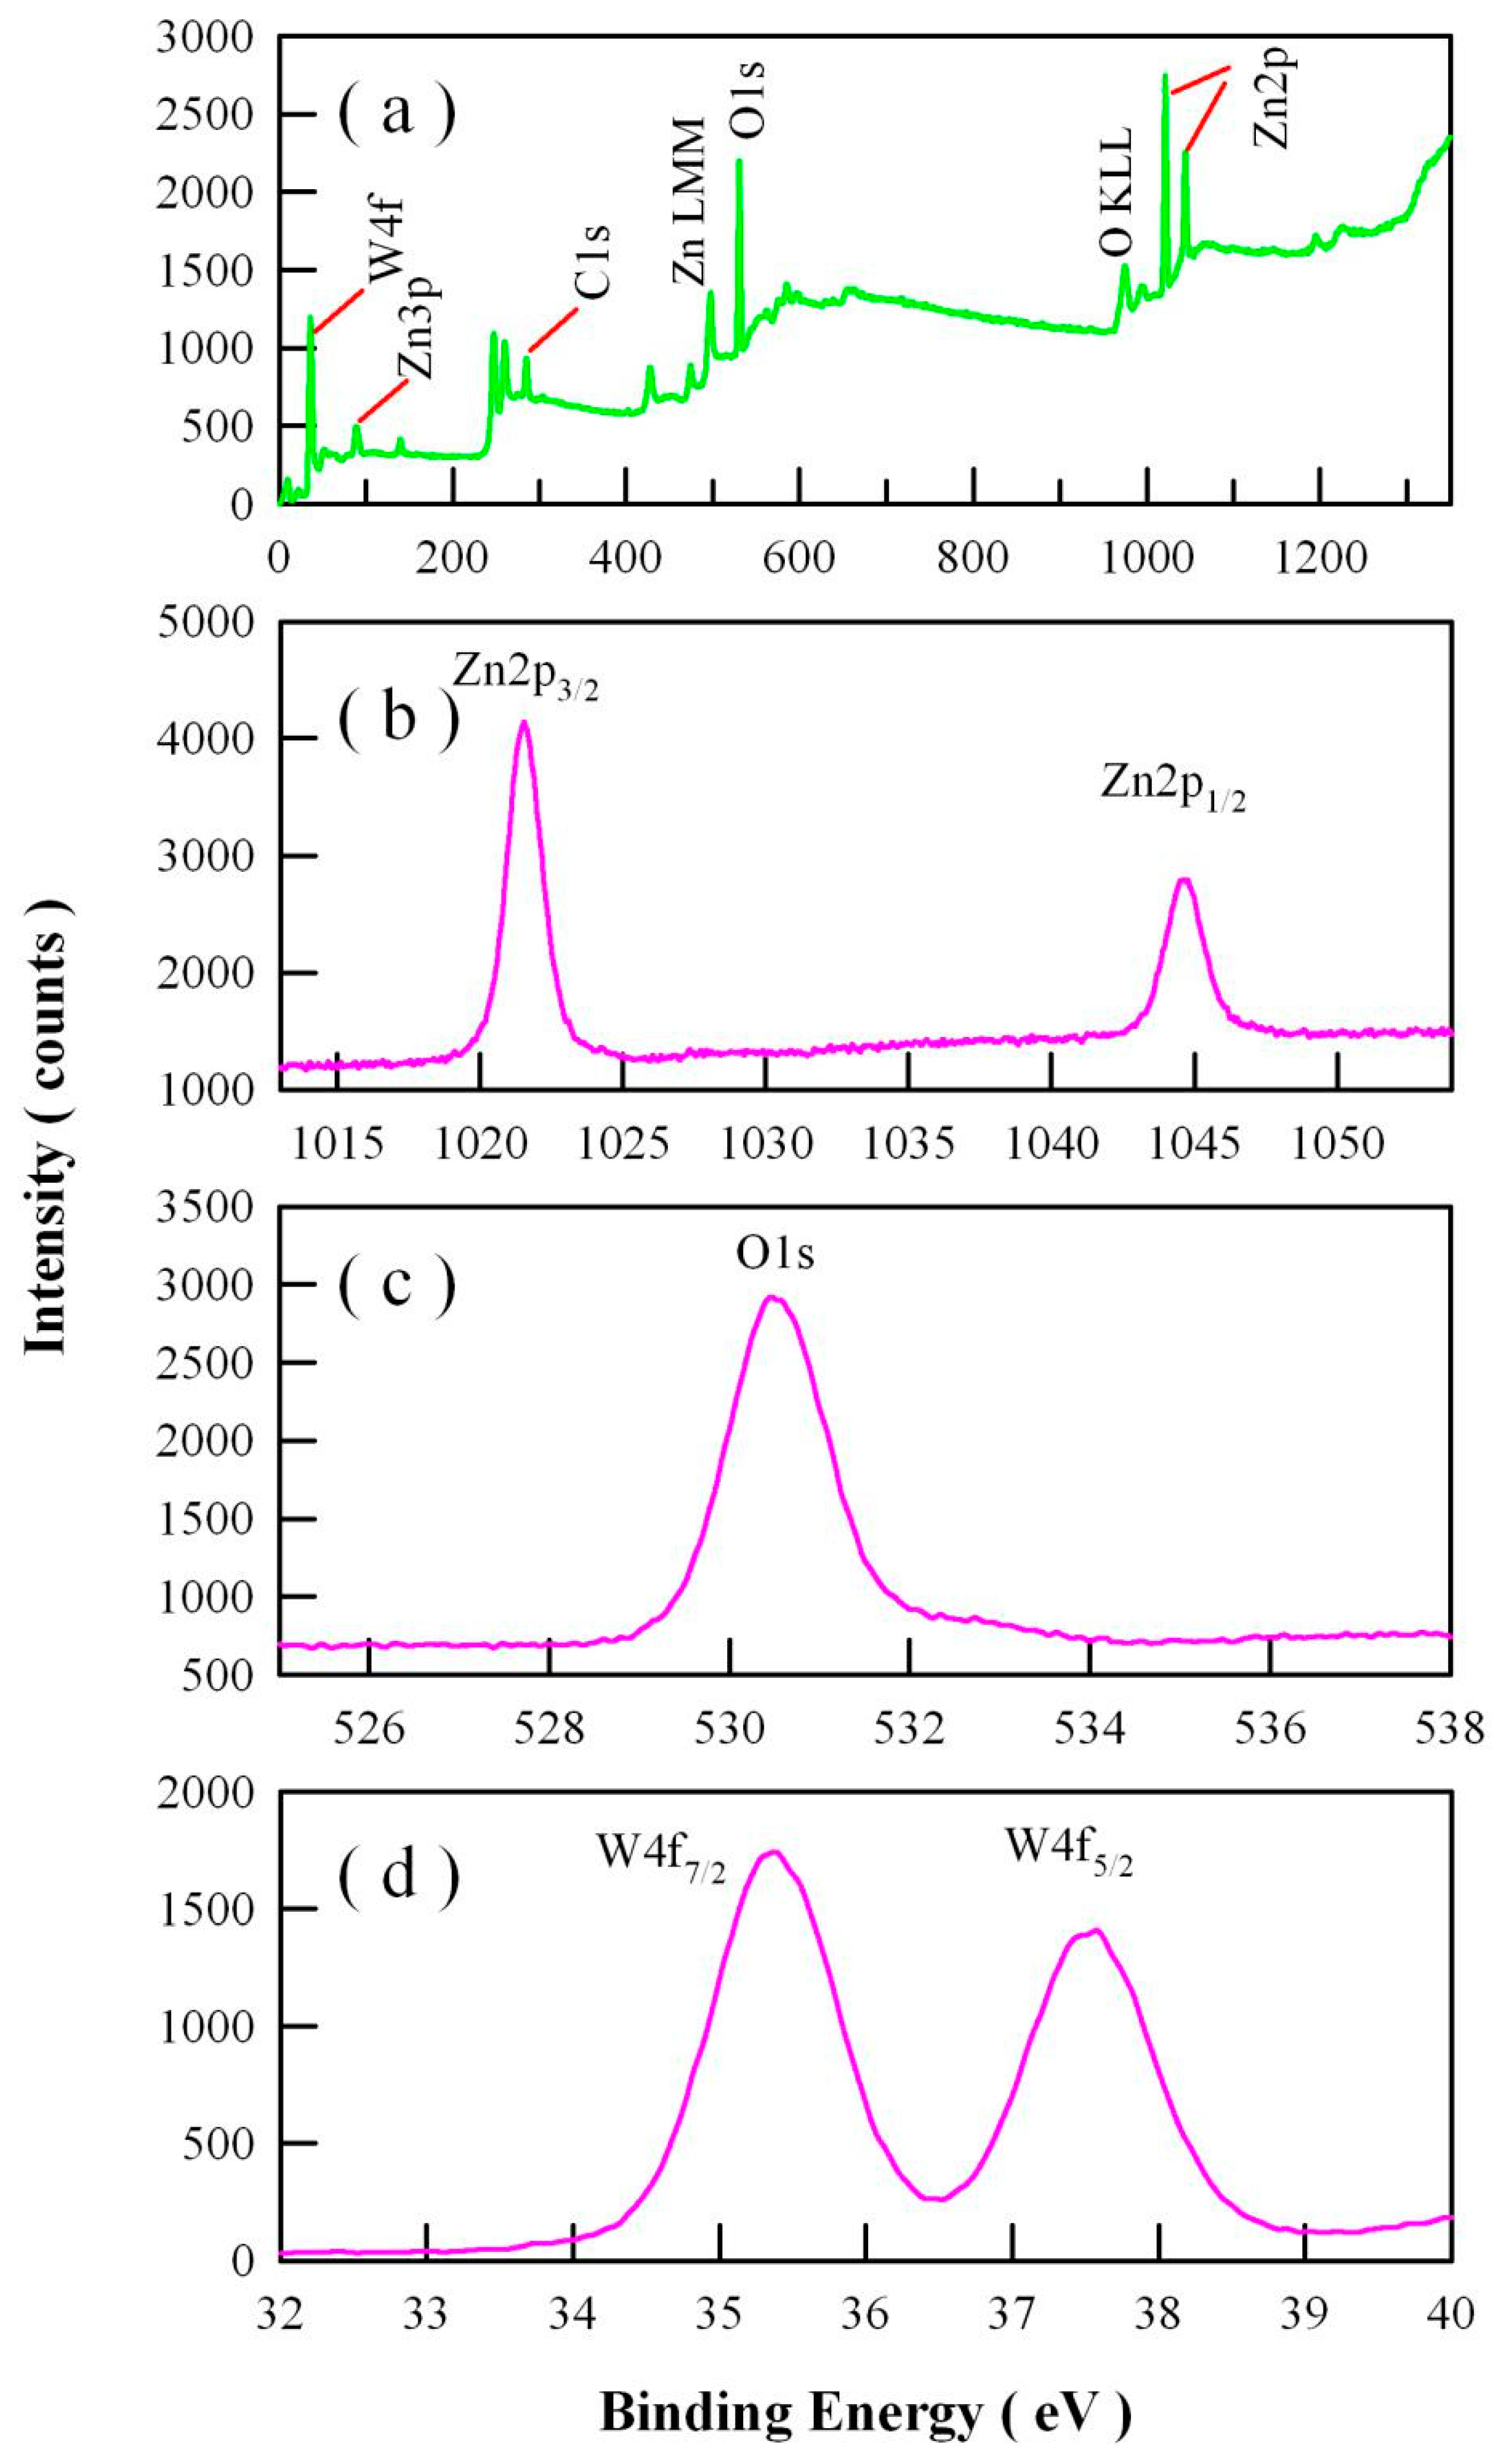
The XPS spectra of ZnWO4 nanoparticles are given for the purpose of comparison. Figure 12 displays the XPS survey scan (a), and the high-resolution XPS spectra of Zn 2p (b), O 1s (c), and W 4f (d) in ZnWO4 nanoparticles. Figure 12a confirms that ZnWO4 nanoparticles consisted of Zn, O, W, and C. As shown in Figure 12b, the peaks of Zn 2p3/2 and Zn 2p1/2 were located at 1021.53 and 1044.73 eV, respectively. Figure 12c shows that the peak of O 1s was located at 530.48 eV. The peaks of W 4f7/2 and W 4f5/2 in Figure 12d were located at 35.38 and 37.58 eV, respectively. When compared to those in ZnWO4 nanoparticles, the peaks of Zn 2p3/2, Zn 2p1/2, O 1s, W 4f7/2, and W 4f5/2 in ZnWO4 nanoplates were shifted by 0.10 eV, 0.25 eV, 0.10 eV, 0.15 eV, and 0.15 eV toward the lower binding energy, respectively. Why do the XPS peaks shift to lower binding energy? Generally speaking, the observed peak shift may be ascribed to the characteristic change in the physical or chemical environment of the analyzed species. The peak shifts suggest that the elements Zn, O, and W in ZnWO4 nanoplates were no longer in the same chemical states as they were in ZnWO4 nanoparticles. Here, “chemical state” refers to the local bonding environment of a species in question. The local bonding environment of a species in question is affected by its formal oxidation state, the identity of its nearest-neighbor atom, its bonding hybridization to the nearest-neighbor atom, and in some cases even the bonding hybridization between the atom in question and the next-nearest-neighbor atom. Thus, the chemical shifts derived from Figure 11 and Figure 12 indicate that the local bonding environments around W, Zn, and O in ZnWO4 nanoplates were different from those in ZnWO4 nanoparticles.
2.7. Specific Surface Area of ZnWO4 Nanoplates
Figure 13a represents the N2 adsorption and desorption isotherms for ZnWO4 nanoplates. Obviously the N2 adsorption isotherm in Figure 13a belonged to type IV. The intermediate flat region in the isotherm corresponded to monolayer formation. Saturation level was reached when the relative pressure fell in the range of 0.8 and 1. This can be explained on the basis of gases getting condensed in the tiny capillary pores of the ZnWO4 adsorbent. According to the BET theory, we calculated the specific surface area for ZnWO4 nanoplates. Our derived value was 6.01 m2/g for ZnWO4 nanoplates. Figure 13b shows the N2 adsorption and desorption isotherms for ZnWO4 nanoparticles. The surface area was calculated to be about 18.67 m2/g for ZnWO4 nanoparticles. It is evident that the surface area value of ZnWO4 nanoplates was only one-third of that of ZnWO4 nanoparticles. It was reported that the surface areas were 25–28 m2/g for ZnWO4 nanocrystals [10], 22–47.2 m2/g for B-doped ZnWO4 nanorods [24], and 109.4 m2/g for Sn2+-doped ZnWO4 nanocrystals [27]. We can see that the surface area of our ZnWO4 nanoplates was much smaller than those of ZnWO4 nanorods and nanocrystals. Thus, we can safely conclude that the specific surface area was not likely to be responsible for the strong photo-oxidative capability of ZnWO4 nanoplates.
2.8. Possible Photocatalytic Mechanisms and Intermediates of ZnWO4 Nanoplates
In order to explore the effects of crystal facets on the photo-oxidative capability of ZnWO4 nanoplates, we examined the surface bonding on ZnWO4 facets. ZnWO4 super cells with different sizes can be constructed by making use of the initial structural data of ZnWO4 (ICSD No. 156483). Figure 14 schematically illustrates the different surface bonding on ZnWO4 facets: (a) the {100} facet; (b) the {010} facet; (c) the {001} facet; and (d) the {01} facet. The O, W, and Zn atoms are shown in red, blue, and gray, respectively. As can be seen in Figure 14a, the {100} facet was characteristic of all coordinatively unsaturated W atoms. That is to say, the {100} facet was fully covered with W dangling bonds. As a contrast, both the {010} facet and the {001} facet were fully covered with coordinatively unsaturated O atoms (i.e., O dangling bonds), as shown in Figure 14b,c. As for the {01} facet, one can see that this facet was partially covered with coordinatively unsaturated O atoms, leaving the remaining portion of the facet covered by coordinatively unsaturated W atoms. When compared to the {100}, {010}, and {001} facets, we can see that the substantial differences in the surface bonding on the {01} facet led to the non-selective binding of organic fragments in waste water, which eventually resulted in non-selective oxidation of the adsorbed organic fragments. This might be the reason why ZnWO4 nanoplates exhibited stronger photo-oxidative capability of complete mineralization. More importantly, the {01} facet was distinctly different from the {100}, {010}, and {001} facets in the aspect of stereochemistry. Such a difference in stereochemistry yielded stronger binding with organic fragments onto the {01} facets. Both the non-selective binding and the stronger binding ability on {01} facets were key factors to the complete mineralization of the organic molecules.
In order to gain insight into the nanoscale structure and binding details in such systems, we have to study the intermediates produced in the photocatalytic degradation of methyl orange. Figure 15 schematically illustrates the possible intermediates produced in the photocatalytic degradation of methyl orange by ZnWO4 nanoparticles. As shown in Figure 15a, one methyl orange molecule consists of a large conjugation system and a small conjugation system. On one hand, the large conjugation system is primarily constituted by two separated aromatic rings with the –N=N– linkage, which exhibits a strong absorption at about 460 nm. On the other hand, the small conjugation system is primarily constituted by two separated aromatic rings, which exhibit a weak absorption band at about 260 nm [39,40,41]. Upon the photocatalytic reactions, the highly oxidative hydroxyl radicals partially oxidize the –N=N– bond into the –N–N– bond, yielding the intermediates as shown in Figure 15b. As a result of the partial cleavage of the –N=N– bond into –N–N– bond, the absorption intensity at 463 nm decreases gradually until its complete disappearance. This process, which decolorates the organic polluted water, is evidenced by the absorption spectra in Figure 9. Instead of complete mineralization of the organic pollutants in waste water, most previous work focused on the decoloration rates of a variety of ZnWO4 nanostructures [3,4,5,8,10,12,13,15,18,19,20,21,22,23]. Further oxidation of the intermediates in Figure 15b leads to the complete cleavage of the –N=N– bond in the methyl orange molecule. The complete cleavage of the N–N double bond yields organic fragments, as shown in Figure 15c,d. It can be seen in Figure 15c,d that each of the organic fragments contains one aromatic ring, which is responsible for the absorption band at 260 nm.
If the photo-oxidative capability of ZnWO4 photocatalysts is strong enough, the aromatic rings in the organic fragments can be completely oxidized as the photocatalytic reactions progress. In this case, the conjugation in the aromatic rings becomes fully destroyed. Such a destruction of the conjugation in the aromatic rings leads to the complete disappearance of the absorption band at 267 nm. This case is evidenced in Figure 9a for ZnWO4 nanoplates, and the possible intermediates are shown in Figure 15e,f. On the contrary, the aromatic rings in the organic fragments cannot be completely oxidized if the photo-oxidative capability of ZnWO4 photocatalysts is not strong enough. In this case, the absorption band at 267 nm is present in spite of the progress of photocatalytic reactions. This case is evidenced in Figure 9b for ZnWO4 nanoparticles, and the possible intermediates are shown in Figure 15c,d. It is worth noting that the intermediates in Figure 15c–f formed through the photocatalytic reactions are more toxic than the original compound. Thus, it is critically important for the photocatalysts to completely mineralize these harmful intermediates. Additionally, other kinds of organic fragments may be generated by the photocatalytic degradation, and further work is required to identify the molecular structures of the organic fragments. In light of the organic fragments generated in the processes of photocatalytic reactions, we can understand why ZnWO4 nanoplates can completely mineralize methyl orange, whereas ZnWO4 nanoparticles can only cleave the organic molecules into fragments. Based on the specific surface bonding shown in Figure 14 and the possible organic fragments shown in Figure 15, we can see that the superior photo-oxidative capability of ZnWO4 nanoplates stems from the highly exposed {01} facet. The specific chemical bonding and the stereochemistry on the {01} facet make ZnWO4 nanoplates suitable for strong binding to the organic fragments.
It is worthy of being noted that the possible photocatalytic mechanisms shown in Figure 15 tend to schematically show the difference between the decoloration and the complete mineralization of methyl orange. The actual decomposition processes and possible intermediates produced in the photocatalytic degradation of methyl orange by ZnWO4 nanoplates are not yet known. It is known that gas chromatography/mass spectrometry is the most ubiquitous analytical technique for the identification and quantification of organic substances in complex mixtures. Thus, analysis with the technique of gas chromatography/mass spectrometry is required to identify the intermediates formed during the photocatalytic degradation of methyl orange. This identification is under way and a huge amount of work is needed to be done before the completion of this task.
First-principles calculation of the surface binding energies of methyl orange molecules on different facets ({100}, {010}, {001}, and {01}) may provide further information on the facet-dependent photo-oxidative capability of ZnWO4 nanoplates. Following the descriptions in the literature [42,43,44], we constructed ZnWO4 slabs with {100}, {010}, {001}, and {01} facets, and then calculated the binding energies of methyl orange molecules on ZnWO4 {100}, {010}, {001}, and {01} facets using density functional theory. The calculated binding energies of methyl orange molecules on ZnWO4 {100}, {010}, {001}, and {01} facets were 1.9, 2.7, 2.2, and 3.5 eV per molecule, respectively. Notably, the binding energy of methyl orange molecule depended on the crystal facets of ZnWO4 nanoplates. Our calculations reveal that the binding energy of methyl orange molecules on the {01} facet was larger than that on {100}, {010}, and {001} facets. On one hand, the high binding energy for the {01} facet shows that the methyl orange molecule preferred to strongly bind to the {01) facets. On the other hand, the low binding energy for the other three facets caused the adsorbed methyl orange molecules to be easily desorbed from the corresponding facets. Therefore, the high binding energy on the {01} facet suggests that ZnWO4 nanoplates with a highly exposed {01} facet allow for high reactivity with regards to the oxidation of methyl orange molecules.
2.9. Catalytic Performances of ZnWO4 Nanoplates with {100}, {010}, and {001} Facets
In order to verify the importance of crystal facets, we prepared ZnWO4 nanoplates with different facets ({100}, {010}, and {001}) and then investigated their photocatalytic performances. By varying the pH value in the mixture filled in the Teflon-lined stainless-steel autoclave, we obtained ZnWO4 nanoplates with a {100} facet, ZnWO4 nanoplates with a {100} facet, and ZnWO4 nanoplates with a {100} facet, respectively [10,15]. Figure 16a shows the high-resolution TEM micrograph of ZnWO4 nanoplates with a {100} facet. As can be seen in Figure 16a, the spacing of two adjacent (010) crystallographic planes was 0.570 nm, whilst the spacing of two adjacent (002) crystallographic planes on the same nanoplate was 0.246 nm. The normal of the facet could be determined as <100> by the vector product of the two orientation vectors <010> and <002>. Thus, the facet of this ZnWO4 nanoplate could be noted as {100}. Figure 16b depicts the absorption spectra of methyl orange solution as a function of UV irradiation time in the presence of ZnWO4 nanoplates with a {100} facet. As shown in Figure 16b, the absorption band peaking at 463 nm disappeared completely upon UV irradiation for 50 min, indicating the complete destruction of the –N=N– bonds in the methyl orange molecules. Instead of a complete disappearance, the absorption band peaking at about 270 nm weakened with a loss of about 40% of its original intensity, indicating partial destruction of the conjugation in the aromatic rings in methyl orange. When compared to the data in Figure 9, the data in Figure 16 demonstrate that the photo-oxidative capability of ZnWO4 nanoplates with {100} facets was weaker than that of ZnWO4 nanoplates with {01} facets.
Figure 17a shows the high-resolution TEM micrograph of ZnWO4 nanoplates with a {010} facet. As can be seen in Figure 17a, the spacing of two adjacent (100) crystallographic planes was 0.470 nm. On the same nanoplate, the spacing of two adjacent (002) crystallographic planes could be determined to be 0.248 nm. The normal of this facet could be determined as <010> by the vector product of the two orientation vectors <100> and <002>. Consequently, the facet of this ZnWO4 nanoplate could be denoted as {010}. Figure 17b depicts the absorption spectra of methyl orange solution as a function of UV irradiation time in the presence of ZnWO4 nanoplates with a {010} facet. It can be seen in Figure 17b that the absorption band peaking at 463 nm disappeared completely upon UV irradiation for 50 min. The absorption band at about 270 nm also nearly disappeared upon UV irradiation for 50 min, indicating the complete destruction of the conjugation in aromatic rings in methyl orange. Interestingly, a new absorption band appeared at about 250 nm at the cost of the absorption band at about 270 nm, suggesting the production of a new species of organic intermediates, whose conjugation was even shorter. When compared to the data in Figure 9 and Figure 16, the data in Figure 17 demonstrate that the photo-oxidative capability of ZnWO4 nanoplates with {010} facets was weaker than that of ZnWO4 nanoplates with {01} facets, but stronger than that of ZnWO4 nanoplates with {100} facets.
Figure 18a shows the high-resolution TEM micrograph of ZnWO4 nanoplates with a {001} facet. As can be seen in Figure 18a, the spacing of two adjacent (010) crystallographic planes was 0.570 nm. On the same nanoplate, the spacing of two adjacent (100) crystallographic planes was determined to be 0.470 nm. The normal of this facet could be determined as <001> by the vector product of the two orientation vectors <010> and <100>. In this way, the facet of the ZnWO4 nanoplate could be denoted as {001}. Figure 18b depicts the absorption spectra of methyl orange solution as a function of UV irradiation time in the presence of ZnWO4 nanoplates with a {001} facet. It is clear in Figure 18b that the absorption band peaking at 463 nm disappeared completely upon UV irradiation for 50 min. In contrast, the absorption band at about 270 nm lost about 75% of its original intensity upon UV irradiation for 50 min. When compared to the data in Figure 9, Figure 16 and Figure 17, the data in Figure 18 demonstrate that the photo-oxidative capability of ZnWO4 nanoplates with {001} facets was weaker than that of ZnWO4 nanoplates with {010} facets, but stronger than that of ZnWO4 nanoplates with {100} facets. Our photocatalytic tests show that the photo-oxidative capability of ZnWO4 nanoplates was heavily dependent on its crystal facets. It was found that the photo-oxidative capabilities of these ZnWO4 nanoplates decreased sequentially in the order of {01}, {010}, {001}, and {100}. Based on these experimental data, we believe that the features of crystal facets are tightly correlated with their photo-oxidative capabilities.
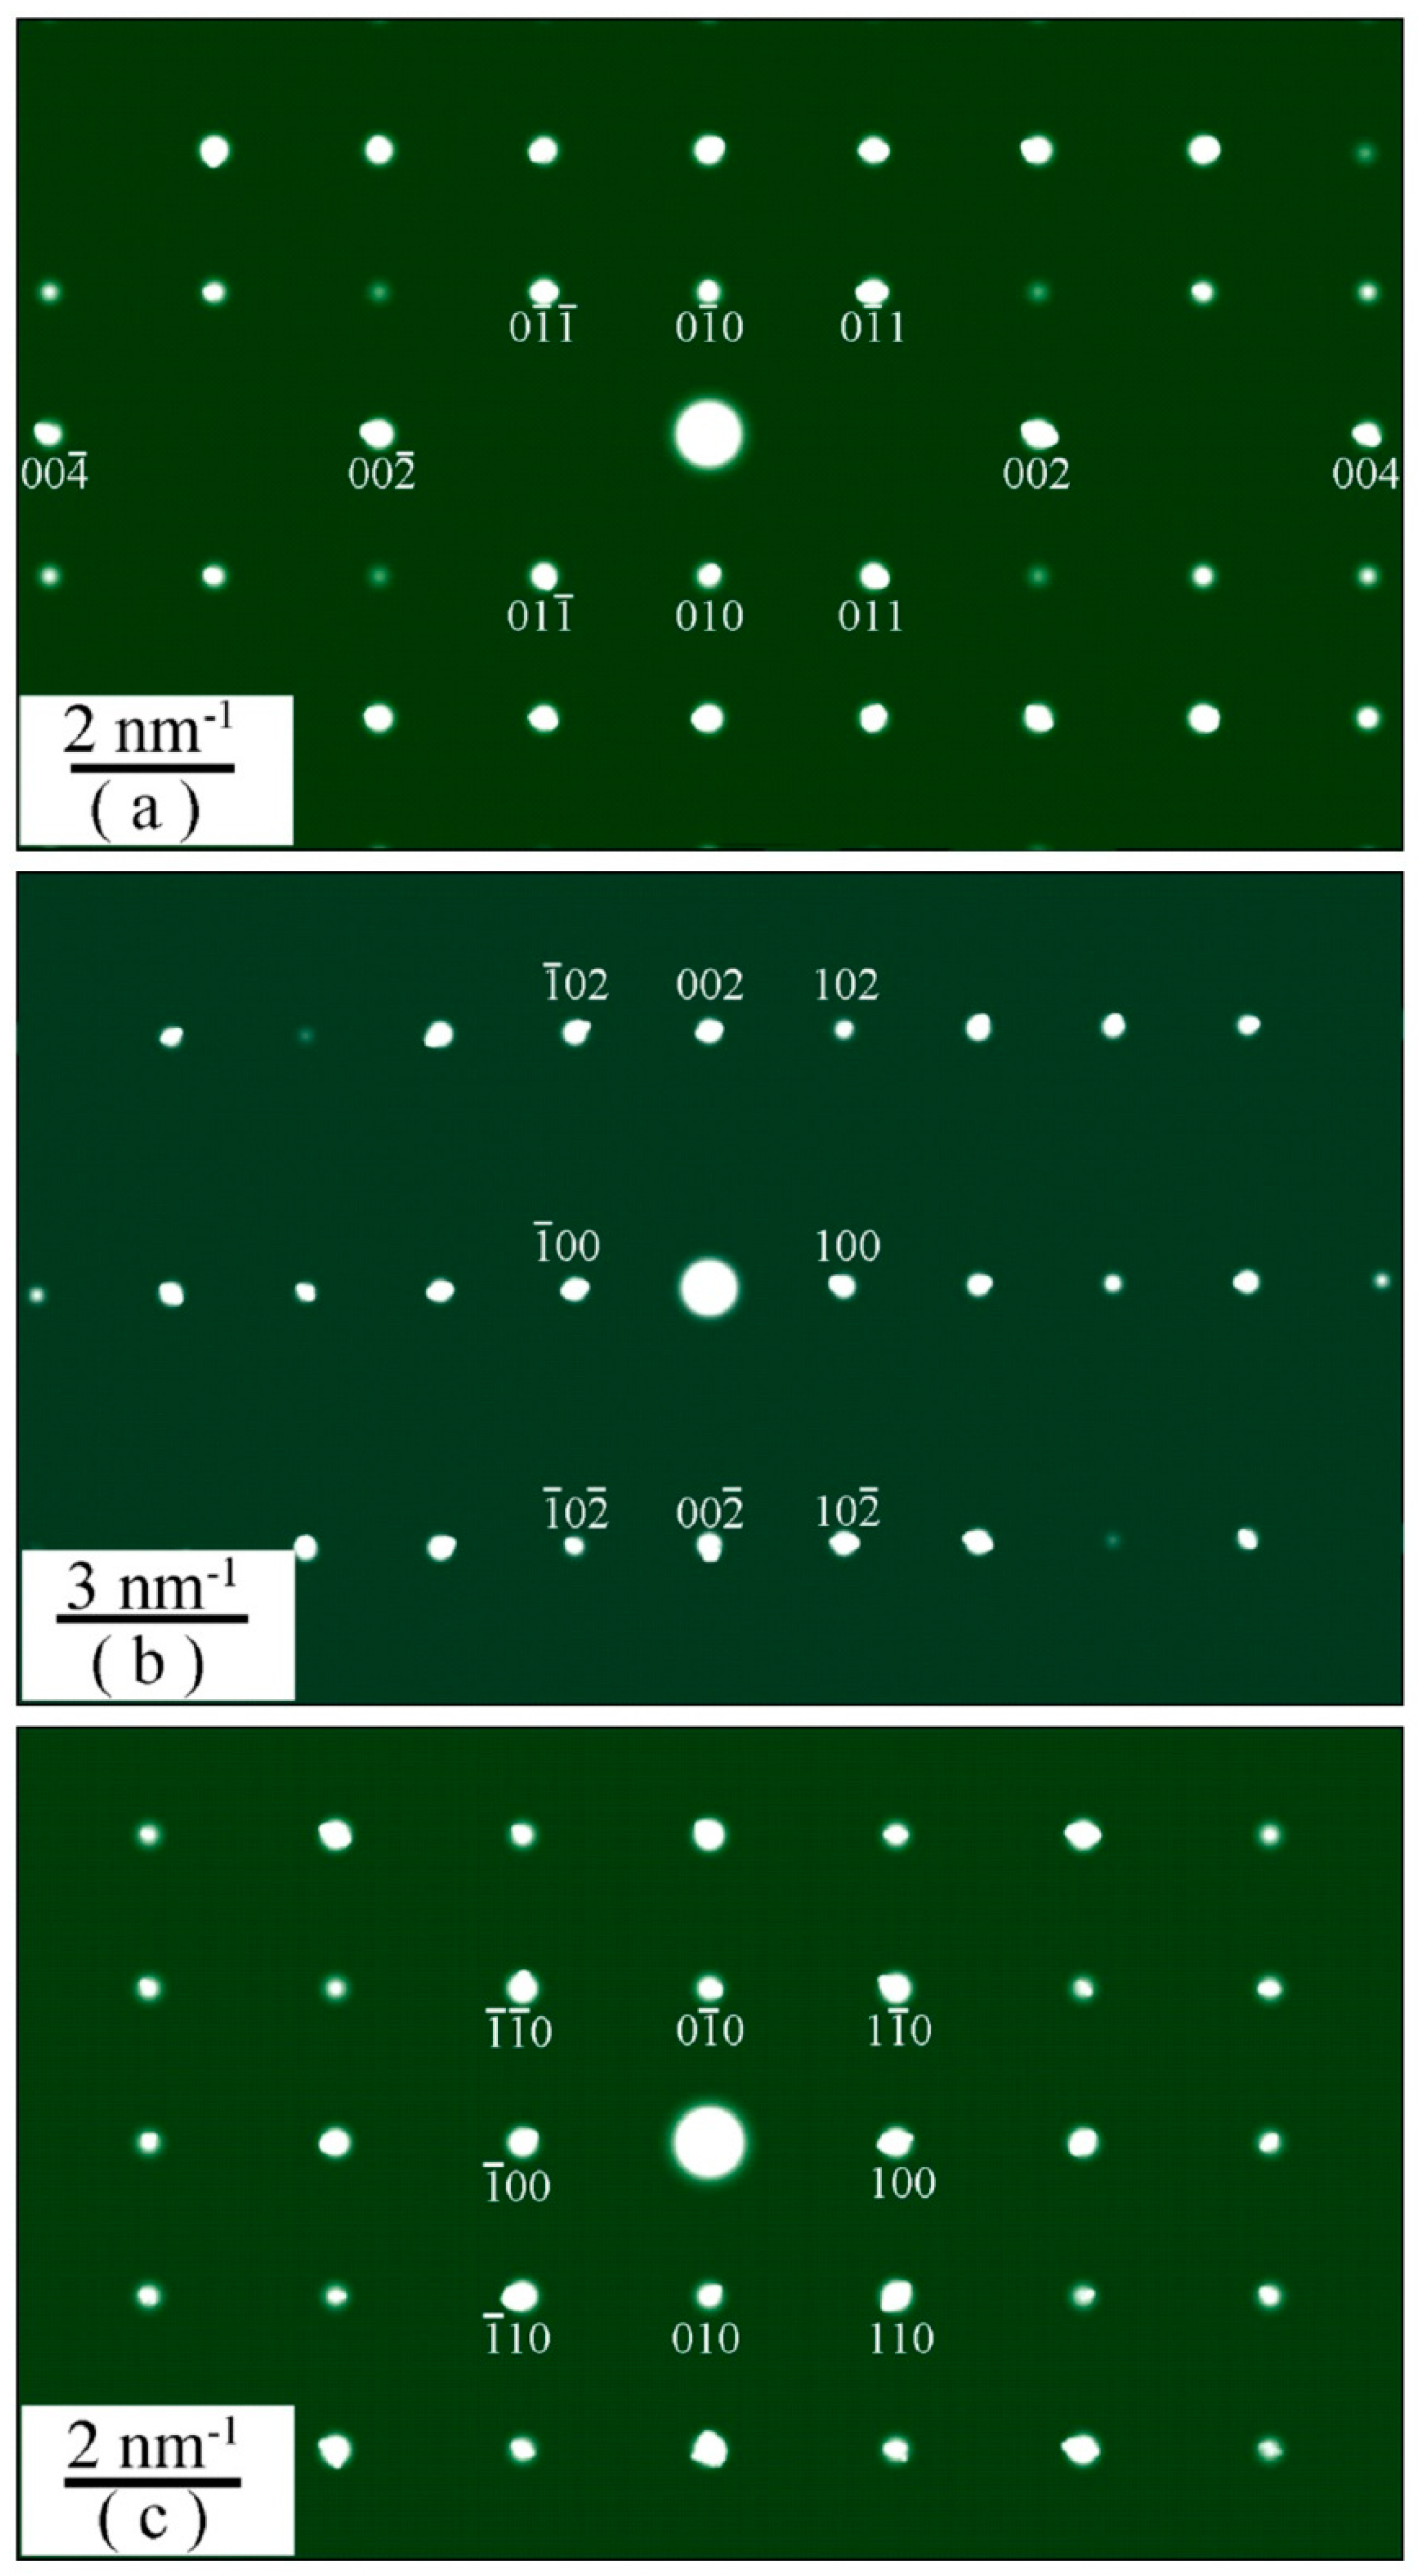
In order to confirm the formation of ZnWO4 nanoplates with {100}, {010}, and {001} facets, we performed electron diffraction characterizations. Figure 19 depicts the selected area electron diffraction patterns of ZnWO4 nanoplates with a {100} facet (a), {010} facet (b), and {001} facet (c). The operation voltage of the TEM machine was 200 keV in order to obtain clear electron diffraction patterns. Diffraction spots were labeled with Miller indices for each kind of facet. As shown in Figure 19a, the zone axis could be determined by evaluating the three shortest reciprocal lattice vectors [010], [011], and [002]. The zone axis in Figure 19a could be identified as [100], indicating the {100} facet of the ZnWO4 nanoplates. In a similar way, the zone axis [010] could be identified for ZnWO4 nanoplates with a {010} facet by evaluating the three shortest reciprocal lattice vectors [100], [002], and [102] in Figure 19b. As is well known, each spot in an electron diffraction pattern corresponds to a satisfied diffraction condition of the ZnWO4 nanoplate, and selected area electron diffraction patterns are a projection of the reciprocal lattice, in which the lattice reflections are shown as sharp diffraction spots. In our case, the diffraction spots in Figure 19c can be seen clearly. On the basis of the nearest diffraction spots around the zeroth-order diffraction spot, we could determine the zone axis of the electron diffraction as [001], which suggested the formation of the {001} facet for the ZnWO4 nanoplates. The combination of the electron diffraction patterns provided in Figure 19 with the lattice spacings given in Figure 16, Figure 17 and Figure 18 gave evidence on the formation of ZnWO4 nanoplates with {100}, {010}, and {001} facets.
3. Materials, Characterizations, and Calculations
3.1. Synthesis of ZnWO4 Nanoplates
Analytical-grade reagents ammonia, Zn(NO3)2·6H2O, Na2WO4·2H2O, and cetyltrimethyl ammonium bromide were provided by Sinopharm Chemical Reagents Ltd (Shanghai, China). To start, 0.001 mol of cetyltrimethyl ammonium bromide, 0.01 mol of Na2WO4·2H2O, and 0.01 mol of Zn(NO3)2·6H2O were dissolved in 80 mL of deionized water. After adding some drops of ammonia into the mixture, we adjusted the pH value of the mixture to be nearly 9, and then transferred the mixture into one Teflon-lined stainless-steel autoclave. The volume of the Teflon-lined reactor chamber was 90 mL. The autoclave was maintained at 180 °C for about 17 h. ZnWO4 nanoplates were obtained after the solid precipitates in the autoclave were filtered, washed, and dried. Because ZnWO4 nanoparticles had no clearly defined facets, we synthesized ZnWO4 nanoparticles as a reference. All other parameters in the hydrothermal reactions were kept unchanged with the exception of pH = 5.65.
In order to synthesize ZnWO4 nanoplates with {100}, {010}, and {001} facets, we altered the pH values of the mixtures of the starting materials in the autoclave, while all other parameters in the hydrothermal reactions were kept unchanged. When the pH values were 10.30, 10.86, and 11.20, we obtained ZnWO4 nanoplates with {100}, {010}, and {001} facets, respectively.
3.2. Phase, Morphology, and PL Characterizations of ZnWO4 Nanoplates
An X-ray diffractometer (XRD) (D/max 2500 PC, Japan) and scanning electron microscope (SEM) (S–4800, Hitachi, Japan) were employed to analyze the crystal structure and morphology of ZnWO4 nanoplates. The SEM was coupled with a silicon-drifted detector as the X-ray analyzer for the energy-dispersive X-ray (EDX) spectroscopic analysis. The nanostructures of the samples were characterized on a transmission electron microscope (TEM) (JEOL JEM–2100, Japan Electronics Corp.) which was operated at 200 kV. We measured the diffused reflectance spectra of ZnWO4 nanoplates with a UV–visible–infrared spectrometer (UV3600, Shimazu, Kyoto, Japan). The photoluminescence (PL) spectrum of the ZnWO4 nanoplates was recorded with a spectrophotometer (Tianjin Gangdong Ltd., China). The 325-nm laser line from a helium–cadmium laser was utilized as the excitation source for the PL measurement. The PL lifetime measurement of the samples was performed at room temperature on a picosecond fluorescence lifetime spectrometer (LifeSpec II, Edinburgh Instruments, Edinburgh, UK). The emission wavelength of the pulsed diode laser was 375 nm. The repetition frequency, peak power, and pulse width of the pulsed laser were 20 MHz, 90 mW, and 50 ps, respectively.
3.3. Electronic Structure Calculation of ZnWO4
Both the band structures and density of states of perfect ZnWO4 were calculated in the framework of density functional theory (DFT). The DFT software package (Atomistix ToolKit 11.8 package) was provided by Quantumwise. Lattice parameters of ZnWO4 were 0.4691 nm (a), 0.572 nm (b), 0.4925 nm (c), and 90.64° (β). The GGA+U scheme was employed to treat the exchange–correlation functional. GGA was described by the well-known Perdew–Burke–Ernzerhof potential. The U parameters were U5d = 8 eV for W, U2p = 0 eV, for O and U3d = 0 eV for Zn.
3.4. Photocatalytic Activity of ZnWO4 Nanoplates
The photocatalytic activity of ZnWO4 nanoplates was tested by monitoring the photocatalytic degradation of methyl orange in deionized water in a photocatalytic reactor. The UV emissions from one high-pressure Hg lamp was utilized as the photon source. In addition to the high-pressure Hg lamp, the photocatalytic reactor was made up of one inner cylindrical quartz tube whose diameter was 55 mm, one middle cylindrical glass tube whose diameter was 75 mm, and one outer cylindrical glass tube whose diameter was 140 mm. Each cylinder was 210 mm high. The bottoms of the cylinders were co-axially sealed together. The high-pressure Hg lamp was housed in the inner cylindrical quartz tube. Then, 400 mL of aqueous solution of methyl orange was filled into the working chamber for photocatalytic degradation. The working chamber was the free space between the middle glass tube and the inner glass tube, and the concentration of aqueous solution of methyl orange was 56 mM. In order to keep the temperature of the reaction solution lower than 40 °C, we filled running water into the free space between the outer glass tube and the middle glass tube. After loading 400 mg of ZnWO4 nanoplates into 400 mL of aqueous solution of methyl orange, the suspension was magnetically stirred to establish an adsorption–desorption equilibrium. Then, we started collecting several milliliters of the suspension at different photocatalytic stages for the determination of methyl orange concentration. Details on the instrumentation could be found elsewhere [36,37,45].
3.5. Measurement of Chemical Oxygen Demand (COD)
To check if the organic contaminants in water were completely mineralized, we measured the COD values of the methyl orange solutions via the K2Cr2O7 titration method [46]. Briefly, 20 mL of methyl orange solution derived at a specific stage of photocatalytic degradation was refluxed with HgSO4 (0.4g), K2Cr2O7 (0.25 mol/L, 10 mL), and a mixture of AgSO4 and H2SO4 (5g AgSO4 in 500 mL H2SO4, 30 mL) at 150 °C for 2 h. Then, the resultant solution was titrated with ferrous ammonium sulfate (0.1 mol/L) using a ferroin indicator. A blank titration was carried out with deionized water. The equation for the COD value determination is described in the literature [46].
3.6. X-Ray Photoelectron Spectroscopy (XPS) and Specific Surface Area Analyses
The XPS analysis was carried out on an Escalab 250Xi spectrophotometer (Thermo Scientific, Waltham, MA, USA). The incident X-ray came from Al Kα radiation with an energy of 1486.6 eV. The specific surface areas of ZnWO4 nanoplates and nanoparticles were measured using a surface area analyzer (Micromeritics ASAP2010C, Norcross, GA, USA) on the basis of N2 absorption at −196 °C. The samples were degassed overnight at 150 °C before N2 adsorption. The obtained N2 adsorption–desorption isotherms were evaluated with the Brunauer–Emmett–Teller (BET) equation to give the values of their specific surface areas.
4. Conclusions
ZnWO4 nanoplates with highly exposed {01} facets were synthesized. SEM and TEM characterizations revealed that the ZnWO4 nanoplates were about several micrometers long, 100 nm wide, and 10 nm thick. Steady-state and time-resolved PL analyses along with the DFT calculations confirmed that the strong blue PL of ZnWO4 nanoplates originated from the intrinsic defects in ZnWO4 nanoplates. Our photocatalytic tests showed that ZnWO4 nanoplates exhibited strong photo-oxidative capability, completely mineralizing the methyl orange molecules, whereas ZnWO4 nanoparticles could only break the organic molecules into fragments. The superior photo-oxidative capability of ZnWO4 nanoplates could be attributed to the specific chemical bonding and stereochemistry on the exposed crystal facets. This study demonstrates that crystal facet engineering is useful for the design of ZnWO4 with superior photo-oxidative capability. Moreover, it helps provide a solid basis for understanding the superior photo-oxidative capability of ZnWO4 nanoplates.
Author Contributions
Methodology, J.-S.S.; Formal Analysis, B.-G.Z.; Investigation, F.-F.Z.; Writing-Original Draft Preparation, B.-G.Z.; Writing-Review & Editing, Y.M.H.; Project Administration, B.-G.Z.; Funding Acquisition, L.Y.
Funding
This research was funded by the National Natural Science Foundation of China under the grant numbers 11574036 and 11604028.
Acknowledgments
Xiazhang Li is acknowledged for the TEM characterizations.
Conflicts of Interest
The authors declare no conflict of interest.
References
- Kraus, H.; Mikhailik, V.B.; Ramachers, Y.; Day, D.; Hutton, K.B.; Telfer, J. Feasibility study of a ZnWO4 scintillator for exploiting materials signature in cryogenic WIMP dark matter searches. Phys. Lett. B 2005, 610, 37–44. [Google Scholar] [CrossRef]
- Lou, Z.; Hao, J.; Cocivera, M. Luminescence of ZnWO4 and CdWO4 thin films prepared by spray pyrolysis. J. Lumin. 2002, 99, 349–354. [Google Scholar] [CrossRef]
- Fu, H.; Lin, J.; Zhang, L.; Zhu, Y. Photocatalytic activities of a novel ZnWO4 catalyst prepared by a hydrothermal process. Appl. Catal. A Gen. 2006, 306, 58–67. [Google Scholar] [CrossRef]
- Zhan, S.; Zhou, F.; Huang, N.; Liu, Y.; He, Q.; Tian, Y.; Yang, Y.; Ye, F. Synthesis of ZnWO4 electrode with tailored facets: Deactivating the microorganisms through photoelectrocatalytic methods. Appl. Surf. Sci. 2017, 391, 609–616. [Google Scholar] [CrossRef]
- Zhu, Z.; Zhou, F.; Zhan, S.; Huang, N.; He, Q. Enhancement of g–C3N4 cathode for inactivation of marine microorganisms in ZnWO4 photocatalytic system. Appl. Surf. Sci. 2018, 456, 156–163. [Google Scholar] [CrossRef]
- Yu, C.; Yu, J.C. Sonochemical fabrication. characterization and photocatalytic properties of Ag/ZnWO4 nanorod catalyst. Mater. Sci. Eng. B 2009, 164, 16–22. [Google Scholar] [CrossRef]
- Hamrouni, A.; Moussa, N.; Paola, A.D.; Parrino, F.; Houas, A.; Palmisano, L. Characterization and photoactivity of coupled ZnO–ZnWO4 catalysts prepared by a sol–gel method. Appl. Catal. B–Environ. 2014, 154, 379–385. [Google Scholar] [CrossRef]
- Zhao, X.; Yao, W.; Wu, Y.; Zhang, S.; Yang, H.; Zhu, Y. Fabrication and photoelectrochemical properties of porous ZnWO4 film. J. Solid State Chem. 2006, 179, 2562–2570. [Google Scholar] [CrossRef]
- Zhang, C.; Zhang, H.; Zhang, K.; Li, X.; Leng, Q.; Hu, C. Photocatalytic activity of ZnWO4: Band structure. morphology and surface modification. ACS Appl. Mater. Interfaces 2014, 6, 14423–14432. [Google Scholar] [CrossRef]
- Li, D.; Shi, R.; Pan, C.; Zhu, Y.; Zhao, H. Influence of ZnWO4 nanorod aspect ratio on the photocatalytic activity. CrystEngComm 2011, 13, 4695–4700. [Google Scholar] [CrossRef]
- Yan, J.; Shen, Y.; Li, F.; Li, T. Synthesis and photocatalytic properties of ZnWO4 nanocrystals via a fast microwave–assisted method. Sci. World J. 2013, 2013, 458106. [Google Scholar] [CrossRef] [PubMed]
- Gao, B.; Fan, H.; Zhang, X.; Song, L. Template–free hydrothermal synthesis and high photocatalytic activity of ZnWO4 nanorods. Mater. Sci. Eng. B 2012, 177, 1126–1132. [Google Scholar] [CrossRef]
- Luo, Z.; Xu, D.; Zhang, S.; Shen, J. Facile hydrothermal synthesis of ZnWO4 for enhanced photocatalytic performance. J. Nanosci. Nanotechnol. 2018, 18, 7241–7245. [Google Scholar] [CrossRef]
- Jiang, Y.; Liu, B.; Zhai, Z.; Liu, X.; Yang, B.; Liu, L.; Jiang, X. A general strategy toward the rational synthesis of metal tungstate nanostructures using plasma electrolytic oxidation method. Appl. Surf. Sci. 2015, 356, 273–281. [Google Scholar] [CrossRef]
- Liu, Z.; Tian, J.; Zeng, D.; Yu, C.; Zhu, L.; Huang, W.; Yang, K.; Li, D. A facile microwave–hydrothermal method to fabricate B doped ZnWO4 nanorods with high crystalline and highly efficient photocatalytic activity. Mater. Res. Bull. 2017, 94, 298–306. [Google Scholar] [CrossRef]
- Sun, L.; Zhao, X.; Cheng, X.; Sun, H.; Li, Y.; Li, P.; Fan, W. Evaluating the C, N, and F pairwise codoping effect on the enhanced photoactivity of ZnWO4: The charge compensation mechanism in donor–acceptor pairs. J. Phys. Chem. C 2011, 115, 15516–15524. [Google Scholar] [CrossRef]
- Chen, S.; Sun, S.; Sun, H.; Fan, W.; Zhao, X.; Sun, X. Experimental and theoretical studies on the enhanced photocatalytic activity of ZnWO4 nanorods by fluorine doping. J. Phys. Chem. C 2010, 114, 7680–7688. [Google Scholar] [CrossRef]
- Su, Y.; Zhu, B.; Guan, K.; Gao, S.; Lv, L.; Du, C.; Peng, L.; Hou, L.; Wang, X. Particle size and structural control of ZnWO4 nanocrystals via Sn2+ doping for tunable optical and visible photocatalytic properties. J. Phys. Chem. C 2012, 116, 18508–18517. [Google Scholar] [CrossRef]
- Dutta, D.P.; Raval, P. Effect of transition metal ion (Cr3+, Mn2+ and Cu2+) doping on the photocatalytic properties of ZnWO4 nanoparticles. J. Photochem. Photobiol. A 2018, 357, 193–200. [Google Scholar] [CrossRef]
- Deng, S.; Zhang, W.; Hu, Z.; Feng, Z.; Hu, P.; Wu, H.; Ma, L.; Pan, Y.; Zhu, Y.; Xiong, G. Dual–functional Bi3+, Dy3+ co–doping ZnWO4 for photoluminescence and photocatalysis. Appl. Phys. A 2018, 124, 526. [Google Scholar] [CrossRef]
- Wang, F.; Li, W.; Gu, S.; Li, H.; Zhou, H.; Wu, X. Novel In2S3/ZnWO4 heterojunction photocatalysts: Facile synthesis and high–efficiency visible–light driven photocatalytic activity. RSC Adv. 2015, 5, 89940–89950. [Google Scholar] [CrossRef]
- Tian, L.; Rui, Y.; Sun, K.; Cui, W.; An, W. Surface decoration of ZnWO4 nanorods with Cu2O nanoparticles to build heterostructure with enhanced photocatalysis. Nanomaterials 2018, 8, 33. [Google Scholar] [CrossRef] [PubMed]
- Wang, Y.; Liping, L.; Li, G. Solvothermal synthesis. characterization and photocatalytic performance of Zn–rich ZnWO4 nanocrystals. Appl. Surf. Sci. 2017, 393, 159–167. [Google Scholar] [CrossRef]
- Yuan, D.; Zhang, L.; Lai, J.; Xie, L.; Mao, B.; Zhan, D. SECM evaluations of the crystal–facet–correlated photocatalytic activity of hematites for water splitting. Electrochem. Commun. 2016, 73, 29–32. [Google Scholar] [CrossRef]
- Wu, X.; Ng, H.Y.; Wang, L.; Du, Y.; Dou, S.X.; Amal, R.; Scott, J. Improving the photo–oxidative capability of BiOBr via crystal facet engineering. J. Mater. Chem. A 2017, 5, 8117–8124. [Google Scholar] [CrossRef]
- Qi, W.; An, X.; Zhang, F.; Liu, H.; Qu, J. Facet–dependent intermediate formation and reaction mechanism of photocatalytic removing hydrophobic anthracene under simulated solar irradiation. Appl. Catal. B–Environ. 2017, 206, 194–202. [Google Scholar] [CrossRef]
- Rong, S.; Zhang, P.; Liu, F.; Yang, Y. Engineering crystal facet of α–MnO2 nanowire for highly efficient catalytic oxidation of carcinogenic airborne formaldehyde. ACS Catal. 2018, 8, 3435–3446. [Google Scholar] [CrossRef]
- Huang, Y.M.; Li, M.Y.; Yang, L.; Zhai, B.G. Eu2+ and Eu3+ doubly doped ZnWO4 nanoplates with superior photocatalytic performance for dye degradation. Nanomaterials 2018, 8, 765. [Google Scholar] [CrossRef] [PubMed]
- Zhai, B.G.; Ma, Q.L.; Yang, L.; Huang, Y.M. Effects of sintering temperature on the morphology and photoluminescence of Eu3+ doped zinc molybdenum oxide hydrate. J. Nanomater. 2018, 2018, 7418508. [Google Scholar] [CrossRef]
- Kalinko, A.; Kuzmin, A.; Evarestov, R.A. Ab initio study of the electronic and atomic structure of the wolframite–type ZnWO4. Solid State Commun. 2009, 149, 425–428. [Google Scholar] [CrossRef]
- Zhai, B.G.; Yang, L.; Ma, Q.L.; Liu, X.; Huang, Y.M. Mechanism of the prolongation of the green afterglow of SrAl2O4:Dy3+ caused by the use of H3BO3 flux. J. Lumin. 2017, 181, 78–87. [Google Scholar] [CrossRef]
- Zhai, B.G.; Yang, L.; Ma, Q.L.; Huang, Y.M. Growth of ZnMoO4 nanowires via vapor deposition in air. Mater. Lett. 2017, 188, 119–122. [Google Scholar] [CrossRef]
- Ma, Q.L.; Xiong, R.; Huang, Y.M. Tunable photoluminescence of porous silicon by liquid crystal infiltration. J. Lumin. 2011, 131, 2053–2057. [Google Scholar] [CrossRef]
- Zhai, B.G.; Ma, Q.L.; Yang, L.; Huang, Y.M. Synthesis and optical properties of Tb–doped pentazinc dimolybdate pentahydrate. Results Phys. 2017, 7, 3991–4000. [Google Scholar] [CrossRef]
- Zhai, B.G.; Yang, L.; Huang, Y.M. Intrinsic defect engineering in Eu3+ doped ZnWO4 for annealing temperature tunable photoluminescence. Nanomaterials 2019, 9, 99. [Google Scholar] [CrossRef] [PubMed]
- Ma, Q.L.; Xiong, R.; Zhai, B.G.; Huang, Y.M. Ultrasonic synthesis of fern–like ZnO nanoleaves and their enhanced photocatalytic activity. App. Surf. Sci. 2015, 324, 842–848. [Google Scholar] [CrossRef]
- Zhai, B.G.; Ma, Q.L.; Yang, L.; Huang, Y.M. Synthesis of morphology–tunable ZnO nanostructures via the composite hydroxide mediated approach for photocatalytic applications. Mater. Res. Express 2016, 3, 105045. [Google Scholar] [CrossRef]
- Shi, R.; Wang, Y.; Li, D.; Xu, J.; Zhu, Y. Synthesis of ZnWO4 nanorods with [100] orientation and enhanced photocatalytic properties. Appl. Catal. B–Environ. 2010, 100, 173–178. [Google Scholar] [CrossRef]
- Huang, Y.M.; Zhai, B.G.; Zhou, F.F. Effects of photo–irradiation on the optical properties and electronic structures of an azo–containing bent–core liquid crystal. Mol. Cryst. Liq. Cryst. 2009, 510, 34–42. [Google Scholar] [CrossRef]
- Azuma, J.; Tamai, N.; Shishido, A.; Ikeda, T. Femtosecond dynamics and stimulated emission from the S2 state of a liquid crystalline trans–azobenzene. Chem. Phys. Lett. 1998, 288, 72–78. [Google Scholar] [CrossRef]
- Lednev, I.K.; Ye, T.Q.; Matousek, P.; Towrie, M.; Foggi, P.; Neuwahl, F.V.R.; Umapathy, S.; Hester, R.E.; Moore, J.N. Femtosecond time–resolved UV–visible absorption spectroscopy of trans–azobenzene: Dependence on excitation wavelength. Chem. Phys. Lett. 1998, 290, 68–74. [Google Scholar] [CrossRef]
- Azoz, S.; Jiang, J.; Keskar, G.; McEnally, C.; Alkas, A.; Ren, F.; Marinkovic, N.; Haller, G.L.; Ismail-Beigi, S.; Pfefferle, L.D. Mechanism for strong binding of CdSe quantum dots to multiwall carbon nanotubes for solar energy harvesting. Nanoscale 2013, 5, 6893–6900. [Google Scholar] [CrossRef] [PubMed]
- Liao, H.G.; Zherebetskyy, D.; Xin, H.; Czarnik, C.; Ercius, P.; Elmlund, H.; Pan, M.; Wang, L.W.; Zheng, H. Facet development during platinum nanocube growth. Science 2014, 345, 916–919. [Google Scholar] [CrossRef]
- Shanavas, K.V.; Sharma, S.M.; Dasgupta, I.; Nag, A.; Hazarika, A.; Sarma, D.D. First-principles study of the effect of organic ligands on the crystal structure of CdS nanoparticles. J. Phys. Chem. C 2012, 116, 6507–6511. [Google Scholar] [CrossRef]
- Zhai, B.G.; Liu, D.; He, Y.; Yang, L.; Huang, Y.M. Tuning the photoluminescence of Eu2+ and Eu3+ co–doped SrSO4 through post annealing technique. J. Lumin. 2018, 194, 485–493. [Google Scholar] [CrossRef]
- Krishnakumar, B.; Swaminathan, M. Influence of operational parameters on photocatalytic degradation of a genotoxic azo dye acid violet 7 in aqueous ZnO suspensions. Spectrochim. Acta A 2011, 81, 739–744. [Google Scholar] [CrossRef] [PubMed]
Figure 1.
SEM micrograph (a), low-resolution TEM micrograph (b), and high-resolution TEM micrograph (c) of ZnWO4 nanoplates.
Figure 1.
SEM micrograph (a), low-resolution TEM micrograph (b), and high-resolution TEM micrograph (c) of ZnWO4 nanoplates.

Figure 2.
Electron diffraction pattern for ZnWO4 nanoplates with {01} facet.

Figure 3.
High-resolution SEM micrographs of ZnWO4 nanoplates: (a) Two large nanolates with two small nanoplates; (b) One large nanolate with a few small nanoplates.
Figure 3.
High-resolution SEM micrographs of ZnWO4 nanoplates: (a) Two large nanolates with two small nanoplates; (b) One large nanolate with a few small nanoplates.

Figure 4.
X-ray diffraction (XRD) curve (a) and energy-dispersive X-ray spectroscopy (EDX) spectrum (b) of ZnWO4 nanoplates.
Figure 4.
X-ray diffraction (XRD) curve (a) and energy-dispersive X-ray spectroscopy (EDX) spectrum (b) of ZnWO4 nanoplates.

Figure 5.
EDX elemental maps of O, Zn, and W along one ZnWO4 nanoplate: (a) ZnWO4 nanoplate; (b) O map; (c) Zn map; and (d) W map.
Figure 5.
EDX elemental maps of O, Zn, and W along one ZnWO4 nanoplate: (a) ZnWO4 nanoplate; (b) O map; (c) Zn map; and (d) W map.

Figure 6.
Ultraviolet–visible light (UV–Vis) absorption spectrum (a) and photoluminescence (PL) spectrum (b) of ZnWO4 nanoplates. The Tauc plot and luminescence photo are shown as insets for the ZnWO4 nanoplates.
Figure 6.
Ultraviolet–visible light (UV–Vis) absorption spectrum (a) and photoluminescence (PL) spectrum (b) of ZnWO4 nanoplates. The Tauc plot and luminescence photo are shown as insets for the ZnWO4 nanoplates.

Figure 7.
Band structures (a) and density of states (b) of defect-free ZnWO4 derived via density functional theory (DFT) calculations in the scheme of generalized gradient approximation (GGA)+U.
Figure 7.
Band structures (a) and density of states (b) of defect-free ZnWO4 derived via density functional theory (DFT) calculations in the scheme of generalized gradient approximation (GGA)+U.

Figure 8.
Time-resolved PL spectra for ZnWO4 nanoplates at different detection wavelengths: (a) 460 nm; (b) 500 nm.
Figure 8.
Time-resolved PL spectra for ZnWO4 nanoplates at different detection wavelengths: (a) 460 nm; (b) 500 nm.

Figure 9.
Absorption spectra of methyl orange solution as a function of UV irradiation time in the presence of ZnWO4 nanoplates (a) and in the presence of ZnWO4 nanoparticles (b).
Figure 9.
Absorption spectra of methyl orange solution as a function of UV irradiation time in the presence of ZnWO4 nanoplates (a) and in the presence of ZnWO4 nanoparticles (b).

Figure 10.
Chemical oxygen demand (COD) plots of methyl orange solution against the UV irradiation time in the presence of ZnWO4 nanoplates (a) and in the presence of ZnWO4 nanoparticles (b).
Figure 10.
Chemical oxygen demand (COD) plots of methyl orange solution against the UV irradiation time in the presence of ZnWO4 nanoplates (a) and in the presence of ZnWO4 nanoparticles (b).

Figure 11.
XPS survey scan (a), and XPS spectra of Zn 2p (b), O 1s (c), and W 4f (d) in ZnWO4 nanoplates.
Figure 11.
XPS survey scan (a), and XPS spectra of Zn 2p (b), O 1s (c), and W 4f (d) in ZnWO4 nanoplates.

Figure 12.
XPS survey scan (a), and XPS spectra of Zn 2p (b), O 1s (c), and W 4f (d) in ZnWO4 nanoparticles.
Figure 12.
XPS survey scan (a), and XPS spectra of Zn 2p (b), O 1s (c), and W 4f (d) in ZnWO4 nanoparticles.

Figure 13.
N2 adsorption and desorption isotherms of ZnWO4 nanoplates (a) and ZnWO4 nanoparticles (b). The inset shows the pore size distributions of ZnWO4 nanoplates and nanoparticles.
Figure 13.
N2 adsorption and desorption isotherms of ZnWO4 nanoplates (a) and ZnWO4 nanoparticles (b). The inset shows the pore size distributions of ZnWO4 nanoplates and nanoparticles.

Figure 14.
Schematic illustrations of the crystal structures on ZnWO4 facets: (a) the {100} facet; (b) the {010} facet; (c) the {001} facet; and (d) the {01} facet. The O, W, and Zn atoms are shown in red, blue, and gray, respectively.
Figure 14.
Schematic illustrations of the crystal structures on ZnWO4 facets: (a) the {100} facet; (b) the {010} facet; (c) the {001} facet; and (d) the {01} facet. The O, W, and Zn atoms are shown in red, blue, and gray, respectively.

Figure 15.
Schematic illustration of the possible intermediates produced in the photocatalytic degradation of methyl orange by ZnWO4 nanoplates: (a) an original methyl orange molecule; (b) the methyl orange molecule when its azo-linkage is partially broken; (c,d) fragments of the methyl orange molecule when its azo-linkage is completely broken; (e) fragment (c) when the conjugation in the aromatic ring is destroyed; (f) fragment (d) when the conjugation in the aromatic ring is destroyed.

Figure 16.
(a) High-resolution TEM micrograph of one ZnWO4 nanoplate with a {100} facet; (b) absorption spectra of methyl orange solution as a function of UV irradiation time in the presence of ZnWO4 nanoplates with a {100} facet.
Figure 16.
(a) High-resolution TEM micrograph of one ZnWO4 nanoplate with a {100} facet; (b) absorption spectra of methyl orange solution as a function of UV irradiation time in the presence of ZnWO4 nanoplates with a {100} facet.

Figure 17.
(a) High-resolution TEM micrograph of one ZnWO4 nanoplate with a {010} facet; (b) absorption spectra of methyl orange solution as a function of UV irradiation time in the presence of ZnWO4 nanoplates with a {010} facet.
Figure 17.
(a) High-resolution TEM micrograph of one ZnWO4 nanoplate with a {010} facet; (b) absorption spectra of methyl orange solution as a function of UV irradiation time in the presence of ZnWO4 nanoplates with a {010} facet.

Figure 18.
(a) High-resolution TEM micrograph of one ZnWO4 nanoplate with a {001} facet; (b) absorption spectra of methyl orange solution as a function of UV irradiation time in the presence of ZnWO4 nanoplates with a {001} facet.
Figure 18.
(a) High-resolution TEM micrograph of one ZnWO4 nanoplate with a {001} facet; (b) absorption spectra of methyl orange solution as a function of UV irradiation time in the presence of ZnWO4 nanoplates with a {001} facet.

Figure 19.
Selected area electron diffraction patterns of ZnWO4 nanoplates with different facets: (a) {100} facet; (b) {010} facet; and (c) {001} facet. The operation voltage of the TEM machine was 200 keV.
Figure 19.
Selected area electron diffraction patterns of ZnWO4 nanoplates with different facets: (a) {100} facet; (b) {010} facet; and (c) {001} facet. The operation voltage of the TEM machine was 200 keV.

© 2019 by the authors. Licensee MDPI, Basel, Switzerland. This article is an open access article distributed under the terms and conditions of the Creative Commons Attribution (CC BY) license (http://creativecommons.org/licenses/by/4.0/).
Share and Cite
MDPI and ACS Style
Zhai, B.-g.; Yang, L.; Zhou, F.-f.; Shi, J.-s.; Huang, Y.M. Strong Photo-Oxidative Capability of ZnWO4 Nanoplates with Highly Exposed {0 1 1} Facets. Catalysts 2019, 9, 178. https://doi.org/10.3390/catal9020178
AMA Style
Zhai B-g, Yang L, Zhou F-f, Shi J-s, Huang YM. Strong Photo-Oxidative Capability of ZnWO4 Nanoplates with Highly Exposed {0 1 1} Facets. Catalysts. 2019; 9(2):178. https://doi.org/10.3390/catal9020178
Chicago/Turabian StyleZhai, Bao-gai, Long Yang, Fu-fang Zhou, Jun-sheng Shi, and Yuan Ming Huang. 2019. "Strong Photo-Oxidative Capability of ZnWO4 Nanoplates with Highly Exposed {0 1 1} Facets" Catalysts 9, no. 2: 178. https://doi.org/10.3390/catal9020178
Note that from the first issue of 2016, this journal uses article numbers instead of page numbers. See further details here.