Article

Fluorinated and Platinized Titania as Effective Materials in the Photocatalytic Treatment of Dyestuffs and Stained Wastewater Coming from Handicrafts Factories

by
Julie Joseane Murcia
1,*,
Ángela Carolina Cely
1,
Hugo Alfonso Rojas
1,
María Carmen Hidalgo
2 and
José Antonio Navío
2
1
Grupo de Catálisis, Escuela de Ciencias Químicas, Universidad Pedagógica y Tecnológica de Colombia UPTC, Avenida Central del Norte, 150003 Tunja, Boyacá, Colombia
2
Instituto de Ciencia de Materiales de Sevilla (ICMS), Consejo Superior de Investigaciones Científicas CSIC—Universidad de Sevilla, Américo Vespucio 49, 41092 Seville, Spain
*
Author to whom correspondence should be addressed.
Catalysts 2019, 9(2), 179; https://doi.org/10.3390/catal9020179
Submission received: 17 January 2019 / Revised: 7 February 2019 / Accepted: 10 February 2019 / Published: 14 February 2019
(This article belongs to the Special Issue New Trends in the Photocatalytic Removal of Organic Dyes)

Abstract

:
In this study, commercial and lab-prepared TiO2 were modified by fluorination and platinum photodeposition; and the effect of these modifications over the physicochemical and photocatalytic properties of TiO2 was evaluated. It was found that F and Pt addition leads to the modification of the optical and textural properties of TiO2. The materials prepared were tested in the photocatalytic degradation of different organic dyestuffs such as methylene blue (MB) and methyl orange (MO); the degradation of commercial anilines employed in the staining of natural fibers was also evaluated. Photocatalysis was also studied in this work as an eco-friendly treatment of wastewater coming from handicrafts factories. In general it was observed that the effectiveness of the photocatalytic treatment strongly depends on the substrate to be degraded, thus, fluorinated and platinized commercial Titania (Pt-F-P25) showed the best photocatalytic performance in the MB and MO photodegradation and in contrast, in the case of the anilines the highest degradation was obtained over commercial TiO2 fluorinated (F-P25). These results can be explained by differences observed in the structure and in the adsorption of these dyestuffs over the photocatalysts surfaces. F-P25 photocatalyst also demonstrated to be the best material for the treatment of real wastewater coming from handicrafts factories.

Graphical Abstract

1. Introduction

Handicrafts elaboration is a traditional activity in Latin America and currently, the handicrafts factories represent one of the most important lines of the economy in many regions in Latin-American countries such as Colombia; these industries have a large consumption of water and in these processes important volumes of wastewater containing different pollutants, mainly dyestuffs used in the staining of natural fibers and wool, are generated. In many cases the wastewater coming from handicraft production represents an important environmental problem; wastewater can arrive at the rivers located near to the factories, and there, the dyestuffs may be carcinogenic [1] and mutagenic for living species.
Currently, finding new and more effective treatments for industrial wastewater represents a challenge for the scientific community around the world. Photocatalysis has been recognized as an eco-friendly, less expensive, non-selective and effective alternative in the treatment of effluents. Thus, a number of studies have demonstrated that heterogeneous photocatalysis is a promising approach of Advanced Oxidation Process in the treatment of dyestuffs in the liquid phase [2,3,4,5,6,7,8,9,10,11]. In most of these studies, lab prepared dyes solutions or synthetic wastewater are employed and only a few researchers have conducted studies by using real industrial wastewater samples [12,13]. Working with real wastewater samples, which are polluted by different types of organic substances lead to determine the true effectiveness of the photocatalytic treatment. Methyl orange and Methylene blue has extensively studied in order to know their photodegradation mechanism, which takes place mainly by unstable intermediates cations formation and successive oxidation reactions [14,15,16,17].
In the dyestuffs degradation by photocatalysis, it takes place a series of chemical reactions focused on the total mineralization of these pollutants transforming them in higher biodegradable or lower toxic reaction byproducts; however, the effectiveness of these processes depends on many factors such as pH in the reaction medium, the chemical structure of dyes, and also the dyestuff adsorption onto the surface of the photocatalysts represents a crucial step on the effectiveness of the photocatalytic treatment [7].
As TiO2 is the most recognized and employed material in photocatalysis, many efforts have been devoted to improve its effectiveness; thus, noble metal addition [11,18], non-metals doping [19,20], sulfation and fluorination [4,21,22,23,24,25,26,27,28,29,30] among others have been reported to be suitable alternatives for titania modification. Taking into account that the practical application of TiO2 is not in the form of dispersions, many studies in this area have been also focused on supported TiO2 being photolyzed in the presence of a pollutant during a continuous cleaning process [14,16,28,31,32], in these processes the separation of the pollutant from the processed solution at the end of the process it is not necessary.
The main target of this work was focused on the evaluation of photocatalysis efficiency in the treatment of dyestuffs and stained wastewater coming from Colombian handicrafts factories. Lab prepared and commercial TiO2 were modified by fluorine and platinum addition, the materials thus obtained were employed as photocatalysts in the degradation of commercial dyestuffs solutions and also in the treatment of real industrial wastewater samples.

2. Results and Discussion

2.1. Photocatalysts Characterization Results

The key experimental parameters used in the present work and some characterization results are reported in Table 1. As it can be observed in this table, the specific surface area of lab prepared TiO2 significantly increases after fluorination, this is because fluorine ions protect Anatase phase against the Rutile phase formation sintering, preserving the surface area during the calcination at 650 °C [21]. After Pt deposition the SBET of lab prepared and commercial TiO2 slightly decreases, this is probably due to pore blocking by Pt particles on Titania surface.
Figure 1 shows the XRD patterns obtained for all the photocatalysts analyzed, as it can be observed lab prepared TiO2 presents both, Anatase and Rutile phases (ratio of 90:10), after fluorination and platinization only Anatase phase was observed in the solids. This is mainly due to the protective effect of the fluorination over Titania surface, as it was previously mentioned, this pretreatment inhibits the formation of the Rutile phase during the calcination process [21,22].
The Anatase crystallite size (DAnatase) was calculated from the XRD data by means of the Scherrer equation, and the values obtained are between 11 and 24 nm (Table 1). Lab prepared TiO2 sample shows the lowest value; however, this size notably increases after fluorination. It has been reported that fluorination enhanced the crystallization of the Anatase phase and promoted the growth of crystallites [23,28]. In the case of commercial TiO2 P25, it was observed that the Anatase: Rutile ratio (i.e., 80:20) and DAnatase were not significantly affected by fluorination or Pt addition.
The use of fluorine as a morphology controlling agent has been extensively reported in scientific literature, in general, during the fluorination of TiO2 surface a substitution reaction takes place, in this reaction the hydroxyl groups (Titanol groups) can be replaced by Fluoride ions, as it was reported by Torrents et al. [27], each fluorine substituted/adsorbed occupy 0.33 nm2 on the TiO2 surface (i.e., 3 to 4 F- ions per 1 nm of TiO2 surface). Other authors such as Vohra et al. [24] have studied the Fluorine ions content on TiO2 surface at different pH values by using a 10mM NaF solution as Fluorine precursor, these authors have found that the 95% of Titanol groups are replaced by Fluorine ions in an interval pH value between 3 and 5. Fluorination of TiO2 surface has an important influence over physicochemical and photocatalytic properties of this oxide:
(i) On one side, the anchorage of fluorine ions by replacing OH groups on the Titania surface has a protective effect over the surface of this oxide during the treatment at high temperatures, it is because fluorine ions are not eliminated from surface even after 650 °C, as it was observed in the present work and other research previously reported [21,26], thus preventing the sinterization of titania particles and therefore the Rutile phase formation, as it widely known the transition of Anatase to Rutile phase takes place at temperatures above 600 °C in a typical bare Titania surface without protection.
(ii) On the other hand, fluoride can promote the growth of Titania crystallites [23,28], it was also found that morphology and crystallite size depend on the concentration of fluorine precursor, thus Liu et al. [30] have reported a complete study devoted to analyzing the mechanism of TiO2 crystal growth by fluorination processes; these authors have indicated that during fluorination, the formation of HF in the hydrolyze process of fluorine precursor takes place, and the surface-selective fluorinated on different facets could be the core steps for the nucleation and crystal growth of anatase particles with dominant {001} facets. High concentration of starting materials during F-TiO2 synthesis would promote the nucleation and crystal growth of the exposed mirror-like plane (001) crystalline facets.
Figure 2 shows the UV-Vis DR spectra of the photocatalysts analyzed, for all the samples the characteristic band edge of TiO2 was observed at around 370 nm. A slight increase of absorbance throughout the visible range of the spectrum was observed in the fluorinated and platinized samples; this is mainly due to the presence of fluorine species on Titania surface and also due to the gray color of platinized photocatalysts. The band gap values were also calculated from the UV–Vis DR spectra and it was observed that this value slightly decreases after fluorination and platinization (Table 1). It is important to comment that fluorinated and platinized Titania lab prepared materials have been studied in different photocatalytic processes previously reported [21,26], for these studies different series of samples have been prepared and characterized almost twice, and the spectra and results the obtained in band gap values are the same as those reported in the present work, these data ensure the reliability of the results reported in the present manuscript.
Figure 3 shows selected TEM images for the platinized samples and the Pt particle size distribution, in these figures the Pt nanoparticles can be identified as small black dots. Pt–F–TiO2 sample (Figure 3a) presents a large number of Pt nanoparticles with size > 6 nm. For Pt–F–P25 sample (Figure 3b) the aggregation of Pt particles heterogeneously distributed on Titania surface is clearly observed, with an average Pt particle size in this sample between 9 and 10 nm.
The chemical composition of the samples was evaluated by XRF and it was observed that the real platinum content was 0.36% and 0.39% for Pt–F–P25 and Pt–F–TiO2, respectively. These values are under the nominal metal content (0.5 wt.%) thus indicating an incomplete reduction of the metal precursor during the photochemical deposition. For these samples negligible amounts of Cl species, remained on the platinized solids after preparation, were also detected (i.e., <0.02 wt.%). F or Na species were not detected by XRF.
Table 1 presents the binding energies and Figure 4 shows selected spectra of the samples analyzed by XPS. These measurements showed in the O 1s region, a peak located at the binding energy of 529.6 ± 0.2 eV for all the samples, corresponding to O in the Titania network. In addition, a broad shoulder at higher binding energies (530.3 eV) ascribed to oxygen in surface hydroxyl groups was also observed; this shoulder is most prominent in the F-TiO2 sample, indicating the highest hydroxylation degree of this material. The ground lying study of E. Pelizzetti et al. [33,34], in the early eighties, was devoted to studying the interaction of hydrogen and oxygen with loaded titanium dioxide.
On the other hand, the Ti 2p core level spectra were similar for all the studied samples with peaks of binding energies located at 458 ± 0.5 eV, ascribed to Ti4+ as the main component. By XPS analyzes, the presence of fluoride species on the surface fluorinated samples was detected, indicating that ≡TiOH2 species could be substituted by ≡TiF [24]. By XPS was also determined the atomic concentration of fluorine (Table 1) and it was found that the fluorine concentration on lab prepared TiO2 is lower than that observed in P25 samples, it is also found that the fluorine content decreases after platinum addition, probably due to the lixiviation of this element during the synthesis of the platinized samples. Sodium species remained from NaF precursor were also detected in the samples. As it was previously indicated F and Na species were not detected by XRF analyzes, it can be due to the lower content of these species in the bulk of the photocatalysts.
Figure 5 shows the FTIR spectra in the range between 4000 and 2400 cm−1 obtained for the photocatalysts analyzed.
A band located at 3698 cm−1 corresponding to isolated hydroxyl groups (Ti–OH(is)) was detected in all the samples. Two bands located at 3393 cm−1 and at 3000 cm−1 were also detected. These absorptions have been assigned to terminal Ti–OH and adsorbed water Ti–OH2 species, respectively. It is also possible to observe that after fluorination or Pt addition the relative intensity of the TiO2 IR bands decreases; mainly due to the presence of fluorine or Pt ions on the surface.

2.2. Commercial Dyestuffs Characterization Results

A survey asking the handicraftsmen for the dyestuffs commonly used in textile industries located in the Colombian region of Boyacá was performed in this work. From this survey, it was possible to determine that anilines are the dyestuffs mainly used in the handicrafts factories; representing the 56% of the dyestuffs used in the staining of sheep wool and other natural fibers (Figure 6A), which are the most recognized starting materials for the handicrafts production in Colombia.
Figure 6B shows the percentage of the different trademarks anilines used in the staining of natural fibers in the handicrafts factories. The most used anilines, according to their commercial names are: “El Sol” (S), “El Paisa” (P) and “El Indio” (I).
It is worth noting that the anilines composition is not declared by the manufacturers but according to the data sheet provided by the commercial supplier, these anilines are monoazo dyes type.
The elemental analysis carried out by XRF shows that the anilines under study are mainly composed by C, N2, O2, Na, Mg, Al, Si, P, S, Cl, Mn, Fe and Ni.
Figure 7 presents the XRD patterns of the anilines, as it can be seen in this figure, these are crystalline samples with similar characteristics. Different diffraction patterns were detected in these samples; thus, the peaks located at 2Ө positions of 27.41°, 45.53° and 53.97°correspond to sodium sulfate; the peaks at 32.99° and 58.52° are assigned to Calcium; Carbon is identified by the peaks located at 37.77° and p-aniline can be identified by peaks at 22.52° and 40.57°.
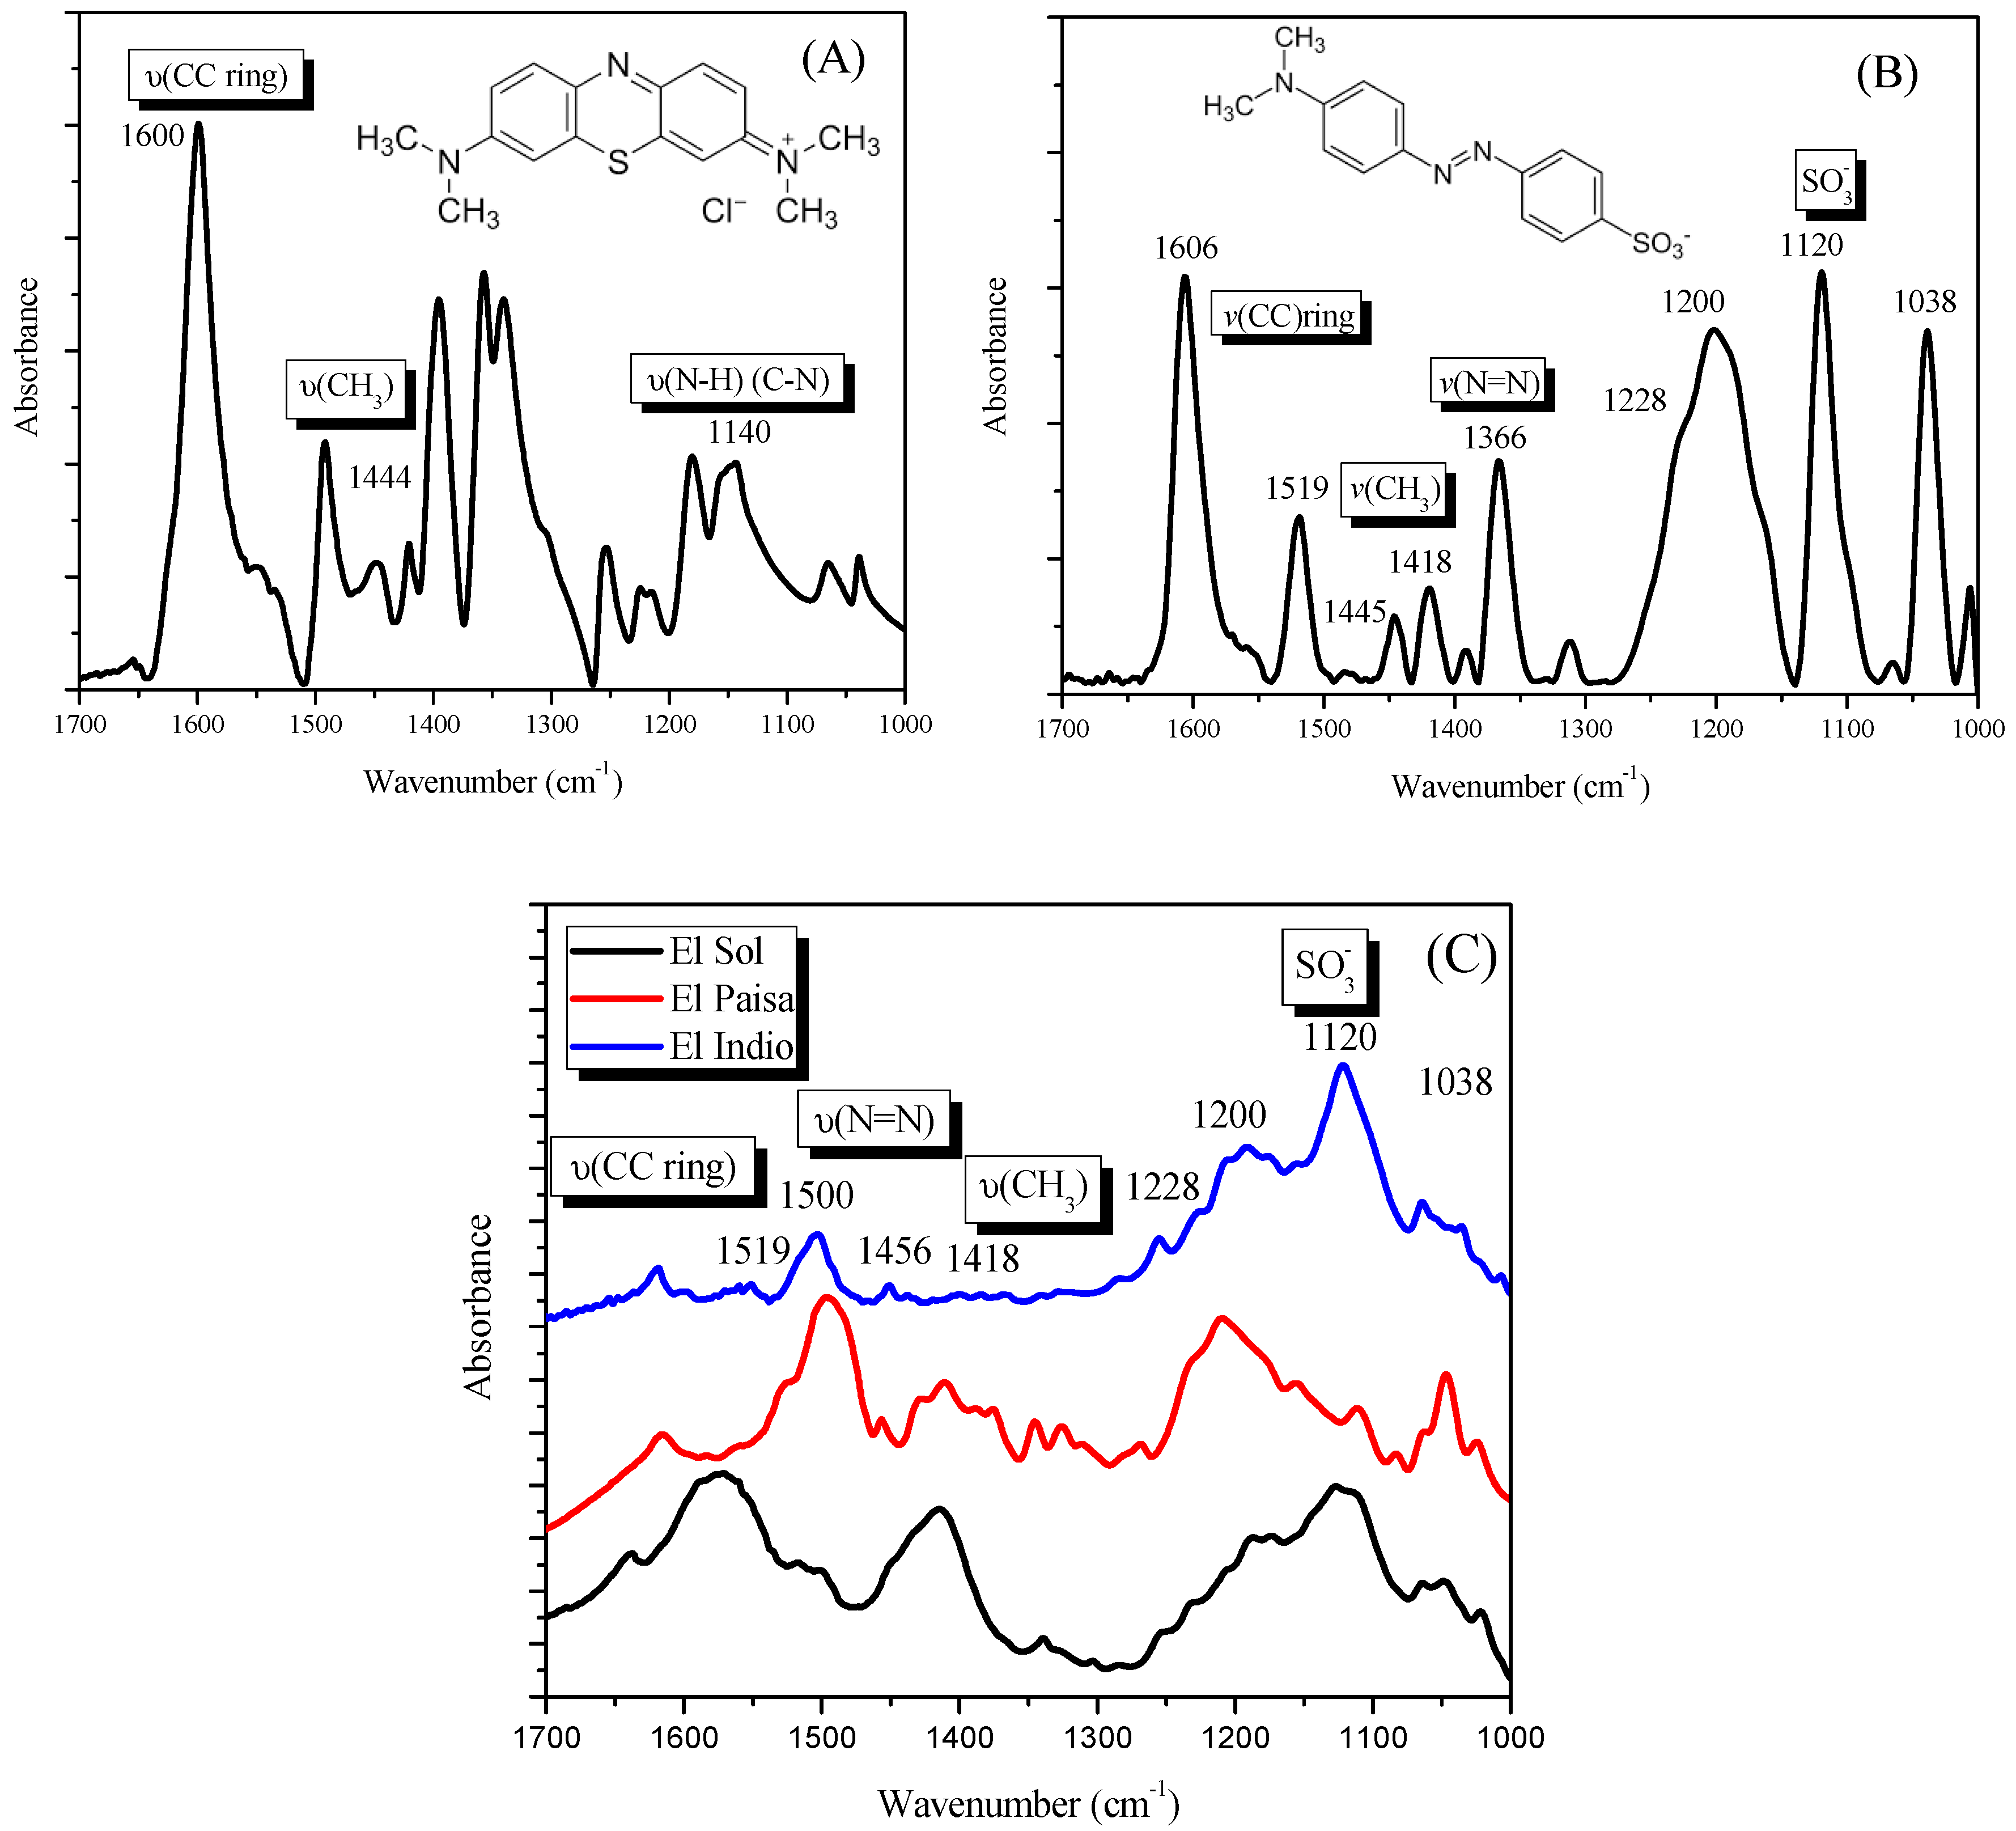
The FTIR spectra of the anilines are presented in Figure 8. In order to compare the structural characteristics of the commercial anilines, the spectra of MB and MO are also included in this figure.
Firstly, Figure 8A shows the MB spectrum where a band located at 1440 cm−1 corresponding to υCH3 vibrations is identified; the strong peak at 1140 cm−1 indicates the bending band of N-H and C-N from the amide III band functional group and the band located at ~1606 cm−1 is assigned to υCC vibrations in the aromatic rings [35,36].
Figure 8B represents the MO spectrum, where two bands located at ~1606 and 1519 cm−1 are assigned to υCC vibrations in the aromatic rings; the bands at 1444 and 1415 cm−1 corresponds to υCH3 vibrations and a band located at 1366 cm−1 is assigned to the azo group υN=N vibration. Bands assigned to sulfate groups from sulfonate species were also detected in the range between 1250 and 1000 cm−1 [36,37].
Figure 8C shows the spectra of the commercial anilines analyzed, and as it can be seen, these anilines present similar structure to MO; thus, in these spectra sulfonate groups bands (1250 to 1000 cm−1) were identified. Band located at 1418 cm−1 is assigned to υCH3 vibrations bands located between 1500 and1400 cm−1 are characteristic of the azo group with N=N stretching [38] and band at 1519 cm−1 corresponds to υCC vibrations in the aromatic rings [39].

2.3. Dyestuff Photocatalytic Degradation

2.3.1. MB Photodegradation

All the photocatalysts prepared and characterized were tested in the MB photodegradation reaction; Figure 9 represents the evolution of the dye concentration during the photooxidation reaction over the photocatalysts analyzed in a total reaction time of 120 min. As it can be seen, during photolysis experiments (carried out without catalyst) the MB degradation is negligible, thus indicating that the presence of a photocatalyst is necessary to induce the efficient dye removal from the liquid phase.
Figure 9A shows the MB concentration evolution by using the series of photocatalysts obtained by modification of lab prepared TiO2. As it can be observed in this figure, fluorination and platinization significantly increase the effectiveness of the bare TiO2 in the MB degradation. It can be explained taking into account that fluorination treatment leads to improve the physicochemical properties of bare Titania, thus in the F-TiO2 sample, it was observed that the SBET value is significantly higher than the obtained in the bare powder (Table 1). A higher surface area can contribute to better adsorption of the dye on the surface, thus leading to improve its photodegradation. Both fluorination and Pt addition modify the optical properties of TiO2, thus, a higher absorption in the visible region it was observed in these samples (Figure 2); it was also observed that the band gap value decreases after these treatments (Table 1). In the case of the fluorinated sample, the fluoride addition leads to the formation of an unbounded •OH that is more reactive than •OH trapped on catalyst surface [25,40]. All these factors can favor the photocatalytic activity of the fluorinated lab-prepared TiO2. It is also important to mention that Pt nanoparticles in the Pt-F-TiO2 catalyst act as a sink for the photogenerated electrons, thus reducing the electron-hole pair recombination rate, and therefore leading to more efficient photocatalysts in the dye degradation.
Figure 9B shows the results obtained in the MB degradation over the commercial Titania series of photocatalysts. As it can be seen, in this figure, fluorination or Pt addition did not modify significantly the photocatalytic activity of P25, as expected, taking into account that these treatments did not induce to any considerable modifications in the properties of this commercial powder, thus, DAnatase, band gap or SBET values of P25 remain almost constant after fluorination or platinization (Table 1), and just a slight increase in the absorption of the platinized P25 in the visible region was observed.
It is important to note that the highest photocatalytic activity was obtained in the P25 series of catalysts; thus, the 100% of MB degradation was achieved over the F-25 and F-Pt-P25 photocatalysts after 120 min of photoreaction time, thus indicating that fluorination and Pt addition slightly improve the commercial Titania photoactivity.
In order to have a better comprehension of the MB photodegradation mechanism, it is important to cite the work developed by Rtimi et al. [14]; these authors have explained that under light radiation the formation of an MB excited state takes place, thus leading to different processes such as: (i) formation of a short living unstable cation, which is further decomposed; (ii) injection of an electron to TiO2 which is transferred to the O2 on Titania surface, thus leading to the formation of oxidative radicals; (iii) the cation reacts with the O2 present in the reaction medium. Then the MB degradation is carried out by successive oxidation processes until the formation of CO2 by dye mineralization [15].

2.3.2. MO Photodegradation

The MO photodegradation as a function of reaction time is represented in Figure 10. As can be seen, photolysis of MO is also negligible. It can also be observed that the total degradation of MO is not achieved during the 120 min tests for any of the evaluated photocatalysts; in contrast to the total degradation of MB observed in Figure 9, indicating that MO is less sensitive to be degraded by photocatalysis that MB.
As it can be seen in Figure 10A, the photocatalytic activity of the lab prepared TiO2 highly increases after fluorination; however, the activity of the F-TiO2 material decreases after platinum addition. This could be due to the presence of platinum nanoparticles which can lead to the obstruction of the adsorption sites for MO on Titania surface. Similar results have previously reported by Murcia et al. [39]. These authors have reported that platinum nanoparticles can hinder the MO-photocatalyst interaction because the MO adsorption on Pt–TiO2 photocatalysts surface takes place preferentially through the interaction of the strongly electronegative azo group (N=N) with Ti4+ on TiO2 surface.
In the case of commercial TiO2 P25 series (Figure 10B), it appears that fluorination has a detrimental effect over Titania photoactivity. This behavior can be explained taking into account that, as it was observed by XPS analyzes, in this series of photocatalysts the concentration of fluorine on surface is lower than the one observed in the lab prepared materials (Table 1); so it is possible that the fluorine species on P25 surface are not enough to represent an improvement of P25 photoactivity. In addition, it is important to note that as it can be seen by FTIR analyzes, hydroxylation degree of P25 strongly decreases after fluorination (Figure 5). Hydroxylation is an important factor influencing the production of •OH radicals, which are responsible for organic dyes photooxidation, so high hydroxylation degree is desirable; and this can also be one of the reasons why fluorine addition has a negative impact over P25 photoactivity in the MO degradation.
On the contrary, as it can be seen in Figure 5, the effect of fluorination over hydroxylation surface is less remarkable in the lab prepared materials; but the elimination of Rutile phase, as determined by XRD analyzes (Figure 1), was the main change observed in this TiO2 induced by fluorination. Thus, it is also possible that the increasing of MO degradation over F-TiO2 can be related with the presence only of Anatase in this material, which has been considered the most active crystalline phase of TiO2 in photocatalytic processes.
On the other hand, the platinum addition slightly increases MO photodegradation, as it was observed after 100 min of reaction time over the Pt-F-P25 sample (Figure 10B). This behavior is clearly different from the one observed in the case of the lab prepared series (Figure 10A), where Pt had a negative impact over the TiO2 photoefficiency along all photoreaction time. This can be explained taking into account that the platinum particles size observed in the Pt-F-P25 sample is higher than the observed in Pt-F-TiO2 material (Figure 3); thus Pt particles of high size represent lower obstruction on TiO2 surface leading to a better MO adsorption.
From these results, it is possible to prove that, as it has been extensively reported, the effectiveness of photocatalysis in the dyestuff treatment depends on the substrate to be degraded. In addition, in the present work, it has been observed that the degradation of MB or MO depends on the dye adsorption over the photocatalyst surface.
The mechanism of azo dyes mediated by TiO2 under light irradiation in the presence of O2 as oxidant takes place by production of a singlet excited state as reported by Zhiyong et al. [16], then, an electron is injected from the excited state of the adsorbed Methyl Orange in the conduction band of TiO2 leading to the Methyl Orange cation formation, which subsequently decays and the electron in the conduction band is scavenged by the O2 adsorbed on the TiO2 surface generating the superoxide radical.
The azoic bond (–N=N–) is the most active in the MO molecule, it can be oxidized by •OH radicals or be reduced by electrons on the conduction band, then the breaking of the –N=N– group leads to the discoloration of dyestuffs. In addition, the azoic dye degradation can lead to the formation of intermediaries compounds such as aromatic amines, phenolic compounds and short-chain organic acids, the production of these acids is due to the opening of the aromatic ring in the dye molecule, these compounds are exposed to successive oxidations and finally conduct to the CO2 and water formation [17].

2.3.3. Photodegradation of Commercial Anilines

As it was found by characterization results previously presented in Section 2.2, commercial anilines have a similar structure to MO, so, taking into account that the highest efficiency in the photodegradation of this dye was observed by using the P25 series of photocatalysts (P25, F-P25 and Pt-F-P25), these materials were selected to test them in the photodegradation of lab prepared solutions of three of the most used commercial anilines in the handicrafts elaboration: “El sol” (S), “El paisa” (P) and “El indio” (I).
By UV-Vis spectrophotometry, it was observed that the highest absorption bands for these anilines solutions are located at the wavelengths of 500, 542 and 474 nm for I, P and S, respectively. The anilines concentration was evaluated by using these bands as references. Selected UV-Vis spectra obtained during 120 min of the S dye degradation over the F-P25 photocatalyst are presented in Figure 11; for the sake of brevity the UV-Vis spectra obtained for others commercial anilines are not included but, a similar tendency was observed for all of them. As it can be observed, the absorption bands intensity decreases as the photoreaction time increases, thus indicating the breaking of the dye chromophore group. It is important to note that the absence of new signals in the spectra suggests the total degradation of the dye being treated. It is also important to mention that the photolysis of the commercial dyestuffs is negligible during the experiments performed without photocatalyst.
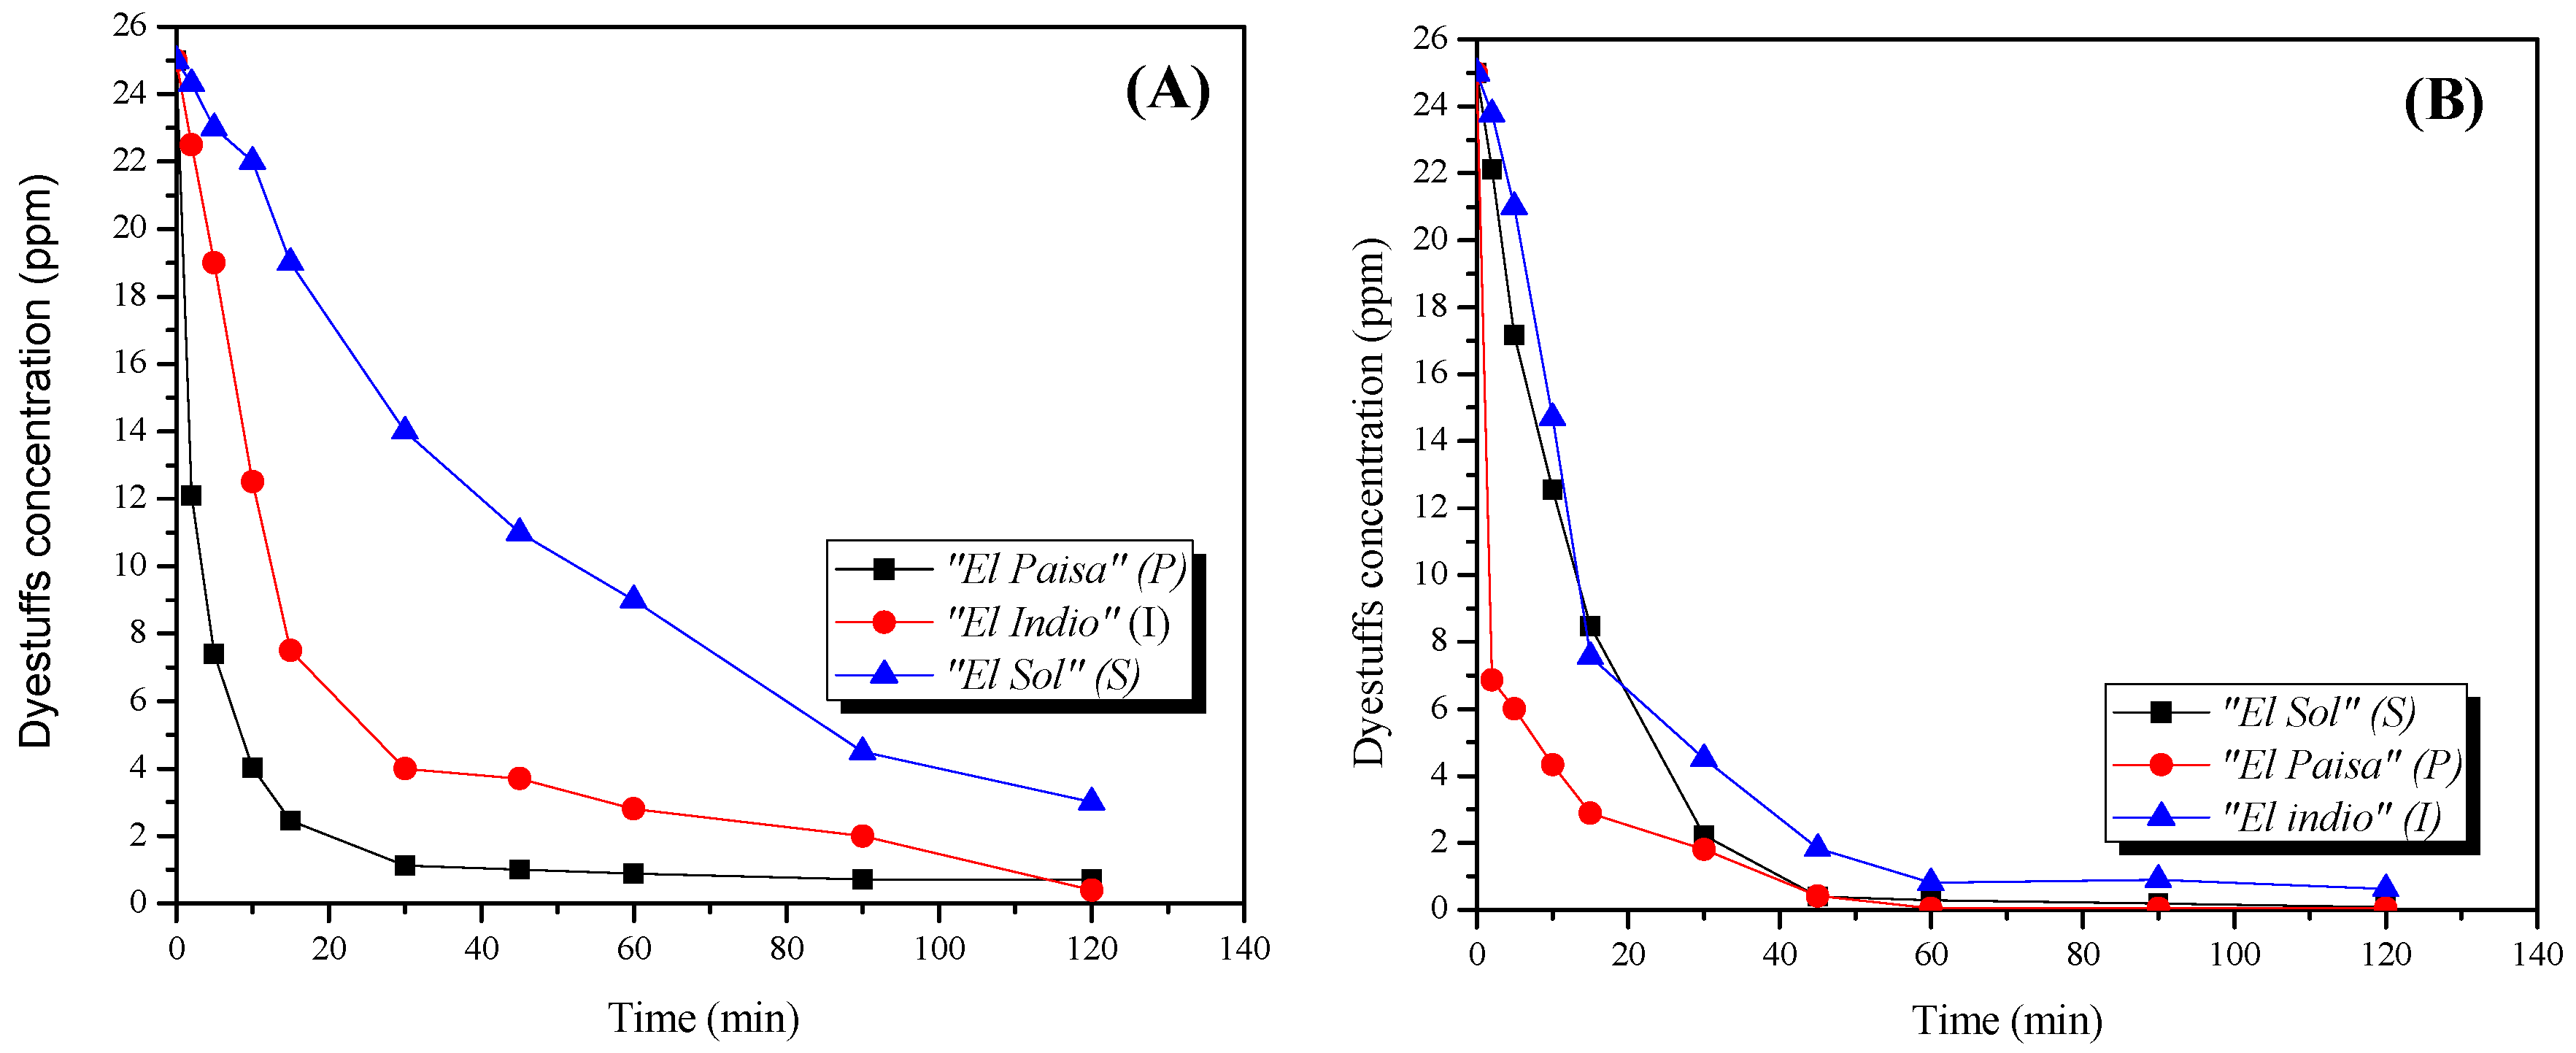
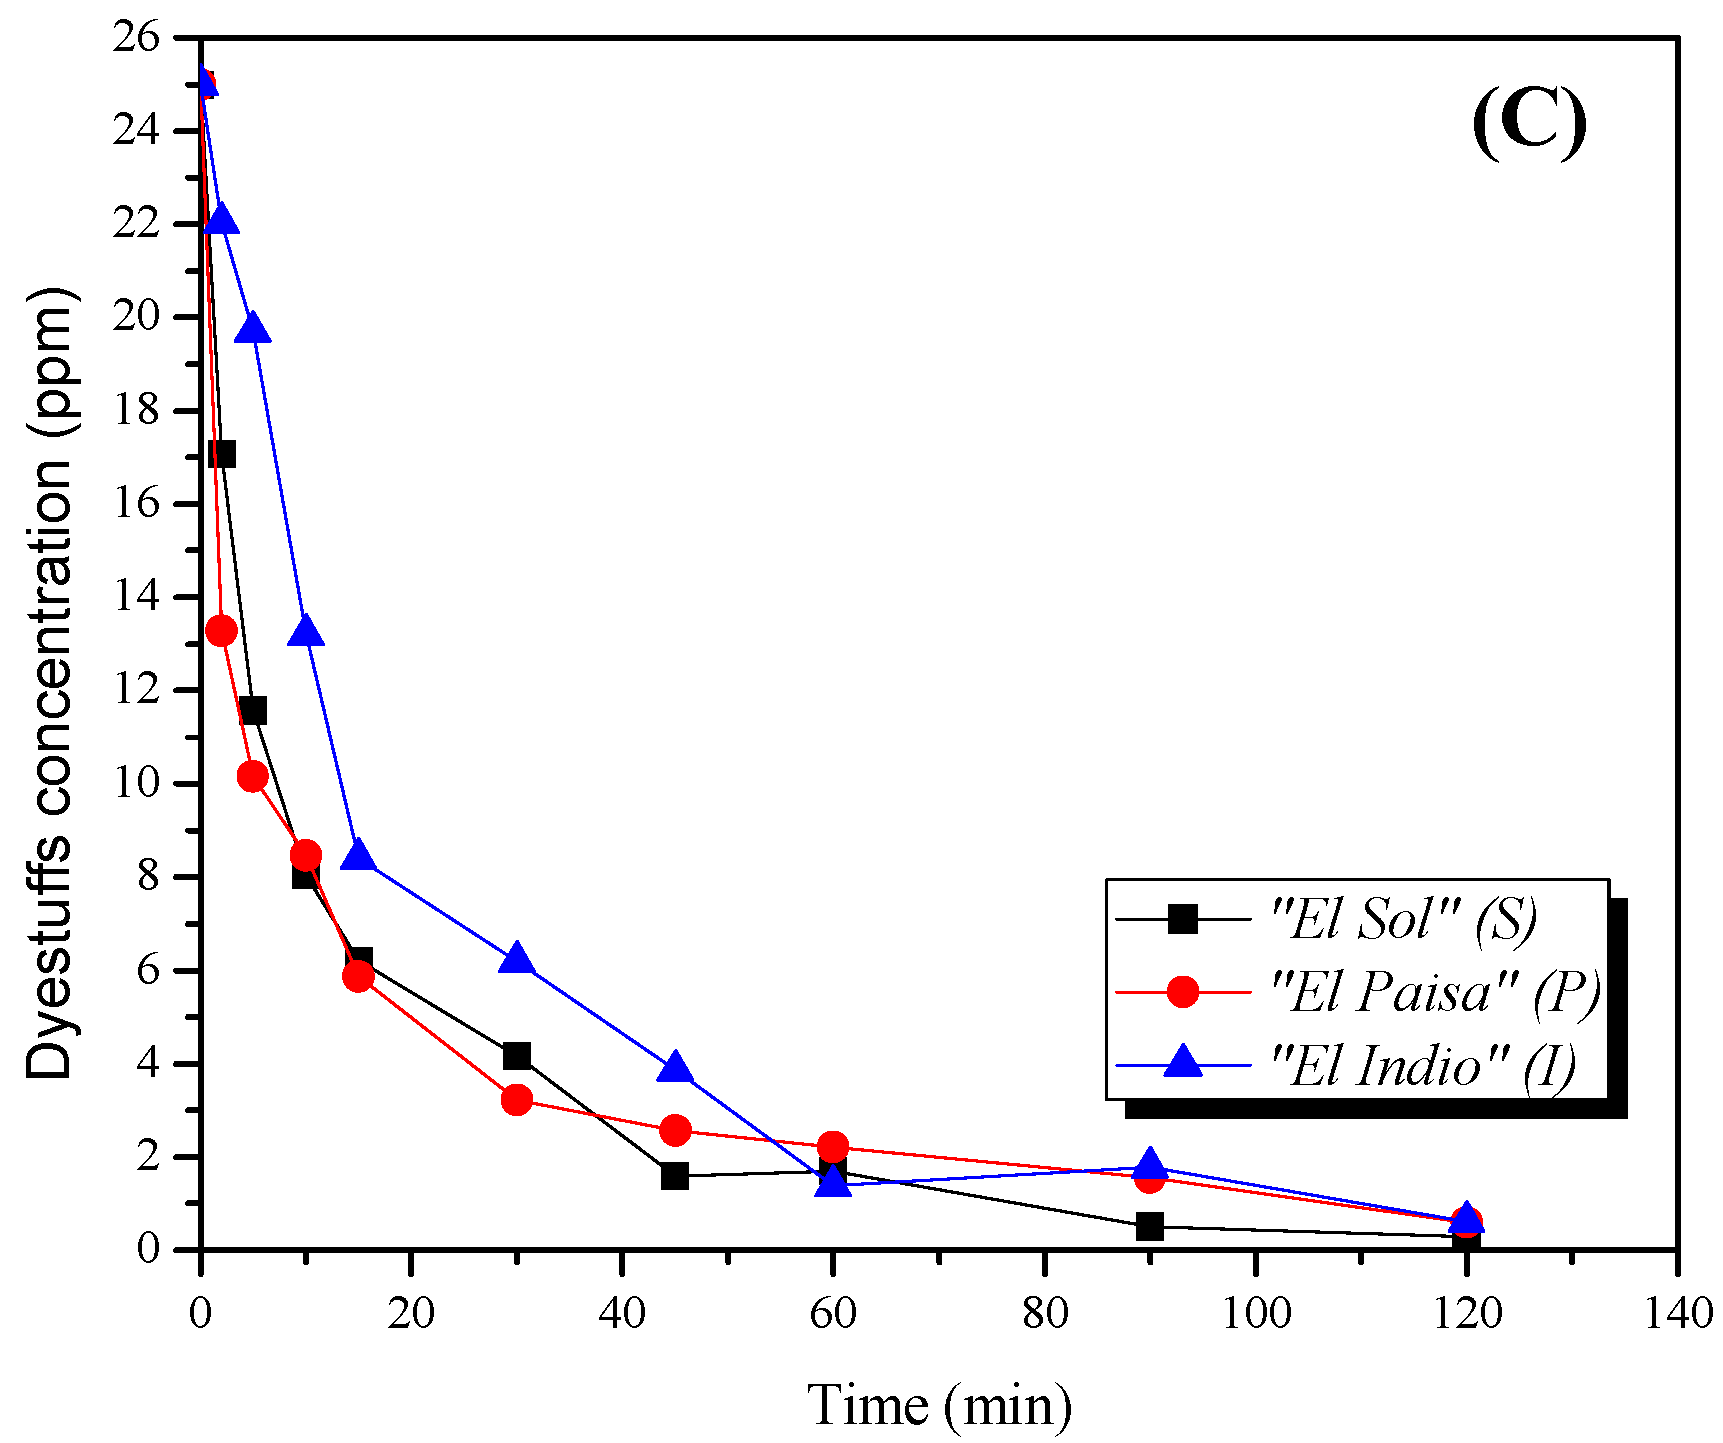
Figure 12 shows the evolution of the commercial anilines concentration during the photodegradation reactions over the photocatalysts analyzed. As it can be observed, the anilines concentration decreases with the reaction time overall catalysts evaluated, and for these anilines photolysis is negligible. It was also found that the highest anilines degradation was obtained by using F-P25 as a photocatalyst, and the degradation efficiency slightly decreases after platinization. The results observed after platinization are in good agreement with the behavior obtained in the MO photodegradation, as expected, by the similarity of the anilines and MO structure. Therefore, it is possible to conclude that in fact, platinum nanoparticles hinder the adsorption of these azo dyestuffs on TiO2 surface.
In Figure 12 it is also possible to observe that there are some differences in the photodegradation efficiency between the anilines analyzed; thus, the aniline labeled as “P” was the most sensitive to be degraded by photocatalysis over F-P25. This could be explained in terms of the dyestuffs molecules adsorption over the photocatalyst surface.
In order to study the adsorption of the dyestuffs over the photocatalysts analyzed, dark adsorption experiments were carried out and the results obtained are summarized in Table 2.
As it can be observed in this table, the concentration of the dyestuffs analyzed decreases during the dark stirring, thus indicating that the dyes adsorption on the photocatalysts surface is the first step in the degradation of these substrates. The most noticeable concentration decreasing was observed after adsorption of the commercial dyestuff labeled as “P” on the F-P25 sample (i.e., from 25 to 6.86 ppm), this outcome is in agreement with the photocatalytic activity results; as the highest degradation rate was also observed for dyestuff “P” by using the F-P25 as photocatalyst. From these results is possible to conclude that in fact, the dyestuffs absorption on fluorinated or platinized Titania is an important factor influencing the effectiveness of these materials in the treatment of colored liquid samples.

2.3.4. Dyestuffs Removal from Handicrafts Wastewater

From the results obtained until now in the present work, it is now interesting to study the behavior of the photocatalysts analyzed in the treatment of real effluents coming from the industrial production of handicrafts. The survey performed lead us to determine that a 60% of the handicraftsmen surveyed expressed that the coloring wastewater coming from their factories is directly discharged into the drain without previous treatment (Figure 13), in most of the cases this wastewater reaches the rivers nearby the factories. For that reason, currently, it represents a serious environmental problem in the Colombian regions where the main handicrafts factories are located.
The treatment of real samples coming from handicraft industries represents an important challenge in photocatalysis; it is because these matrixes of samples are very complex in different ways: these are composed by different pollutants, which must be removed from the water sources; besides, these samples contain different pollutant concentration, as it depends on the production volumes of the industries. Therefore, in order to know the composition of the wastewater samples employed in the present study, a preliminary physicochemical and microbiological analysis was carried out and the results obtained are summarized in Table 3. As can be seen in this table, besides of organic and inorganic pollutants the wastewater under analysis also presents a high content of microorganisms mainly represented by Total coliforms species. In addition, by simple observation, it is evident that the wastewater samples are highly colored.
The samples of wastewater were taken from handicrafts factories and in order to ensure the reproducibility of the results obtained in this work, different samples were evaluated and the photocatalytic reactions were carried out twice. According to the statistic parameters, the average of the results obtained after 5 h of photocatalytic treatment are summarized in Table 3. As can be seen in this table, there are no significant changes in the pH values or chloride content in the wastewaters samples after treatment. It was also found that alkalinity values in the wastewater samples are mainly represented by CaCO3 and HCO3 species, the alkalinity values decrease after the photocatalytic process, probably due to the adsorption of these ions on the photocatalysts surface during treatment.
It was also found that the photocatalytic treatment leads to achieve an important microbial removal, thus, F-P25 material shows the best performance in the bacteria elimination.
On the other hand, with the objective of analyzing the color photodegradation a UV-Vis spectroscopic analysis of the wastewater samples before and after treatment was also carried out, and Figure 14 shows the UV-Vis spectra obtained by using P25 as a photocatalyst (the spectra obtained with other photocatalysts analyzed are not included for sake of brevity). Monitoring the UV band located at 550 nm, it was possible to determine that by using P25 as a photocatalyst a 27% (Figure 14a) of dyestuffs removal was achieved after 5 h of photocatalytic treatment, this value slightly increases by using F-P25 and Pt-F-P25, however, it was not possible to achieve the total color elimination in the wastewater samples in any case.
As it was observed in the commercial dyestuffs degradation tests, the concentration of the dyestuffs analyzed decreases during the dark stirring; thus indicating the dyes adsorption on the photocatalysts. So, it is expected that during the photocatalytic treatment of the real industrial wastewater samples the absorption of colored and organic compounds takes place, it was probed in the dark adsorption tests performed, however, under illumination and in the presence of a photocatalyst the intensity of the UV bands decreases, thus indicating that the presence of a photocatalyst is necessary to improve the dyestuffs photodegradation.
The dyestuffs removal in the wastewater samples by photocatalysis is much lower than the observed in the lab prepared anilines solutions. This can be explained taking into account that the wastewater samples are composed of different pollutants and more than a single dye. All the pollutants present in the wastewater samples can compete for the •OH radical species, thus slowing down the effectiveness of the photocatalytic treatment. In spite of it, in the present work, it was possible to demonstrate that photocatalysis is a non-selective technology, which can be used in the treatment of complex matrixes of samples, leading to remove different kinds of pollutants from the same sample.
Different studies have reported the photocatalytic treatment of lab prepared dyestuff solutions and textile industrial effluents, according to scientific literature the effectiveness of this treatment depends on the photocatalytic material employed in the process, thus, for example, Liu et al. [8] have found a maximum Acid Yellow 17 removal ratio of 70.6% at pH 3 during the 375 min of reaction time; on the other hand, Škoric´ et al. [9] have studied TiO2 nanoparticles immobilized in chitosan-based microparticles for photodegradation of textile dyes, in this study it was found a removal ratio of 75 and 95% for lab prepared solutions of Reactive Yellow 17 and Acid Orange 7, respectively. Just a few studies have included as target substrate real industrial wastewater, in these reports, it is possible to find that almost 70% of color in the wastewater was removed when the catalyst concentration was 200 mg/L [13]. Hussein et al. [12] have achieved 50% of decolorization in textile wastewater by using 175 mg of Anatase TiO2.
As the reader can see, organic decomposition and water purification by using photocatalysis based on TiO2 materials have been extensively reported in scientific literature, in these reports a wide variety of TiO2 based materials have evaluated, so, it is hard to establish a conscious comparison between the color removal ratio obtained with different photocatalytic materials. In addition, as far as we know, no article reports the use of Pt-F-TiO2 materials in the photocatalytic degradation of commercial anilines such those analyzed in the present work, neither in the treatment of industrial effluents coming from handicraft factories. So, one of the major contributions of the present work is to understand the factors influencing the photocatalytic activity of platinized and fluorinated Titania in the treatment of colored industrial effluents coming from Colombian handicrafts factories; it will be useful for further studies focused on increasing the performance of the photocatalytic materials under study for the practical use of them in real environmental remediation processes. On the other hand, the information obtained from the survey applied to the handicraftsmen allowed us to understand the real impact of the environmental problem addressed in the present manuscript.

3. Materials and Methods

3.1. Synthesis of the Photocatalysts

The photocatalysts preparation was carried out by following the method previously reported by Murcia et al. [21]. Briefly, lab prepared TiO2 was obtained by hydrolysis of titanium tetraisopropoxide in isopropanol solution by the slow addition of distilled water (isopropanol/water 1:1). After hydrolysis, the powder was filtered and dried at 110 °C for 12 h. A fraction of this material was calcined at 650 °C for 2 h (4 °C/min). Their counterpart commercial TiO2 Evonik P25 (P25) was used as received.
Fluorinated Titania was prepared by adding 10 mM NaF to an aqueous suspension of uncalcined bare TiO2 or P25 (2 g/L); these materials were named F–TiO2 and F–P25, respectively. In order to favor the fluorine adsorption pH was adjusted to 3 by using a 1 M HCl solution. This suspension was stirred for 1 h in the dark and then filtered and calcined at 650 °C for 2 h (4 °C /min).
Platinum was deposited on the surface of the fluorinated Titania by photodeposition method, hexachloroplatinic acid (H2PtCl6, Aldrich 99.9%) was used as the metal precursor. The nominal content of Pt in the photocatalysts was selected to be 0.5 wt.%, due to the commercial value of this metal, a low content is preferable when it is used in photocatalytic processes. A suspension of the corresponding F–TiO2 or F–P25 sample in distilled water containing isopropanol (Merck 99.8%) and the metal precursor was prepared. Pt photodeposition was then performed under N2 atmosphere, by illuminating at 60 W/m2 the suspension for 120 min, as a solar light-simulating source was employed an Osram Ultra-Vitalux lamp (300 W) which possesses a sun-like radiation spectrum with a main emission line in the UVA range at 365 nm. After Pt photodeposition, the photocatalysts were recovered by filtration and dried at 110 °C for 12 h.

3.2. Photocatalysts Characterization

The photocatalysts synthesized were extensively characterized by using a number of instrumental techniques. These analyses led to obtaining a complete morphological and structural study and a summary of the techniques and the equipment employed is presented as follows.
Surface area (SBET) determination by using the Brunauer–Emmett–Teller method was carried out by low-temperature N2 physisorption (77 K). A Micromeritics ASAP 2010 instrument was employed (USA).
Crystalline phases present in the photocatalytic materials and the Anatase crystallite size were evaluated by X-ray diffraction. The main diffraction peaks were employed for the size determination by using the Scherrer equation. In this step, a Siemens D-501 diffractometer (Holland) with Ni filter and graphite monochromator using Cu Kα radiation was used.
All the photocatalysts were analyzed by UV–Vis Diffuse Reflectance spectrophotometry, for these analyses, a Varian Cary 100 UV–Vis spectrophotometer was employed (USA). BaSO4 was used as a reference. Band gap values were estimated from the Kubelka–Munk functions (F(∞)), which are proportional to the absorption of radiation, by plotting (F(∞) × hυ)1/2 against hυ [41].
The chemical composition of the photocatalysts was determined by X-ray Fluorescence Spectrometry (XRF) by using a Panalytical Axios sequential spectrometer (United Kingdom); this analyzer was equipped with a rhodium tube as the source of radiation. XRF measurements were carried out onto pressed pellets, the sample was included in 10 wt.% of wax.
Platinum particle sizes and morphology were studied by Transmission Electron Microscopy (TEM) by using a Philips CM200 microscopy (Amsterdam, The Netherlands). Photocatalysts to be analyzed were dispersed in ethanol using an ultrasonicator and dropped on a carbon grid. Evaluation of the platinum particle average size was attempted by counting Pt particles in a high number of TEM micrographs from different places of the samples.
X-ray Photoelectron Spectroscopy (XPS) analysis was also carried out in a Leybold–Heraeus LHS-10 equipment (Cologne, Germany), working with a constant pass energy of 50 eV. This equipment included the main chamber, working at a pressure <2 × 10⁻⁹ Torr, an EA-200 MCD hemispherical electron analyzer with a dual X-ray source working with Al Kα (hυ = 1486.6 eV) at 120 W and 30 mA was also employed. C 1s signal (284.6 eV) was used as an internal energy reference in all analyses. Samples were outgassed at 150 °C up to a pressure <2 × 10⁻⁸ Torr to remove chemisorbed water.
Fourier Transform Infrared Spectroscopy (FTIR) analyses were carried out by using a Thermo Scientific Nicolet iS50 spectrometer (USA), for that analyzes the photocatalysts were placed in an ATR cell and the spectra were recorded at a wavenumber between 4000 and 1000 cm−1 with a resolution of 2 cm−1.

3.3. Commercial Dyestuffs Characterization

To determine the main dyestuffs used in traditional handicraft factories, a survey involving 50 handicraftsmen from factories located in Boyacá, Colombia, South America was performed. They were asked about the dyestuffs usually applied in handicrafts production and also about the final disposition of the wastewater coming from their factories.
In order to know the structure and composition of these commercial dyestuffs, a complete analysis of them was carried out by using XRF, XRD and FTIR as characterization techniques.

3.4. Photocatalytic Tests

The photocatalytic tests for the dyestuff degradation were carried out in a batch Pyrex reactor containing 250 mL of the colored sample to be degraded and 1 g/L of photocatalyst loading. This reaction system was illuminated through a UV-transparent Plexiglas® top window (threshold absorption at 250 nm), an Osram Ultra-Vitalux lamp (300 W) was employed as the light source with a sun-like emission spectrum. The intensity of the incident light (UV-Visible) on the dyestuff solution was measured with a Delta OHM photoradiometer HD2102.2 (Italy), being ca. 120 W/m2.
To favor the adsorption-desorption equilibrium and also to study the adsorption properties of the dyestuffs on the photocatalysts surface, prior to irradiation the suspension was maintained under continuous stirring in dark for 10 min. After this time of stirring, the dyestuff concentration in suspension was calculated.
To produce a homogeneous mix of the photocatalyst in the liquid phase magnetic stirring and an oxygen flow of 0.84 L/h were used. A bubbler tank was employed as the oxygen source. The total reaction time for each photocatalytic test was 120 min.
For the evaluation of the dyestuff discoloration, the concentration of the substrates during the photocatalytic tests was analyzed by UV–Vis spectrophotometry, by using a Thermo Scientific Evolution 300 equipment (Madison, WI, USA).
Selected photoreactions were carried out twice, finding an error percentage of 1%.
In the present study, the photocatalytic degradation of three different colored samples was evaluated and the main characteristics of them are described as follows:
Conventional lab dyestuffs: All the photocatalysts synthesized were tested in the methylene blue (MB) and methyl orange (MO) photodegradation. For this stage of the work, starting solutions of 25 ppm of each dyestuff were prepared.
Commercial dyestuffs: The photocatalysts showing best performances in MO degradation were selected for testing them in the degradation of individual solutions of 25 ppm of the commercial dyestuffs most commonly used in Colombian handicrafts factories.
Industrial wastewater samples: Samples of stained wastewater collected from handicrafts factories were also used as a substrate to be degraded by photocatalysis, the total reaction time for these samples was 5 h.
Wastewater Sampling and Analyzes: Wastewater samples were taken at the exit of the staining tanks in the handicrafts industries selected for this study; a complete physicochemical analysis of these samples was carried out before and after photocatalytic treatment, the microbiological population was also analyzed in the wastewater samples. Physicochemical analyzes have included pH, alkalinity and chloride content measurements. pH was measured by using an SI analytics Lab 850 pH-meter; the alkalinity and chloride content was calculated by using the 2320 B-1995 APHA and 4500 Cl-B-1995 APHA methods, respectively [42]; all the physicochemical analyses were carried out by double testing.
On the other hand, to determine the microbial population in the wastewater samples and the effectiveness of the photocatalytic treatment in the Total coliforms elimination; all the samples were analyzed before and after the photoreaction tests. For these assays, the membrane filtration method Merck (method 9222) [42] was used. Coliforms Chromocult® agar was employed as the culture medium. The total coliforms concentration in the samples analyzed is reported in this work as CFU (Colony Forming Units)/100 mL of wastewater sample.

4. Conclusions

Fluorination and Pt addition are employed to improve the physicochemical and photocatalytic properties of sol-gel lab prepared and commercial Titania. It was observed that these modifications induce absorption in the visible region, lead to obtain lower band gap values and modify the specific surface areas; these modifications are more evident in the lab prepared TiO2 than in commercial one.
The effectiveness of the photocatalysts prepared was evaluated in the treatment of different commercial dyestuffs and wastewater coming from industrial handicraft production. It was observed the structure of the dyestuff to be degraded is an important factor to take into account for the selection of a suitable photocatalyst, because the structure and composition of the dye molecule depend on its adsorption on the photocatalyst surface and therefore the effectiveness in the dyes removal by photocatalysis.
It was found that Fluorine and Pt addition are suitable methods to enhance the photocatalytic activity of both commercial P25 and lab-prepared TiO2 in the methylene blue degradation. On the contrary, in the case of Methyl orange photodegradation the effectiveness of fluorinated and/or platinized TiO2 depends on the starting TiO2 (commercial or lab prepared). In general is more effective the commercial one modified by F and Pt addition. Platinum nanoparticles can hinder the dye adsorption on TiO2 surface, so a high (>10 nm) metal particle size is preferable to improve the TiO2 activity in azo dyes degradation.
Commercial anilines usually employed in handicrafts factories present a similar structure to methyl orange, so, the behavior observed in the degradation of these pollutants is similar to that observed in the orange dye.
Commercial TiO2 fluorinated was the most effective material in the treatment of wastewaters coming from handicrafts factories, showing a good performance not only in the dyestuffs removal but as well in the bacteria population reduction after 5h of photocatalytic treatment. So, it is possible to say that fluorinated Titania can be used for the treatment of stained industrial effluents containing dyes and microorganisms.

Author Contributions

Conceptualization, Methodology, Supervision and Funding acquisition J.J.M.; investigation Á.C.C.; Project administration H.A.R.; writing—original draft preparation M.C.H. and writing—original draft preparation J.A.N.

Funding

This work was funded by Fondo Nacional de Financiamiento para la Ciencia, la Tecnología y la Innovación “Francisco José de Caldas”, COLCIENCIAS and Universidad Pedagógica y Tecnológica de Colombia.

Conflicts of Interest

The authors declare no conflict of interest.

References

  1. Robinson, T.; McMullan, G.; Marchant, R.; Nigam, P. Remediation of dyes in textile effluent: A critical review on current treatment technologies with a proposed alternative. Bioresour. Technol. 2001, 77, 247–255. [Google Scholar] [CrossRef]
  2. Ajmal, A.; Majeed, I.; Malik, R.N.; Iqbal, M.; Nadeem, M.A.; Hussain, I.; Yousaf, S.; Zeshan; Mustafa, G.; Zafar, M.I.; et al. Photocatalytic degradation of textile dyes on Cu2O-CuO/TiO2 anatase powders. J. Environ. Chem. Eng. 2016, 4, 2138–2146. [Google Scholar] [CrossRef]
  3. Charanpahari, A.; Umare, S.S.; Sasikala, R. Enhanced photodegradation of dyes on Bi2O3 microflakes: Effect of GeO2 addition on photocatalytic activity. Sep. Purif. Technol. 2014, 133, 438–442. [Google Scholar] [CrossRef]
  4. Devi, L.G.; Nithya, P.M.; Abraham, C.; Kavitha, R. Influence of surface metallic silver deposit and surface fluorination on the photocatalytic activity of rutile TiO2 for the degradation of crystal violet a cationic dye under UV light irradiation. Mater. Today Commun. 2017, 10, 1–13. [Google Scholar] [CrossRef]
  5. Gadhi, T.A.; Hernández-Gordillo, A.; Bizarro, M.; Jagdale, P.; Tagliaferro, A.; Rodil, S.E. Efficient α/β-Bi2O3 composite for the sequential photodegradation of two-dyes mixture. Ceram. Int. 2016, 42, 13065–13073. [Google Scholar] [CrossRef]
  6. Gómez-Solís, C.; Juárez-Ramírez, I.; Moctezuma, E.; Torres-Martínez, L.M. Photodegradation of indigo carmine and methylene blue dyes in aqueous solution by SiC–TiO2 catalysts prepared by sol–gel. J. Hazard. Mater. 2012, 217–218, 194–199. [Google Scholar]
  7. Guillard, C.; Lachheb, H.; Houas, A.; Ksibi, M.; Elaloui, E.; Herrmann, J.-M. Influence of chemical structure of dyes, of pH and of inorganic salts on their photocatalytic degradation by TiO2 comparison of the efficiency of powder and supported TiO2. J. Photochem. Photobiol. A 2003, 158, 27–36. [Google Scholar] [CrossRef]
  8. Liu, C.-C.; Hsieh, Y.-H.; Lai, P.-F.; Li, C.-H.; Kao, C.-L. Photodegradation treatment of azo dye wastewater by UV/TiO2 process. Dyes Pigment. 2006, 68, 191–195. [Google Scholar] [CrossRef]
  9. Lučić Škorić, M.; Terzić, I.; Milosavljević, N.; Radetić, M.; Šaponjić, Z.; Radoičić, M.; Kalagasidis Krušić, M. Chitosan-based microparticles for immobilization of TiO2 nanoparticles and their application for photodegradation of textile dyes. Eur. Polym. J. 2016, 82, 57–70. [Google Scholar] [CrossRef]
  10. Šíma, J.; Hasal, P. Photocatalytic Degradation of Textile Dyes in a TiO2/UV. Chem. Eng. Trans. 2013, 32, 79–84. [Google Scholar]
  11. Vaiano, V.; Iervolino, G.; Sannino, D.; Murcia, J.J.; Hidalgo, M.C.; Ciambelli, P.; Navío, J.A. Photocatalytic removal of patent blue V dye on Au-TiO2 and Pt-TiO2 catalysts. Appl. Catal. B 2016, 188, 134–146. [Google Scholar] [CrossRef]
  12. Hussein, F.; Abass, T. Photocatalytic treatment of textile industrial wastewater. Int. J. Chem. Sci. 2010, 8, 1353–1364. [Google Scholar]
  13. Zhang, T.; Wang, X.; Zhang, X. Recent Progress in TiO2-Mediated Solar Photocatalysis for Industrial Wastewater Treatment. Int. J. Photoenergy 2014, 2014, 607954. [Google Scholar] [CrossRef]
  14. Rtimi, S.; Pulgarin, C.; Sanjines, R.; Kiwi, J. Kinetics and mechanism for transparent polyethylene-TiO2 films mediated self-cleaning leading to MB dye discoloration under sunlight irradiation. Appl. Catal. B 2015, 162, 236–244. [Google Scholar] [CrossRef]
  15. Mills, A.; Wang, J. Photobleaching of methylene blue sensitised by TiO2: An ambiguous system? J. Photochem. Photobiol. A 1999, 127, 123–134. [Google Scholar] [CrossRef]
  16. Zhiyong, Y.; Keppner, H.; Laub, D.; Mielczarski, E.; Mielczarski, J.; Kiwi-Minsker, L.; Renken, A.; Kiwi, J. Photocatalytic discoloration of Methyl Orange on innovative parylene–TiO2 flexible thin films under simulated sunlight. Appl. Catal. B. 2008, 79, 63–71. [Google Scholar] [CrossRef]
  17. He, Y.; Grieser, F.; Ashokkumar, M. The mechanism of sonophotocatalytic degradation of methyl orange and its products in aqueous solutions. Ultrason. Sonochem. 2011, 18, 974–980. [Google Scholar] [CrossRef]
  18. Murcia, J.J.; Guarín, J.R.; Cely Macías, A.C.; Rojas, H.; Cubillos, J.A.; Hidalgo, M.C.; Navío, J.A. Methylene blue degradation over M-TiO2 photocatalysts (M = Au or Pt). Ciencia en Desarrollo 2017, 8, 109–117. [Google Scholar] [CrossRef]
  19. Ananpattarachai, J.; Seraphin, S.; Kajitvichyanukul, P. Formation of hydroxyl radicals and kinetic study of 2-chlorophenol photocatalytic oxidation using C-doped TiO2, N-doped TiO2, and C,N Co-doped TiO2 under visible light. Environ. Sci. Pollut. Res. 2016, 23, 3884–3896. [Google Scholar] [CrossRef]
  20. Liu, Y.; Chen, X.; Li, J.; Burda, C. Photocatalytic degradation of azo dyes by nitrogen-doped TiO2 nanocatalysts. Chemosphere 2005, 61, 11–18. [Google Scholar] [CrossRef]
  21. Murcia, J.J.; Hidalgo, M.C.; Navío, J.A.; Araña, J.; Doña-Rodríguez, J.M. Study of the phenol photocatalytic degradation over TiO2 modified by sulfation, fluorination, and platinum nanoparticles photodeposition. Appl. Catal. B 2015, 179, 305–312. [Google Scholar] [CrossRef]
  22. Trapalis, C.; Todorova, N.; Giannakopoulou, T.; Romanos, G.; Vaimakis, T.; Yu, J. Preparation of fluorine-doped TiO2 photocatalysts with controlled crystalline structure. Int. J. Photoenergy 2008, 2008, 534038. [Google Scholar]
  23. Yu, J.; Xiang, Q.; Ran, J.; Mann, S. One-step hydrothermal fabrication and photocatalytic activity of surface-fluorinated TiO2 hollow microspheres and tabular anatase single micro-crystals with high-energy facets. CrystEngComm 2010, 12, 872–879. [Google Scholar] [CrossRef]
  24. Vohra, M.S.; Kim, S.; Choi, W. Effects of surface fluorination of TiO2 on the photocatalytic degradation of tetramethylammonium. J. Photochem. Photobiol. 2003, 160, 55–60. [Google Scholar] [CrossRef]
  25. Yu, J.; Wang, W.; Cheng, B.; Su, B.-L. Enhancement of Photocatalytic Activity of Mesporous TiO2 Powders by Hydrothermal Surface Fluorination Treatment. J. Phys. Chem. C 2009, 113, 6743–6750. [Google Scholar] [CrossRef]
  26. Iervolino, G.; Vaiano, V.; Murcia, J.J.; Rizzo, L.; Ventre, G.; Pepe, G.; Campiglia, P.; Hidalgo, M.C.; Navío, J.A.; Sannino, D. Photocatalytic hydrogen production from degradation of glucose over fluorinated and platinized TiO2 catalysts. J. Catal. 2016, 339, 47–56. [Google Scholar] [CrossRef]
  27. Torrents, A.; Stone, A.T.; Torrents, A. Catalysis of Picolinate Ester Hydrolysis at the Oxide/Water Interface: Inhibition by Adsorbed Natural Organic Matter. Environ. Sci. Technol. 1993, 27, 2381–2386. [Google Scholar] [CrossRef]
  28. Yamabi, S.; Imai, H. Crystal Phase Control for Titanium Dioxide Films by Direct Deposition in Aqueous Solutions. Chem. Mater. 2002, 14, 609–614. [Google Scholar] [CrossRef]
  29. Yanga, G.; Jiang, Z.; Shib, H.; Jones, M.O.; Xiao, T.; Edwards, P.P.; Yan, Z. Study on the photocatalysis of F–S co-doped TiO2 prepared using solvothermal method. Appl. Catal. B 2010, 96, 458–465. [Google Scholar] [CrossRef]
  30. Liu, B.; Jin, C.; Ju, Y.; Peng, L.; Tiana, L.; Wang, J.; Zhang, T. Crystal growth and design of a facile synthesized uniform single crystalline football-like anatase TiO2 microspheres with exposed {0 0 1} facets. Appl. Surf. Sci. 2014, 311, 147–157. [Google Scholar] [CrossRef]
  31. Hidalgo, M.C.; Sakthivel, S.; Bahnemann, D. Highly photoactive and stable TiO2 coatings on sintered glass. Appl. Catal. A 2004, 277, 183–189. [Google Scholar] [CrossRef]
  32. Hidalgo, M.C.; Bahnemann, D. Highly photoactive supported TiO2 prepared by thermal hydrolysis of TiOSO4: Optimisation of the method and comparison with other synthetic routes. Appl. Catal. B 2005, 61, 259–266. [Google Scholar] [CrossRef]
  33. Stradella, L.; Pelizzetti, E. Energetics of the interaction of hydrogen with loaded titanium dioxide. J. Mol. Catal. 1986, 35, 221–226. [Google Scholar] [CrossRef]
  34. Stradella, L.; Pelizzetti, E. Energetics of the adsorption-desorption cycles of oxygen on doped titanium dioxide. Thermochim. Acta 1985, 85, 19–22. [Google Scholar] [CrossRef]
  35. Burattini, E.; Cavagna, M.; Dell’Anna, R.; Malvezzi Campeggi, F.; Monti, F.; Rossi, F. A FTIR microspectroscopy study of autolysis in cells of the wine yeast Saccharomyces cerevisiae. Vib. Spectrosc. 2008, 47, 139–147. [Google Scholar] [CrossRef]
  36. Mahmoud, M.E.; Yakout, A.A.; Osman, M.M. Dowex anion exchanger-loaded-baker’s yeast as bi-functionalized biosorbents for selective extraction of anionic and cationic mercury(II) species. J. Hazard. Mater. 2009, 164, 1036–1044. [Google Scholar] [CrossRef] [PubMed]
  37. Murcia, J.J.; Hidalgo, M.C.; Navío, J.A.; Araña, J.; Doña-Rodríguez, J.M. In situ FT-IR study of the adsorption and photocatalytic oxidation of ethanol over sulfated and metallized TiO2. Appl. Catal. B 2013, 142–143, 205–213. [Google Scholar] [CrossRef]
  38. Yuen, C.W.M.; Ku, S.K.A.; Choi, P.S.R.; Kan, C.W.; Tsang, S.Y. Determining Functional Groups of Commercially Available Ink-Jet Printing Reactive Dyes Using Infrared Spectroscopy. RJTA 2005, 9, 26–38. [Google Scholar] [CrossRef]
  39. Murcia, J.J.; Hidalgo, M.C.; Navío, J.A.; Araña, J.; Doña-Rodríguez, J.M. Correlation study between photo-degradation and surface adsorption properties of phenol and methyl orange on TiO2 Vs platinum-supported TiO2. Appl. Catal. B 2014, 150–151, 107–115. [Google Scholar] [CrossRef]
  40. Park, H.; Park, Y.; Kim, W.; Choi, W. Surface modification of TiO2 photocatalyst for environmental applications. J. Photochem. Photobiol. C 2013, 15, 1–20. [Google Scholar] [CrossRef]
  41. Tandon, S.P.; Gupta, J.P. Measurement of Forbidden Energy Gap of Semiconductors by Diffuse Reflectance Technique. Phys. Status Solidi 2006, 38, 363–367. [Google Scholar] [CrossRef]
  42. APHA. Standard Methods for Examination of Water and Wastewater, 22th ed.; APHA: Washington, DC, USA, 2012. [Google Scholar]
Figure 1. XRD patterns for photocatalysts analyzed. (a) TiO2; (b) F-TiO2; (c) Pt-F-TiO2; (d) P25; (e) F-P25 and (f) Pt-F-P25.
Catalysts 09 00179 g001
Figure 2. UV-Vis DR spectra for photocatalysts analyzed.
Catalysts 09 00179 g002
Figure 3. TEM images for analyzed samples. (a) Pt–F–TiO2 and (b) Pt–F–P25.
Catalysts 09 00179 g003
Figure 4. XPS spectra of the regions O 1s, Na 1s, F 1s and Pt4f in the photocatalysts analyzed.
Catalysts 09 00179 g004
Figure 5. FTIR spectra for the photocatalysts analyzed.
Catalysts 09 00179 g005
Figure 6. (A) Kind of dyestuffs and (B) commercial dyestuffs usually applied in Colombian handicrafts factories.
Catalysts 09 00179 g006
Figure 7. XRD patterns for commercial anilines.
Catalysts 09 00179 g007
Figure 8. FTIR spectra for the dyestuffs analyzed. (A) MB, (B) MO and (C) commercial anilines.
Catalysts 09 00179 g008
Figure 9. Evolution of MB concentration with the photoreaction time over the photocatalysts analyzed. (A) Lab prepared TiO2 modified and (B) Commercial TiO2 modified.
Catalysts 09 00179 g009
Figure 10. Evolution of MO concentration with the photoreaction time over the photocatalysts analyzed. (A) Lab prepared TiO2 modified and (B) commercial TiO2 modified.
Catalysts 09 00179 g010
Figure 11. UV–Vis spectra obtained during the commercial aniline “El Sol (S)” photodegradation over F-P25 catalyst.
Catalysts 09 00179 g011
Figure 12. Evolution of the dyestuffs concentration with the photoreaction time over the photocatalysts analyzed. (A) P25; (B) F-P25 and (C) Pt-F-P25.
Catalysts 09 00179 g012aCatalysts 09 00179 g012b
Figure 13. Final disposal of colored wastewater coming from Colombian handicrafts factories.
Catalysts 09 00179 g013
Figure 14. UV-Vis spectra obtained during the photocatalytic treatment of colored wastewater coming from Colombian handicrafts factories by using P25 as a photocatalyst (a) and (b) Initial spectra and final results obtained after 5 h of photocatalytic treatment.
Catalysts 09 00179 g014
Table 1. Summary of the characterization results.
PhotocatalystsSBET (m2/g)DAnatase (nm)Band Gap (eV)Binding Energy (eV)Fluorine Atomic Content (%)
Ti 2p3/2O 1s
TiO211173.30458.5529.8-
F-TiO251243.21458.4529.61.83
Pt-F-TiO242233.24458.4529.81.12
P2551223.23458.5529.8-
F-P2550233.20458.6529.80.48
Pt-F-P2547213.20458.6529.90.37
Table 2. Dyestuffs concentration after dark adsorption experiments. Initial concentration 25 ppm.
DyestuffPhotocatalystDyestuff Concentration (ppm)
Methylene Blue (MB)F-P2517.80
Pt-F-P2525.00
Methyl orange (MO)F-P2524.31
Pt-F-P2523.90
El Sol (S)F-P2524.60
Pt-F-P2519.10
El Indio (I)F-P2523.71
Pt-F-P2522.03
El Paisa (P)F-P256.86
Pt-F-P2521.49
Table 3. Average results of the physicochemical and microbiological analysis for wastewater samples coming from handicrafts factories, before and after 5 h of photocatalytic treatment.
Photocatalytic TreatmentpHCl (mg/L)Alkalinity (mg CaCO3/L)Total Coliforms (CFU/100 mL)
Wastewater sample before treatment5.0350.2075.008.66 × 105
Photolysis4.8550.2774.087.62 × 105
P254.2450.3570.021000
F-P255.0550.3544.02640
Pt-F-P255.1550.0055.809400

