Plasma Catalysis: Distinguishing between Thermal and Chemical Effects


1
Catalytic Processes and Materials Group, University of Twente, 7522 NB Enschede, The Netherlands
2
Nonequilibrium Fuel Conversion, DIFFER, 5612 AJ Eindhoven, The Netherlands
*
Author to whom correspondence should be addressed.
Catalysts 2019, 9(2), 185; https://doi.org/10.3390/catal9020185
Submission received: 21 January 2019
/
Revised: 7 February 2019
/
Accepted: 7 February 2019
/
Published: 16 February 2019
(This article belongs to the Special Issue Plasma Catalysis)
Abstract
:The goal of this study is to develop a method to distinguish between plasma chemistry and thermal effects in a Dielectric Barrier Discharge nonequilibrium plasma containing a packed bed of porous particles. Decomposition of CaCO3 in Ar plasma is used as a model reaction and CaCO3 samples were prepared with different external surface area, via the particle size, as well as with different internal surface area, via pore morphology. Also, the effect of the CO2 in gas phase on the formation of products during plasma enhanced decomposition is measured. The internal surface area is not exposed to plasma and relates to thermal effect only, whereas both plasma and thermal effects occur at the external surface area. Decomposition rates were in our case found to be influenced by internal surface changes only and thermal decomposition is concluded to dominate. This is further supported by the slow response in the CO2 concentration at a timescale of typically 1 minute upon changes in discharge power. The thermal effect is estimated based on the kinetics of the CaCO3 decomposition, resulting in a temperature increase within 80 °C for plasma power from 0 to 6 W. In contrast, CO2 dissociation to CO and O2 is controlled by plasma chemistry as this reaction is thermodynamically impossible without plasma, in agreement with fast response within a few seconds of the CO concentration when changing plasma power. CO forms exclusively via consecutive dissociation of CO2 in the gas phase and not directly from CaCO3. In ongoing work, this methodology is used to distinguish between thermal effects and plasma–chemical effects in more reactive plasma, containing, e.g., H2.
1. Introduction
Plasma catalysis is receiving more and more attention in the last few years, since the specific interactions between plasma and catalyst surface may lead to synergistic effects [1,2,3,4]. One of the earliest plasma catalytic applications is the abatement of volatile organic compounds (VOC) [5,6], while in the last decade research has been focused more on CO2 conversion [7,8,9], conversion of hydrocarbons via reforming, and coupling [10,11,12], as well as activation of N2 [13,14]. Reforming of hydrocarbons is an example of an endothermic reaction, where plasma catalysis holds promise because of activation of hydrocarbons at low temperature, but also because electrical energy would be used to generate the required heat. Methane coupling and CO2 dissociation are examples of thermodynamically hill-up reactions, which are clearly more challenging.
Nonequilibrium plasma, e.g., microwave of Dielectric Barrier Discharge (DBD) plasma, is especially attractive because it operates at relatively low temperatures [15,16,17]. Consequently, catalyst sintering is prevented. Moreover, low temperatures are a necessity to enable catalysis in the first place, facilitating initial adsorption that decreases entropy. Starting and stopping plasma reactors is much faster than usual thermal reactors, which is an advantage when fast capacity changes are required, e.g., in connection with intermittent energy supply and storage.
DBD plasma is frequently used for studying plasma catalytic conversion. The high AC voltages applied at relatively low frequency (50 to 105 Hz) produces a nonequilibrium plasma with very high electron temperatures (1–10 eV equal to 104–105 K), rather high vibrational temperatures (103 K), and rather low rotational and translational temperatures in the plasma zone, typically in the order or smaller than 100 K [6,15,16,17]. The fact that energy would be directed directly to bond breaking, without the need to heat up the gas mixture completely, is very attractive as heat exchangers to recover the heat would become redundant. The presence of a dielectric between the two electrodes prevents the formation of hot plasma in a single spark, forming instead several microfilaments, resulting in a more uniform plasma. The low gas temperature allows the application of a catalyst directly in the plasma generation zone without fast deactivation, maximizing the interaction between active species and the catalytic phase. Furthermore, DBD plasma can be generated at atmospheric pressure, which is interesting from the application point of view. Very promising results were presented in the last years on several topics, such as CO2 conversion [9,18,19,20,21,22,23,24,25,26,27] and CH4 reforming [12,13,28,29,30,31,32,33,34], in terms of high conversion and selectivity. However, the main issue of DBD remains the low energy efficiency achieved, i.e., the ratio between chemical energy stored in the produced molecules and electrical energy applied, which rarely surpasses 10%. This is explained by dissociative excitation by electron impact, involving a large activation barrier, dominating over vibrational excitation [7,35,36,37]. A more suitable technique for vibrational excitation is microwave plasma, which uses GHz frequencies [38,39,40]. However, the temperature increase is more pronounced in microwave plasma, limiting the opportunities for plasma catalysis.
Interaction between plasma and catalyst can proceed in many ways [1,2,3,4]. Obviously, the plasma will introduce new chemical species including activated species, radicals, and ions, which may all adsorb on the catalyst opening new reaction pathways and influencing the products distribution. Plasma can also induce photocatalytic effects by UV irradiation, impingement of charged particles and thermal fluctuations. The surface and subsurface of a catalyst can be modified by plasma via poisoning, implantation, sputtering, and etching. The presence of a catalyst influences the plasma by changing the electrical field distribution, but also modifying the free volume and the residence time in the plasma zone. Plasma also affects the temperature of the system, obviously influencing reaction rates of chemical reactions.
Unfortunately, it is not possible to measure the temperature in a DBD plasma catalytic reactor directly. Application of a thermocouple inside the plasma is not possible due to the high electric fields present. Nevertheless, thermocouples were used a few millimeters outside the plasma zone inside the reactor tube, or outside the reactor tube just alongside the plasma zone [41,42,43,44]. Furthermore, many attempts have been done to measure temperatures indirectly, for instance by emission spectroscopy of UV–Vis radiation probing electronic transitions in nitrogen and hydroxyl groups [45,46,47,48], by UV absorption spectroscopy [47], or by infrared emission [23,44]. Unfortunately, these methods have serious limitation depending on the reactor material properties as well as the packed bed properties.
This study proposes a method to distinguish between thermal effect and plasma chemistry effects in fixed bed DBD plasma reactors. The decomposition of calcium carbonate is used as a model system for packed beds containing porous particles. It is well known that thermal decomposition results in formation of exclusively CaO and CO2 [49], whereas formation of CO would indicate that plasma chemistry is involved. A pure thermal effect is likely when using an Ar plasma, since no chemistry is expected between activated argon species and CaCO3. The choice for CaCO3 as model system in combination with a DBD reactor is inspired by its relevance for CO2 separation. The calcium looping cycle consists of carbonation of CaO for capturing followed by calcination of CaCO3 in order to recycle calcium oxide and to produce pure CO2 [49]. Bottleneck is the calcination reaction that requires high temperatures in order to achieve high CO2 concentrations in the outlet, i.e., at least 950 °C to achieve 1 bar CO2 [50]. Such temperatures result in sintering, decreasing the CO2 capture capacity when calcium oxide is recycled multiple times [51,52,53]. Using a DBD plasma during the calcium carbonate decomposition might circumvent the need for such high temperatures, and in addition CO2 will be converted by plasma into CO, converting electrical energy into chemical energy and producing an added-value product.
The method to distinguish between thermal and plasma chemistry is based on the fact that plasma cannot exist in the pores inside particles if they are smaller than a few micrometers, as can be understood from Paschen’s Law, which is generally accepted [54,55]. It was recently reported in a theoretical study that penetration of plasma in pores is possible to some extent [56]; however, we will discuss that under our conditions the plasma is limited to the interparticle volume and the external surface area is exposed under the conditions applied. The internal surface area, caused by the presence of small pores in the material is not exposed to the plasma, but would be influenced by any thermal effect. The theory is explained in detail in the section Methods in Appendix B and shown in Figure A13. The method then consists of two approaches: first, the effects of both the internal surface area as well as external surface area will be explored, and second, the dynamics of the performance on changing plasma power will be evaluated. Decomposition rate and eventual further reactions of the carbon dioxide product will be assessed. Argon plasma is used as a reference for the method to be developed as to distinguish between thermal effects and plasma–chemical effects.
2. Results
X-ray fluorescence (XRF) measurements confirmed the purity of CaO (99.12%) containing some minor impurities, i.e., SiO2 (0.16%), MgO (0.12%), and Al2O3 (0.095%).
Table 1 in the Materials and Methods Section presents the surface area and particles sizes of the five prepared samples. The surface areas reported for samples A and B are well reproducible, but it should be noted that systematic errors may be larger, given the relatively low value of the surface areas. The surface area of batch III (samples C–E) is below the detection limit of the N2 physisorption equipment, from which we deduce that the surface area is below 0.5 m2/g. In any case, the total surface of the samples increases in the order C<B<A. Remarkably, the surface areas of the parent oxides are much higher, confirming the theory that formation of a carbonate layer induces closure of small pores, due to the lower density of CaCO3 (2.71 g cm−3) compared to CaO (3.35 g cm−3). However, the order in surface area remains the same, reassuring that the surface area of the samples is in the order A>B>C>D>E. Figure 1 shows the pore size distribution measured with mercury porosimetry for the carbonated samples synthesized from calcium ascorbate (sample B, Figure 2a) and from calcium carbonate (sample C, Figure 2b). Sintering at 900 °C for 24 h (sample C) causes formation of large pores of typically 400 nm, compared to sample A which was treated with CO2 only at 630 °C. Remarkably, the pore volume of the sintered sample is ~20%, much larger than sample B (~5%), indicating that smaller pores collapsed favoring enlargement of the bigger pores.
Figure 2 presents the results of isothermal decomposition at 630 °C of the carbonated samples A–C, showing that the CO2 concentration generated via decomposition is within 10% constant during typically 20 min, after an induction time of a few minutes. In general, this is observed when decomposition is limited to max 50% of CaCO3 present initially. The amounts of CO2 desorbed from the samples A, B, and C are 4, 3.8, and 2.8 mg, respectively, equivalent with 0.66, 0.61, and 0.39 gCO2/gCaO, respectively. The amounts of CO2 decrease in the same order as surface area. It can be estimated that the thickness of the CaCO3 layer is in the order of 30 nm for all three sample. This is consistent with the observation that the maximum CO2 concentration during decomposition experiments, between 900 to 1700 ppm, which is significantly lower than the 7000 ppm thermodynamic equilibrium CO2 concentration at 630 °C [50]. Consequently, the CO2 concentration is determined by kinetics, instead of thermodynamics, and thus also by the surface area.
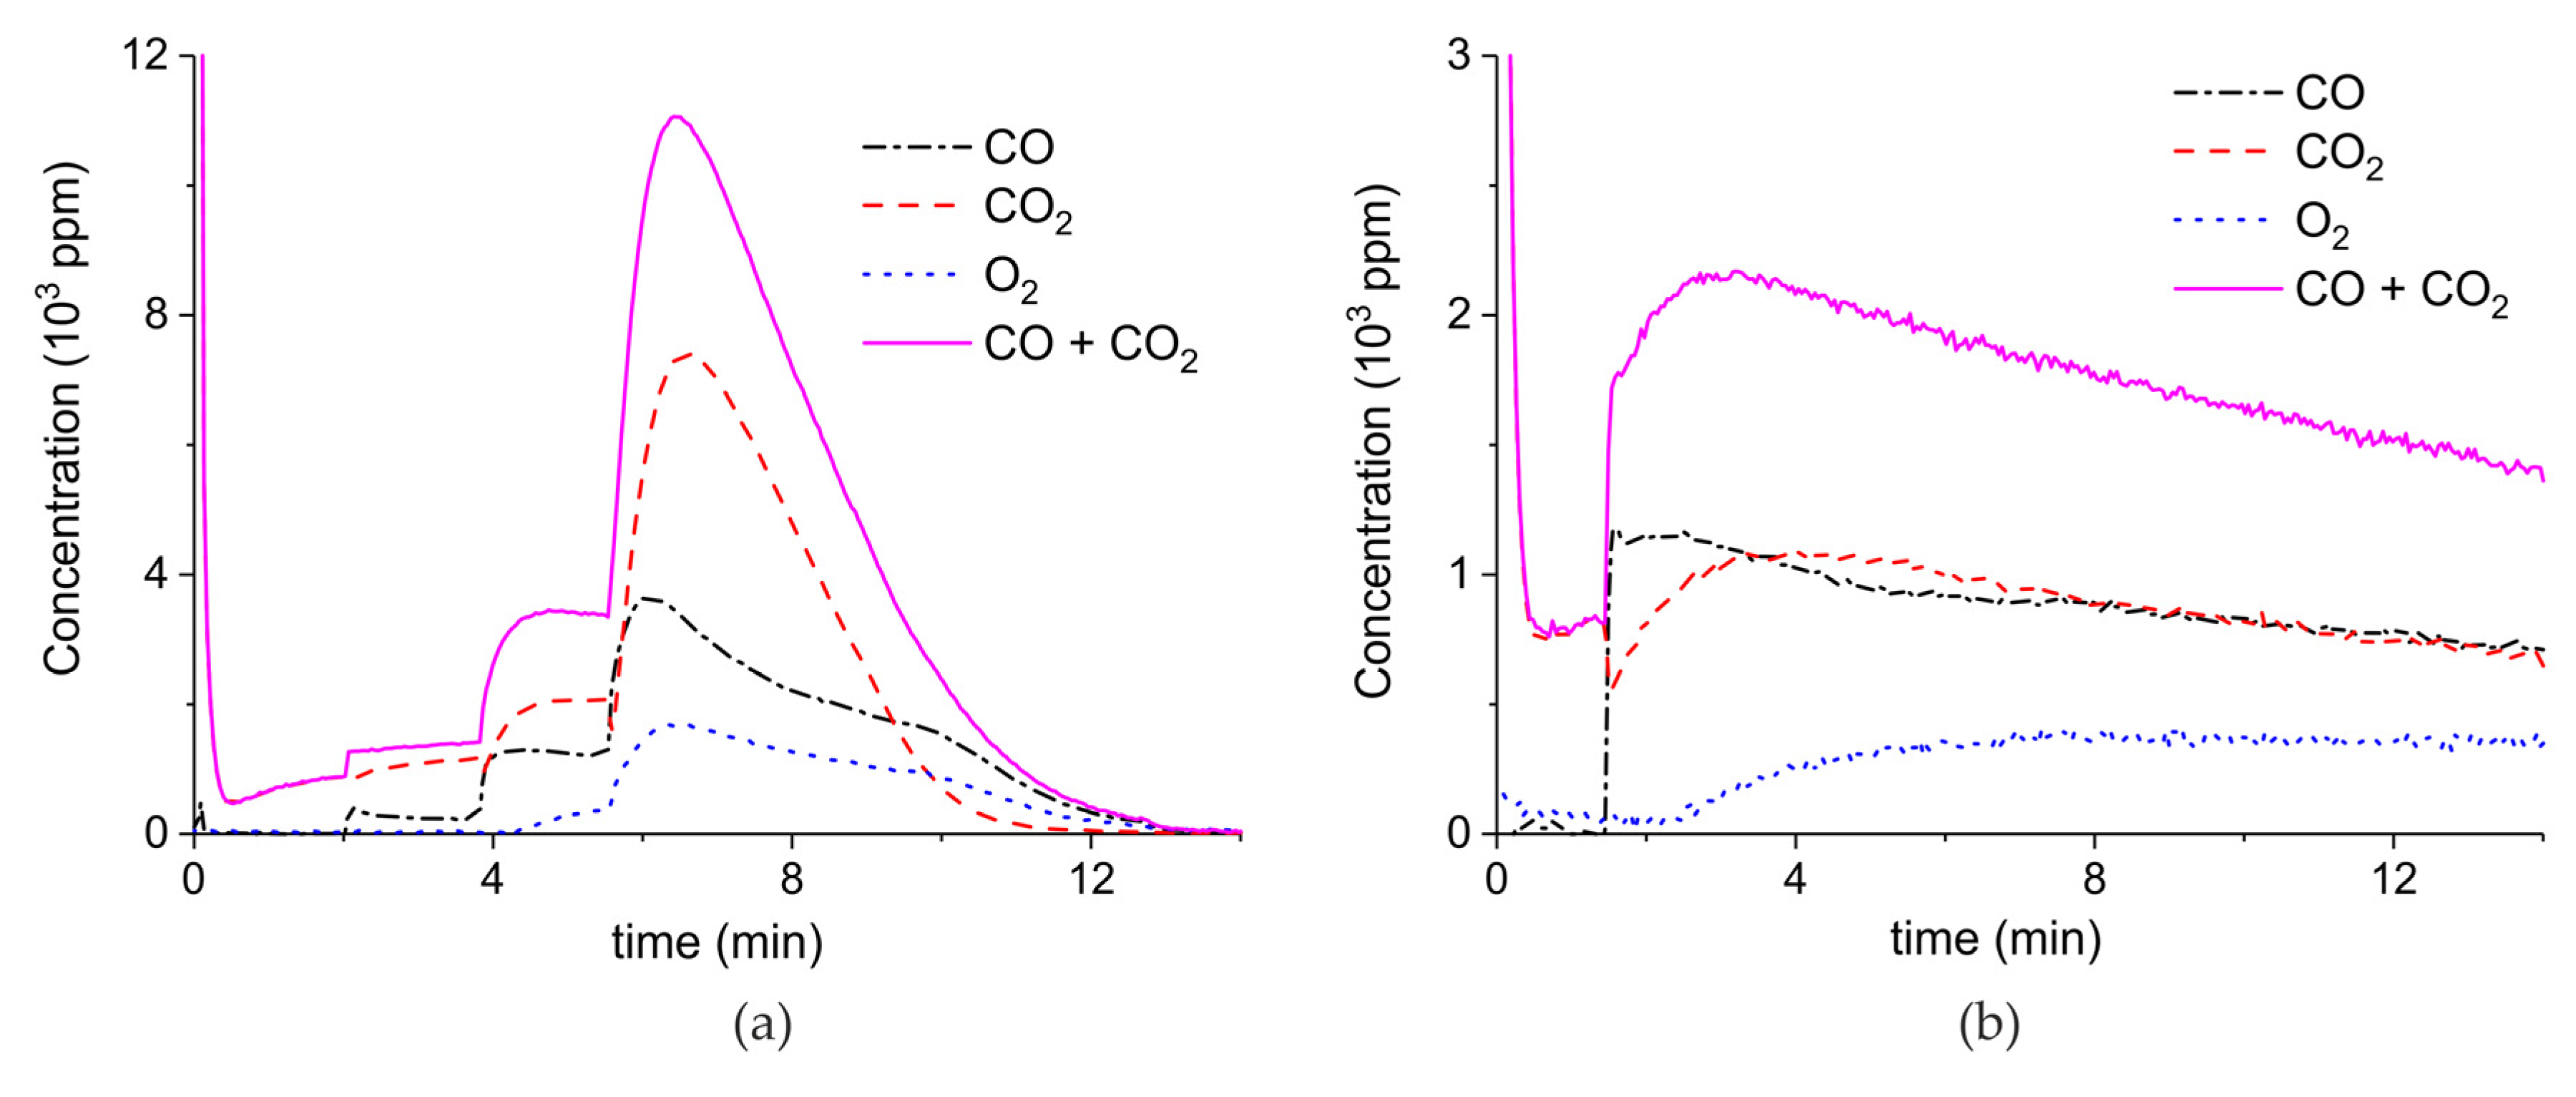
Figure 3 presents the effect of plasma power, measured with a Lissajous plot (see Appendix B), on the decomposition of carbonated sample C. No plasma was applied during the first two minutes and CO2 is the only product observed, while in the presence of plasma CO and O2 are also produced, next to CO2. Every two minutes a different voltage is applied, and the power is measured after ca. 1 minute. Changing the plasma power causes a fast response of the CO concentration in the order of seconds, while the CO2 concentration needs typically a minute to stabilize. The O2 concentration shows a delay; this effect is not understood at this time, but it may be speculated that interaction with CaO is responsible. Figure 3 shows that steady-state decomposition was achieved for the two lower plasma power values. The highest power setting of 9.6 W caused exhaustion so that the product concentrations are likely to be underestimated. Additional experiments were performed at constant maximum power as shown in Figure 4. Two experiments were performed at 2.1 W and demonstrate a reproducibility within ±5%, even though plasma was applied with a 1.5 min delay in the second experiment (Figure 4b). Figure 4c is performed at 4.4 W, showing a higher decomposition rate and shorter steady state duration. Therefore, the power was not further increased for this sample and in general the maximum power was limited to 5.1 W.
Figure 5 shows three typical results on the effect of the specific surface area on the decomposition at 2.1 W plasma power, by comparing the samples A (ex calcium gluconate, Figure 6a), B (ex calcium ascorbate, Figure 6b), and C (ex calcium carbonate Figure 6c), keeping particle size constant (250–300 µm). The total decomposition rate, as calculated based on the sum of the rates of formation of CO and CO2, seems to increase with increasing specific surface area, as also observed in the absence of plasma. During the decomposition of sample B, the power has been turned off after 9 min, resulting in a rapid decrease in the CO and CO + CO2 concentrations. Figure 6 presents all data on the decomposition rate measured on the three samples when changing the plasma power, showing that the rate of decomposition at the same power is significantly lower for the sample with the lowest specific surface area. The difference between sample A and B is not larger than experimental scatter, although the data suggest a slightly higher rate for sample A.
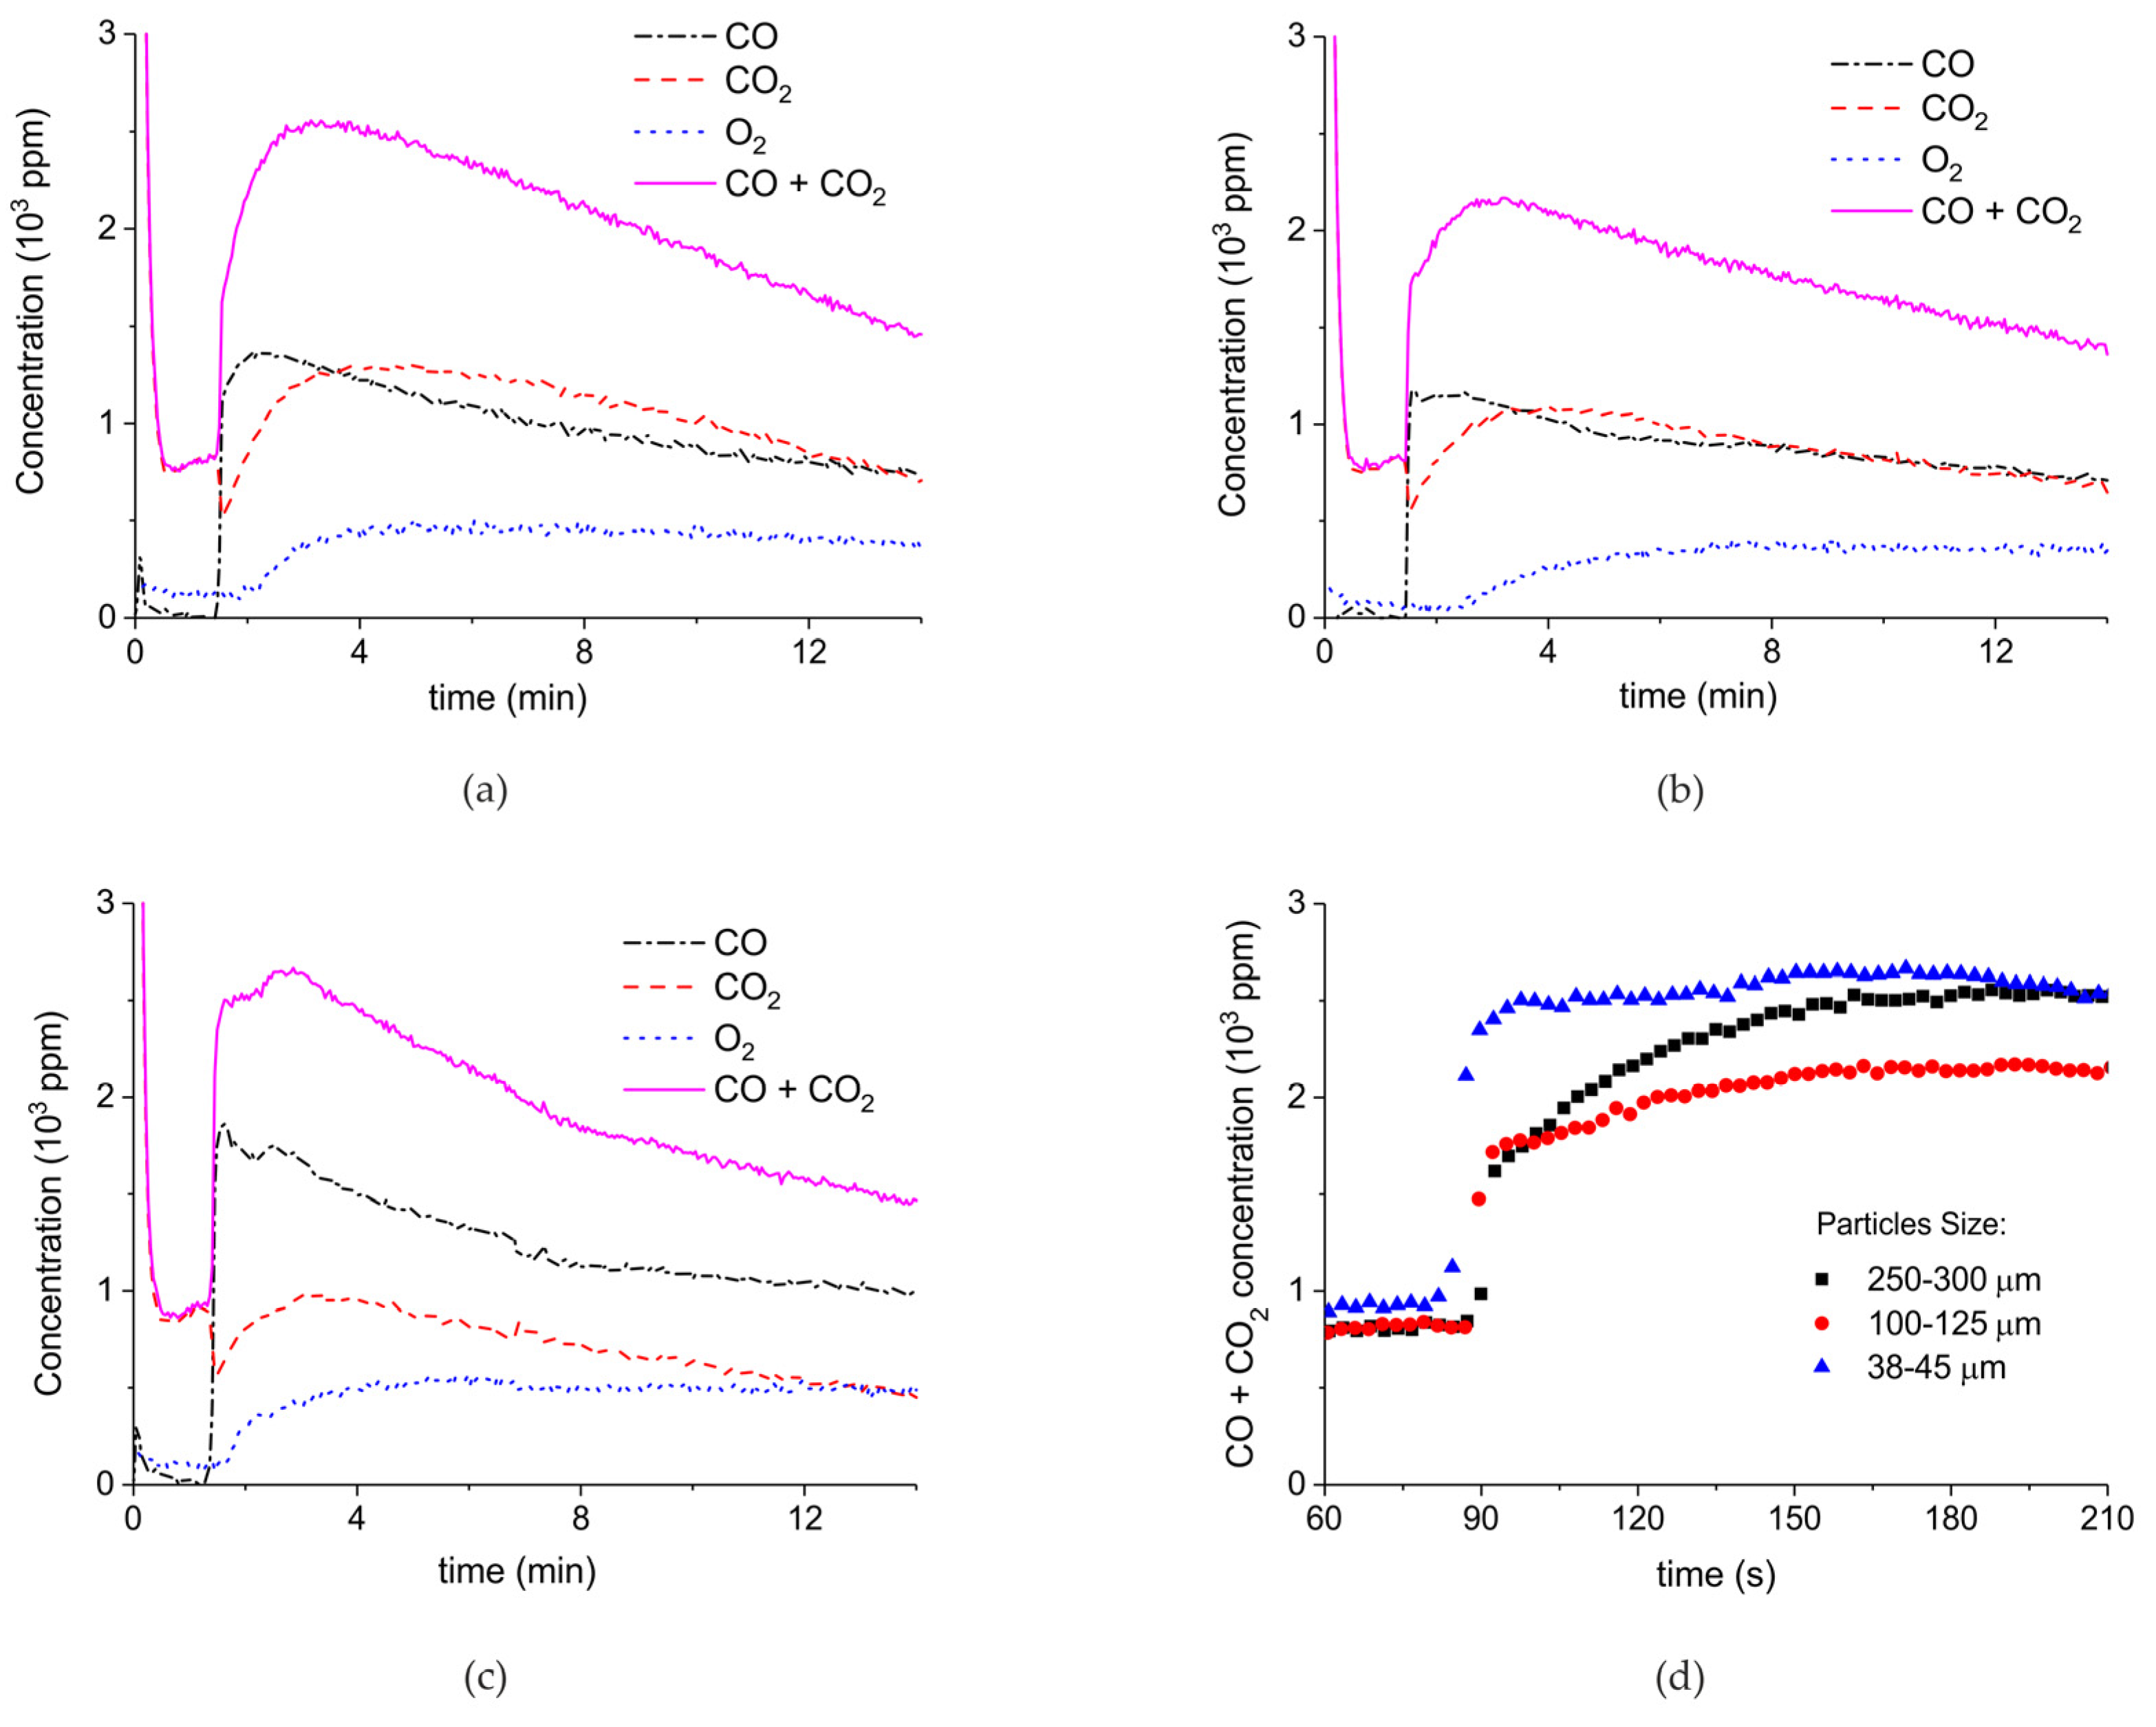
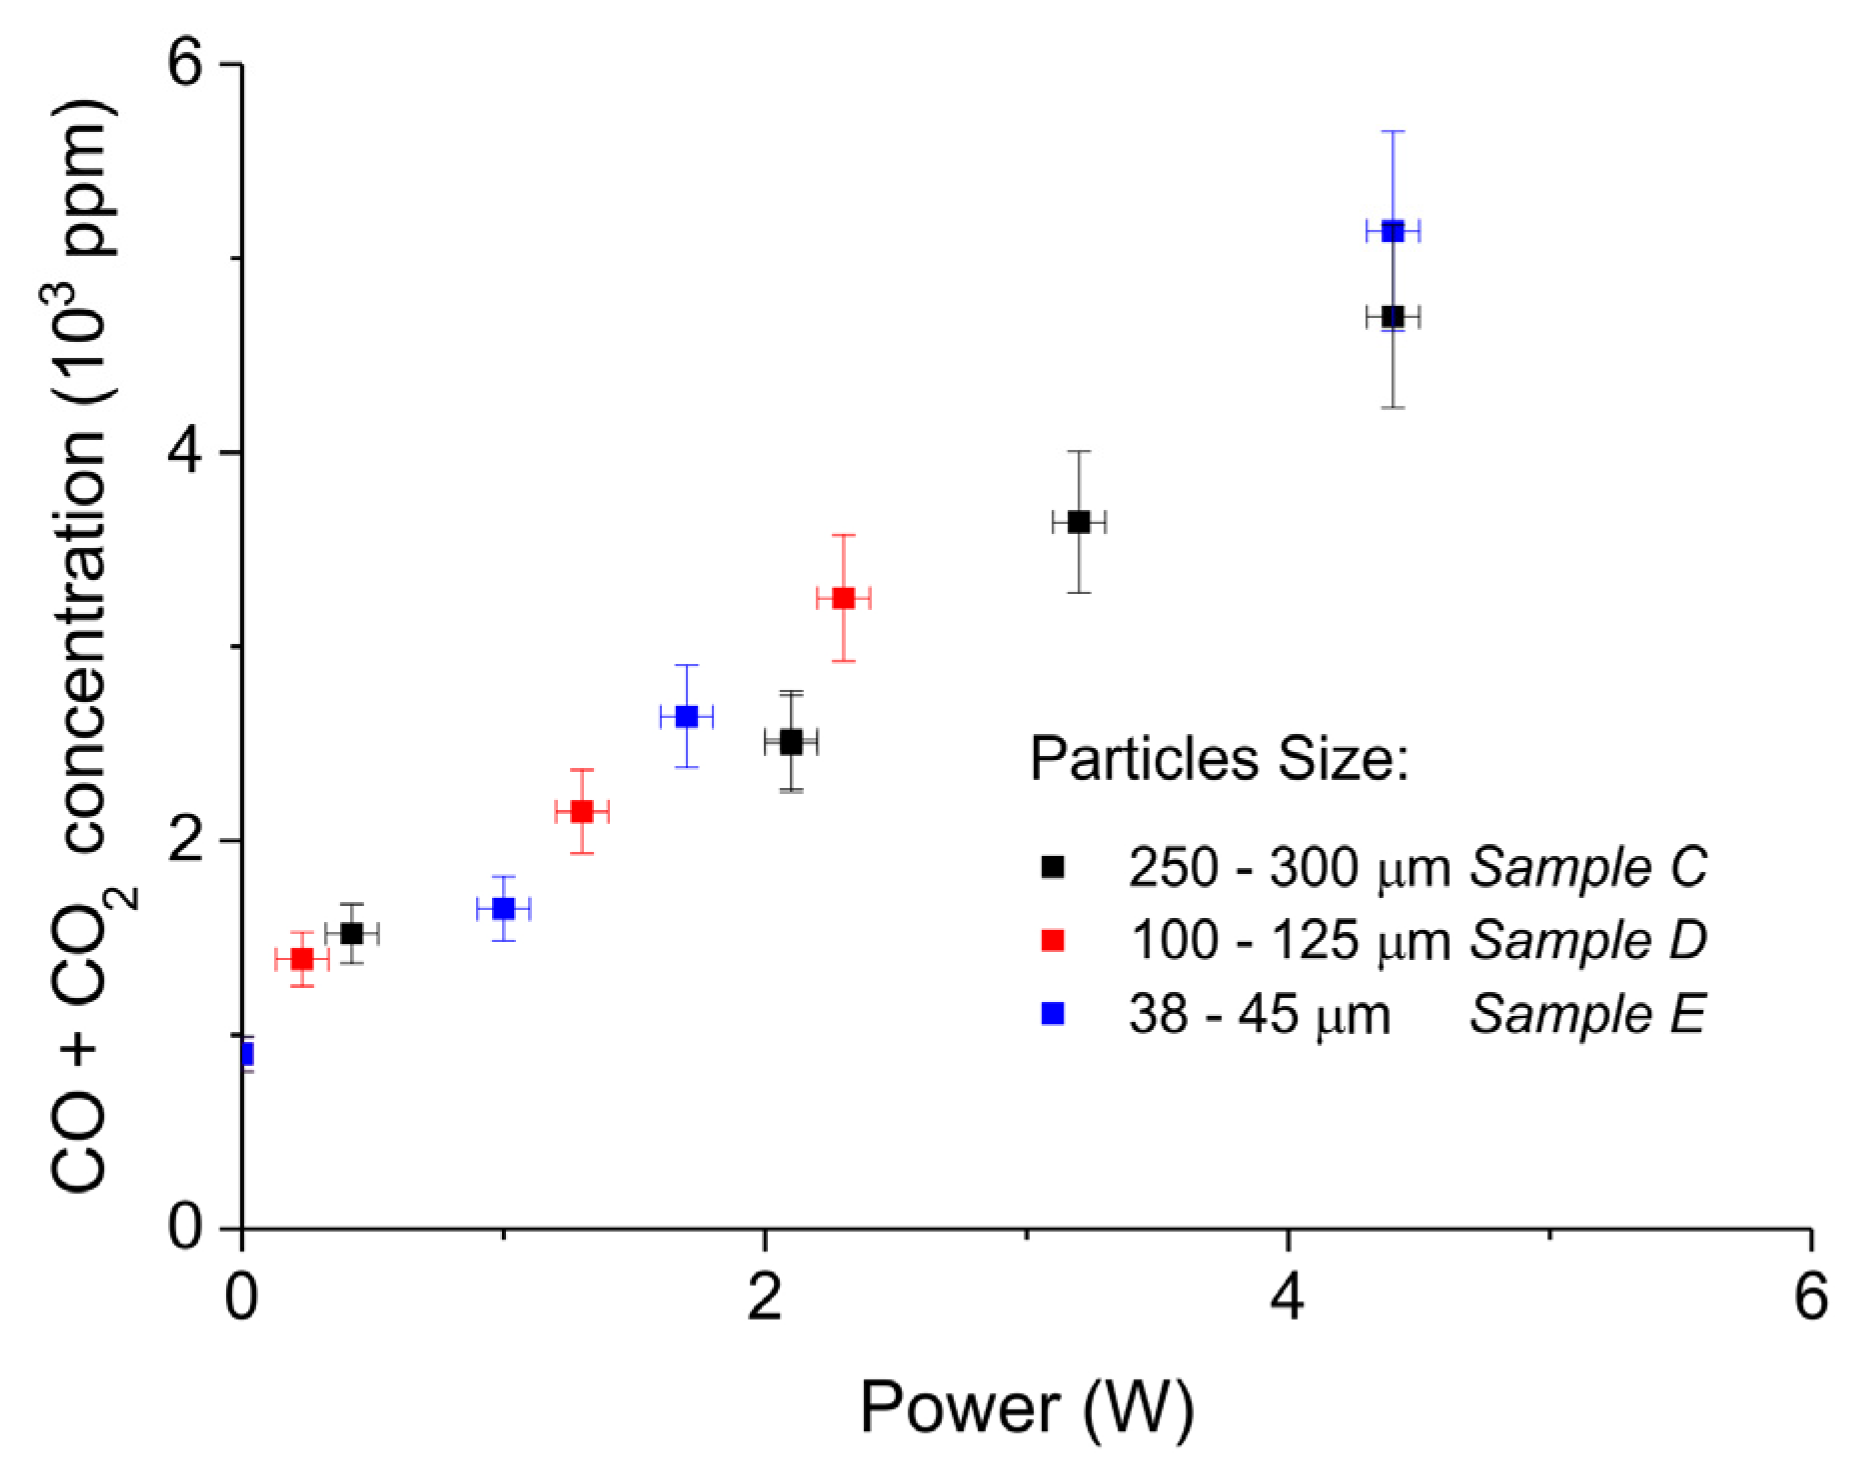
Figure 7 shows the influence of particles size on CaCO3 decomposition by comparing sample C (250–300 µm, Figure 7a), D (100–125 µm, Figure 7b), and E (38–45 µm, Figure 7c) at plasma powers varying between 1.3 and 2.1 W. Figure 5d shows details on the response time after switching on the plasma for the three samples. The time to reach steady state is 50, 40, and 10 seconds for samples C, D, and E, respectively. These times are in reasonable agreement with the Fourier times of CaCO3 particles of these sizes. The different powers do not allow direct comparison of the decomposition rates. Instead, the effect of plasma power on the decomposition rate for samples C, D, and E is presented in Figure 8, showing that the particle size has no effect on the decomposition rate within experimental error. All the experiments addressed in Figure 6 and Figure 8 are shown in detail in Figure A1, Figure A2, Figure A3, Figure A4, Figure A5 and Figure A6 in Appendix A.
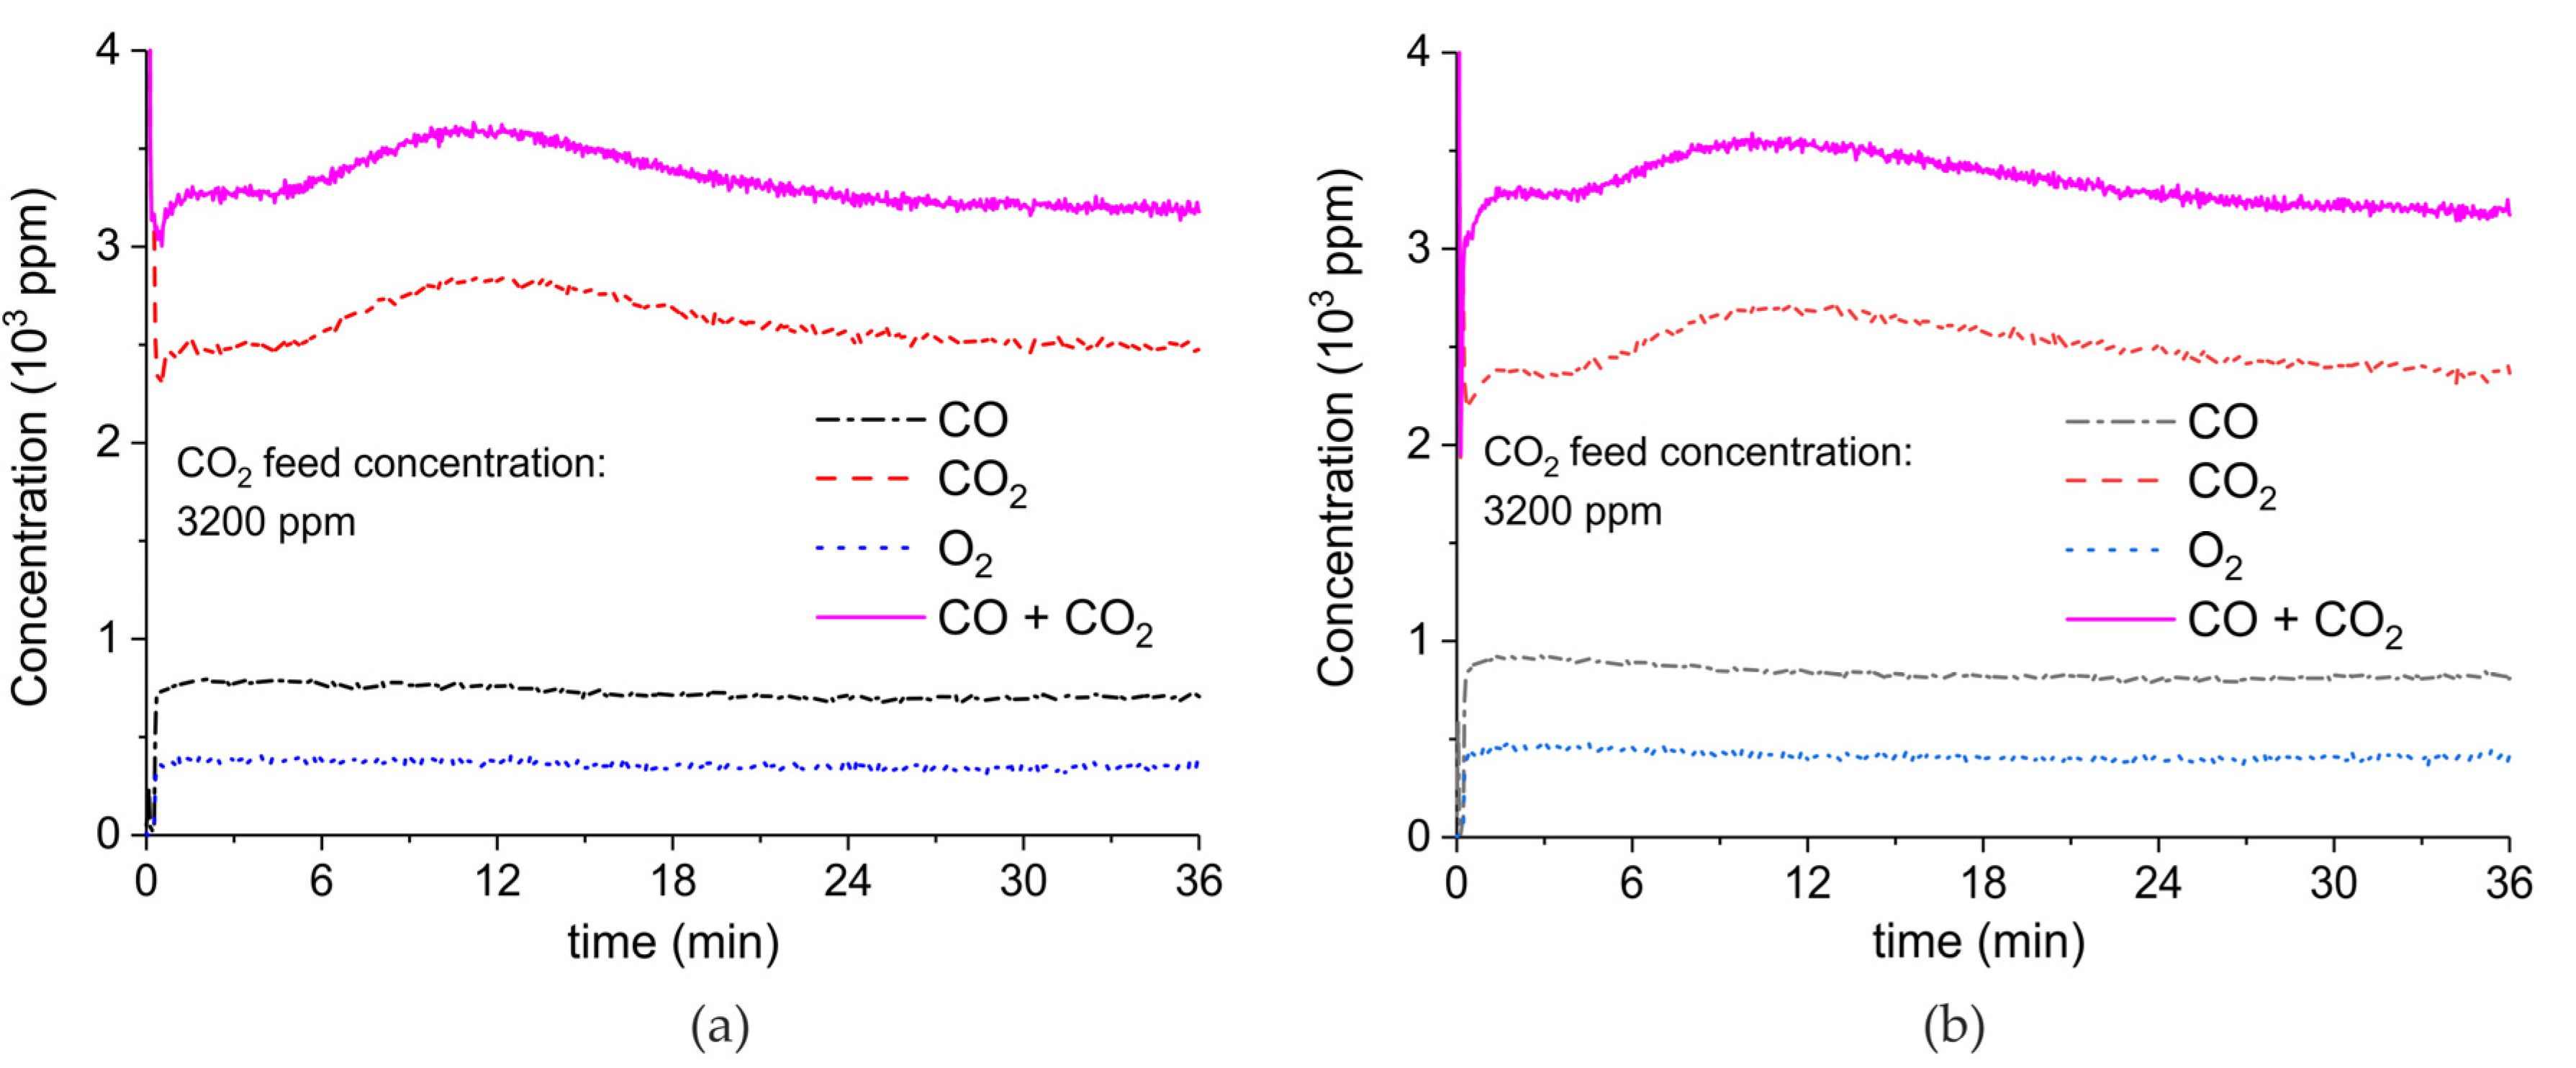
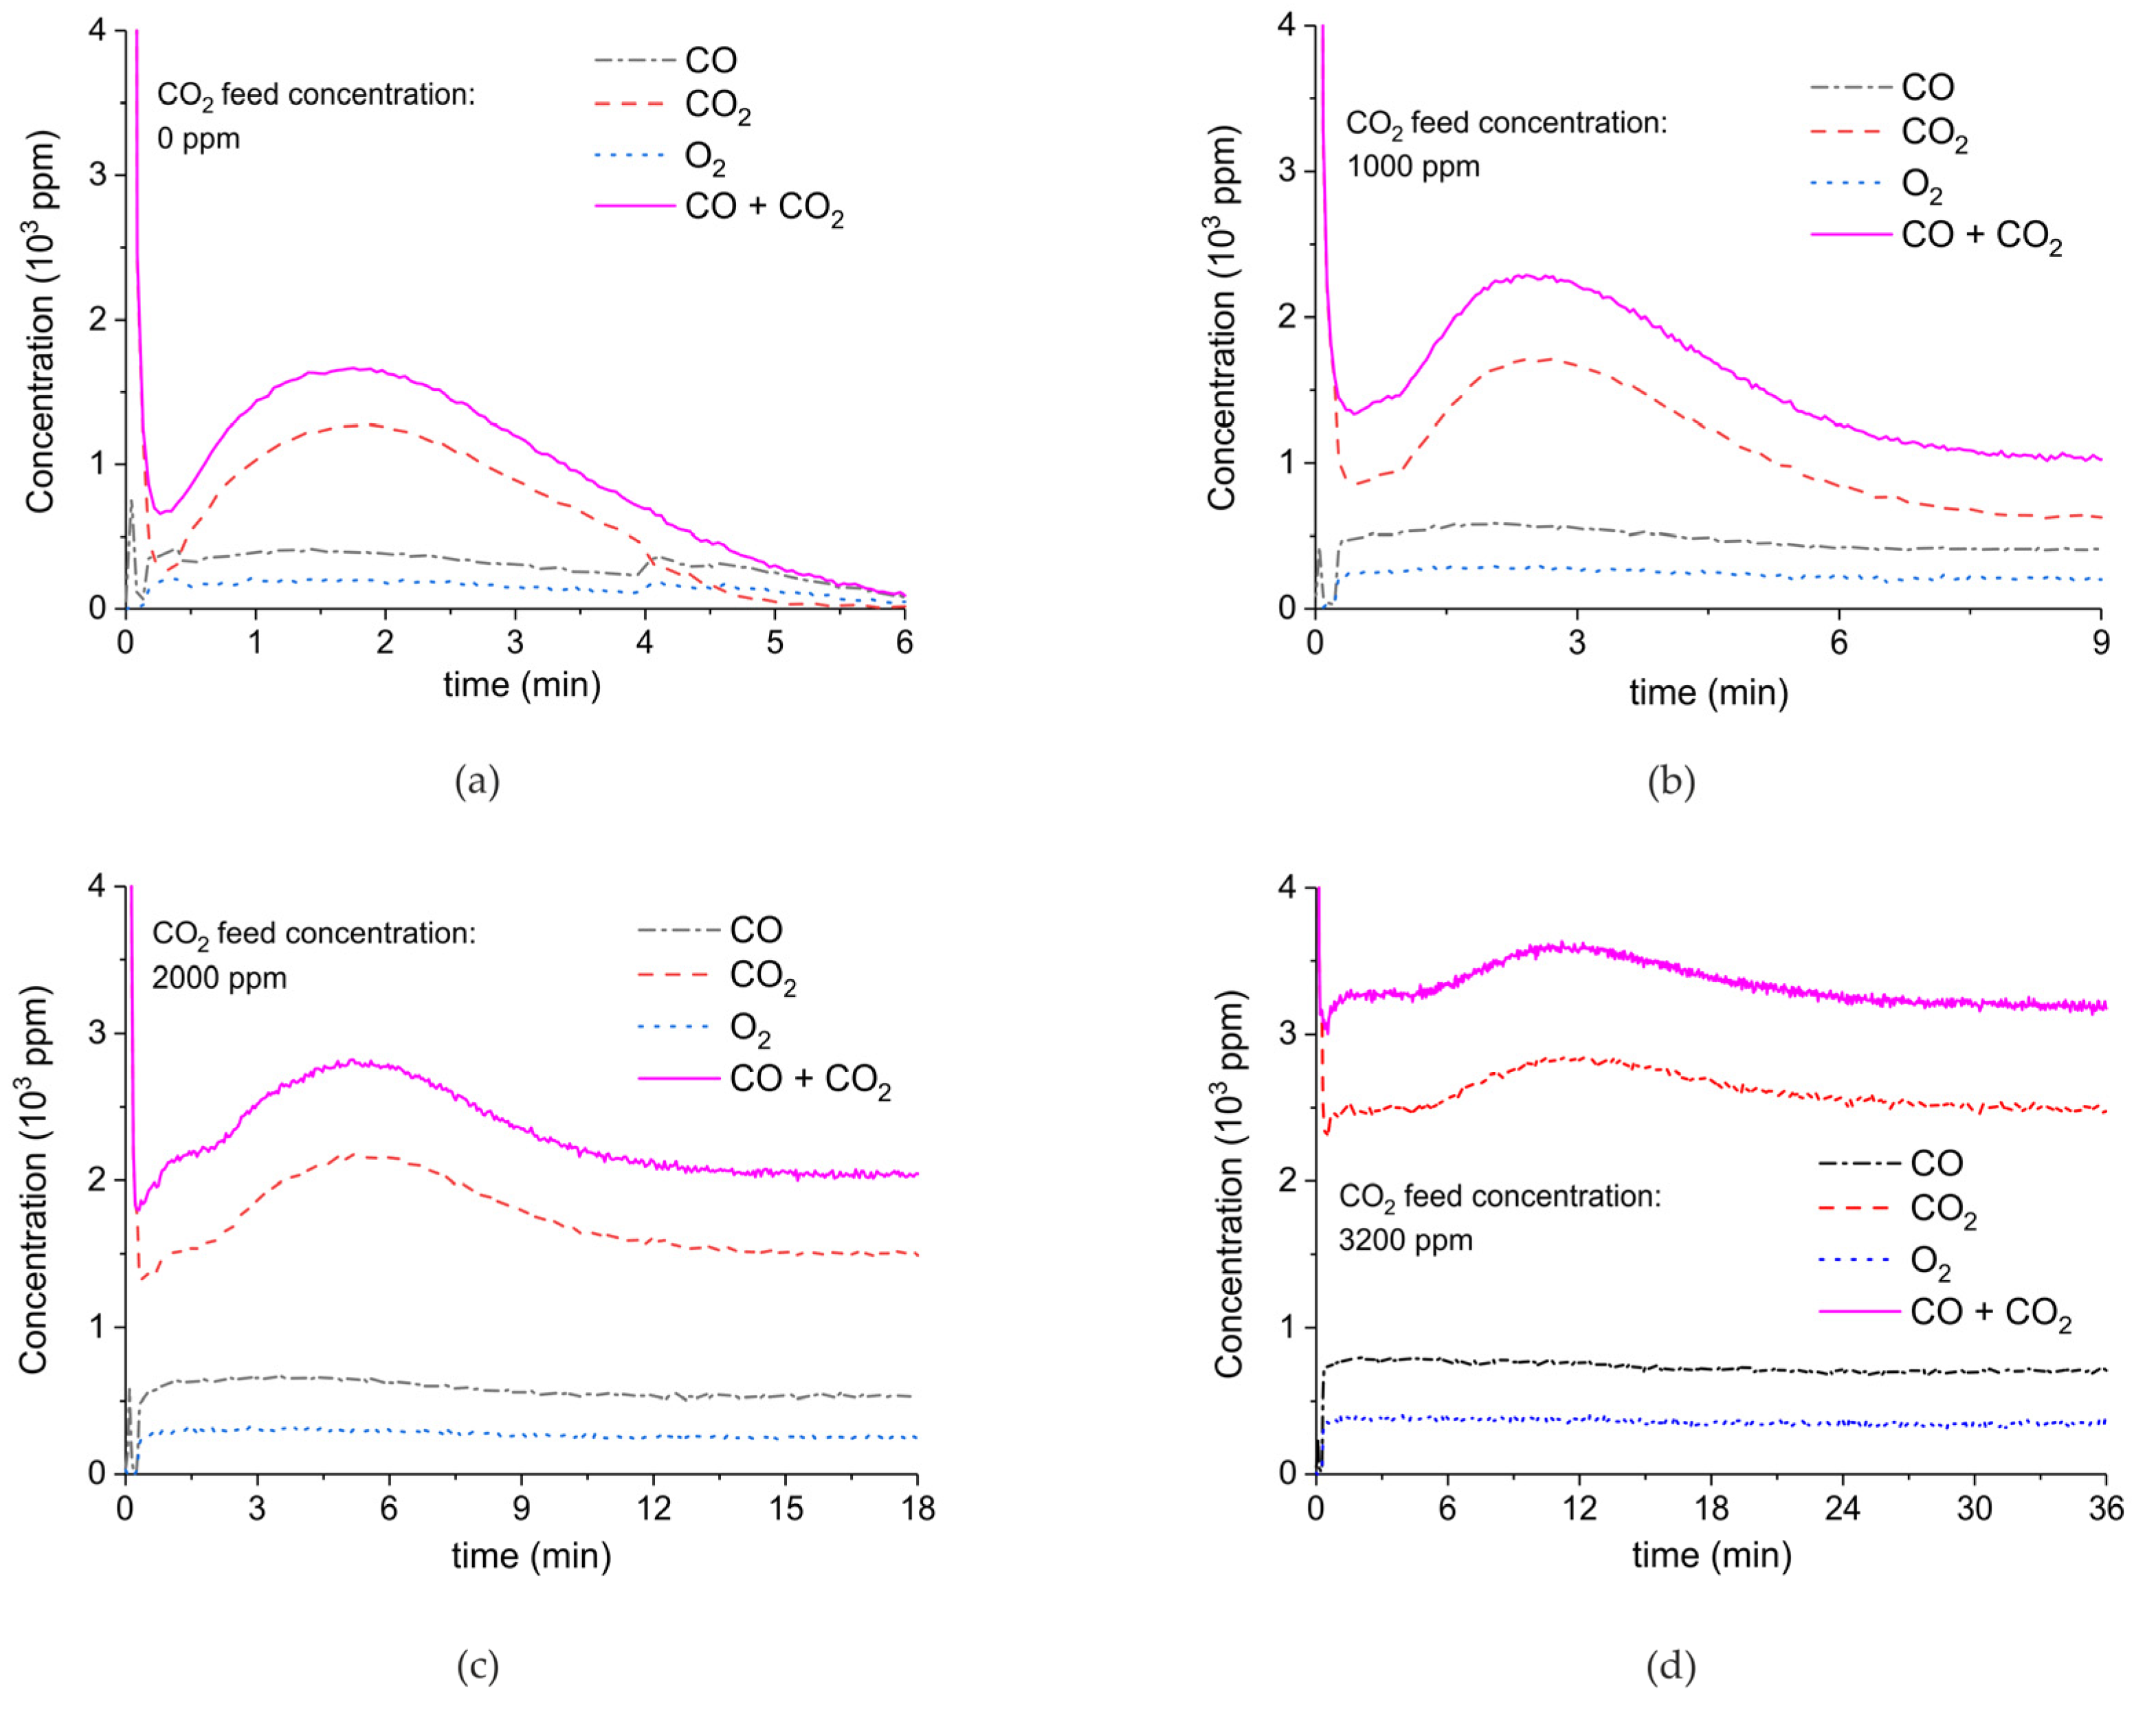
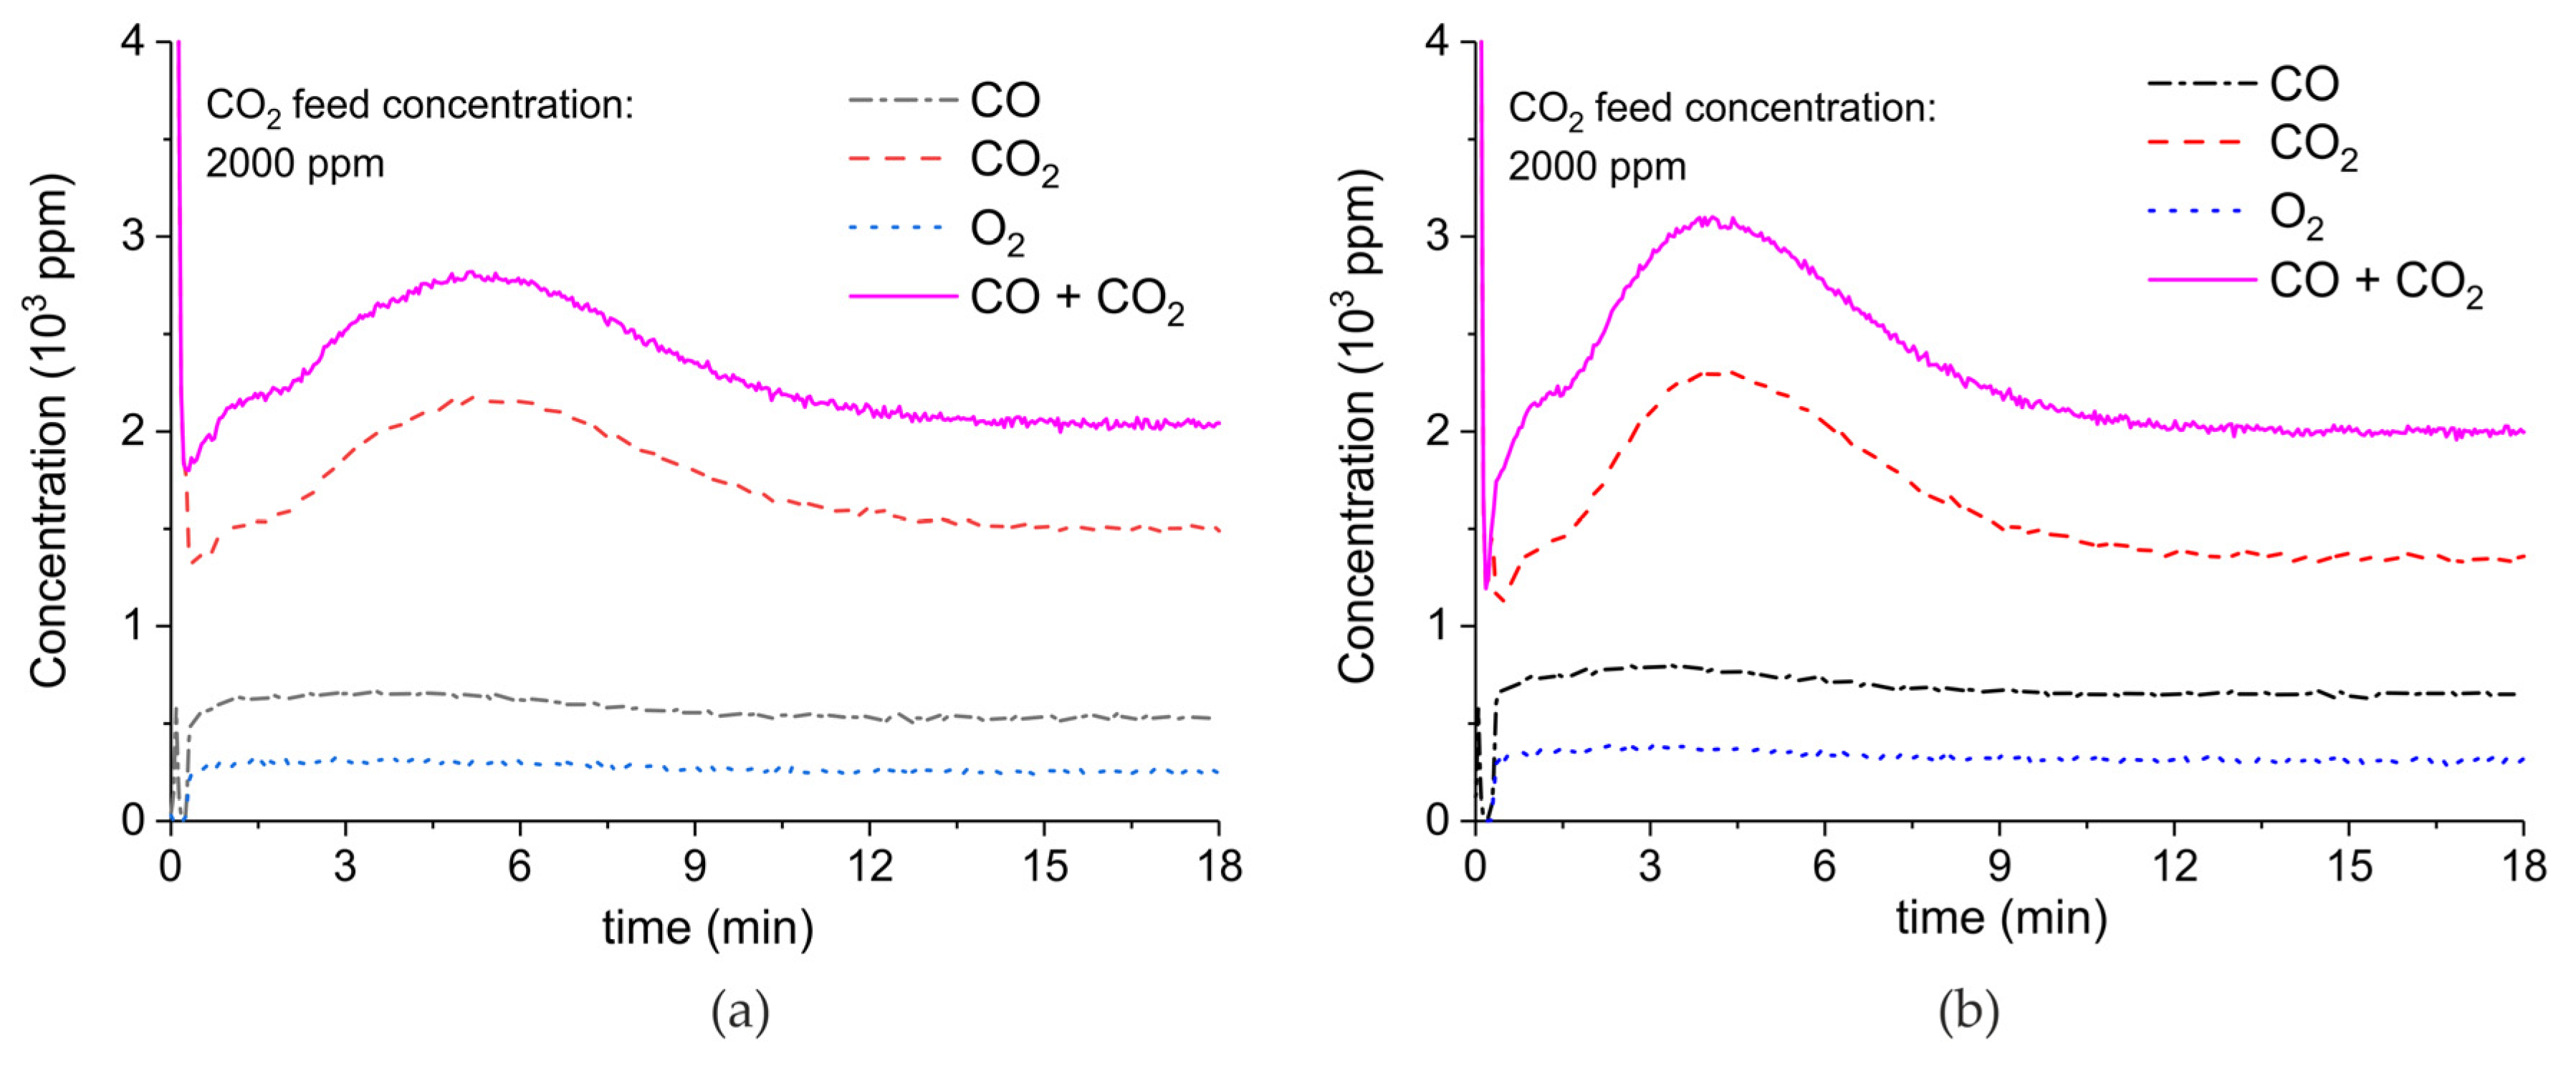
Figure 9 shows the results of a series of plasma enhanced decomposition experiments in the presence CO2 in the feed gas, measured on sample C. All experiments were done with one sample by performing 22 carbonation and decomposition cycles. The stability of the sample was verified by repeating decomposition measurements in the absence of plasma, demonstrating invariable results within 5% as shown in Figure A15 in Appendix A.
Figure 9 shows the effect of CO2 in the feed on plasma-enhanced decomposition at similar plasma powers, i.e., between 1.3 and 1.5 W. The reaction rate substantially decreases in presence of extra CO2, as can be estimated based on the sum of the concentrations of CO and CO2 minus the CO2 concentration at the inlet. Furthermore, the CO concentration increases with increasing CO2 concentration.
In order to correct for the differences in power, additional experiments at other plasma powers were performed as shown in Figure A6, Figure A7, Figure A8 and Figure A9 in Appendix A and the results allowed interpolation of the CO and CO2 values to 1.5 W plasma power, resulting in Figure 10. As the CO2 concentration varies along the axis of the reactor, an averaged value is calculated according to Equation (1):
The spread in the CO2 concentration provides the window of concentrations occurring along the axis of the reactor; note this is not an error margin. Figure 11 confirms that the CO concentration indeed increases with increasing CO2 concentration in the gas phase and this is observed for both CaCO3 as well as the blank experiment with α-Al2O3 only, which is shown in Figure A10 in Appendix A.
3. Discussion
Scheme 1 presents a simple reaction scheme describing CaCO3 decomposition, both in the absence and presence of plasma. Thermal decomposition without plasma involves exclusively R1 (solid arrow), whereas in the presence of plasma both R2 and R3 might contribute. The observed enhancement of decomposition by plasma might be caused by plasma chemistry according R2 and/or by enhancing R1 via increasing temperature, as will be discussed below. Furthermore, we will discuss whether R2 or R3 is responsible for the formation of CO.
3.1. Formation of CO
Figure 10 shows that the CO formation rate is not affected by the presence of CaCO3 in the plasma at low CO2 feed concentrations. It is enhanced by feeding additional CO2. Hence, we conclude that CO formation occurs only in the gas phase (R3) and not on the CaCO3 surface (R2). The trend in Figure 11 also indicates that the order of CO formation in the CO2 concentration is clearly smaller than one. This is qualitatively in line with the results of Ramakers et al. [25] and Butterworth et al. [27], reporting that Ar can enhance the activation of CO2, which is attributed to the fact that the electron density is enhanced because Ar is much easier ionized than CO2. On the other hand, one may also speculate that higher CO2 concentration increases the probability of recombination of CO and O, quenching the reaction.
The formation of CO responds extremely fast to switching the plasma on, as can be seen in Figure 3, Figure 4 and Figure 5 and Figure 7, much faster than the CO2 response as will be discussed below. This is in line with the conclusion that CO formation is plasma controlled. In cases when CO2 concentration increase slowly in time (Figure 4 and Figure 5), it can be seen that the CO concentration follows, which is in line with the conclusion that the consecutive pathway R3 is dominant over R2.
3.2. Thermal Effect or Plasma Chemistry?
The decomposition rate at a fixed power depends on the total surface area, as can be observed from Figure 6. On the other hand, the decomposition rate remains constant within experimental error when varying the particles size and consequently the external surface area, as shown in Figure 8. Therefore, the external surface area has no influence on the rate of decomposition at any power. According to the Paschen law, typically plasma cannot exist in pores smaller than 6 µm, implying that any plasma chemistry on the surface of CaCO3 can exclusively contribute at the external surface of the particles. Recent work [56] revealed that penetration into relatively large pores is possible; however, the pores in CaCO3 are much smaller, the electrical field is two orders of magnitude lower compared to [56], and the calculated penetration depth is limited to 5 µm, which is much smaller than the particle size used. Therefore, it seems reasonable to assume that penetration of plasma in this study is negligible. As the external surface area has no significant effect, we conclude that R2 does not contribute. The enhancing effect of plasma power on the decomposition rate, as well as the observation that increasing the specific surface area increases the rate of decomposition (both in Figure 6), both suggest that plasma induced temperature increase is responsible for the increase in the decomposition rate. In fact, this is a result that can be expected operating with an Ar plasma because a chemical reaction between Ar ions and CaCO3 would not be expected. Work on DBD plasmas containing H2 and H2O is ongoing in which plasma induced chemical reactions are much more likely, in which we will use the methodology developed in this work.
Figure 11 shows the apparent temperature increase, as estimated based on the temperature that would be required to account for the increase in decomposition rate, based on the kinetics of the decomposition reaction [57]. Remarkably, all observations converge to a single line independent of both surface area and particle size. The order of magnitude of the temperature increase is quite similar to results reported in literature. Typical temperatures estimated in DBD plasmas range up to typically 200 K [17,23,41,42,43,44,45,46,47,48]. It should be noted that determination of the temperature is cumbersome, e.g., the temperature of the exiting gas provides only a minimum value because of rapid heat exchange between small reactors and environment, whereas infrared cameras and UV–Vis spectroscopy measurements have limited accuracy. Nevertheless, the order of magnitude agrees well with our observations. In short, although experimental details vary, a temperature increase of 50 °C due to 4 W plasma power input is concluded.
The temperature regulation of the oven played an important role in our study. It stabilized the temperature at a few millimeters outside the low voltage electrode at 630 °C. Therefore, any power input from the plasma will result in a decrease of the electrical power to the oven. Hence, the temperature effect of the plasma is actually larger than estimated above, in contrast to all experiments performed at room temperature without any kind of temperature control.
The conclusion that thermal effects are dominant is further supported by the fact that the typical response time of the decomposition rate is in the order of one minute for large particles and somewhat faster for small particles (Figure 4 and Figure 8d). The order of magnitude agrees well with the Fourier time of CaCO3 particles of the sizes used. In any case, the response times are longer than response times observed for CO formation, as discussed above, which is in line with the conclusion that decomposition is thermally controlled, whereas CO2 dissociation is obviously plasma controlled.
The conclusion is also reinforced by the fact that the sum of CO2 and CO concentrations obtained by decomposition of sample C at 630 °C and 3.2 W plasma power corresponds to the CO2 concentration obtained by decomposition at 680 °C (i.e., increasing the temperature of 50 °C as calculated in Figure 11) without plasma of the same sample, as observed by comparing Figure A3a and Figure A11 in Appendix A.
The proposed method is validated, since it enables to distinguish between thermal and plasma chemistry effect on the decomposition rate. This method is applicable to other systems in which a plasma is in contact with a fixed bed of porous particles, including supported catalysts. It should be noted that in general the increase in gas temperature in a DBD plasma cannot be neglected, as done frequently in many studies. Second, only the external surface of catalysts particles interacts with plasma: plasma–catalyst synergy is therefore maximal for nonporous catalytic materials. Further work is currently ongoing to apply this method for CaCO3 decomposition in more reactive plasma, e.g., H2 plasma, as well as for plasma catalytic conversions.
4. Materials and Methods
4.1. Plasma Reactor
Figure 12 shows a schematic representation of the equipment used to measure plasma enhanced decomposition of CaCO3. The fixed bed reactor is fed with either pure Ar, or a mixture of Ar containing 5% CO2. The temperature of the oven is controlled with a Euro-Therm controller with an accuracy of ±0.5 °C between room temperature and 1000 °C. The isothermal zone is 8 cm long at 900 °C, defined as the part of the reactor with less than ±1 °C temperature variation. A Quadrupole Mass Spectrometer (MS) measures the composition of the gas downstream of the reactor. The MS signal for CO2 (44 m/e) is calibrated between 0.16% and 5% CO2, resulting in a linear relationship as shown in Figure A14. The reactor is a 4 mm inner- and 6 mm outer diameter quartz tube. The inner electrode is a stainless-steel rod of 1 mm diameter placed coaxially in the center of the reactor section. The outer electrode is a 1 cm long stainless-steel tube with 6 mm inner diameter, enclosing a plasma zone of 0.035 cm3 in volume. The amount of CaCO3 sample was limited to 10.5 ± 0.3 mg in order to prevent CO2 concentrations approaching thermodynamic equilibrium, thus minimizing reabsorption of CO2. The 10 mg sample was mixed with 90 mg α-Al2O3, filling the plasma zone completely and preventing any bypassing. An AC voltage of up to 10 kV peak to peak was applied to the inner electrode with a frequency of 23.5 kHz using a PMV 500–4000 power supply, while the outer electrode is connected to the ground via a probe capacitor of capacity 4 nF. The power of the plasma was calculated using the Lissajous method by measuring the voltage on the inner electrode with a Tektronix P6015A high voltage probe and on the outer electrode with a TT–HV 250 voltage probe, as described in the literature [58]. A sample of Lissajous plot is shown in Figure A12 in Appendix B.
4.2. Calcium Oxides Preparation
Three different precursors have been used to synthesize calcium oxide, respectively (batch I) calcium L-ascorbate-di-hydrate (99%, Sigma-Aldrich, St. Louis, MO, USA), (batch II) calcium D-gluconate-monohydrate (99%, Alfa Aesar, Haverhill, MA, USA), and (batch III) calcium carbonate (99%, Sigma-Aldrich, St. Louis, MO, USA). The precursors were calcined in 20% O2 in N2 at atmospheric pressure, heating the sample to 900 °C (heating rate 15 °C/min), and keeping the temperature at 900 °C for 3 h. The calcined products were pelletized (pressure 160 bar), crushed and sieved in different particle size range: 250–300 µm, 100–125 µm, and 38–45 µm.
4.3. Carbonation
Five CaCO3 samples have been produced via carbonation of CaO. The oxide synthesized from calcium ascorbate (batch II) has been treated in situ with 5% CO2 in Ar at 630 °C for 4 h (heating rate 15 °C/min), the other two batches I and III were treated in a calcination oven with 20% CO2 in N2 at 630 °C for 5 h (heating rate 15 °C/min). The oxide synthesized from calcium carbonate (III) was consecutively sintered in pure CO2 at 900 °C for 24 h (heating rate 15 °C/min), as summarized in Table 1. The resulting three samples (A, B, and C) were crushed and sieved, obtaining particles sizes in the range between 250 and 300 μm. The material made from CaCO3 was also obtained with smaller particles, between 100 and 125 μm (sample D) and between 38 and 45 μm (sample E), respectively.
4.4. Characterization
The specific surface area, pore volume, and pore size distribution of the samples were measured both in CaO form as well as in CaCO3 form, after carbonation. The samples were first degassed at 300 °C in vacuum for 3 h. The surface area was calculated based on the BET isotherm for N2 adsorption at −196 °C in a Tristar 3000 analyzer (Micromeritics, Norcross, GA, USA). The pore size distribution was measured by Hg porosimetry. The chemical composition was determined with X-ray fluorescence analysis in a S8 Tiger (Bruker, Billerica, MA, USA).
4.5. Experimental Procedure
The carbonated samples (ex situ) were heated up in 5% CO2 in Ar to the temperature at which decomposition is to be measured, in order to prevent any premature decomposition. The decomposition reaction is initiated by switching the gas composition from 5% CO2 to pure Ar, at a constant flow rate of 30 mL/min. Isothermal decomposition experiments have been performed at different plasma powers by varying the applied voltage. The plasma power was varied during the experiment in case of low decomposition rates, allowing observations of steady state CO2 concentrations for each plasma power. In case CaCO3 is exhausted too fast, only one single power was applied. The rate of decomposition is calculated based on the sum of CO2 and CO concentrations in the exit of the reactor as measured with MS.
Sample C (Table 1, ex calcium carbonate, 250–300 μm) was measured by performing 20 carbonation-decomposition cycles. The sample was recarbonated, after a decomposition experiment, in the reactor (in situ) by CO2 absorption at 630 °C in 5% CO2 in Ar for 30 min in a constant flow of 90 mL/min. The carbonated samples were decomposed using a constant power plasma in the presence of a relatively low CO2 concentration in the feed, varied between 0 to 3200 ppm. During these 20 cycles, blank experiments were done every few cycles by decomposing in the absence of plasma, in order to ensure that the sample did not change in the course of the experiments.
Blank experiments were performed with 100mg of α-Al2O3 with particles size of 250 to 300 μm in the absence of any CaCO3, operating with low CO2 concentrations in the feed, i.e., 1000, 2000, and 3200 ppm. The plasma power was varied between 0 and 10 W and the responses of the CO and CO2 concentrations were measured with MS.
5. Conclusions
The effect of argon plasma on calcium carbonate decomposition was herein assessed by means of a comparative method which allowed us to distinguish between thermal effects and plasma chemistry, based on reaction rates and dynamics. It represents a systematic method to distinguish between thermal effects versus plasma chemistry effect in fixed DBD plasma applications. Application of a DBD Ar plasma causes two effects when decomposing CaCO3.
First, the rate of CaCO3 decomposition increases. We conclude that this effect is purely a thermal effect, based on the fact that the rate of decomposition is enhanced when the total surface area is increased, whereas the external surface area has no influence. If the contact of plasma with CaCO3 would dominate, the opposite would be expected. Furthermore, the dynamics of CaCO3 decomposition follow the dynamics of heat transfer in CaCO3 particles.
Second, plasma induces formation of CO. We conclude that this occurs via decomposition of CO2 in the gas phase, based on the observation that the rate of CO formation is ruled by the CO2 concentration as well as the observation that dynamic changes are very fast, as expected for plasma effect.
Author Contributions
Conceptualization, G.G., L.L., and G. van R.; Methodology, G.G. and L.L.; Validation, G.G., L.L., and G. van R.; Formal Analysis, G.G. and L.L.; Investigation, G.G. and L.L.; Resources, L.L.; Data Curation, G.G. and L.L.; Writing—Original Draft Preparation, G.G.; Writing—Review and Editing, G.G. and L.L.; Supervision, L.L. Project Administration, G.G. and L.L.; Funding Acquisition, L.L.
Funding
This work was supported by Netherlands Organization for Scientific Research (NWO).
Acknowledgments
We acknowledge Bert Geerdink, Karin Altena-Schildkamp, and Tom Velthuizen for Technical assistance; Tom Butterworth and Floran Peeters from DIFFER for the fruitful discussions and help in understanding; Tesfaye Belete and Micheal Gleeson from DIFFER also for their fruitful discussions and critical feedback; and Vera Meyner, the technical staff of the department of Chemistry of University of Antwerp, and Frank Morssinkhof for the continuous help in material characterization.
Conflicts of Interest
The authors declare no conflict0s of interest.
Appendix A
Appendix A.1. Decomposition in Argon Plasma of All the Samples
Figure A1, Figure A2, Figure A3, Figure A4 and Figure A5 show the results of all the CaCO3 decomposition experiments on samples A–E, respectively, in presence of plasma and without recycling. The results with power higher than 6 W and further than the second step of power have been rejected due to exhaustion.
Figure A1.
Concentration of the products of CaCO3 decomposition (sample A) as function of time at 630 °C in pure argon and flow rate of 30 mL/min. Plasma power is 0.3, 1.4, and 8.4 W (a); 1.4, 3.5, and 6.4 W (b); 5.1 W (c); 3.9 W (d); 2.2 W (e); and 3.7 W (f). Plasma is turned on after 2 min and changed every 2 min (a,b), after 1.5 min (c), or at the beginning of the decomposition (d–f).
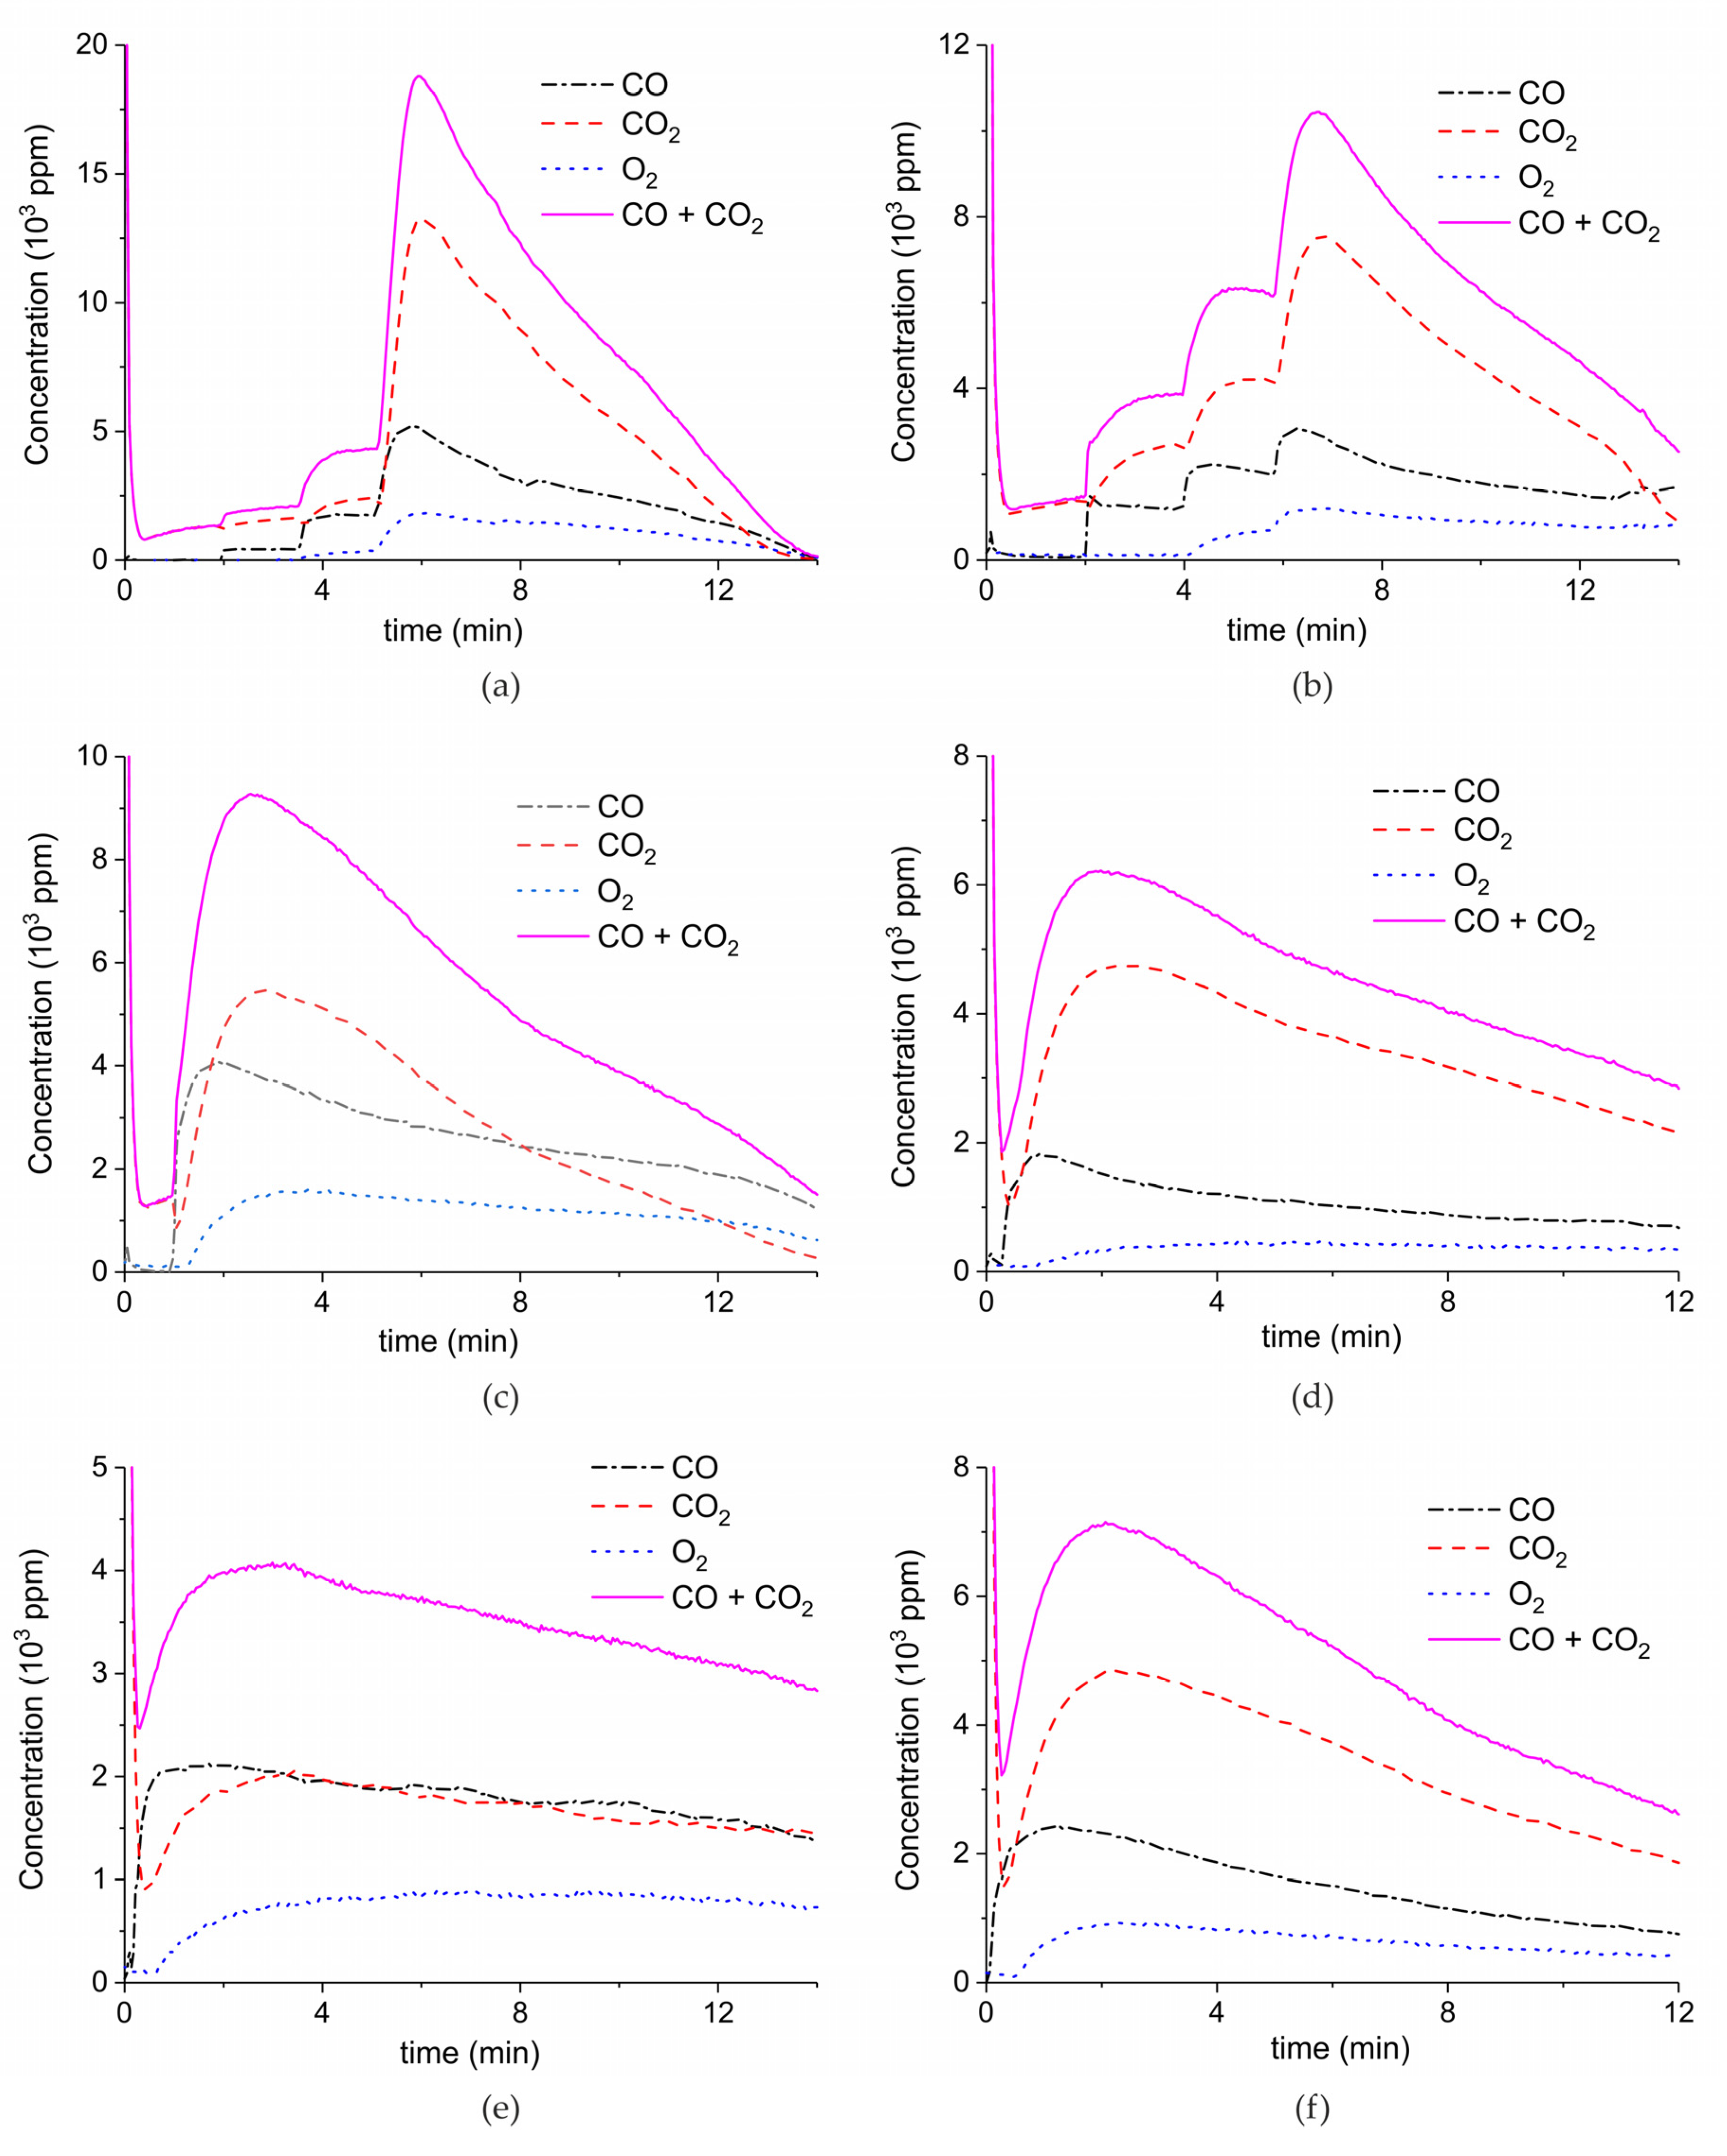
Figure A2.
Concentration of the products of CaCO3 decomposition (sample B) as function of time at 630°C in pure argon and flow rate of 30 mL/min. Plasma power is 1, 4.1, and 5.8 W (a); 0.5, 2.1, and 8.5 W (b); and 2.1 W (c,d). Plasma is turned on after 2 min and changed every 2 min (a,b) or at the beginning of the decomposition (c,d).
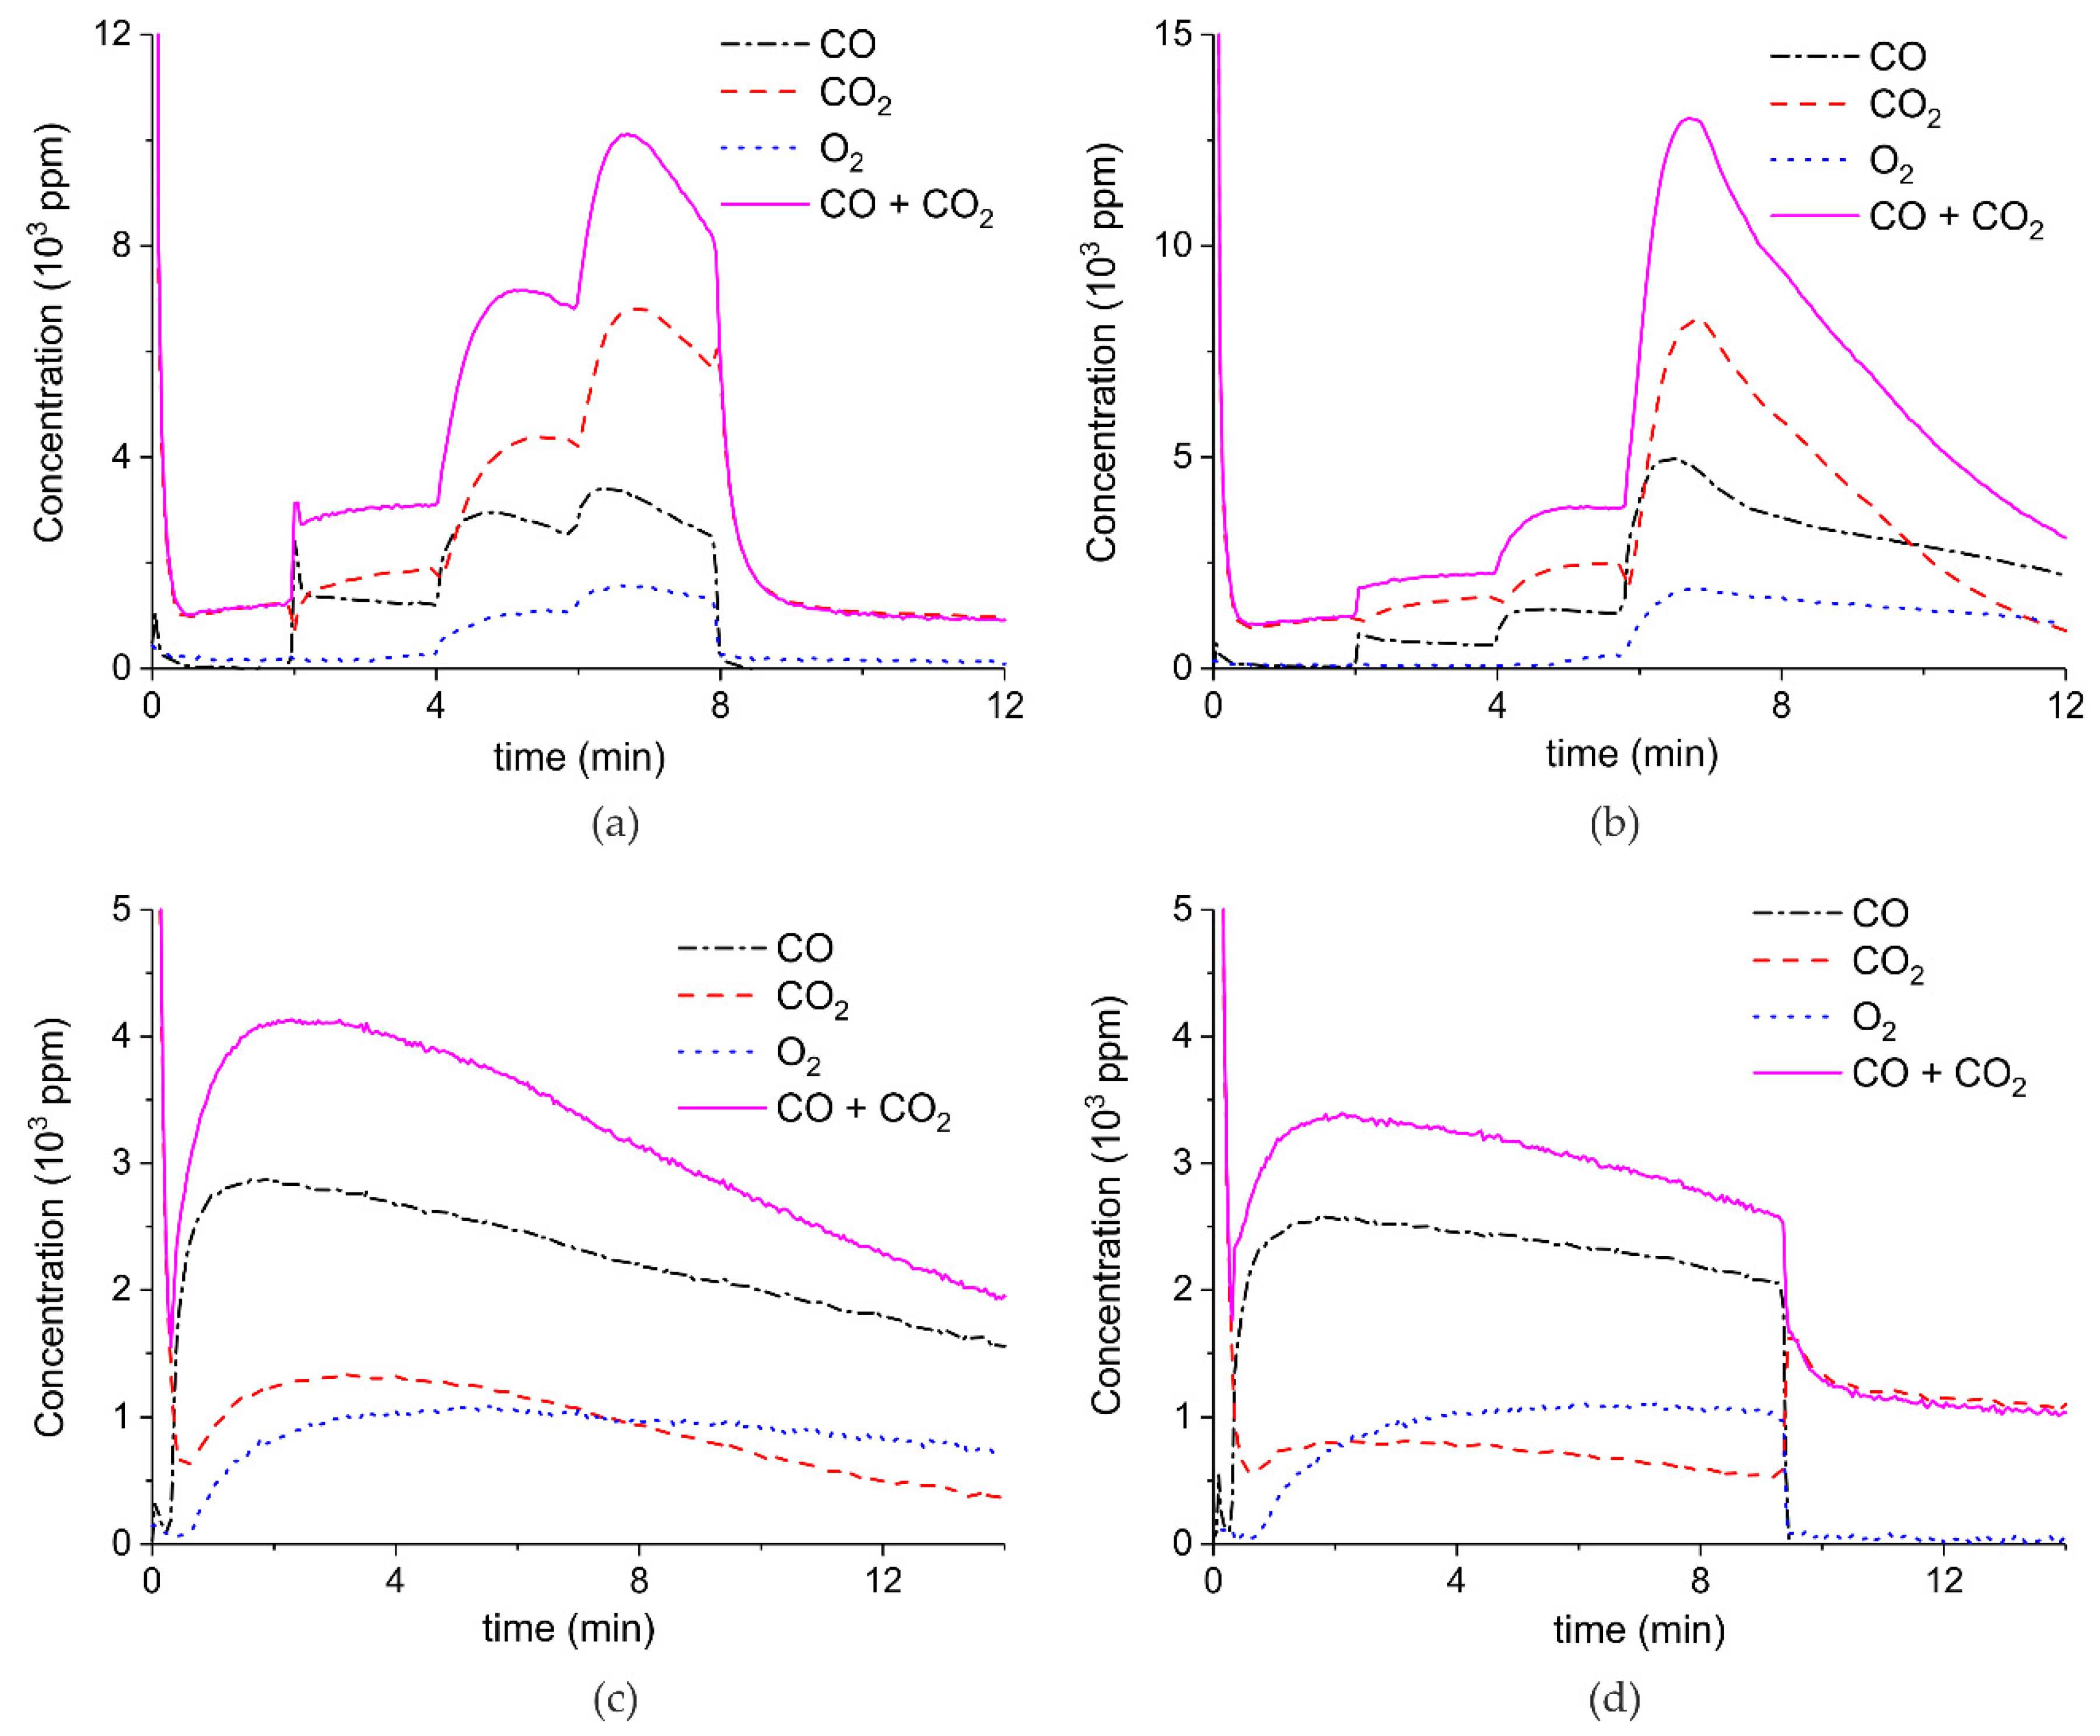
Figure A3.
Concentration of the products of CaCO3 decomposition (sample C) as function of time at 630 °C in pure argon and flow rate of 30 mL/min. Plasma power is 0.4, 3.2, and 9.6 W (a); 4.4 W (b); and 2.1 W (c,d). Plasma is turned on after 2 min and changed every 2 min (a) or at the beginning of the decomposition (b,c) or after 1.5 min (d).
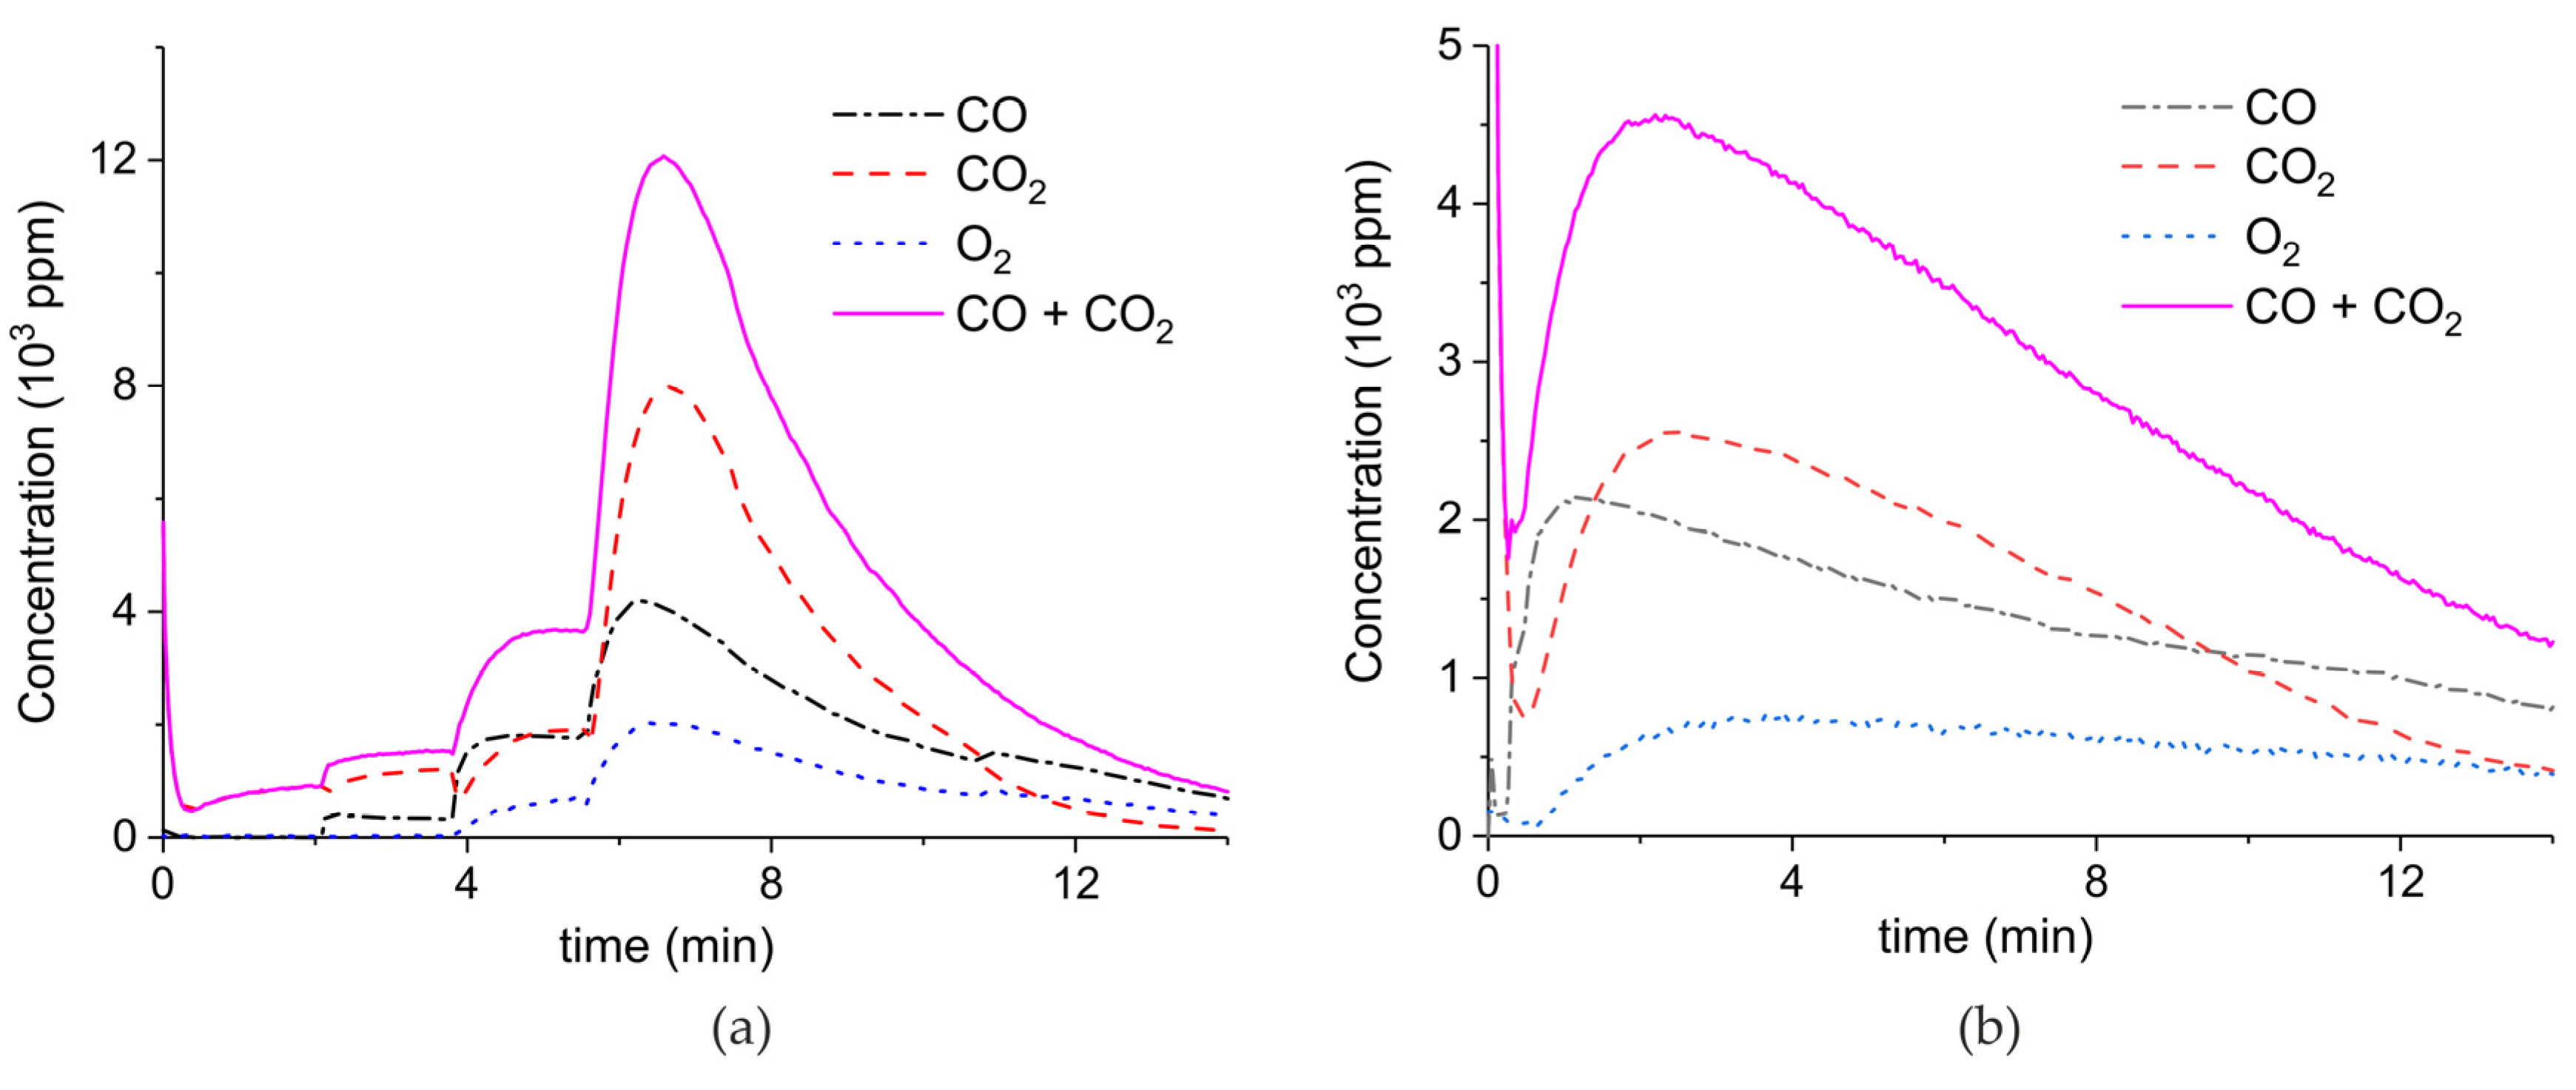
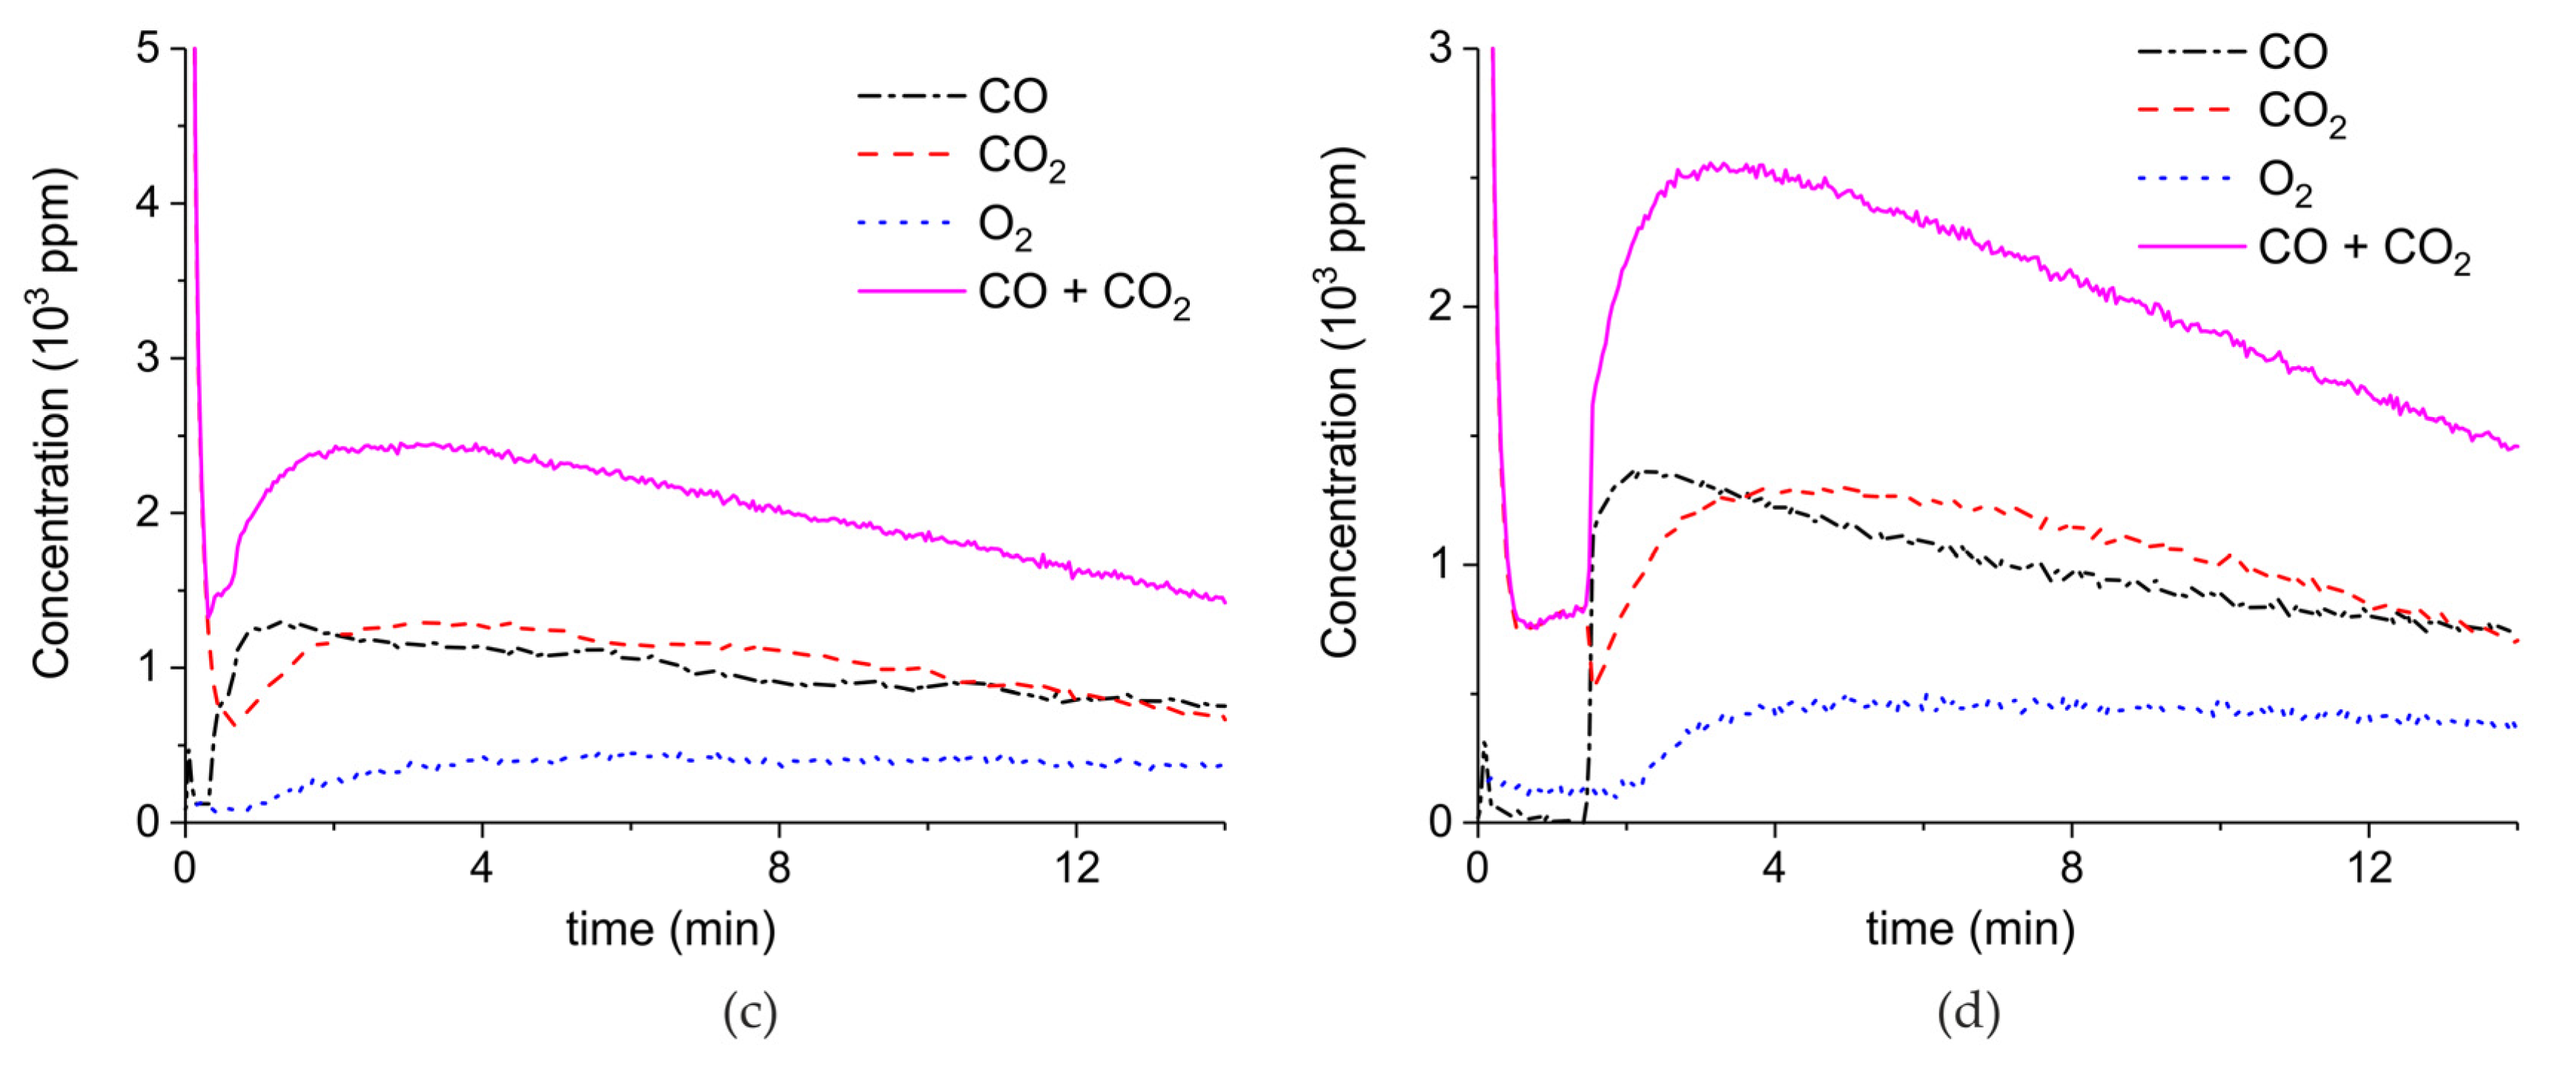
Figure A4.
Concentration of the products of CaCO3 decomposition (sample D) as function of time at 630 °C in pure argon and flow rate of 30 mL/min. Plasma power is 0.2, 2.3, and 8.1 W (a) and 1.3 W (b). Plasma is turned on after 2 min and changed every 2 min (a) or after 1.5 min (b).
Figure A4.
Concentration of the products of CaCO3 decomposition (sample D) as function of time at 630 °C in pure argon and flow rate of 30 mL/min. Plasma power is 0.2, 2.3, and 8.1 W (a) and 1.3 W (b). Plasma is turned on after 2 min and changed every 2 min (a) or after 1.5 min (b).

Figure A5.
Concentration of the products of CaCO3 decomposition (sample E) as function of time at 630 °C in pure argon and flow rate of 30 mL/min. Plasma power is 4.4, 1, 4.9, and 1 W (a) and 1.7 W (b). Plasma is turned on after 2 min and changed every 2 min (a) or after 1.5 min (b).
Figure A5.
Concentration of the products of CaCO3 decomposition (sample E) as function of time at 630 °C in pure argon and flow rate of 30 mL/min. Plasma power is 4.4, 1, 4.9, and 1 W (a) and 1.7 W (b). Plasma is turned on after 2 min and changed every 2 min (a) or after 1.5 min (b).
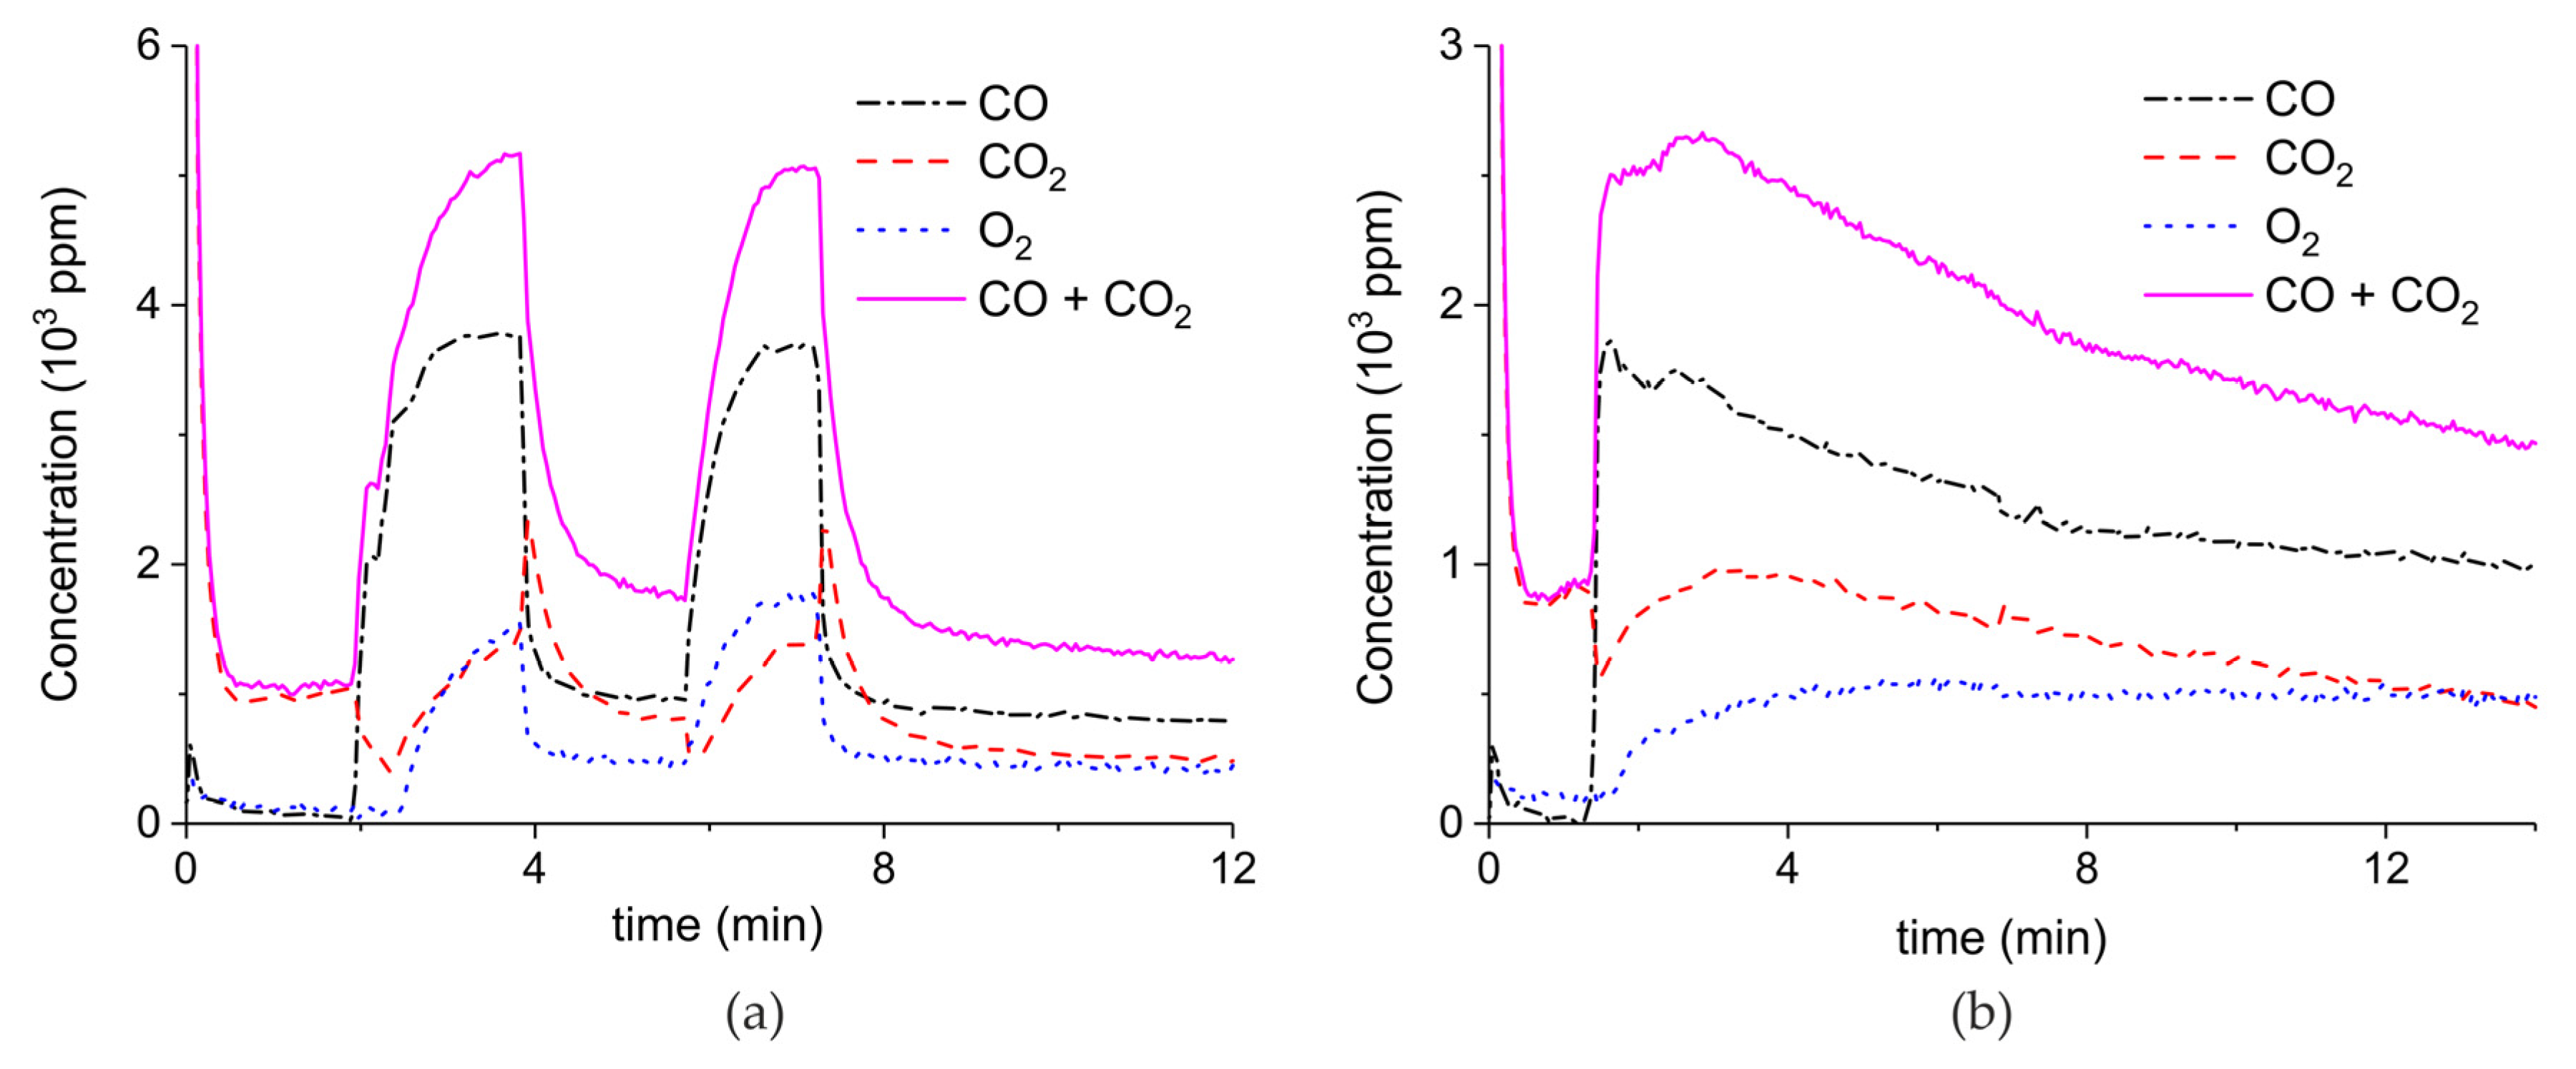
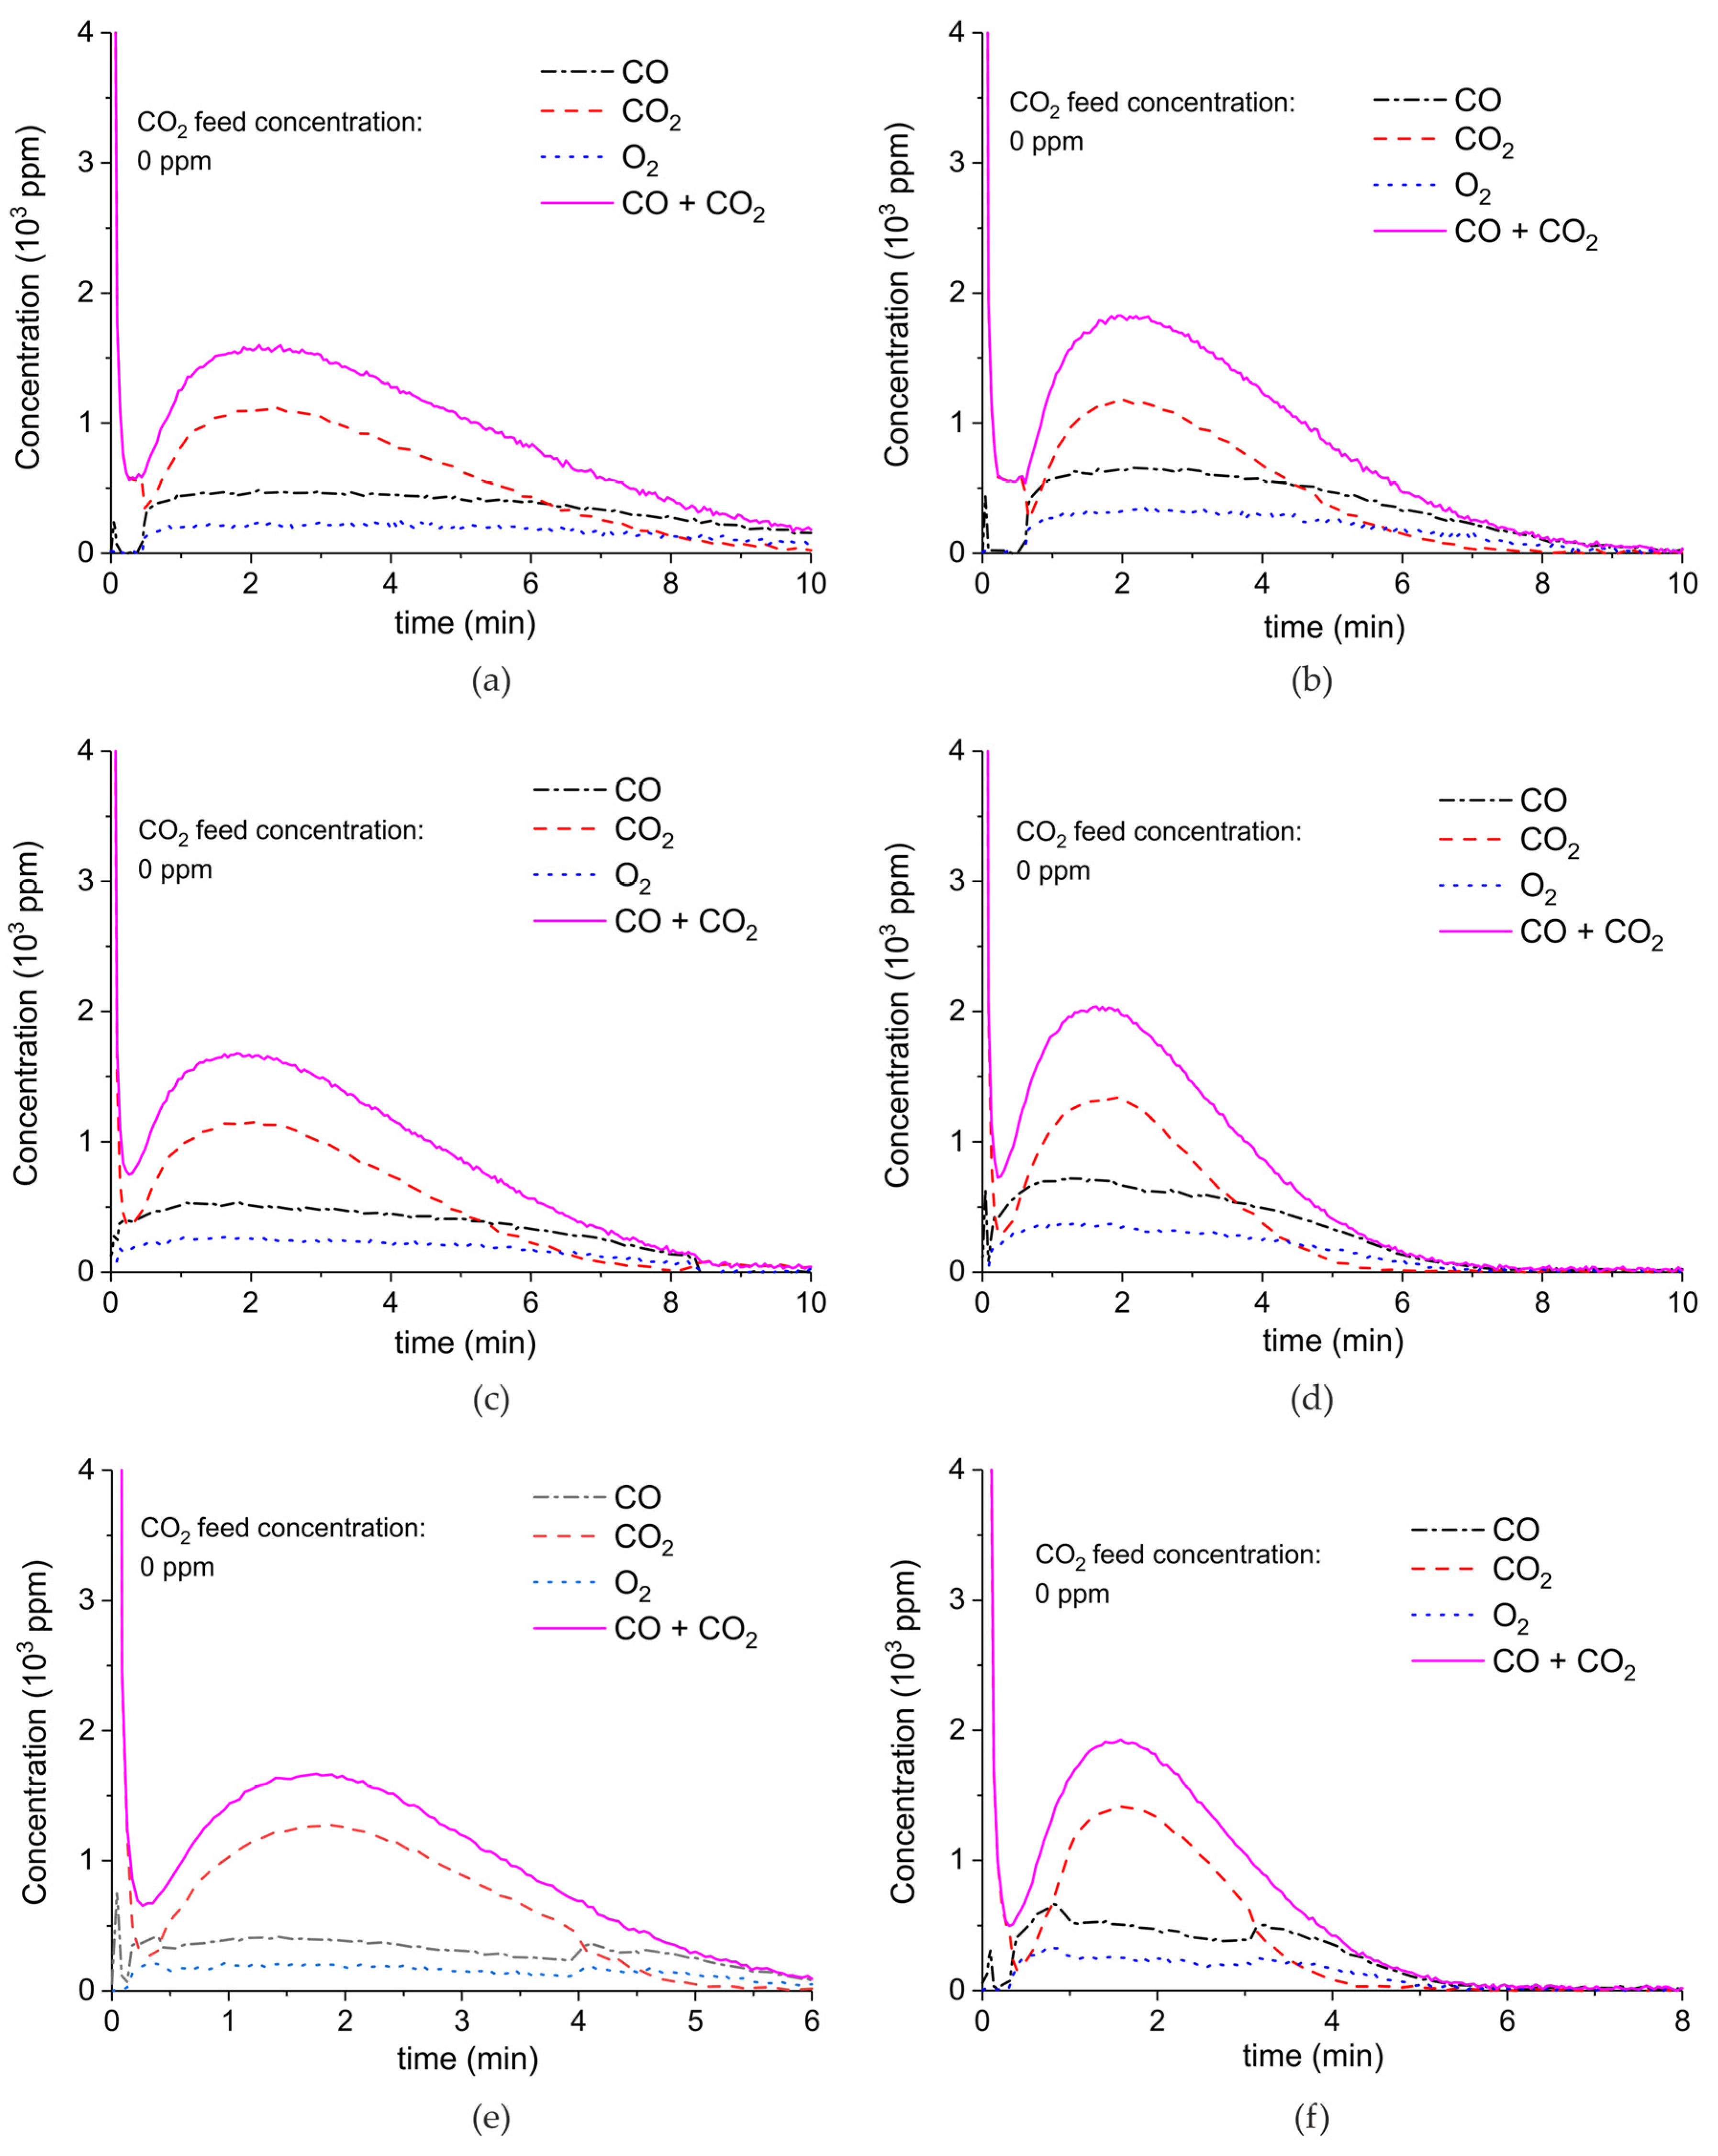
Figure A6, Figure A7, Figure A8 and Figure A9 show the results of all the CaCO3 decomposition experiments on sample C in presence of plasma when the sample is recycled 20 times, including experiments with extra CO2 added.
Figure A6.
Concentration of the products of CaCO3 decomposition (sample C) as function of time at 630 °C, flow rate of 90 mL/min. The fed CO2 concentration is 0 ppm and the plasma power is 1.5 W (a), 2.1 W (b), 1.7 W (c), 2.2 W (d), 1.5 W (e), 2 W (f), and 1.1 W (g). The plasma is applied at the beginning of the reaction. The decomposition cycles are in order #2, #3, #7, #8, #10, #11, #19.

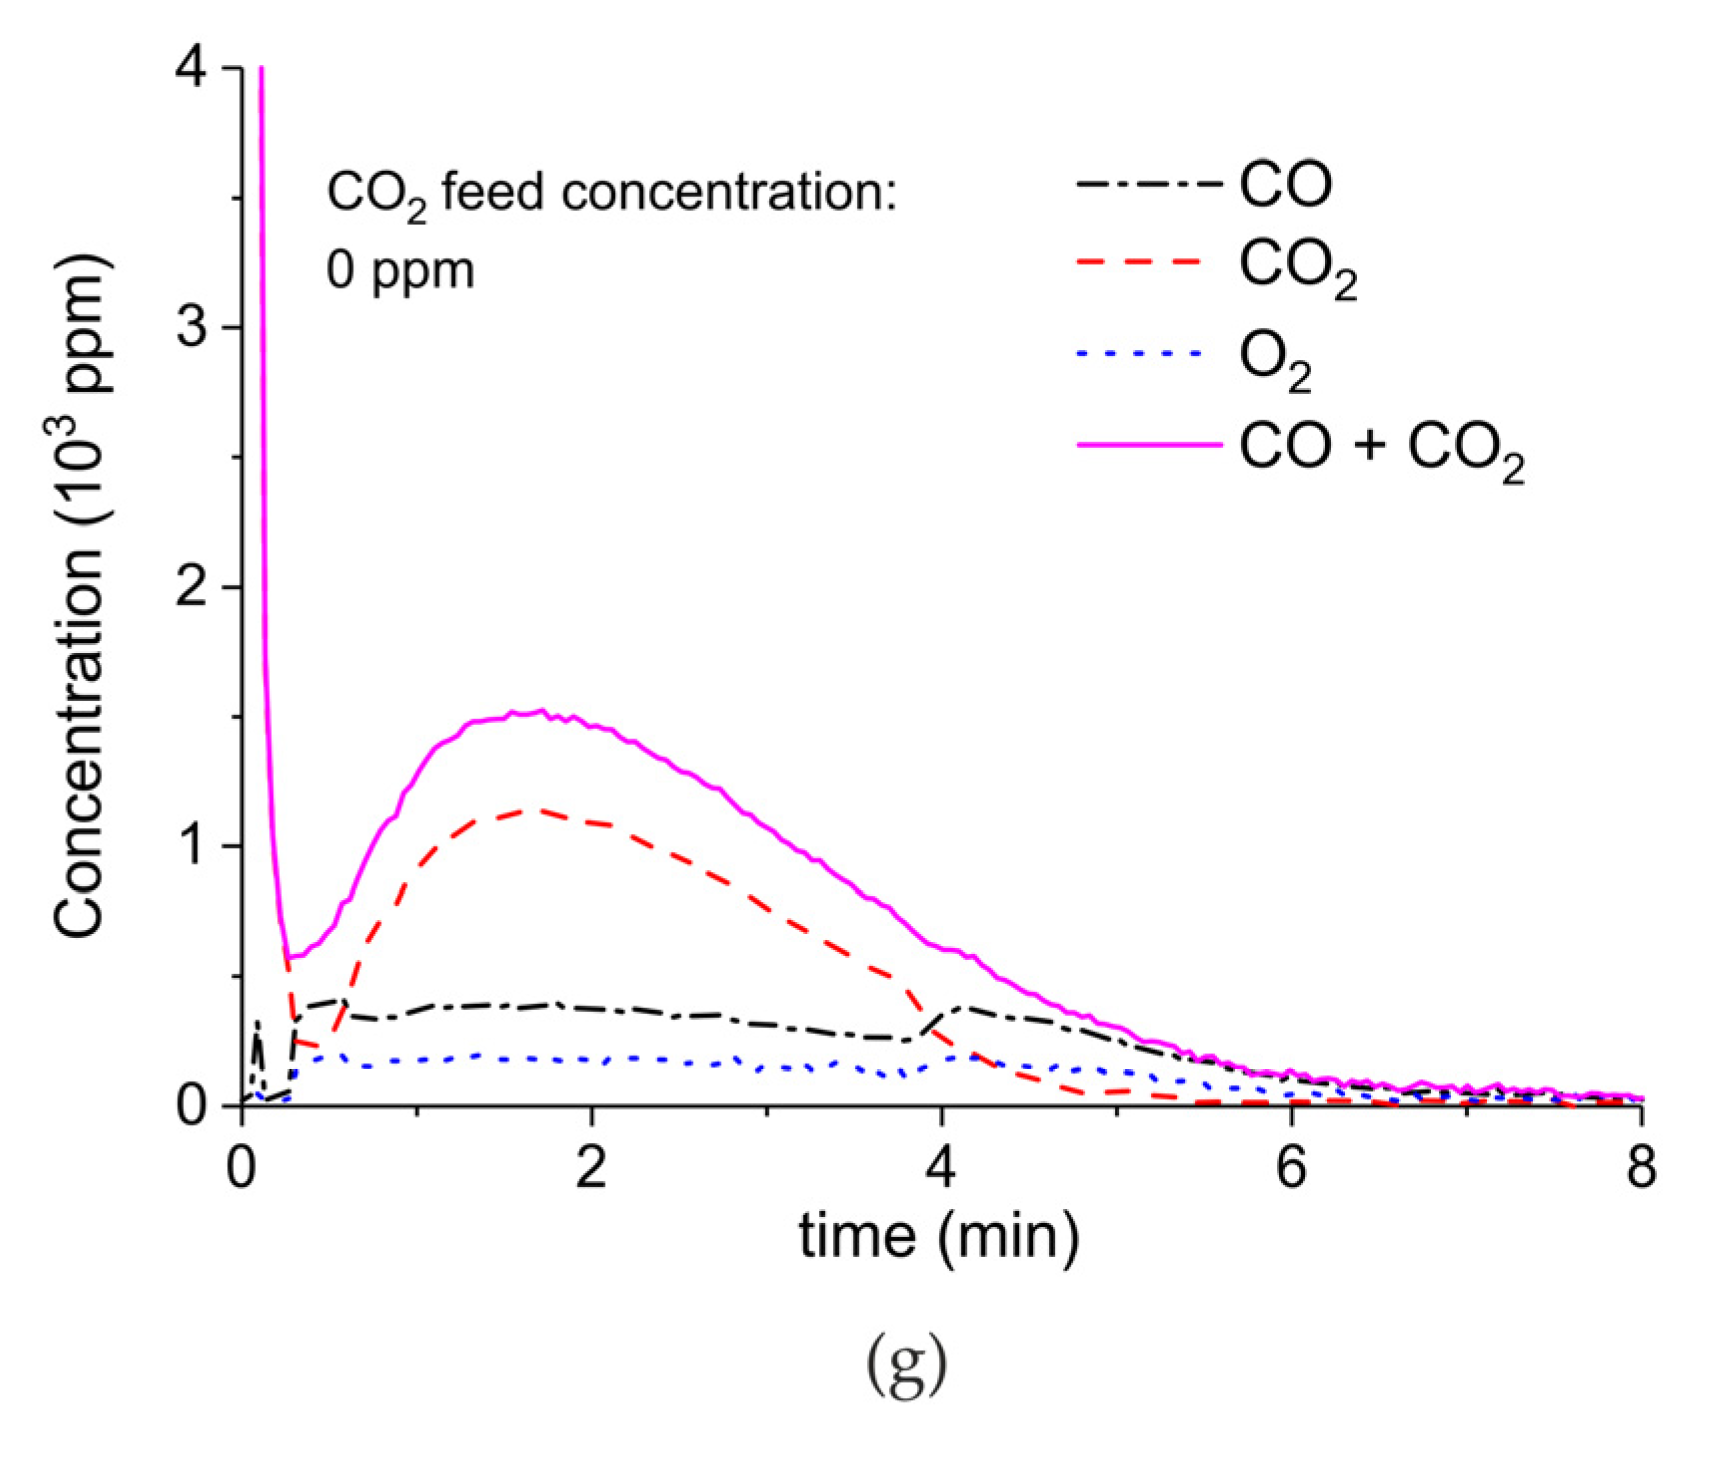
Figure A7.
Concentration of the products of CaCO3 decomposition (sample C) as function of time at 630 °C, flow rate of 90 mL/min. The fed CO2 concentration is 1000 ppm and the plasma power is 1.3 W (a) and 1.5 W (b). The plasma is applied at the beginning of the reaction. The decomposition cycles are in order #20, #21.
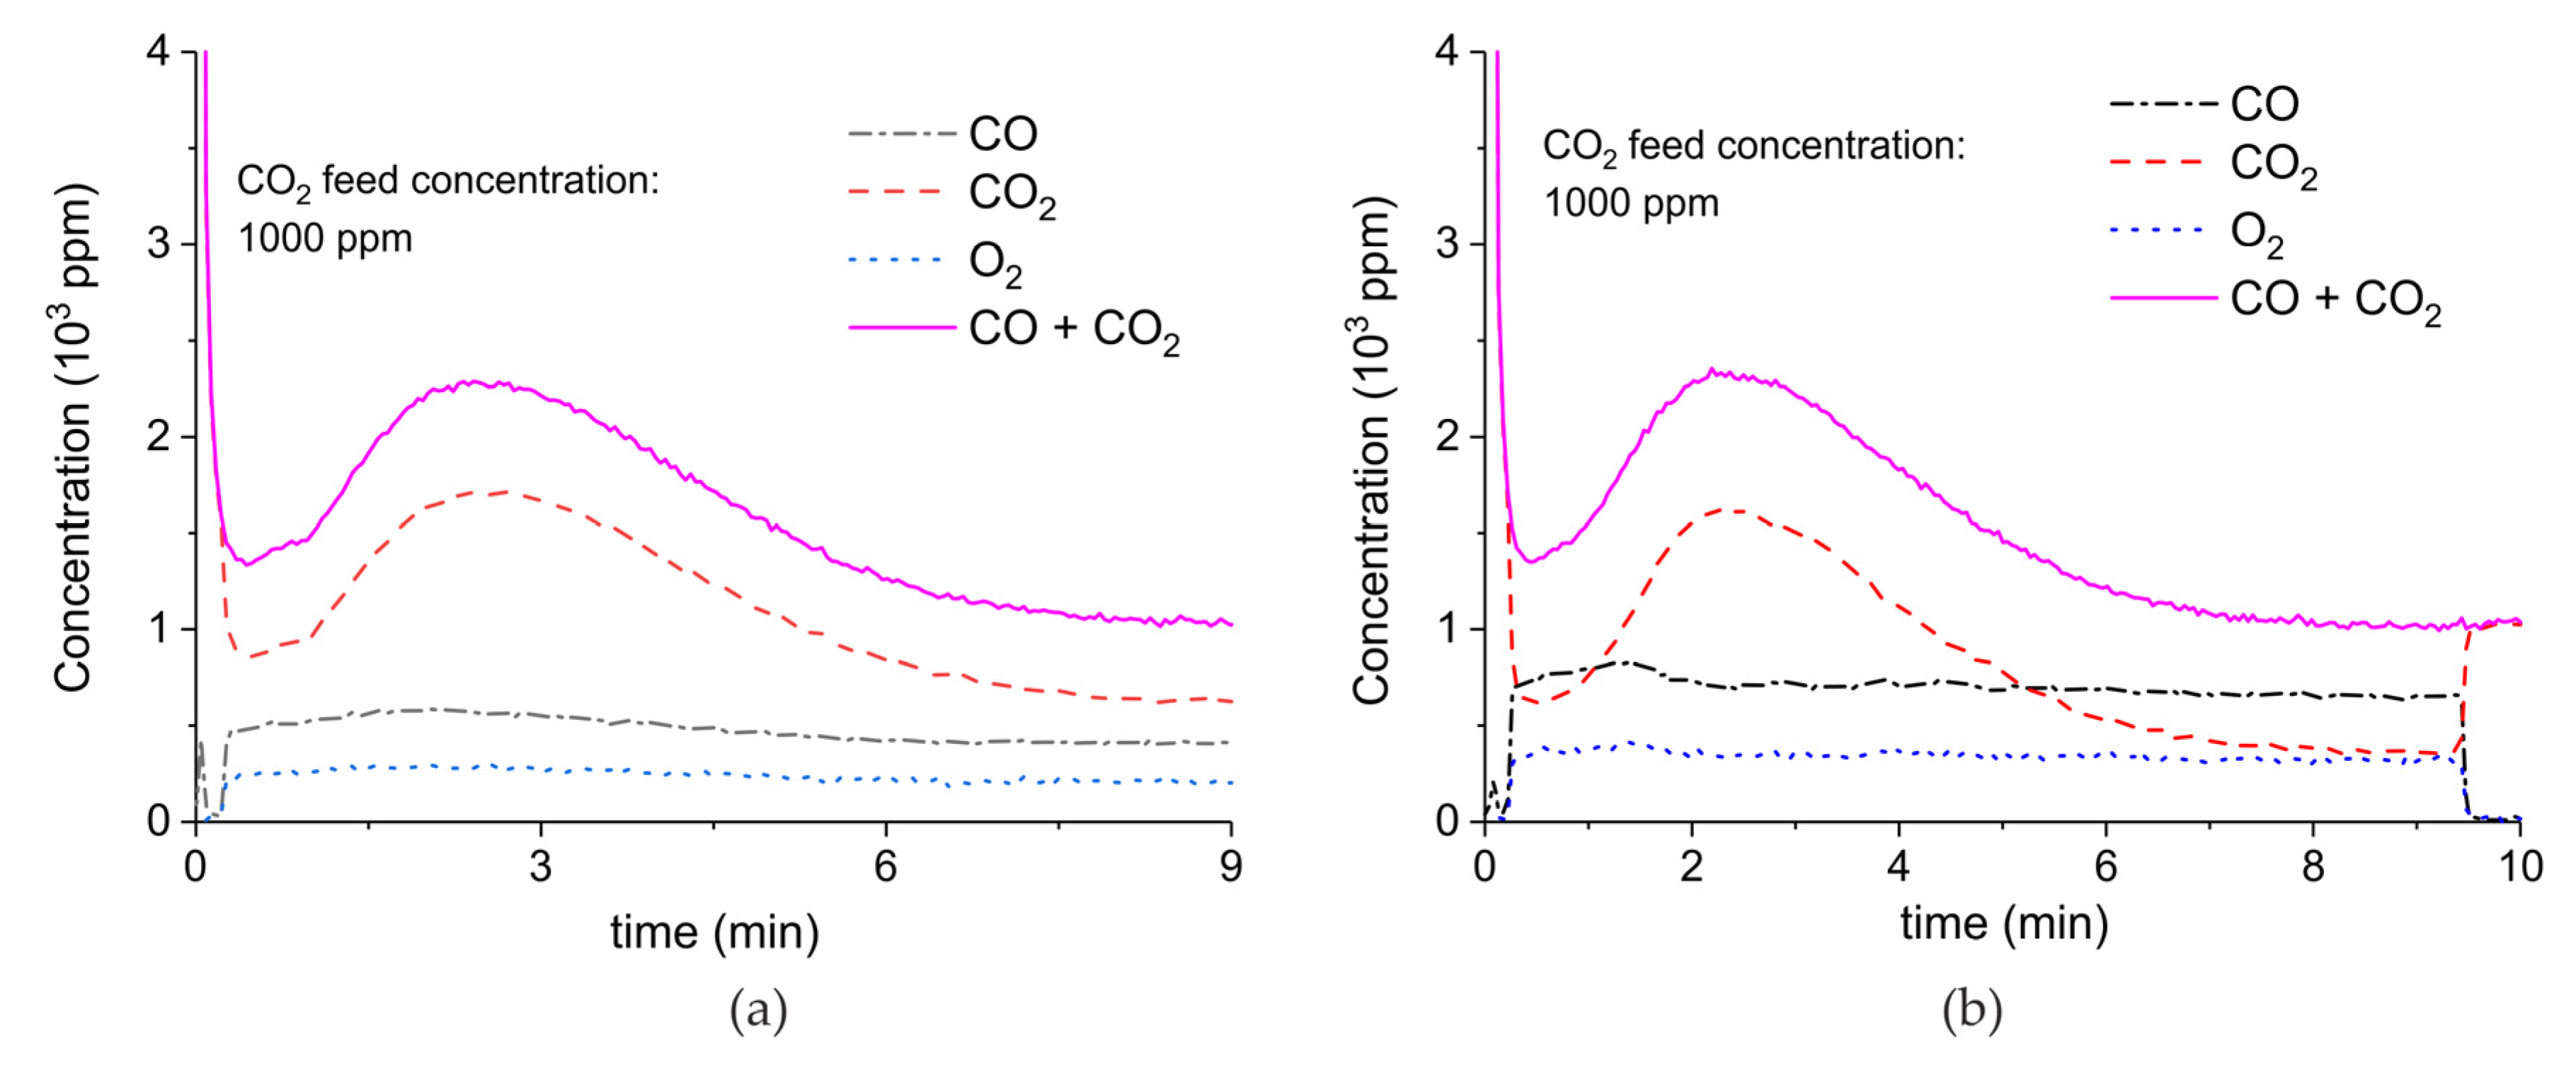
Figure A8.
Concentration of the products of CaCO3 decomposition (sample C) as function of time at 630 °C, flow rate of 90 mL/min. The fed CO2 concentration is 2000 ppm and the plasma power is 1.4 W (a) and 1.9 W (b). The plasma is applied at the beginning of the reaction. The decomposition cycles are in order #13, #14.

Figure A9.
Concentration of the products of CaCO3 decomposition (sample C) as function of time at 630 °C, flow rate of 90 mL/min. The fed CO2 concentration is 3200 ppm and the plasma power is 1.4 W (a) and 1.5 W (b). The plasma is applied at the beginning of the reaction. The decomposition cycles are in order #16, #17.
Appendix A.2. CO2 Dissociation with Only α-Al2O3
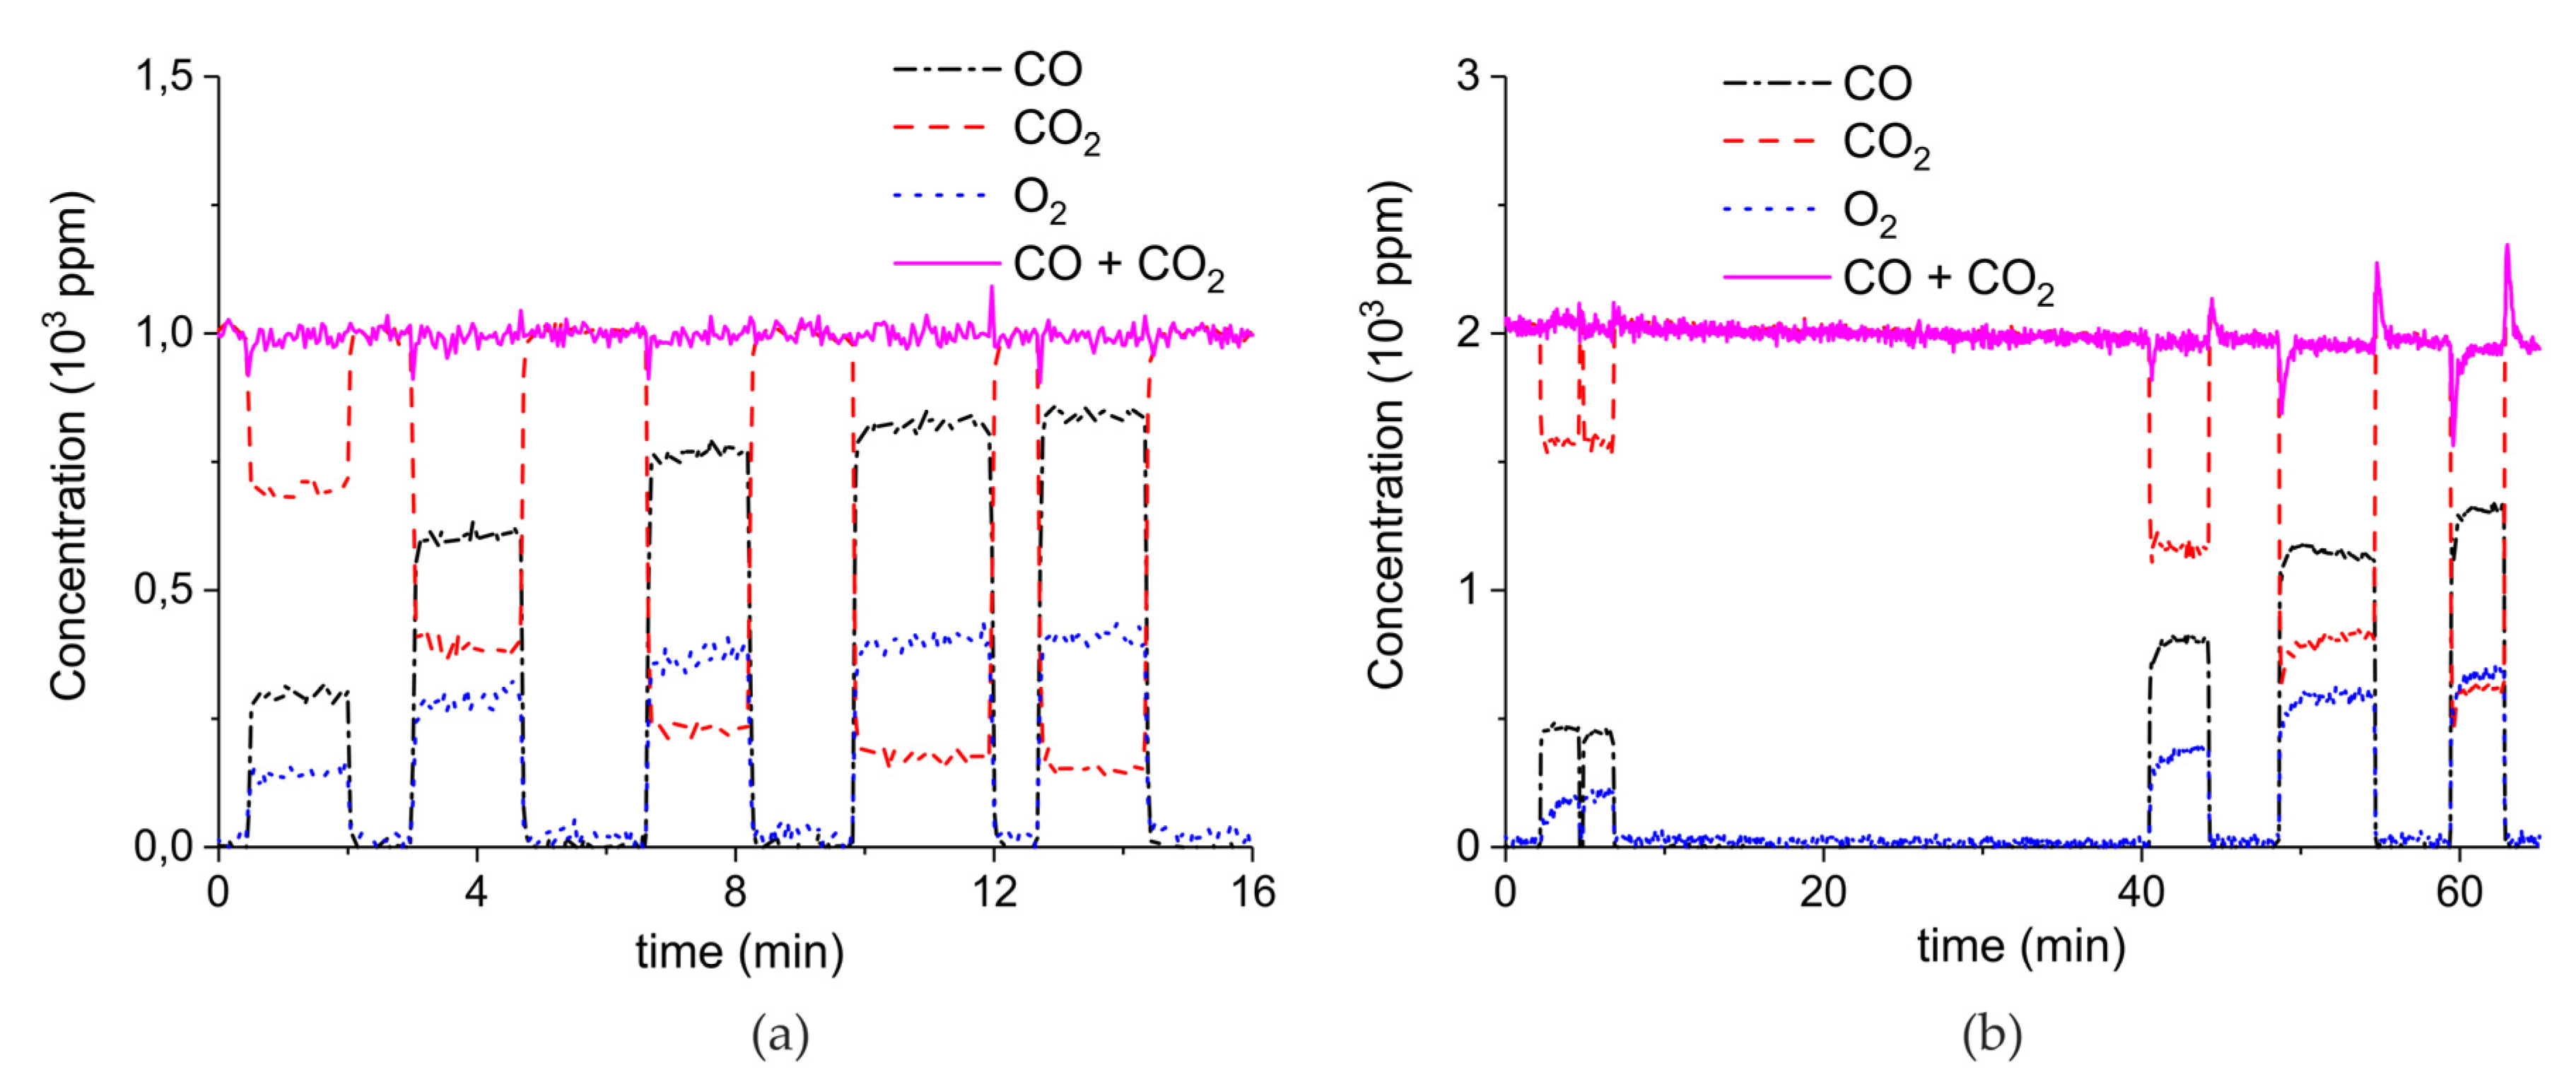
Figure A10 shows the result of CO2 dissociation experiments on a sample consisting of 100 mg α-Al2O3 with particle size of 250–300 μm. The applied gas composition is respectively 1000 ppm (Figure A10a), 2000 ppm (Figure A10b), and 3200 ppm (Figure A10c) in Argon. The CO concentrations at 1.5 W plasma power are obtained by interpolation and showed in Figure 11.
Figure A10.
Concentration of the products of CO2 dissociation on 100mg α-Al2O3, particle size of 250–300 μm, as function of time at 630 °C, flow rate of 90 mL/min. The fed CO2 concentration is 1000ppm (a), 2000ppm (b), and 3200ppm (c); the plasma powers are 0.6, 1.6, 3.1, 4.8, and 7.2 W (a); 0.7, 1.8, 4.1, and 5.6 W (b); and 0.5, 1.5, 3.1, and 4.9 W (c). The plasma is applied for a few minutes and then turned off.

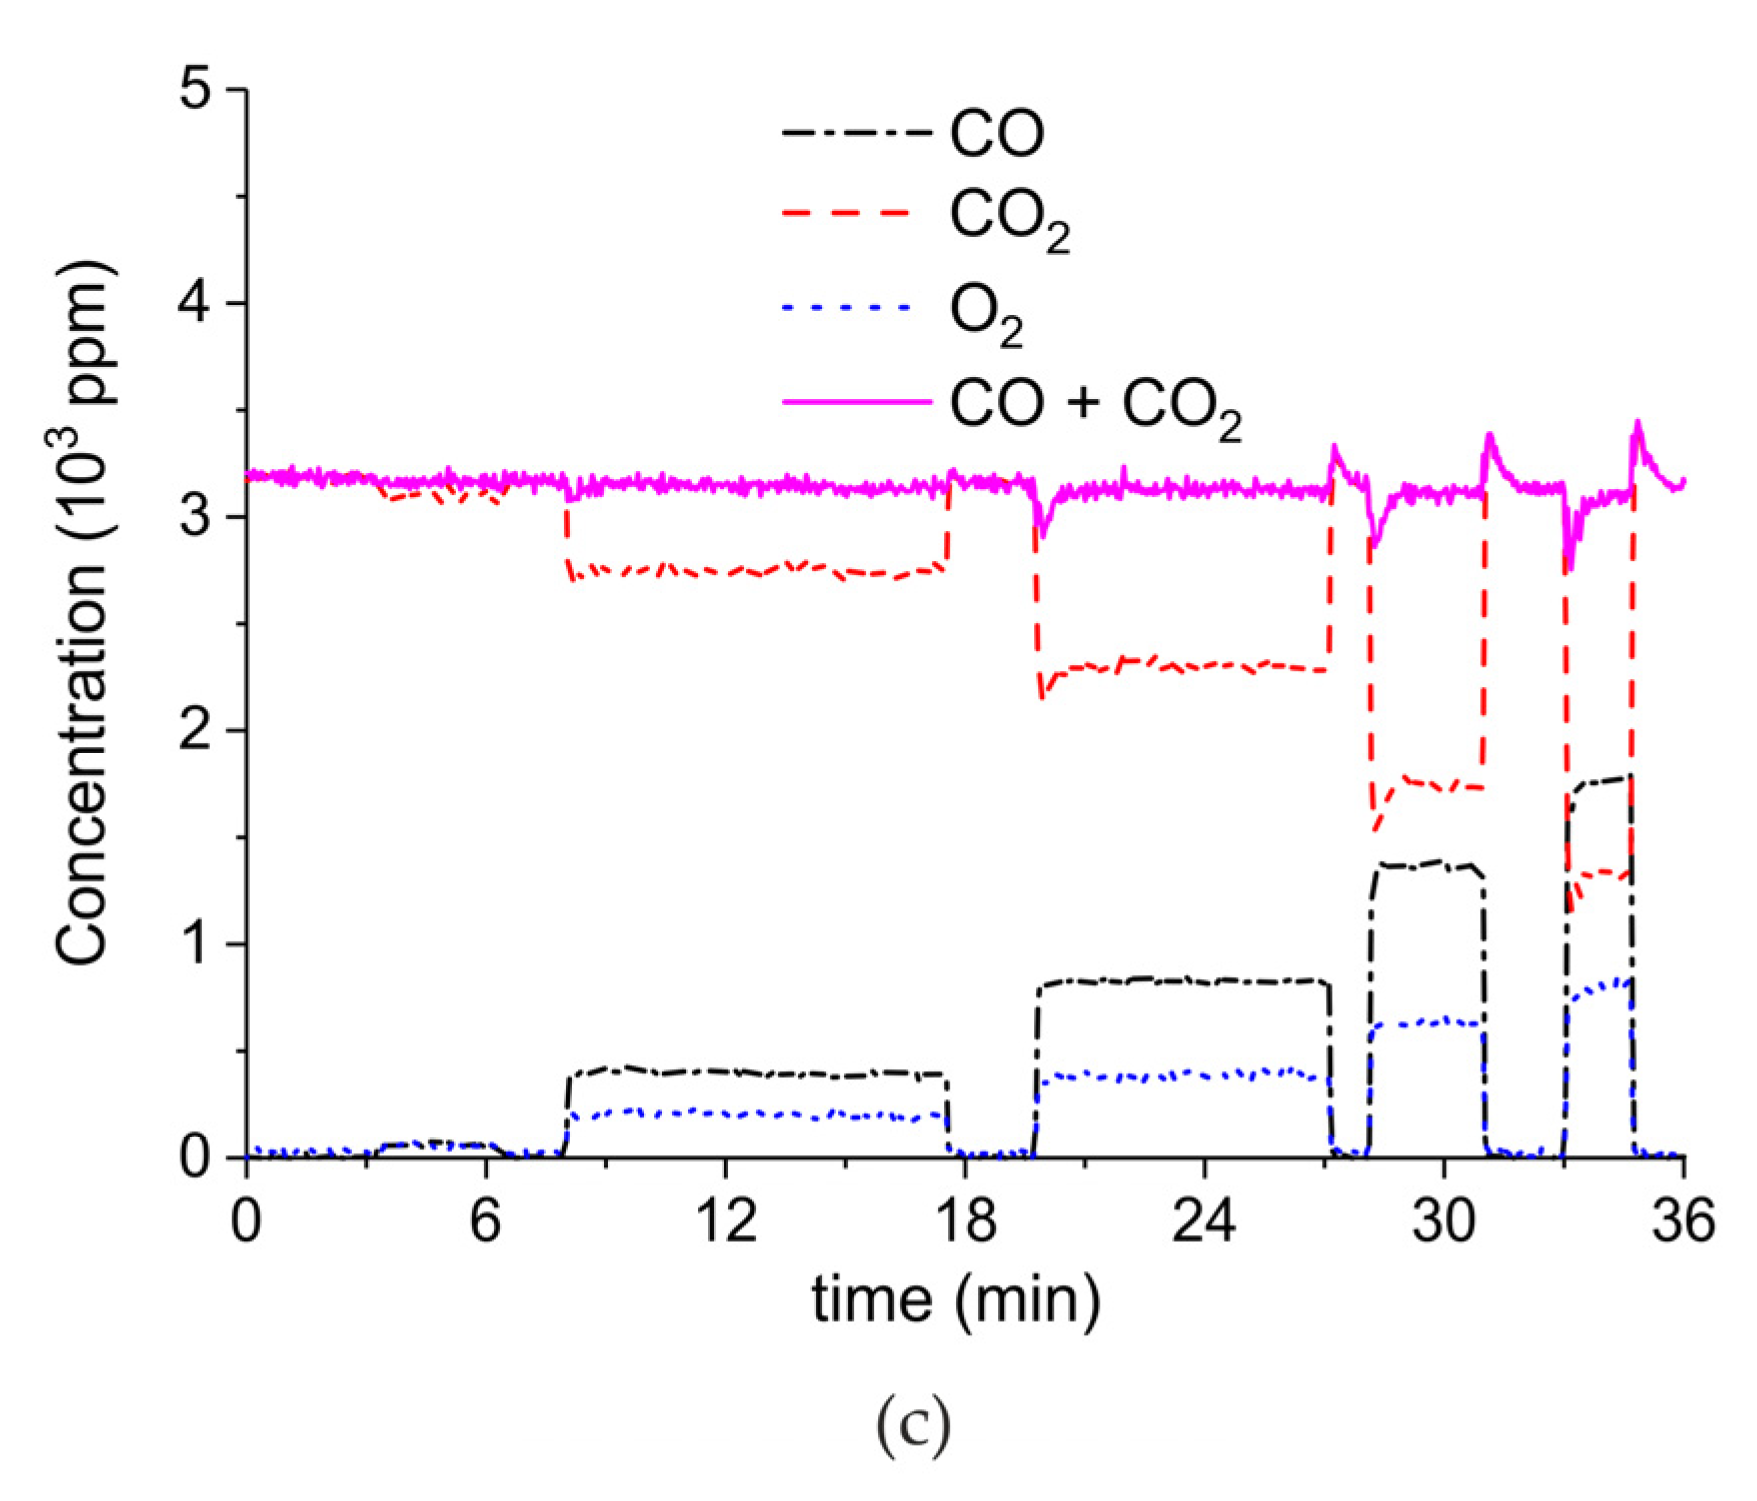
Figure A11 shows the result of a CaCO3 decomposition experiment at 680 °C without plasma on sample C. It is observed that the CO2 concentration at the steady state corresponds within the error margins to the sum of CO and CO2 concentrations during decomposition at 630 °C with 3.2 W plasma power, shown in Figure A3a. The comparison supports the estimation of a 50 °C increase for 3.2 W, as shown in Figure 11.
Figure A11.
Concentration of CO2 during CaCO3 decomposition (sample C) as function of time at 680 °C and a flow rate of 30 mL/min.
Figure A11.
Concentration of CO2 during CaCO3 decomposition (sample C) as function of time at 680 °C and a flow rate of 30 mL/min.

Appendix B
Appendix B.1. Determination of Plasma Power
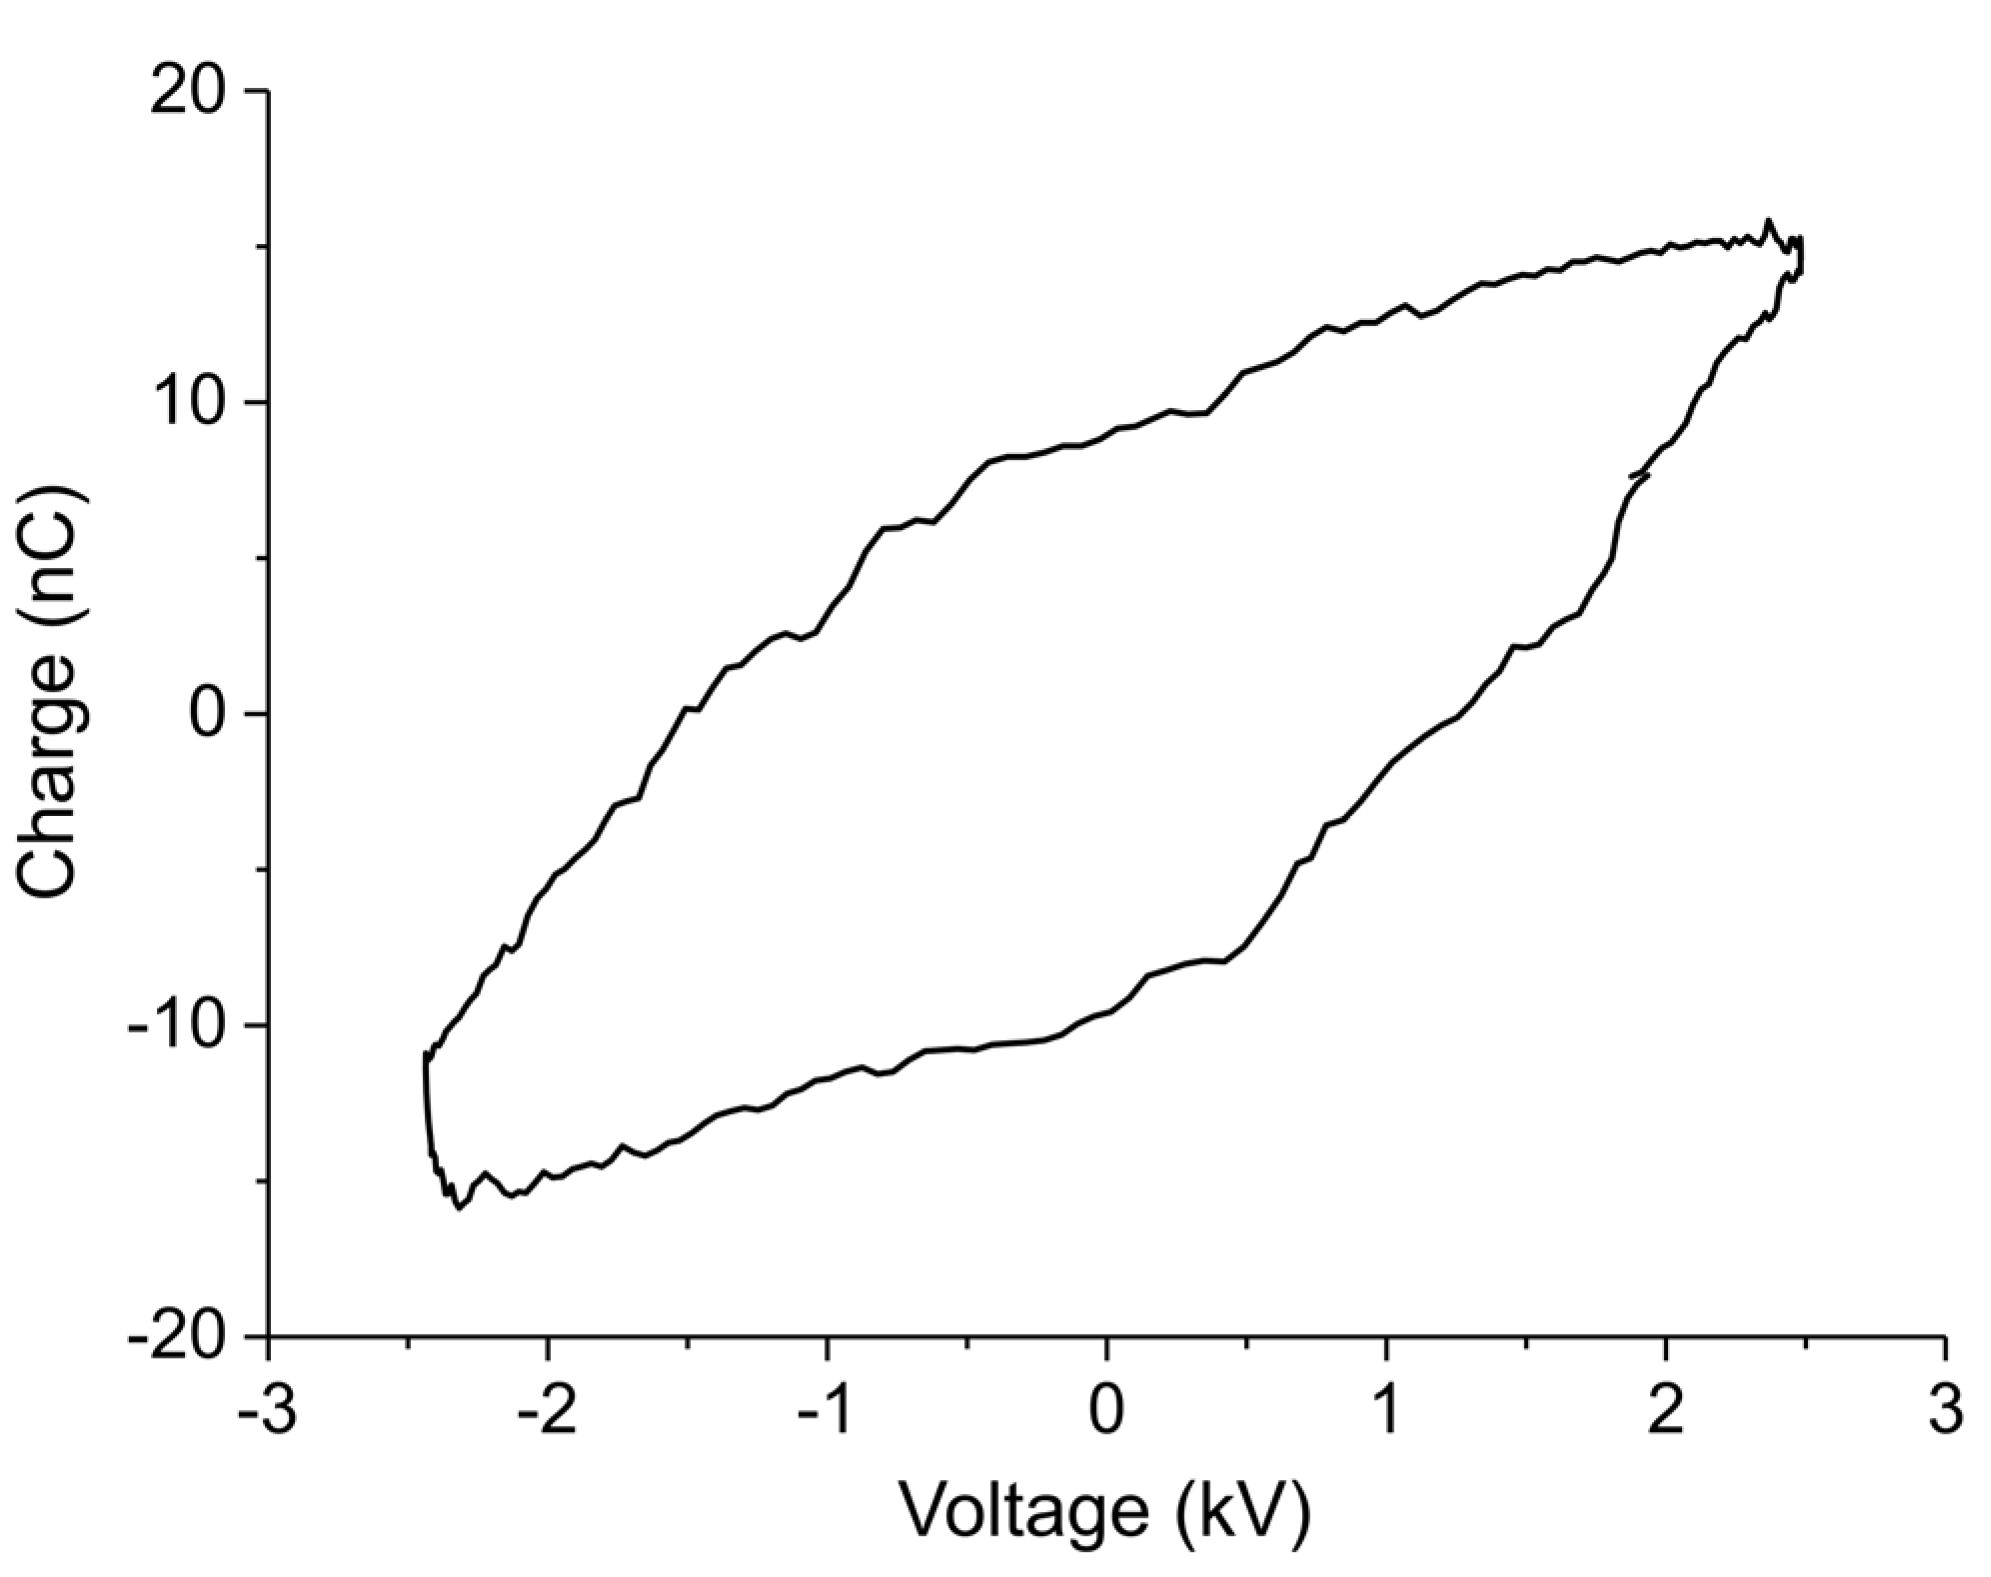
The Lissajous plot measured during decomposition of sample C in Ar with 3200 ppm extra CO2 and plasma power 1.5 W, indicating plasma charge as function of voltage for one cycle, is shown in Figure A12. The hysteresis has a shape of parallelogram, indicating that a plasma is generated inside the reactor. The slopes of the two sides indicate respectively a cell capacity of 2.8 pF with plasma off and an effective capacity of 8 pF corresponding to the dielectric capacity and indicating that the plasma occupies the whole empty volume within the electrodes. The power of the plasma is calculated based on the area of the parallelogram:
Figure A12.
Lissajous plot of 1.5 W plasma applied on the CaCO3 and Al2O3 mixture with 3200 ppm of CO2 in Ar.
Figure A12.
Lissajous plot of 1.5 W plasma applied on the CaCO3 and Al2O3 mixture with 3200 ppm of CO2 in Ar.
Appendix B.2. Method
The assumptions made in order to evaluate the argon plasma effect on calcium carbonate decomposition are the following:
- According to the Paschen’s Law the electron filaments and active species cannot exist inside the pores of the carbonate particles, this is explained in the following paragraph.
- Temperature gradients between particles outer surface and inner core are minimized within much smaller times than the duration of the experiment, i.e., within 2 min, according to the Fourier time calculated in the specific case.
Figure A13 shows the voltage needed to generate a plasma as function of the distance between the charges at an argon pressure of 1 atm, where the parameters A, B, and γ are determined experimentally [59]. The physical mechanism can be explained for the 2 branches of the curve:
- dgap > 6μm: In order to generate a discharge (that is produced by an avalanche of ionizations of Argon atoms by high energy electrons), we need a minimum electric field that is able to accelerate electrons above the ionization energy of Ar atoms in the mean free path of electrons at that pressure (ca. 0.5 μm). Since the electric field is inversely proportional to dgap at constant voltage, Vb increases linearly with dgap.
- dgap < 6μm: the gap distance is comparable with the mean free path, so the probability of collisions that produce ionizations decreases. In order to have enough collisions to produce a discharge, the voltage has to be increased.
It follows that plasma cannot form in the pores of CaCO3 particles within the plasma zone, since their diameter is below 2 μm.
Figure A13.
Burning voltage in function of the gap distance for argon at 1 atm, as calculated by [59].
Figure A13.
Burning voltage in function of the gap distance for argon at 1 atm, as calculated by [59].

In order to discriminate whether the gas temperature increment or the active species drives the CaCO3 decomposition in presence of plasma, we compared the effect of plasma on the reaction rate on samples with different specific surface area and perform a similar comparison for samples with different particles size. By choosing different particles sizes or different specific surface areas, we can vary selectively the external surface, exposed to the active species and temperature increase, and the internal surface, exposed only to a temperature increase.
Appendix B.3. CO2 and CO and Calibration
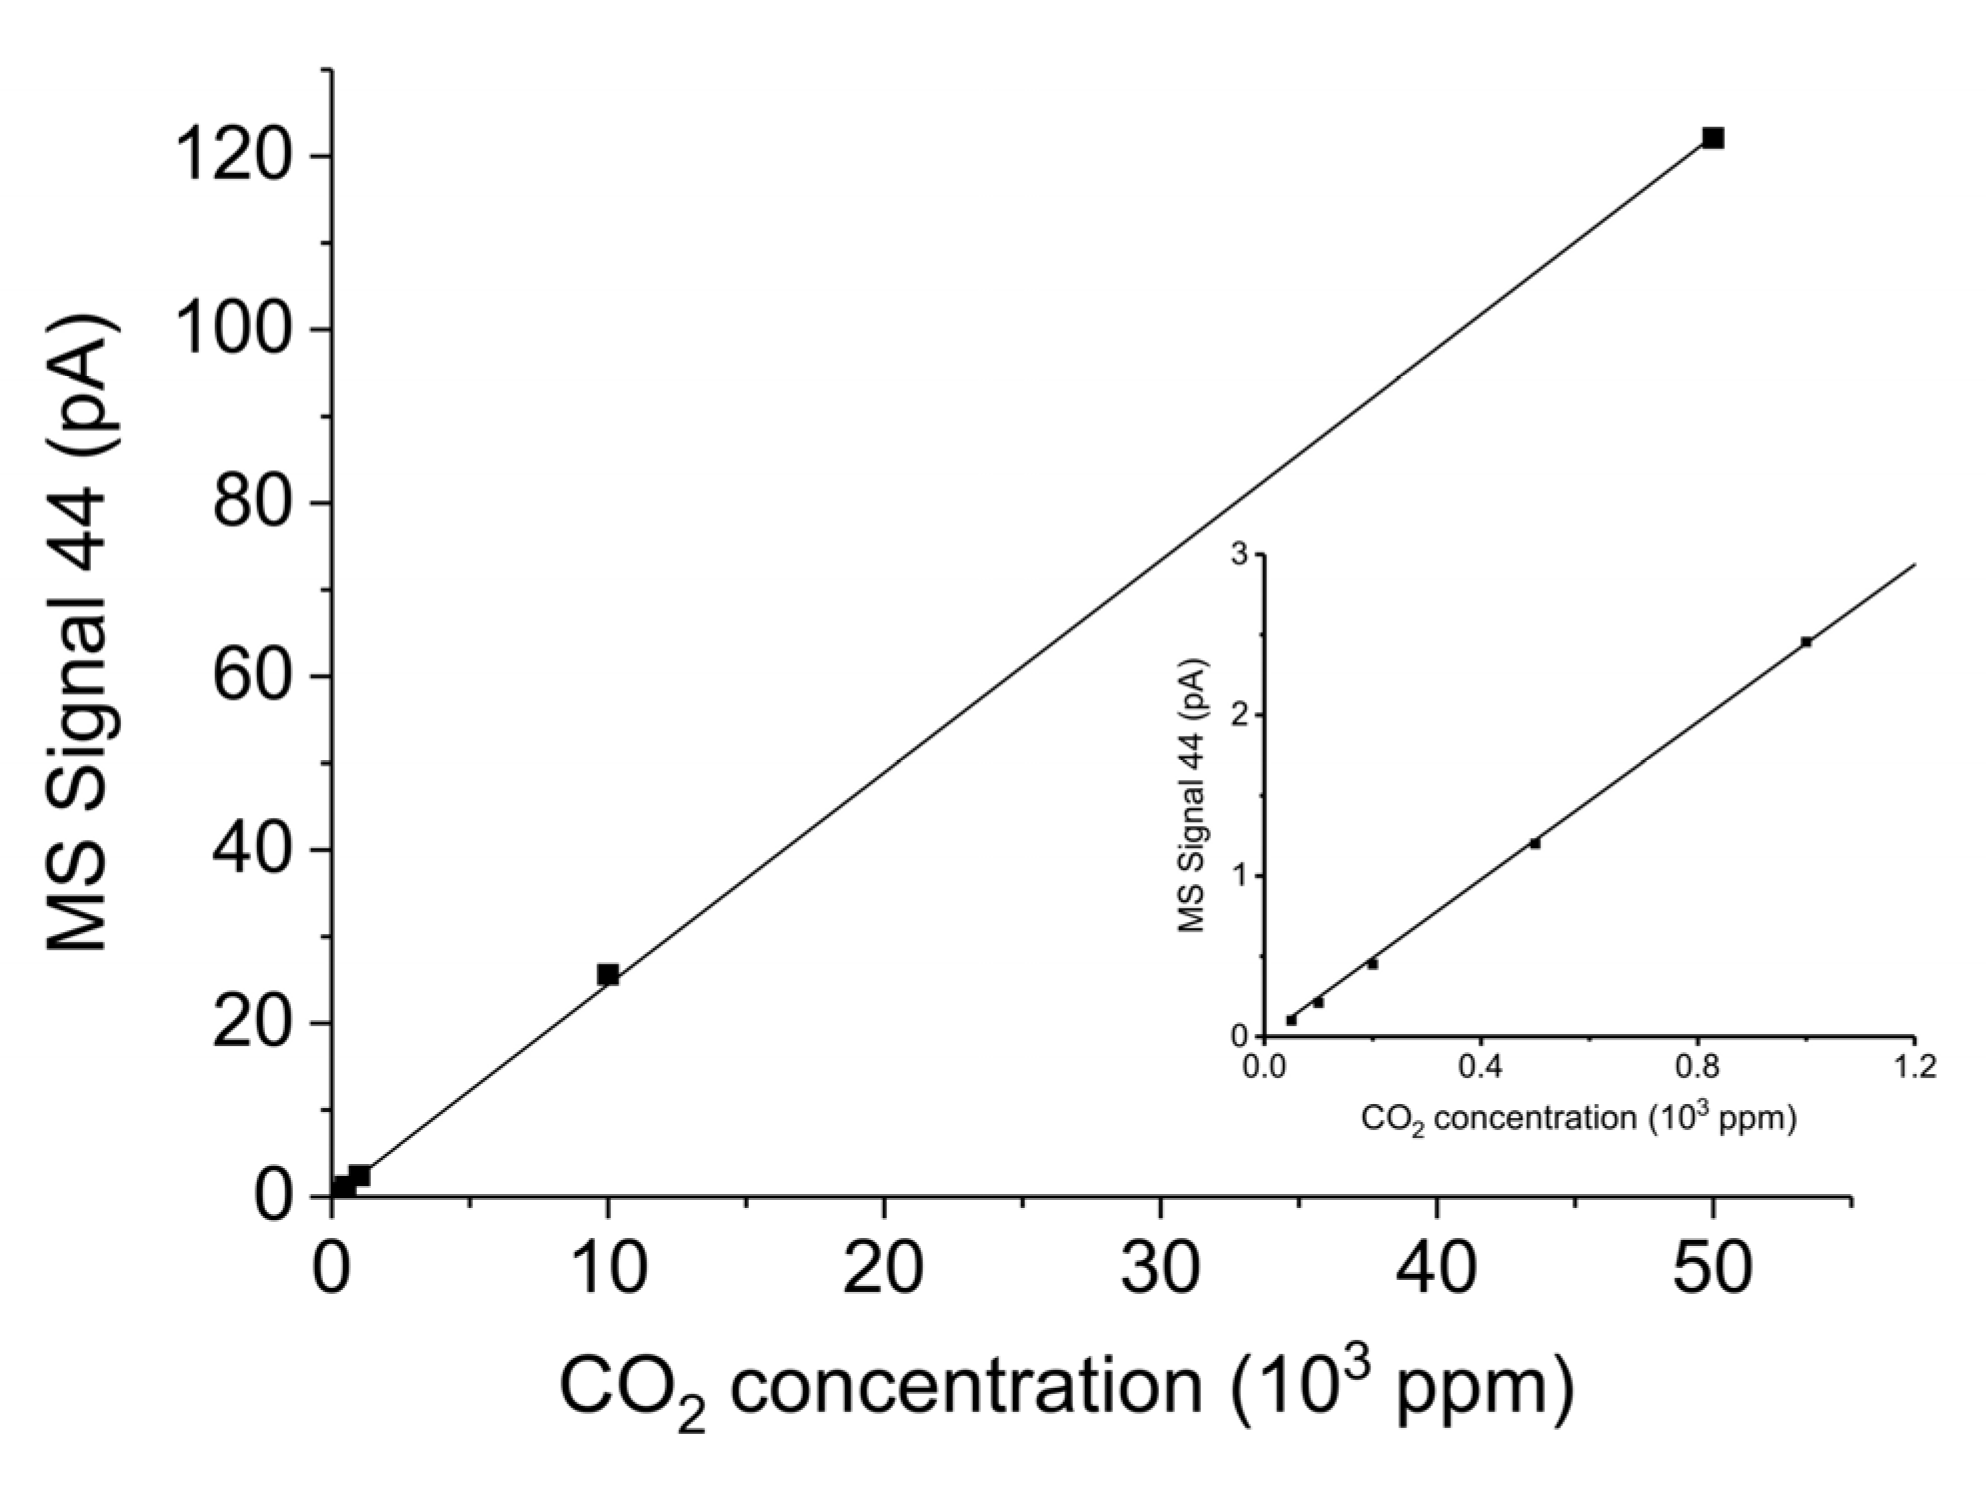
Figure A14 shows the CO2 signal elaborated by MS (m/e = 44) for CO2 concentrations up to 5% in Ar and in the inset CO2 concentrations up to 1000 ppm are expanded. In this range the signal is linear with the CO2 concentration, with a R2 coefficient of 0.9996. The CO signal (m/e = 28) for the CO concentration of 5% in Ar is 1.15 ± 0.05 times larger than the CO2 signal (m/e = 44) at the same CO2 concentration.
Figure A14.
Mass spectrometer signal m/e = 44 for different CO2 concentrations in Ar from 0 to 5%; inset: enhancement of the CO2 concentration range of 0 to 1000 ppm.
Figure A14.
Mass spectrometer signal m/e = 44 for different CO2 concentrations in Ar from 0 to 5%; inset: enhancement of the CO2 concentration range of 0 to 1000 ppm.
Appendix B.4. Sample Stability during Absorption–Desorption Cycles
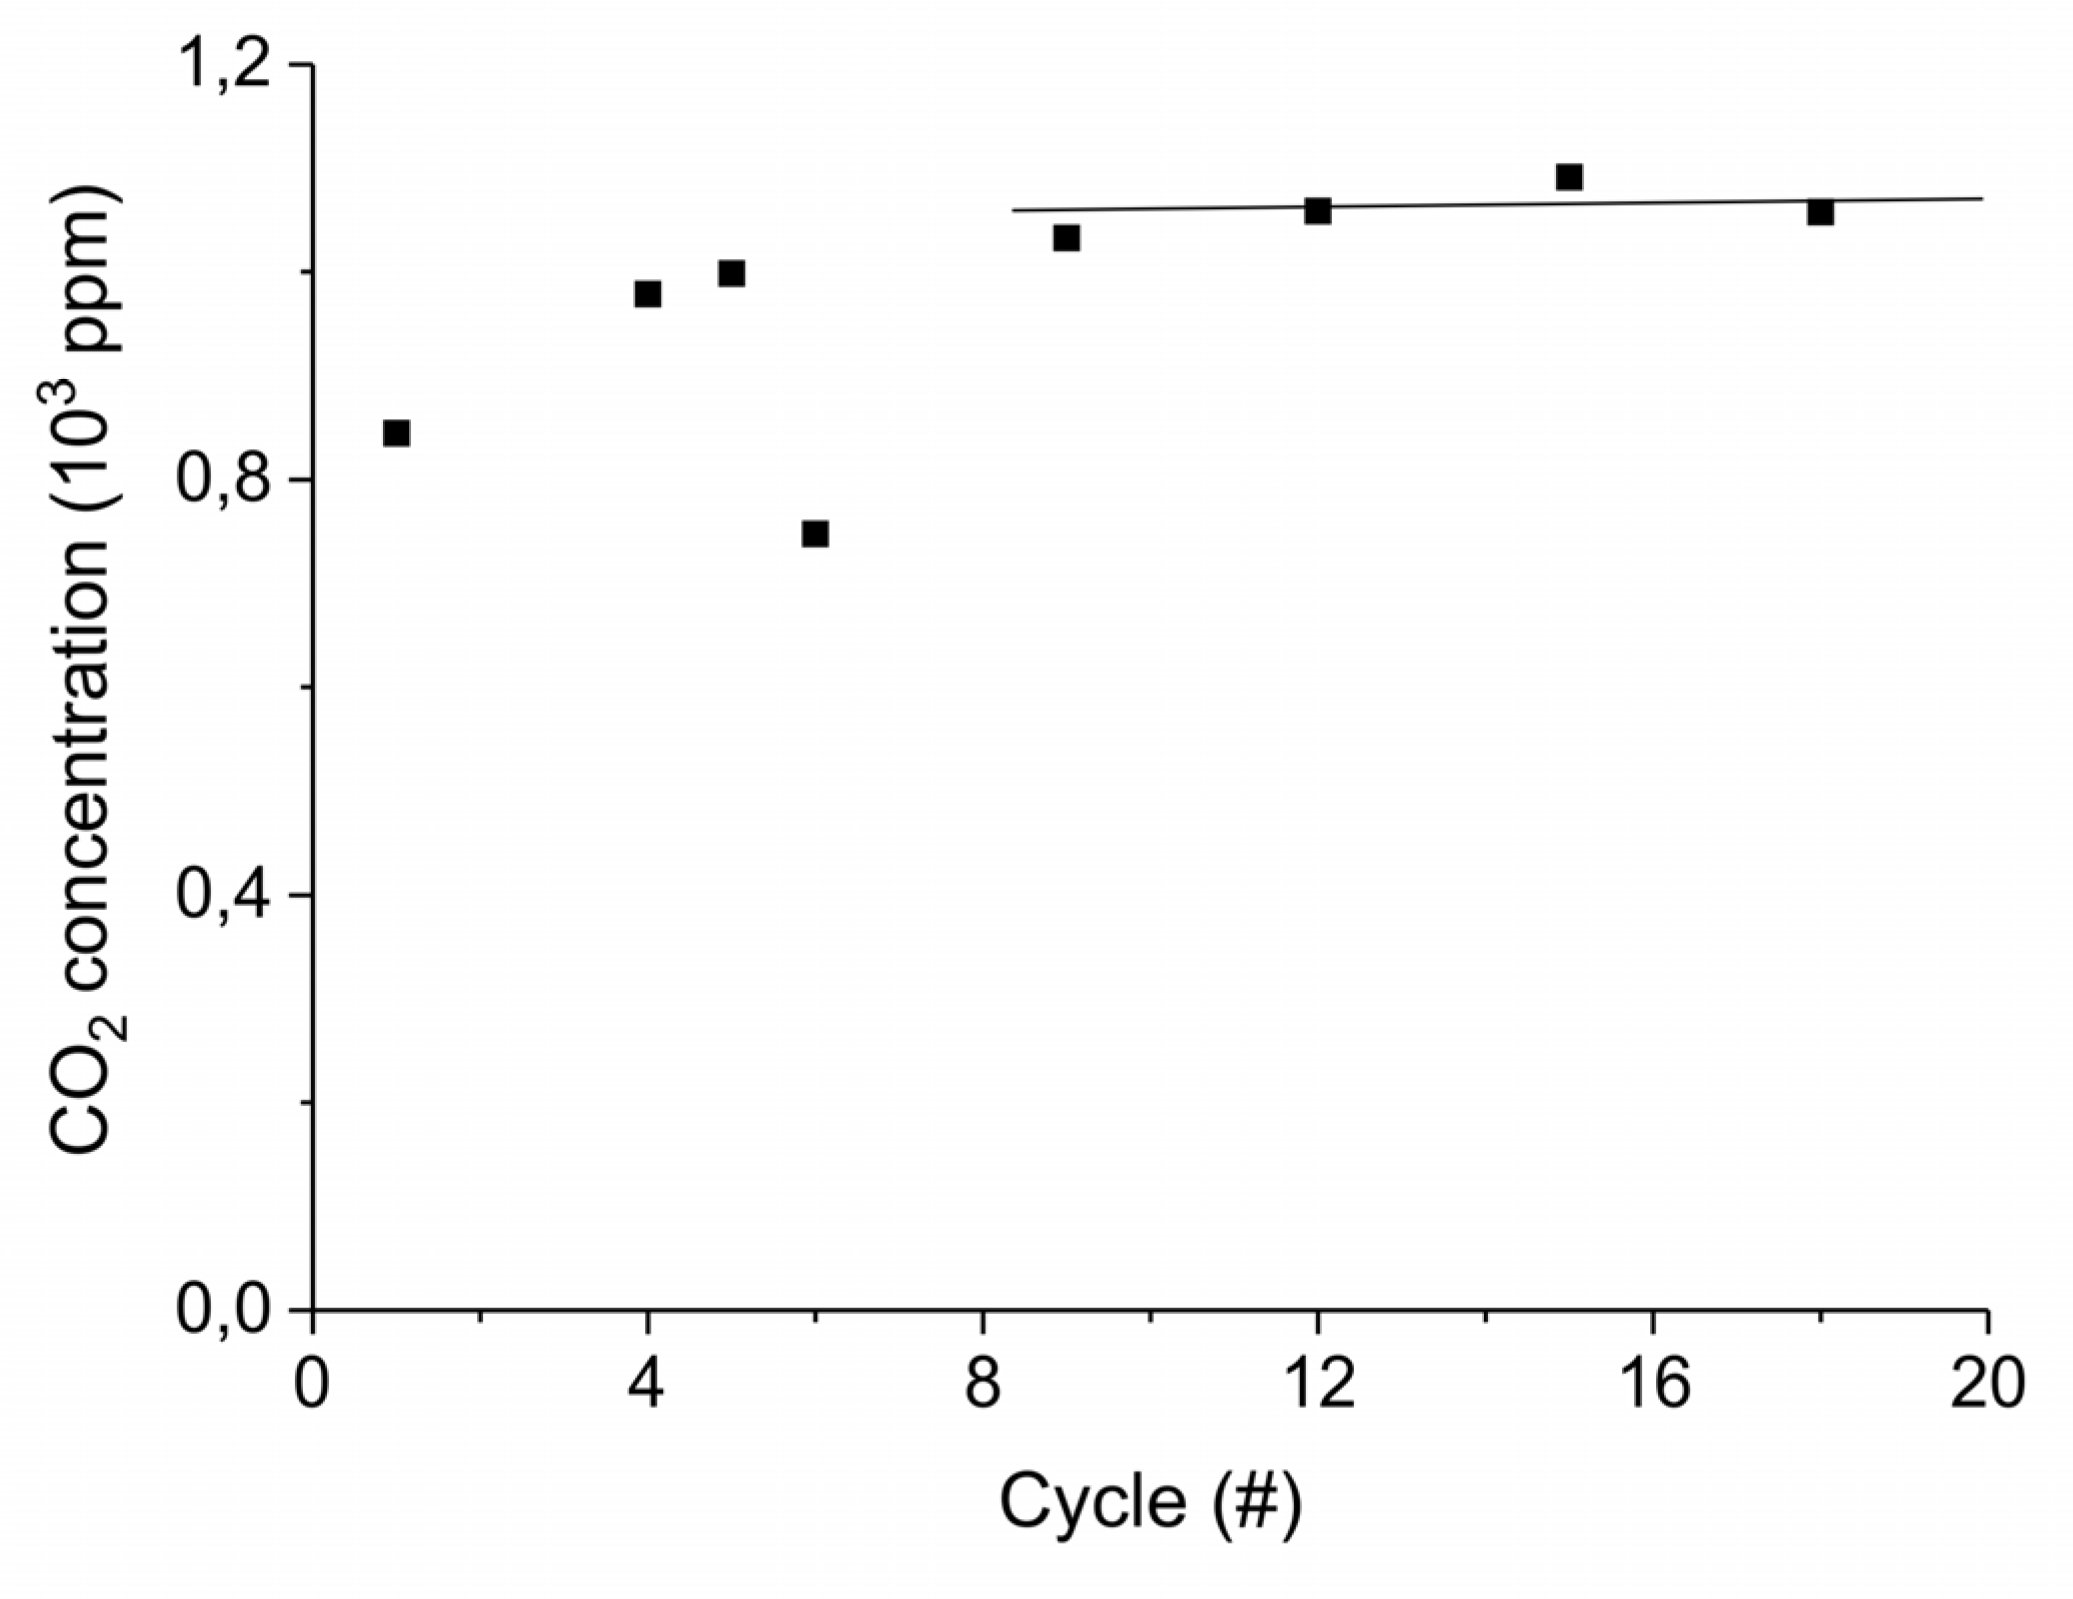
Figure A15 shows the aging of the sample synthesized from calcium carbonate with the largest particles size, within 22 absorption–desorption cycles: the concentration of CO2 during the initial stage of decomposition does not show significant change during the 21 absorption–desorption cycles at 630°C in absence of extra CO2 and plasma, as expected for a sample already sintered at 900 °C for 24 h. The experiments in presence of extra CO2 and plasma were all performed from cycle 9 to cycle 22, where the sample shows the highest stability.
Figure A15.
CO2 concentration at the first stage of decomposition of 10 mg CaCO3 for different cumulative number of cycles. The decompositions are performed at standard conditions, i.e., 630 °C without plasma in absence of CO2 in the gas mixture.
Figure A15.
CO2 concentration at the first stage of decomposition of 10 mg CaCO3 for different cumulative number of cycles. The decompositions are performed at standard conditions, i.e., 630 °C without plasma in absence of CO2 in the gas mixture.
Appendix B.5. Heat Transfer in the Packed Bed
Plasma is considered as a uniform heat source at temperature T∞ around the particles which are assumed spherical and have an initial temperature T0. We calculated the time needed to increase the temperature of the center of the particles of the 90% of the initial temperature difference T∞–T0 as follows [60]
The physical constants in the equation are the following: ρ is the density of CaCO3 (2710 kg/m3); Cp is the heat capacity of CaCO3 at 630 °C (1.26 J g−1 K−1) [61]; V and A are the volume and section of the CaCO3 particles, respectively, and h is the convective heat transfer coefficient of a dry gas in a packed bed reactor, approximated to 15 W m−2 K−1 [60]. As a result, the times needed to heat up the particles are respectively 4, 11, and 24 seconds for the smallest (38–45 μm), medium (100–125 μm), and largest (250–300 μm) particles, respectively. Equation (1) is an approximation for spherical particles without porosity, so we assume that more accurate calculation will give slightly longer times.
References
- Neyts, E.C.; Ostrikov, K.; Sunkara, M.K.; Bogaerts, A. Plasma Catalysis: Synergistic Effects at the Nanoscale. Chem. Rev. 2015, 115, 13408–13446. [Google Scholar] [CrossRef] [PubMed]
- Neyts, E.C.; Bogaerts, A. Understanding plasma catalysis through modelling and simulation—A review. J. Phys. D Appl. Phys. 2014, 47, 224010. [Google Scholar] [CrossRef]
- Neyts, E.C.; Ostrikov, K.; Sunkara, M.K.; Bogaerts, A. Plasma-Surface Interactions in Plasma Catalysis. Plasma Chem. Plasma Process. 2014, 36, 13408–13446. [Google Scholar] [CrossRef]
- Whitehead, J.C. Plasma-catalysis: The known knowns, the known unknowns and the unknown unknowns. J. Phys. D Appl. Phys. 2016, 49, 243001. [Google Scholar] [CrossRef]
- Chen, H.L.; Lee, H.M.; Chen, S.H.; Chang, M.B.; Yu, S.J.; Li, S.N. Removal of volatile organic compounds by single-stage and two-stage plasma catalysis systems: A review of the performance enhancement mechanisms, current status, and suitable applications. Environ. Sci. Technol. 2009, 43, 2216–2227. [Google Scholar] [CrossRef] [PubMed]
- Dobslaw, D.; Schulz, A.; Helbich, S.; Dobslaw, C.; Engesser, K.H. VOC removal and odor abatement by a low-cost plasma enhsnced biotrickling filter process. J. Environ. Chem. Eng. 2017, 5, 5501–5511. [Google Scholar] [CrossRef]
- Kozàk, T.; Bogaerts, A. Splitting of CO2 by vibrational excitation in non-equilibrium plasmas: A reaction kinetics model. Plasma Sources Sci. Technol. 2014, 23, 045004. [Google Scholar] [CrossRef]
- Ashford, B.; Tu, X. Non-thermal plasma technology for the conversion of CO2. Curr. Opin. Green Sustain. Chem. 2017, 3, 45–49. [Google Scholar] [CrossRef]
- Michielsen, I.; Uytdenhouwen, Y.; Pype, J.; Michielsen, B.; Mertens, J.; Reniers, F.; Meynen, V.; Bogaerts, A. CO2 dissociation in a packed bed DBD reactor: First steps towards a better understanding of plasma catalysis. Chem. Eng. J. 2017, 326, 477–488. [Google Scholar] [CrossRef]
- Grofulović, M.; Silva, T.; Klarenaar, B.L.; Morillo-Candas, A.S.; Guaitella, O.; Engeln, R.; Pintassilgo, C.D.; Guerra, V. Kinetic study of CO2 plasmas under non-equilibrium conditions. {I}. Relaxation of vibrational energy. Plasma Sources Sci. Technol. 2018, 27, 15019. [Google Scholar] [CrossRef]
- Sobacchi, M.G.; Saveliev, A.V.; Fridman, A.A.; Kennedy, L.A.; Ahmed, S.; Krause, T. Experimental assessment of a combined plasma/catalytic system for hydrogen production via partial oxidation of hydrocarbon fuels. Int. J. Hydrogen Energy 2002, 27, 635–642. [Google Scholar] [CrossRef]
- Tu, X.; Whitehead, J.C. Plasma-catalytic dry reforming of methane in an atmospheric dielectric barrier discharge: Understanding the synergistic effect at low temperature. Appl. Catal. B Environ. 2012, 125, 439–448. [Google Scholar] [CrossRef]
- Chung, W.C.; Chang, M.B. Review of catalysis and plasma performance on dry reforming of CH4 and possible synergistic effects. Renew. Sustain. Energy Rev. 2016, 62, 13–31. [Google Scholar] [CrossRef]
- Patil, B.S.; Wang, Q.; Hessel, V.; Lang, J. Plasma N2-fixation: 1900–2014. Catal. Today 2015, 256, 49–66. [Google Scholar] [CrossRef]
- Fridman, A. Plasma Chemistry; Cambridge University Press: Cambridge, UK, 2008. [Google Scholar]
- Tendero, C.; Tixier, C.; Tristant, P.; Desmaison, J.; Leprince, P. Atmospheric pressure plasmas: A review. Spectrochim. Acta Part B At. Spectrosc. 2006, 61, 2–30. [Google Scholar] [CrossRef]
- Kim, H.H.; Teramoto, Y.; Negishi, N.; Ogata, A. A multidisciplinary approach to understand the interactions of nonthermal plasma and catalyst: A review. Catal. Today 2015, 256, 13–22. [Google Scholar] [CrossRef]
- Aerts, R.; Somers, W.; Bogaerts, A. Carbon Dioxide Splitting in a Dielectric Barrier Discharge Plasma: A Combined Experimental and Computational Study. ChemSusChem 2015, 8, 702–716. [Google Scholar] [CrossRef]
- Mei, D.; Zhu, X.; He, Y.L.; Yan, J.D.; Tu, X. Plasma-assisted conversion of CO2 in a dielectric barrier discharge reactor: Understanding the effect of packing materials. Plasma Sources Sci. Technol. 2015, 24, 015001. [Google Scholar]
- Nizio, M.; Albarazi, A.; Cavadias, S.; Amouroux, J.; Galvez, M.E.; da Costa, P. Hybrid plasma-catalytic methanation of CO2 at low temperature over ceria zirconia supported Ni catalysts. Int. J. Hydrogen Energy 2016, 41, 11584–11592. [Google Scholar] [CrossRef]
- Bogaerts, A.; Kozák, T.; van Laer, K.; Snoeckx, R. Plasma-based conversion of CO2: Current status and future challenges. Faraday Discuss. 2015, 183, 217–232. [Google Scholar] [CrossRef]
- van Laer, K.; Bogaerts, A. Improving the Conversion and Energy Efficiency of Carbon Dioxide Splitting in a Zirconia-Packed Dielectric Barrier Discharge Reactor. Energy Technol. 2015, 3, 1038–1044. [Google Scholar] [CrossRef]
- Brehmer, F.; Welzel, S.; van de Sanden, M.C.M.; Engeln, R. CO and byproduct formation during CO2 reduction in dielectric barrier discharges. J. Appl. Phys. 2014, 116, 123303. [Google Scholar] [CrossRef]
- Uytdenhouwen, Y.; van Alphen, S.; Michielsen, I.; Meynen, V.; Cool, P.; Bogaerts, A. A packed-bed DBD micro plasma reactor for CO2 dissociation: Does size matter? Chem. Eng. J. 2018, 348, 557–568. [Google Scholar] [CrossRef]
- Ramakers, M.; Michielsen, I.; Aerts, R.; Meynen, V.; Bogaerts, A. Effect of argon or helium on the CO2 conversion in a dielectric barrier discharge. Plasma Process. Polym. 2015, 12, 755–763. [Google Scholar] [CrossRef]
- Zeng, Y.; Tu, X. Plasma-catalytic hydrogenation of CO2 for the cogeneration of CO and CH4 in a dielectric barrier discharge reactor: Effect of argon addition. J. Phys. D Appl. Phys. 2017, 50, 184004. [Google Scholar] [CrossRef]
- Butterworth, T.; Elder, R.; Allen, R. Effects of particle size on CO2 reduction and discharge characteristics in a packed bed plasma reactor. Chem. Eng. J. 2016, 293, 55–67. [Google Scholar] [CrossRef]
- Kameshima, S.; Tamura, K.; Ishibashi, Y.; Nozaki, T. Pulsed dry methane reforming in plasma-enhanced catalytic reaction. Catal. Today 2015, 256, 67–75. [Google Scholar] [CrossRef]
- Kameshima, S.; Tamura, K.; Mizukami, R.; Yamazaki, T.; Nozaki, T. Parametric analysis of plasma-assisted pulsed dry methane reforming over Ni/Al2O3 catalyst. Plasma Process. Polym. 2017, 14, 1600096. [Google Scholar] [CrossRef]
- Ozkan, A.; Dufour, T.; Arnoult, G.; de Keyzer, P.; Bogaerts, A.; Reniers, F. CO2-CH4 conversion and syngas formation at atmospheric pressure using a multi-electrode dielectric barrier discharge. J. CO2 Util. 2015, 9, 78–81. [Google Scholar] [CrossRef]
- Tu, X.; Gallon, H.J.; Twigg, M.V.; Gorry, P.A.; Whitehead, J.C. Dry reforming of methane over a Ni/Al2O3 catalyst in a coaxial dielectric barrier discharge reactor. J. Phys. D Appl. Phys. 2011, 44, 274001. [Google Scholar] [CrossRef]
- Gallon, H.J.; Tu, X.; Whitehead, J.C. Effects of reactor packing materials on H2 production by CO2 reforming of CH4 in a dielectric barrier discharge. Plasma Process. Polym. 2012, 9, 90–97. [Google Scholar] [CrossRef]
- Zeng, Y.; Zhu, X.; Mei, D.; Ashford, B.; Tu, X. Plasma-catalytic dry reforming of methane over γ-Al2O3 supported metal catalysts. Catal. Today 2015, 256, 80–87. [Google Scholar] [CrossRef]
- Zheng, X.; Tan, S.; Dong, L.; Li, S.; Chen, H. Silica-coated LaNiO3 nanoparticles for non-thermal plasma assisted dry reforming of methane: Experimental and kinetic studies. Chem. Eng. J. 2015, 265, 147–156. [Google Scholar] [CrossRef]
- Aerts, R.; Martens, T.; Bogaerts, A. Influence of vibrational states on CO2 splitting by dielectric barrier discharges. J. Phys. Chem. C 2012, 116, 23257–23273. [Google Scholar] [CrossRef]
- Bogaerts, A.; Wang, W.; Berthelot, A.; Guerra, V. Modeling plasma-based CO2 conversion: Crucial role of the dissociation cross section. Plasma Sources Sci. Technol. 2016, 25, 55016. [Google Scholar] [CrossRef]
- Pietanza, L.D.; Colonna, G.; D’Ammando, G.; Capitelli, M. Time-dependent coupling of electron energy distribution function, vibrational kinetics of the asymmetric mode of CO2 and dissociation, ionization and electronic excitation kinetics under discharge and post-discharge conditions. Plasma Phys. Control. Fusion 2017, 59, 14035. [Google Scholar] [CrossRef]
- Van Rooij, G.J.; van den Bekerom, D.C.; Den Harder, N.; Minea, T.; Berden, G.; Bongers, W.A.; Engeln, R.; Graswinckel, M.F.; Zoethout, E.; van de Sanden, M.C. Taming microwave plasma to beat thermodynamics in CO2 dissociation. Faraday Discuss. 2015, 183, 233–248. [Google Scholar] [CrossRef] [PubMed]
- Bongers, W.; Bouwmeester, H.; Wolf, B.; Peeters, F.; Welzel, S.; van den Bekerom, D.; den Harder, N.; Goede, A.; Graswinckel, M.; Groen, P.W.; et al. Plasma-driven dissociation of CO2 for fuel synthesis. Plasma Process. Polym. 2017, 14, 1600126. [Google Scholar] [CrossRef]
- Minea, T.; van den Bekerom, D.C.; Peeters, F.J.; Zoethout, E.; Graswinckel, M.F.; van de Sanden, M.C.; Cents, T.; Lefferts, L.; van Rooij, G.J. Non-oxidative methane coupling to C2 hydrocarbons in a microwave plasma reactor. Plasma Process. Polym. 2018, 15, 1800087. [Google Scholar] [CrossRef]
- Li, S.; Zheng, W.; Tang, Z.; Gu, F. Plasma heating and temperature difference between gas pellets in packed bed with dielectric barrier discharge under natural convection condition. Heat Transf. Eng. 2012, 33, 609–617. [Google Scholar] [CrossRef]
- Jidenko, N.; Bourgeois, E.; Borra, J.P. Temperature profiles in filamentary dielectric barrier discharges at atmospheric pressure. J. Phys. D Appl. Phys. 2010, 43, 295203. [Google Scholar] [CrossRef]
- Patil, B.S.; Cherkasov, N.; Lang, J.; Ibhadon, A.O.; Hessel, V.; Wang, Q. Low temperature plasma-catalytic NOx synthesis in a packed DBD reactor: Effect of support materials and supported active metal oxides. Appl. Catal. B Environ. 2016, 194, 123–133. [Google Scholar] [CrossRef]
- Nozaki, T.; Hiroyuki, T.; Okazaki, K. Hydrogen enrichment of low-calorific fuels using barrier discharge enhanced Ni/γ-Al2O3 bed reactor: Thermal and nonthermal effect of nonequilibrium plasma. Energy Fuels 2006, 20, 339–345. [Google Scholar] [CrossRef]
- Masoud, N.; Martus, K.; Figus, M.; Becker, K. Rotational and vibrational temperature measurements in a high-pressure cylindrical dielectric barrier discharge (C-DBD). Contrib. Plasma Phys. 2005, 45, 32–39. [Google Scholar] [CrossRef]
- Rajasekaran, P.; Opländer, C.; Hoffmeister, D.; Bibinov, N.; Suschek, C.V.; Wandke, D.; Awakowicz, P. Characterization of dielectric barrier discharge (DBD) on mouse and histological evaluation of the plasma-treated tissue. Plasma Process. Polym. 2011, 8, 246–255. [Google Scholar] [CrossRef]
- Du, Y.; Nayak, G.; Oinuma, G.; Ding, Y.; Peng, Z.; Bruggeman, P.J. Emission considering self-absorption of OH to simultaneously obtain the OH density and gas temperature: Validation, non-equilibrium effects and limitations. Plasma Sources Sci. Technol. 2017, 26, 095007. [Google Scholar] [CrossRef]
- Florian, J.; Merbahi, N.; Wattieaux, G.; Plewa, J.M.; Yousfi, M. Comparative Studies of Double Dielectric Barrier Discharge and Microwave Argon Plasma Jets at Atmospheric Pressure for Biomedical Applications. IEEE Trans. Plasma Sci. 2015, 43, 3332–3338. [Google Scholar] [CrossRef]
- Blamey, J.; Anthony, E.J.; Wang, J.; Fennell, P.S. The calcium looping cycle for large-scale CO2 capture. Prog. Energy Combust. Sci. 2010, 36, 260–279. [Google Scholar] [CrossRef]
- McBride, B.J.; Zehe, M.J.; Gordon, S. NASA Glenn Coefficients for Calculating Thermodynamic Properties of Individual Species. In Technical Reports NASA; NASA: Washington, DC, USA, 2002; Volume 291, p. 211556. [Google Scholar]
- Fennell, P.S.; Pacciani, R.; Dennis, J.S.; Davidson, J.F.; Hayhurst, A.N. The effects of repeated cycles of calcination and carbonation on a variety of different limestones, as measured in a hot fluidized bed of sand. Energy Fuels 2007, 21, 2072–2081. [Google Scholar] [CrossRef]
- Lysikov, A.I.; Salanov, A.N.; Okunev, A.G. Change of CO2 carrying capacity of CaO in isothermal recarbonation-decomposition cycles. Ind. Eng. Chem. Res. 2007, 46, 4633–4638. [Google Scholar] [CrossRef]
- Borgwardt, R.H. Sintering of nascent calcium oxide. Chem. Eng. Sci. 1989, 44, 53–60. [Google Scholar] [CrossRef]
- Zhang, Y.R.; van Laer, K.; Neyts, E.C.; Bogaerts, A. Can plasma be formed in catalyst pores? A modeling investigation. Appl. Catal. B Environ. 2016, 185, 56–67. [Google Scholar] [CrossRef]
- Hensel, K.; Katsura, S.; Mizuno, A. DC Microdischarges inside porous ceramics. IEEE Trans. Plasma Sci. 2005, 33, 574–575. [Google Scholar] [CrossRef]
- Zhang, Q.Z.; Wang, W.Z.; Bogaerts, A. Importance of surface charging during plasma streamer propagation in catalyst pores. Plasma Sources Sci. Technol. 2018, 27, 065009. [Google Scholar] [CrossRef] [Green Version]
- Giammaria, G.; Lefferts, L. Catalytic Effect of Water on Calcium Carbonate Decomposition. Appl. Catal. B. unpublished.
- Peeters, F.J.J.; van de Sanden, M.C.M. The influence of partial surface discharging on the electrical characterization of DBDs. Plasma Sources Sci. Technol. 2015, 24, 15016. [Google Scholar] [CrossRef]
- Ghassemi, M.; Mohseni, H.; Niayesh, K.; Shayegani, A.A. Dielectric Barrier Discharge (DBD) Dynamic Modeling for High Voltage Insulation. In Proceedings of the 2011 Electrical Insulation Conference (EIC), Annapolis, MD, USA, 5–8 June 2011. [Google Scholar]
- Jess, A.; Wasserscheid, P. Chemical Technology; An Integrated Textbook; Wiley: Hoboken, NJ, USA, 2013. [Google Scholar]
- Jacobs, G.K.; Kerrick, D.M.; Krupka, K.M. The High-Temperature Heat Capacity of Natural Calcite (CaCO3). Phys. Chem. Miner. 1981, 7, 55–59. [Google Scholar] [CrossRef]
Figure 1.
(a) Pore size distribution for sample B batch II and (b) pore size distribution for sample C batch III according Hg porosimetry.
Figure 1.
(a) Pore size distribution for sample B batch II and (b) pore size distribution for sample C batch III according Hg porosimetry.
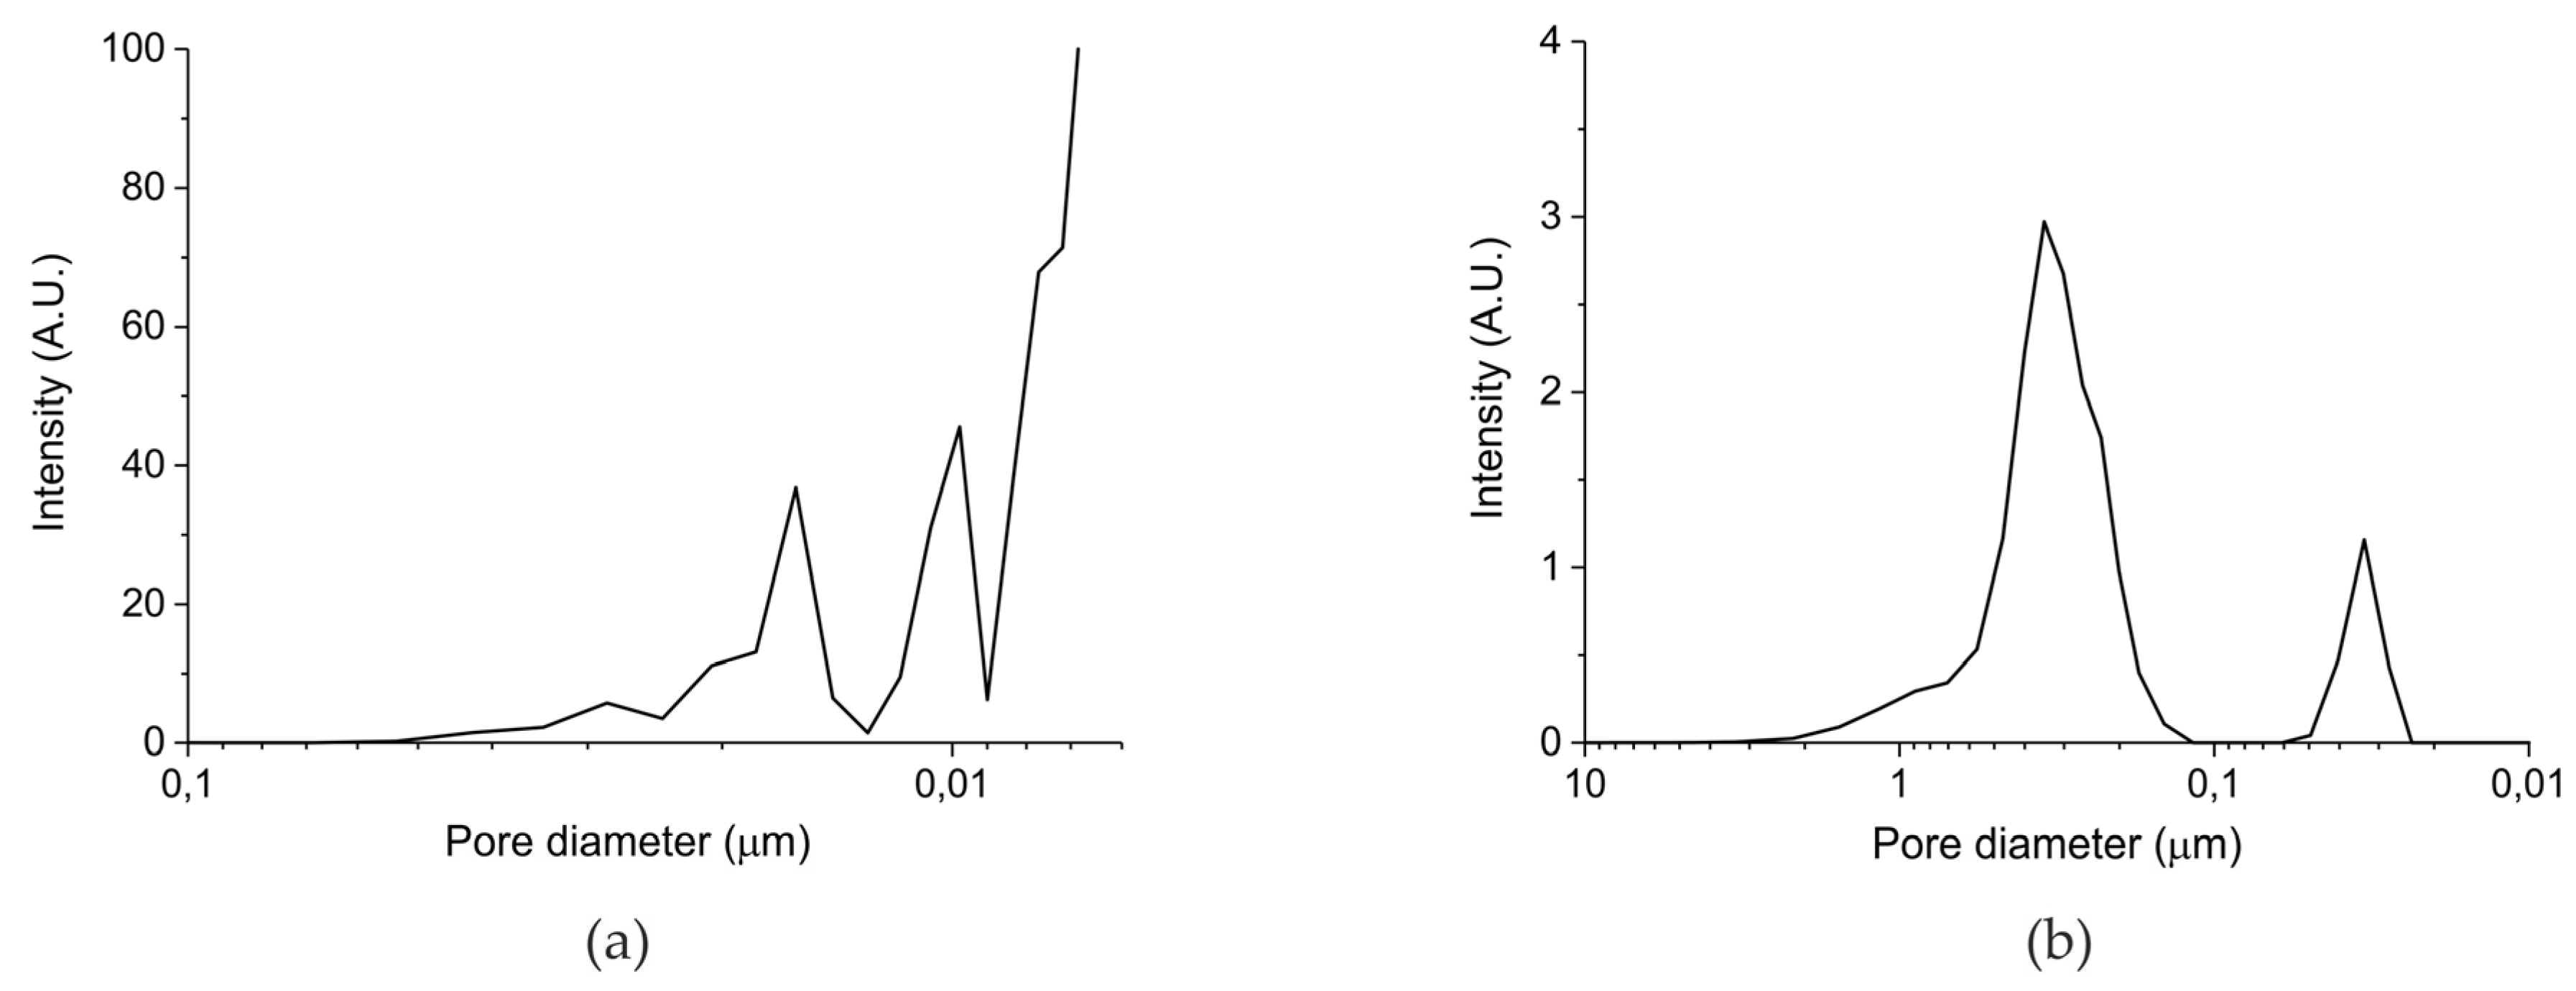
Figure 2.
CO2 concentration monitored by mass spectrometry during decomposition of carbonated sample A (solid line), sample B (dotted line), and sample C (dashed line). The temperature is 630 °C, flow rate is 30 mL min−1, and the gas is pure Ar.
Figure 2.
CO2 concentration monitored by mass spectrometry during decomposition of carbonated sample A (solid line), sample B (dotted line), and sample C (dashed line). The temperature is 630 °C, flow rate is 30 mL min−1, and the gas is pure Ar.

Figure 3.
Concentration of the products of CaCO3 decomposition (sample C) as function of time at 630 °C in pure argon, flow rate of 30 mL/min, plasma power is changed every 2 min with values of 0, 0.4, 3.2, and 9.6 W.
Figure 3.
Concentration of the products of CaCO3 decomposition (sample C) as function of time at 630 °C in pure argon, flow rate of 30 mL/min, plasma power is changed every 2 min with values of 0, 0.4, 3.2, and 9.6 W.
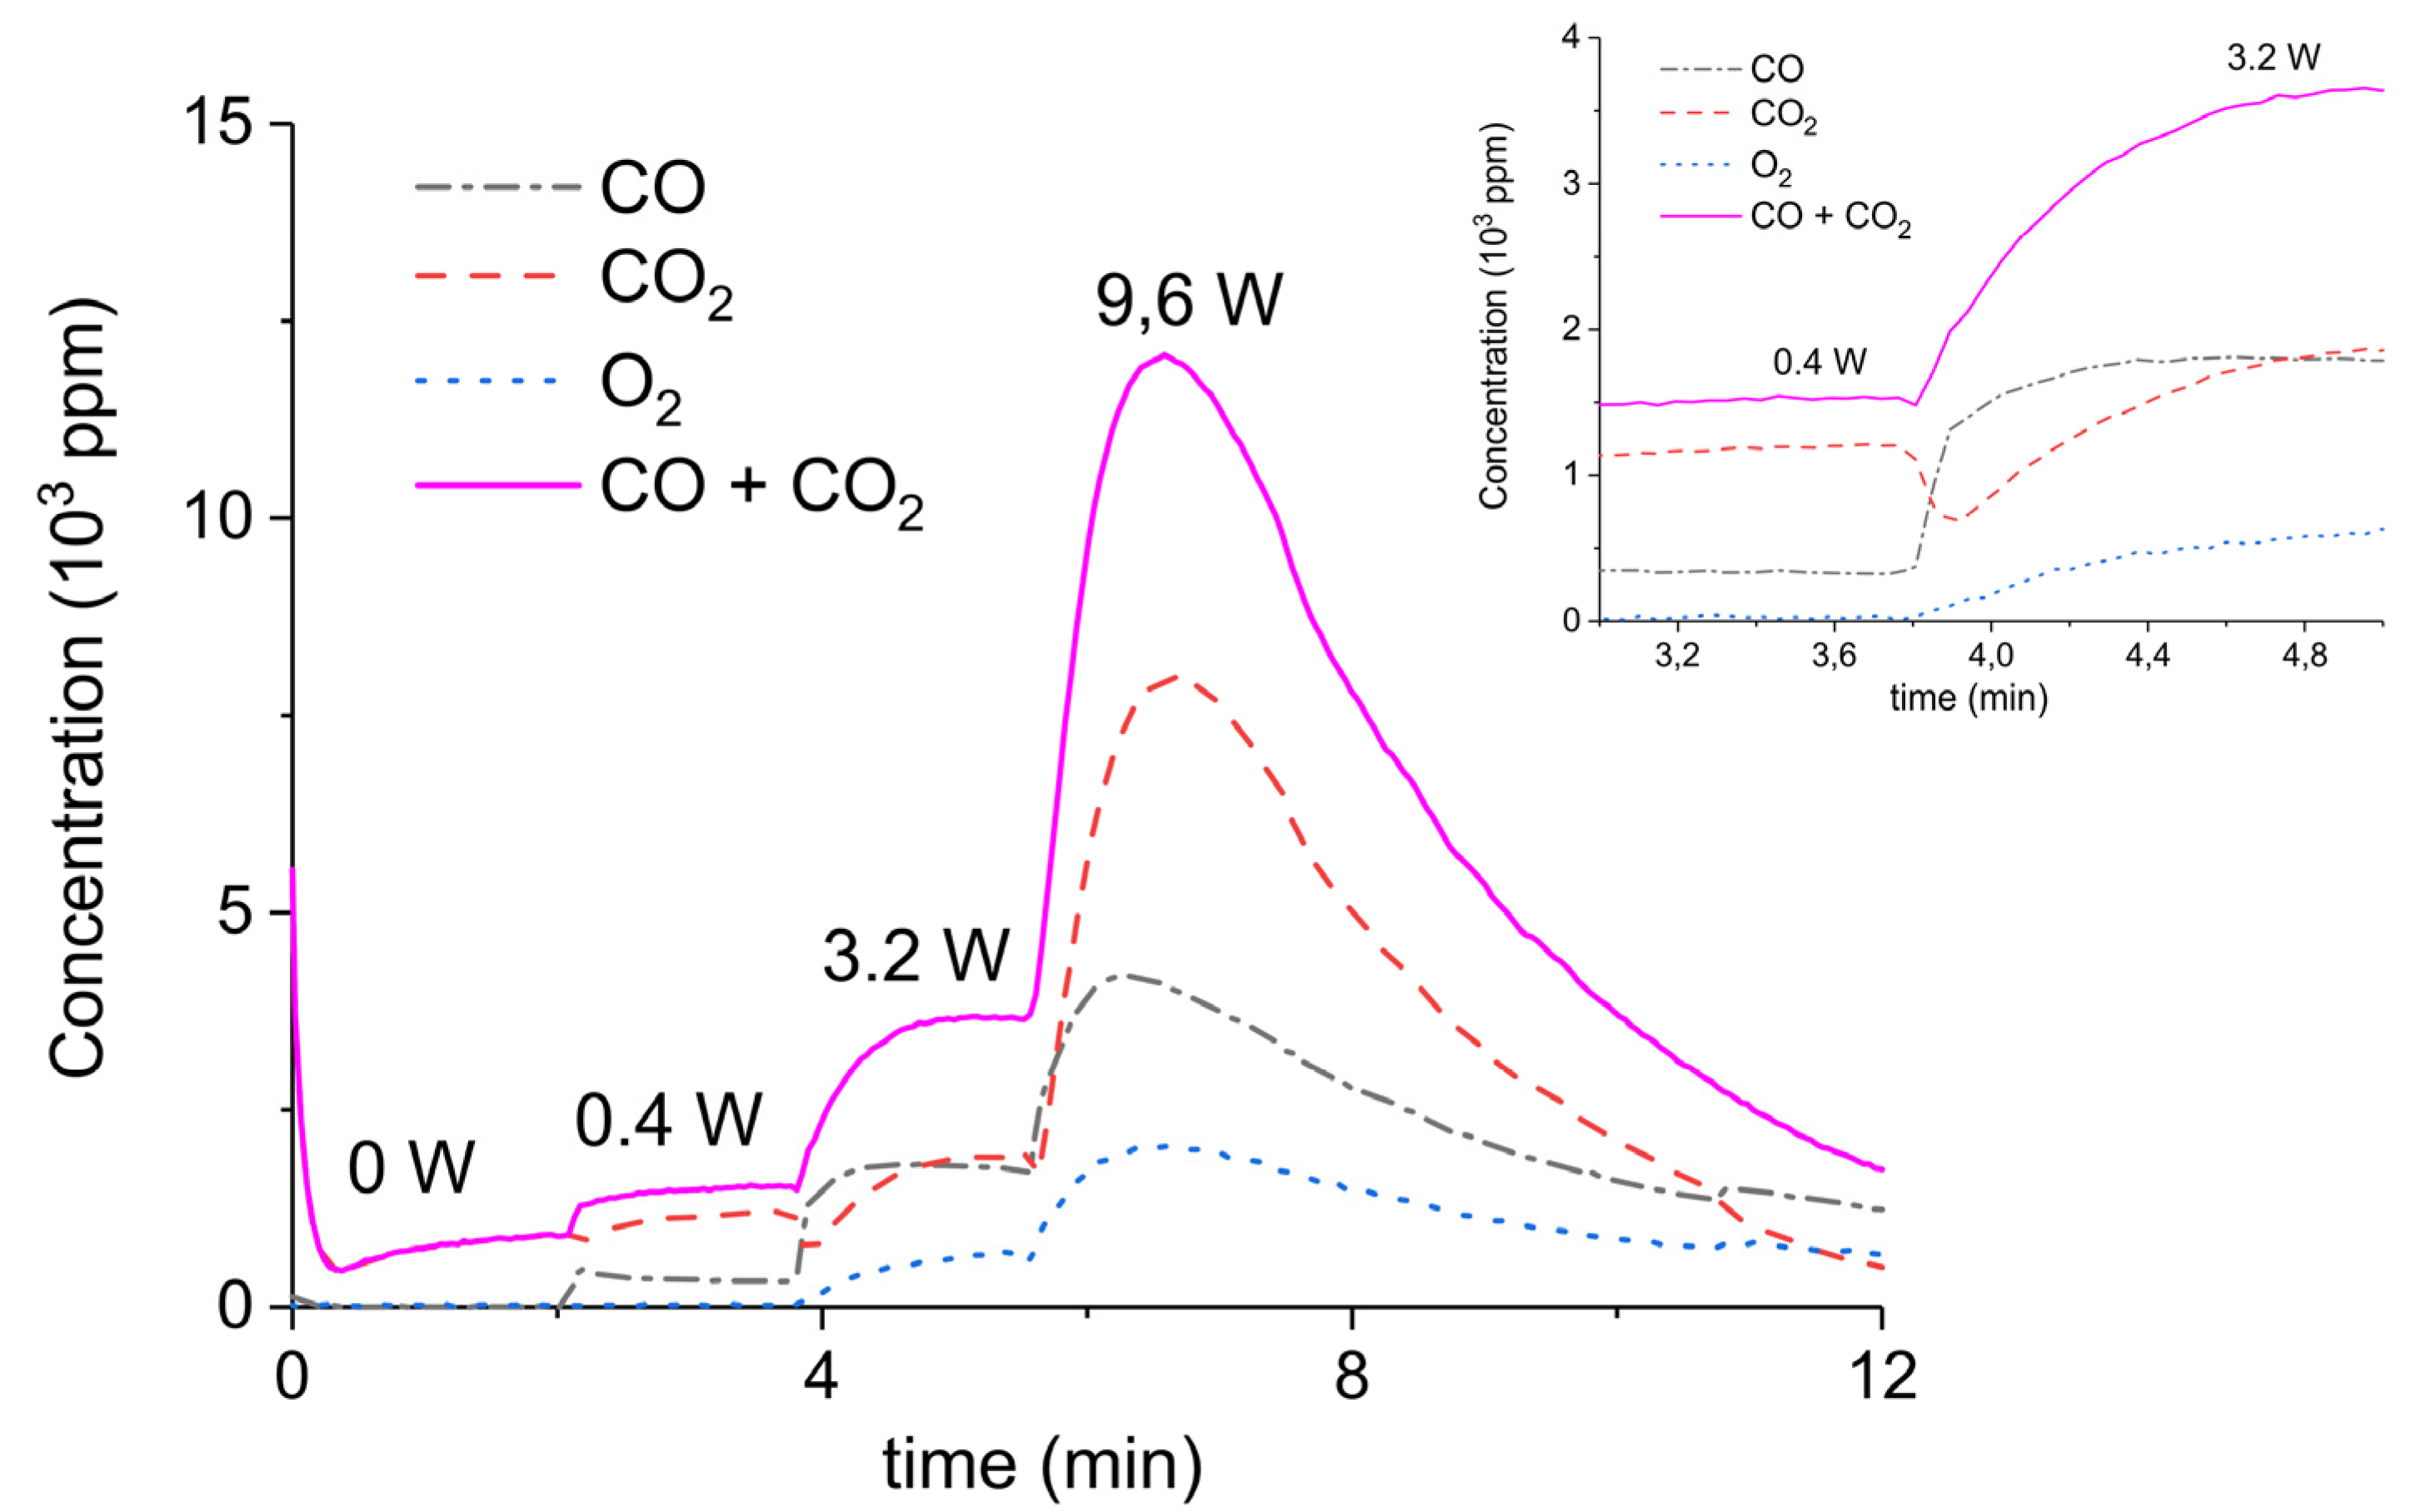
Figure 4.
Concentration of the products of CaCO3 decomposition (sample C) as function of time at 630 °C in pure argon, flow rate of 30 mL/min, plasma power is 2.1 W (a,b) and 4.4 W (c). Plasma is turned on at the beginning of decomposition (a,c) or after 1.5 min (b).
Figure 4.
Concentration of the products of CaCO3 decomposition (sample C) as function of time at 630 °C in pure argon, flow rate of 30 mL/min, plasma power is 2.1 W (a,b) and 4.4 W (c). Plasma is turned on at the beginning of decomposition (a,c) or after 1.5 min (b).

Figure 5.
Concentration of the products of decomposition of sample A (a), sample B (b), and sample C (c), with a temperature of 630 °C in pure argon and flow rate of 30 mL/min; plasma power is 2.1 ± 0.1 W.
Figure 5.
Concentration of the products of decomposition of sample A (a), sample B (b), and sample C (c), with a temperature of 630 °C in pure argon and flow rate of 30 mL/min; plasma power is 2.1 ± 0.1 W.

Figure 6.
Sum of CO2 and CO concentrations plotted as function of power obtained during decomposition of CaCO3 samples A, B, and C with different surface areas; all the experiments performed at 630 °C, in pure argon, and flow rate 30 mL/min.
Figure 6.
Sum of CO2 and CO concentrations plotted as function of power obtained during decomposition of CaCO3 samples A, B, and C with different surface areas; all the experiments performed at 630 °C, in pure argon, and flow rate 30 mL/min.
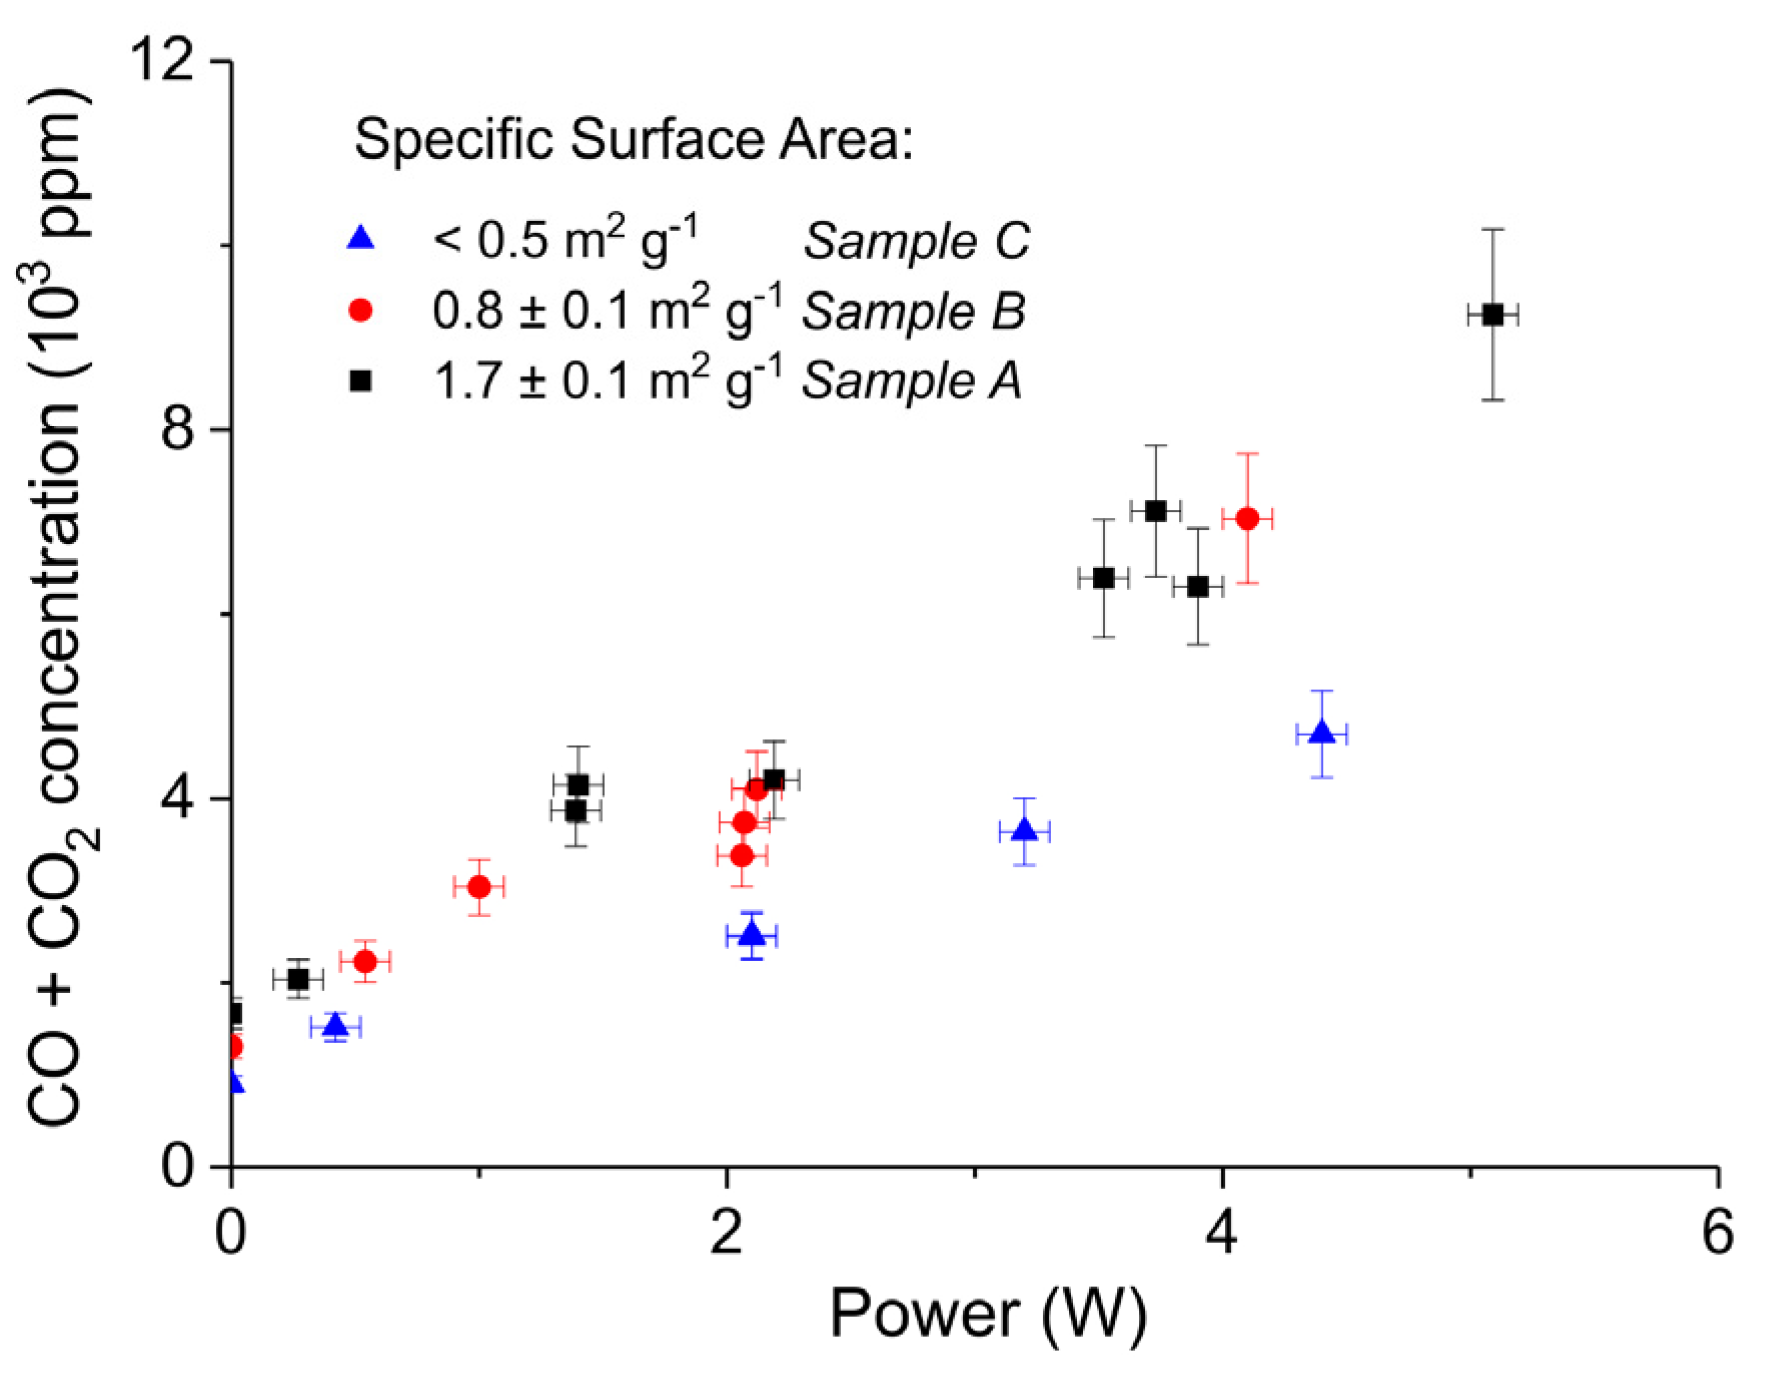
Figure 7.
Concentration of the products of decomposition of sample C (a), sample D (b), and sample E (c) as function of time with a temperature of 630 °C in pure argon and flow rate of 30 mL/min; plasma power is 2.1 W for sample C, 1.3 W for sample D, and 1.7 W for sample E. (d) Initial response of CO + CO2 concentration after activating the plasma for all three samples.

Figure 8.
Sum of CO2 and CO concentrations as function of power during decomposition of CaCO3 samples with different particles size (samples C, D, and E); all the experiments were performed at 630 °C, in pure argon, and at a flow rate 30 mL/min.
Figure 8.
Sum of CO2 and CO concentrations as function of power during decomposition of CaCO3 samples with different particles size (samples C, D, and E); all the experiments were performed at 630 °C, in pure argon, and at a flow rate 30 mL/min.

Figure 9.
CO + CO2 (solid line), CO2 (dashed line), CO (dash-dotted line), and O2 concentrations monitored by mass spectrometry during CaCO3 decomposition in different CO2 feed concentrations in Ar and different plasma power. The amount of CaO is 6 mg, temperature is 630 °C, and the flow rate is 90 mL min−1. The fed CO2 concentration is 0 ppm (a), 1000 ppm (b), 2000 ppm (c), and 3200 ppm (d). The plasma power is 1.5 W (a), 1.3 W (b), 1.3 W (c), and 1.5 W (d).

Figure 10.
CO outlet concentration vs. CO2 average concentration obtained in a packed bed of 10 mg CaCO3 and 90 mg Al2O3 at 630 °C with different CO2 concentrations in Ar and a flow rate of 90 mL/min (squares); all results interpolated to 1.5 W plasma power. The same experiment was also performed with 100 mg Al2O3 only (circles). Error margins of the CO concentration are provided, as well as the window of the CO2 concentrations (note these are not error margins).

Scheme 1.
CaCO3 decomposition in Ar plasma.

Figure 11.
Average increase of temperature in the plasma zone as function of power during the CaCO3 decomposition previously shown.
Figure 11.
Average increase of temperature in the plasma zone as function of power during the CaCO3 decomposition previously shown.

Figure 12.
Schematic of the setup to study decomposition of CaCO3 in Ar plasma. The generator can provide up to 30 kV peak to peak with a frequency range of 23.5 to 66 kHz. The plasma zone is 1 cm long and the reactor is a quartz tube with 6mm outer diameter and 4mm inner diameter. The inner electrode is a stainless-steel rod of 1mm diameter.


Table 1.
Characteristics of the samples prepared from three different precursors.
| Sample Code | Precursor (Batch #) | Carbonation Time at 630 °C (h) | Sintering Time at 900°C (h) | CaO S.S.A. (m2 g−1) | CaCO3 S.S.A. (m2 g−1) | Particles Diameter (µm) |
|---|---|---|---|---|---|---|
| A | Ca Gluconate (I) | 5 | 0 | 46.2 | 1.7 ± 0.1 | 250–300 |
| B | Ca Ascorbate (II) | 4 | 0 | 23.2 | 0.8 ± 0.1 | 250–300 |
| C | CaCO3 (III) | 5 | 24 | 10.1 | <0.5 | 250–300 |
| D | CaCO3 (III) | 5 | 24 | 10.1 | <0.5 | 100–125 |
| E | CaCO3 (III) | 5 | 24 | 10.1 | <0.5 | 38–45 |
© 2019 by the authors. Licensee MDPI, Basel, Switzerland. This article is an open access article distributed under the terms and conditions of the Creative Commons Attribution (CC BY) license (http://creativecommons.org/licenses/by/4.0/).
Share and Cite
MDPI and ACS Style
Giammaria, G.; van Rooij, G.; Lefferts, L. Plasma Catalysis: Distinguishing between Thermal and Chemical Effects. Catalysts 2019, 9, 185. https://doi.org/10.3390/catal9020185
AMA Style
Giammaria G, van Rooij G, Lefferts L. Plasma Catalysis: Distinguishing between Thermal and Chemical Effects. Catalysts. 2019; 9(2):185. https://doi.org/10.3390/catal9020185
Chicago/Turabian StyleGiammaria, Guido, Gerard van Rooij, and Leon Lefferts. 2019. "Plasma Catalysis: Distinguishing between Thermal and Chemical Effects" Catalysts 9, no. 2: 185. https://doi.org/10.3390/catal9020185
Note that from the first issue of 2016, this journal uses article numbers instead of page numbers. See further details here.