Catalytic Behaviour of Flame-Made CuO-CeO2 Nanocatalysts in Efficient CO Oxidation
by
 , ,
, ,
Feng Zhao
1,2 ,
,
Shuangde Li
1,
Xiaofeng Wu
1,
Renliang Yue
1,
Weiman Li
1,2,
Xicuo Zha
1,2,
Yuzhou Deng
1,2 and
Yunfa Chen
1,3,* 1
State Key Laboratory of Multi-Phase Complex Systems, Institute of Process Engineering, Chinese Academy of Sciences, Beijing 100190, China
2
University of Chinese Academy of Sciences, Beijing 100049, China
3
Center for Excellence in Regional Atmospheric Environment, Institute of Urban Environment, Chinese Academy of Sciences, Xiamen 361021, China
*
Author to whom correspondence should be addressed.
Catalysts 2019, 9(3), 256; https://doi.org/10.3390/catal9030256
Submission received: 5 February 2019
/
Revised: 3 March 2019
/
Accepted: 8 March 2019
/
Published: 13 March 2019
(This article belongs to the Special Issue Sustainable Applications in Surface Chemistry and Catalysis)
Abstract
:CuO-CeO2 nanocatalysts with varying CuO contents (1, 5, 9, 14 and 17 wt %) were prepared by one-step flame spray pyrolysis (FSP) and applied to CO oxidation. The influences of CuO content on the as-prepared catalysts were systematically characterized by X-ray diffraction (XRD), N2 adsorption-desorption at −196 °C, field emission scanning electron microscopy (FESEM), high-resolution transmission electron microscopy (HRTEM), Raman spectroscopy, X-ray photoelectron spectroscopy (XPS), and hydrogen-temperature programmed reduction (H2-TPR). A superior CO oxidation activity was observed for the 14 wt % CuO-CeO2 catalyst, with 90% CO conversion at 98 °C at space velocity (60,000 mL × g−1 × h−1), which was attributed to abundant surface defects (lattice distortion, Ce3+, and oxygen vacancies) and high reducibility supported by strong synergistic interaction. In addition, the catalyst also displayed excellent stability and resistance to water vapor. Significantly, in situ diffuse reflectance infrared Fourier transform spectroscopy (in situ DRIFTS) showed that in the CO catalytic oxidation process, the strong synergistic interaction led readily to dehydroxylation and CO adsorption on Cu+ at low temperature. Furthermore, in the feed of water vapor, although there was an adverse effect on the access of CO adsorption, there was also a positive effect on the formation of fewer carbon intermediates. All these results showed the potential of highly active and water vapor-resistive CuO-CeO2 catalysts prepared by FSP.
1. Introduction
Owing to increasingly stringent environmental regulations, the development of materials with high activity as three-way catalysts (TWCs) for removing CO becomes necessary. The traditional supported noble metal catalysts (e.g., Pt, Pd and Rh) offer excellent catalytic properties with the low CO oxidation temperature. However, it is limited for their application due to the cost, easy sintering and coking [1]. In recent years, research has focused on the metal oxides for their economy and readily controlling activities [2,3]. In particular, the combination of copper oxides (CuOx) and CeO2 is of great interest as a result of their cooperative redox and catalytic activities [4,5]. The activity of CuOx/CeO2 catalysts is related to the highly dispersed CuOx species, its strong interaction with CeO2, and mutual effect between Cu1+/2+ and Ce3+/4+ redox couples [6]. The CO oxidation reaction mechanism follows a Mars van Krevelen, starting with CO adsorption on Cu+, and then reacts with lattice oxygen to produce the carbon intermediates, such as mono- or poly-dentate carbonates and bidentate carbonate. Finally, desorption of intermediates produces CO2 [7]. The CO oxidation rate over CuO/CeO2 catalysts correlates with the formation of the Cu+-CO above a crucial temperature as Cu+-CO formation is the rate-limiting step [8]. However, the CO catalytic oxidation reaction is also affected by carbon intermediates, which is related to CO2 desorption below the threshold temperature, hindering further adsorption of fresh CO molecule and retarding the reaction rate [9,10]. Additionally, the catalytic activity of CuO-CeO2 is usually negatively affected by water vapor, which limits their practical application. For example, Bae et al. [11] reported that with 14% H2O in the feed, the reaction temperature increased by around 60 and 40 °C respectively for the 10 and 20 at % Cu-CeO2 catalysts prepared by co-precipitation method in the CO catalytic oxidation. Thus, it is highly desired to develop highly efficient and stabilized CO catalytic materials, especially with a strong water resistive property.
It is well known that the dispersion and valence state of copper species, solid solution, and oxygen vacancies associated with the synergistic interaction and catalytic performance strongly depend on the preparation methods. For example, Wang et al. [12] reported that the solvent-free method facilitated the formation of synergistic interaction between copper species and ceria to result in smaller crystallite size and the formation of more Cu+ species together with a high ratio of Ce3+. Shang et al. [13] founded that the impregnation method offered more highly dispersed CuO and stronger synergistic interaction between CuO and CeO2 to promote the reduction of CuO to Cu+ species at the Cu–Ce interface, resulting in the highest catalytic activity, whereas the catalyst prepared by the co-precipitation method suppressed the formation of the Cu–Ce interface, where the adsorbed CO would react with active lattice oxygen to form CO2 to exhibit a lower catalytic performance. Besides, the water resistive property of CuO-CeO2 catalytic systems is also affected by preparation methods [14]. Flame spray pyrolysis (FSP) is a comparatively simple, one-step synthesis for mixed metal oxides [15]. Metal precursors experience a high-temperature and oxygen-rich environment in the flame, and also the rapid quench leads to strong synergistic interaction between the highly dispersed active component and support, as well as formation of more oxygen defects [16]. Moreover, most research has paid attention on the physicochemical-activity relationships of CuO-CeO2 catalysts in CO oxidation, and few works in the literature has reported the relationships among physicochemical properties, the evolution of intermediates (such as hydroxyl groups, CO adsorbed center Cun+ and carbon intermediates) and catalytic activity.
Considering this fact, in order to prepare the CuO-CeO2 catalyst with low temperature CO oxidation activity and high water resistance, as well as reveal the catalytic behaviour, in this work, a range of catalysts with 1–17 wt % CuO were prepared via FSP, and the physical, chemical, morphological and surface electronic properties of the catalysts were systematically characterized by X-ray diffraction (XRD), N2 adsorption-desorption at −196 °C, field emission scanning electron microscopy (FESEM), high-resolution transmission electron microscopy (HRTEM), Raman, X-ray photoelectron spectroscopy (XPS) and hydrogen-temperature programmed reduction (H2-TPR). Moreover, much attention has been paid to the intermediates of CO catalytic oxidation with and without water vapor via in situ diffuse reflectance infrared Fourier transform spectroscopy (in situ DRIFTS).
2. Materials and Methods
2.1. Catalysts’ Preparation
The FSP method was used for synthesis of CuO-CeO2 mixed oxide catalysts with different nominal CuO to CeO2 mass concentration of 1, 5, 9, 14 and 17 wt %. The details of the FSP device and the section view of the spray nozzle were depicted in the report [16]. The precursor solution was prepared by dissolving Cu(CH3COO)2 (Aladdin, Shanghai, China, >98%) and Ce(CH3COO)3·H2O (Mackin, Shanghai, China, 99.9%) into 200 mL propionic acid (Sinopharm, Shanghai, China, 99.9%) to obtain 0.2 M Ce precursor solutions. During the process of preparation, the precursor solution was fed (rate: 5 mL/min) to the flame by a syringe pump and atomized with dispersion oxygen (rate: 3 L/min), and then the dispersed droplets of precursor were ignited by a surrounding supporting flame (1.5 L/min CH4, 3 L/min O2). The gas flow rate was monitored by mass flow controller (D07-11C, Beijing Sevenstar Electronics Co., Ltd., Beijing, China). The productive powder was gathered with glass fiber filters with the aid of a vacuum pump and scraped from the filter for direct use as a catalyst. Pure CeO2 and bulk CuO samples were also produced as a comparison with 0.2 M metal concentration precursors. The catalysts with different CuO loadings (1, 5, 9, 14 and 17 wt %) were denoted as 1, 5, 9, 14 and 17% CuCe, respectively.
2.2. Catalysts’ Characterization
XRD patterns were collected on PANalytical B.V. Empyrean powder diffractometer (Almelo, Netherlands) at a scan speed of 0.0248°/s in the range of 10~90° with Cu Kα radiation (40 kV, 40 mA).
The specific surface area, the pore volume and pore size of the samples were determined from the adsorption and desorption isotherms of nitrogen at −196 °C using an SSA-7300 (Beijing Builder Electronic Technology Co., Beijing, China) apparatus, the catalysts (ca. 100 mg) were out gassed at 150 °C under vacuum for 5 h before measurement.
The morphologies of the catalysts were collected at ×60,000 magnification by FESEM (JOEL, JSM 7001F, Akishima, Japan) with energy-dispersive X-ray spectroscopy (EDX) signal detection. HRTEM images were acquired by a JEM 2100F electron microscopy (JEOL, 200KV). The sample was prepared by dipping a copper-grid supported transparent carbon foil in an ethanol solution, and the grid was dried in the open air.
The Raman spectra were conducted from 200 to 800 cm−1 on a Renishaw RM2000 (Wotton-under-Edge, UK) using a laser wavelength of 532 nm with a power of 1.25 mW on the sample (objective 50×), the accumulations of spectra were 10 scans.
H2-TPR measurement was performed on AutoChemisorbII 2920 pulse chemisorption system equipped with a TCD detector (Micromeritics, Norcross, GA, USA) and a TPx (temperature-programmed controller and software) system. 50 mg of the sample was reduced under 25 mL/min of 10% H2/N2 along with temperature rising up to 700 °C at a 10 °C/min ramping rate.
X-ray powder surface species of the as-prepared catalysts were determined by XPS using an XLESCALAB 250Xi electron spectrometer from VG Scientic (Thermo Fisher Scientific, Waltham, MA, USA), using a monochromatic Al Kα radiation. The binding energies were calibrated with respect to the C 1s energy of incidental graphitic carbon at 284.8 eV. The surface compositions of all samples in terms of atomic ratios were calculated, using a Shirley-type background and empirical cross section factors for XPS transmission.
In situ DRIFTS were collected by using a Fourier transform infrared spectrometer (Vertex 70, Bruker, Billerica, MA, USA), equipped with a reaction cell (PIKE, Fitchburg, WI, USA) and an MCT detector. The spectra were averaged over 32 scans with a resolution of 4 cm−1. Prior to measurement, the catalyst was pretreated at 300 °C in a N2 flow (70 mL/min−1) for 30 min to remove contaminants from the catalyst surface. After cooling down to 25 °C, the background spectrum was collected. Then a stream (70 mL/min−1) of 1 vol % CO, 0.6 vol % O2, balanced with N2 (the same atmosphere as the CO catalytic oxidation test) was introduced to the reaction cell.
2.3. Catalytic Activity Measurement
The catalytic activity was carried out using a conventional fixed-bed quartz reactor (10 mm inner diameter). The catalyst (70 mg, 40–60 mesh) mixed with quartz sand (140 mg) with quartz wool packed at both ends of the catalyst bed was loaded in the quartz reactor. The gas mixture of 1 vol % CO, 0.6 vol % O2 and balance with N2 was passed through the reactor for CO catalytic oxidation. The total flow rate was 70 ml × min−1, matching a weight hourly space velocity (WHSV) at 60,000 mL × g−1 × h−1. The test was stabilized at each temperature for 60 min, the outlet products were measured with on-line gas chromatography (Shimadzu GC-2014, Kyoto, Japan) equipped with a flame ionization detector (FID), and another FID with a conversion furnace for converting CO2 to CH4 was used to analyse the concentration of CO2 in the outlet gas. A K-type thermocouple was placed in the middle of the catalyst bed to measure the temperature of the catalyst.
The complete conversion values of CO () and the yield of CO2 () were calculated according to the following equations:
(ppm), (ppm) and (ppm) were the concentrations of CO in the inlet and outlet gas, and CO2 in the outlet gas, respectively.
3. Results and Discussion
3.1. Microstructure of the Prepared Catalysts
The X-ray patterns of the catalysts are compiled in Figure 1. All patterns exhibit the featured peaks of the cubic fluorite structure of CeO2 (JCPDS 034-0394), and also two small diffraction peaks of CuO (JCPDS 044-0706) are detected at 35.5 and 38.9° with CuO from 9 wt %, which indicates copper species are aggregating on the CeO2 support, for CuO displays very limited solubility in CeO2 framework. The particle sizes of the catalysts are calculated by the Scherrer equation, and the results are listed in Table 1. With the introduction of copper species, the crystallite sizes of the samples become larger stemming from the presence of foreign dopants during the high-temperature particle formation in the FSP process leading to the thermal sintering effect [17]. Interestingly, the crystallite size of the 14% CuCe sample shrinks, together with the smallest cell parameter, which stem from the smaller ionic radius of Cu2+ ions (0.073 nm) than either Ce4+ (0.097 nm) or Ce3+ ions (1.14 nm), as shown in Table 1. The result shows that the largest amounts of Cu2+ ions are located into the CeO2 framework to form a Cu-Ce-O solid solution [18], favoring the redox reaction of CO catalytic oxidation.
Figure A1 presents the N2 adsorption-desorption isotherms and the pore size distributions of the obtained samples. The pore belongs to the type IV isotherm with a H3 hysteresis loop (p/p0 > 0.4), as shown in Figure A1a, meaning the pore structure is mesoporous, which is further verified by the pore size distribution (Figure A1b). The pore volumes and pore sizes of these samples are in the range of 0.15 to 0.20 cm3 × g−1 and 9.10 to 13.60 nm, respectively. With the increment of CuO contents, the surface areas of the catalysts linearly decrease from 54.2 to 38.9 m2 × g−1 (Table 1), which is attributed to aggregation of the large particles of CuO [19], and in agreement with the XRD results. It is notable that the sequence of the surface areas of the CuO-CeO2 catalysts is not in accordance with the catalytic activity discussed in the following section, revealing that the specific surface area is not the primary factor to affect the catalytic activity for CO oxidation.
The 14% CuCe sample was subjected to field emission scanning electron microscopy with energy dispersive X-ray spectroscopy (FESEM-EDX) analysis to obtain information about element dispersion, as shown in Figure A2. Cu, Ce and O elements exhibit the homogeneous distributions with related peaks of various elements distinctly observed in the spectra and their proportions. The simultaneous nucleation of Cu and Ce in the flame along with the rapid-quenching stage can enhance the formation of atomic-scale dispersed active element sites [20], which is feasible for the interaction between CuO and CeO2 during the reaction.
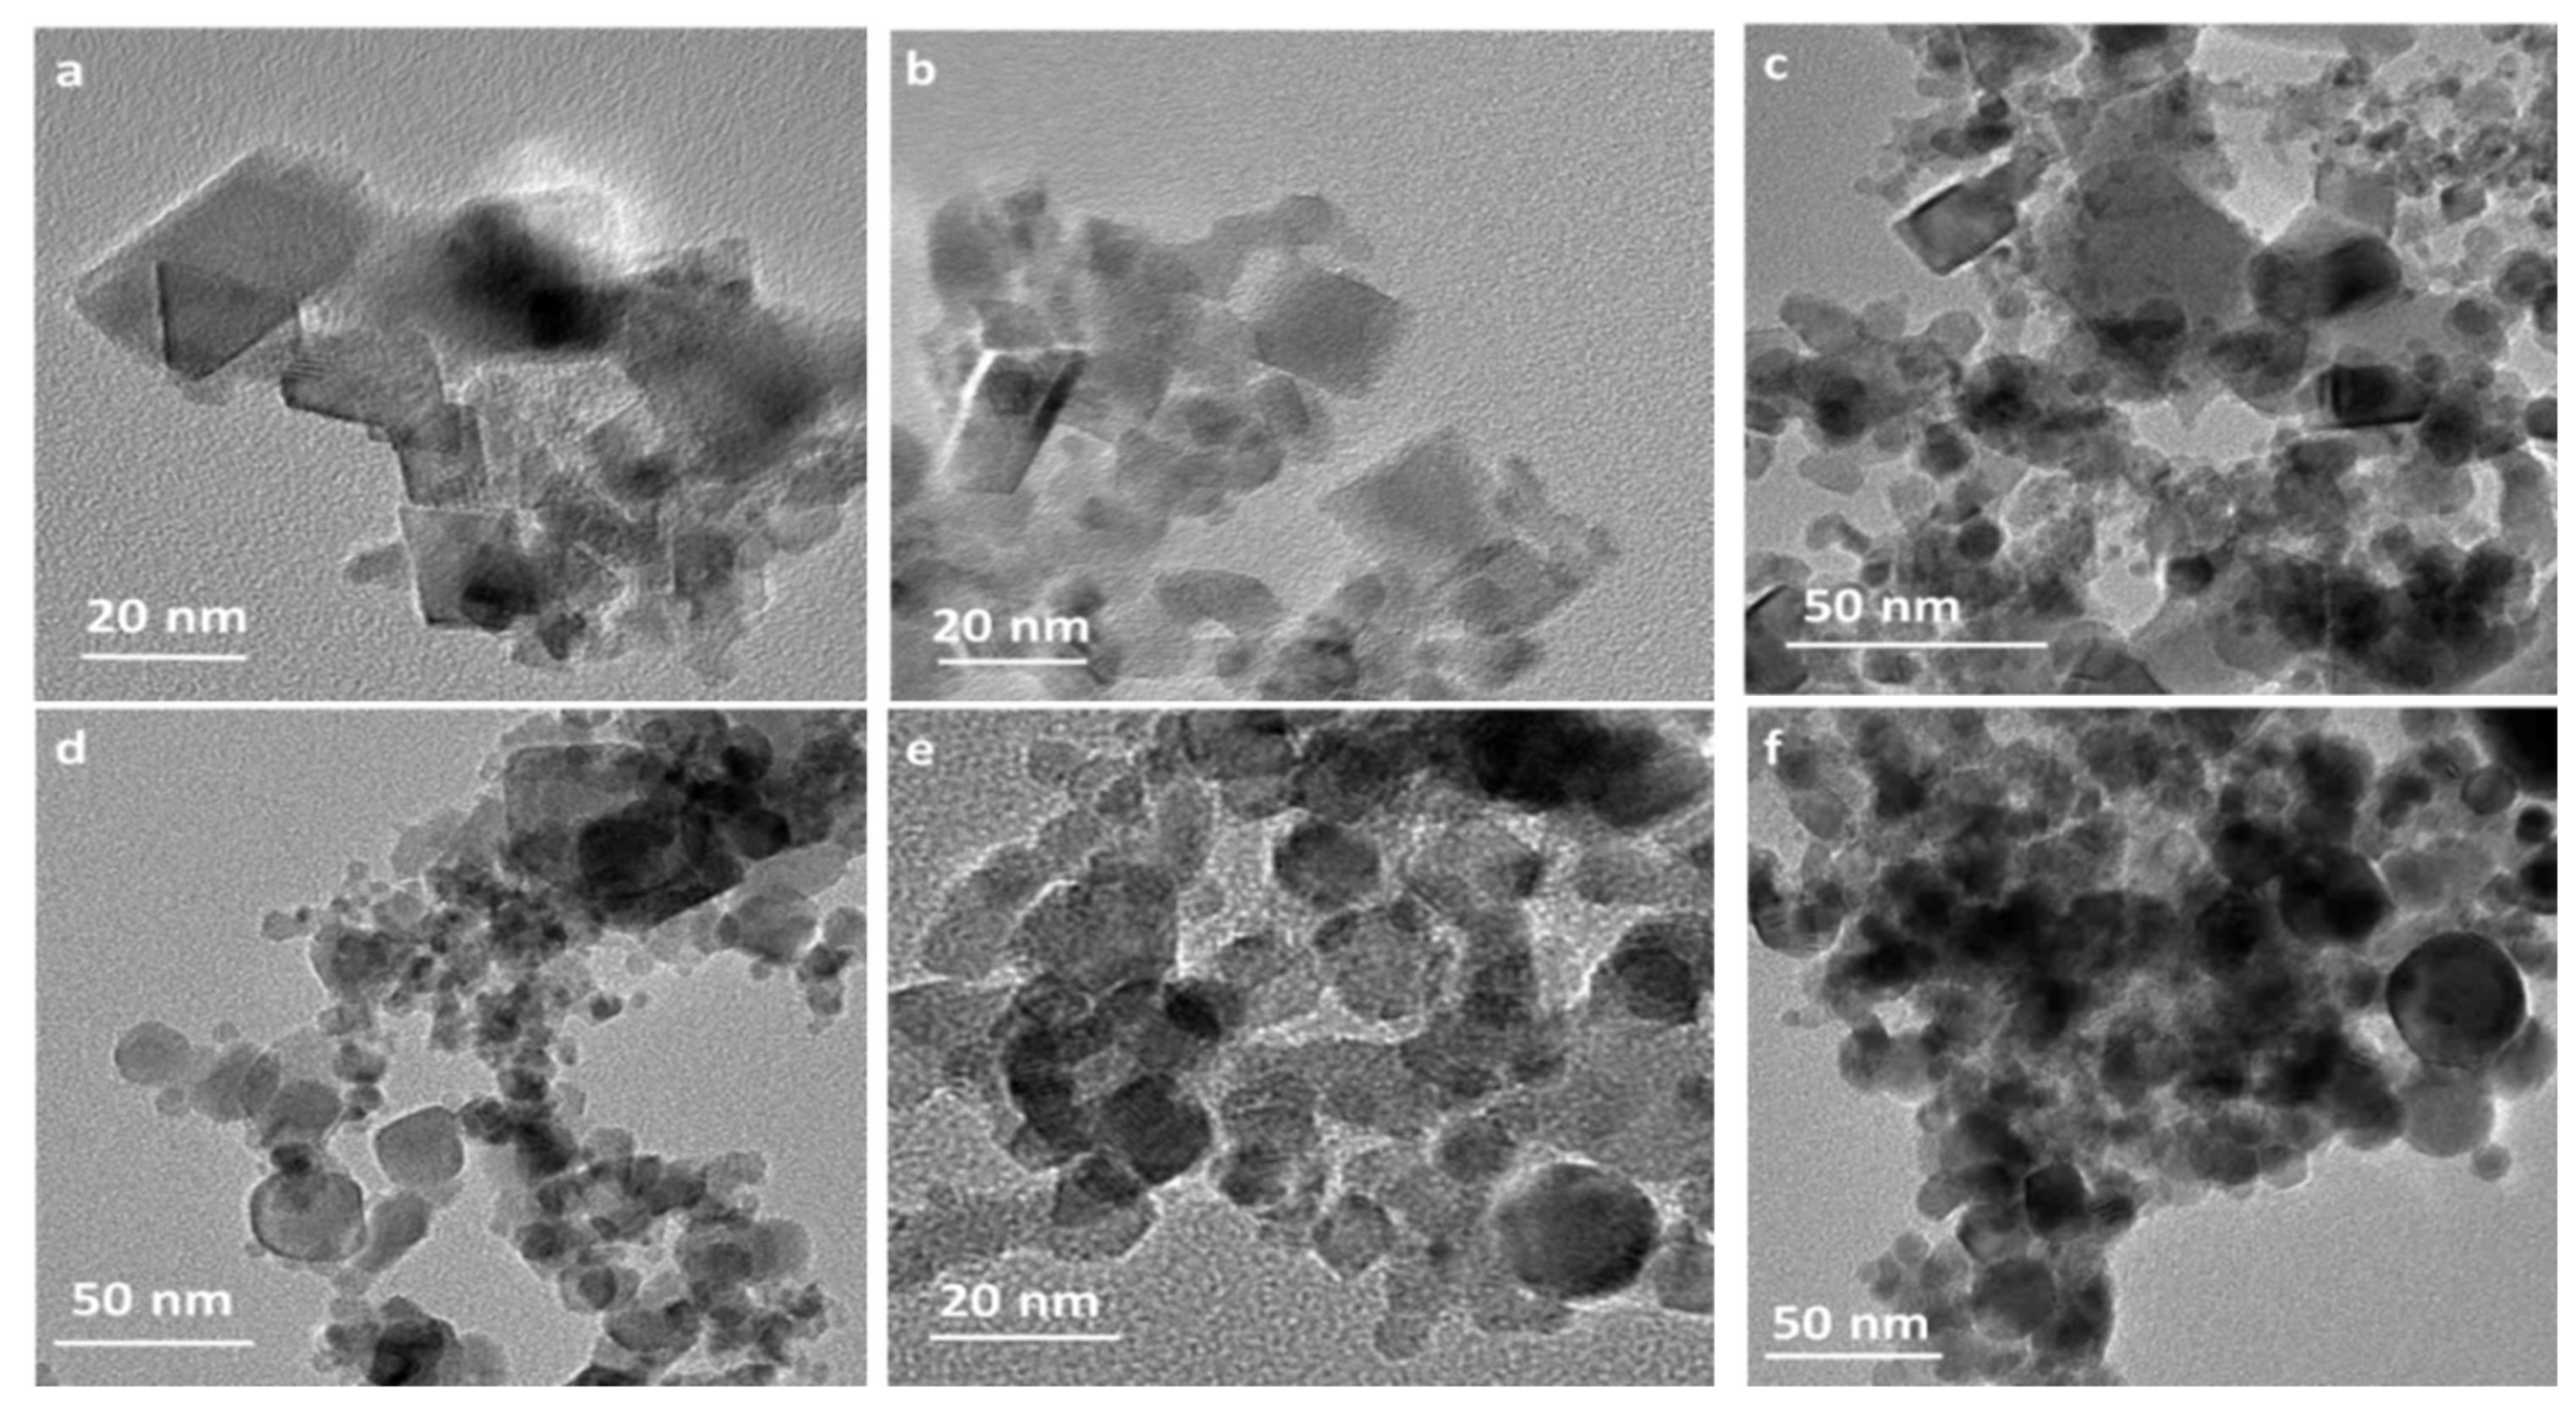
The morphological transformation of the samples with the incorporation of the copper was investigated and the results are depicted in Figure A3. The particles sizes estimated from HRTEM images are approximately from 15–40 nm, which is compliant with the crystallite sizes calculated by the Scherrer formula. The pure CeO2 displays rhombohedral morphology (Figure A3a). Upon doping with 1 wt % CuO, the morphology of the catalyst is not obviously changed (Figure A3b). As the CuO contents are further increased, the morphology of samples transform to polyhedral (the 5 and 9% CuCe samples, Figure A3c,d), through to sphere (the 14 and 17% CuCe samples, Figure A3e,f), suggesting the preferential growth directions of the crystals are disrupted by the introduction of copper [21].
HRTEM measurement also provides the microstructures of the samples. For CuO-CeO2 catalysts, the lattice fringes of 0.29–0.32 nm presenting on Figure 2a–d can be indexed to the (111) crystal planes of CeO2. It is worthy of note that the 14% CuCe sample exhibits the smallest lattice spacing of 0.29 nm, which is in agreement with the formation the most solid solutions observed in XRD, suggesting the existence of strongest synergistic interaction between the active components and the support [22]. Importantly, the lattice fringes of the 14% CuCe sample displays lattice distortions (which include bending and dislocation), as depicted in Figure 2e, which are induced by the copper ions dopants lowering the energy for oxygen vacancies segregation and mobility of lattice oxygen [23].
Raman spectra (Figure 3) were used to further investigate the structure of the catalysts. The observed main band of pure CeO2 is 463 cm−1, which is ascribed to the triple degenerate F2g mode of ceria [24]. With increasing CuO contents, except the 1% CuCe sample, the slight red shifts of the F2g Raman bands of the Cu-containing samples suggest the incorporation of Cu atoms into the CeO2 lattice [25]. The oxygen vacancies caused by the crystalline distortion are also investigated by Raman spectra. The band OV at 606 cm−1 can be attributed to Frenkel-type anion defects [26]. The relative intensity ratio between the defect band (Iov) and the F2g band (IF2g) of the fluorite phase can be used as an indicator of the oxygen vacancies [27]. Figure 4b displays the trend of the Ov/F2g values. It is obvious the oxygen vacancy changes with increasing of CuO content in a volcano-shaped tendency. The 14% CuCe sample displays the most amounts of oxygen vacancies.
3.2. The Surface Composition of Catalysts
In order to obtain information on the surface element distribution, we analyzed the Cu 2p, Ce 3d and O 1s (Figure 4) by XPS measurement. The ratio values of Cu to Ce are listed in Table 2. Comparing with the nominal values of Cu/Ce of the samples, the values obtained by XPS are 3~16 times higher, which further confirms the high dispersion of Cu species detected by FESEM results. Figure 4a displays two groups of peaks for the Cu-containing catalysts: the peak at 928.9–939.8 eV is assigned to Cu 2p3/2, while the peak at 950.2–958.7 eV belongs to Cu 2p1/2 [28]. Both peaks are further de-convoluted into Cu2+ (935.1–939.8 eV and 954.8–958.7 eV for 2p3/2 and 2p1/2, separately) and Cu+ or Cu0 (928.9–935.1 eV and 950.2–954.8 eV for 2p3/2 and 2p1/2, separately). The relevant satellites exist in the 940.1–944.0 eV (Cu+ or Cu0 2p3/2), 945.5–947.3 eV (Cu+ or Cu0 2p1/2) and 960.9–968.0 eV (Cu2+ 2p1/2) ranges [29]. In order to discern between Cu0 and Cu+ as a very tiny difference in peak position, the Auger L3VV lines are further investigated. The peaks in the Auger kinetic spectra 915.4 and 917.5 eV correspond to Cu+ and Cu2+ species, respectively (Figure A4). By contrast, the peak of Cu0 in Cu L3VV spectrum is generally at 918.7 eV, but the current peaks arise in lower kinetic energy, which suggests no exsitence of Cu0, meanwhile confirming the presence of Cu+. The values of Cu2+/Cu are calculated by de-convoluted spectra, and listed in Table 2. The copper species on the 1% CuCe sample is fully Cu+ ions. A small number of copper species can easily form Cu+, because of the similarity of Cu+ and Ce4+ ionic radii [30]. With the increment of CuO contents, the ratios of Cu2+ are monotonically increased from 0 to 67.2% (Table 2), as Ce4+ ions are continuously substituted by copper ions, there are more Cu2+ formed to maintain the electronic neutrality of the lattice [31]. This trend is further confirmed by the high kinetic energy shift of the broad peaks (from 915.4 to 917.1 eV) in the spectra of Cu L3VV Auger (Figure A4).
The coexistence of Cu+ and Cu2+ is linked to the redox cycle of Ce3+ ↔ Ce4+ [32]. Ce 3d spectra can be de-convoluted into three pairs of spin-orbit doublets shown in Figure 4b. The characteristic peaks denoted as v (at 882.5 eV), v2 (at 889.6 eV) and v3 (at 898.7 eV) belong to Ce4+ 3d5/2, and the characteristic peaks marked as u (at 900.6 eV), u2 (at 907.7 eV) and u3 (at 916.6 eV) are features of Ce4+ 3d3/2, the other two peaks denoted as v1 (at 885.6 eV) and u1 (at 903.9 eV) are ascribed to Ce3+ 3d5/2 and Ce3+ 3d3/2, separately [33]. The relative contents of Ce3+/Ce over the surfaces of the catalysts are calculated from the sum of areas of Ce3+ to the entire cerium and listed in Table 2. The Ce3+/Ce values vary as a volcano-shaped curve with increasing CuO content (Figure 4c). The 14% CuCe sample possesses the highest values of Ce3+/Ce (35.4%) than other catalysts, which is in good agreement with the largest amounts of oxygen vacancies verified by Raman.
The trends of the ratios of Cu2+/Cu and Ce3+/Ce of the samples are depicted in Figure 4c. As CuO contents increasing from 1 to 14 wt %, both the ratios of Cu2+ and Ce3+ in the CuO-CeO2 catalysts increase concurrently. These results provide evidence of the existence of redox equilibrium of Cu2+ + Ce3+ ↔ Cu+ + Ce4+, which has been claimed to be the origin of a synergistic interaction in the CuO-CeO2 catalysts [34]. During the flame synthesis process, the redox equilibrium progressively shifts to the left to simultaneously increase the ratios of Cu2+ and Ce3+ as more copper species incorporation, suggesting electrons transfer from copper oxide clusters to ceria support, and the electronic synergistic interaction achieves the maximum on the 14% CuCe sample. Nevertheless, as the CuO content is further increased to 17 wt %, the ratio of Ce3+ of the sample declines with the opposite variation trend compared with the ratio of Cu2+, meaning the synergistic interaction turns to weakening.
The O 1s spectra can be de-convoluted into three contributions, as shown in Figure 4c. The peaks at 528.9–529.7 eV, 530.6 and 531.5–532.7 eV, which are ascribed to the lattice oxygen (O2−), surface adsorbed oxygen (O−/O22−) and hydroxyl oxygen (OOH), respectively [35]. The O2− peak position of the 14% CuCe sample displays higher binding energy value (529.3 eV) than those of other samples (528.5–529.2 eV) originating from “O → Cu” and “O → Ce” electron transfer, which promotes the instability of lattice oxygen, and improves the mobility of lattice oxygen [22]. Moreover, the results further confirm that the CeO2 lattice is distorted by the introduction of Cu ions as observed in the HRTEM results, because the lattice distortion lowers the energy for lattice oxygen release [36]. In the CO catalytic oxidation reaction, the gaseous O2 is trapped by oxygen vacancies, and transfers to the active surface lattice oxygen; after the reactions of adsorbed CO with surface lattice oxygen, the subsurface lattice oxygen readily refilled the oxygen surface [37].
3.3. Redox Properties of the Prepared Catalysts
The H2-TPR experiment is plotted on Figure 5. Pristine CeO2 displays a broad peak centred at 275 °C, which is ascribed to the surface reduction of CeO2 [38]. The 1 and 5% CuCe samples exhibit two reduction peaks (labelled α and β), which are attributed to the reduction of highly dispersed CuOx species and Cu+/Cu2+ ions into the ceria lattice, respectively [29,39]. Besides α and β peaks, another reduction peak γ belongs to the bulk CuO appears on the samples with the increment of CuO contents from 9 wt % [40], which is in accordance with the XRD results. With the introduction of Cu, the tendency of the low-temperature reduction peak indicates that the coexistence of CuO and CeO2 promotes the surface reducibility, and the 14% CuCe sample exhibits the lowest reduction temperature. The 14% CuCe sample can weaken the strength of the Ce-O bond through the strong synergistic interaction between CuOx and CeO2 species and promote desorption of the surface lattice oxygen from the CeO2 surface, thereby enhancing the redox property of the catalyst [7].
3.4. The CO Catalytic Oxidation Performance
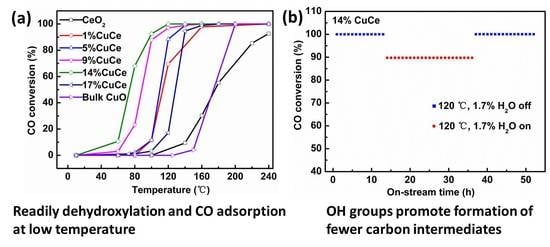
Figure 6a shows the CO conversion as a function of reaction temperature at WHSV = 60,000 mL × g−1 × h−1 over the prepared samples. The temperatures of 50 and 90% CO conversion (T50 and T90) are summarized in Table 2. The pure CeO2 has very limited activity for CO oxidation with T50 = 176 °C, T90 = 233 °C, and the bulk CuO exhibits low CO catalytic activity with T50 = 174 °C, T90 = 195 °C. After incorporation of CuO, the CO oxidation performances of the CuO-CeO2 samples are obviously improved, which is attributed to a synergistic interaction between CuO and CeO2. With the increment of CuO, the catalytic performances of the CuO-CeO2 samples also display as a volcano-shape tendency, and the 14% CuCe sample exhibits the optimal catalytic activity, achieving T50 = 74 °C, T90 = 98 °C.
The kinetic study is conducted for all these catalysts based on the CO conversion not exceeding 10%, following first-order kinetics [41]:
where is the CO gas flow rate (mL/min), is the CO conversion, is the catalyst weight (g), and , , A, and are the reaction rate (mmol × g−1 × s−1), pre-exponential factor, rate constant (s−1), and apparent activation energy (kJ × mol−1), respectively.
The reaction rate for CO oxidation at T = 80 °C for all samples are shown in Figure 6b. The reaction rate of the 14% CuCe sample is 1.82 mmol × g−1 × h−1, which is obviously larger than these of other samples (0–0.62 mmol × g−1 × h−1). The Arrhenius plots for the CO oxidation are displayed in Figure 6c. The activation energies are on account of the slopes of the Arrhenius plots between ln () versus 1000/T and listed in Table 2. The results show that the values decreased in the following sequence: 14% CuCe < 9% CuCe < CeO2 < 17% CuCe < 5% CuCe < Bulk CuO < 1% CuCe, which confirms the superior catalytic performance of the 14% CuCe sample. Moreover, compared with CuO-CeO2 catalysts prepared by other methods from the literature (Table 3), a nearly full CO conversion at a temperature of 120 °C in the present work was better than the previous 1MnOx-5CuO (Mn/Cu molar of 1:5)-FSP, 0.4% mol CuO-SCS, 10 wt % CuO-IMP, 14.1 mol % CuO-ST, 5 wt % CuO-MN, 1 wt % Pd-IMP, and 4 Co3O4 (Co/Ce = 4/1)-STA.
To investigate the stability and effect of water vapor on the catalytic performances of the 14% CuCe sample, the on-stream reactions at 120 °C were implemented in the feed of water vapor (Figure 6d). The catalyst maintains full conversion at 120 °C over the first 13 h of running without water vapor. In the following 23 h CO stream with the feed of 1.7% H2O, it can be found that water vapor has little negative effect on the catalyst, resulting in the CO conversion from 100 to 89.8%. Interestingly, after removing water vapor, the catalytic activity is fast recovered. The results suggest that the 14% CuCe catalyst has long stability and high resistance to water vapor. During the flame synthesis process, high temperature of the flame (>1000 °C) is in favor of the formation of the metal oxide with enhanced stability [16]. Furthermore, the synergistic effect originating from electron transfer between active species and support often plays a pivotal role in water resistance of the catalysts [48].
3.5. CO and O2 Co-Adsorption In Situ Diffuse Reflectance Infrared Fourier Transform Spectroscopy (DRIFTS) Analysis
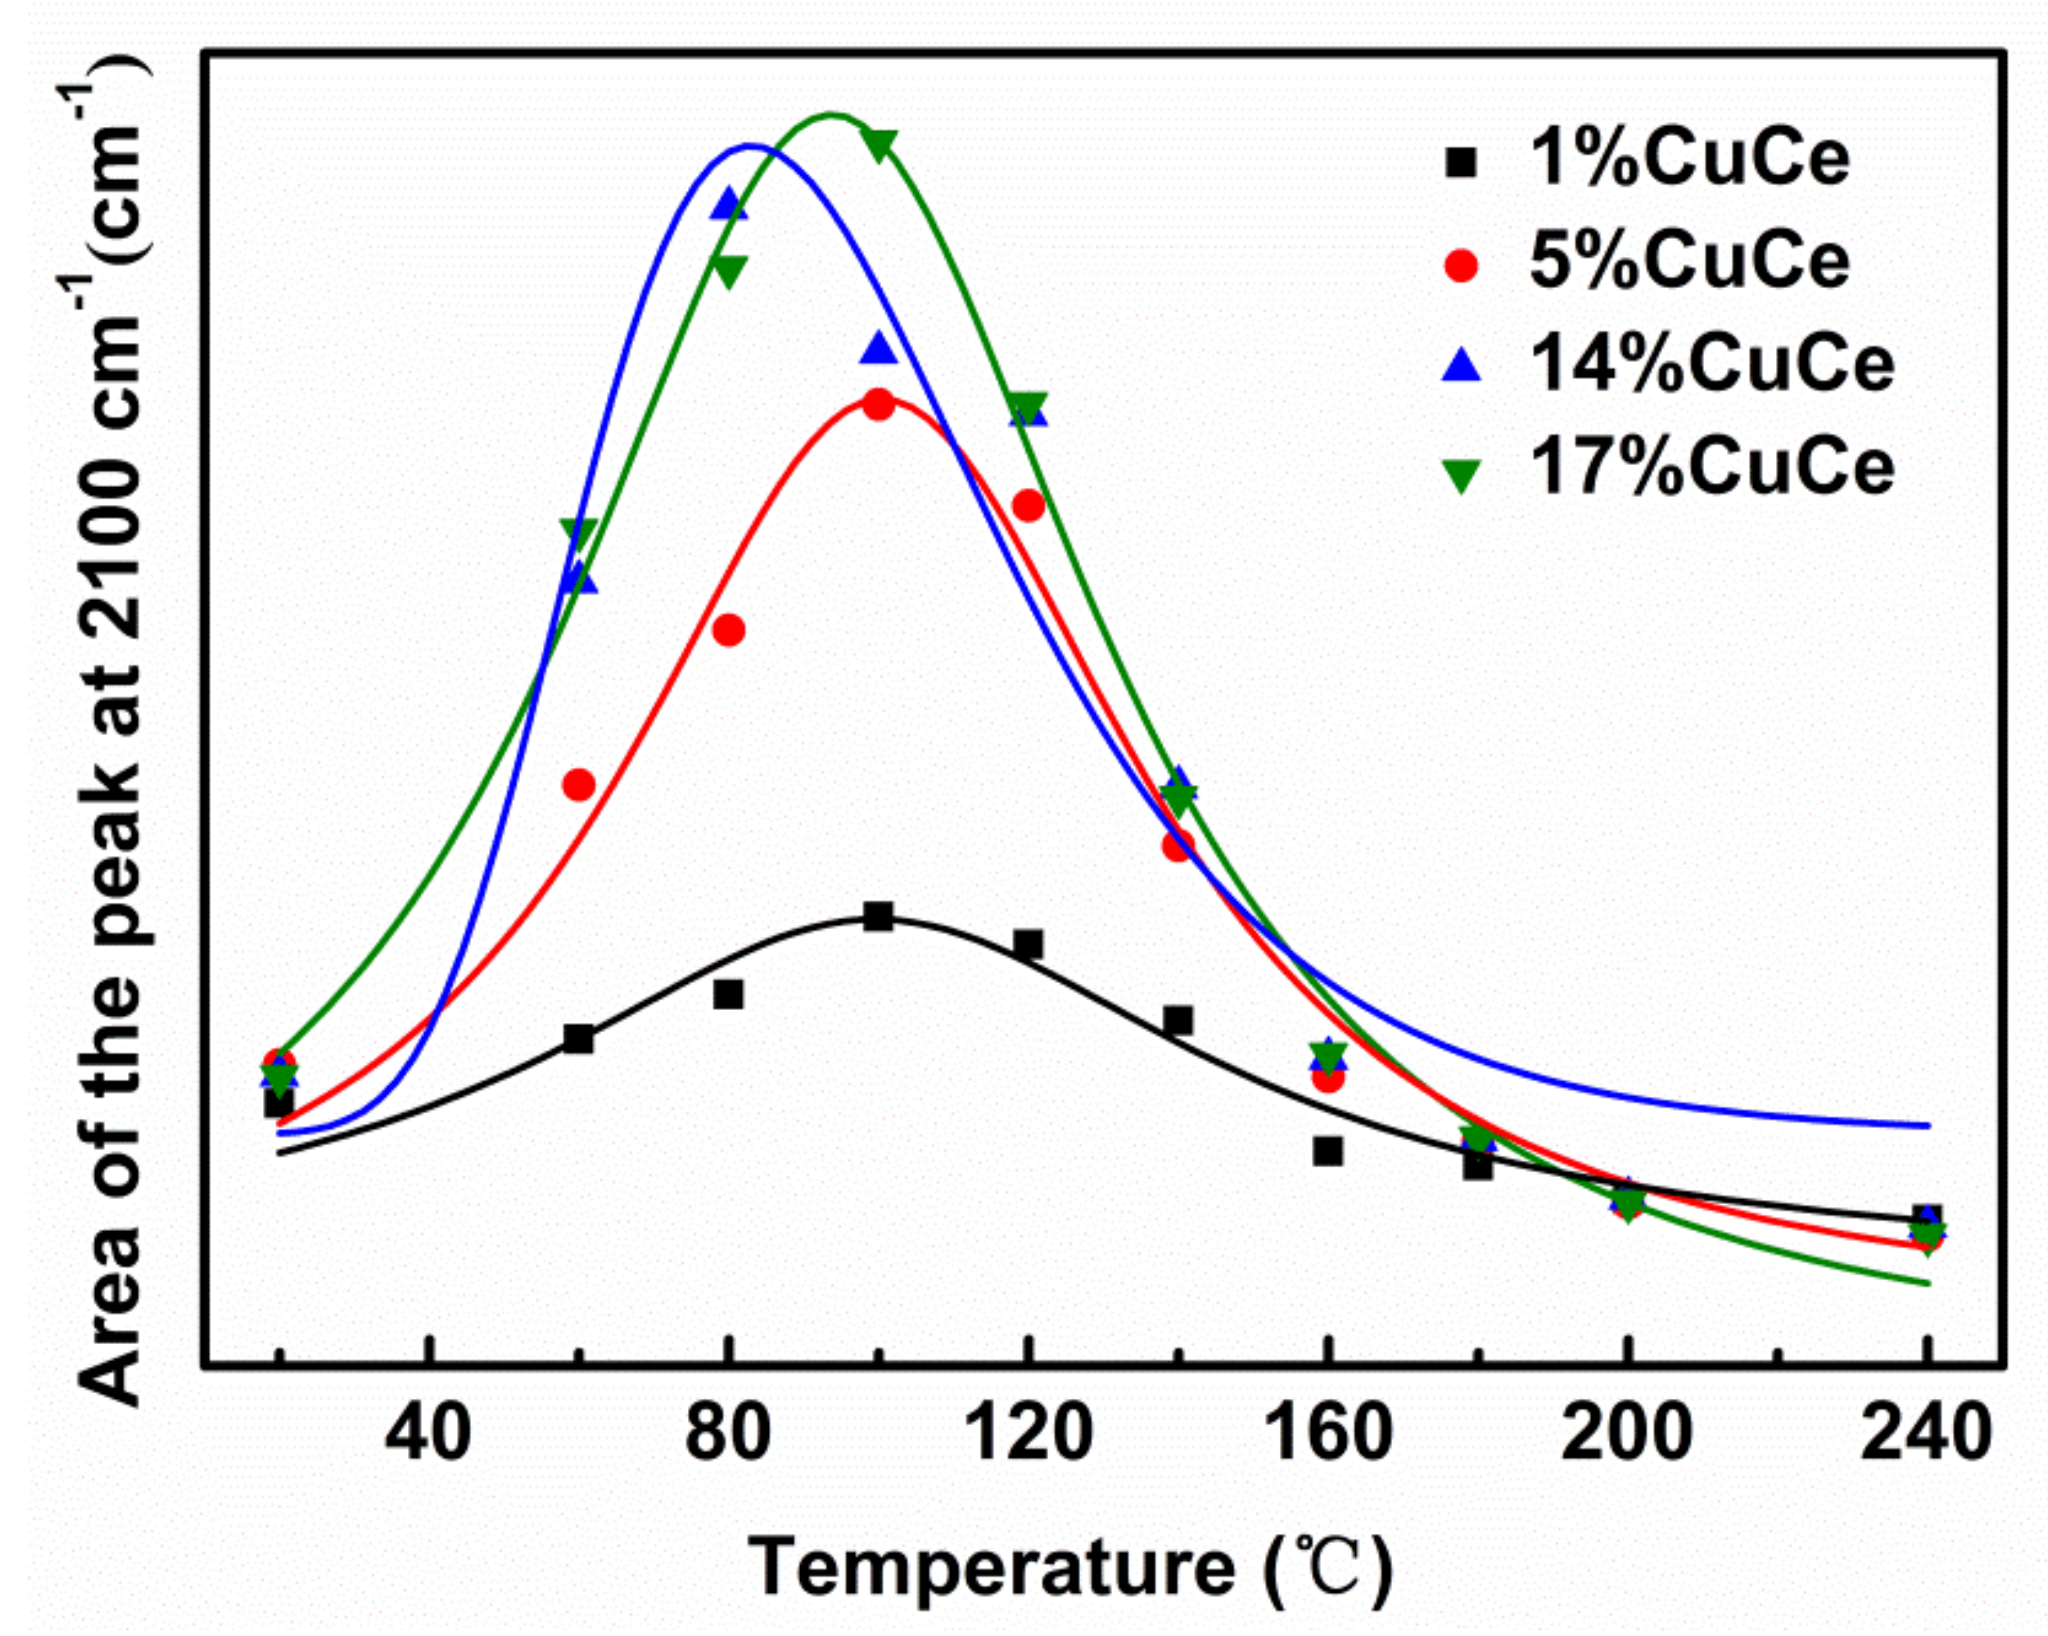
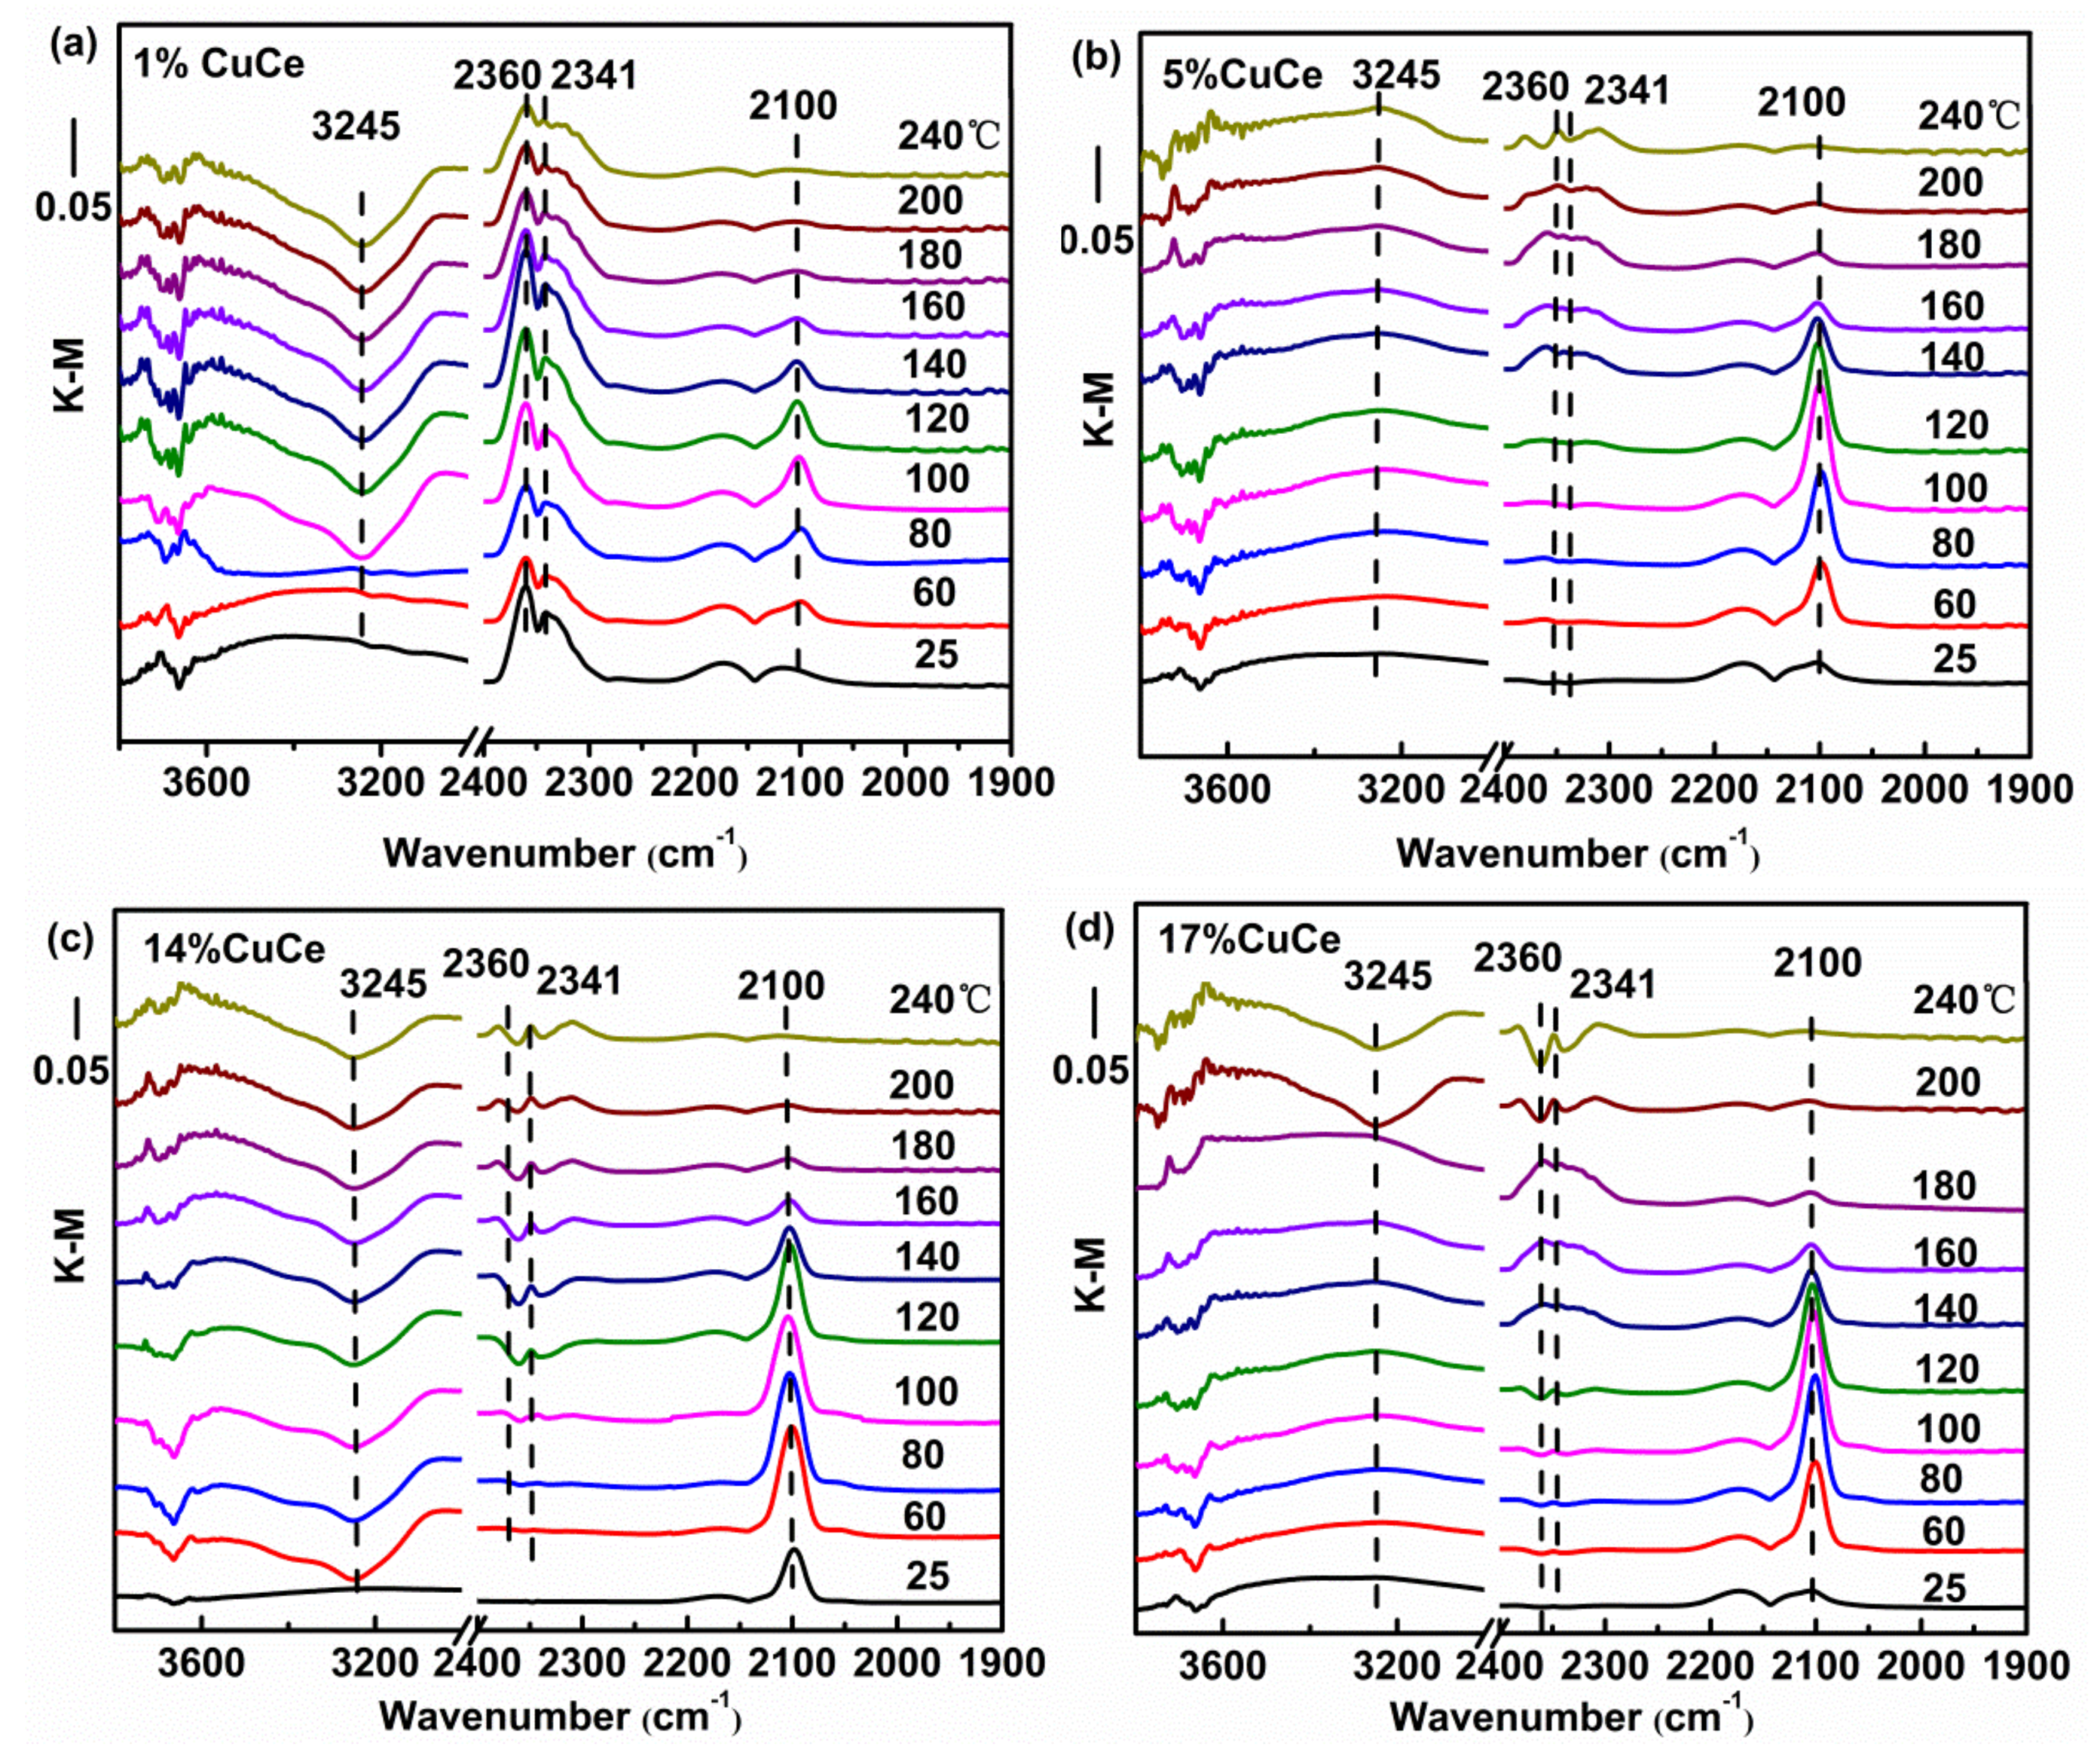
In order to study the nature of intermediates of CO catalytic reaction, in situ DRIFTS analysis was examined. Figure 7 presents the DRIFTS spectra recorded under operando CO + O2 reaction stream over CuO-CeO2 catalysts with different copper contents at the temperature from 25 to 240 °C. The bands in the 3800–3000 cm−1 range correspond to hydroxyl groups. Note that the area of the hydroxyl band shows negative values because hydroxyls are removed during the reactions. The initial temperature of dehydroxylation of the 14% CuCe sample is at 60 °C, which is significantly lower than those of other samples, suggesting the hydroxyl groups are readily removed for a good accessibility of the active center in the catalytic oxidation reaction [8]. Sanchez et al. reported the degree of difficulty of surface removal of OH− correlated with the reducibility of the catalyst [49]. The zone in 2400–1900 cm−1 is predominantly composed of the vibrations of two species, CO2 and Cun+-CO species, as observed on Figure 7, including the generation of CO2 represented by the rotational vibration at 2360 and 2341cm−1, and the 2250–1950 cm−1 range, where a single band at 2100 cm−1 corresponding to the Cu+-CO carbonyl is observed [8,50], suggesting Cu+ is providing CO adsorption sites. The areas of the Cu+-CO band of different catalysts monitored with the reaction temperature were fitted to curve and depicted in Figure A5. The maximum temperature of carbonyl coverage of the 14% CuCe sample (80 °C) is lower than those of other samples (100 °C), indicating that CO is readily adsorbed on the 14% CuCe sample at lower temperature. The synergistic interaction between CuO and CeO2 support triggered by electron transfer of the 14% CuCe sample is benefical for enhancing CO adsorption to promote the catalytic activity [51].
Figure 8 shows the variations of hydroxyl groups, Cu+-CO and carbon intermediates without and with water vapor on the 14% CuCe sample. The bands below 1700 cm−1 are attributed to the carbon intermediates (mainly bicarbonate and carbonates) [8]. With no presence of water vapor (Figure 8a), 1570 and 1291 cm−1 bands are attributed to bicarbonate species [52], and the band at 1465 cm−1 belongs to mono- or poly-dentate carbonates [53]. With 1.7% H2O in the feed, the intensities of the Cu+-CO bands of the sample become weakened, combining with accumulation of large amounts of hydroxyl groups on the surface, as shown in Figure 8b, which indicates a blocking effect induced by the presence of molecular water, limiting access of CO adsorption on Cu+. Interestingly, the specific carbon species are modified after presence of water vapor. In the presence of water, the bands at 1570 cm−1 keep the stability, while the bands at 1465 and 1291 cm−1 become weak (Figure 8b,c), suggesting the formations of partial carbonates and bicarbonate decreased. Because the hydroxyl groups caused by water vapor on the catalyst surface play a key role in determining the nature of the carbon-based intermediates, which favor the formation of bicarbonates with respect to carbonates. Bicarbonates produce faster CO oxidation rates than carbonates [8]. Therefore, although there is an adverse effect for CO adsorption on Cu+, fewer carbon intermediates, especially carbonates, generate on the interface of the catalysts with positive effect, which can still sustain the high CO conversion in the presence of water vapor. The spectra of the catalysts in the water vapor feed are invariable, as depicted in Figure 8d, which is consistent with the high stability of water resistance.
4. Conclusions
In this work, we investigated the effect of CuO contents on the physicochemical properties and CO catalytic behaviour of the flame-made CuO-CeO2 catalyst. The 14% CuCe sample exhibited the best CO catalytic activity with T90 at 98 °C, and good stability as well as high resistance to water vapor, which are ascribed to a greater number of defect sites (lattice distortions, Ce3+ ions, and oxygen vacancies) and high reducibility originated from the strong synergistic interaction. The intermediate of CO catalytic oxidation reaction without and with water vapor were further investigated, the strong synergistic interaction leads readily to dehydroxylation and CO adsorption at low temperature. Importantly, with the presence of water vapor, although there is an adverse effect to the access of CO adsorption on Cu+, there is formation of less carbon intermediate, especially less carbonates, which exhibit a positive effect. These results demonstrate the FSP method is a rapid and effective strategy for preparing composite metal oxides nanocatalysts with a strong synergistic interaction among the oxides to improve the catalytic performance.
Author Contributions
Authors equally contributed to the conception, the design, the analysis of the experimental activity and to the writing of the paper.
Funding
This research described above was financially supported by the National Key Research and Development Program of China (2016YFC0204903, 2016YFC0207100, 2017YFC0702705 and 2017YFC0211503), the National Natural Science Foundation of China (No. 51672273), the National Hi-tech Research and Development Program of China (863 Program, 2012AA062702) and the Open Research Fund of State Key Laboratory of Multi-phase Complex Systems (No. MPCS-2017-D-06).
Conflicts of Interest
The authors declare no conflict of interest.
Appendix A
Figure A1.
(a) N2 adsorption-desorption isotherms curves; (b) pore size distribution calculated from the desorption branch of the prepared samples.
Figure A1.
(a) N2 adsorption-desorption isotherms curves; (b) pore size distribution calculated from the desorption branch of the prepared samples.
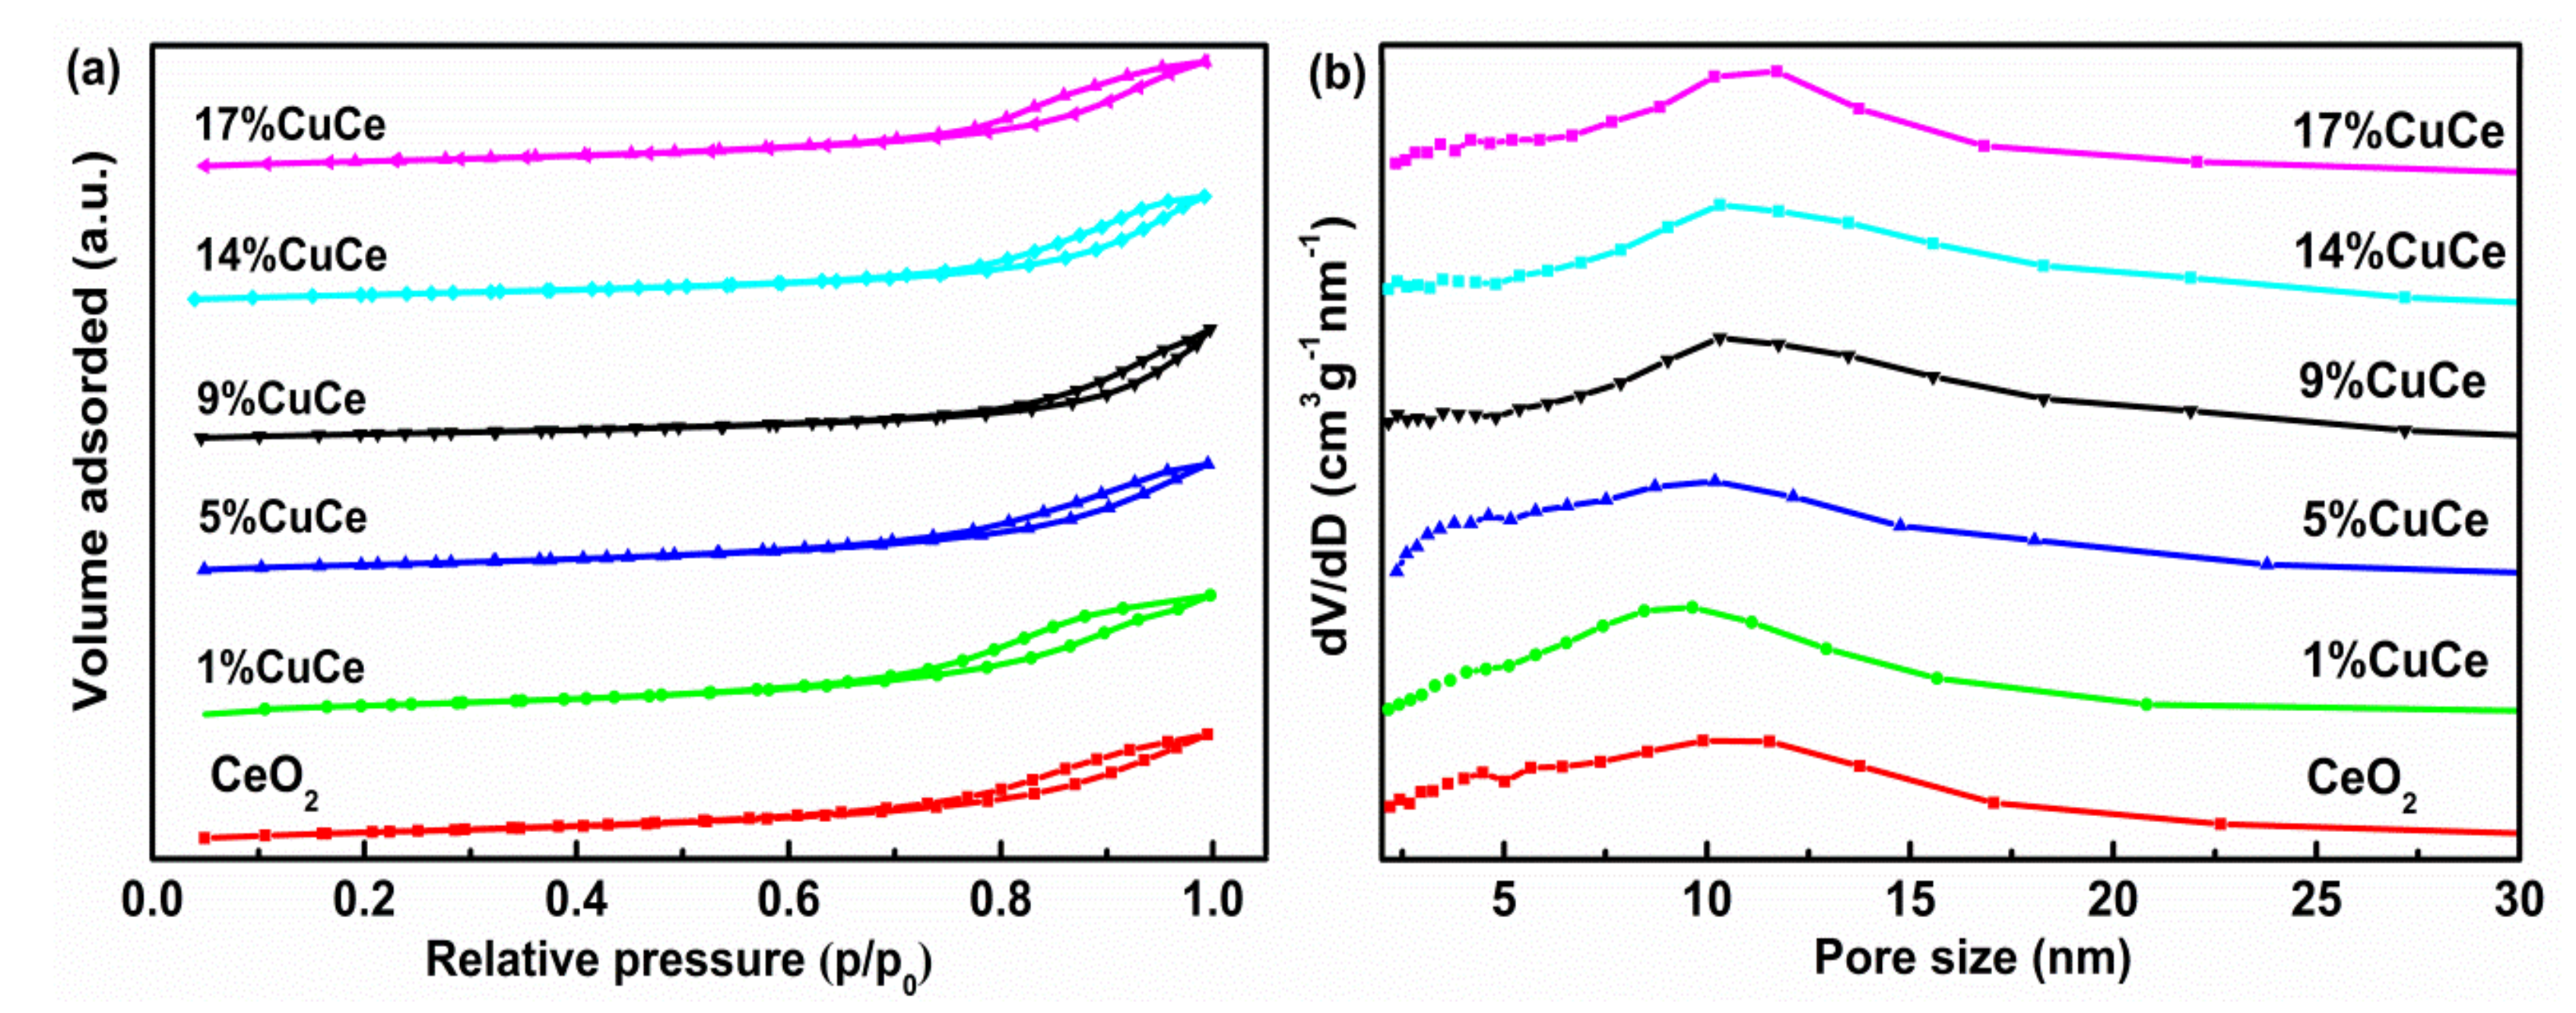
Figure A2.
Field emission scanning electron microscopy (FESEM) images, element distributions and energy-dispersive X-ray spectroscopy (EDX) data for the 14% CuCe sample.
Figure A2.
Field emission scanning electron microscopy (FESEM) images, element distributions and energy-dispersive X-ray spectroscopy (EDX) data for the 14% CuCe sample.
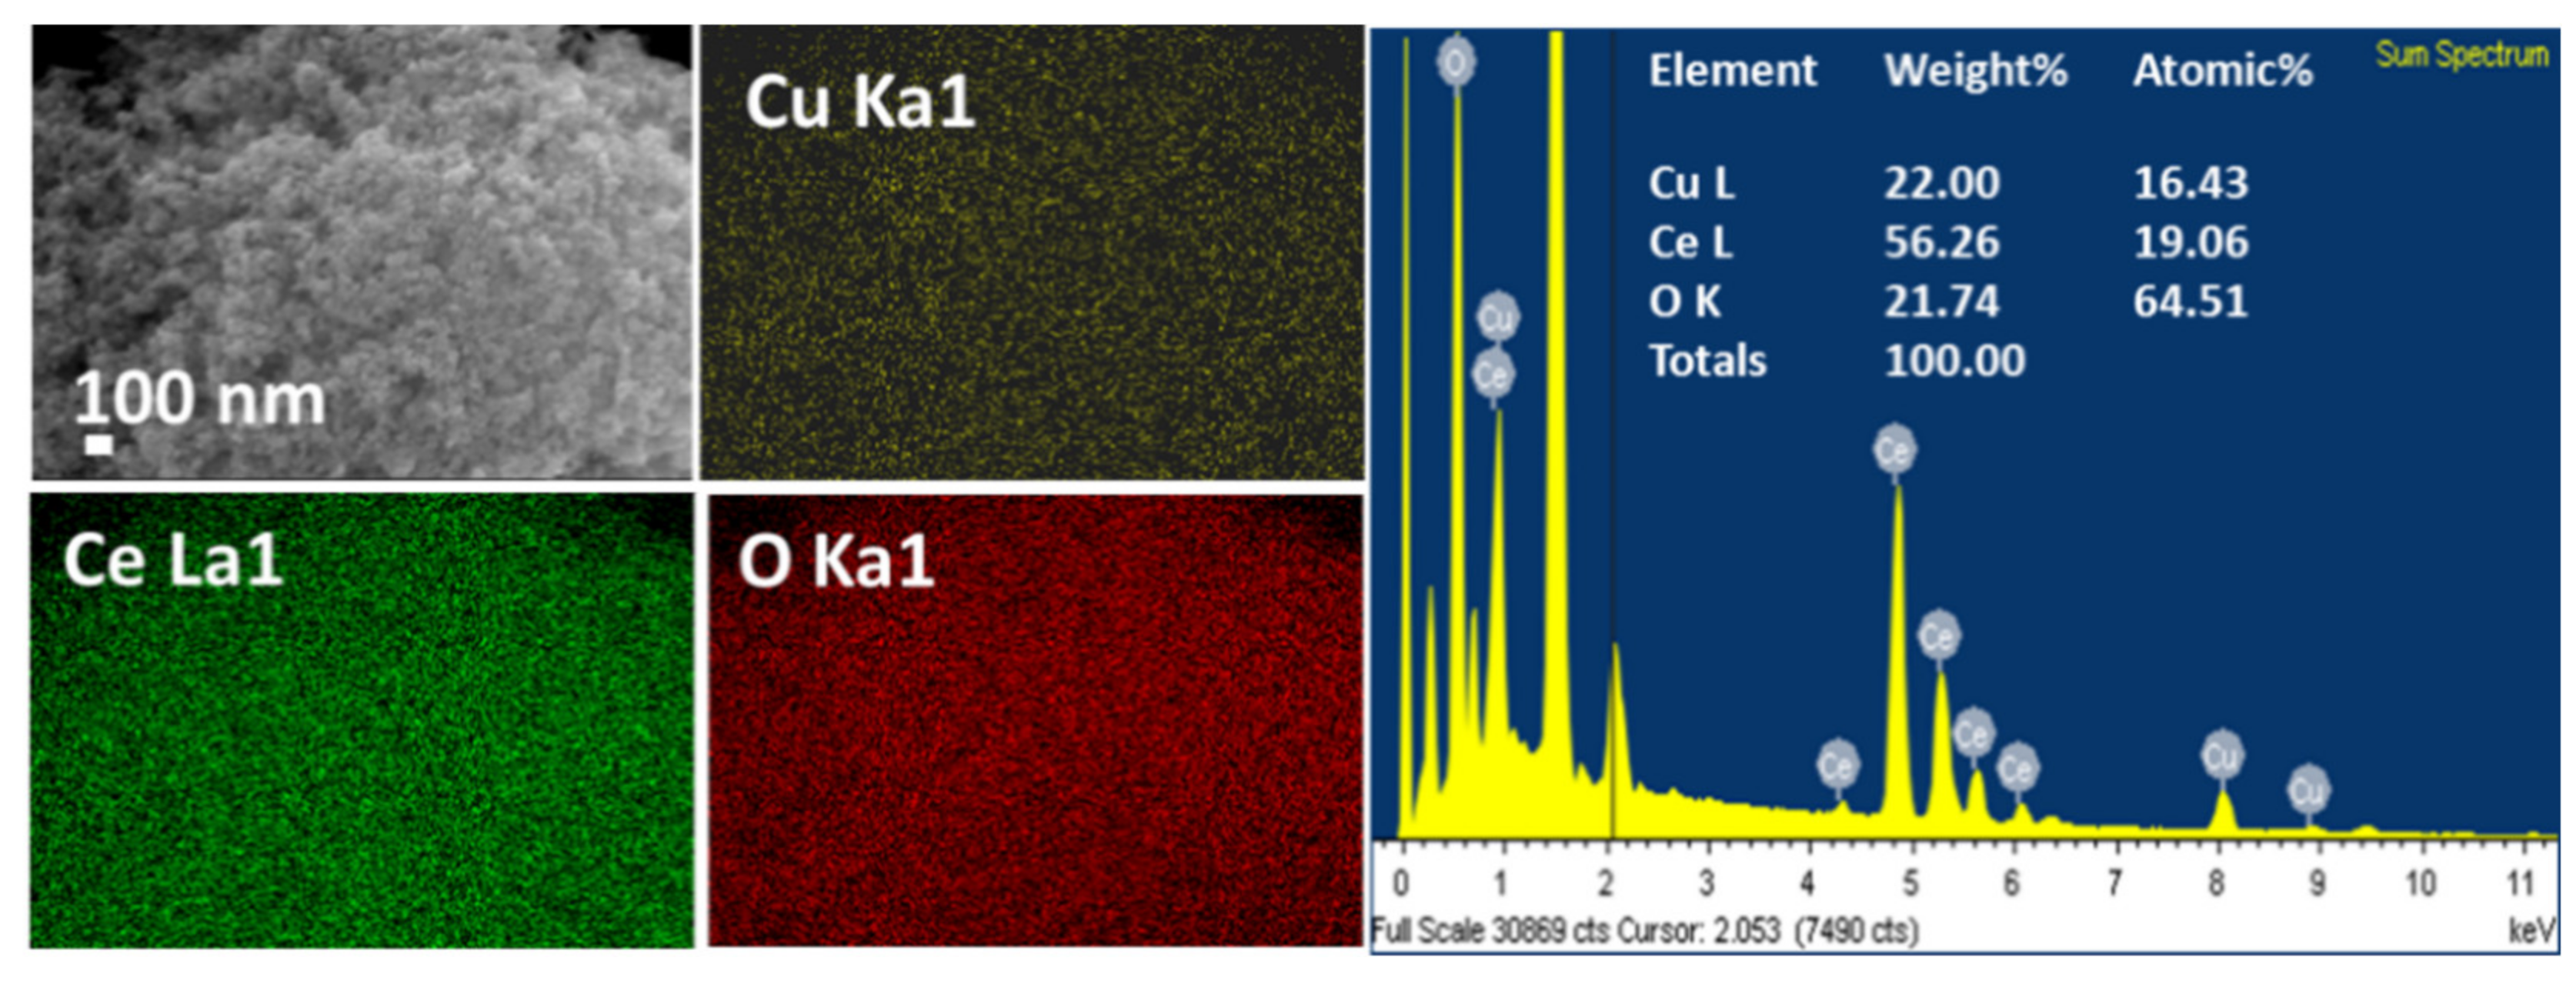
Figure A3.
Morphologies of the prepared samples: (a) Pure CeO2; (b) 1% CuCe; (c) 5% CuCe; (d) 9% CuCe; (e) 14% CuCe; (f) 17% CuCe.
Figure A3.
Morphologies of the prepared samples: (a) Pure CeO2; (b) 1% CuCe; (c) 5% CuCe; (d) 9% CuCe; (e) 14% CuCe; (f) 17% CuCe.

Figure A4.
Kinetic energy spectra of Cu L3VV Auger.
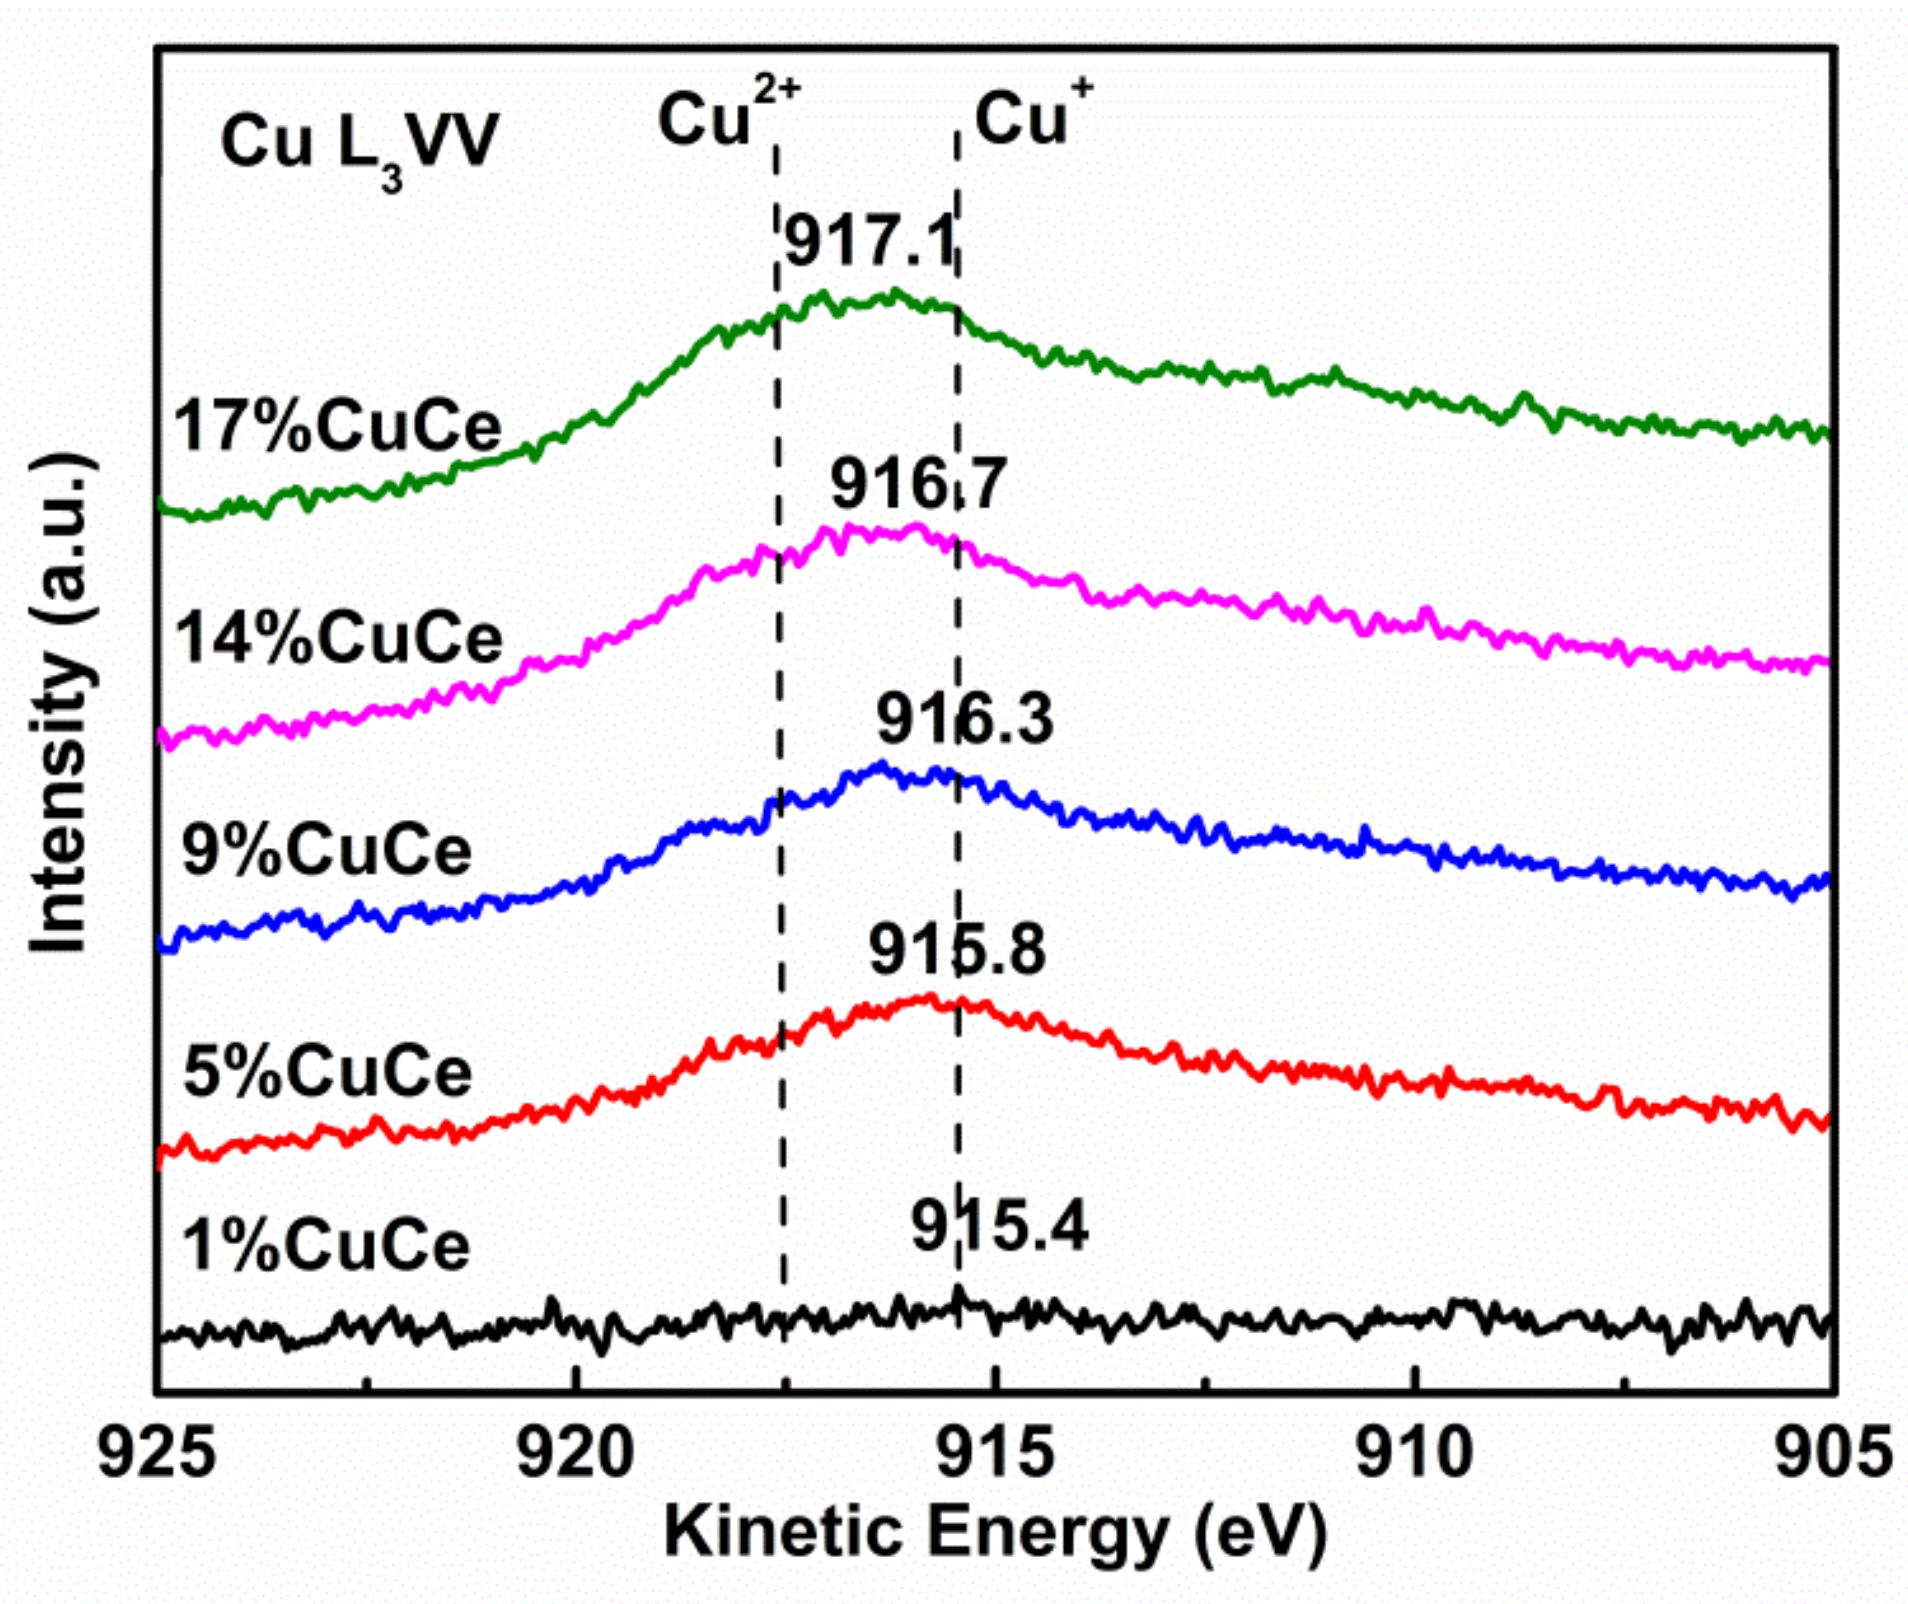
Figure A5.
Integrated area of the Cu+-CO band at 2100 cm−1 as a function of temperature.
References
- Pitkäaho, S.; Matejova, L.; Jiratova, K.; Ojala, S.; Keiski, R.L. Oxidation of perchloroethylene-activity and selectivity of Pt, Pd, Rh, and V2O5 catalysts supported on Al2O3, Al2O3-TiO2 and Al2O3-CeO2. Part 2. Appl. Catal. B 2012, 126, 215–224. [Google Scholar] [CrossRef]
- Varghese, S.; Cutrufello, M.G.; Rombi, E.; Cannas, C.; Monaci, R.; Ferino, I. CO oxidation and preferential oxidation of CO in the presence of hydrogen over SBA-15-templated CuO-Co3O4 catalysts. Appl. Catal. A 2012, 443–444, 161–170. [Google Scholar] [CrossRef]
- Qiao, D.; Lu, G.; Liu, X.; Guo, Y.; Wang, Y.; Guo, Y. Preparation of Ce1−XFeXO2 solid solution and its catalytic performance for oxidation of CH4 and CO. J. Mater. Sci. 2011, 46, 3500–3506. [Google Scholar] [CrossRef]
- Sedmak, G.; Hočevar, S.; Levec, J. Kinetics of selective CO oxidation in excess of H2 over the nanostructured Cu0.1Ce0.9O2-y catalyst. J. Catal. 2003, 213, 135–150. [Google Scholar] [CrossRef]
- Avgouropoulos, G.; Ioannides, T.; Papadopoulou, C.; Batista, J.; Hocevar, S.; Matralis, H.K. A comparative study of Pt/γ-Al2O3, Au/α-Fe2O3 and CuO- CeO2 catalysts for the selective oxidation of carbon monoxide in excess hydrogen. Catal. Today 2002, 75, 157–167. [Google Scholar] [CrossRef]
- Sudarsanam, P.; Hillary, B.; Mallesham, B.; Rao, B.G.; Amin, M.H.; Nafady, A.; Alsalme, A.M.; Reddy, B.M.; Bhargava, S.K. Designing CuOx nanoparticle-decorated CeO2 nanocubes for catalytic soot oxidation: Role of the nanointerface in the catalytic performance of heterostructured nanomaterials. Langmuir 2016, 32, 2208–2215. [Google Scholar] [CrossRef]
- Mukherjee, D.; Rao, B.G.; Reddy, B.M. CO and soot oxidation activity of doped ceria: Influence of dopants. Appl. Catal. B 2016, 197, 105–115. [Google Scholar] [CrossRef]
- Davó-Quiñonero, A.; Navlani-García, M.; Lozano-Castelló, D.; Bueno-López, A.; Anderson, J.A. Role of hydroxyl groups in the preferential oxidation of CO over copper oxide–cerium oxide catalysts. ACS Catal. 2016, 6, 1723–1731. [Google Scholar] [CrossRef]
- Di Benedetto, A.; Landi, G.; Lisi, L. Improved CO-PROX performance of CuO/CeO2 catalysts by using nanometric ceria as support. Catalysts 2018, 8, 209. [Google Scholar] [CrossRef]
- Aneggi, E.; Boaro, M.; Leitenburg, C.D.; Dolcetti, G.; Trovarelli, A. Insights into the redox properties of ceria-based oxides and their implications in catalysis. J. Alloys Compd. 2006, 408–412, 1096–1102. [Google Scholar] [CrossRef]
- Bae, C.M.; Ko, J.B.; Kim, D.H. Selective catalytic oxidation of carbon monoxide with carbon dioxide, water vapor and excess hydrogen on CuO-CeO2 mixed oxide catalysts. Catal. Commun. 2005, 6, 507–511. [Google Scholar] [CrossRef]
- Wang, J.; Pu, H.; Wan, G.; Chen, K.; Lu, J.; Lei, Y.; Zhong, L.; He, S.; Han, C.; Luo, Y. Promoted the reduction of Cu2+ to enhance CuO-CeO2 catalysts for CO preferential oxidation in H2-rich streams: Effects of preparation methods and copper precursors. Int. J. Hydrogen Energy 2017, 42, 21955–21968. [Google Scholar] [CrossRef]
- Shang, H.; Zhang, X.; Xu, J.; Han, Y. Effects of preparation methods on the activity of CuO/CeO2 Catalysts for CO oxidation. Front. Chem. Sci. Eng. 2017, 11, 603–612. [Google Scholar] [CrossRef]
- Cecilia, J.; Arango-Díaz, A.; Marrero-Jerez, J.; Núñez, P.; Moretti, E.; Storaro, L.; Rodríguez-Castellón, E. Catalytic behaviour of CuO-CeO2 systems prepared by different synthetic methodologies in the CO-PROX reaction under CO2-H2O feed stream. Catalysts 2017, 7, 160. [Google Scholar] [CrossRef]
- Liu, G.; Li, J.; Yang, K.; Tang, W.; Liu, H.; Yang, J.; Yue, R.; Chen, Y. Effects of cerium incorporation on the catalytic oxidation of benzene over flame-made perovskite La1−XCexMnO3 catalysts. Particuology 2015, 19, 60–68. [Google Scholar] [CrossRef]
- Liu, G.; Yue, R.; Jia, Y.; Ni, Y.; Yang, J.; Liu, H.; Wang, Z.; Wu, X.; Chen, Y. Catalytic oxidation of benzene over Ce–Mn oxides synthesized by flame spray pyrolysis. Particuology 2013, 11, 454–459. [Google Scholar] [CrossRef]
- Zhao, F.; Li, S.; Wu, X.; Yue, R.; Li, W.; Chen, Y. Synergetic effect over flame-made manganese doped CuO–CeO2 Nanocatalyst for enhanced CO oxidation performance. RSC Adv. 2019, 9, 2343–2352. [Google Scholar] [CrossRef]
- Wang, Z.; Qu, Z.; Quan, X.; Li, Z.; Wang, H.; Fan, R. Selective catalytic oxidation of ammonia to nitrogen over CuO-CeO2 mixed oxides prepared by surfactant-templated method. Appl. Catal. B 2013, 134–135, 153–166. [Google Scholar] [CrossRef]
- Solsona, B.; Sanchis, R.; Dejoz, A.; García, T.; Ruiz-Rodríguez, L.; López Nieto, J.; Cecilia, J.; Rodríguez-Castellón, E. Total oxidation of propane using CeO2 and CuO-CeO2 catalysts prepared using templates of different nature. Catalysts 2017, 7, 96. [Google Scholar] [CrossRef]
- Strobel, R.; Pratsinis, S.E. Flame aerosol synthesis of smart nanostructured materials. J. Mater. Chem. 2007, 17, 4743–4756. [Google Scholar] [CrossRef]
- Feng, X.; Sayle, D.C.; Wang, Z.L.; Paras, M.S.; Santora, B.; Sutorik, A.C.; Sayle, T.X.T.; Yang, Y.; Ding, Y.; Wang, X.; et al. Converting ceria polyhedral nanoparticles into single-crystal nanospheres. Science 2006, 312, 1504. [Google Scholar] [CrossRef]
- Liu, T.; Yao, Y.; Wei, L.; Shi, Z.; Han, L.; Yuan, H.; Li, B.; Dong, L.; Wang, F.; Sun, C. Preparation and evaluation of copper–manganese oxide as a high-efficiency catalyst for CO oxidation and NO reduction by CO. J. Phys. Chem. C 2017, 121, 12757–12770. [Google Scholar] [CrossRef]
- Balducci, G.; Kaspar, J.; Fornasiero, P.; Graziani, M.; Islam, M.S. Surface and reduction energetics of the CeO2-ZrO2 catalysts. J. Phys. Chem. C 1998, 102, 557–561. [Google Scholar] [CrossRef]
- Fornasiero, P.; Balducci, G.; Di Monte, R.; Kašpar, J.; Sergo, V.; Gubitosa, G.; Ferrero, A.; Graziani, M. Modification of the redox behaviour of CeO2 induced by structural doping with ZrO2. J. Catal. 1996, 164, 173–183. [Google Scholar] [CrossRef]
- Dosa, M.; Piumetti, M.; Bensaid, S.; Andana, T.; Novara, C.; Giorgis, F.; Fino, D.; Russo, N. Novel Mn-Cu-containing CeO2 nanopolyhedra for the oxidation of CO and diesel soot: Effect of dopants on the nanostructure and catalytic activity. Catal. Lett. 2017, 148, 298–311. [Google Scholar] [CrossRef]
- Du, L.; Wang, W.; Yan, H.; Wang, X.; Jin, Z.; Song, Q.; Si, R.; Jia, C. Copper-ceria sheets catalysts: Effect of copper species on catalytic activity in CO oxidation reaction. J. Rare Earths 2017, 35, 1186–1196. [Google Scholar] [CrossRef]
- Piumetti, M.; Bensaid, S.; Fino, D.; Russo, N. Nanostructured ceria-zirconia catalysts for CO oxidation: Study on surface properties and reactivity. Appl. Catal. B 2016, 197, 35–46. [Google Scholar] [CrossRef]
- Binet, C.; Badri, A.; Boutonnet-Kizling, M.; Lavalley, J.C. FTIR study of carbon monoxide adsorption on ceria: CO carbonite dianion adsorbed species. J. Chem. Soc. Faraday Trans. 1994, 90, 1023–1028. [Google Scholar] [CrossRef]
- Avgouropoulos, G.; Ioannides, T. Selective CO oxidation over CuO-CeO2 catalysts prepared via the urea-nitrate combustion method. Appl. Catal. A 2003, 244, 155–167. [Google Scholar] [CrossRef]
- Hočevar, S.; Krašovec, U.O.; Orel, B.; Aricó, A.S.; Kim, H. CWO of phenol on two differently prepared CuO-CeO2 Catalysts. Appl. Catal. B 2000, 28, 113–125. [Google Scholar] [CrossRef]
- Liu, W.; Flytzani-stephanopoulos, M. Total oxidation of carbon-monoxide and methane over transition metal fluorite oxide composite catalysts: II. catalyst characterization and reaction-kinetics. J. Catal. 1995, 153, 317–332. [Google Scholar] [CrossRef]
- Xie, Y.; Yin, Y.; Zeng, S.; Gao, M.; Su, H. Coexistence of Cu+ and Cu2+ in star-shaped CeO2/CuXO catalyst for preferential CO oxidation. Catal. Commun. 2017, 99, 110–114. [Google Scholar] [CrossRef]
- Gómez, L.E.; Miró, E.E.; Boix, A.V. Spectroscopic characterization of Mn-Co-Ce mixed oxides, active catalysts for COPROX reaction. Int. J. Hydrogen Energy 2013, 38, 5645–5654. [Google Scholar] [CrossRef]
- Qi, L.; Yu, Q.; Dai, Y.; Tang, C.; Liu, L.; Zhang, H.; Gao, F.; Dong, L.; Chen, Y. Influence of cerium precursors on the structure and reducibility of mesoporous CuO-CeO2 catalysts for CO oxidation. Appl. Catal. B 2012, 119–120, 308–320. [Google Scholar] [CrossRef]
- Li, S.; Wang, H.; Li, W.; Wu, X.; Tang, W.; Chen, Y. Effect of Cu substitution on promoted benzene oxidation over porous CuCo-based catalysts derived from layered double hydroxide with resistance of water vapor. Appl. Catal. B 2015, 166–167, 260–269. [Google Scholar] [CrossRef]
- Zhang, R.; Teoh, W.Y.; Amal, R.; Chen, B.; Kaliaguine, S. Catalytic reduction of NO by CO over Cu/CexZr1−XO2 prepared by flame synthesis. J. Catal. 2010, 272, 210–219. [Google Scholar] [CrossRef]
- Dow, W.P.; Huang, T.J. Effects of oxygen vacancy of yttria-stabilized zirconia support on carbon monoxide oxidation over copper catalyst. J. Catal. 1994, 147, 322–332. [Google Scholar] [CrossRef]
- Piumetti, M.; Bensaid, S.; Russo, N.; Fino, D. Nanostructured ceria-based catalysts for soot combustion: Investigations on the surface sensitivity. Appl. Catal. B 2015, 165, 742–751. [Google Scholar] [CrossRef]
- Zhu, P.; Li, J.; Zuo, S.; Zhou, R. Preferential oxidation properties of CO in excess hydrogen over CuO-CeO2 catalyst prepared by hydrothermal Method. Appl. Surf. Sci. 2008, 255, 2903–2909. [Google Scholar] [CrossRef]
- Delimaris, D.; Ioannides, T. VOC oxidation over CuO–CeO2 catalysts prepared by a combustion Method. Appl. Catal. B 2009, 89, 295–302. [Google Scholar] [CrossRef]
- Jia, A.P.; Deng, Y.; Hu, G.S.; Luo, M.F.; Lu, J.Q. Kinetic and activity study of CO oxidation over CuO-MnOx-CeO2 catalysts. React. Kinet. Mech. Catal. 2015, 117, 503–520. [Google Scholar] [CrossRef]
- Piumetti, M.; Bensaid, S.; Andana, T.; Russo, N.; Pirone, R.; Fino, D. Cerium-copper oxides prepared by solution combustion synthesis for total oxidation reactions: from powder catalysts to structured reactors. Appl. Catal. B 2017, 205, 455–468. [Google Scholar] [CrossRef]
- Sun, S.; Mao, D.; Yu, J.; Yang, Z.; Lu, G.; Ma, Z. Low-temperature CO oxidation on CuO/CeO2 catalysts: The significant effect of copper precursor and calcination temperature. Catal. Sci. Technol. 2015, 5, 3166–3181. [Google Scholar] [CrossRef]
- Chen, G.; Xu, Q.; Yang, Y.; Li, C.; Huang, T.; Sun, G.; Zhang, S.; Ma, D.; Li, X. Facile and mild strategy to construct mesoporous CeO2-CuO nanorods with enhanced catalytic activity toward CO oxidation. ACS Appl. Mater. Interfaces 2015, 7, 23538–23544. [Google Scholar] [CrossRef]
- Xiao, W.; Yang, S.; Zhang, P.; Li, P.; Wu, P.; Li, M.; Chen, N.; Jie, K.; Huang, C.; Zhang, N.; et al. Facile synthesis of highly porous metal oxides by mechanochemical nanocasting. Chem. Mater. 2018, 30, 2924–2929. [Google Scholar] [CrossRef]
- Spezzati, G.; Benavidez, A.D.; DeLaRiva, A.T.; Su, Y.; Hofmann, J.P.; Asahina, S.; Olivier, E.J.; Neethling, J.H.; Miller, J.T.; Datye, A.K.; Hensen, E.J.M. CO oxidation by Pd supported on CeO2(100) and CeO2(111) facets. Appl. Catal. B Evniron. 2019, 243, 36–46. [Google Scholar] [CrossRef]
- Wang, H.; Mao, D.; Qi, J.; Zhang, Q.; Ma, X.; Song, S.; Gu, L.; Yu, R.; Wang, D. Hollow multishelled structure of heterogeneous Co3O4-CeO2−X nanocomposite for CO catalytic oxidation. Adv. Funct. Mater. 2019, 1806588. [Google Scholar] [CrossRef]
- Gong, S.; Chen, J.; Wu, X.; Han, N.; Chen, Y. In-situ synthesis of Cu2O/reduced graphene oxide composite as effective catalyst for ozone decomposition. Catal. Commun. 2018, 106, 25–29. [Google Scholar] [CrossRef]
- Sanchez, M.G.; Gazquez, J.L. Oxygen vacancy model in strong metal-support interaction. J. Catal. 1987, 104, 120–135. [Google Scholar] [CrossRef]
- Wan, H.; Wang, Z.; Zhu, J.; Li, X.; Liu, B.; Gao, F.; Dong, L.; Chen, Y. Influence of CO pretreatment on the activities of CuO/γ-Al2O3 catalysts in CO+O2 reaction. Appl. Catal. B 2008, 79, 254–261. [Google Scholar] [CrossRef]
- Zhang, Z.; Zhu, Yi.; Asakura, H.; Zhang, B.; Zhang, J.; Zhou, M.; Han, Y.; Tanaka, T.; Wang, A.; Zhang, T.; et al. Thermally stable single atom Pt/M-Al2O3 for selective hydrogenation and CO oxidation. Nat. Commun. 2017, 8, 16100. [Google Scholar] [CrossRef] [PubMed]
- Gamarra, D.; Martínez-Arias, A. Preferential oxidation of CO in rich H2 over CuO/CeO2: Operando-drifts analysis of deactivating effect of CO2 and H2O. J. Catal. 2009, 263, 189–195. [Google Scholar] [CrossRef]
- Binet, C.; Daturi, M.; Lavalley, J.C. Ir study of polycrystalline ceria properties in oxidised and reduced states. Catal. Today 1999, 50, 207–225. [Google Scholar] [CrossRef]
Figure 1.
X-ray diffraction (XRD) patterns of the prepared samples.

Figure 2.
High resolution transmission electron microscopy (HRTEM) images of the representative samples: (a) 1% CuCe; (b) 9% CuCe; (c) 14% CuCe; (d) 17% CuCe; (e) high magnification of the 14% CuCe sample.
Figure 2.
High resolution transmission electron microscopy (HRTEM) images of the representative samples: (a) 1% CuCe; (b) 9% CuCe; (c) 14% CuCe; (d) 17% CuCe; (e) high magnification of the 14% CuCe sample.
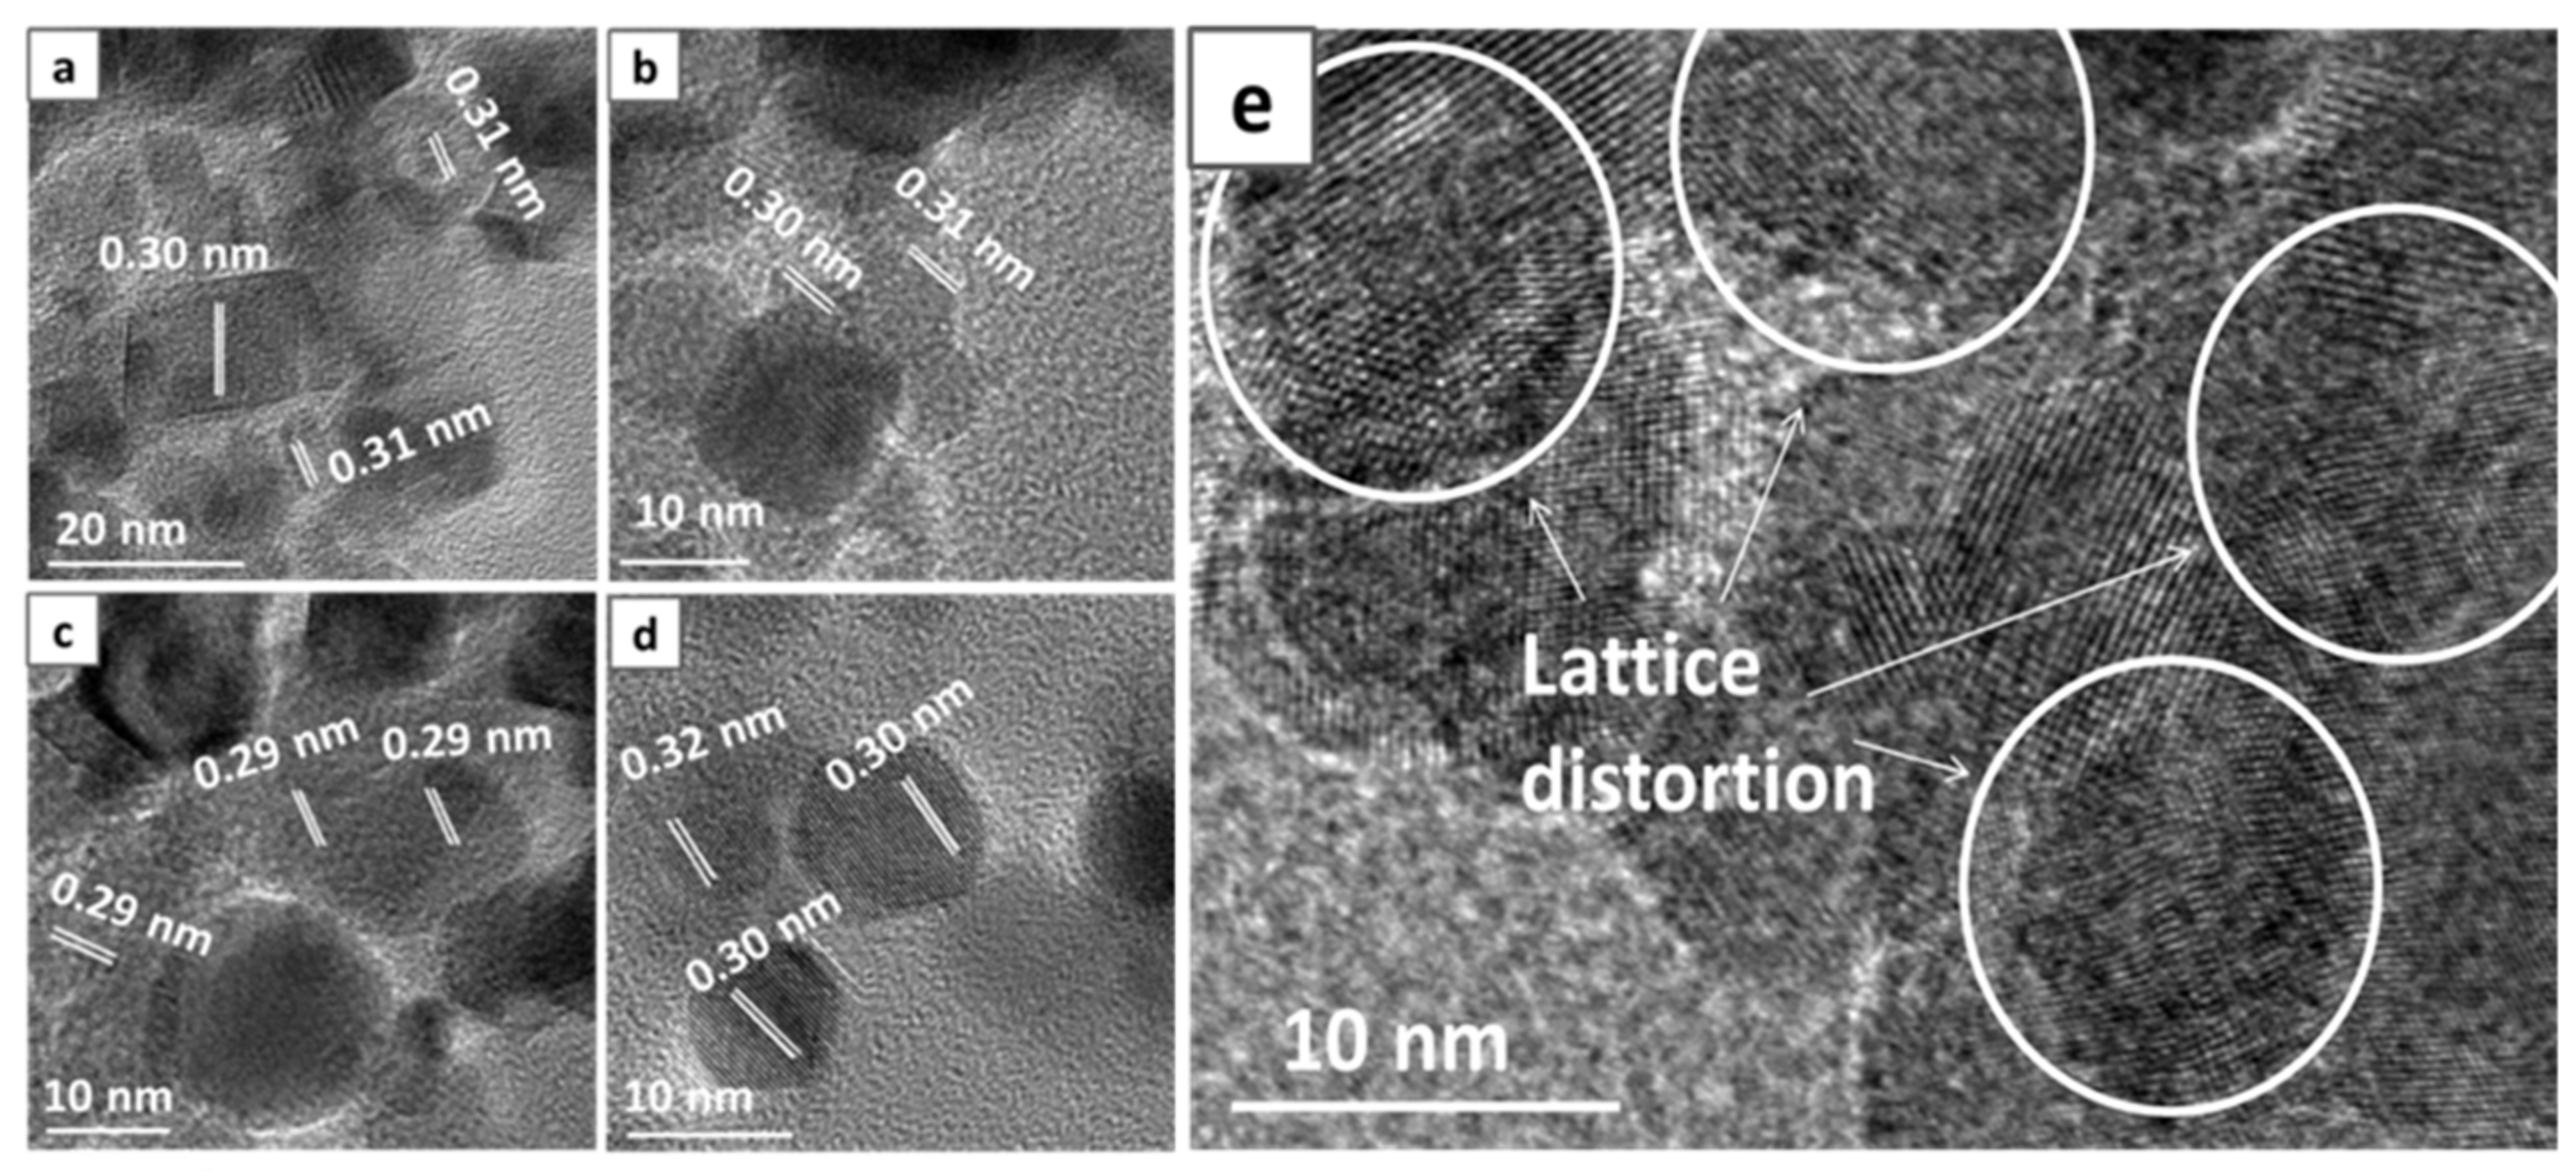
Figure 3.
(a) Raman spectra for the prepared samples; (b) Ov/F2g area ratios of the Cu-containing catalysts.
Figure 3.
(a) Raman spectra for the prepared samples; (b) Ov/F2g area ratios of the Cu-containing catalysts.

Figure 4.
(a) Cu 2p X-ray photoelectron spectroscopy (XPS) spectra; (b) Ce 3d XPS spectra; (c) the variation tendency of ratios of Cu2+ and Ce3+ for the samples with different CuO contents; (d) O 1s XPS spectra.
Figure 4.
(a) Cu 2p X-ray photoelectron spectroscopy (XPS) spectra; (b) Ce 3d XPS spectra; (c) the variation tendency of ratios of Cu2+ and Ce3+ for the samples with different CuO contents; (d) O 1s XPS spectra.

Figure 5.
Hydrogen-temperature programmed reduction (H2-TPR) profile of the prepared samples.

Figure 6.
(a) the curve of CO conversion; (b) the reaction rate of all catalysts at 80 °C; (c) Arrhenius plots of catalytic CO oxidation over all samples; (d) the effect of water vapor on the activities of the 14% CuCe sample at 120 °C. (weight hourly space velocity (WHSV): 60,000 mL × g−1 × h−1; 1 vol % CO, 0.6 vol % O2).

Figure 7.
In situ DRIFTS spectra as a function of temperature from 25 to 240 °C under operando CO conditions with representative samples: (a) 1% CuCe; (b) 5% CuCe; (c) 14% CuCe; (d) 17% CuCe.
Figure 7.
In situ DRIFTS spectra as a function of temperature from 25 to 240 °C under operando CO conditions with representative samples: (a) 1% CuCe; (b) 5% CuCe; (c) 14% CuCe; (d) 17% CuCe.

Figure 8.
In situ DRIFT spectra of the 14% CuCe sample: (a) without water vapor from 25 to 120 °C; (b) with water vapor from 25 to 120 °C; (c) the comparison of CO catalytic oxidation with water vapor and without water vapor at 80 °C; (d) time evolution with water vapor at 80 °C.
Figure 8.
In situ DRIFT spectra of the 14% CuCe sample: (a) without water vapor from 25 to 120 °C; (b) with water vapor from 25 to 120 °C; (c) the comparison of CO catalytic oxidation with water vapor and without water vapor at 80 °C; (d) time evolution with water vapor at 80 °C.


Table 1.
Physical properties of various catalysts.
| Samples | Crystallite Size a (nm) | Cell Parameter (nm) | Surface Area (m2 × g−1) | Pore Volume (cm3 × g−1) | Pore Size (nm) |
|---|---|---|---|---|---|
| CeO2 | 25.6 | 0.5421 | 54.2 | 0.18 | 9.46 |
| 1% CuCe | 26.5 | 0.5420 | 48.5 | 0.16 | 9.10 |
| 5% CuCe | 30.1 | 0.5420 | 43.9 | 0.17 | 10.30 |
| 9% CuCe | 31.6 | 0.5419 | 42.6 | 0.20 | 13.60 |
| 14% CuCe | 31.4 | 0.5417 | 39.4 | 0.15 | 11.50 |
| 17% CuCe | 32.8 | 0.5422 | 38.9 | 0.16 | 10.46 |
a Calculated applying the Scherrer formula.
Table 2.
Catalytic performance and surface chemical properties of various catalysts.
| Samples | T50 (°C) | T90 (°C) | Ea (kJ × mol−1) | Cu/Ce (at. %) | Cu2+/Cu (%) | Ce3+/Ce (%) | |
|---|---|---|---|---|---|---|---|
| Nominal | XPS | ||||||
| CeO2 | 176 | 233 | 63.2 | - | - | - | - |
| 1% CuCe | 114 | 149 | 124.4 | 0.02 | 0.32 | 0 | 17.4 |
| 5% CuCe | 110 | 123 | 99.4 | 0.11 | 0.56 | 63.9 | 33.1 |
| 9% CuCe | 88 | 104 | 40.8 | 0.19 | 0.69 | 64.3 | 33.5 |
| 14% CuCe | 74 | 98 | 28.9 | 0.30 | 1.04 | 66.5 | 35.4 |
| 17% CuCe | 129 | 139 | 87.0 | 0.37 | 1.08 | 67.2 | 27.1 |
| Bulk CuO | 174 | 195 | 121.8 | - | - | - | - |
Table 3.
Comparison on CO oxidation activity over CeO2 based catalysts via different methods.
| Sample | Preparation | CO Conversion (%) | Reaction Condition | Ref. |
|---|---|---|---|---|
| 14 wt % CuO-CeO2 | FSP | 100 (120 °C) | 1% CO/0.6% O2/N2, 60,000 mL × g−1 × h−1 | This work |
| 1MnOx-5CuO-CeO2 | FSP | 100 (160 °C) | 1% CO/0.6% O2/N2, 60,000 mL × g−1 × h−1 | [17] |
| Cu0.40Ce0.60 | SCS a | 100 (130 °C) | 1000 ppm CO/10%O2/N2, 30,000 mL × g−1 × h−1 | [42] |
| 10 wt % CuO-CeO2 | IMP b | 99 (117 °C) | 4% CO/10% O2/N2, 9000 mL × g−1 × h−1 | [43] |
| 14.1 mol % CuO-CeO2NR | ST c | 100 (150 °C) | 1% CO/10% O2/N2, 60,000 mL × g−1 × h−1 | [44] |
| 5 wt % CuO-CeO2 | MN d | 100 (200 °C) | 1% CO/Air, 30,000 mL × g−1 × h−1 | [45] |
| 1 wt % Pd/CeO2-rod | IMP | 100 (150 °C) | 2% CO/2% O2/He, 60,000 mL × g−1 × h−1 | [46] |
| 4Co3O4-CeO2−x | STA e | 100 (160 °C) | 1% CO/1.6% O2/He, 30,000 mL × g−1 × h−1 | [47] |
a Solution combustion synthesis; b Impregnagtion; c Solvent thermal d Mechanochemical nanocasting e Sequential templating approach.
© 2019 by the authors. Licensee MDPI, Basel, Switzerland. This article is an open access article distributed under the terms and conditions of the Creative Commons Attribution (CC BY) license (http://creativecommons.org/licenses/by/4.0/).
Share and Cite
MDPI and ACS Style
Zhao, F.; Li, S.; Wu, X.; Yue, R.; Li, W.; Zha, X.; Deng, Y.; Chen, Y. Catalytic Behaviour of Flame-Made CuO-CeO2 Nanocatalysts in Efficient CO Oxidation. Catalysts 2019, 9, 256. https://doi.org/10.3390/catal9030256
AMA Style
Zhao F, Li S, Wu X, Yue R, Li W, Zha X, Deng Y, Chen Y. Catalytic Behaviour of Flame-Made CuO-CeO2 Nanocatalysts in Efficient CO Oxidation. Catalysts. 2019; 9(3):256. https://doi.org/10.3390/catal9030256
Chicago/Turabian StyleZhao, Feng, Shuangde Li, Xiaofeng Wu, Renliang Yue, Weiman Li, Xicuo Zha, Yuzhou Deng, and Yunfa Chen. 2019. "Catalytic Behaviour of Flame-Made CuO-CeO2 Nanocatalysts in Efficient CO Oxidation" Catalysts 9, no. 3: 256. https://doi.org/10.3390/catal9030256
Note that from the first issue of 2016, this journal uses article numbers instead of page numbers. See further details here.