Photocatalytic Activity of Nanostructured Titania Films Obtained by Electrochemical, Chemical, and Thermal Oxidation of Ti6Al4V Alloy—Comparative Analysis


1
Faculty of Chemistry, Nicolaus Copernicus University in Toruń, Gagarina 7, 87-100 Toruń, Poland
2
Nano-implant Ltd., Gagarina 5/102, 87-100 Toruń, Poland
Catalysts 2019, 9(3), 279; https://doi.org/10.3390/catal9030279
Submission received: 9 February 2019
/
Revised: 12 March 2019
/
Accepted: 15 March 2019
/
Published: 19 March 2019
(This article belongs to the Special Issue Sustainable Applications in Surface Chemistry and Catalysis)
Abstract
:Three different Ti6Al4V surface oxidation methods have been applied to obtain three types of titania materials of different nanoarchitecture. Electrochemical oxidation of titanium alloy allowed for obtaining titania nanotubes (TNT), chemical oxidation led to obtain titania nanofibers (TNF), and thermal oxidation gave titania nanowires (TNW). My earlier investigations of these nanomaterials were focused mainly on the estimation of their bioactivity and potential application in modern implantology. In this article, the comparative analysis of the photocatalytic activity of produced systems, as well as the impact of their structure and morphology on this activity, are discussed. The activity of studied nanomaterials was estimated basis of UV-induced degradation of methylene blue and also acetone, and it was determined quantitatively according to the Langmuir–Hinshelwood reaction mechanism. The obtained results were compared to the activity of Pilkington Glass ActivTM (reference sample). Among analyzed systems, titania nanofibers obtained at 140 and 120 °C, possessing anatase and anatase/amorphous structure, as well as titania nanowires obtained at 475 and 500 °C, possessing anatase and anatase/rutile structure, were better photocatalyst than the reference sample. Completely amorphous titania nanotubes, turned out to be an interesting alternative for photocatalytic materials in the form of thin films, however, their photocatalytic activity is lower than for Pilkington Glass ActivTM.

1. Introduction
The use of modern materials in different technologies requires detailed knowledge on the impact of the structure, morphology, and the physicochemical properties of produced systems on their adequate activity: photocatalytic, optical or biological one. This is particularly important when such innovative materials are commercialized and marketed. The studies on titanium dioxide and the materials produced on its basis are a good example of the efforts to determine the impact of individual structural and morphological parameters on properties and application possibilities of modern materials. TiO2 materials and nanomaterials, now are often used in various applications, such as self-cleaning surfaces [1,2,3], anti-fogging mirrors [4,5], antimicrobial coatings, [6,7,8,9] electrochromic devices [10,11,12], rechargeable batteries [13,14], and sensors [15,16]. They can also be applied in medicine [17,18,19,20], automotive [21,22], and in photocatalytic environmental cleaning of water and air [23,24,25,26]. For these applications, the crystalline form of TiO2 (anatase and rutile) are mostly used and additional density functional theory (DFT) calculations, which are intended to define the electronic structure, energy band gap, and defects level, are applied [27]. But it should be pointed out that recently more and more studies have started to question the belief that amorphous titania is not photoactive. Even, if it is characterized by a large number of defects leading to rapid recombination of photogenerated electrons and holes, before applying them in reactions [28]. Photocatalytic activity of amorphous titania has been noticed in the decomposition of stearic acid [29] and methylene blue [30], as well as in the photogeneration of hydrogen from water [31] and the photo-oxidation of dibenzothiophene [32]. The increase of surface active sites density (Ti-peroxide for the oxidation [33] and Ti3+ for the reduction [34]), as well, as charge trapping by dopants [35], are used to explain the observed photocatalytic activity of amorphous TiO2. However, it does not change the fact that the same amorphous titania is inactive in the photoreduction of alcohols [36] as well as in the photooxidation of acetic acid and acetaldehyde [37]. But the structure of titanium dioxide is one thing, and the surface morphology is another that affects photocatalytic activity. It is because of the fact, that surface wettability and surface energy, which influence mentioned activity, are closely related to surface morphology. Among different titania architectures nanoparticles [38,39], nanotubes [40,41], nanofibers [42], nanowires [43], nanorods [43,44], nanobelts [43,45], nanoribbons [46], are the most important and often studied. The diversity of TiO2 nanoarchitecture results from a wide range of applied experimental methods for the synthesis of nanomaterials. These include the hydrothermal method [47], solvothermal method [48], sol-gel [49], chemical vapor deposition (CVD) [50], and direct oxidation methods: electrochemical [51], chemical [52] and thermal one [53]. To make matters even more complicated, each of the mentioned methods may lead to various architectures depending on the conditions of the synthesis process. It is not possible to characterize and compare all the systems with each other. But I have decided to choose several of them and carry out analyzes to assess their photocatalytic activity.
In this article I would like to undertake an important issue, which has not been thoroughly analyzed in detail, so far, i.e., the comparison of photocatalytic activity of thin titanium dioxide layers of a diverse nanoarchitecture, which are completely or partially amorphous, or which are crystalline. Samples of the similar thickness, consisting of nanotubes (TNT), nanofibers (TNF), and nanowires (TNW), have been produced by electrochemical, chemical, and thermal oxidation of the surface of titanium alloy substrates, respectively. The photocatalytic activity of above-mentioned materials has been estimated on the basis of the UV induced decomposition of the water-soluble impurities pattern (methylene blue) and volatile impurities pattern (acetone). Obtained results were compared with the same ones obtained for the Pilkington Glass ActivTM, which is the world’s first commercially available, self-cleaning glass, comprising a film of nanocrystalline titanium dioxide (about 15 nm) as the photocatalytic active layer [54]. This layer is deposited on float glass, using the atmospheric pressure chemical vapor deposition (APCVD) process, and TiCl4 and ethyl acetate as titania precursors [55]. Pilkington Glass ActivTM can be used as a benchmark for all other photocatalyst films, which are produced for light-driven air and water purification.
The results presented in this paper can be used to design of low-budget and low-energy-consuming water and air purification systems. The production of the amorphous systems is beneficial from an economic point of view in the construction of the above-mentioned devices. Furthermore, the studied materials were checked in terms of their potential applications as systems capable of UV-induced sterilization. This property of produced titania materials is especially desirable in their potential application in the design and in the production of medical devices, e.g., implants.
2. Results
2.1. Morphological and Structural Characterization of Titania Nanomaterials
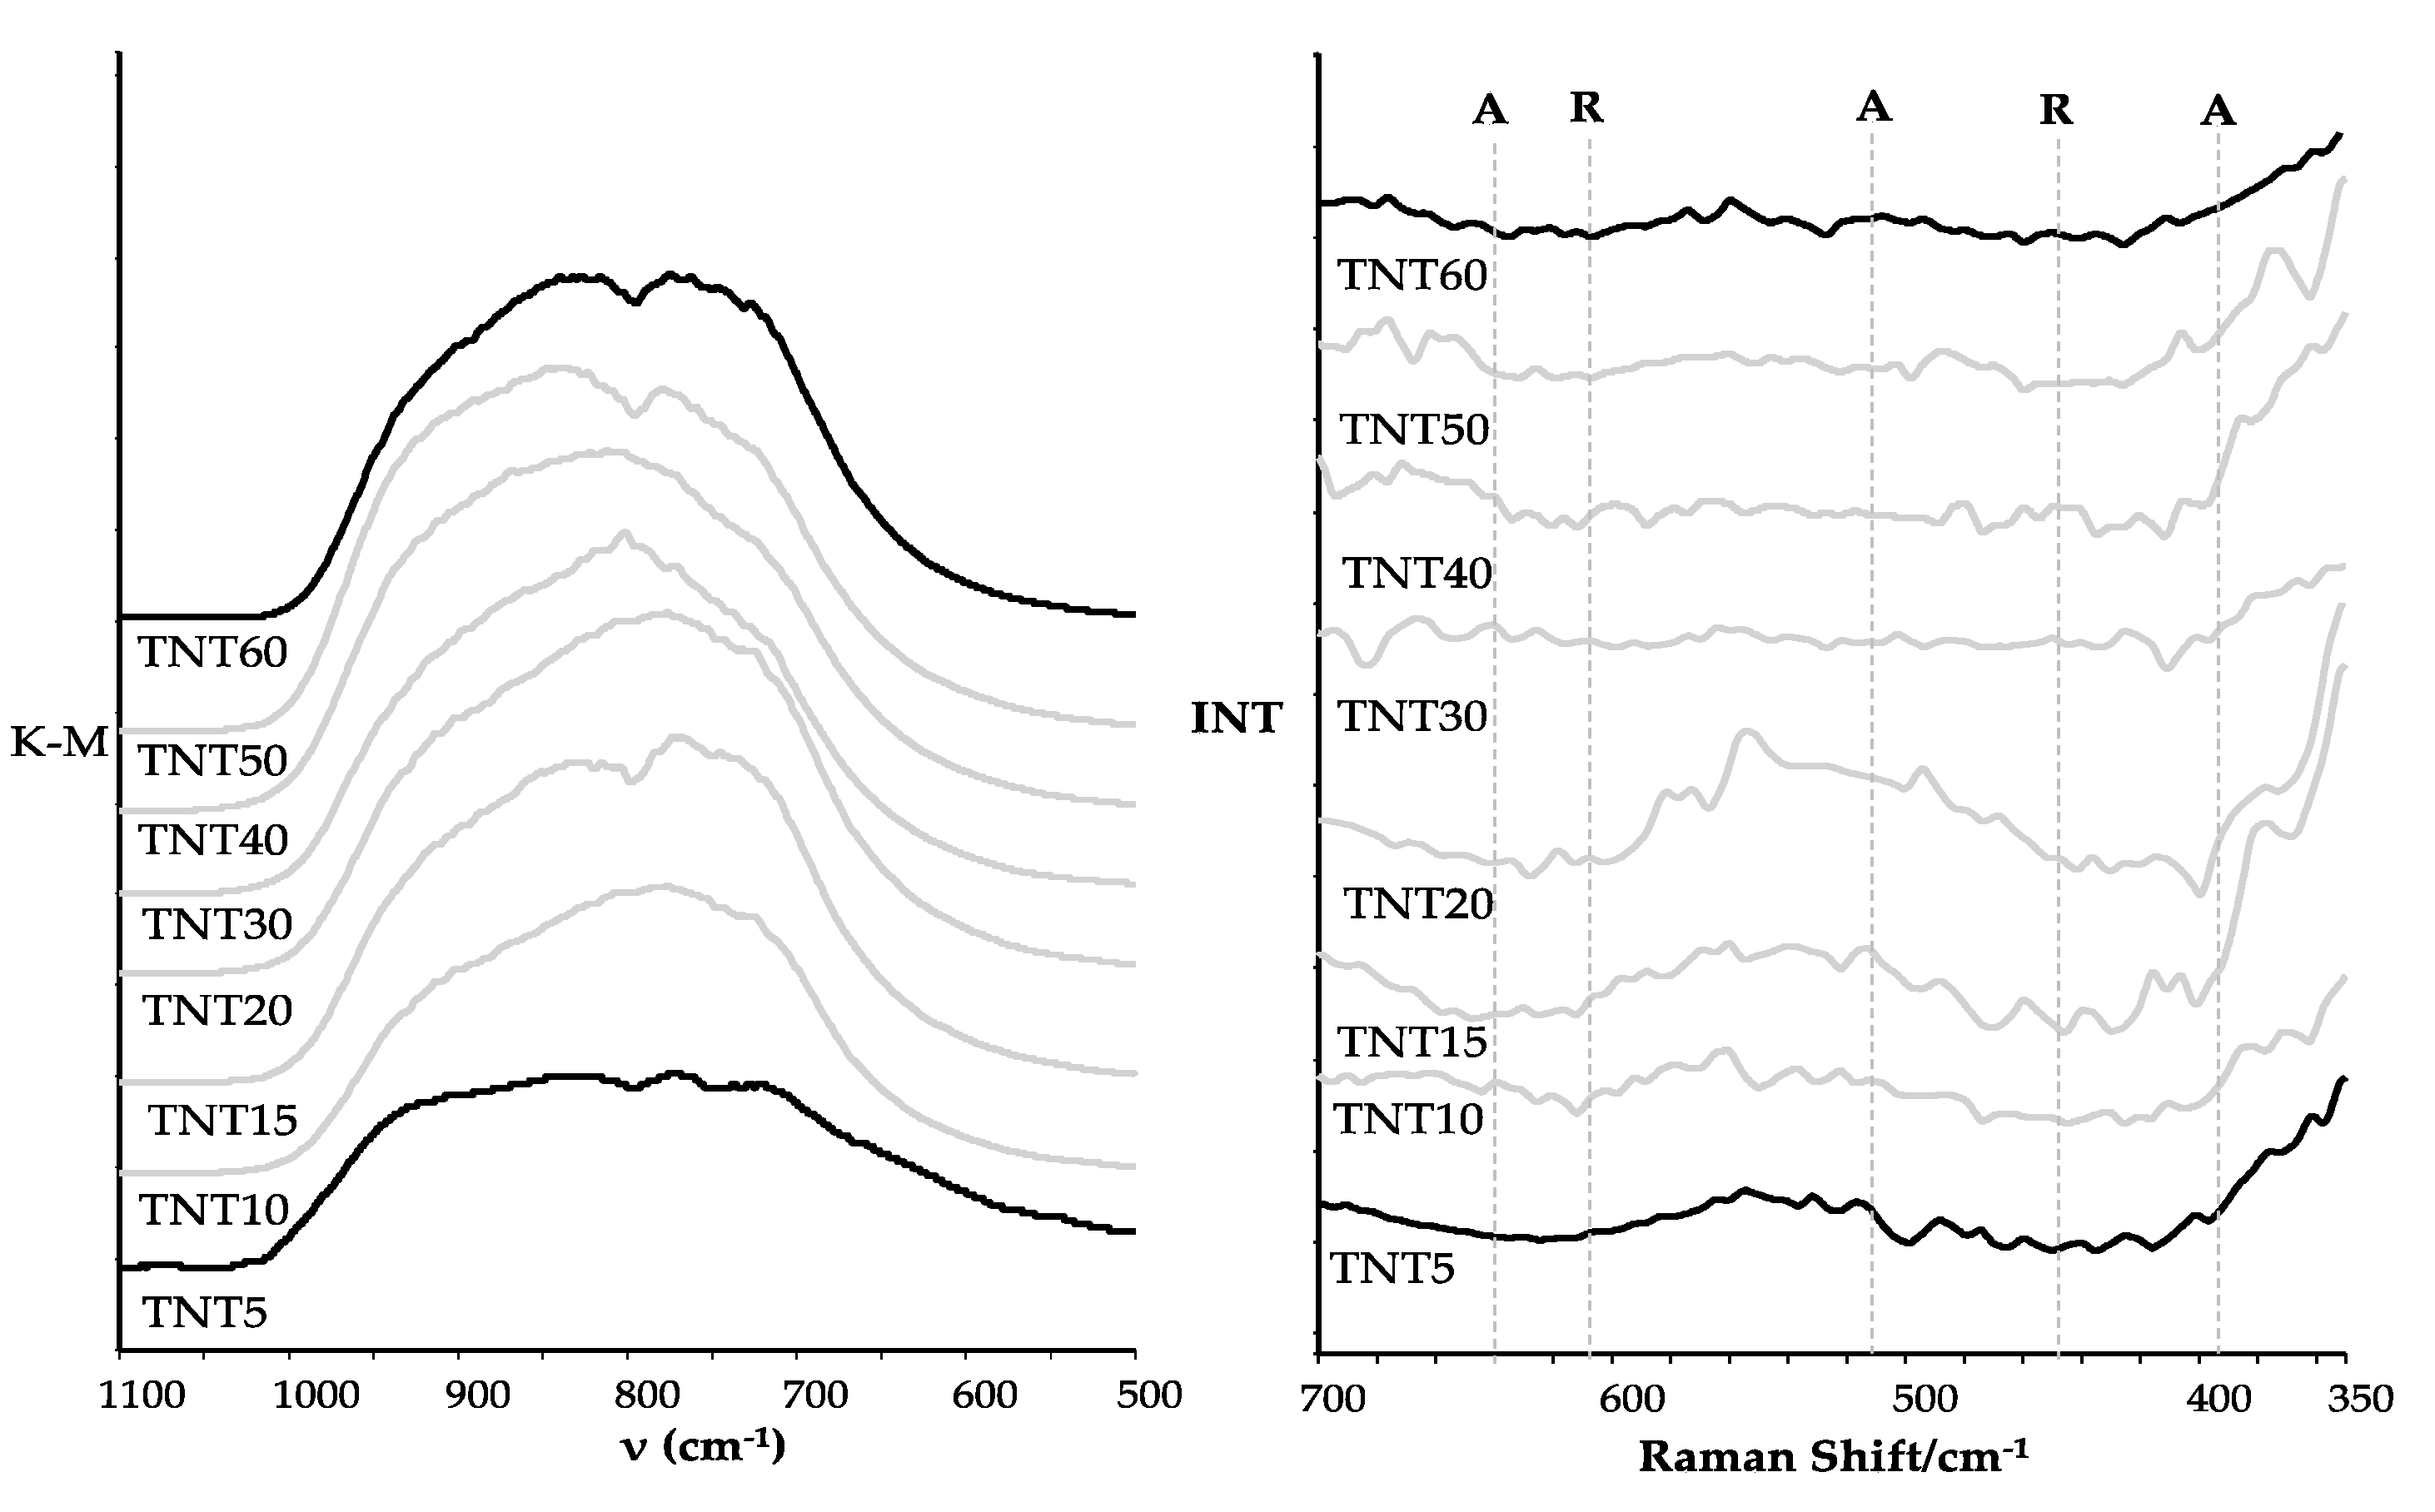
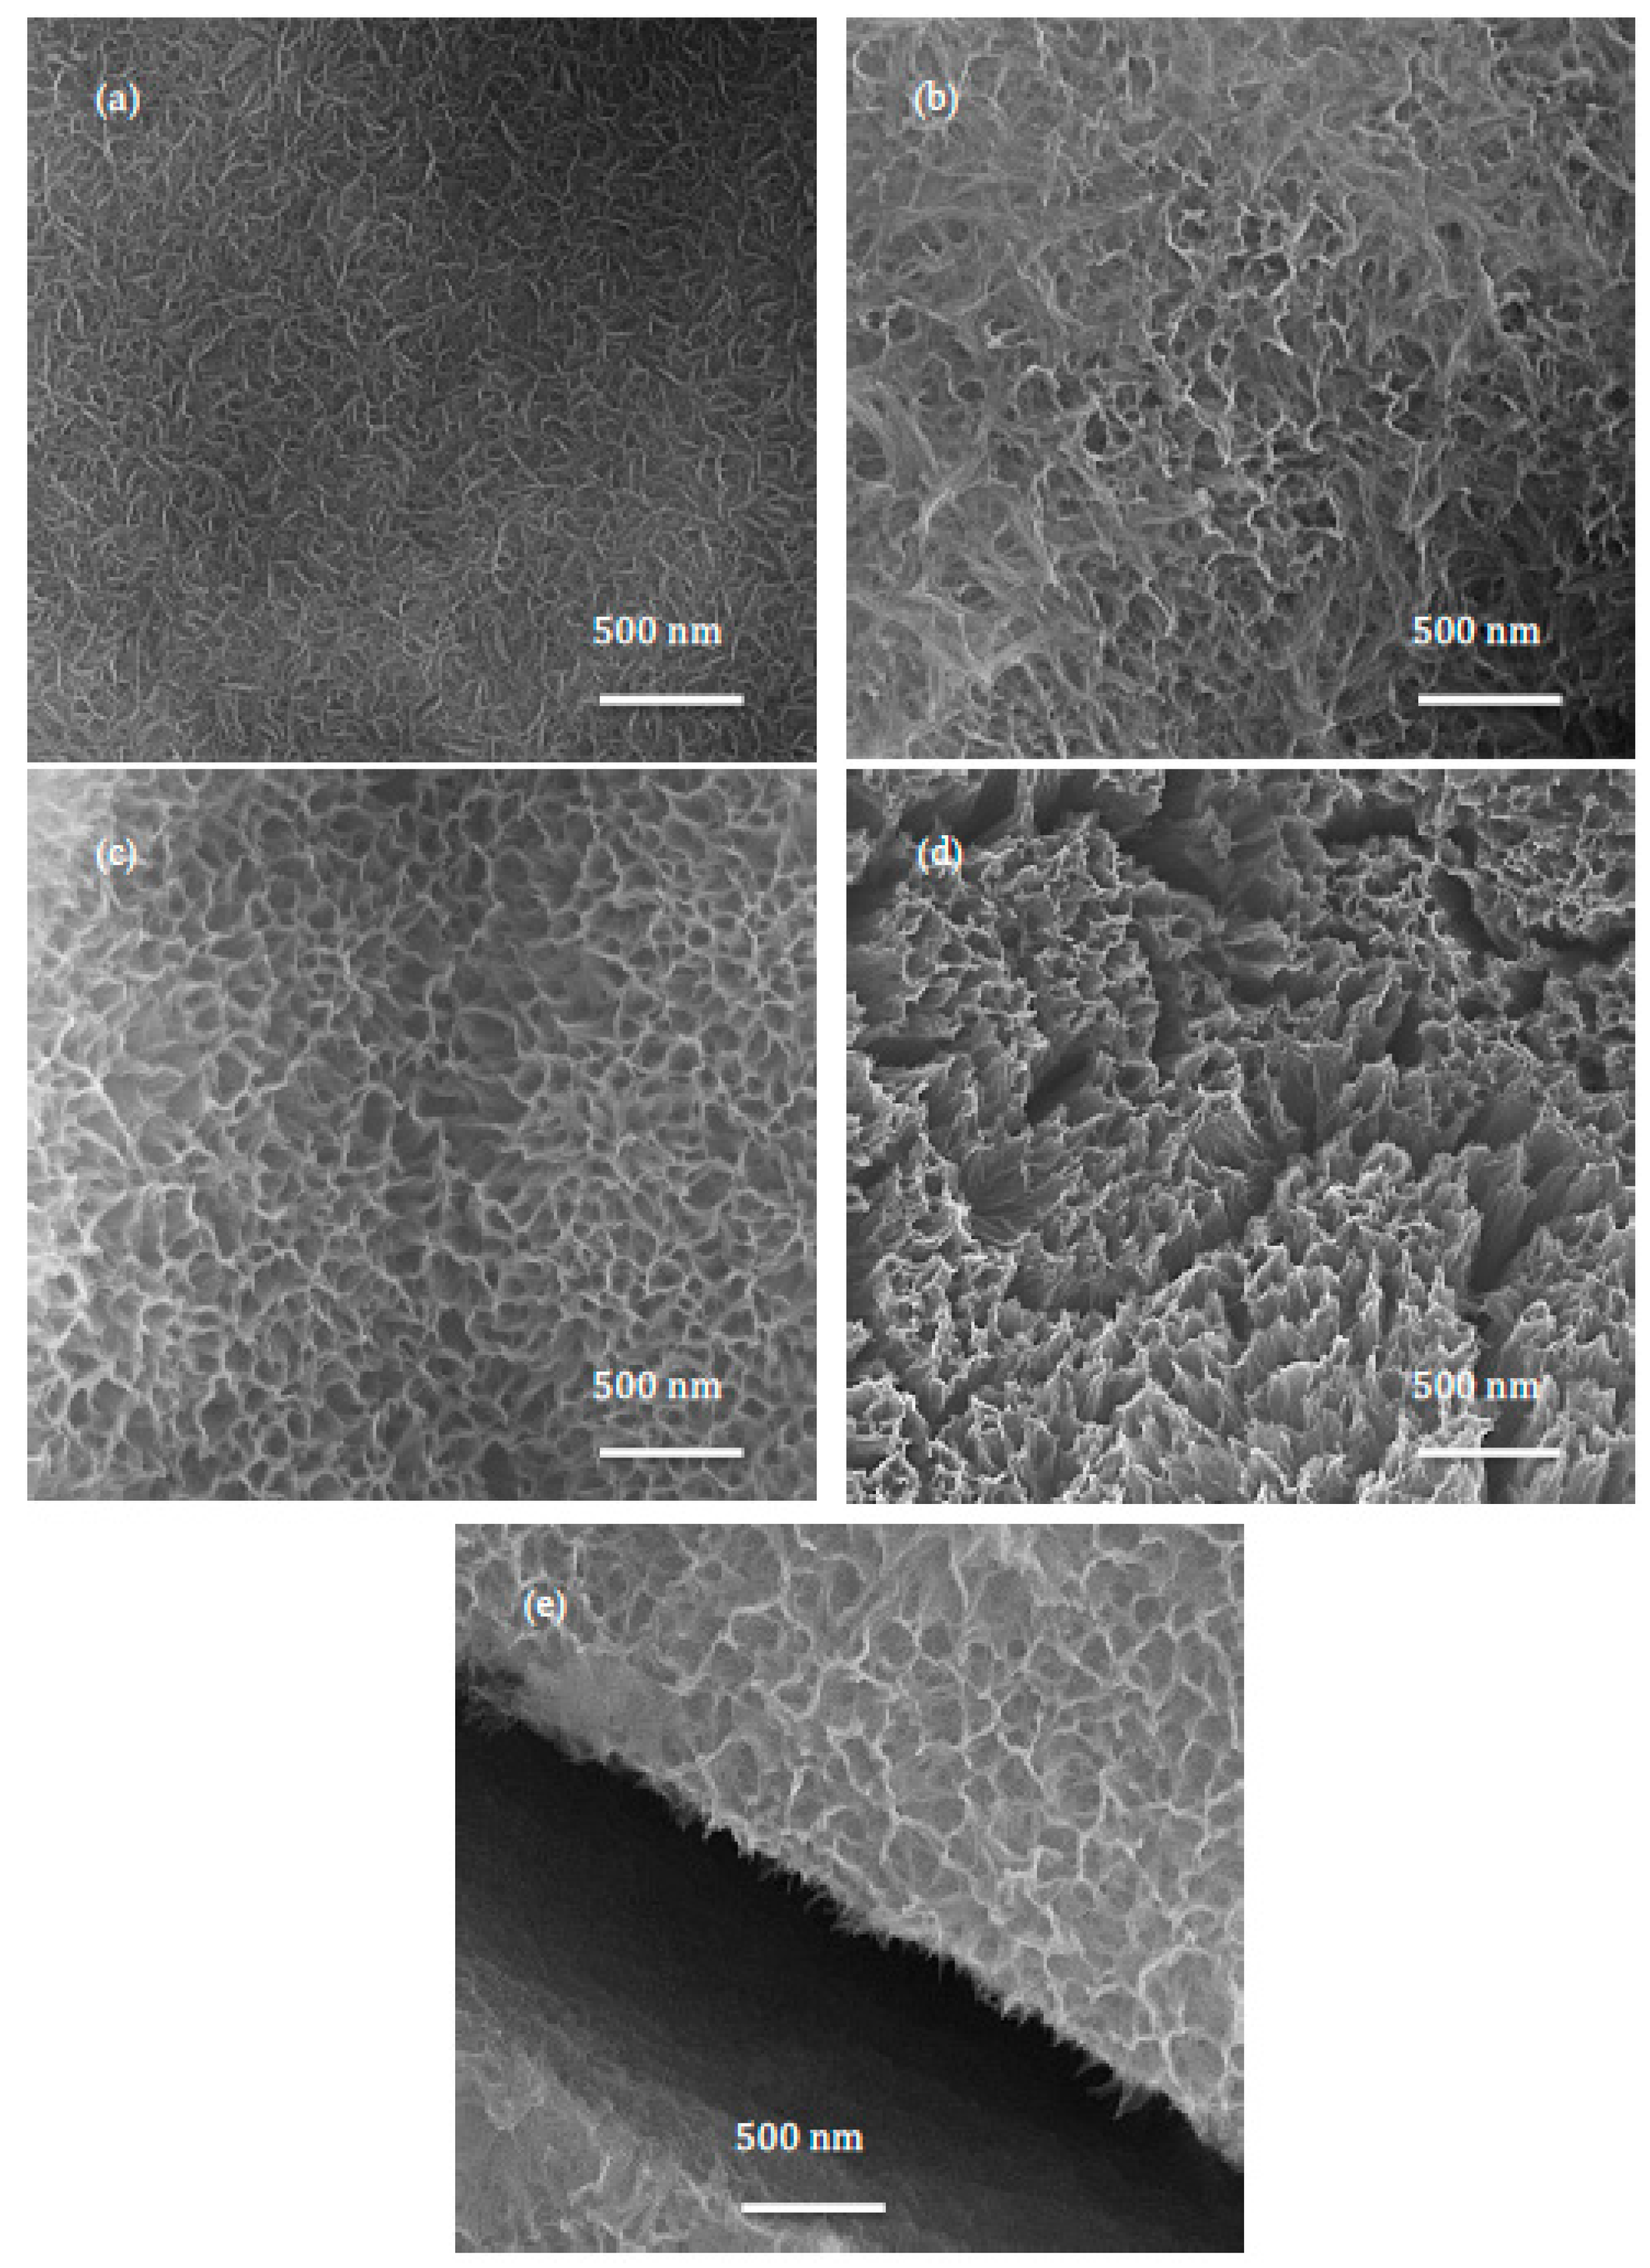
The electrochemical oxidation of titanium alloy (Ti6Al4V), carried out with the use of defined potentials allowed for the formation of TiO2 nanotubular architecture (TNT) on the surface of this substrate. Figure 1 shows the impact of the applied voltage on the diameter of nanotubes and for their arrangement on the surface. The use of the low potentials (U = 5, 10 V) led to the formation of nanoporous coatings, while at higher ones (U = 15, 20, 30, 40 V) the produced coatings consisted of separated titania nanotubes of well-formed walls. The thicknesses of the produced coatings were 120 to 150 nm. In general, the diameter of the produced nanotubes increases with the increasing potential. However, analysis of scanning electron microscope (SEM) images of samples anodized at higher potentials, i.e., 40–60 V, indicate on the formation of morphologically heterogeneous TNT coatings. In some cases, the tubes of small diameters are visible in the interior of larger ones (Figure 1f). It suggests that the growth conditions at such high potentials on the surface of the titanium alloy in the presence of an aqueous HF solution, as an electrolyte (1st generation nanotubes synthesis), are not optimal. While 15 to 30 V are optimal values of the potential used in the formation of well-ordered nanotubes in these conditions. Regardless the potential applied in the anodization of Ti6Al4V substrates, the obtained nanotubular coating on the alloy surface was amorphous TiO2, which was proved by analysis of Raman and infrared diffuse reflectance Fourier transform spectroscopy (IR DRIFT) spectral data (Figure 2). On the registered spectra there is a lack of signals, which can be attributed to crystalline forms of titania, such as anatase or rutile [56,57].
In the case of treating the titanium alloy surface with 30% hydrogen peroxide solution at elevated temperature, a layer resembling very fine nanofibers was obtained—TNF. The parameter, which was changed during the research, was the temperature. SEM images presented in Figure 3 seem to confirm that applying the chemical oxidation at the temperature range of 80 to 120 °C lead to morphologically similar arrangements, but obtained fibers differ in thickness. The sample obtained at 140 °C differs from the others, as it forms more compact systems, consisting of sticking together clusters of nanofibers, intersected by grooves having a width of about 100 nm.
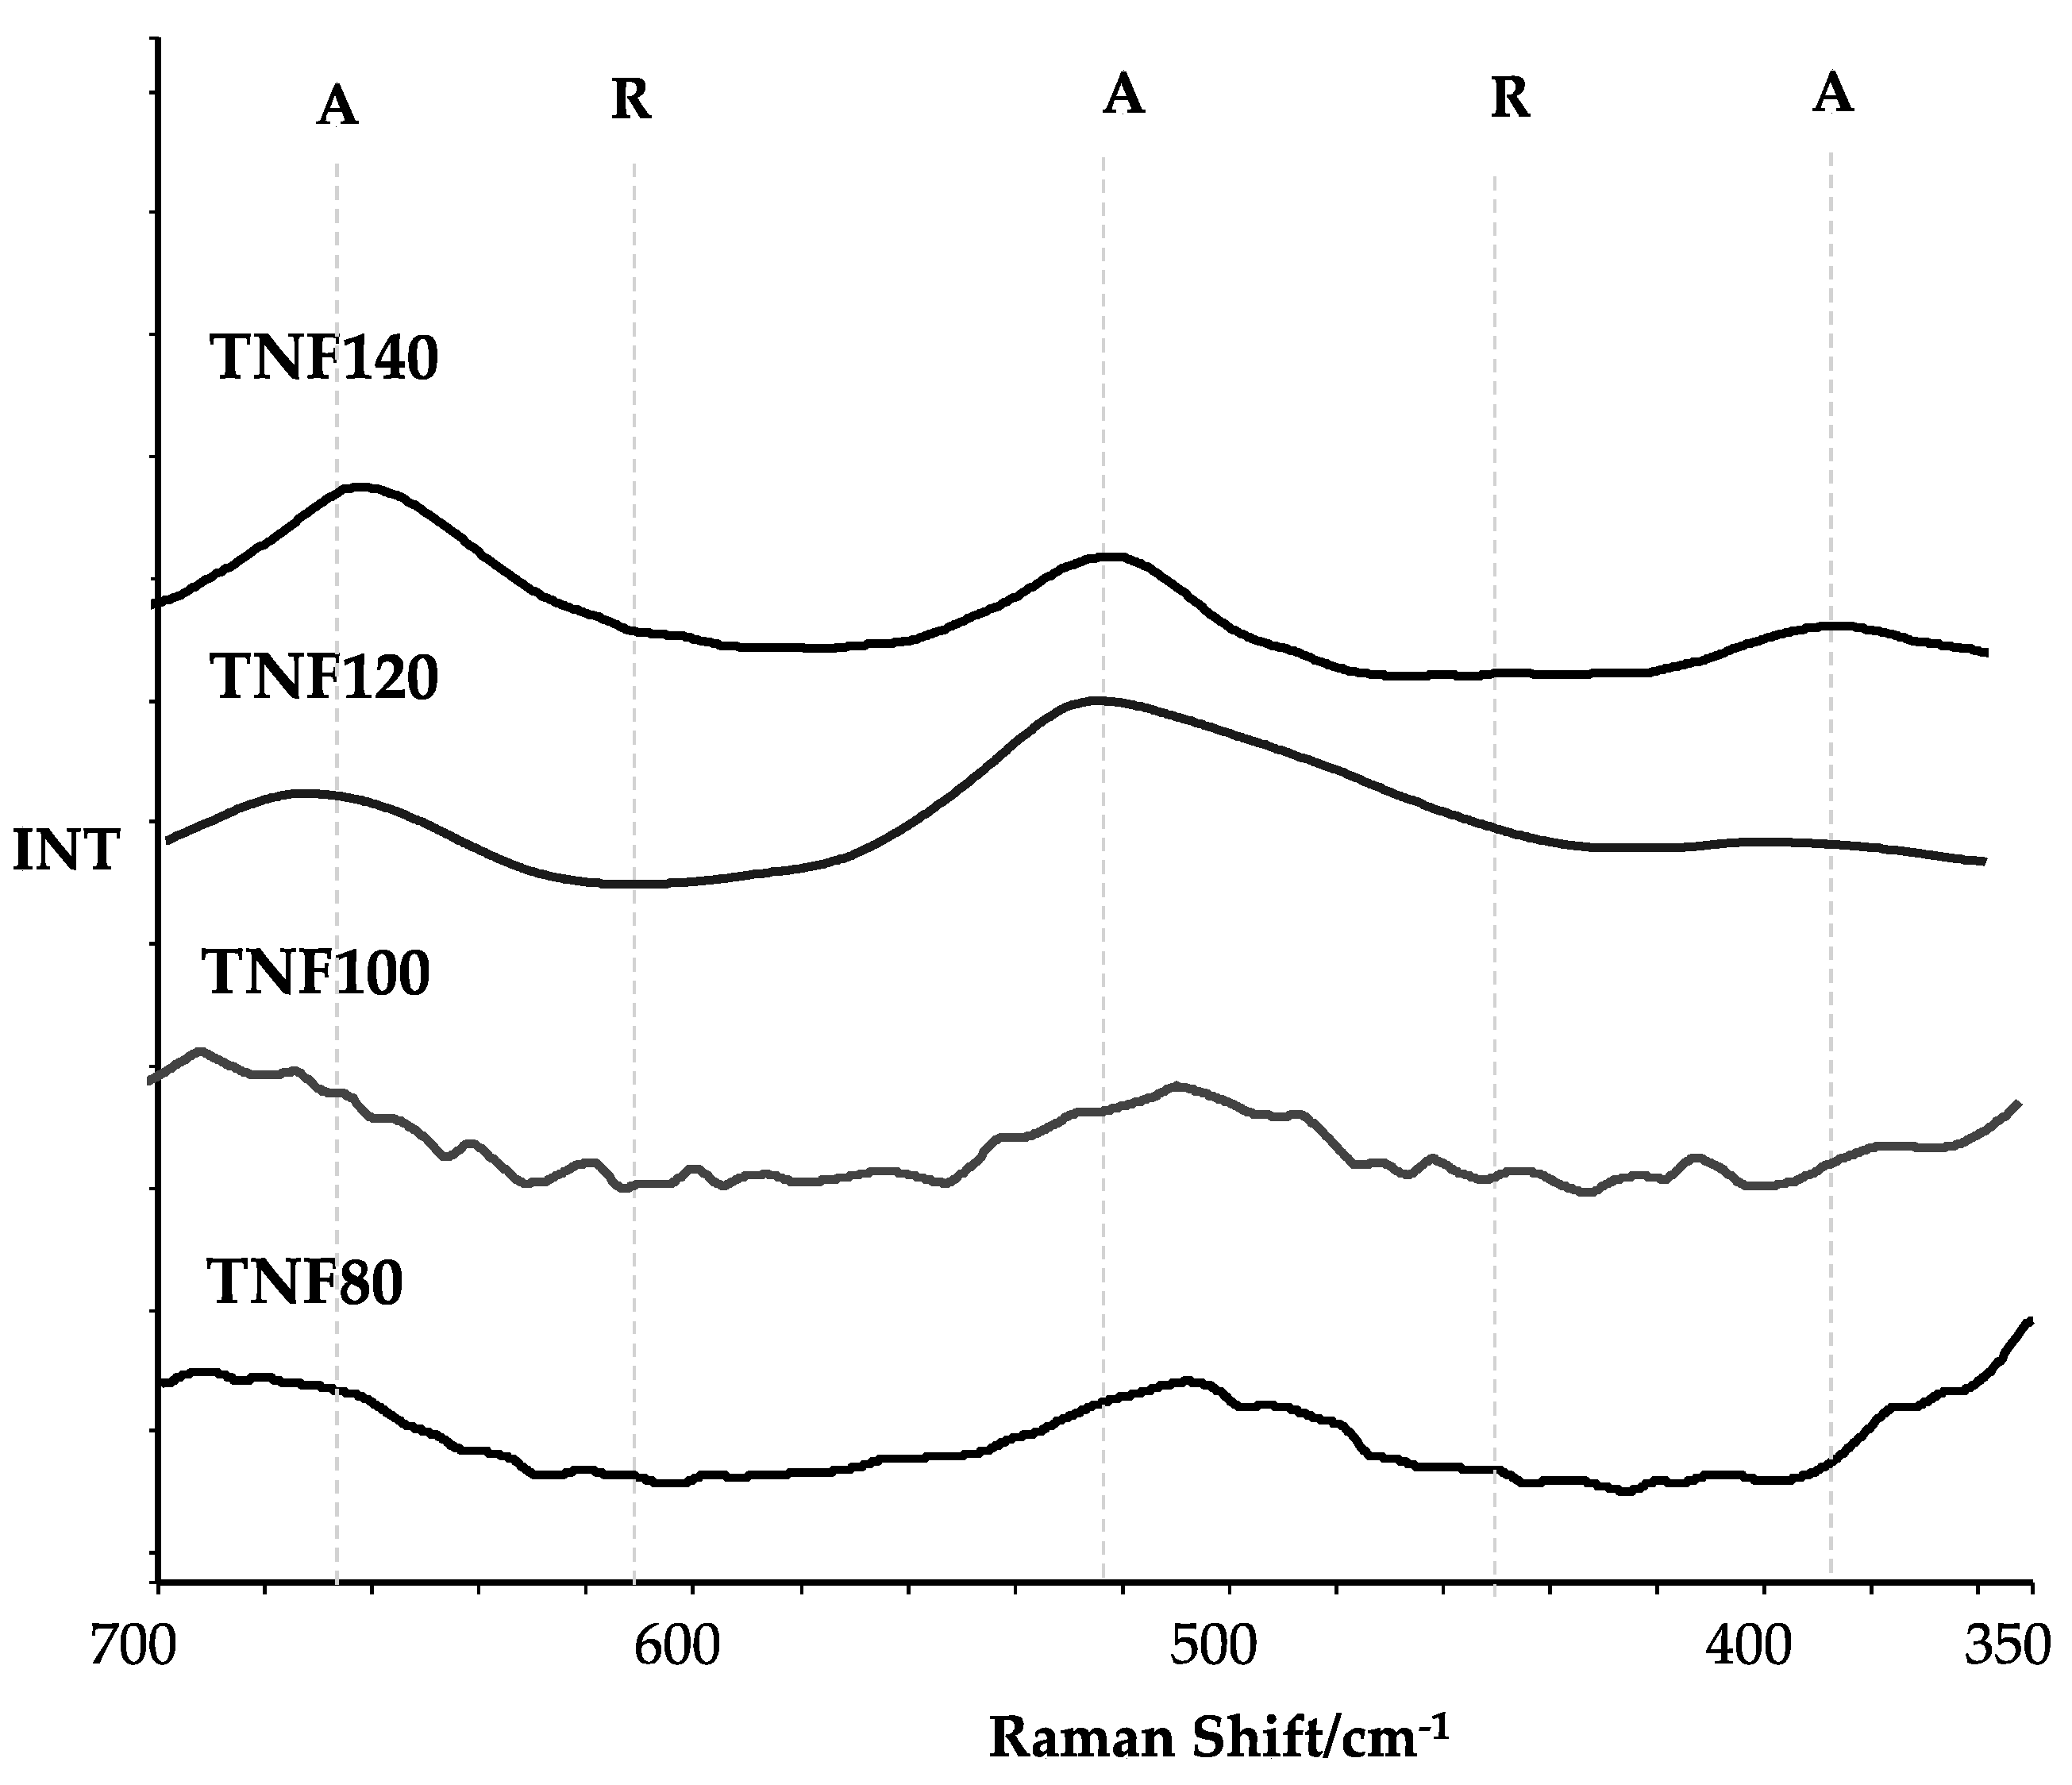
Figure 4, shows the Raman spectra of TNF samples produced at 80, 100, 120, and 140 °C. According to these data the TNF80 and TNF100 samples were amorphous, whereas the presence of TiO2 anatase crystallites in the layer structure of TNF120 and TNF140 has been confirmed. [56,57].
Thermal oxidation of titanium alloy carried out in the presence of argon containing trace amounts of oxygen led to obtain nanowires and nanorods, which for the purposes of this publication, were jointly named as TNW (Numbers at TNW are the temperature [°C], in which the system was created). Large morphological diversity of the obtained systems (Figure 5) is associated with the use of different temperatures in oxidation processes, as the temperature was the only variable process parameter. From the structural point of view, this kind of nanoarchitecture differs from the rest of the studied systems, which was confirmed by analysis of Raman spectra. The bands, which were found at c.a. 399, 516, and 640 cm−1, in Raman spectra of samples produced at a lower temperature (475 °C), indicate on the formation of TiO2 anatase form (Figure 6a) [56,57]. The appearance of the additional bands at c.a. 440 and 611 cm−1 in spectra of layers produced at 500 and 550 °C confirms the presence of both TiO2 crystalline forms; anatase and rutile [56,57], which was additionally proved by grazing-angle X-ray diffraction (GAXRD) studies (Figure 6b [58]). Structural studies on titania nanowires obtained at 600 °C showed the presence of rutile form. Structural homogeneity of the TNW600 sample surface was confirmed by Raman microscopy mapping (Figure S1). According to this data TiO2 rutile was the only polymorhic form appearing on the whole surface of the studied sample.
2.2. Wettability and Surface Energy of Titania Nanoarchitectures
The wettability of all studied samples was estimated based on the contact angle measurements of water droplets deposited on the sample surface (Table 1). For the samples Ti6Al4V/TNT5-Ti6Al4V/TNT40 the hydrophilicity of the coatings increases with the increase of the nanotube diameter. While the use of higher potentials (50, 60 V), led to the increase of hydrophobicity of produced Ti6Al4V/TNT50 and Ti6Al4V/TNT60 systems. In comparison to the reference sample (pure titanium alloy), the amorphous titania nanofiber coatings revealed clear hydrophilic character. However, it was not so high as in the case of titania nanotube layers. The results of wettability studies on titania nanowires point out the diverse character of their surface, as all samples are highly hydrophobic. Analysis of changes in the surface free energy, estimated based on the Owens–Wendt method [59], which uses the values of contact angles for polar and dispersive liquid (water and diiodomethane, respectively), revealed that the original value of surface free energy (Ti6Al4V–45.4 mJ/m2) after surface modifications using the electrochemical, chemical, and thermal method generally did not lead to great changes. Surface free energy (SFE) values range from 31.5 to 58.0 mJ/m2. Only three samples (Ti6Al4V/TNT20, Ti6Al4V/TNT30, and Ti6Al4V/TNT40) possess visibly higher SFE values: 65, 70, and 71 mJ/m2, respectively.
2.3. Specific Surface Area According to BET Theory
Brunauer–Emmett–Teller (BET) theory, which is an extension of the Langmuir theory, is the basis for the measurement of specific surface area. This methodology has been used in the estimation of the specific surface area of studied systems: TNT, TNF, and TNW. Nitrogen was the employed as gaseous adsorbate used for surface probing by BET methods. The results of BET investigations, in the form of surface specific area values [m2/g] of titania coatings characterized by nanotubular, fibrous, and wire-like architecture, are presented in Table 2.
2.4. Band Gap Characteristic
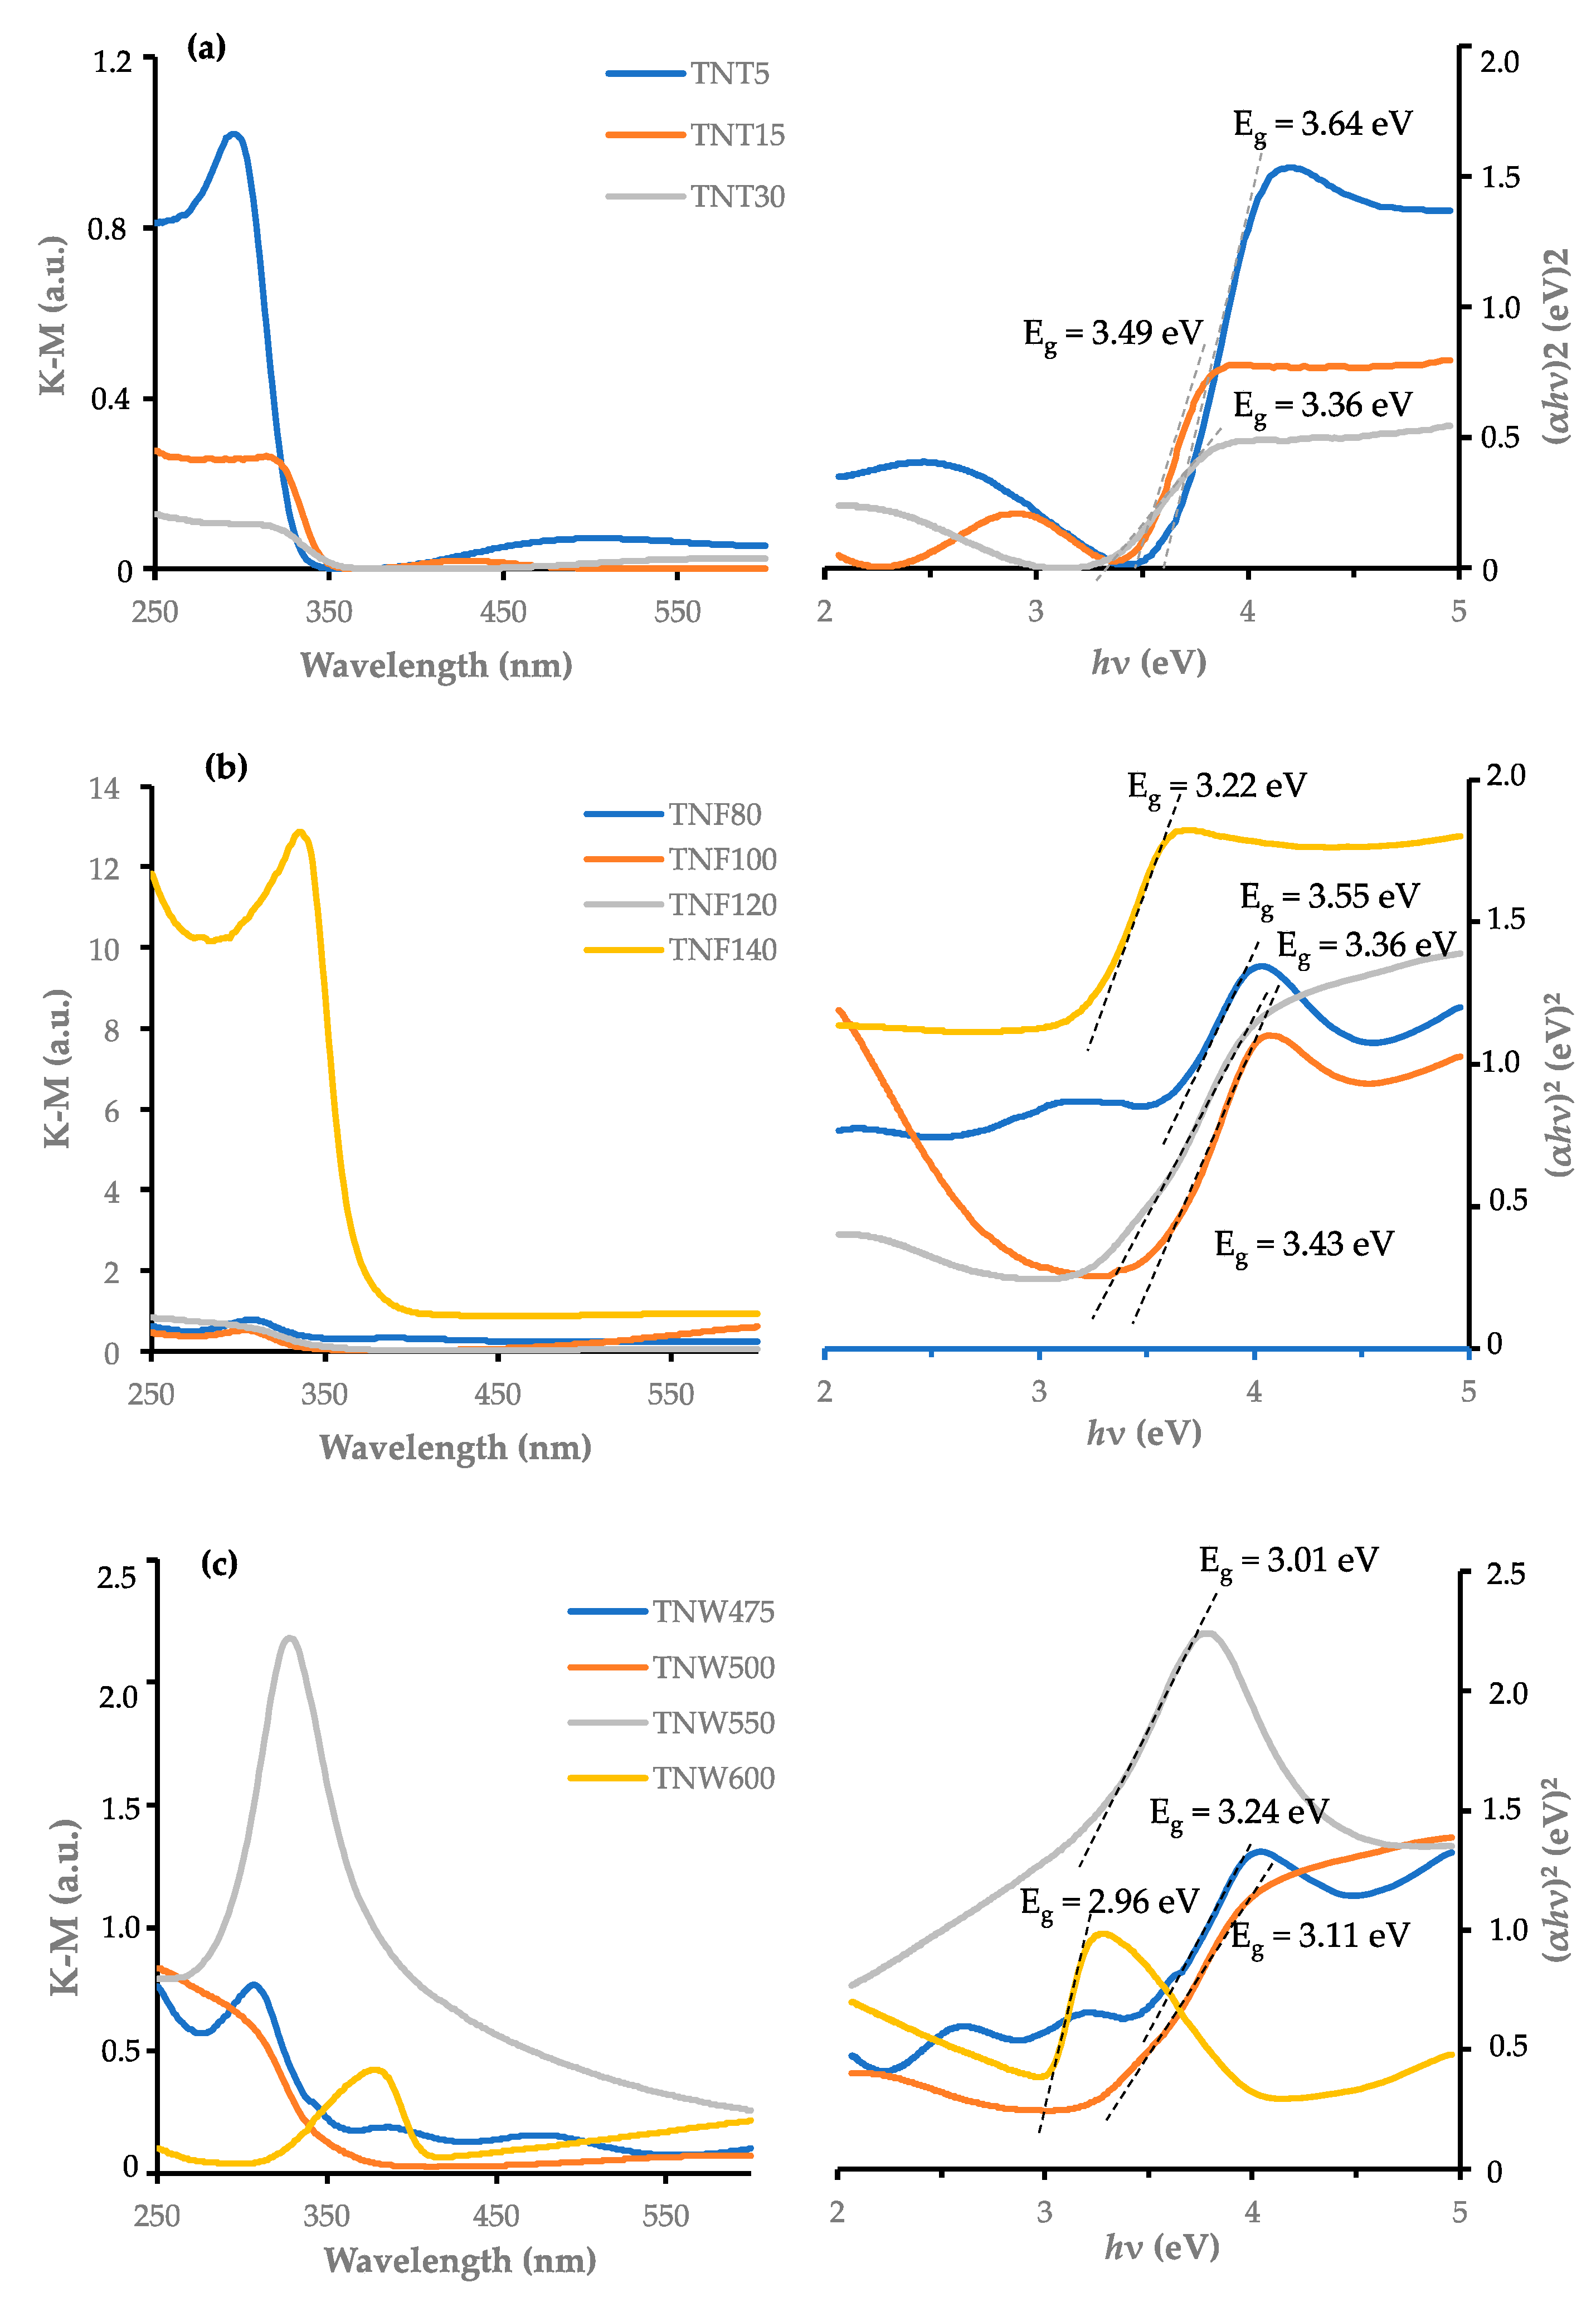
To estimate the band gap values for studied titania samples of different nanoarchitecture and structure, diffuse reflectance UV-Vis spectra (UV-VIS-DRS) have been registered. Assuming indirect bandgap for titania n = 2 and considering that absorption coefficient α is proportional to Kubelka–Munk function, the band gap energy can be obtained from the plots of (αhν)2 vs. hν as the intercept at (αhν)2 = 0 of the extrapolated linear part of the plot. The intersection of the straight line at the photon energy axis gives the value to Eg. Figure 7 presents UV-VIS-DRS spectra registered for TNT (a), TNF (b), and TNW (c), as well as plots of (αhν)2 vs. hν, which were used to calculate the energy difference between the valence band and the conduction band in studied semiconductor samples. In Table 3 detailed band gap values are presented.
2.5. Photocatalytic Activity Results
Results referring to kinetic measurements focused on the photodegradation process of methylene blue and acetone under UV light irradiation are presented in Figure 8, Figure 9, Figure 10, Figure 11 and Figure 12 and in Table S1. The results involve all three kinds of nanolayers presented in this paper. Concentration-time dependencies for acetone photodegradation are linear in the whole studied range and exponential for experiments with methylene blue. The initial concentration of CO2 equal ca. 400 ppm (see in Figure 8) results from measurement technique. Application of some known level of initial CO2 concentration instead of a complete CO2 removing before reaction measurement was a much more simple approach and allowed to gather the results with completely the same quality.
3. Discussion
The application of simple methods for the production of TiO2 layers, using electrochemical, chemical, and thermal oxidation of the titanium alloy (Ti6Al4V), allowed for obtaining coating materials characterized by different nanoarchitecture: nanotubes (TNT), nanofibers (TNF), and nanowires (TNW), respectively. The results of my works exhibited that the change one of the manufacturing process parameters (e.g., potential during the anodic oxidation process or temperature in the case of chemical/thermal oxidation process) enabled to control the structure and morphology of produced nanocoatings, thus, controlling their photocatalytic activity. In the case of TNT layers, the tube diameters were strictly dependent on the potential applied during the anodic oxidation, e.g., in the potential range of 5 to 40 V, the tube diameters grew with increasing of the potential used. Simultaneously, at higher potentials (50, 60 V), such a relationship was not found (Figure 1). The structural characterization of TNT coatings proved their amorphousness, which was expected especially without subjecting of the produced systems to annealing [60]. The diameter changes of titania nanotubes are closely related to changes in their hydrophilicity. Studied TNT coatings showed visible hydrophilicity versus the pure titanium alloy surface, as a reference sample. In practice the linear tendency of hydrophilic properties increase of TNT coatings was noticed in the row TNT5 > TNT10 > TNT15 > TNT20 > TNT30 > TNT40, i.e., from the contact angle value 64.5° for TNT5 up to 19.3° for TNT40. Disorders in the surface morphology of TNT50 and TNT60 coatings caused a rapid increase of the contact angle to 55.6° and 75.1°, respectively, and in the same way increase of hydrophobicity.
The chemical oxidation of Ti6Al4V samples with the use of H2O2 solution as an oxidation agent at elevated temperature (80–140 °C), allowed me to receive a set of samples with surface morphology similar to nanofibers. The use of lower temperatures (80–120 °C) led to obtain delicate fibers, somehow tangled in a continuous layer, while the temperature of 140 °C forced the formation of fibers glued together on the surface in such a way that there are free spaces between the frames. Probably the presence of these spaces favors the entry of water and, hence, the better hydrophilicity of this system compared to the others. What is worth to underline, sample TNF140, as well as TNF120, are not completely amorphous and Raman spectra proved the presence of anatase crystallites, which were not visible in the spectra of TNF80 and TNF100.
The temperature was also an important factor in the production of TiO2 nanowires by thermal oxidation of the titanium alloy Ti6Al4V in the presence of Ar containing traces of oxygen. Layers consisted of dense-packed thin needles/wires with anatase structure (which was proved by Raman spectroscopy. Figure 6) were produced on the surface of Ti6Al4V samples annealed at 475 °C. The raising of the process temperature to 500 °C caused a change in the morphology of the surface layer. Instead of densely packed sharp-pointed needles, whose distribution on the surface of the alloy resembles a shaggy carpet, I received tightly packed rods with rounded ends, more than 3 to 5 times thicker than needles. This nanoarchitecture possesses anatase/rutile structure, which was proved by Raman spectroscopy and GAXRD studies (Figure 6). The use of even higher temperatures (550 °C, 600 °C) leads to obtaining of anatase/rutile and pure rutile systems, respectively, densely packed and arranged in the form of cuboids with mutual walls. The poor wettability of these systems (all analyzed systems turned out to be strongly hydrophobic) can be associated with this densely packed nanoarchitecture.
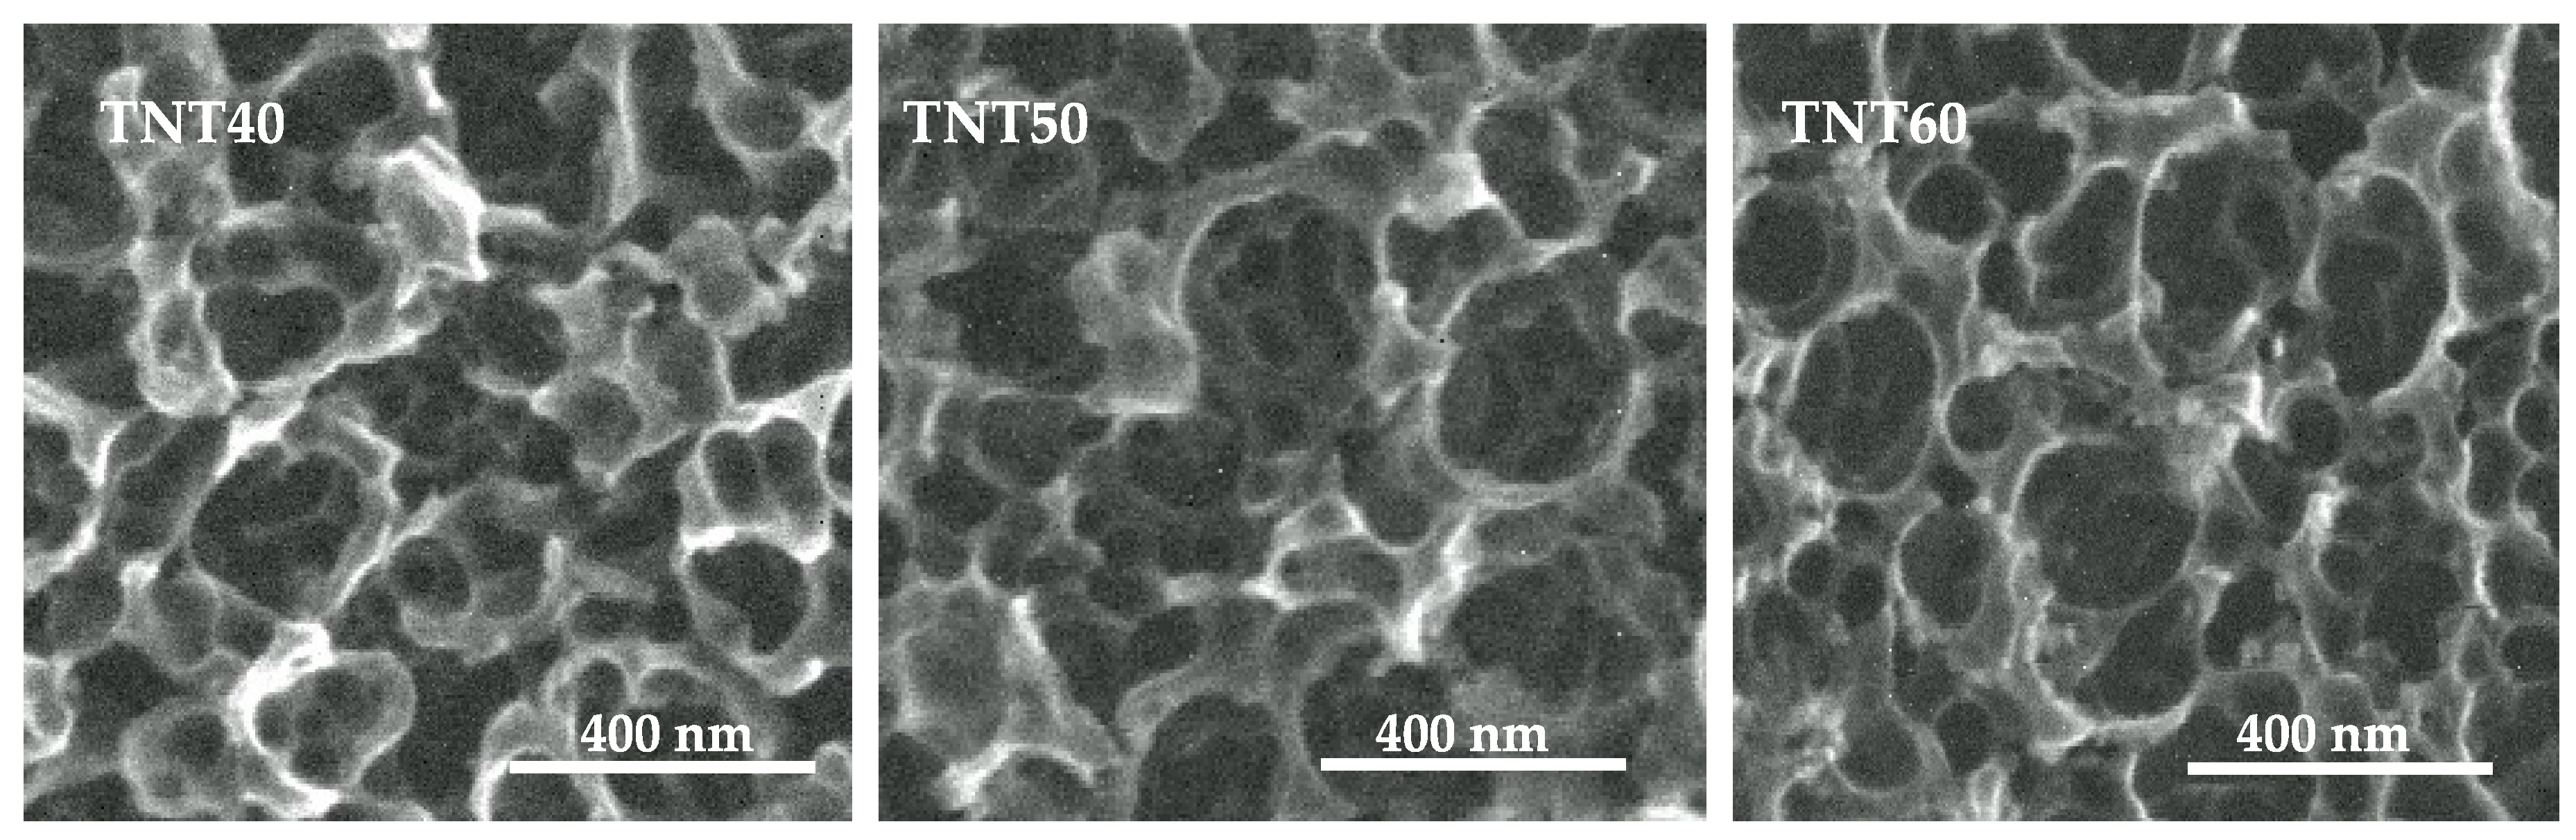
Studied systems were characterized in terms of specific surface area (SBET) on the basis of BET measurements. The biggest value of SBET has been noticed for titania nanowires obtained during thermal oxidation of titanium alloy at 475 °C. Looking at SEM image of this coating it is easy to explain this state of affairs—needle-like architecture allows for an easy nitrogen molecules penetration of the layer. Such easy penetration does not take place in case of next titania nanowire coatings. SBET values for TNW 500, TNW550, and TNW600 are twice, three times, and four times smaller, respectively. The dense packing of rods, which do not allow for deep penetration of the layer through nitrogen molecules, can be the factor, which reduces the specific surface area. SBET values obtained for titania nanofibers are in the range of 21.3 to 23.7 m2/g for amorphous and amorphous/anatase titania nanofibers obtained at 80, 100, and 120 °C. Anatase nanofibers obtained during chemical oxidation of titanium alloy with the use of H2O2 at 140 °C possess bigger specific surface area—31.2 m2/g, which is in accordance with the surface morphology—this sample surface is characterized by compact systems, consisting of sticking together clusters of nanofibers, intersected by grooves having a width of about 100 nm. Review of literature data about BET studies on titania nanofibers shows that obtained values are in accordance with them. Ghosh et al. studied mesoporous TiO2 nanofibers with a controlled diameter to characterize the influence of the structure, morphology, and specific surface area on photocatalytic activity. During their studies, they calculated SBET values for samples, and they were in the region 3.40–29.50 m2/g [61]. Lee et al. analyzed TiO2 and TiO2/Ag nanofibers, and they obtained for titania SBET value equal to 34.4 m2/g. [62]. Considering the results of these measurements carried out on titania nanotube coatings it can be stated that with the increase of nanotubes diameter, the value of specific surface area decreases. The same tendency was visible in my earlier research [63]. Some anomalies occur in the case of nanotube layers obtained at potentials of 50 and 60 V. In the case of these systems, the increase of applied potential did not cause the creation of nanotubes with the largest diameters. The diameters began to gradually decrease, and the surface became less homogeneous. Simultaneously, the specific surface area value increases for TNT50 and TNT60 in comparison to samples obtained at 40 V and 30 V. Looking at Figure 1c,d,g,h, one can have the impression that the diameters of the nanotubes produced at the potential of 15 V and 20 V are similar to the diameters of nanotubes produced at potentials 50 V and 60 V. The systems differ only in the surface homogeneity—the systems produced at 15 and 20 V are definitely more homogeneous, and those produced at 50 and 60 V are not as uniform.
For all the obtained systems the UV-VIS-DRS spectra were registered to determine the energy gap value (EBG). The band gap energy values were estimated from the plots of (αhν)2 vs. hν as the intercept at (αhν)2 = 0 of the extrapolated linear part of the plot (Figure 7, Table 3). In the case of amorphous titania nanotube coatings, the values of EBG were decreasing from 3.64 eV up to 3.34 eV for TNT5 to TNT40, respectively. This red shift in band gap energy and values are in accordance with the literature data [64,65]. Simultaneously, analysis of data presented in Table 3 revealed that EBG values appointed for TNT40, TNT50, and TNT60 samples are higher than for TNT30 one (they are much more similar to TNT15 and TNT20 samples). A similar dependency was found in the case of specific surface area. It can be associated with the morphology similarities of TNT40, TNT50, and TNT60 to TNT15, TNT20 samples (Figure 13, Figure 1). The nanotubes, which built TNT40, TNT50, and TNT60 coatings possess smaller nanotubes inside. These inner nanotubes have the diameters similar to nanotubes which built TNT15, TNT20 samples.
The higher EBG values (3.55, 3.43 eV) were noticed for amorphous TNF80 and TNF100 coatings, whereas, in the case of TNF120 sample for which the anatase nanocrystals presence was confirmed (Figure 4), the energy band gap decreases to 3.36 eV. For the anatase TNF coating (TNF140 sample) the EBG = 3.22 eV was found, which was close to the theoretical value for anatase (3.2 eV) [66]. In the case of titania nanowires layers, produced as a result of the thermal oxidation of Ti6Al4V substrate which revealed anatase (TNW475), anatase/rutile (TNW500, TNW550), and rutile (TNW600) structures, the energy band gap values are similar to those published in the literature: TNW475—anatase (3.24 eV), TNW500 (3.11 eV), TNW550 (3.01 eV), and TNW600—rutile form (2.96 eV) [67,68]. The decrease of the EBG value is strictly connected to structural differences of studied samples, and these values provide additional evidence for the crystallinity systems of anatase and rutile.
Using the produced TiO2 systems, so varied in the structure, morphology, and characterized by different specific surface area values (SBET) and energy band gap values (EBG), and commercially available Pilkington Glass ActivTM as reference sample with high photocatalytic activity, methylene blue and acetone degradation tests were carried out. The activity of all the studied samples was induced using UV light. The results of my works revealed clear differences in photodegradation rates for methylene blue (MB) and acetone (Ac) under applied conditions. According to these data Ac undergoes photodegradation significantly slower than MB. After several hours, the concentration of CO2, which is one of two final products of Ac degradation, increases with the same rate as just after the reaction initiation. It manifests by a linear trend of the concentration-time data plot (Figure 8). Contrary, the decrease of MB concentration has exponential character, (Figure 9), similar to those visible in the literature [69,70]. It forces the application of two different approaches to experimental data. Details on these approaches are described in Materials and Methods. It caused that both rate constants cannot be compared with each other. However, it is clear that reaction with acetone was significantly slower in the applied conditions. Analysis of data presented in Figure 10, Figure 11 and Figure 12 shows that both of photodegradation pathways are faster when titania nanowires or nanofibers have been used as photocatalysts. The photocatalytic effect caused by titania nanotubes is clearly lower (Figure 10). One of the most active photocatalytically nanotube coatings is TNT40. TNT50 and TNT60 are the weakest photocatalysts of the studied samples. In case of the MB photodegradation, photoactivity of the reference Pilkington Glass ActivTM is almost three times higher than the medium activity of other TNT surfaces. In case of the reaction of acetone, the effect is more typical. The kobsA values are the highest for TNT40, and generally, the shape of the curve involving all TNT samples is similar to the Gaussian curve. The TNT30 and TNT40 samples revealed higher photocatalytic activity than Pilkington glass and, therefore, seem to be an interesting example of the surface for next optimizations. It is hard to explain this fact by specific surface area, as these samples were characterized by the smallest values of SBET among studies TNT samples. However, their energy band gap values are the smallest and the most similar to the literature bandgap value of the best titania structure—anatase [67,68]. Generally, TNT coatings catalyze the MB photodegradation process significantly weaker than photodegradation of Ac. Such a significant difference in reactivity can be related to the size of the molecule: acetone is smaller than MB, and it is easier to adsorb a small molecule than a bigger one, which generates sterically hindrances for the next molecules approaching surface.
Titania nanofibers photocatalytic activity is similar for both MB and Ac. Moreover, the order of photoactivity is similar, and the rate of degradation increases with the increasing temperature, which was used in the production of TNF samples (Figure 10). In both cases, between TNF100 and TNF120 a distinct increase in the kobs is seen. It can be the consequence of the presence of a crystalline form of titania in the structure of TNF120, as well as in the structure of TNF140. Figure 4 shows that bands attributed to anatase crystallites are visible in Raman spectra of TNF120 and TNF140. The impact of crystallinity of the samples is additionally proved by UV-VIS studies and calculated EBG values, which are for TNF 140 almost identical with literature data available for anatase, and for TNF120—close to this values [67,68]. The specific surface area is the biggest for TNF 140, which can be treated as the next factor increasing this sample’s photoactivity. Samples TNF140 and TNT120 degrade both compounds: MB and Ac faster than Pilkington Glass ActivTM. Their potential in future applications is also significant.
In the case of titania nanowires, the higher photocatalytic activity was noticed for TNW samples produced at lower temperatures (Figure 11). This trend is almost linear in case of MB photodegradation, as with the increase of used oxidation process temperature from 475 to 600 °C and with simultaneous transition from the form of anatase, through a mixed system, to rutile, the photocatalytic activity decreases. The only exception is noticed for the photodegradation of Ac, for which TNW500 is definitely the most active. It should be noted that photocatalytic activity of selected TNWs samples (TNW 500 in the case of Ac photodegradation, and TNW457, TNW500 in the case of MB photodegradation) were similar to the reference surface, i.e., Pilkington Glass ActivTM. It can be explained by the presence of anatase nanocrystallites in the structure of TNW475 and TNW500 samples (Figure 6). The appearance of signals indicating the presence of rutile indicates structural changes, which occur during the synthesis of systems at higher temperatures (550 and 600 °C). The addition of the rutile form in the structure of the layer resulted in a significant reduction in photocatalytic activity of the studied systems, in particular in the reaction of acetone degradation. Energy band gap values of titania nanowires in the form of anatase and rutile are close to the literature values, and there are an additional proof of their nanocrystallity on the presence of anatase crystallites [67,68].
Considering received results of my photocatalytical experiments, it should be noted that differences in the observable rate constants for different produced coating materials, i.e., TNT, TNF, and TNW, seem to be more distinct for photodegradation of smaller acetone in comparison to the relatively huge MB. It suggests that small organic molecules, such as acetone, are a better indicator of titania nanomaterials photoactivity. The easiest explanation is based on the size of acetone. This small non-charged molecule is an excellent reactant to test a surface susceptibility toward adsorption and catalytic activity because its size reduces additional disturbing factors, such as hindering the activity evaluation. Moreover, the mechanism of MB degradation on the surface of nanoporous titania is quite complicated and not only one model of degradation is known [71,72]. The titania-based photocatalytic oxidation in water is not selective by contrast with the selective mild oxidation in pure organic gaseous or liquid phase of aliphatic or substituted aromatic hydrocarbons performed with the same titania catalyst as discussed in [73]. Two oxidative agents can be considered: the photo-produced holes h+ (mainly involved in the decarboxylation reaction) and/or the OH◦ radicals, which are known as strongly active and degrading but non-selective agents and can be generated by oxidation of water by holes or transient formation of hydroperoxide radicals. Since the reactant is cationic, electron donor photo-holes are certainly not concerned by the initial step. On the other hand, the OH− radicals can attack the C–S+=C functional group in MB, which is in direct coulombic interaction with titania’s surface. Therefore, the initial step of MB degradation can be ascribed to the cleavage of the bonds of the C–S+=C functional group in MB. A detailed reaction mechanism could be presented from the initial step of adsorption involving the cationic functional group of MB molecule, which is probably adsorbed perpendicularly to the surface down to the final products (CO2, SO42−, NH4+ and NO3−). The degradation intermediates originated from the initial opening of the central aromatic ring, and their subsequent metabolites were formed in agreement with general rules already put in evidence in the degradation of other complex molecules in water.
4. Materials and Methods
4.1. Electrochemical Oxidation of Ti6Al4V
Titanium alloy substrates (Ti6Al4V foil, grade 5.70 mm × 7 mm × 0.25 mm) have been ground with abrasive paper, degreased (ultrasonic bath, 5 min/ethanol, 5 min/acetone, 5 min/water) and activated in the solution of HF:HNO3:H2O (molar ratio—1:4:5, time—30 s). Such prepared substrates were subjected to 30 min of electrochemical oxidation in the presence of electrolyte (aqueous HF solution, C = 0.3%), using a platinum rod as a cathode and using the following potential values: 5, 10, 15, 20, 30, 40, 50, and 60 V. After the process samples were cleaned in an ultrasonic bath (water with a pinch of aluminum oxide, 10 min), they were rinsed with water and dried in a stream of argon.
4.2. Chemical Oxidation of Ti6Al4V
Titanium alloy substrates (Ti6Al4V foil, grade 5.70 mm × 7 mm × 0.25 mm) were ground with abrasive paper, degreased (ultrasonic bath, 5 min/ethanol, 5 min/acetone, 5 min/water) and activated in the solution of HCl:H2O (molar ratio—1:1, time—30 min, temperature—80 °C). Such prepared substrates were subjected to 4 h of Ti6Al4V chemical oxidation using a system with reflux condenser, in the presence of H2O2 solution (C = 30%), which was heated up to 80, 100, 120, and 140 °C. After the process samples have been cleaned in an ultrasonic bath (distilled water, 10 min) and then dried in a stream of argon.
4.3. Thermal Oxidation of Ti6Al4V
Titanium alloy substrates (Ti6Al4V foil, grade 5.70 mm × 7 mm × 0.25 mm) were ground with abrasive paper, degreased (ultrasonic bath, 5 min/ethanol, 5 min/acetone, 5 min/water) and activated in the solution of HCl:H2O (molar ratio—1:1, time—30 min, temperature—80 °C). Such prepared substrates were subjected to 90 min of Ti6Al4V thermal oxidation in the vacuum furnace (T = 475, 500, 550, 600 °C, p = 4 mbar (400 Pascal)), using Ar (99.95% purity) as carrier gas. After the process samples were cleaned in an ultrasonic bath (distilled water, 10 min) and then dried in a stream of argon.
4.4. Structure and Morphology Characterization
The structure of the produced TiO2 layers was studied using Raman spectroscopy (RamanMicro 200 PerkinElmer (PerkinElmer Inc., Waltham, MA, USA) (λ = 785 nm)), diffuse reflectance infrared Fourier transform spectroscopy (DRIFT, Spectrum2000, PerkinElmer Inc., Waltham, MA, USA), and glancing angle X-ray diffraction (PANalytical X’Pert Pro MPD X-ray diffractometer using Cu-Kα radiation, PANalytical B.V., Almelo, The Netherlands); the incidence angle was equal to 1 deg. The surface morphology changes of produced samples were estimated using a Quanta scanning electron microscope with field emission (SEM, Quanta 3D FEG, FEI Company, Huston, TX, USA).
4.5. Wettability Studies and Surface Free Energy Estimation
The wettability and surface free energy of the produced titania nanocoatings were determined using the earlier described method [74,75]. The contact angle of water and diiodomethane was measured using a goniometer with drop shape analysis software (DSA 10 Krüss GmbH, Hamburg, Germany). Each measurement was carried out three times, immediately after deposition of the drop. The volume of the distilled water drop in the contact angle measurement was 3 µL and the volume of the diiodomethane drop was 4 µL. Both contact angles values were used to estimate the value of the surface free energy, basing on mathematical calculations, which were performed using the Owens–Wendt method [59].
4.6. Specific Surface Area Estimation According to BET analysis
Studies on BET specific surface area were done using the ASAP 2010 Micromeritics (Micromeritics France S.A., Verneuil Halatte, France). The samples were heated (desorbed) before measurement at 70 °C, to achieve a final pressure of 0.001 mbar, over 8 h. After the desorption process, the samples were weighed and placed in a measuring station, in the temperature of liquid nitrogen, in which the nitrogen adsorption isotherms were determined.
4.7. Band Gap Characterization on the Basis of Diffuse Reflectance UV-Vis Spectroscopy
UV-Vis spectra were registered in the range of 250 to 700 nm using spectrophotometer Jasco V-750 (JASCO Deutschland GmbH, Pfungstadt, Germany) equipped with an integrating sphere for diffuse reflectance spectroscopy. The recorded spectra were analyzed in terms of energy band gap values using Spectra ManagerTM CFR software (JASCO Deutschland GmbH, Pfungstadt, Germany).
4.8. Photoactivity Test
The photocatalytic activity of the produced titania coatings was estimated using: (a) the most used procedure in the literature, i.e., methylene blue (MB, 3 cm3) photodegradation, as well as (b) acetone (0.1 cm3) photodegradation. The temperature during the experiments was constant at 23 °C. In all experiments, I was waiting 30 min for the adsorption equilibria (in the darkness), after the samples of the porous materials were (a) immersed in the aqueous 10−5 M methylene blue solution or (b) placed inside the homemade reactor, equipped with CO2 detector, to which the volatile acetone had been delivered. Then, they were illuminated by UV radiation (18 W, range of 340 to 410 nm with a maximum at 365 nm, UV irradiance on the film surface was measured to be 0.8 mW/cm2). The changes in MB concentration (absorbance measured at λ = 660 nm) were registered every 24 h for seven days by spectrophotometric analysis (Metertech SP-830 PLUS). The concentration of CO2 generated in the acetone degradation process was read based on the signal from the detector every hour for 24 h. Pilkington Glass ActivTM samples were subjected to the same tests, treating them as reference system with high photocatalytic activity. All analyzed samples had dimensions of 7 mm × 7 mm. During calculations, the blind tests (degradation without UV and titania samples) were considered.
4.9. Kinetic Calculations
Photoactivity of nanomaterials analyzed in this paper was determined quantitatively according to the Langmuir–Hinshelwood reaction mechanism [76]. Thus, a general rate of reaction can be expressed as:
where c is a reactant (MB or acetone) concentration; t is time of the concentration measurement; kobs’ is an observed rate constant, and K describes the reactant adsorption process.
r = dc/dt = kobs’Kc/(1 + Kc)
Significantly low concentration of the reactants ([MB] ca. 10−5 M and gaseous acetone), as well as a lack of saturation for both reactant’s concentrations during their photodegradation, suggest that photodegradation processes occur according to the pseudo-first-order kinetics. Low values of c and K allow simplifying Equation (1) to the following form:
dc/dt = kobs’Kc = kobsc
Considering linearity of the concentration-time dependencies it is clear that, in case of acetone photodegradation, its concentration is almost constant due to its relatively high initial concentration (0.015 cm3 of liquid acetone injected to the reaction chamber) in relation to the monitored reaction time and amount of CO2 generated during photodegradation (ca. 50–500 ppm). Thus, concentration c in Equation (2) is constant and can be involved in the observable rate constant. Finally, Equation (2) applied to the reactions of methylene blue and acetone has the form:
dc/dt = kobsMBc
dc/dt = kobsA
In result, the concentration-time dependencies for both photodegradation processes are described by the following different equations:
where ct is the reactant concentration after time t; c0 is its starting concentration of MB, kobsMB is a pseudo-first-order observable rate constant for MB degradation, and kobsA is a pseudo-zero-order observable rate constant for acetone degradation.
ct = c0 exp(−kobsMBt) + const.
ct = kobsAt + const.
Application of two different kinetic approaches for the studied reactions was forced by differences in the absorbance-time data behavior. In case of experiments with methylene blue where the exponential decrease of the dye concentration is visible, the exponential Equation (5) can be applied whereas such procedure for the acetone degradation process would be a form of rashness. Thus, a linear Equation (6) has been used instead to avoid too uncertain conclusions.
5. Conclusions
The comparative analysis of photocatalytic activity of three completely different in terms of structure and morphology, titania coatings (nanotubes, nanofibers, and nanowires) with the reference sample—Pilkington Glass ActivTM showed that titania nanofibers obtained at 140 and 120 °C, possessing anatase and anatase/amorphous structure, as well as titania nanowires obtained at 475 and 500 °C, possessing anatase and anatase/rutile structure, were better photocatalyst than Pilkington Glass ActivTM. Completely amorphous titania nanotubes, turned out to be an interesting alternative for photocatalytic materials in the form of thin films. However, their photocatalytic activity is lower than for Pilkington Glass ActivTM. The results of my previous work showed that this type of coating exhibited adequate bioactivity, which allows their use as coating biomaterials in the design and construction of implants [77,78,79]. Their photoactivity enriches the set of their properties because UV-induced photocatalytic activity in the degradation of organic compounds can be used in the processes of UV implant sterilization.
Supplementary Materials
The following are available online at https://www.mdpi.com/2073-4344/9/3/279/s1 Figure S1. Raman microscopy map of TNW600, Table S1. Observable rate constants (kobs) for the process of acetone (A) and methylene blue (MB) degradation by studied nanomaterials under UV light.
Funding
The APC was funded by Nano-implant Ltd.
Acknowledgments
I would like to thank Adrian Topolski for fruitful discussion on the kinetics of acetone and methylene blue photodegradation.
Conflicts of Interest
The authors declare no conflict of interest.
References
- Banerjee, S.; Dionysiou, D.D.; Pillai, S.C. Self-cleaning applications of TiO2 by photo-induced hydrophilicity and photocatalysis. Appl. Catal. B Environ. 2015, 176–177, 396–428. [Google Scholar] [CrossRef]
- Erika Cedillo-González, E.I.; Riccò, R.; Montorsi, M.; Montorsi, M.; Falcaro, P.; Siligardi, C. Self-cleaning glass prepared from a commercial TiO2 nano-dispersion and its photocatalytic performance under common anthropogenic and atmospheric factors. Build. Environ. 2014, 71, 7–14. [Google Scholar] [CrossRef]
- Xu, F.; Wang, T.; Chen, H.Y.; Bohling, J.; Maurice, A.M.; Wu, L.; Zhou, S. Preparation of photocatalytic TiO2-based self-cleaning coatings for painted surface without interlayer. Prog. Org. Coat. 2017, 113, 15–24. [Google Scholar] [CrossRef]
- Takagi, K.; Makimoto, T.; Hiraiwa, H.; Negishi, T. Photocatalytic Antifogging Mirror. J. Vac. Sci. Technol. A 2001, 19, 2931–2935. [Google Scholar] [CrossRef]
- Hashimoto, K.; Irie, H.; Fujishima, A. TiO2 photocatalysis—A historical overview and future prospects. Jpn. J. Appl. Phys. 2005, 44, 8269–8285. [Google Scholar] [CrossRef]
- Vitiello, G.; Pezzella, A.; Zanfardino, A.; Varcamonti, M.; Silvestri, B.; Costantini, A.; Luciani, G. Titania as a driving agent for DHICA polymerization: A novel strategy for the design of bioinspired antimicrobial nanomaterials. J. Mater. Chem. B 2015, 3, 2808–2815. [Google Scholar] [CrossRef]
- Fu, G.; Vary, P.S.; Lin, C.-T. Anatase TiO2 Nanocomposites for Antimicrobial Coatings. J. Phys. Chem. B 2005, 109, 8889–8898. [Google Scholar]
- Kubacka, A.; Diez, M.S.; Rojo, D.; Bargiel, R.; Ciordia, S.; Zapico, I.; Albar, J.P.; Barbas, C.; Martins dos Santos, V.; Fernandez-Garcia, M.; et al. Understanding the antimicrobial mechanism of TiO2-based nanocomposite films in a pathogenic bacterium. Sci. Rep. 2014, 4, 4134. [Google Scholar] [CrossRef]
- Vitiello, G.; Pezzella, A.; Zanfardino, A.; Silvestri, B.; Giudicianni, P.; Costantini, A.; Luciani, G. Antimicrobial activity of eumelanin-based hybrids: The role of TiO2 in modulating the structure and biological performance. Mater. Sci. Eng. C 2017, 75, 454–462. [Google Scholar] [CrossRef]
- Ghicov, A.; Tsuchiya, H.; Hahn, R.; Macak, J.M.; Munoz, A.G.; Schmuki, P. TiO2 nanotubes: H+-insertion and strong electrochromic effects. Electrochem. Commun. 2006, 8, 528–532. [Google Scholar] [CrossRef]
- Garcia Canadas, J.; Fabregat-Santiago, F.; Kapla, J.; Bisquert, J.; Garcia-Belmonte, G.; Mora-Sero, I.; Edwards, M.O.M. Dynamic behaviour of viologen-activated nanostructured TiO2: Correlation between kinetics of charging and coloration. Electrochim. Acta 2004, 49, 745–752. [Google Scholar] [CrossRef]
- Turhan, I.; Tepehan, F.Z.; Tepehan, G.G. Effect of V2O5 content on the optical, structural and electrochromic properties of TiO2 and ZrO2 thin films. J. Mater. Sci. 2005, 40, 1359–1362. [Google Scholar] [CrossRef]
- Yan, X.; Wang, Z.; He, M.; Hou, Z.; Xia, T.; Liu, G.; Chen, X. TiO2 Nanomaterials as Anode Materials for Lithium-Ion Rechargeable Batteries. Energy Technol. 2015, 3, 801–814. [Google Scholar] [CrossRef]
- Lahan, H.; Boruah, R.; Hazarika, A.; Das, S.K. Anatase TiO2 as an Anode Material for Rechargeable Aqueous Aluminum-Ion Batteries: Remarkable Graphene Induced Aluminum Ion Storage Phenomenon. J. Phys. Chem. C 2017, 121, 26241–26249. [Google Scholar] [CrossRef]
- Bai, J.; Zhou, B. Titanium Dioxide Nanomaterials for Sensor Applications. Chem. Rev. 2014, 114, 10131–10176. [Google Scholar] [CrossRef]
- Maziarz, W.; Kusior, A.; Trenczek-Zajac, A. Nanostructured TiO2-based gas sensors with enhanced sensitivity to reducing gases. Beilstein J. Nanotechnol. 2016, 7, 1718–1726. [Google Scholar] [CrossRef]
- Rehman, F.U.; Zhao, C.; Jiang, H.; Wang, X. Biomedical applications of nano-titania in theranostics and photodynamic therapy. Biomater Sci. 2016, 4, 40–54. [Google Scholar] [CrossRef]
- Jukapli, N.M.; Bagheri, S. Recent developments on Titania nanoparticle as photocatalytic cancer cells treatment. J. Photochem. Photobiol. B 2016, 163, 421–430. [Google Scholar] [CrossRef]
- Yin, F.Z.; Wu, L.; Yang, H.G.; Su, Y.S. Recent progress in biomedical applications of titanium dioxide. Phys. Chem. Chem. Phys. 2013, 15, 4844–4858. [Google Scholar] [CrossRef]
- Kulkarni, M.; Mazare, A.; Gongadze, E.; Perutkova, Š.; Kralj-Iglič, V.; Milošev, I.; Schmuki, P.; Iglič, A.; Mozetič, M. Titanium nanostructures for biomedical applications. Nanotechnology 2015, 26, 062002. [Google Scholar] [CrossRef] [Green Version]
- Cao, P.J.; Wu, H.D.; Dong, J.L. Research on Application of Nano-TiO2 in Automotive Coating. Appl. Mech. Mater. 2012, 160, 216–222. [Google Scholar] [CrossRef]
- Francioso, L.; Presicce, D.S.; Taurino, A.M.; Rella, R.; Siciliano, P.; Ficarella, A. Automotive application of sol–gel TiO2 thin film-based sensor for lambda measurement. Sens. Actuators B Chem. 2003, 95, 66–72. [Google Scholar] [CrossRef]
- Lazar, M.; Varghese, S.; Nair, S. Photocatalytic Water Treatment by Titanium Dioxide: Recent Updates. Catalysts 2012, 2, 572–601. [Google Scholar] [CrossRef] [Green Version]
- Gamage, J.; Zhang, Z. Applications of Photocatalytic Disinfection. Int. J. Photoenergy 2010, 2010, 1–11. [Google Scholar] [CrossRef]
- Binas, V.; Venieri, D.; Kotzias, D.; Kiriakidis, G. Modified TiO2 based photocatalysts for improved air and health quality. J. Mater. 2017, 3, 3–16. [Google Scholar]
- Stefanov, B.I.; Lebrun, D.; Mattsson, A.; Granqvist, C.G.; Österlund, L. Demonstrating Online Monitoring of Air Pollutant Photodegradation in a 3D Printed Gas-Phase Photocatalysis Reactor. J. Chem. Educ. 2015, 92, 678–682. [Google Scholar] [CrossRef]
- Zhang, J.; Zhou, P.; Liu, J.; Yu, J. New understanding of the difference of photocatalytic activity among anatase, rutile and brookite TiO2. Phys. Chem. Chem. Phys. 2014, 16, 20382–20386. [Google Scholar] [CrossRef]
- Clarizia, L.; Vitiello, G.; Pallotti, D.K.; Silvestri, B.; Nadagouda, M.; Lettieri, S.; Marotta, R. Effect of surface properties of copper-modified commercial titanium dioxide photocatalysts on hydrogen production through photoreforming of alcohols. Int. J. Hydrogen Energy 2017, 42, 28349–28362. [Google Scholar] [CrossRef]
- Araiedh, F.; Ducos, F.; Houas, A.; Chaoui, N. Kinetic study of the photocatalytic degradation of the C-polymorph of a stearic acid microcrystal grown on an amorphous titania surface scattered with anatase microdomains. J. Photochem. Photobiol. A Chem. 2018, 353, 458–463. [Google Scholar] [CrossRef]
- Thao, L.; Dang, T.; Khanitchaidecha, W.; Channei, D.; Nakaruk, A. Photocatalytic Degradation of Organic Dye under UV-A Irradiation Using TiO2-Vetiver Multifunctional Nano Particles. Materials 2017, 10, 122. [Google Scholar] [CrossRef]
- Zywitzki, D.; Jing, H.; Tüysüz, H.; Chan, C.K. High surface area, amorphous titania with reactive Ti3+ through a photo-assisted synthesis method for photocatalytic H2 generation. J. Mater. Chem. A 2017, 5, 10957–10967. [Google Scholar] [CrossRef]
- Matsuzawa, S.; Tanaka, J.; Sato, S.; Ibusuki, T. Photocatalytic oxidation of dibenzothiophenes in acetonitrile using TiO2: Effect of hydrogen peroxide and ultrasound irradiation. J. Photochem. Photobiol. A Chem. 2002, 149, 183–189. [Google Scholar] [CrossRef]
- Krylova, G.; Na, C. Photoinduced crystallization and activation of amorphous titanium dioxide. J. Phys. Chem. C 2015, 119, 12400–12407. [Google Scholar] [CrossRef]
- Xiong, L.B.; Li, J.L.; Yang, B.; Yu, Y. Ti3+ in the surface of titanium dioxide: Generation, properties and photocatalytic application. J. Nanomater. 2012, 2012, 831524. [Google Scholar] [CrossRef]
- Ghuman, K.K.; Singh, C.V. Self-Trapped Charge Carriers in Defected Amorphous TiO2. J. Phys. Chem. C 2016, 120, 27910–27916. [Google Scholar] [CrossRef]
- Ohtani, B.; Ogawa, Y.; Nishimoto, S. Photocatalytic activity of amorphous-anatase mixture of titanium(IV) oxide particles suspended in aqueous solutions. J. Phys. Chem. B 1997, 101, 3746–3752. [Google Scholar] [CrossRef]
- Ohtani, B.; Prieto-Mahaney, O.O.; Li, D.; Abe, R. What is Degussa (Evonik) P25? Crystalline composition analysis, reconstruction from isolated pure particles and photocatalytic activity test. J. Photochem. Photobiol. A 2010, 216, 179–182. [Google Scholar] [CrossRef] [Green Version]
- Scolan, E.; Sanchez, C. Synthesis and Characterization of Surface-Protected Nanocrystalline Titania Particles. Chem. Mater. 1998, 10, 3217–3223. [Google Scholar] [CrossRef]
- Gupta, S.M.; Tripathi, M. A review of TiO2 nanoparticles. Chin. Sci. Bull. 2011, 56, 1639–1657. [Google Scholar] [CrossRef]
- Zhou, X.; Liu, N.; Schmuki, P. Photocatalysis with TiO2 Nanotubes: “Colorful” Reactivity and Designing Site-Specific Photocatalytic Centers into TiO2 Nanotubes. ACS Catal. 2017, 7, 3210–3235. [Google Scholar] [CrossRef]
- Meriam Suhaimy, S.; Lai, C.; Tajuddin, H.; Samsudin, E.; Johan, M. Impact of TiO2 Nanotubes’ Morphology on the Photocatalytic Degradation of Simazine Pollutant. Materials 2018, 11, 2066. [Google Scholar] [CrossRef]
- Li, D.; Xia, Y. Fabrication of Titania Nanofibers by Electrospinning. Nano Lett. 2003, 3, 555–560. [Google Scholar]
- Wang, X.; Li, Z.; Shi, J.; Yu, Y. One-Dimensional Titanium Dioxide Nanomaterials: Nanowires, Nanorods, and Nanobelts. Chem. Rev. 2014, 114, 9346–9384. [Google Scholar] [CrossRef] [PubMed]
- Wu, J.-M.; Zhang, T.-W.; Zeng, Y.-W.; Hayakawa, S.; Tsuru, K.; Osaka, A. Large-Scale Preparation of Ordered Titania Nanorods with Enhanced Photocatalytic Activity. Langmuir 2005, 21, 6995–7002. [Google Scholar] [CrossRef]
- Wu, N.; Wang, J.; Tafen, D.; Wang, H.; Zheng, J.G.; Lewis, J.P.; Liu, X.; Leonard, S.S.; Manivannan, A. Shape-enhanced photocatalytic activity of single-crystalline anatase TiO2 (101) nanobelts. J. Am. Chem. Soc. 2010, 132, 6679–6685. [Google Scholar] [CrossRef] [PubMed]
- Rutar, M.; Rozman, N.; Pregelj, M.; Bittencourt, C.; Cerc Korošec, R.; Sever Škapin, A.; Mrzel, A.; Škapin, S.D.; Umek, P. Transformation of hydrogen titanate nanoribbons to TiO2 nanoribbons and the influence of the transformation strategies on the photocatalytic performance. Beilstein J. Nanotechnol. 2015, 6, 831–844. [Google Scholar] [CrossRef] [PubMed]
- Stengl, V.; Bakardjieva, S.; Murafa, N.; Houskova, V. Hydrothermal synthesis of Titania powders and their photocatalytic properties. Ceram. Silik. 2008, 52, 278–290. [Google Scholar]
- Nam, C.T.; Yang, W.-D.; Duc, L.M. Solvothermal Synthesis of TiO2 Photocatalysts in Ketone Solvents with Low Boiling Points. J. Nanomater. 2013, 2013, 627385. [Google Scholar] [CrossRef]
- Su, C.; Hong, B.-Y.; Tseng, C.-M. Sol-gel preparation and photocatalysis of titanium dioxide. Catal. Today 2004, 96, 119–126. [Google Scholar] [CrossRef]
- Michalcik, Z.; Horakova, M.; Spatenka, P.; Klementova, S.; Zlamal, M.; Martin, N. Photocatalytic Activity of Nanostructured Titanium Dioxide Thin Films. Int. J. Photoenergy 2012, 2012, 689154. [Google Scholar] [CrossRef]
- Lee, K.; Mazare, A.; Schmuki, P. One-Dimensional Titanium Dioxide Nanomaterials: Nanotubes. Chem. Rev. 2014, 114, 9385–9454. [Google Scholar] [CrossRef] [Green Version]
- Yi, J.-H.; Bernard, C.; Variola, F.; Zalzal, S.F.; Wuest, J.D.; Rosei, F.; Nanci, A. Characterization of a bioactive nanotextured surface created by controlled chemical oxidation of titanium. Surf. Sci. 2006, 600, 4613–4621. [Google Scholar] [CrossRef]
- Jamesh, M.; Sankara Narayanan, T.S.N.; Chu, P.K. Thermal oxidation of titanium: Evaluation of corrosion resistance as a function of cooling rate. Mater. Chem. Phys. 2013, 138, 565–572. [Google Scholar] [CrossRef]
- Mills, A.; Lepre, A.; Elliott, N.; Bhopal, S.; Parkin, I.P.; O’Neill, S.A. Characterisation of the photocatalyst Pilkington ActivTM: A reference film photocatalyst? J. Photochem. Photobiol. A Chem. 2003, 160, 213–224. [Google Scholar] [CrossRef]
- Sheel, D.W.; McCurdy, R.J.; Hurst, S.J. Method of Depositing Tin Oxide and Titanium Oxide Coatings on Flat Glass and the Resulting Coated Glass. Patent Application WO 1998/06675, 1998. [Google Scholar]
- Zhang, W.F.; He, Y.L.; Zhang, M.S.; Yin, Z.; Chen, Q. Raman scattering study on anatase TiO2 nanocrystals. J. Phys. D Appl. Phys. 2000, 33, 912–916. [Google Scholar] [CrossRef]
- Mazza, T.; Barborini, E.; Piseri, P.; Milani, P.; Cattaneo, D.; Li Bassi, A.; Bottani, C.E.; Ducati, C. Raman spectroscopy characterization of TiO2 rutile nanocrystals. Phys. Rev. B Condens. Matter Mater. Phys. 2007, 75, 045416. [Google Scholar] [CrossRef]
- Saalinraj, S.; Ajithprasad, K.C. Effect of Calcination Temperature on Non-linear Absorption Co-efficient of Nano Sized Titanium Dioxide (TiO2) Synthesised by Sol-Gel Method. Mater. Today Proc. 2017, 4, 4372–4379. [Google Scholar] [CrossRef]
- Owens, D.K.; Wendt, R.C. Estimation of the surface free energy of polymers. J. Appl. Polym. Sci. 1969, 13, 1741–1747. [Google Scholar] [CrossRef]
- Regonini, D.; Jaroenworaluck, A.; Stevens, R.; Bowen, C.R. Effect of heat treatment on the properties and structure of TiO2 nanotubes: Phase composition and chemical composition. Surf. Interface Anal. 2010, 42, 139–144. [Google Scholar] [CrossRef]
- Ghosh, M.; Lohrasbi, M.; Chuang, S.S.C.; Jana, S.C. Mesoporous Titanium Dioxide Nanofibers with a Significantly Enhanced Photocatalytic Activity. ChemCatChem 2016, 8, 2525–2535. [Google Scholar] [CrossRef]
- Lee, C.; Shul, Y.-G.; Einaga, H. Structural Analysis of Mesoporous ZrO2 and TiO2 Nanofiber Mats Prepared by Electrospinning Methods; Engineering Sciences Reports; Kyushu University: Fukuoka, Japan, 2016; Volume 37, pp. 1–5. [Google Scholar]
- Radtke, A.; Piszczek, P.; Topolski, A.; Lewandowska, Ż.; Talik, E.; Andersen, I.H.; Nielsen, L.P.; Heikkilä, M.; Leskelä, M. The structure and the photocatalytic activity of Titania nanotube and nanofiber coatings. Appl. Surf. Sci. 2016, 368, 165–172. [Google Scholar] [CrossRef]
- Padiyan, D.P.; Raja, D.H. Synthesis of Various Generations Titania Nanotube Arrays by Electrochemical Anodization for H2 Production. Energy Procedia 2012, 22, 88–100. [Google Scholar] [CrossRef]
- Liu, Z.; Zhang, Q.; Qin, L.-C. Reduction in the electronic band gap of titanium oxide nanotubes. Solid State Commun. 2007, 141, 168–171. [Google Scholar] [CrossRef]
- Dette, C.; Pérez-Osorio, M.A.; Kley, C.S.; Punke, P.; Patrick, C.E.; Jacobson, P.; Kern, K. TiO2 Anatase with a Bandgap in the Visible Region. Nano Lett. 2014, 14, 6533–6538. [Google Scholar] [CrossRef] [PubMed]
- Scanlon, D.O.; Dunnill, C.W.; Buckeridge, J.; Shevlin, S.A.; Logsdail, A.J.; Woodley, S.M.; Sokol, A.A. Band alignment of rutile and anatase TiO2. Nat. Mater. 2013, 12, 798–801. [Google Scholar] [CrossRef] [PubMed]
- Hanaor, D.A.H.; Sorrell, C.C. Review of the anatase to rutile phase transformation. J. Mater. Sci. 2010, 46, 855–874. [Google Scholar] [CrossRef] [Green Version]
- Dariani, R.S.; Esmaeili, A.; Mortezaali, A.; Dehghanpour, S. Photocatalytic reaction and degradation of methylene blue on TiO2 nano-sized particles. Opt. Int. J. Light Electron. Opt. 2016, 127, 7143–7154. [Google Scholar] [CrossRef]
- Hou, C.; Hu, B.; Zhu, J. Photocatalytic Degradation of Methylene Blue over TiO2 Pretreated with Varying Concentrations of NaOH. Catalysts 2018, 8, 575. [Google Scholar] [CrossRef]
- Konstantinou, I.K.; Albanis, T.A. TiO2-assisted photocatalytic degradation of azo dyes in aqueous solution: Kinetic and mechanistic investigations. Appl. Catal. B Environ. 2004, 49, 1–14. [Google Scholar] [CrossRef]
- Houas, A. Photocatalytic degradation pathway of methylene blue in water. Appl. Catal. B Environ. 2001, 31, 145–157. [Google Scholar] [CrossRef]
- Herrmann, J.M. Water treatment by heterogeneous photocatalysis. In Environmental Catalysis; Catalytic Science Series; Jansen, F., van Santen, R.A., Eds.; Imperial College Press: London, UK, 1999; Volume 1, Chapter 9; pp. 171–194. [Google Scholar]
- Radtke, A.; Ehlert, M.; Jędrzejewski, T.; Sadowska, B.; Więckowska-Szakiel, M.; Holopainen, J.; Ritala, M.; Leskelä, M.; Bartmański, M.; Szkodo, M.; et al. Titania Nanotubes/Hydroxyapatite Nanocomposites Produced with the Use of the Atomic Layer Deposition Technique: Estimation of Bioactivity and Nanomechanical Properties. Nanomaterials 2019, 9, 123. [Google Scholar] [CrossRef] [PubMed]
- Radtke, A.; Grodzicka, M.; Ehlert, M.; Muzioł, T.; Szkodo, M.; Bartmański, M.; Piszczek, P. Studies on Silver Ions Releasing Processes and Mechanical Properties of Surface-Modified Titanium Alloy Implants. Int. J. Mol. Sci. 2018, 19, 3962. [Google Scholar] [CrossRef] [PubMed]
- Kumar, K.V.; Porkodi, K.; Rocha, F. Langmuir–Hinshelwood kinetics—A theoretical study. Catal. Commun. 2008, 9, 82–84. [Google Scholar] [CrossRef]
- Radtke, A.; Bal, M.; Jędrzejewski, T. Novel Titania Nanocoatings Produced by Anodic Oxidation with the Use of Cyclically Changing Potential: Their Photocatalytic Activity and Biocompatibility. Nanomaterials 2018, 8, 712. [Google Scholar] [CrossRef] [PubMed]
- Piszczek, P.; Lewandowska, Ż.; Radtke, A.; Jędrzejewski, T.; Kozak, W.; Sadowska, B.; Szubka, M.; Talik, E.; Fiori, F. Biocompatibility of Titania Nanotube Coatings Enriched with Silver Nanograins by Chemical Vapor Deposition. Nanomaterials 2017, 7, 274. [Google Scholar] [CrossRef] [PubMed]
- Radtke, A.; Topolski, A.; Jędrzejewski, T.; Kozak, W.; Sadowska, B.; Więckowska-Szakiel, M.; Szubka, M.; Talik, E.; Pleth Nielsen, L.; Piszczek, P. The Bioactivity and Photocatalytic Properties of Titania Nanotube Coatings Produced with the Use of the Low-Potential Anodization of Ti6Al4V Alloy Surface. Nanomaterials 2017, 7, 197. [Google Scholar] [CrossRef]
Figure 1.
Scanning electron microscope (SEM) images of (a) TNT5, (b) TNT10, (c) TNT15, (d) TNT20, (e) TNT30, (f)TNT40, (g)TNT50, (h)TNT60, (i) side view of TNT5. Numbers at titania nanotubes (TNT) are the potential in which the system was created.
Figure 1.
Scanning electron microscope (SEM) images of (a) TNT5, (b) TNT10, (c) TNT15, (d) TNT20, (e) TNT30, (f)TNT40, (g)TNT50, (h)TNT60, (i) side view of TNT5. Numbers at titania nanotubes (TNT) are the potential in which the system was created.

Figure 2.
Infrared diffuse reflectance Fourier transform spectroscopy (IR DRIFT) and Raman spectra of TNTs.
Figure 2.
Infrared diffuse reflectance Fourier transform spectroscopy (IR DRIFT) and Raman spectra of TNTs.

Figure 3.
SEM images of (a) TNF80, (b) TNF100, (c) TNF120, (d) TNF140, and (e) side view of TNF120. Numbers at TNF are the temperature [°C], in which the system was created.
Figure 3.
SEM images of (a) TNF80, (b) TNF100, (c) TNF120, (d) TNF140, and (e) side view of TNF120. Numbers at TNF are the temperature [°C], in which the system was created.

Figure 4.
Raman spectra of titania nanofibers (TNFs).

Figure 5.
SEM images of (a1), (a2)—TNW475, (b1), (b2)—TNW500, (c1), (c2)—TNW550, and (d1), (d2)—TNW600. TNW: titania nanowires
Figure 5.
SEM images of (a1), (a2)—TNW475, (b1), (b2)—TNW500, (c1), (c2)—TNW550, and (d1), (d2)—TNW600. TNW: titania nanowires

Figure 6.
Raman spectra of TNWs (a) and (grazing-angle X-ray diffraction) GAXRD spectra of TNW500 and TNW550 (b).
Figure 6.
Raman spectra of TNWs (a) and (grazing-angle X-ray diffraction) GAXRD spectra of TNW500 and TNW550 (b).

Figure 7.
Diffuse reflectance UV-Vis spectra of TNT (a), TNF (b), and TNW (c)—the left side; plots of (αhν)2 vs. hν with the explanation the procedure of band gap value estimation—the right side.
Figure 7.
Diffuse reflectance UV-Vis spectra of TNT (a), TNF (b), and TNW (c)—the left side; plots of (αhν)2 vs. hν with the explanation the procedure of band gap value estimation—the right side.

Figure 8.
CO2 concentration-time data for acetone photodegradation for titania nanotubes (TNT), nanofibers (TNF), and nanowires (TNW).
Figure 8.
CO2 concentration-time data for acetone photodegradation for titania nanotubes (TNT), nanofibers (TNF), and nanowires (TNW).
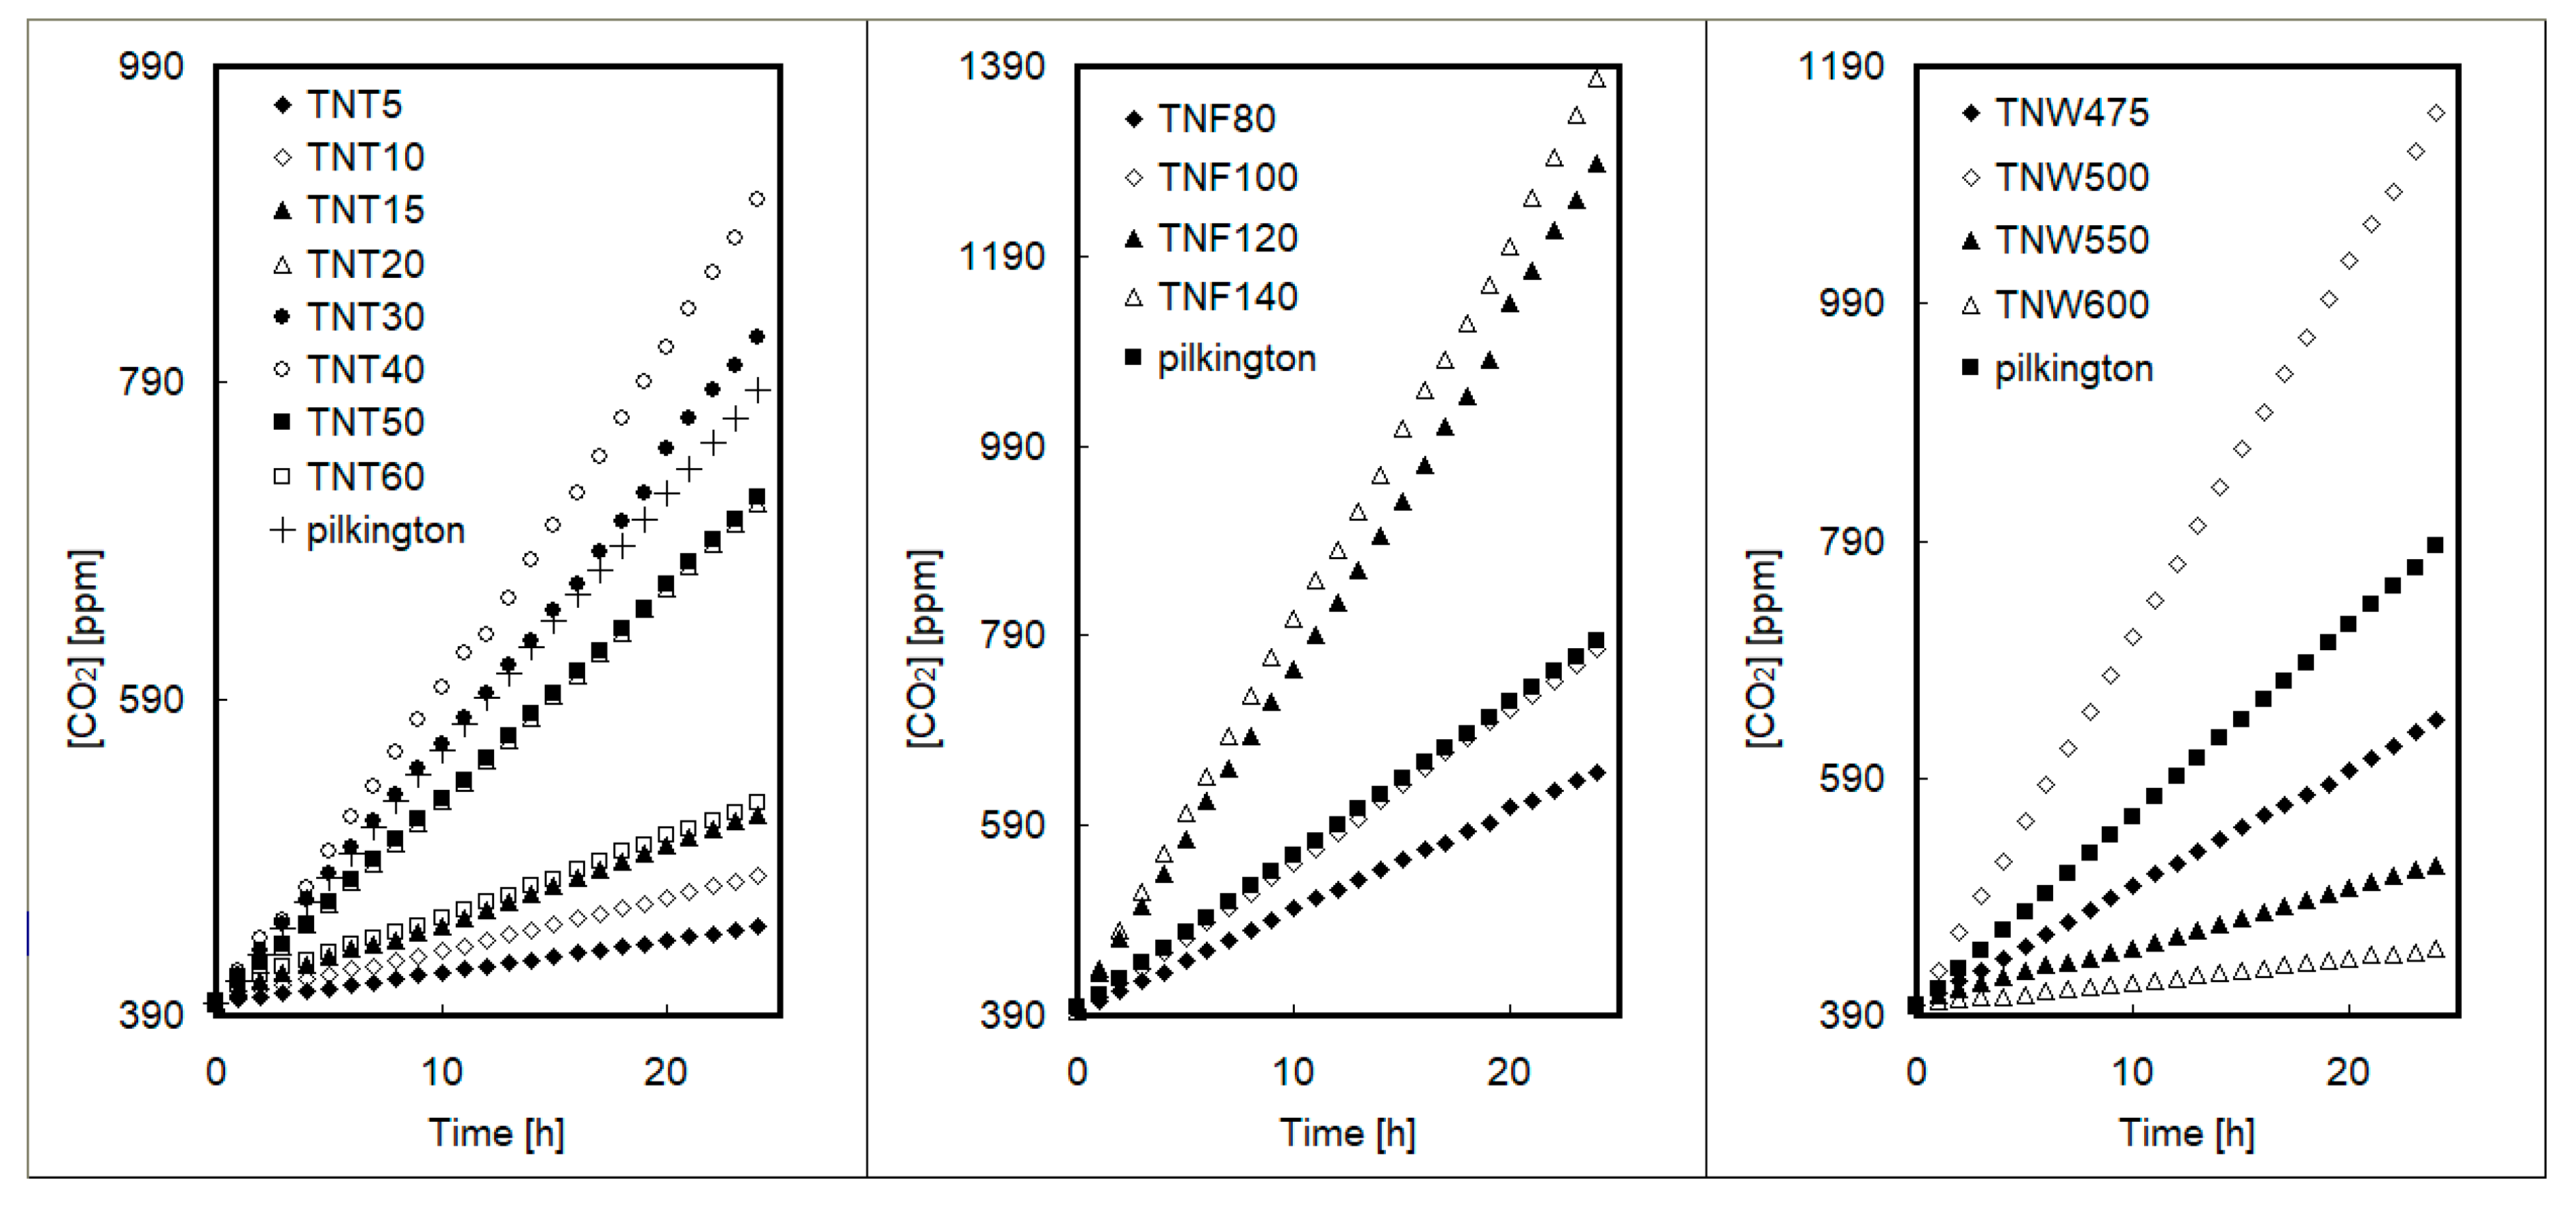
Figure 9.
Absorbance-time data for methylene blue photodegradation for titania nanotubes (TNT), nanofibers (TNF), and nanowires (TNW).
Figure 9.
Absorbance-time data for methylene blue photodegradation for titania nanotubes (TNT), nanofibers (TNF), and nanowires (TNW).

Figure 10.
The observable rate constants for methylene blue and acetone degradation under UV light irradiation in the presence of titania nanotubes.
Figure 10.
The observable rate constants for methylene blue and acetone degradation under UV light irradiation in the presence of titania nanotubes.
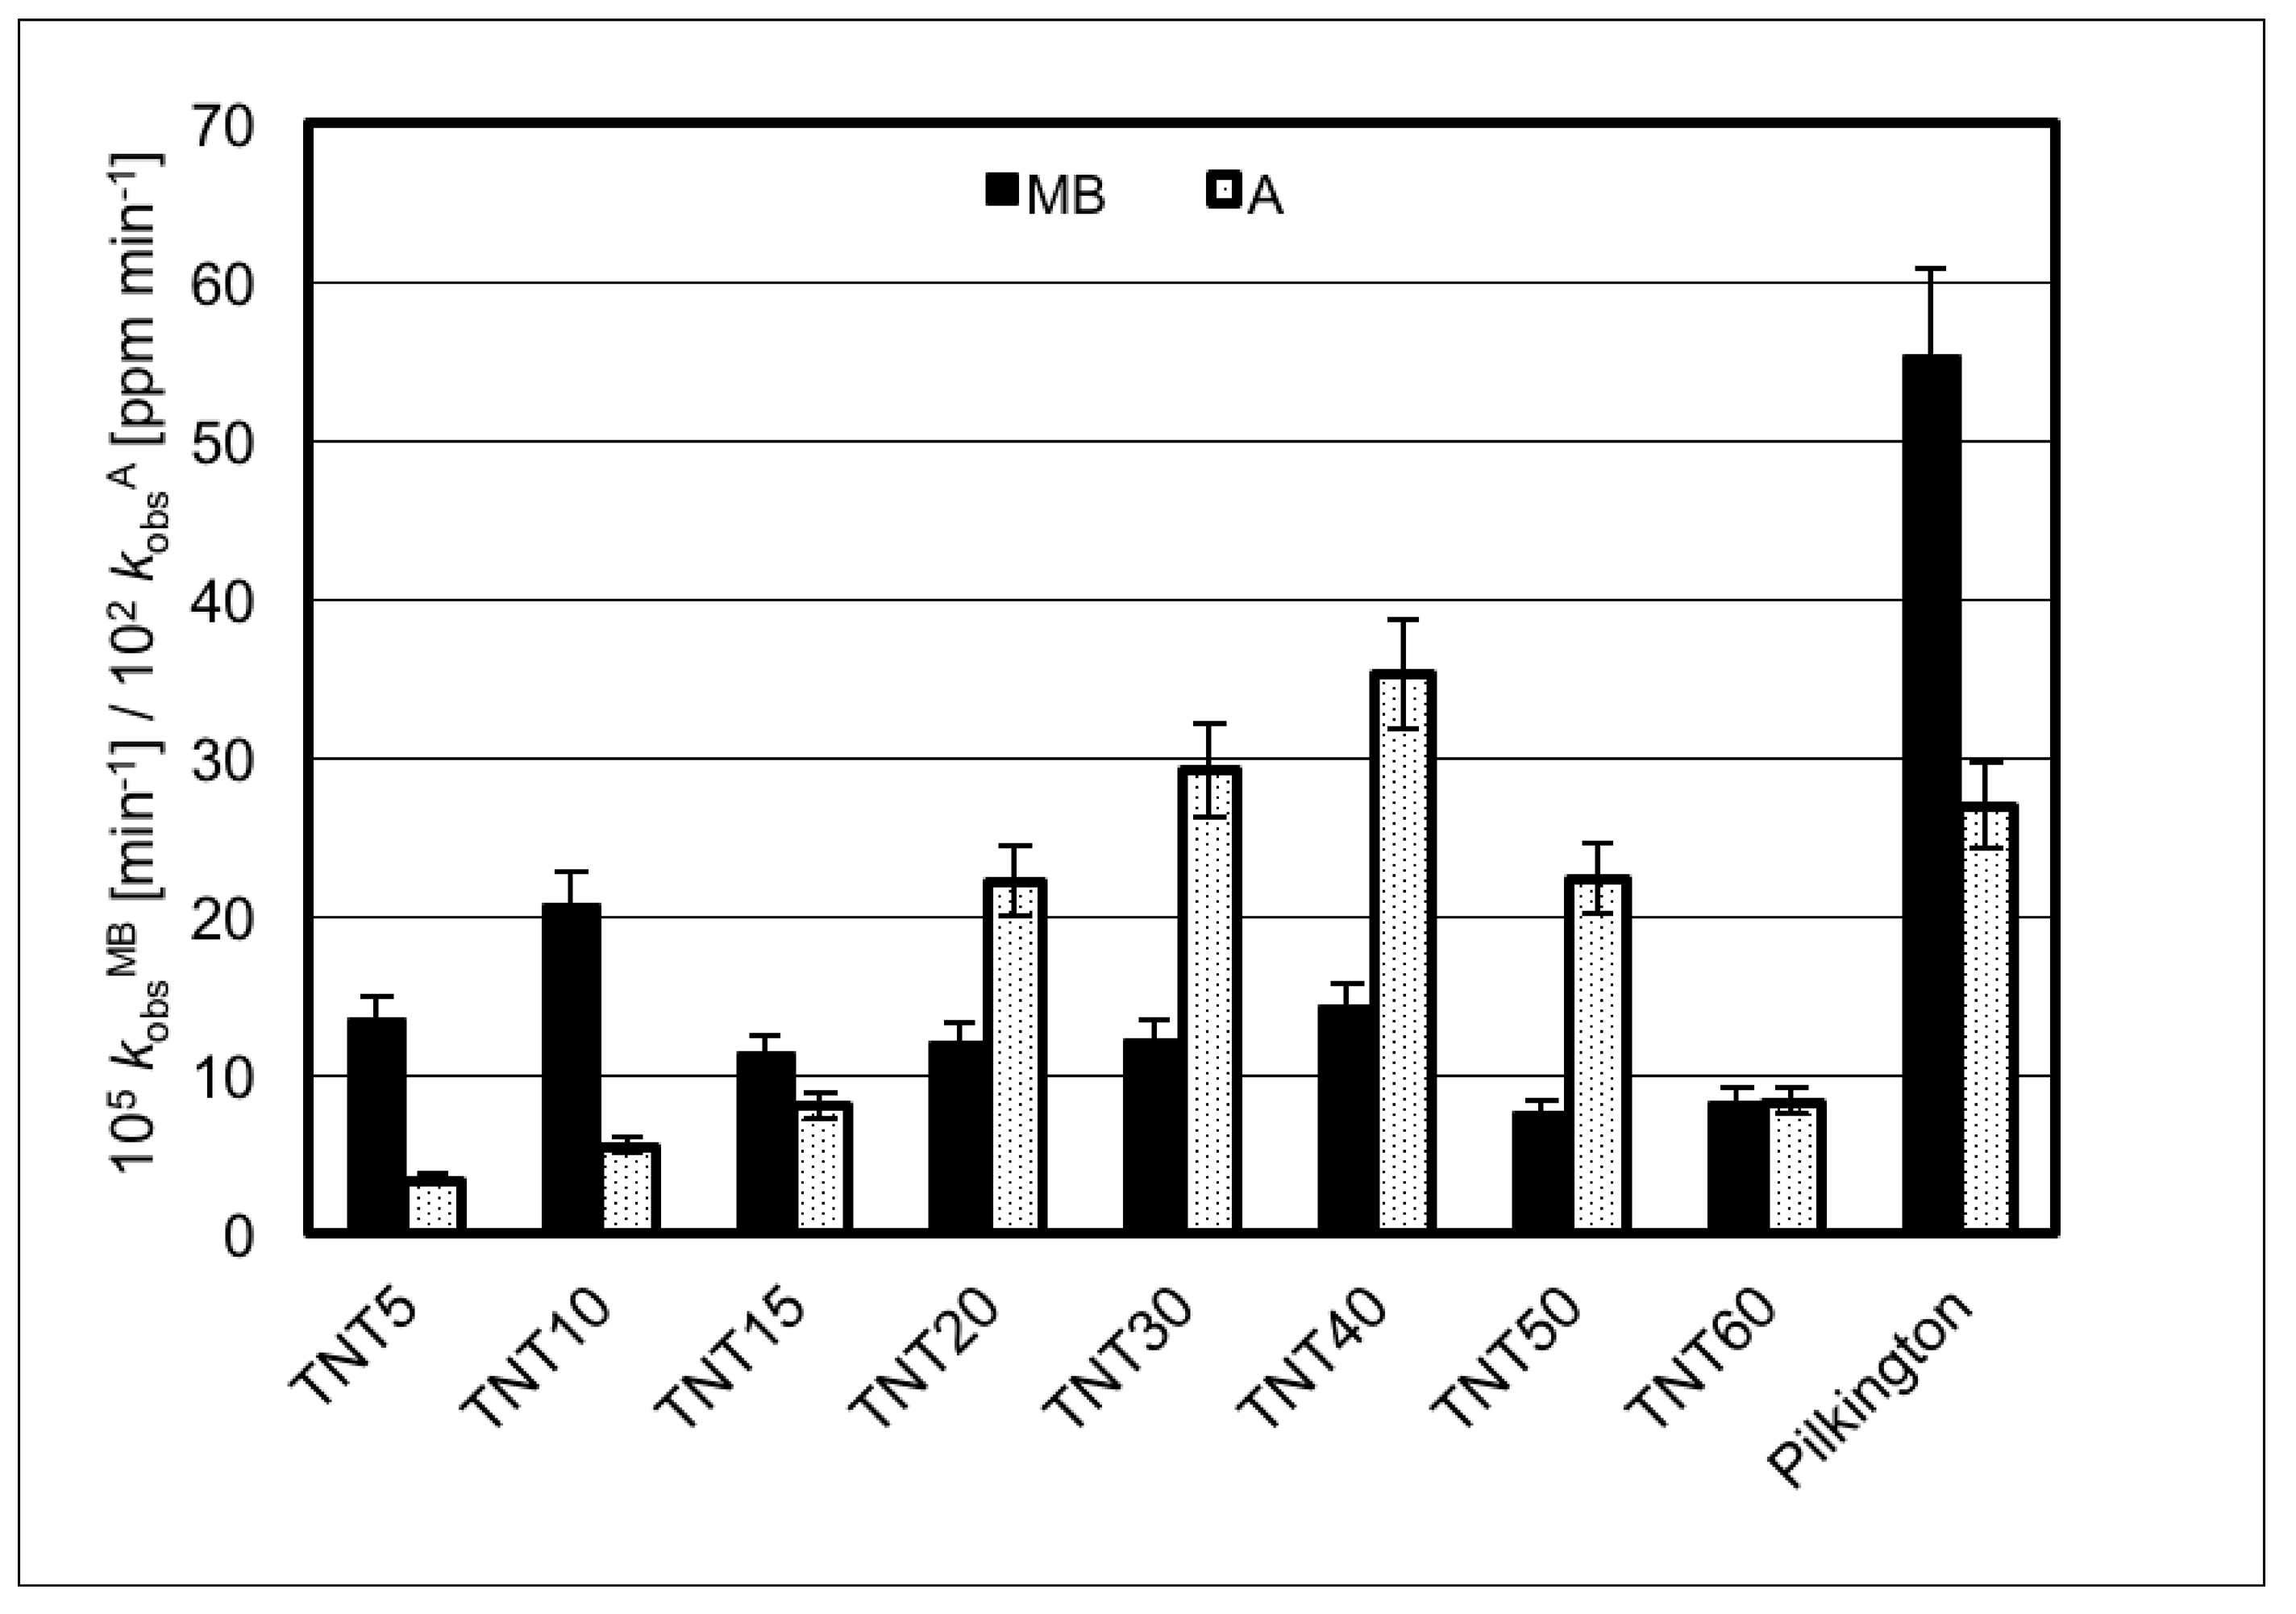
Figure 11.
The observable rate constants for methylene blue and acetone degradation under UV light irradiation in the presence of titania nanofibers.
Figure 11.
The observable rate constants for methylene blue and acetone degradation under UV light irradiation in the presence of titania nanofibers.

Figure 12.
The observable rate constants for methylene blue and acetone degradation under UV light irradiation in the presence of titania nanowires.
Figure 12.
The observable rate constants for methylene blue and acetone degradation under UV light irradiation in the presence of titania nanowires.

Figure 13.
SEM images of TNT40, TNT50, TNT60, which present in detail the inner part of nanotubes.


Table 1.
Results of the contact angle and surface free energy (SFE) measurements; contact angles were measured three times using distilled water and diiodomethane, and the SFE was determined using the Owens–Wendt method.
Table 1.
Results of the contact angle and surface free energy (SFE) measurements; contact angles were measured three times using distilled water and diiodomethane, and the SFE was determined using the Owens–Wendt method.
| Sample | Average Contact Angle [°] ± Standard Deviation | SFE [mJ/m2] | |
|---|---|---|---|
| Measuring Liquid | |||
| Water | Diiodomethane | ||
| Ti6Al4V | 108.3 ± 0.1 | 37 ± 0.2 | 45.4 ± 0.1 |
| Ti6Al4V/TNT5 | 64.5 ± 0.8 | 48.5 ± 2.3 | 42.3 ± 2.4 |
| Ti6Al4V/TNT10 | 52.2 ± 1.2 | 40.8 ± 1.3 | 51.09 ± 1.3 |
| Ti6Al4V/TNT15 | 43.3 ± 1.8 | 31.8 ± 0.9 | 57.98 ± 1.3 |
| Ti6Al4V/TNT20 | 31.2 ± 0.8 | 27.8 ± 1.3 | 65.01 ± 1.3 |
| Ti6Al4V/TNT30 | 21.9 ± 1.3 | <10 | >70.63 ± 1.3 |
| Ti6Al4V/TNT40 | 19.3 ± 1.0 | <10 | >71.52 ± 0.1 |
| Ti6Al4V/TNT50 | 55.6 ± 1.2 | 40.9 ± 0.6 | 49.14 ± 1.2 |
| Ti6Al4V/TNT60 | 75.10 ± 1.1 | 51.8 ± 1.5 | 36.45 ± 1.5 |
| Ti6Al4V/TNF80 | 80.9 ± 0.8 | 46.9 ± 1.2 | 36.87 ± 1.2 |
| Ti6Al4V/TNF100 | 75.7 ± 1.1 | 49.8 ± 1.3 | 37.02 ± 1.3 |
| Ti6Al4V/TNF120 | 60.9 ± 1.3 | 40.2 ± 1.0 | 46.55 ± 1.1 |
| Ti6Al4V/TNF140 | 52.8 ± 1.0 | 57.9 ± 0.7 | 47.55 ± 1.0 |
| Ti6Al4V/TNW475 | 118.7 ± 0.8 | 49.6 ± 0.2 | 42.36 ± 0.8 |
| Ti6Al4V/TNW500 | 123.3 ± 0.3 | 51.9 ± 0.4 | 42.88 ± 0.4 |
| Ti6Al4V/TNW550 | 126.8 ± 0.5 | 60.3 ± 0.1 | 37.25 ± 0.5 |
| Ti6Al4V/TNW600 | 129.8 ± 0.2 | 68.3 ± 0.1 | 31.50 ± 0.2 |
Table 2.
Specific surface area values [m2/g] of titania nanotubes, nanofibers, and nanowires.
| TNT | SBET [m2/g] | TNF | SBET [m2/g] | TNW | SBET [m2/g] |
|---|---|---|---|---|---|
| TNT5 | 18.0 ± 0.2 | TNF80 | 22.5 ± 0.3 | TNW475 | 45.2 ± 0.2 |
| TNT10 | 16.9 ± 0.2 | TNF100 | 21.3 ± 0.2 | TNW500 | 22.1 ± 0.3 |
| TNT15 | 13.4 ± 0.1 | TNF120 | 23.7 ± 0.1 | TNW550 | 15.0 ± 0.1 |
| TNT20 | 10.4 ± 0.2 | TNF140 | 31.2 ± 0.2 | TNW600 | 9.7 ± 0.1 |
| TNT30 | 9.3 ± 0.1 | - | - | - | - |
| TNT40 | 8.5 ± 0.2 | - | - | - | - |
| TNT50 | 11.4 ± 0.3 | - | - | - | - |
| TNT60 | 12.8 ± 0.2 | - | - | - | - |
Table 3.
Band gap values.
| TNT Samples | Eg [eV] | TNF Samples | Eg [eV] | TNW Samples | Eg [eV] |
|---|---|---|---|---|---|
| TNT5 | 3.64 | TNF80 | 3.55 | TNW475 | 3.24 |
| TNT10 | 3.59 | TNF100 | 3.43 | TNW500 | 3.11 |
| TNT15 | 3.49 | TNF120 | 3.32 | TNW550 | 3.01 |
| TNT20 | 3.42 | TNF140 | 3.22 | TNW600 | 2.96 |
| TNT30 | 3.36 | - | - | - | - |
| TNT40 | 3.40 | - | - | - | - |
| TNT50 | 3.44 | - | - | - | - |
| TNT60 | 3.56 | - | - | - | - |
© 2019 by the author. Licensee MDPI, Basel, Switzerland. This article is an open access article distributed under the terms and conditions of the Creative Commons Attribution (CC BY) license (http://creativecommons.org/licenses/by/4.0/).
Share and Cite
MDPI and ACS Style
Radtke, A. Photocatalytic Activity of Nanostructured Titania Films Obtained by Electrochemical, Chemical, and Thermal Oxidation of Ti6Al4V Alloy—Comparative Analysis. Catalysts 2019, 9, 279. https://doi.org/10.3390/catal9030279
AMA Style
Radtke A. Photocatalytic Activity of Nanostructured Titania Films Obtained by Electrochemical, Chemical, and Thermal Oxidation of Ti6Al4V Alloy—Comparative Analysis. Catalysts. 2019; 9(3):279. https://doi.org/10.3390/catal9030279
Chicago/Turabian StyleRadtke, Aleksandra. 2019. "Photocatalytic Activity of Nanostructured Titania Films Obtained by Electrochemical, Chemical, and Thermal Oxidation of Ti6Al4V Alloy—Comparative Analysis" Catalysts 9, no. 3: 279. https://doi.org/10.3390/catal9030279
Note that from the first issue of 2016, this journal uses article numbers instead of page numbers. See further details here.