Article

Differences in the Catalytic Behavior of Au-Metalized TiO2 Systems During Phenol Photo-Degradation and CO Oxidation

1
Instituto de Ciencia de Materiales de Sevilla, Centro Mixto Universidad de Sevilla-CSIC, Avenida Américo Vespucio 49, 41092 Seville, Spain
2
Grupo de Catálisis, Escuela de Ciencias Químicas, Universidad Pedagógica y Tecnológica de Colombia UPTC, Avenida Central del Norte 39-115, Tunja, Boyacá, Colombia
3
Departamento de Química, Universidad del Tolima, Barrio Santa Elena, Ibagué 730006299, Colombia
*
Author to whom correspondence should be addressed.
Catalysts 2019, 9(4), 331; https://doi.org/10.3390/catal9040331
Submission received: 7 March 2019 / Revised: 25 March 2019 / Accepted: 28 March 2019 / Published: 3 April 2019
(This article belongs to the Special Issue Catalysis by Precious Metals, Past and Future)

Abstract

:
For this present work, a series of Au-metallized TiO2 catalysts were synthesized and characterized in order to compare their performance in two different catalytic environments: the phenol degradation that occurs during the liquid phase and in the CO oxidation phase, which proceeds the gas phase. The obtained materials were analyzed by different techniques such as XRF, SBET, XRD, TEM, XPS, and UV-Vis DRS. Although the metallization was not totally efficient in all cases, the amount of noble metal loaded depended strongly on the deposition time. Furthermore, the differences in the amount of loaded gold were important factors influencing the physicochemical properties of the catalysts, and consequently, their performances in the studied reactors. The addition of gold represented a considerable increase in the phenol conversion when compared with that of the TiO2, despite the small amount of noble metal loaded. However, this was not the case in the CO oxidation reaction. Beyond the differences in the phase where the reaction occurred, the loss of catalytic activity during the CO oxidation reaction was directly related to the sintering of the gold nanoparticles.

1. Introduction

During the last decade, different chemical reactions which have focused on environmental pollution remediation have been extensively studied, with the aim of removing pollutants from the atmosphere and water. Regarding gaseous pollutants whose elimination has been studied to a greater extent, CO is one of the most relevant. In fact, in 2002 Haruta and coworkers [1] suggested that CO oxidation could be the most extensively studied reaction in the history of heterogeneous catalysis, and this fact has been confirmed in recent years due to the fundamental role of such a reaction in the cleaning of the air and the control of emissions produced by the automotive sector [2,3,4,5].
Up until now, several systems have been analyzed and different approaches for the design of feasible catalysts for CO abatement have been proposed [6]. Particularly, the results of the noble metal-based catalysts have been attractive due to their tolerance to the presence of water [7], and although high temperatures are often required for the catalysts to achieve optimal performance, the CO oxidation induced by noble metal nanoparticles is a widely studied reaction, taking into account that it is a sensitive surface structure reaction. Therefore, the main lines of research on this topic have been focused on the development of optimized catalysts for obtaining the maximum CO conversion using low temperatures and short periods of time [1,2,3]. Additionally, the use of different noble metals [8], such as Au and Pt, which have demonstrated high activity and selectivity in oxidation reactions. Nevertheless, their catalytic performance, especially in the case of gold, largely depends on the particle size, and this is a parameter that should be controlled during synthesis by selecting the most suitable noble metal precursor, procedures of deposition, and temperatures of calcination in order to avoid sintering and loss of the electronic properties of the metal nanoparticles [9,10,11].
Another aspect of obtaining active catalysts for oxidation reactions based on noble metals is the selection of a suitable support, and some ceramic materials such as Al2O3 and SiO2 have been widely used. However, TiO2, which has attracted increasing attention in the electronics industry due to its high dielectric and semi-conducting properties, is a very interesting system as a support for catalytic reactions due to its electronic properties [12]. In fact, there is evidence that TiO2, as a catalyst support, enforces an electric interaction between the d electrons of Ti3+ cations with those of noble metals supported over its surface, and this results, for instance, in a decrease in the adsorption energy of CO intermediates [13,14,15].
The TiO2 has also been widely studied in photo-catalytic oxidation processes, and the addition of noble metals over this oxide has demonstrated an enhancement in its photo-catalytic performance. This is thanks to the decrease in the recombination rate of photo-generated charges in the systems since the noble metals act as electron collectors. Within the different photo-degradation processes [10], phenol oxidation is more widely studied since this pollutant may contaminate water and generate other compounds even more contaminant than the bare phenol. Therefore, its mineralization is the main goal. In fact, in a previous study, we examined the photo-catalytic phenol oxidation in Au/TiO2 catalysts prepared from sulphated TiO2 by means of a photo-deposition of gold. We observed that the conditions during the preparation of the materials (light intensity and photo-deposition time) were determinant for controlling the properties of the gold deposits over the surface of the TiO2.
It is clear that the differences during the preparation of the gold photo-catalysts resulted in alterations of their surface and structural properties that control their catalytic performance in an aqueous medium. However, the interaction between gold and TiO2 has been demonstrated to be also closely related to the presence of structural defects such as the oxygen vacancies that also modify the electronic properties of Au/TiO2 and which have been studied in CO abatement reactions [2,16]. Subsequently, the following question arises: could these properties generated in photo-catalysts be applied in a different catalytic environment such as a gas phase oxidation process where there is no light irradiation? Therefore, the present work proposes the exploration of a series of different gold catalysts prepared by the photo-deposition method over TiO2 in both the phenol photo-oxidation process and the CO oxidation reaction. Special attention is paid to the study of the electronic properties of the prepared materials and their effect on the catalytic performance in the cited reactions.

2. Results and Discussion

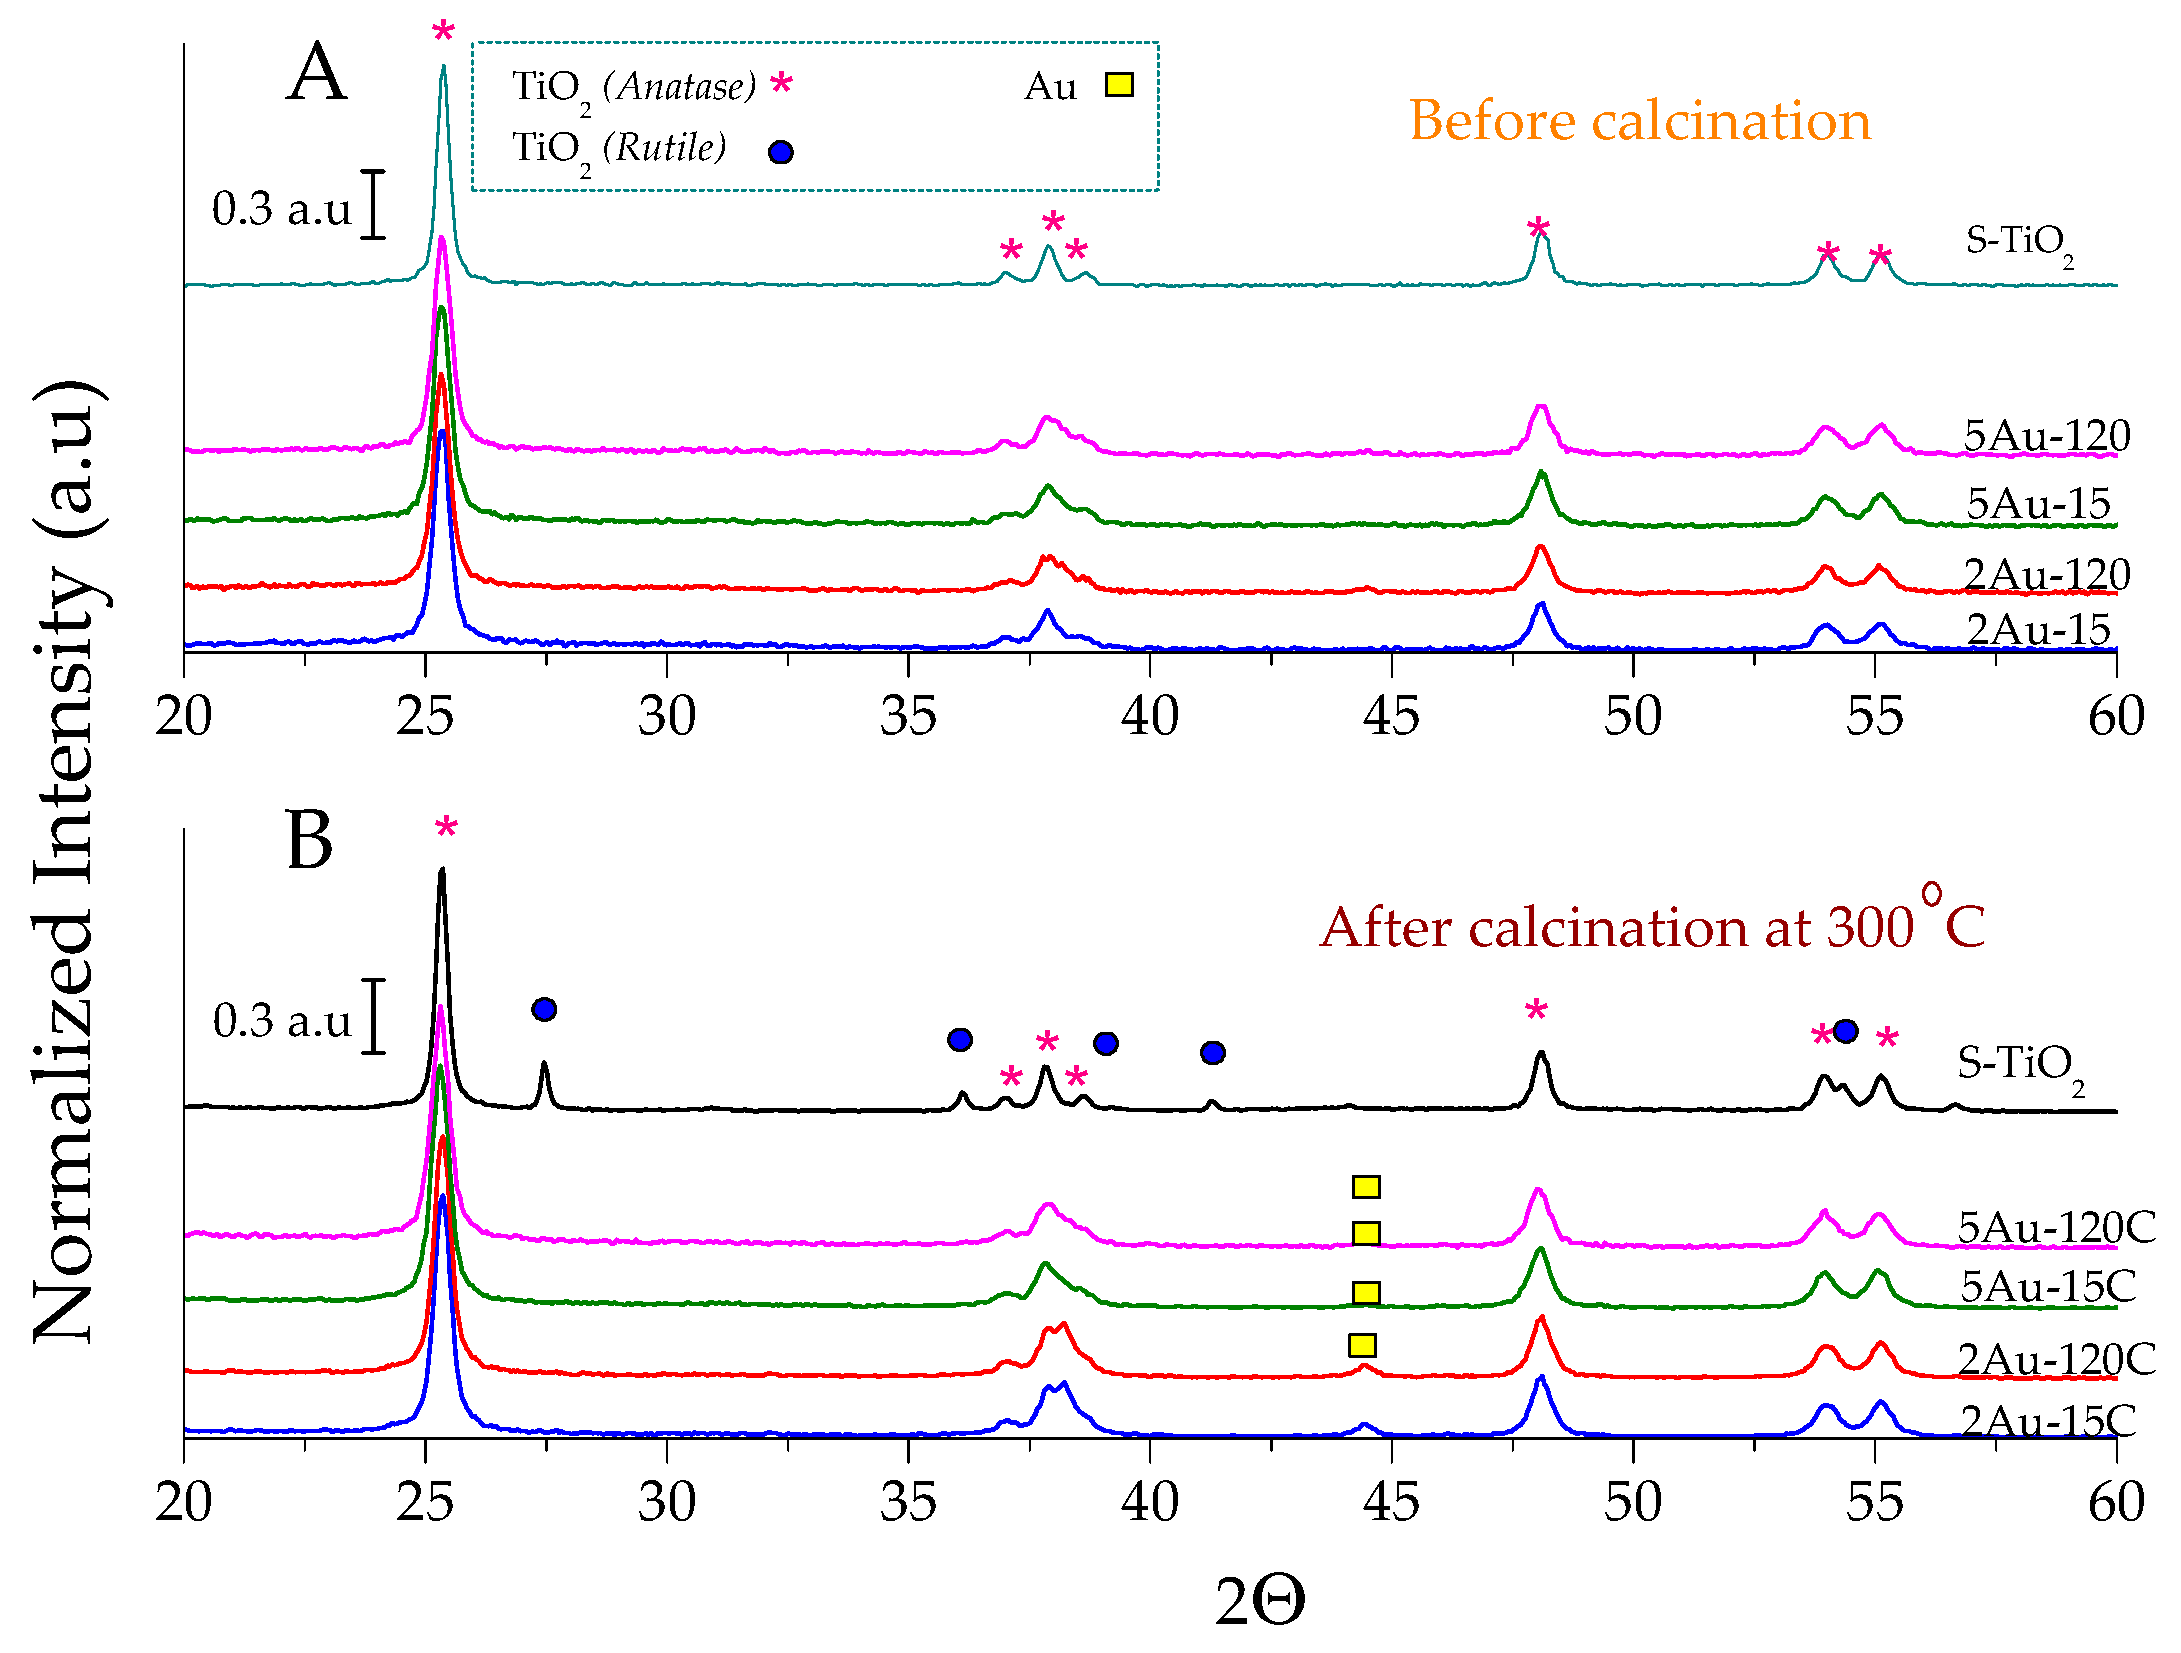
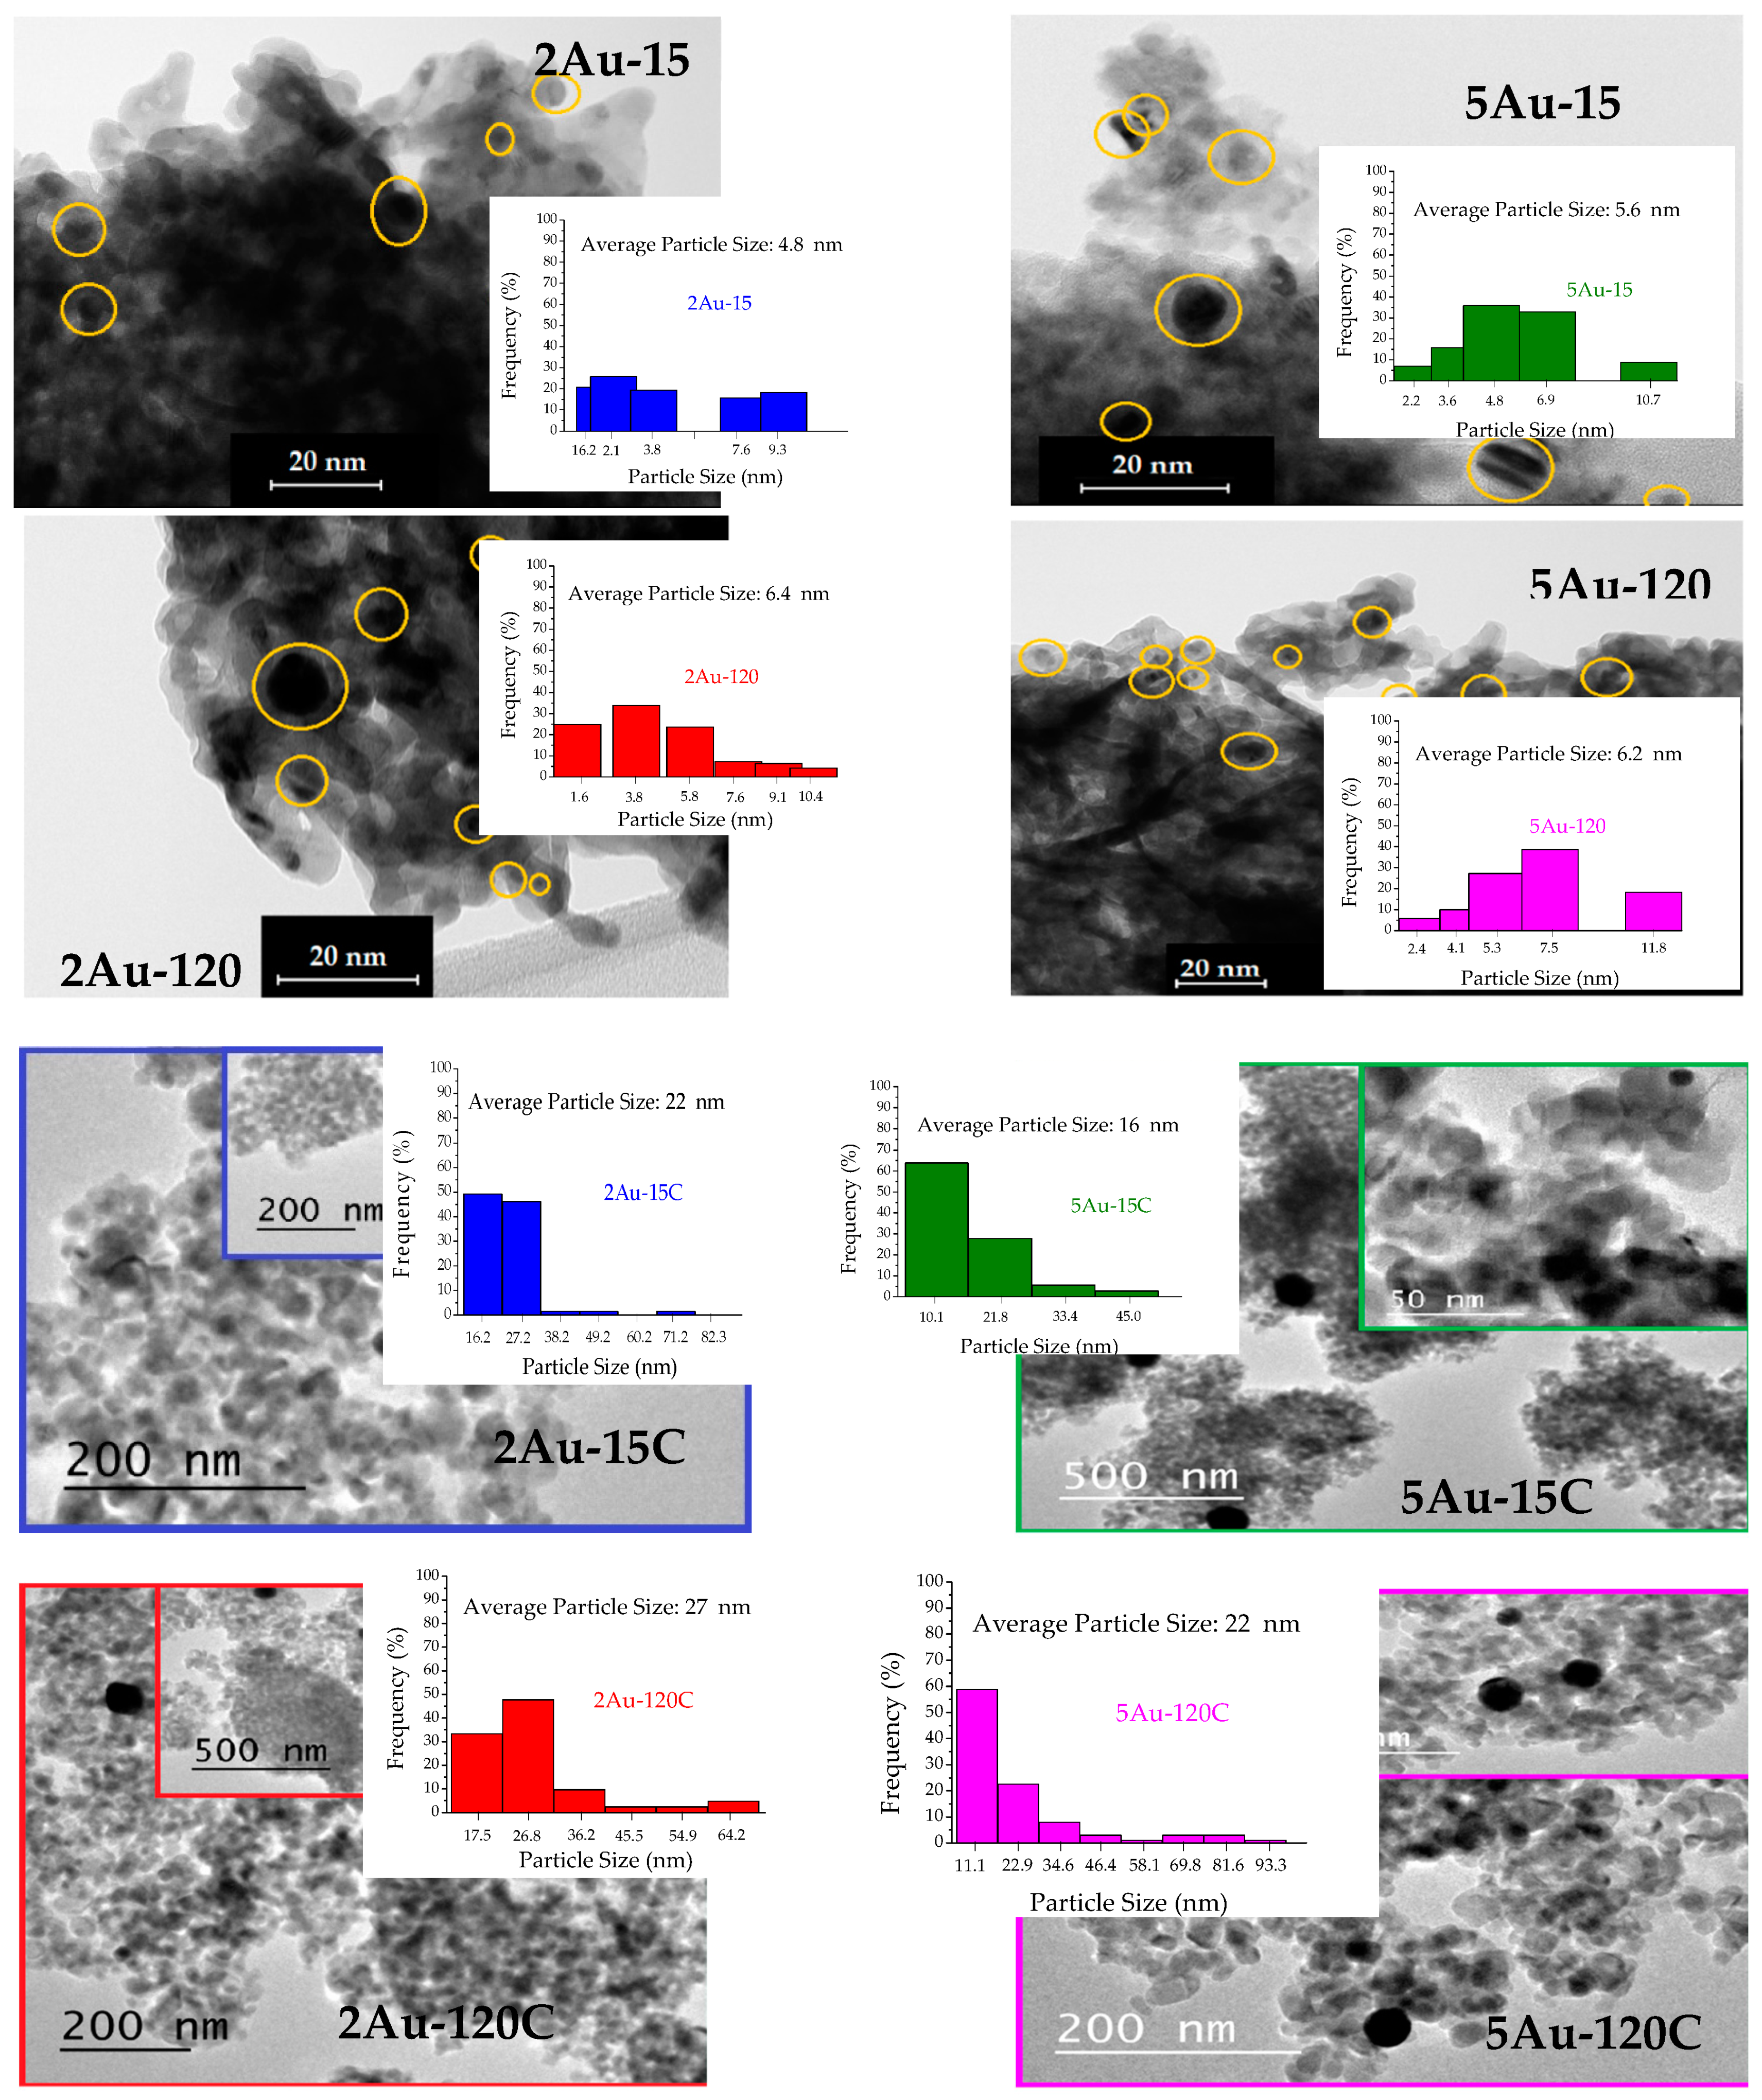
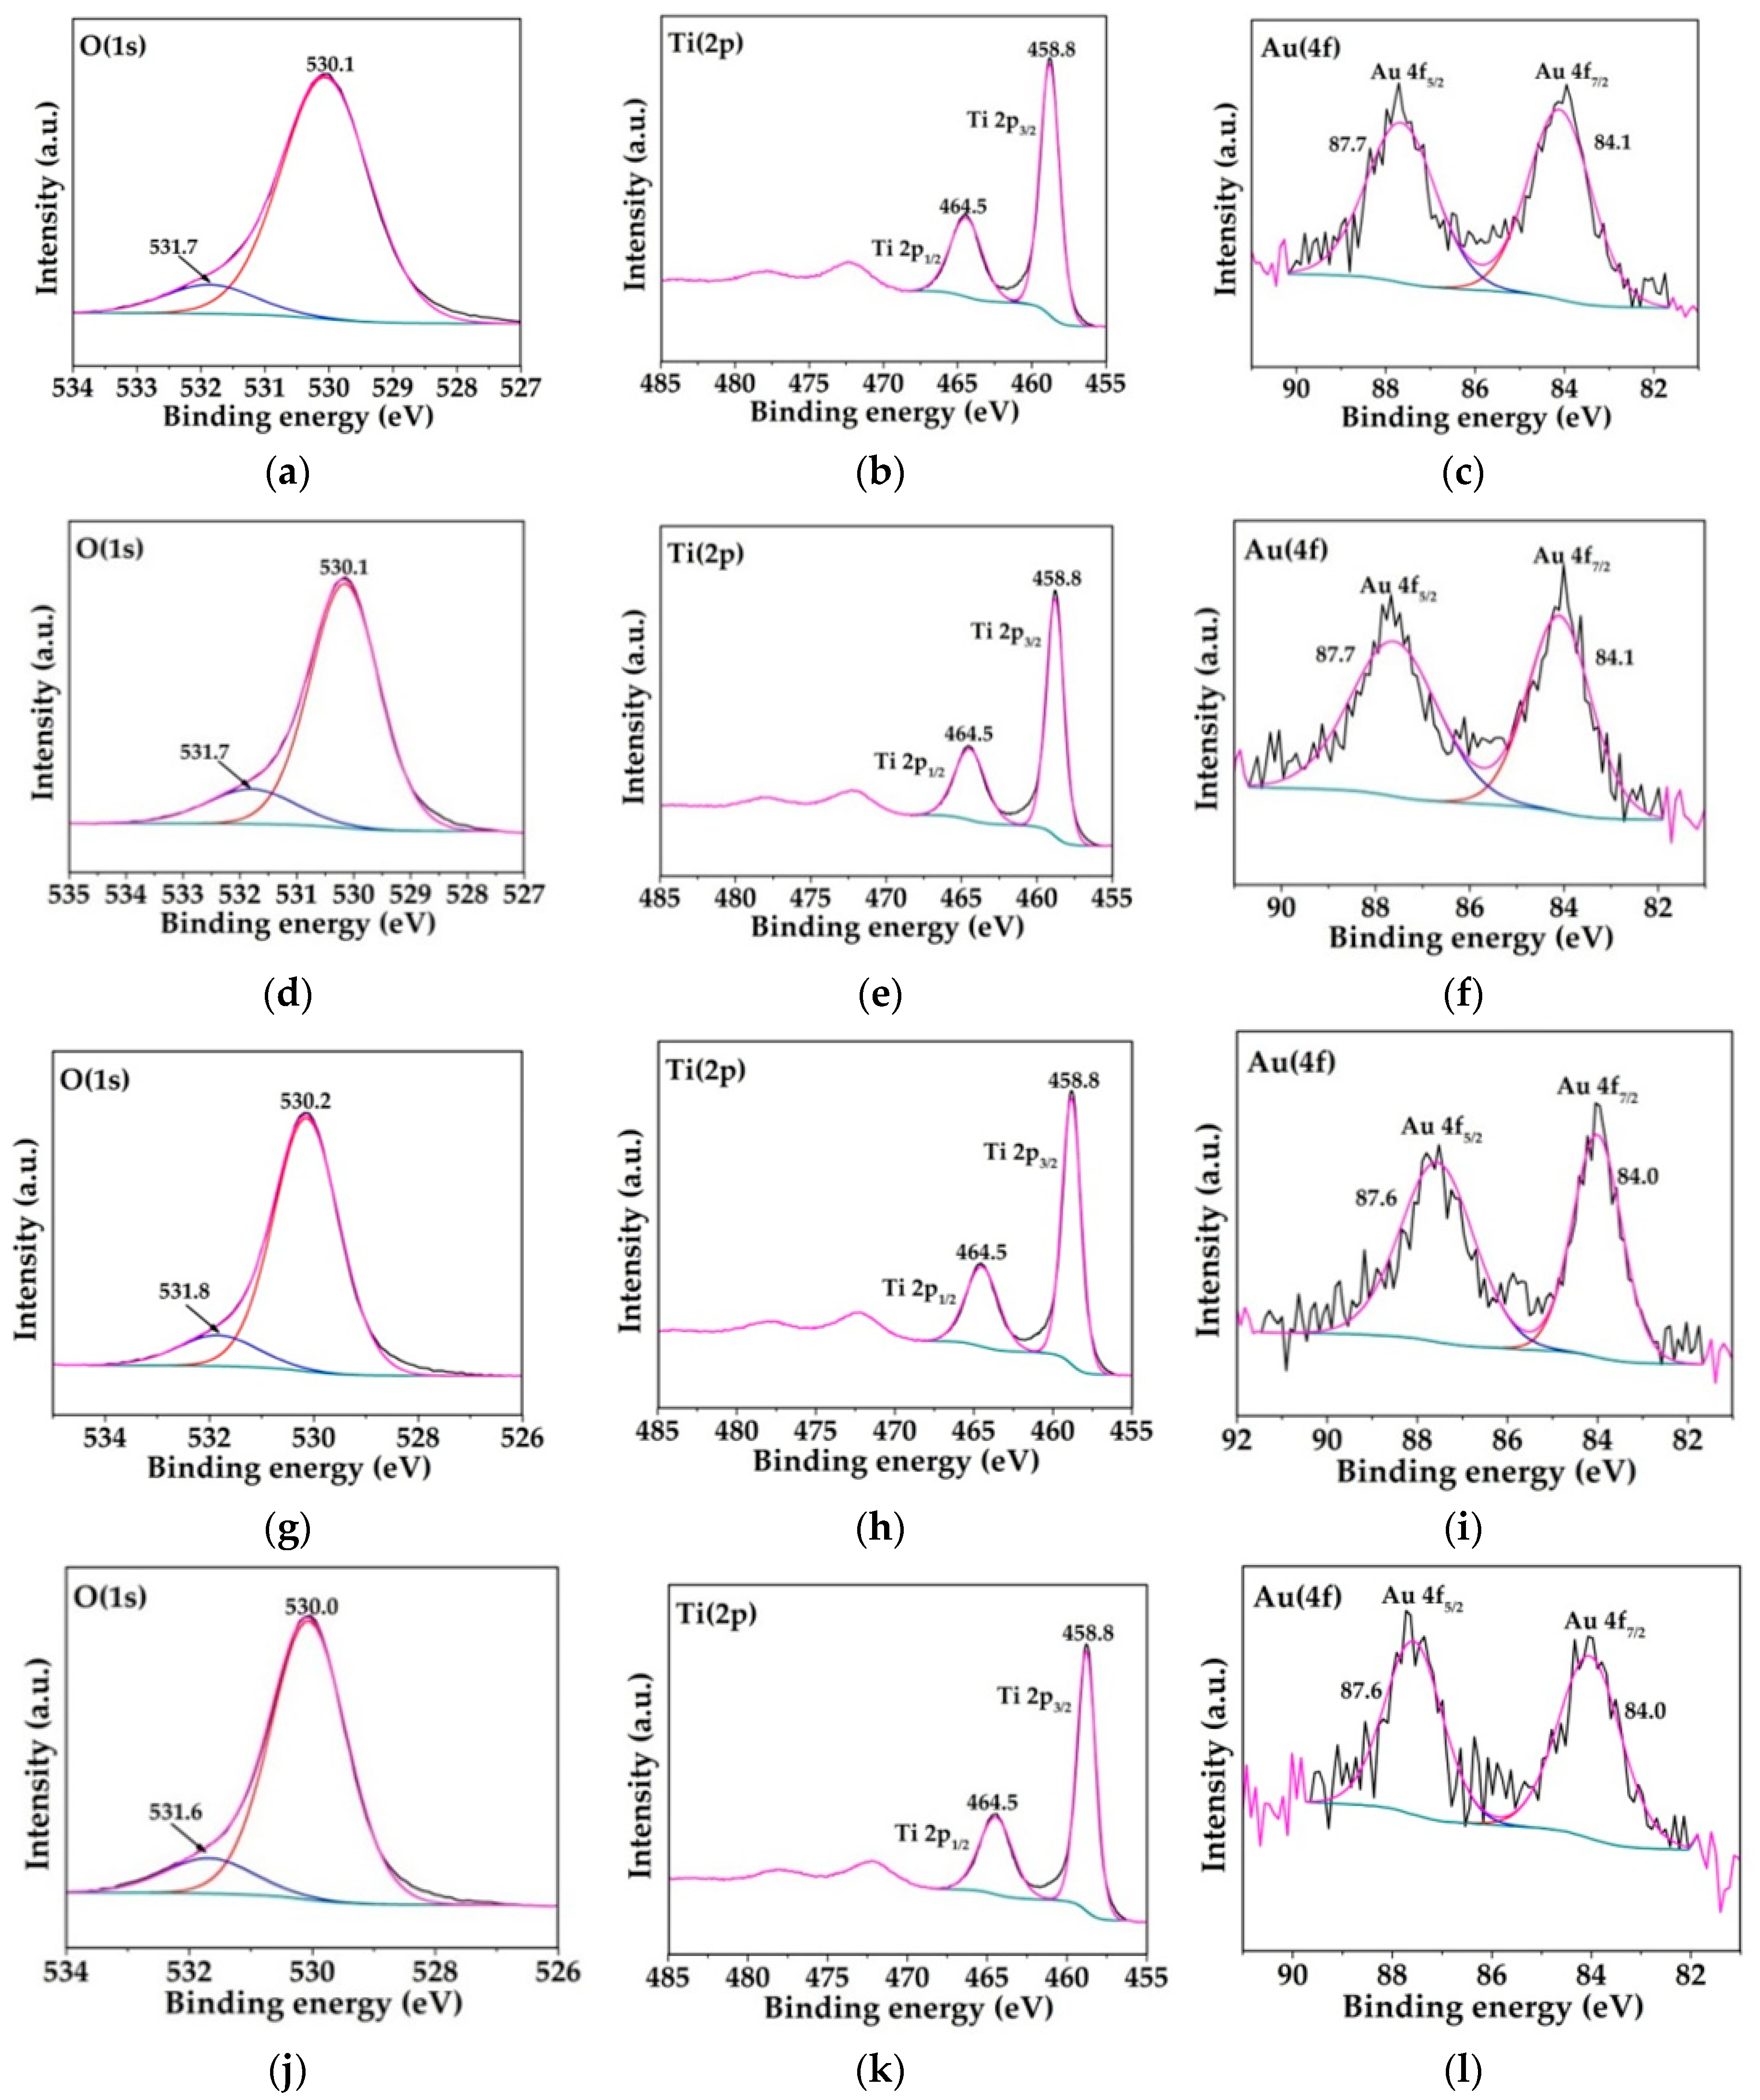
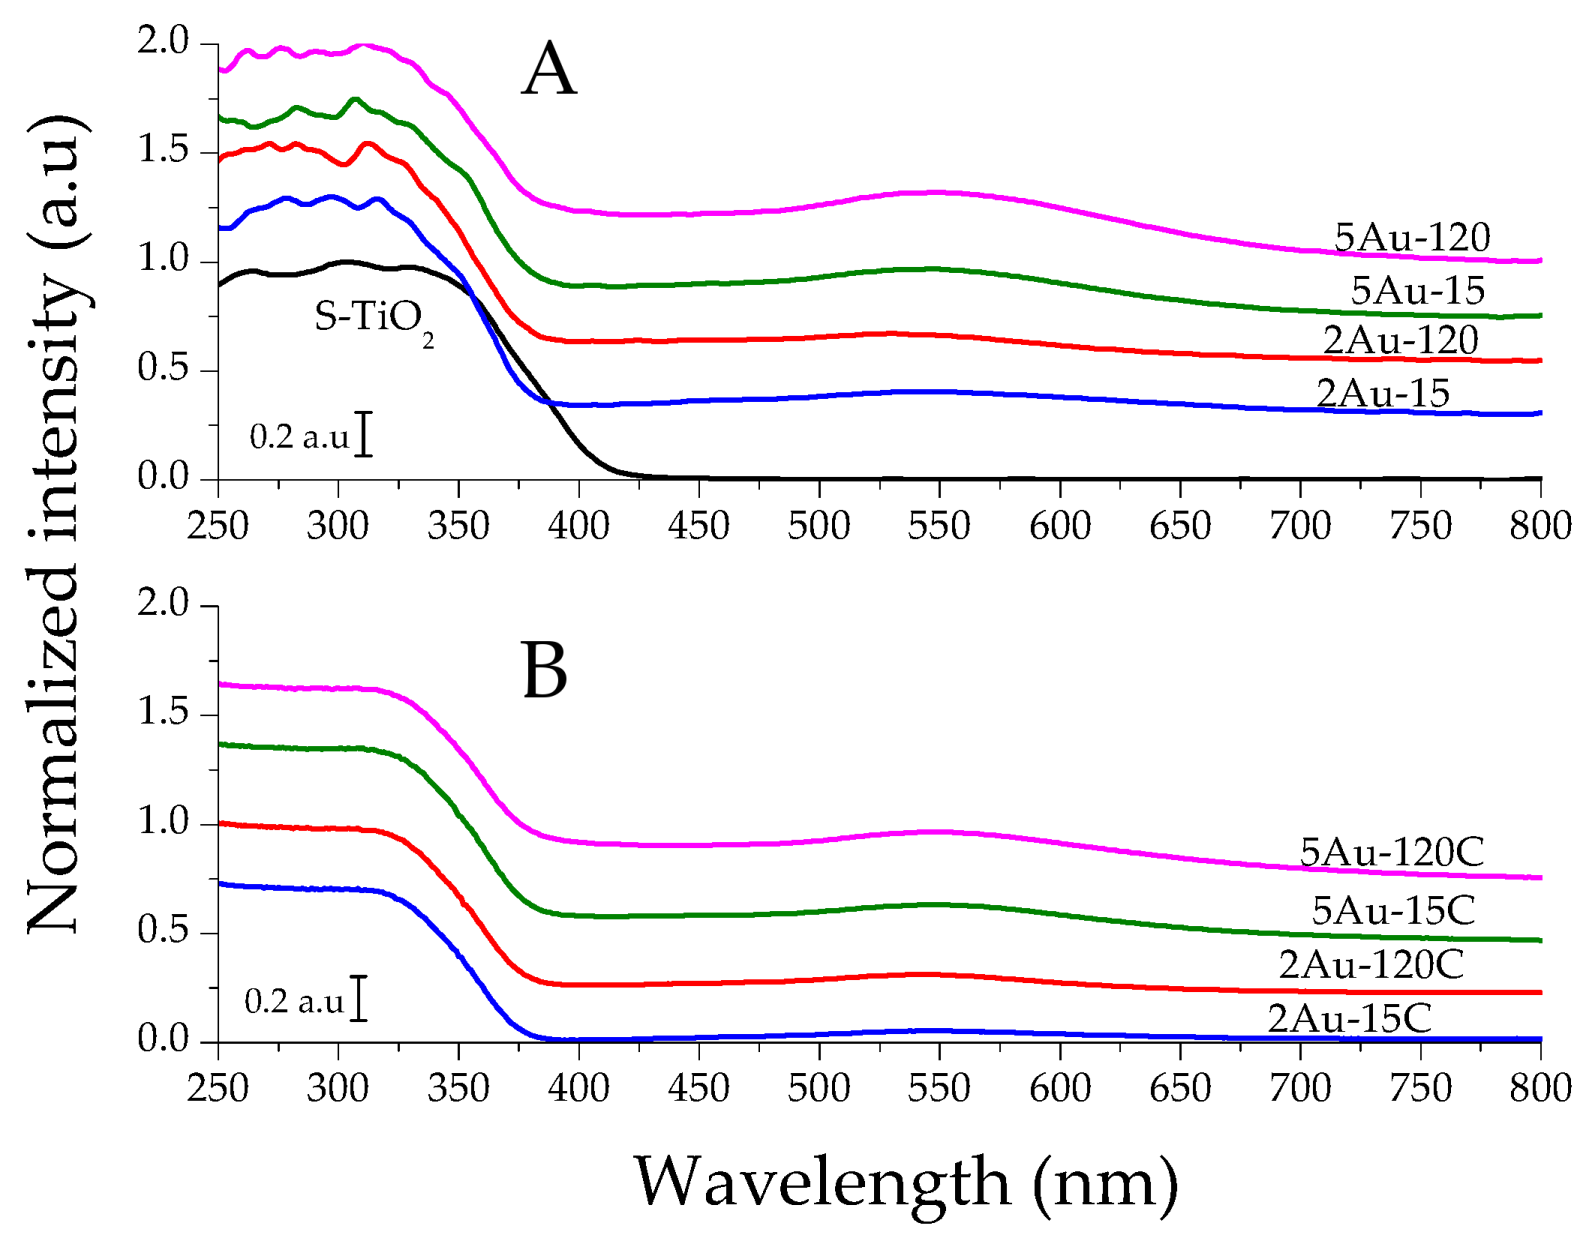
2.1. Physicochemical Characterization of the Obtained Materials

The real content of noble metal measured by XRF is presented in Table 1, as well as other physico-chemical features of the materials. It has to be noted that the amounts of deposited gold were notably lower than the theoretical values in all cases. However, regardless of the poor loading of gold, it was found that the real content of deposited noble metal increased with the deposition time in both cases, with 2 and 5 wt.%. Regarding the efficiency of the deposition of noble metal, in a previous work, it was observed that the loading of gold was strongly connected with the light intensity and the irradiation time during the photo-deposition [17].
As indicated in the experimental section, after synthesis, a certain portion of all the catalysts was calcined at 300 °C, and in order to evaluate the effect of temperature on the surface area of the obtained catalysts, N2 adsorption–desorption measurements were carried out before and after calcination. Prior to the calcination, the metalized solids presented similar specific surface areas around 53 m2/g and no large differences can be appreciated after the metallization process in all cases (Table 1). The BET area values were in agreement with those reported in the literature for similar sulfated titania [18]. However, after the calcination at 300 °C, all the materials exhibited a decrease in the specific area around 20 m2/g, which may possibly be due to the powder’s particles’ agglomeration during the calcination process, thus leading to a decrease in the SBET value. The similarity in the decrease of the specific area values for all the materials confirmed once again that no large differences concerning the textural properties were generated during the metallization process regardless of the nature of the noble metal or its amount.
The XRD profiles of the support and the catalysts, prior to and after the calcination at 300 °C, are presented in Figure 1. Before calcination (Figure 1A), all the materials presented had a similar profile where the principal reflections coincided with those of the anatase phase (JCPDS no. 00-021-1272). This result agrees with the fact that the sulphation of TiO2 stabilizes the anatase phase, avoiding the Rutile formation during the support synthesis (S–TiO2) [18]. Moreover, no clear signals of the presence of gold prior to the calcination were observed. This could indicate a high dispersion of the noble metal, although considering the poor loading of this, the main gold peak corresponding to the crystal plane (111) located at 2θ = 38.18° could be overlapped with the reflections (004) and (112) of the anatase, therefore, it cannot be clearly observed.
After the calcination, the XRD pattern of the support (S–TiO2) exhibited the evolution of the reflections due to the presence of the rutile phase (JCPSD no. 00-021-1276) along with those of the anatase (Figure 1B). However, this new phase of the TiO2 was not observed in the XRD patterns of the metallized catalysts that preserved the main reflections of the Anatase phase.
The presence of gold was noticeable in the XRD patterns after calcination through the evolution of the reflections associated to this metal, thus indicating the increase in the crystalline domain. An evolution of the crystal plane (111) of the gold was observed; however, it is still not clear, due to the overlap with the crystalline planes (004) and (112) of the anatase. However, in the materials 2Au-120C and 2Au-15C, a low-intensity peak was observed at a 2θ~44°, which could correspond to the crystalline plane (200) of gold (JCPDS No. 00-004-0784).
The crystallite sizes of the metal particles in the calcined catalysts are presented in Table 1 and the systems loaded with 2 wt.% showed practically the same gold crystallite size, while for the catalysts with 5 wt.%, a superior size of the nanoparticles was achieved for the solid submitted to the longer photo-deposition procedure (120 min). Calcined and non-calcined catalysts were also analyzed by means of TEM, and in this case, a particle size distribution was obtained for both families of solids. Thus, representative micrographs of the studied materials are presented in Figure 2.
Regarding the non-calcined materials, these had a similar morphology and the clusters of gold (confirmed by EDX analyses and highlighted by yellow circles) presented sizes below ~10 nm. Although the gold average particle size was similar for all the catalysts, the 2Au-120 solid exhibited a higher population of gold nanoparticles below 3 nm.
The calcined materials presented a similar morphology of small irregular agglomerates. In all cases, the majority of the black spots with higher contrast corresponded to clusters of gold (confirmed by EDX analyses), and for establishing the particle size distributions, several particles were measured, including those of micrographs not presented in the manuscript. In this sense, the agreement between the crystallite sizes obtained by the Scherrer equation and the average particle sizes established from the TEM micrographs needs to be noted (See Table 1). A broader particle size distribution was produced with the longer photo-reduction treatment that promoted the growth of the gold nanoparticles.
The surface elemental composition of the materials was analyzed by XPS (Figure 3). It can be observed that O (1s) peaks in all materials (Figure 3a,d,g,j), can be formed by the contribution of two peaks, where the smallest contribution varies between 12% and 15%. It is notable that these higher percentages were produced in materials with a longer photo-deposition time of Au. The contribution of the peak at 530 eV can be assigned to the lattice oxygen of the TiO2, while the peak to 531 eV can be assigned to hydroxyl groups or chemisorbed O species [19].
On the other hand, all the materials show Ti 2p1/2 and Ti 2p3/2 peaks, located at 465.5 eV and 458.8 eV, respectively; the distance between the Ti 2p peaks was 5.7 eV, which was induced by the coupling spin-orbital, indicating the presence of Ti4+ on the surface [19]. In all samples (Figure 3c,f,i,l), peaks were found centered around 87.6 eV and 84.0 eV, which can be assigned to Au 4f5/2 and Au 4f7/2, respectively, the distance between the peaks was about 3.6 eV, which confirms the presence of metallic Au particles deposited on the surface of TiO2 [20].
Although metallic Au was present in all the materials, it was remarkable to observe that for 2 wt.% nominal percentage, the amounts of deposited metal showed around 0.12%, while ~0.08% for materials with 5 wt.% nominal percentage, possibly due to an inverse relationship between the concentration of photo-deposited metal and the size of the Au particle on the TiO2 surface [21,22].
The XPS spectra also confirmed the presence of S (2p) located at 168.9 eV, which corresponds to S6+, which could indicate a substitution of Ti4+ cations by S6+ on the surface, due to the large size of the S6+. It is a viable candidate to replace the Ti site and would be able to compensate the Ti4+ deficiencies [19]. The atomic percentage of all samples was 0.5% (data not shown).
By means of XPS analysis, it was also possible to calculate the O/Ti atomic ratio (Table 2). For the S–TiO2 support, the O/Ti ratio was 1.70, thus the O/Ti atomic ratio of these species was below the stoichiometric one. Therefore, a certain number of oxygen vacancies on the surface of the material should be expected. This is because at the calcination temperature of 650 °C used in the S–TiO2 preparation, the elimination of sulfate groups promotes the creation of several oxygen vacancies, which have been reported as preferential sites for noble metal adsorption [23,24], this being one of the main reason for the application of sulphation treatment on the titania surface in this study. Furthermore, it is important to note that after gold photo-deposition, the O/Ti ratio increased to values around 1.83–1.95, suggesting that oxygen vacancies were partially annihilated during the metal deposition process.
The UV-Vis DR spectra of the catalysts prior to and after calcination are presented in Figure 4. In all cases, the characteristic sharp absorption threshold of TiO2 around 350 nm was observed [25,26]. Furthermore, a broad signal around 546 nm was observed for the catalysts with gold. This absorption in the visible region agrees with the purple color of the solids, whose hue depends on the gold content being more intense for the solids with the highest loadings of gold. The modifications in the hue of the colors of the powders, which is a qualitative feature, was confirmed by the variable intensity of the band in the visible region, this being more intense for the 5Au-15 and 5Au-120 solids.
The absorption band around 550 nm was associated with the localized surface plasmon of resonance of gold nanoparticles supported on TiO2 [25,26,27], and this signal intensified as the loading of gold increased. Different authors have reported a close relationship between the size of the clusters of gold and the position, shape, and intensity of the absorption band [28]. Furthermore, other aspects such as the dielectric constant of the support, and the surrounding medium may affect the position and shape of the surface plasmon resonance in the spectrum [27]. The alteration of the electronic environment of TiO2 produced by the modification with the noble metals may be observed in the change of the band gap values presented in Table 1. Before calcination, all the systems which contained gold presented a superior band gap to the bare support. Nevertheless, the calcined catalysts demonstrated a decrease in their band gap values. The surroundings of the TiO2 that were in contact with the metal depended on the amount of this and the size of the obtained nanoparticles. In this sense, if the calcination produces alterations in the size of the metal nanoparticles, it is to be expected that their interaction with the support will also be modified. Therefore, the catalytic performance, which in this sort of materials is strongly related to their electronic properties, will depend on whether or not the materials were calcined.

2.2. Catalytic Activity Measurements

-Catalytic activity during the phenol photo-catalytic oxidation: The photo-catalytic activity was evaluated with the degradation of a contaminating substrate such as phenol using different percentages of photo-deposited metallic Au on TiO2. Figure 5 shows that all materials evaluated had a phenol conversion greater than 95% after two hours of treatment. These results are in agreement with those reported in previous studies [17,29,30].
However, at short illumination times (40 min), it can be observed that the material with the best photo-catalytic behavior was 2Au-120, reaching a conversion higher than 60%, followed by the material 2Au-15, with a percentage lower than 50%. With respect to the materials 5Au-15 and 5Au-120, their behavior was lower still than the two previously described, with values lower than 40% and both very similar. The superior activity of the 2Au-120 material may be related to the size of the gold nanoparticles, since this material presented a superior population of smaller particles (below 3 nm) as was observed by means of TEM.
It is possible that the metallized materials with Au had an improved photo-catalytic activity, since the photo-deposited nanoparticles on the surface of the TiO2 act as sinks for the photo-generated electrons after the excitation with UV radiation. Generally, the Fermi levels of the photo-deposited noble metals were lower than those in the TiO2 conduction band [29], causing electrons to be efficiently transferred from the gold nanoparticles to the TiO2 conduction band, thus preventing the recombination of the charge carriers and generating a more efficient photo-catalytic process [31]. However, as can be observed at higher percentages of Au, it is possible that a greater recombination process of the h+/e- pairs is present, as suggested by K. Sornalingam et al. [32] at higher percentages of photo-deposited noble metals which can generate recombination processes by decreasing the photo-catalytic activity of the material [31,33]. In addition, at a high particle size, the active centers of TiO2 can be blocked, thus decreasing the photo-catalytic activity. Additionally, the blocked active centers may turn into recombination centers, which also results in the decrease in the catalytic activity [17].
Gold has a high affinity to suffer photo-deposition, where a direct relationship between the size of the nanoparticles and the nominal amount of the metal is observed. In addition, the photo-reduction of this metal is very fast, especially in the TiO2’s vacancies that stabilize gold deposits due to the high-adhesion energy that is generated between the Au and TiO2 [17,34]. This is why the leaching of gold was not observed in the prepared materials, according to the XRF analysis of the post-reaction catalysts (not presented data) that exhibited the same amount of noble metal than that of the catalysts prior to the catalytic activity measurements.
-Catalytic activity during the CO oxidation: The performance of the prepared catalysts during the CO oxidation reaction is presented in Figure 6.
The bare support did not show activity in the CO oxidation reaction, while the CO conversion was noticeable after the deposition of noble metals. Furthermore, for all the catalysts, the CO conversion increased along with the temperature, although the performance of the calcined materials was lower than that of the non-calcined ones. For this last fact, the first explanation that arises and agrees with that reported in the literature [35] is that the additional thermal treatment applied over the calcined catalysts resulted in the agglomeration of the gold nanoparticles, even though it has been proposed that the our calcination temperature (300 °C) was within a temperature range where strong sintering was not expected [35]. In this sense, the activation process itself may alter the size of the gold nanoparticles making them probably different to those presented in Table 1. This is a fact that has to be confirmed since it may allow establishing a clearer relationship between the size of the gold nanoparticles and the catalytic performance.
Another relevant aspect that has to be considered about the activation process is the reductant character of the applied atmosphere, since the use of H2 may result firstly in the total reduction of all gold species. Therefore, despite the possible negative effect of the thermal treatment, in the present work, the total reduction of the gold species was aimed at, since it has been demonstrated that Au0 species are more active in the activation of the reactants involved in CO oxidation [36,37,38].
The effects of the reductant conditions of the activation atmosphere may also modify the support, since TiO2 is a reducible oxide and the generation of Ti3+ species may result in the generation of oxygen vacancies. These punctual defects, generally stabilized in the surface of the oxide, are closely related with the role of this material in the activation of oxygen molecules during the oxidation of CO [39]. In addition, it has been demonstrated that these may enhance also the interaction between gold and the surface of the oxide [2]. Consequently, the reduction of the catalyst could counteract the sintering produced by the increase in temperature, taking also into account the possible dynamic re-dispersion of deposited gold nanoparticles in different supports depending on the atmosphere reported in literature [2,40,41]. However, this has to be confirmed and deeply analyzed through further experiments revealing more insights about the effects of the activation process in the studied catalysts.
Moreover, an approach to understanding the different performance of the catalysts, regardless of whether this performance is measured prior to or after the calcination, could be based on the different amounts of loaded noble metal. In this sense, the systems with higher amounts of gold (2Au-120 and 5Au-120) should be the most active systems, but this was not the case. Therefore, the particle size of the metal clusters, and consequently their interaction with the electronic properties of the support, have to play a more determinant role than the total amount of gold loaded. Different examples of studies combining DFT calculations have demonstrated alterations in the performance of the Au and Pt catalysts during the CO oxidation depending on the electronic environment of the metallic clusters [42,43]. Therefore, the different catalytic behaviors may be produced not only by the different loadings of noble metals but also by the interaction between these and the support. In fact, such interaction has been confirmed by means of the different characterization techniques discussed above. For instance, the strong interaction noble metal-support seemed to inhibit the evolution of the rutile phase (see Figure 1) of the prepared materials. In this sense, the surface O/Ti atomic ratio was also altered by such interaction (see Table 2), and consequently the electronic environment, resulting in the modification of the band gap values (see Table 1).
Bamwenda et al. [14] studied the effect of the preparation method of Pt and Au catalysts for the CO oxidation, supported on the TiO2. Furthermore, the deposition–precipitation and photo-deposition approaches were used by them and the former resulted in the more active systems. In fact, the gold catalysts prepared by the deposition–precipitation method presented a superior activity than the platinum catalysts. This agrees not only with the relatively low activity of the solids studied in the present work prepared by photo-deposition, but also with the fact that the synthesis procedure may determine the interaction between the noble metal and the surface of TiO2.
Regarding the calcined catalysts, the systems 2Au-120C and 5Au-120 that presented a comparable gold content (see Table 1), exhibited differences in their performance. In this case, it has to be remarked that the particle sizes obtained by means of the Scherrer equation and with the TEM micrographs (see Table 1) were very similar for these two solids. Therefore, the dispersion of gold in these two solids should be comparable, demonstrating that the electronic environment may be being influenced by other aspects such as the synthesis procedure that resulted in modifications of the support’s structure. This has also been remarked on by Bamwenda et al. [14] and other authors [44,45] that highlighted the structure sensitivity of Au/TiO2 catalysts due to the contribution from the perimeter interface between Au nanoparticles and the surface of the support.

3. Materials and methods

3.1. Synthesis of the Different Materials

The synthesis of the catalysts has previously been reported by Hidalgo et al. [17]. Firstly, the TiO2 was prepared through the hydrolysis of titanium tetraisopropoxide (Aldrich, 97%) dissolved in isopropanol solution (1.6 M), by means of the slow addition of distilled water (volume ratio isopropanol/water 1:1). The generated precipitate was filtered afterward and dried at 110 °C overnight. Then, the TiO2 powder was sulfated by immersion in H2SO4 (aq.) 1 M for 1 hour, and finally calcined at 650 °C for 2 hours (S–TiO2).
Concerning the synthesis of the Au-modified solids, the photo-deposition method was applied following the procedure previously described [46] and using Gold (III) chloride trihydrate (HAuCl4.3H2O, Aldrich 99.9%) as metal precursor. Therefore, under an inert atmosphere (N2), a suspension of 5 g/L S–TiO2 in distilled water containing 0.3 M isopropanol (Merck 99.8%) which acts as sacrificial donor was prepared. Then, the appropriate amount of metallic precursor was added to obtain the desired loading of gold. Two loadings of noble metal (2 and 5 wt.%) were proposed. The photo-chemical deposition in every system was performed by illuminating the suspension with an Osram® Ultra-Vitalux lamp (300 W), with a sun-like radiation spectrum and the main emission line in the UVA range at 365 nm. Two different photo-deposition times were applied (15 and 120 min). Furthermore, the light intensity on the TiO2 surface was 0.15 W/m2 for Au photo-chemical deposition. After the noble metal depositions, the powders were recovered by filtration and dried at 110 °C overnight [17]. In all cases, a portion of the catalysts was calcined at 300 °C for 2 h in air. The materials have been labelled as follows: indicating firstly, the intended wt.% of noble metal it was indicated; secondly, the noble metal, and finally the deposition time in minutes (2Au-15, 2Au-120, 5Au-15, 5Au-120). Additionally, regarding the calcined materials, the letter C was added: 2Au-15C, 2Au-120C, 5Au-15C, 5Au-120C.

3.2. Characterization of the Obtained Materials

The chemical composition and the total noble metals content in the samples was determined by X-ray fluorescence spectrometry (XRF) in a Panalytical® AXIOS sequential spectrophotometer (Malvern Panalytical, Malvern, United Kingdom) equipped with a rhodium tube as the source of radiation. The XRF measurements were performed onto pressed pellets (sample included in 10 wt.% of wax).
The specific surface area BET measurements were carried out using low-temperature N2 adsorption in a ASAP 2010 instrument (Micromeritics, Norcross, GA, USA). Degasification of the samples was performed at 150 °C for two hours under vacuum.
The XRD analyses were carried out on a Siemens® D500 diffractometer (Siemens, Munich, Germany) using the Cu Kα radiation (40 mA, 40 kV). The patterns were recorded with a 0.05° step size and 300 s of step time. Furthermore, the crystallite sizes of the metallic particles were calculated by means of the Scherrer equation.
Transmission electron microscopy (TEM) was performed with a Philips CM200 instrument (Philips, Amsterdam, Netherlands) and the samples were dispersed in ethanol using an ultrasonicator and dropped on a carbon grid prior to the analysis. With regards to the analysis of the micrographs, the different particle sizes of the metallic clusters were measured with the program ImageJ 1.51g, and afterwards, the corresponding histograms were made, following the Sturges’ rule for the establishment of the categories [47].
X-ray photoelectron spectroscopy (XPS) studies were carried out on a Leybold–Heraeus LHS-10 spectrometer (Leybold, Cologne, Germany), working with constant pass energy of 50 eV. The spectrometer main chamber, working at a pressure <2 × 10⁻⁹ Torr, was equipped with an EA-200MCD hemispherical electron analyzer with a dual X-ray source working with Al Kα (hν = 1486.6 eV) at 120 W and 30 mA. C 1s signal (284.6 eV) was used as internal energy reference in all the experiments. Samples were outgassed in the pre-chamber of the instrument at 150 °C up to a pressure <2 × 10⁻⁸ Torr to remove chemisorbed water.
The light absorption properties of the samples were studied by means of the diffuse reflectance UV–Vis spectrophotometry (DR/UV-Vis) using a Varian® spectrophotometer model Cary 100 (Varian, Palo Alto, CA, USA), equipped with an integrating sphere and using BaSO4 as reference. All the spectra were recorded in diffuse reflectance mode and transformed into a magnitude proportional to the extinction coefficient through the Kubelka–Munk function, (Fα). Concerning the direct band gap, this may be estimated from the adsorption edge wavelength of the inter-band transition using the Tauc function. For insulators and semiconductors, the square root of the Kubelka–Munk function multiplied by the photon energy is depicted versus the photon energy and extrapolating the linear zone of the rising curve to zero [48].

3.3. Catalytic Activity Measurements

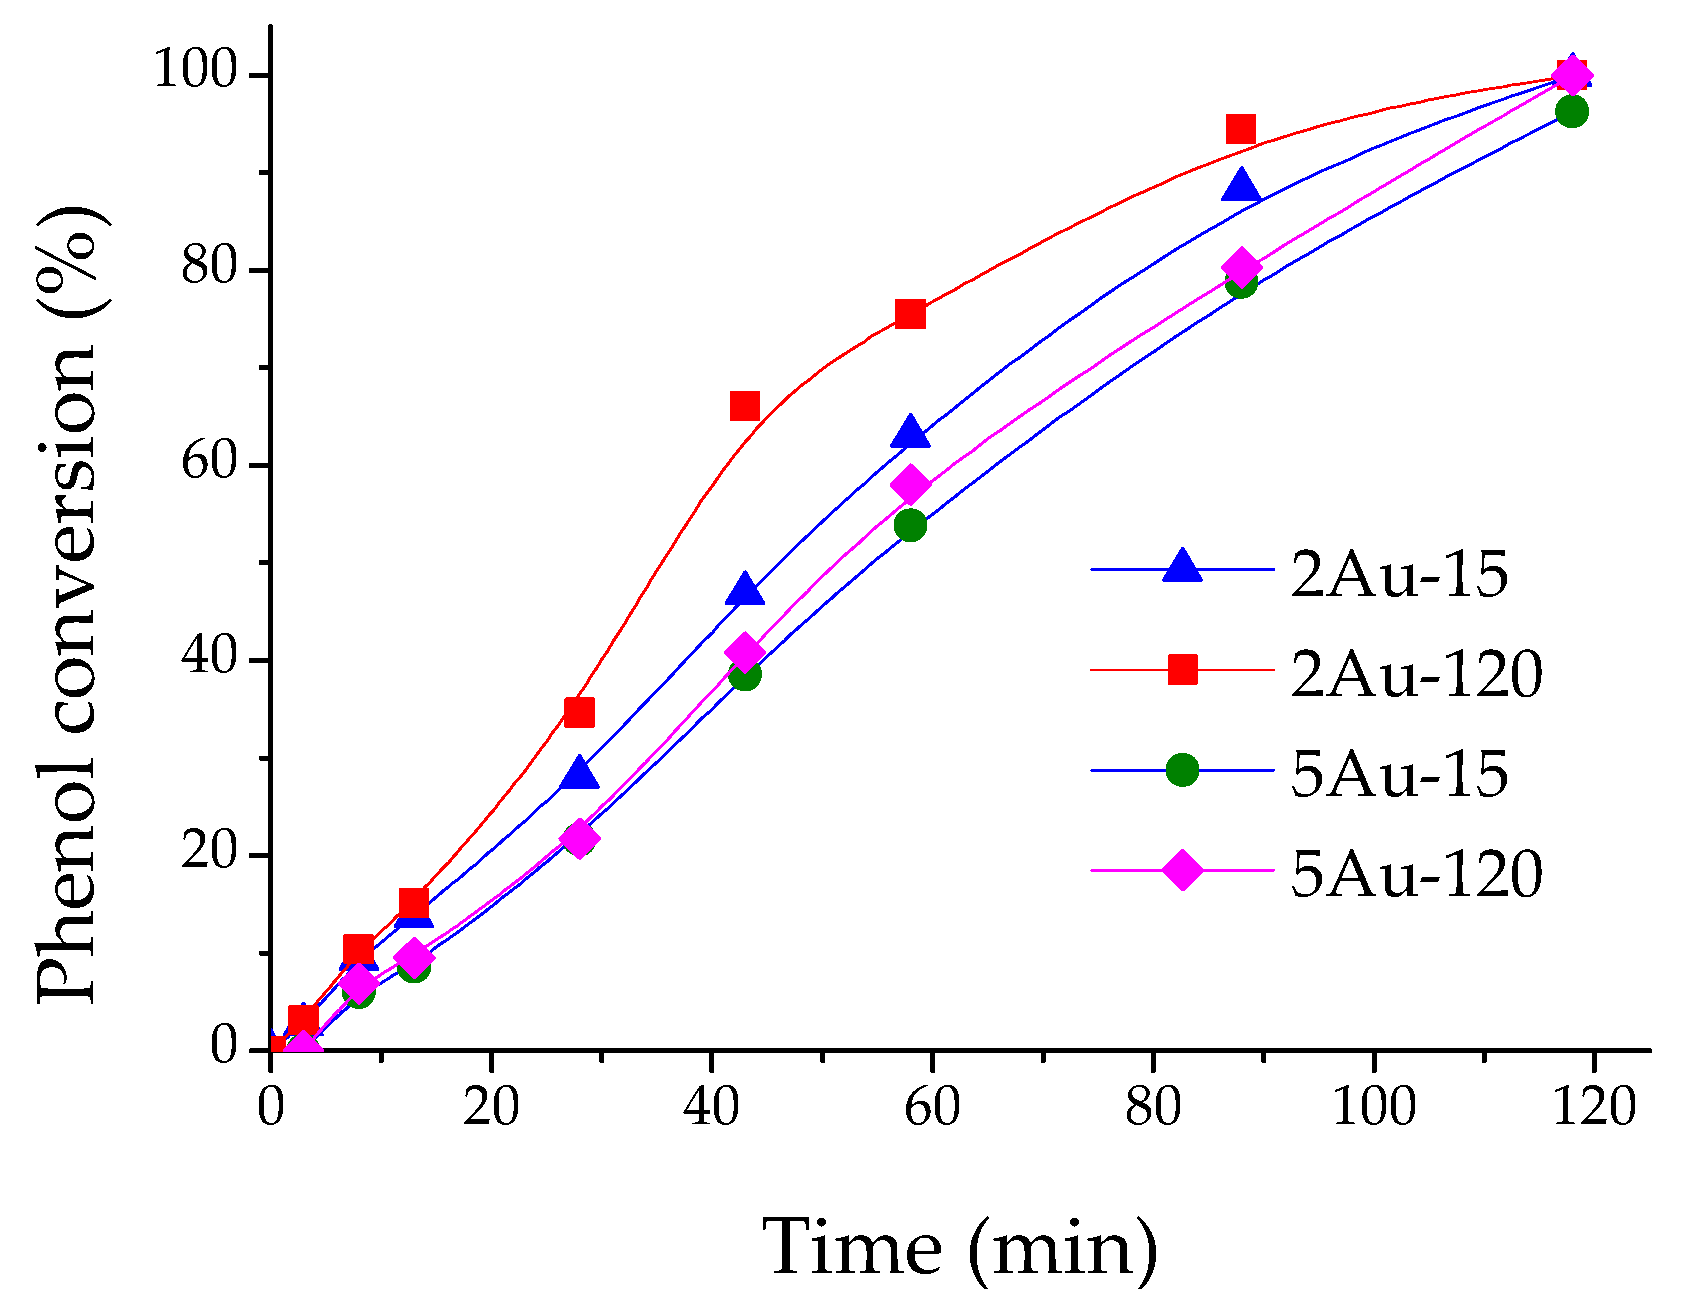
3.3.1. Phenol Photo-Catalytic Oxidation

The phenol photo-catalytic oxidation was carried out following the procedure previously reported by Hidalgo et al. [17]. Briefly, an aqueous suspension that contains 50 ppm of phenol and the photo-catalyst (1 g/L) was magnetically stirred in a 400-mL Pyrex batch reactor foiled with aluminum in the presence of a continuous oxygen flow for 20 minutes in the dark, in order to favor the adsorption–desorption equilibrium, since in this type of liquid phase systems it is important to reach equilibrium in order to obtain a high interaction between the adsorbate and the surface of the photocatalyst [34], and thus obtaining a better performance during the photocatalytic process, avoiding errors while the decrease of Phenol concentration was followed.
The light source used was an Osram Ultra-Vitalux lamp (300 W). The intensity of the incident UVA light on the solution was 140 W/m2, using a UV-transparent Plexiglas®top window with the threshold absorption at 250 nm. This parameter was determined with a PMA 2200 UVA photometer (Solar Light Co.).
The HPLC technique was used for monitoring the phenol concentration during the photo-catalytic activity, using an Agilent Technologies 1200 device, equipped with an Elipse XDB-C18 column (5 μm, 4.6 mm × 150 mm), with the water/methanol (65:35) mobile phase, and a flow rate of 0.8 mL/min.

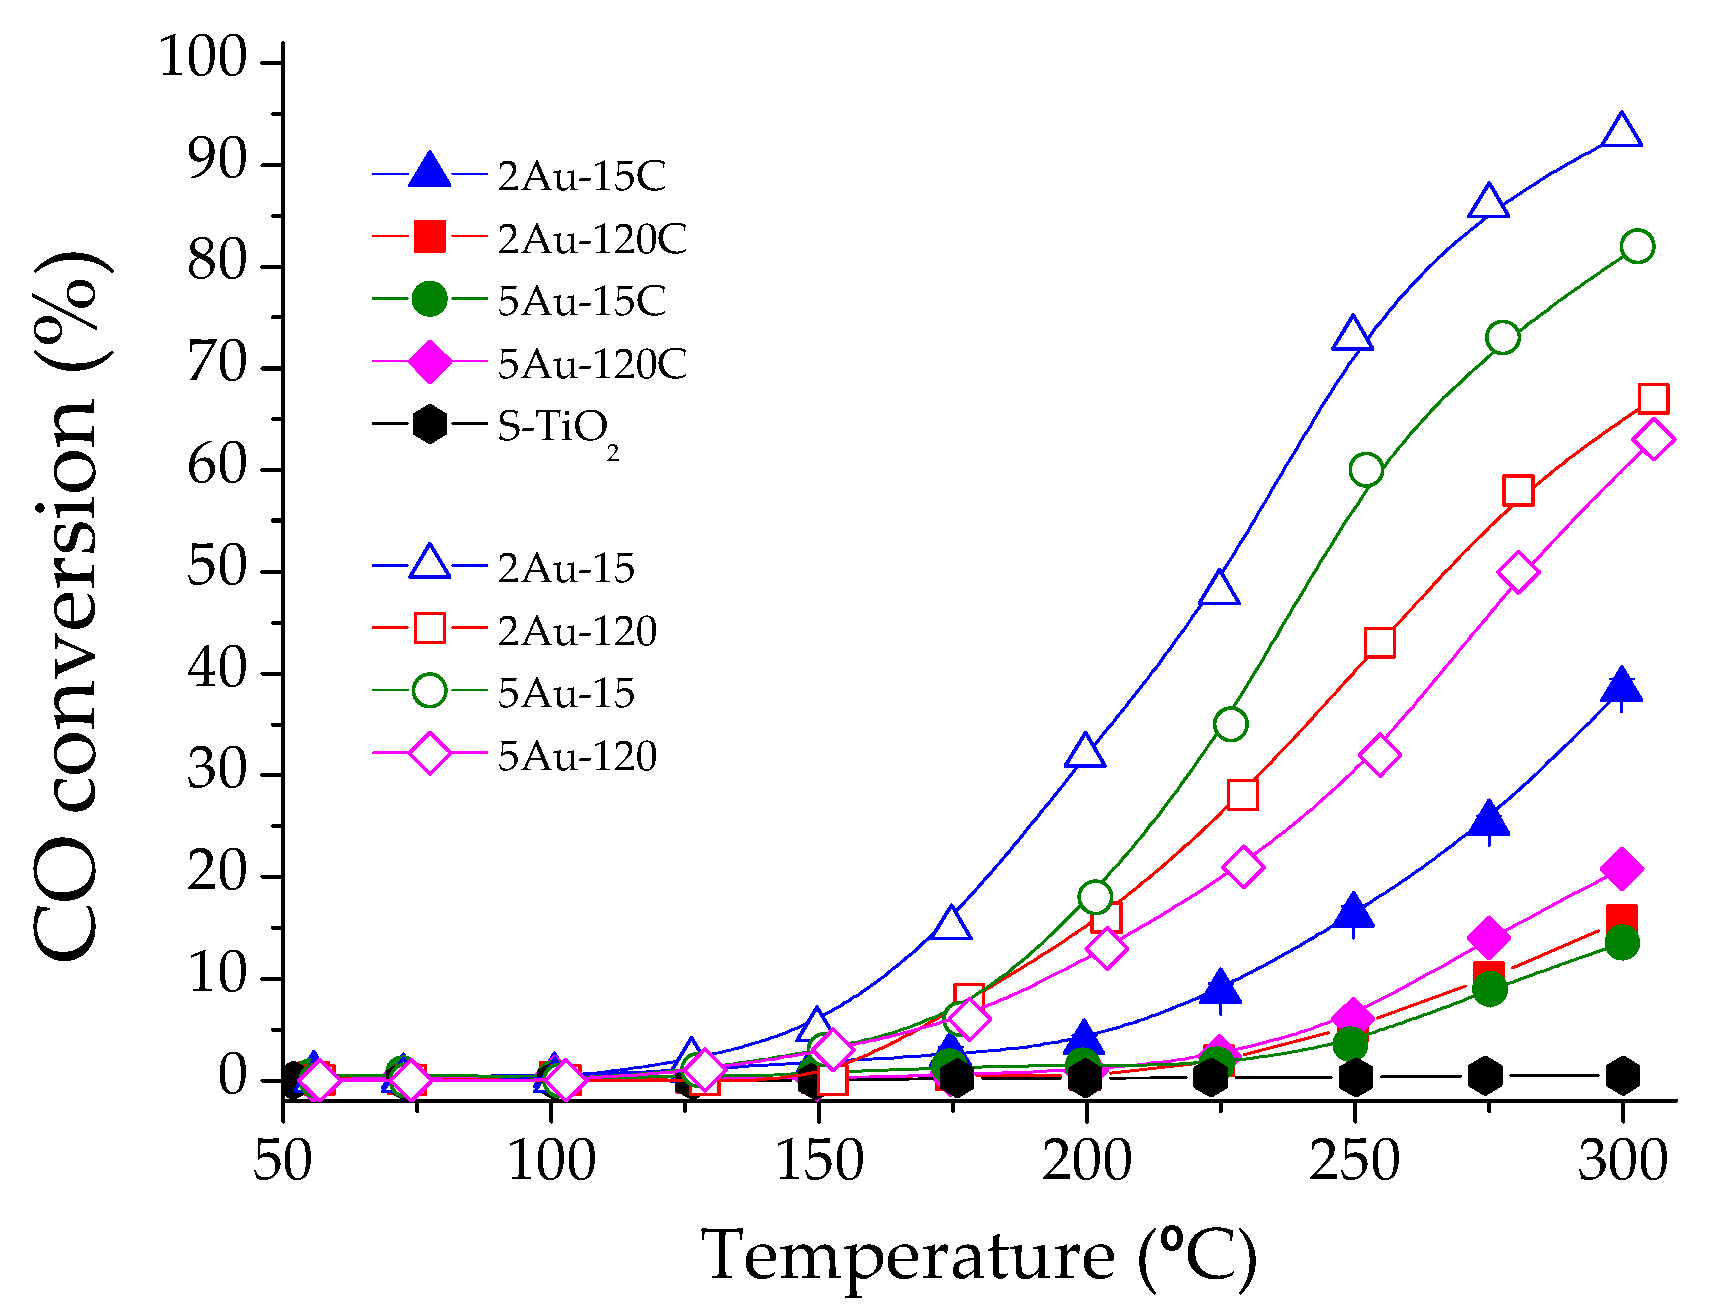
3.3.2. CO Oxidation Reaction

The catalytic activity measurements were carried out on a fixed-bed cylindrical stainless-steel reactor with an internal diameter of 0.9 mm, coupled to a Microactivity Reference Unit (PID Eng&Tech®), which allowed for the temperature to be controlled, as well as the composition of the different feed-streams passed through the samples. For every experiment, 100 mg of catalyst (particle size 100 < ø < 200 µm) was diluted with SiC VWR Prolabo® (particle size 0.125 µm) to achieve a bed of about 5 mm in height.
Firstly, the catalysts were activated under a 100 mL/min total flow of H2 (50 vol.%) and N2 (50 vol.%) at 300 °C for 2 h. Subsequently, the catalysts were cooled and the temperature was stabilized at 50 °C, and then the feed-stream of activation was replaced by the mixture of the reaction (100 mL/min: CO 3 vol.%; O2 15 vol.%; N2 82 vol.%). The reactants and products were analyzed and quantified (from 50 to 300 °C every 25 °C) by gas chromatography on a micro GC (Varian® CP-4900), equipped with a Porapak® Q, a Molecular Sieve 5A, and two TCD detectors. The carrier gas for the chromatographic analyses was He. The CO conversion was calculated according to Equation (1), where Fin,CO and Fout,CO refer to the molar flow rates at the reactor inlet and outlet, respectively.
C O   c o n v e r s i o n = 100 × F i n , C O F o u t , C O F i n , C O

4. Conclusions

A series of Au–TiO2 catalysts were successfully prepared by means of the photo-deposition method. Although the loading of noble metal in all cases was low, compared with the intended value, a strong interaction between the deposited metallic species and TiO2 was noticed. One of the remarkable consequences of such interaction was that in all cases, the presence of noble metal inhibited the transition from anatase–rutile, preserving the anatase as the main phase in the calcined catalysts. Moreover, the spectroscopic characterization of the studied materials showed alterations of the electronic properties appreciable in the modification of the UV-Vis spectra that also resulted in different band gap values depending on the loading and particle size of the deposited nanoparticles. In all cases, the calcination of the materials generated considerable changes in their electronic properties due to the sintering of the noble metal clusters.
Regarding the catalytic activity studies, on the one hand, the uncalcined materials showed considerable activity during the photo-catalytic degradation of phenol, with the 2Au-120 systems being the most active one. On the other hand, during the CO oxidation reaction, although the uncalcined materials also exhibited catalytic activity, this seemed to be below that of other gold catalysts reported in literature. Furthermore, an important reduction of the catalytic activity was obtained after the calcination of the catalyst principally due to the sintering of the metal clusters.
Therefore, the studied materials present structural and electronic properties that seem to be more determinant in photo-oxidation reactions rather than in the CO oxidation. Despite this, it is clear that the cited properties also determine the catalytic performance during the CO oxidation reaction. Therefore, the challenge is to increase the number of active sites without sacrificing the dispersion of the metallic phase, optimizing the synthesis parameters to also improve the noble metal load, while aiming to obtain more active systems for heterogeneous solid–gas reaction environment.

Author Contributions

O.H.L. and J.J.M. conceived and designed the experiments. O.H.L., J.J.M. and C.J.-P. performed the experiments. O.H.L., J.J.M. and C.J.-P. analyzed the data and wrote the paper. H.R., J.A.N. and M.C.H., contributed reagents, materials and analysis tools. O.H.L. and J.J.M. looked for funding for the mobility of researchers involved in this paper.

Funding

This research received no external funding.

Acknowledgments

The authors thank COLCIENCIAS and Universidad Pedagógica y Tecnológica de Colombia for the economic support through the aid: “Complementos para proyectos con financiación internacional para la comunidad COLCIENCIAS en el exterior—2014”. O.H. Laguna thanks the Spanish Ministry of Economy and Competitiveness for the support through the project ENE2015-66975-C3-2-R.C. Jaramillo-Paez thanks the Universidad del Tolima for the financial support through the Studies Commission.

Conflicts of Interest

The authors declare no conflict of interest.

References

  1. Xie, X.; Li, Y.; Liu, Z.-Q.; Haruta, M.; Shen, W. Low-temperature oxidation of CO catalysed by Co3O4 nanorods. Nature 2009, 458, 746–749. [Google Scholar] [CrossRef]
  2. Sarria, F.R.; Plata, J.J.; Laguna, O.H.; Márquez, A.M.; Centeno, M.A.; Sanz, J.F.; Odriozola, J.A. Surface oxygen vacancies in gold based catalysts for CO oxidation. RSC Adv. 2014, 4, 13145–13152. [Google Scholar] [CrossRef] [Green Version]
  3. Choudhary, T. CO-free fuel processing for fuel cell applications. Catal. Today 2002, 77, 65–78. [Google Scholar] [CrossRef]
  4. Costello, C.K.; Yang, J.H.; Law, H.Y.; Wang, Y.; Lin, J.N.; Marks, L.D.; Kung, M.C.; Kung, H.H. On the potential role of hydroxyl groups in CO oxidation over Au/Al2O3. Appl. Catal. A Gen. 2003, 243, 15–24. [Google Scholar] [CrossRef]
  5. Avgouropoulos, G.; Ioannides, T. Selective CO oxidation over CuO-CeO2 catalysts prepared via the urea–nitrate combustion method. Appl. Catal. A Gen. 2003, 244, 155–167. [Google Scholar] [CrossRef]
  6. Laguna, O.H.; Bobadilla, L.F.; Hernández, W.Y.; Centeno, M.A. Chapter 20: Low-Temperature CO oxidation. In Perovskites and Related Mixed Oxides: Concepts and Applications; Granger, P., Parvulescu, V.I., Kaliaguine, S., Prellier, W., Eds.; Wiley-VCH: Weinheim, Germany, 2016; pp. 453–475. [Google Scholar]
  7. Corma, A.; García, H. Supported Gold Nanoparticles as Oxidation Catalysts. In Nanoparticles and Catalysis; Astruc, D., Ed.; Willey-VCH Verlag GmbH & Co. KGaA: Weinheim, Germany, 2008; pp. 389–429. [Google Scholar]
  8. Santos, V.P.; Carabineiro, S.A.C.; Tavares, P.B.; Pereira, M.F.R.; Órfão, J.J.M.; Figueiredo, J.L. Oxidation of CO, ethanol and toluene over TiO2 supported noble metal catalysts. Appl. Catal. B Environ. 2010, 99, 198–205. [Google Scholar] [CrossRef]
  9. Bond, G.C.; Louis, C.; Thompson, D.T. Catalysis by Gold; Hutchings, G.J., Ed.; Catalytic Science Series; Imperial College Press: London, UK, 2006; pp. 180–182. [Google Scholar]
  10. Ide, Y.; Nakamura, N.; Hattori, H.; Ogino, R.; Ogawa, M.; Sadakane, M.; Sano, T. Sunlight-induced efficient and selective photocatalytic benzene oxidation on TiO2-supported gold nanoparticles under CO2 atmosphere. Chem. Commun. 2011, 47, 11531–11533. [Google Scholar] [CrossRef] [PubMed]
  11. Doustkhah, E.; Rostamnia, S.; Tsunoji, N.; Henzie, J.; Takei, T.; Yamauchi, Y.; Ide, Y. Templated synthesis of atomically-thin Ag nanocrystal catalysts in the interstitial space of a layered silicate. Chem. Commun. 2018, 54, 4402–4405. [Google Scholar] [CrossRef] [PubMed]
  12. Galusek, D.; Ghillányová, K. Ceramic Oxides. In Ceramics Science and Technology; Riedel, R., Chen, I.-W., Eds.; Wiley-VCH Verlag GmbH & Co.: Weinheim, Germany, 2010. [Google Scholar]
  13. Bagheri, S.; Julkapli, N.M.; Hamid, S.B.A. Titanium Dioxide as a Catalyst Support in Heterogeneous Catalysis. Sci. J. 2014, 2014, 1–21. [Google Scholar] [CrossRef] [Green Version]
  14. Bamwenda, G.; Tsubota, S.; Nakamura, T.; Haruta, M. The influence of the preparation methods on the catalytic activity of platinum and gold supported on TiO2 for CO oxidation. Catal. Lett. 1997, 44, 83–87. [Google Scholar] [CrossRef]
  15. Sui, X.-L.; Wang, Z.-B.; Yang, M.; Huo, L.; Gu, D.-M.; Yin, G.-P. Investigation on C–TiO2 nanotubes composite as Pt catalyst support for methanol electrooxidation. J. Sources 2014, 255, 43–51. [Google Scholar] [CrossRef]
  16. Plata, J.J.; Romero-Sarria, F.; Amaya-Suarez, J.; Márquez, A.M.; Laguna, O.H.; Odriozola, J.A.; Sanz, J.F.; Ramos, J.J.P.; Sanz, J.F. Improving the activity of gold nanoparticles for the water-gas shift reaction using TiO2–Y2O3: An example of catalyst design. Phys. Chem. Chem. Phys. 2018, 20, 22076–22083. [Google Scholar] [CrossRef] [PubMed]
  17. Hidalgo, M.C.; Murcia, J.; Navío, J.A.; Colón, G.; Mesa, J.J.M. Photodeposition of gold on titanium dioxide for photocatalytic phenol oxidation. Appl. Catal. A Gen. 2011, 397, 112–120. [Google Scholar] [CrossRef]
  18. Colón, G.; Hidalgo, M.C.; Navío, J.A. Photocatalytic behaviour of sulphated TiO2 for phenol degradation. Appl. Catal. B Environ. 2003, 45, 39–50. [Google Scholar] [CrossRef]
  19. Chen, X.; Sun, H.; Zhang, J.; Guo, Y.; Kuo, D.-H. Cationic S-doped TiO2/SiO2 visible-light photocatalyst synthesized by co-hydrolysis method and its application for organic degradation. J. Mol. Liq. 2019, 273, 50–57. [Google Scholar] [CrossRef]
  20. Murcia, J.J.; Navio, J.A.; Hidalgo, M.C. Insights towards the influence of Pt features on the photocatalytic activity improvement of TiO2 by platinisation. Appl. Catal. B Environ. 2012, 126, 76–85. [Google Scholar] [CrossRef]
  21. Chenakin, S.; Kruse, N. Combining XPS and ToF-SIMS for assessing the CO oxidation activity of Au/TiO2 catalysts. J. Catal. 2018, 358, 224–236. [Google Scholar] [CrossRef]
  22. Chenakin, S.P.; Kruse, N. Au 4f spin–orbit coupling effects in supported gold nanoparticles. Phys. Chem. Chem. Phys. 2016, 18, 22778–22782. [Google Scholar] [CrossRef]
  23. Okazaki, K.; Morikawa, Y.; Tanaka, S.; Tanaka, K.; Kohyama, M. Electronic structures of Au onTiO2 (110) by first-principles calculations. Phys. Rev. B 2004, 69, 235404. [Google Scholar] [CrossRef]
  24. Vittadini, A.; Selloni, A. Small gold clusters on stoichiometric and defected TiO2 anatase (101) and their interaction with CO: A density functional study. J. Chem. Phys. 2002, 117, 353–361. [Google Scholar] [CrossRef]
  25. Li, B.; Hao, Y.; Shao, X.; Tang, H.; Wang, T.; Zhu, J.; Yan, S. Synthesis of hierarchically porous metal oxides and Au/TiO2 nanohybrids for photodegradation of organic dye and catalytic reduction of 4-nitrophenol. J. Catal. 2015, 329, 368–378. [Google Scholar] [CrossRef]
  26. Sanchez, V.M.; Martínez, E.D.; Ricci, M.L.M.; Troiani, H.; Soler-Illia, G.J.A.A. Optical Properties of Au Nanoparticles Included in Mesoporous TiO2 Thin Films: A Dual Experimental and Modeling Study. J. Phys. Chem. C 2013, 117, 7246–7259. [Google Scholar] [CrossRef]
  27. Chen, H.; Shao, L.; Li, Q.; Wang, J. Gold nanorods and their plasmonic properties. Chem. Soc. Rev. 2013, 42, 2679–2724. [Google Scholar] [CrossRef] [PubMed]
  28. Link, S.; El-Sayed, M.A. Size and Temperature Dependence of the Plasmon Absorption of Colloidal Gold Nanoparticles. J. Phys. Chem. B 1999, 103, 4212–4217. [Google Scholar] [CrossRef] [Green Version]
  29. Ayati, A.; Ahmadpour, A.; Bamoharram, F.F.; Tanhaei, B.; Mänttäri, M.; Sillanpää, M. A review on catalytic applications of Au/TiO2 nanoparticles in the removal of water pollutant. Chemosphere 2014, 107, 163–174. [Google Scholar] [CrossRef] [PubMed]
  30. Maicu, M.; Hidalgo, M.C.; Colón, G.; Navío, J.A. Comparative study of the photodeposition of Pt, Au and Pd on pre-sulphated TiO2 for the photocatalytic decomposition of phenol. J. Photochem. Photobiol. A Chem. 2011, 217, 275–283. [Google Scholar] [CrossRef]
  31. Gołąbiewska, A.; Malankowska, A.; Jarek, M.; Lisowski, W.; Nowaczyk, G.; Jurga, S.; Zaleska-Medynska, A. The effect of gold shape and size on the properties and visible light-induced photoactivity of Au-TiO2. Appl. Catal. B Environ. 2016, 196, 27–40. [Google Scholar] [CrossRef]
  32. Sornalingam, K.; McDonagh, A.; Zhou, J.L.; Johir, M.A.H.; Ahmed, M.B. Photocatalysis of estrone in water and wastewater: Comparison between Au-TiO2 nanocomposite and TiO2, and degradation by-products. Sci. Total Environ. 2018, 610, 521–530. [Google Scholar] [CrossRef] [PubMed]
  33. Kaur, R.; Pal, B. Size and shape dependent attachments of Au nanostructures to TiO2 for optimum reactivity of Au–TiO2 photocatalysis. J. Mol. Catal. A Chem. 2012, 355, 39–43. [Google Scholar] [CrossRef]
  34. Panayotov, D.A.; Morris, J.R. Surface chemistry of Au/TiO2: Thermally and photolytically activated reactions. Surf. Sci. Rep. 2016, 71, 77–271. [Google Scholar] [CrossRef]
  35. Maciejewski, M.; Fabrizioli, P.; Grunwaldt, J.-D.; Becker, O.S.; Baiker, A. Supported gold catalysts for CO oxidation: Effect of calcination on structure, adsorption and catalytic behaviour. Phys. Chem. Chem. Phys. 2001, 3, 3846–3855. [Google Scholar] [CrossRef]
  36. Yang, J.H.; Henao, J.D.; Raphulu, M.C.; Wang, Y.; Caputo, T.; Groszek, A.J.; Kung, M.C.; Scurrell, M.S.; Miller, J.T.; Kung, H.H. Activation of Au/TiO2 Catalyst for CO Oxidation. J. Phys. Chem. B 2005, 109, 10319–10326. [Google Scholar] [CrossRef]
  37. Weiher, N.; Beesley, A.M.; Tsapatsaris, N.; Delannoy, L.; Louis, C.; Van Bokhoven, J.A.; Schroeder, S.L.M. Activation of Oxygen by Metallic Gold in Au/TiO2 Catalysts. J. Am. Chem. Soc. 2007, 129, 2240–2241. [Google Scholar] [CrossRef]
  38. Wei, S.; Fu, X.-P.; Wang, W.-W.; Jin, Z.; Song, Q.-S.; Jia, C. Au/TiO2 Catalysts for CO Oxidation: Effect of Gold State to Reactivity. J. Phys. Chem. C 2018, 122, 4928–4936. [Google Scholar] [CrossRef]
  39. Laguna, O.H.; Domínguez, M.I.; Romero-Sarria, F.; Odriozola, J.A.; Centeno, M.A. Role of Oxygen Vacancies in Gold Oxidation Catalysis; Royal Society of Chemistry (RSC): London, UK, 2014; Chapter 13; pp. 489–511. [Google Scholar]
  40. Sarria, F.R.; Martínez T, L.M.; Centeno, M.A.; Odriozola, J.A. Surface Dynamics of Au/CeO2 Catalysts during CO Oxidation. J. Phys. Chem. C 2007, 111, 14469–14475. [Google Scholar] [CrossRef]
  41. Kamiuchi, N.; Sun, K.; Aso, R.; Tane, M.; Tamaoka, T.; Yoshida, H.; Takeda, S. Self-activated surface dynamics in gold catalysts under reaction environments. Nat. Commun. 2018, 9, 2060. [Google Scholar] [CrossRef] [PubMed]
  42. An, T.; Selloni, A.; Wang, H. Effect of reducible oxide–metal cluster charge transfer on the structure and reactivity of adsorbed Au and Pt atoms and clusters on anatase TiO2. J. Chem. Phys. 2017, 146, 184703. [Google Scholar]
  43. Kandoi, S.; Gokhale, A.; Grabow, L.; Dumesic, J.; Mavrikakis, M. Why Au and Cu Are More Selective Than Pt for Preferential Oxidation of CO at Low Temperature. Catal. Lett. 2004, 93, 93–100. [Google Scholar] [CrossRef]
  44. Haruta, M.; Tsubota, S.; Kobayashi, T.; Kageyama, H.; Genet, M.; Delmon, B. Low-Temperature Oxidation of CO over Gold Supported on TiO2, α-Fe2O3, and Co3O4. J. Catal. 1993, 144, 175–192. [Google Scholar] [CrossRef]
  45. Cunningham, D.; Tsubota, S.; Kamijo, N.; Haruta, M. Preparation and catalytic behaviour of subnanometer gold deposited on TiO2 by vaccum calcination. Res. Chem. Intermed. 1993, 19, 1–13. [Google Scholar] [CrossRef]
  46. Murcia, J.J.; Ávila-Martínez, E.G.; Rojas, H.; Navío, J.A.; Hidalgo, M.C. Study of the E. coli elimination from urban wastewater over photocatalysts based on metallized TiO2. Appl. Catal. B Environ. 2017, 200, 469–476. [Google Scholar] [CrossRef]
  47. Sturges, H.A. The choice of a class interval Case I Computations involving a single. J. Am. Stat. Assoc. 1926, 21, 65–66. [Google Scholar] [CrossRef]
  48. Channei, D.; Inceesungvorn, B.; Wetchakun, N.; Ukritnukun, S.; Nattestad, A.; Chen, J.; Phanichphant, S. Photocatalytic Degradation of Methyl Orange by CeO2 and Fe–doped CeO2 Films under Visible Light Irradiation. Sci. Rep. 2014, 4, 5757. [Google Scholar] [CrossRef] [PubMed]
Figure 1. XRD patterns of the prepared materials: (A) before calcination at 300 °C; (B) after calcination at 300 °C.
Catalysts 09 00331 g001
Figure 2. TEM micrographs of the non-calcined and calcined catalysts including the corresponding particle size distributions of the metal nanoparticles.
Catalysts 09 00331 g002
Figure 3. (ac) 5Au-120; (df) 5Au-15; (gi) 2Au-120; (jl) 2Au-15.
Catalysts 09 00331 g003
Figure 4. DR/UV-Vis spectra of the prepared catalysts: (A) before calcination at 300 °C; (B) after calcination at 300 °C.
Catalysts 09 00331 g004
Figure 5. Catalytic activity of the prepared catalysts during the phenol photo-catalytic oxidation.
Catalysts 09 00331 g005
Figure 6. Catalytic activity of the prepared catalysts during the CO oxidation.
Catalysts 09 00331 g006
Table 1. Miscellaneous physico-chemical properties of the prepared materials including: noble metal content, specific area BET, band gap, and particle sizes of the metal nanoparticles.
SampleNoble Metal Content (Au wt.%)Area BET (m2/g)Direct Band Gap (eV)* Crystallite Size of the Metallic Species (nm)Δ Average Particle Size of the Metallic Species (nm)
S–TiO2-583.20--
2Au-150.28533.56not detected4.8
2Au-1200.77533.536.4
5Au-150.43503.515.6
5Au-1200.73483.516.2
2Au-15C0.28323.162922
2Au-120C0.77353.022527
5Au-15C0.43333.031716
5Au-120C0.73343.043022
* Crystallite size of Au species calculated by XRD results and using the Scherrer equation for the calcined solids. Δ Average particle size of Au species calculated from the analysis carried out over the TEM micrographs of the non-calcined and calcined solids.
Table 2. Binding energies of the Ti (2p3/2) and O (1s) peaks, and the O/Ti atomic ratio for the prepared catalysts.
CatalystBinding Energy (eV)O/Ti
Atomic Ratio
Ti (2p3/2)O (1s)
S–TiO2458.5529.81.70
2Au-15458.6530.01.83
2Au-120458.5529.81.85
5Au-15458.9530.21.86
5Au-120458.5529.91.95

