Article

Zinc Oxide Nanoparticles Obtained by Supercritical Antisolvent Precipitation for the Photocatalytic Degradation of Crystal Violet Dye

Department of Industrial Engineering, University of Salerno, 84084 Fisciano, Italy
*
Author to whom correspondence should be addressed.
Catalysts 2019, 9(4), 346; https://doi.org/10.3390/catal9040346
Submission received: 20 March 2019 / Revised: 3 April 2019 / Accepted: 5 April 2019 / Published: 9 April 2019
(This article belongs to the Special Issue New Trends in the Photocatalytic Removal of Organic Dyes)

Abstract

:
In this work, the synthesis of zinc oxide (ZnO) photocatalyst from thermal decomposition of zinc acetate (ZnAc) nanoparticles obtained by supercritical antisolvent (SAS) precipitation was investigated. The optimization of calcination conditions of the SAS ZnAc was carried out, studying the effect of temperature (in the range 300–600 °C) on the production of ZnO nanoparticles. In particular, it was demonstrated that the organic residues in ZnO and its particle size, thus the specific surface area, strongly affect the photocatalytic performances. SAS micronization of ZnAc produces regular nanoparticles with a mean diameter of about 54.5 ± 11.5 nm, whereas unprocessed ZnAc is characterized by very large crystals. The experimental results evidenced that ZnAc prepared by SAS process calcined at 500 °C showed a regular nanometric structure (mean diameter: 65.0 ± 14.5 nm) and was revealed to be the best choice for the photocatalytic removal of crystal violet dye (CV). In fact, the photocatalytic activity performances of ZnO nanoparticles prepared by this route were higher with respect to that of ZnO from unprocessed ZnAc calcined at 500 °C (which is characterized by irregular tetrapods with mean size 181.1 ± 65.5 nm). The optimized photocatalyst was able to assure the complete CV decolorization in 60 min of UV irradiation time and a mineralization degree higher than 90% after 120 min of treatment time.

1. Introduction

Nowadays, organic dyes are considered the main pollutants in the wastewater coming from a large number of industries, including textile, paint, paper, ink, rubber, and plastic manufacturing activities. It is estimated that approximately 15–20% of these dyes are lost during synthesis or processing and they are released in the industrial wastewaters [1,2,3]. Organic dyes are generally present in wastewater in concentrations ranging from 5 to 1500 mg/L, causing serious problems for the environment and the health of living organisms, such as carcinogenic and mutagenic effects, due to their toxicity [4].
Conventional methods used to remove dyes from the wastewater, like biological processes, flocculation, coagulation, filtration, and precipitation, have some drawbacks, mainly due to a low removal efficiency [5,6], since dyes are stable to the light and the oxidizing agent [7]. On the contrary, a promising alternative is the heterogeneous photocatalysis [8,9], which is an advanced oxidation technology that allows removal of a great variety of organic pollutants with a very efficient degradation rate [10,11,12].
Up to now, different semiconductor materials have been employed to treat the colored wastewater though photocatalytic methods, especially titanium dioxide (TiO2), which still has several limits as well as most of the photocatalysts studied, i.e., the deactivation caused by ions scavengers in the solution and a low degradation kinetic in the presence of a high content of dyes in aqueous samples [13]. These disadvantages can be overcome by using zinc oxide (ZnO), which recently has received a considerable interest in the photocatalytic field because of its non-toxicity, low cost, high catalytic efficiency, wide band gap energy (3.37 eV at room temperature), and great potential to adsorb UV light irradiation [14]. In some literature works, it was also demonstrated that ZnO is more effective than TiO2 to remove pollutants in the wastewater [15], including organic dyes [16].
For all these reasons, many studies focused on the improvement of ZnO photocatalytic performance, for example by the deposition of noble metals on ZnO surface, such as Au, Pt, Pd, and Ag [17,18,19,20], or the doping of ZnO [13,21,22].
Another promising approach to enhance the photocatalytic performance is the particle size reduction of ZnO, or generally speaking, of semiconductors, because it is well known that the physical and chemical properties are strongly influenced by the morphology and particle size [23].
In this perspective, the method employed to produce ZnO nanoparticles plays an important role in the control of morphology and size. Traditional synthesis methods, such as precipitation, coprecipitation, colloidal methods, sol-gel processing, water-oil microemulsions method, hydrothermal synthesis, solvothermal, sonochemical, as well as polyol method [24], make it difficult to obtain well-separated nanoparticles with a narrow particle size distribution (PSD). Moreover, a massive use of organic and inorganic solvents, like nitrates, ammonia, diethylene glycol [25], ethylene glycol [26], 2-methoxyethanol with monoethanolamine [27], and hydroxides, are often required to obtain ZnO nanopowders [28,29,30,31].
An innovative environmentally friendly route to produce high-activity catalyst nanoparticles in a controlled manner is the supercritical anti solvent (SAS) precipitation [32,33,34], which is the most effective micronization technique based on the use of supercritical carbon dioxide (scCO2) as an antisolvent. In particular, the SAS process is based on the following main prerequisites: scCO2 has to be completely miscible with the liquid solvent used during the process, whereas the solute to be micronized has to be soluble in the selected solvent and insoluble in the mixture solvent/scCO2 [35,36]. The very fast diffusion of scCO2 into the liquid solvent produces the supersaturation of the solute leading to its precipitation in form of nanoparticles. This phenomenon, in addition to the quasi-zero surface tension of scCO2, allows one to obtain particles of smaller size with a narrow PSD with respect to the traditional micronization techniques. Another advantage of the application of the SAS technique to produce catalysts is the decreased use of toxic and polluting solvents, which lowers the environmental impact of long-term catalyst preparation. In addition to this, conventional methods of catalysts synthesis often involve obtaining not completely pure catalysts due to the organic residues.
It is worthwhile to note that, as far as we know, only two papers were focused on the preparation by SAS process of TiO2 to be used as photocatalyst [37,38]. Therefore, the effectiveness of SAS precipitation for photocatalytic applications is still unexplored.
For this reason, for the first time, in this work the use of zinc acetate nanoparticles produced by SAS technique as precursor of ZnO photocatalyst was attempted. The optimization of the calcination conditions and photocatalytic tests for the removal of an organic dye from aqueous solutions were carried out. In detail, crystal violet (CV) was chosen as the model dye, being one of the main widespread dying agents and because of its related toxicity [39,40].

2. Results

2.1. Characterization of ZnAc Nanoparticles by SAS Technique

Zinc acetate (ZnAc) nanoparticles were produced by the SAS technique according to the results obtained in a previous work [41] focused on the micronization of ZnAc. In detail, selecting dimethylsulfoxide (DMSO) as liquid solvent, SAS experiments were performed using a flow rate of the liquid solution and of CO2 equal to 1 mL × min−1 and 30 g × min−1, respectively. Moreover, the operating temperature and pressure were set at 40 °C and 150 bar, whereas a concentration of ZnAc in DMSO equal to 15 mg × mL−1 was chosen. DMSO is one of the best solvents used for SAS process, as shown by SAS literature; in particular, in this specific case, the use of DMSO allowed us to respect the basic hypotheses of the supercritical antisolvent precipitation: ZnAc powder is recovered in the precipitator at the end of the SAS experiment and not extracted by scCO2.
The field emission scanning electron microscope (FESEM) analyses revealed that unprocessed ZnAc is characterized by very large crystals, whose surface is shown in Figure 1a; whereas, SAS processed ZnAc is formed by nanoparticles (Figure 1b) with a mean diameter of about 54.5 ± 11.5 nm.
Fourier transform infrared spectroscopy (FT-IR) analyses were also performed for unprocessed and SAS processed ZnAc. The obtained results are reported in Figure 2. The comparison of the corresponding spectra demonstrated that some changes occurred in the powders after the SAS process, probably due to a carbonation process that occurred in the presence of CO2 [41]. However, this modification was not significant to produce the ZnO photocatalyst, since a thermal decomposition step was necessary after the ZnAc micronization process.
Moreover, specific surface area (SSA) was measured using the Brunauer, Emmett, and Teller (BET) equation for unprocessed and SAS processed ZnAc. In particular, an increase of the SSA after the SAS process from 3 m2 × g−1 to 20 m2 × g−1 was observed. As can be seen from the FESEM results (Figure 1), the increase of SSA could be attributed to the lower value of ZnAC particle size obtained by the SAS technique.

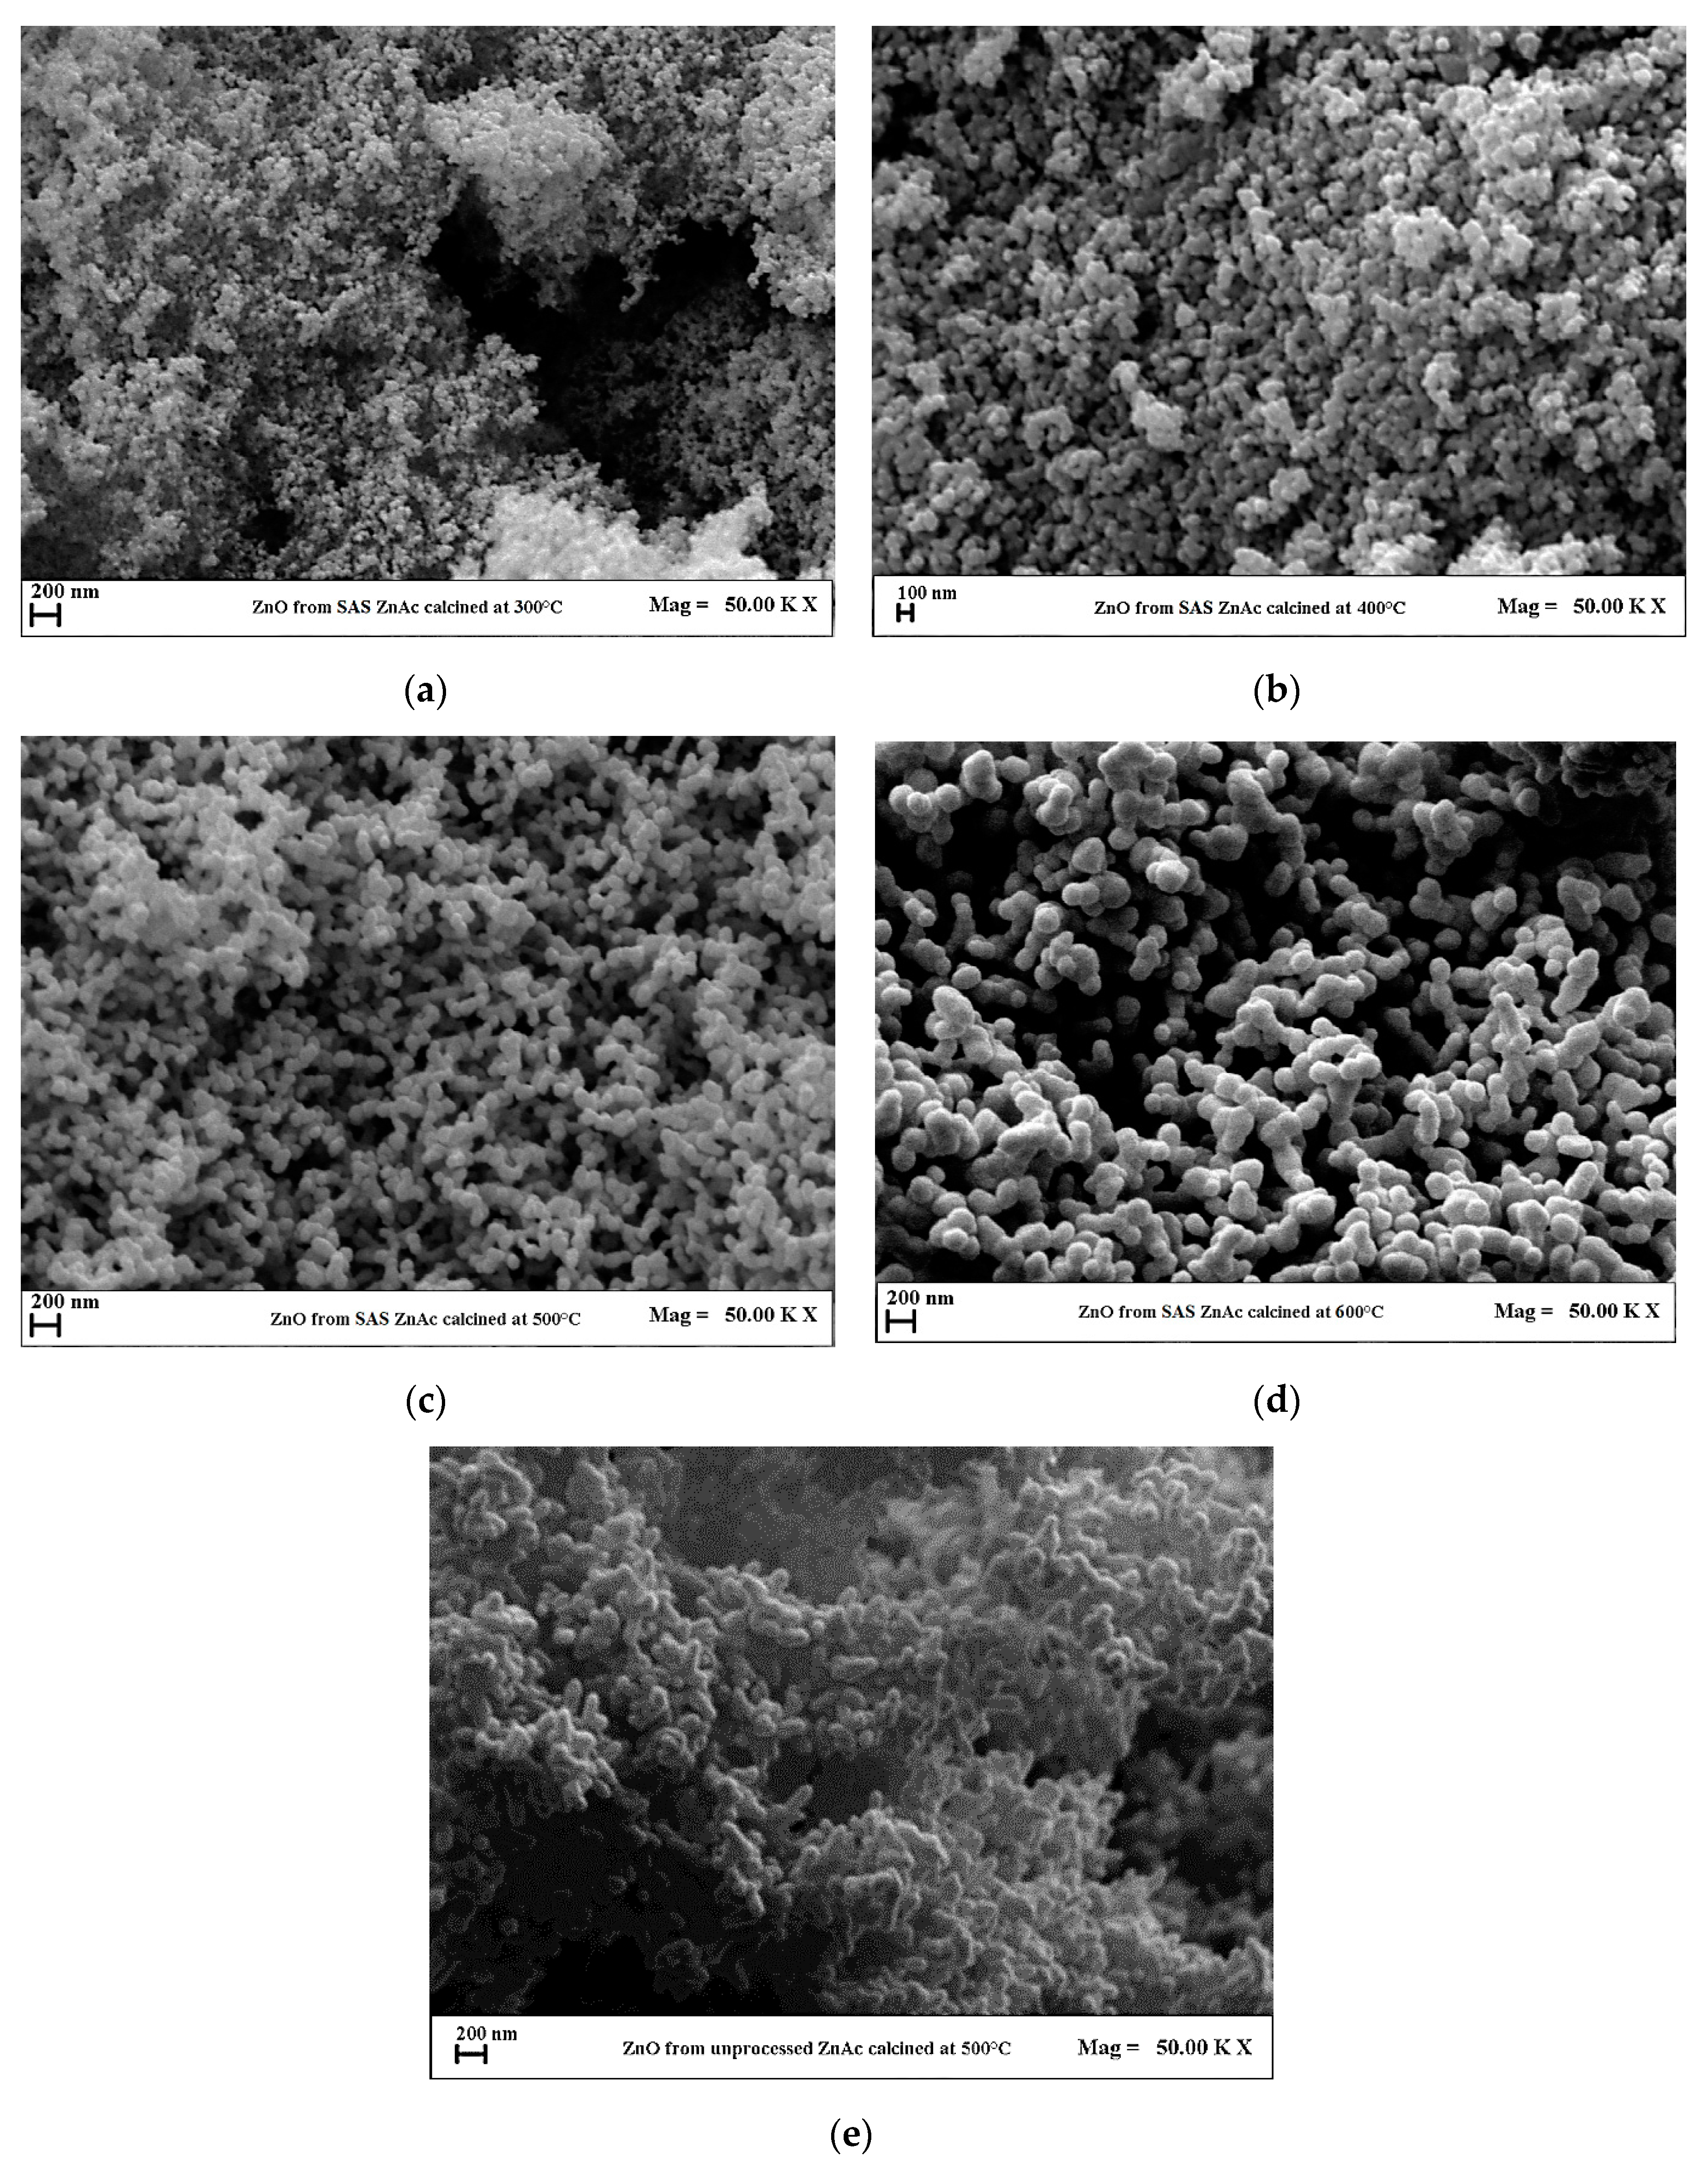
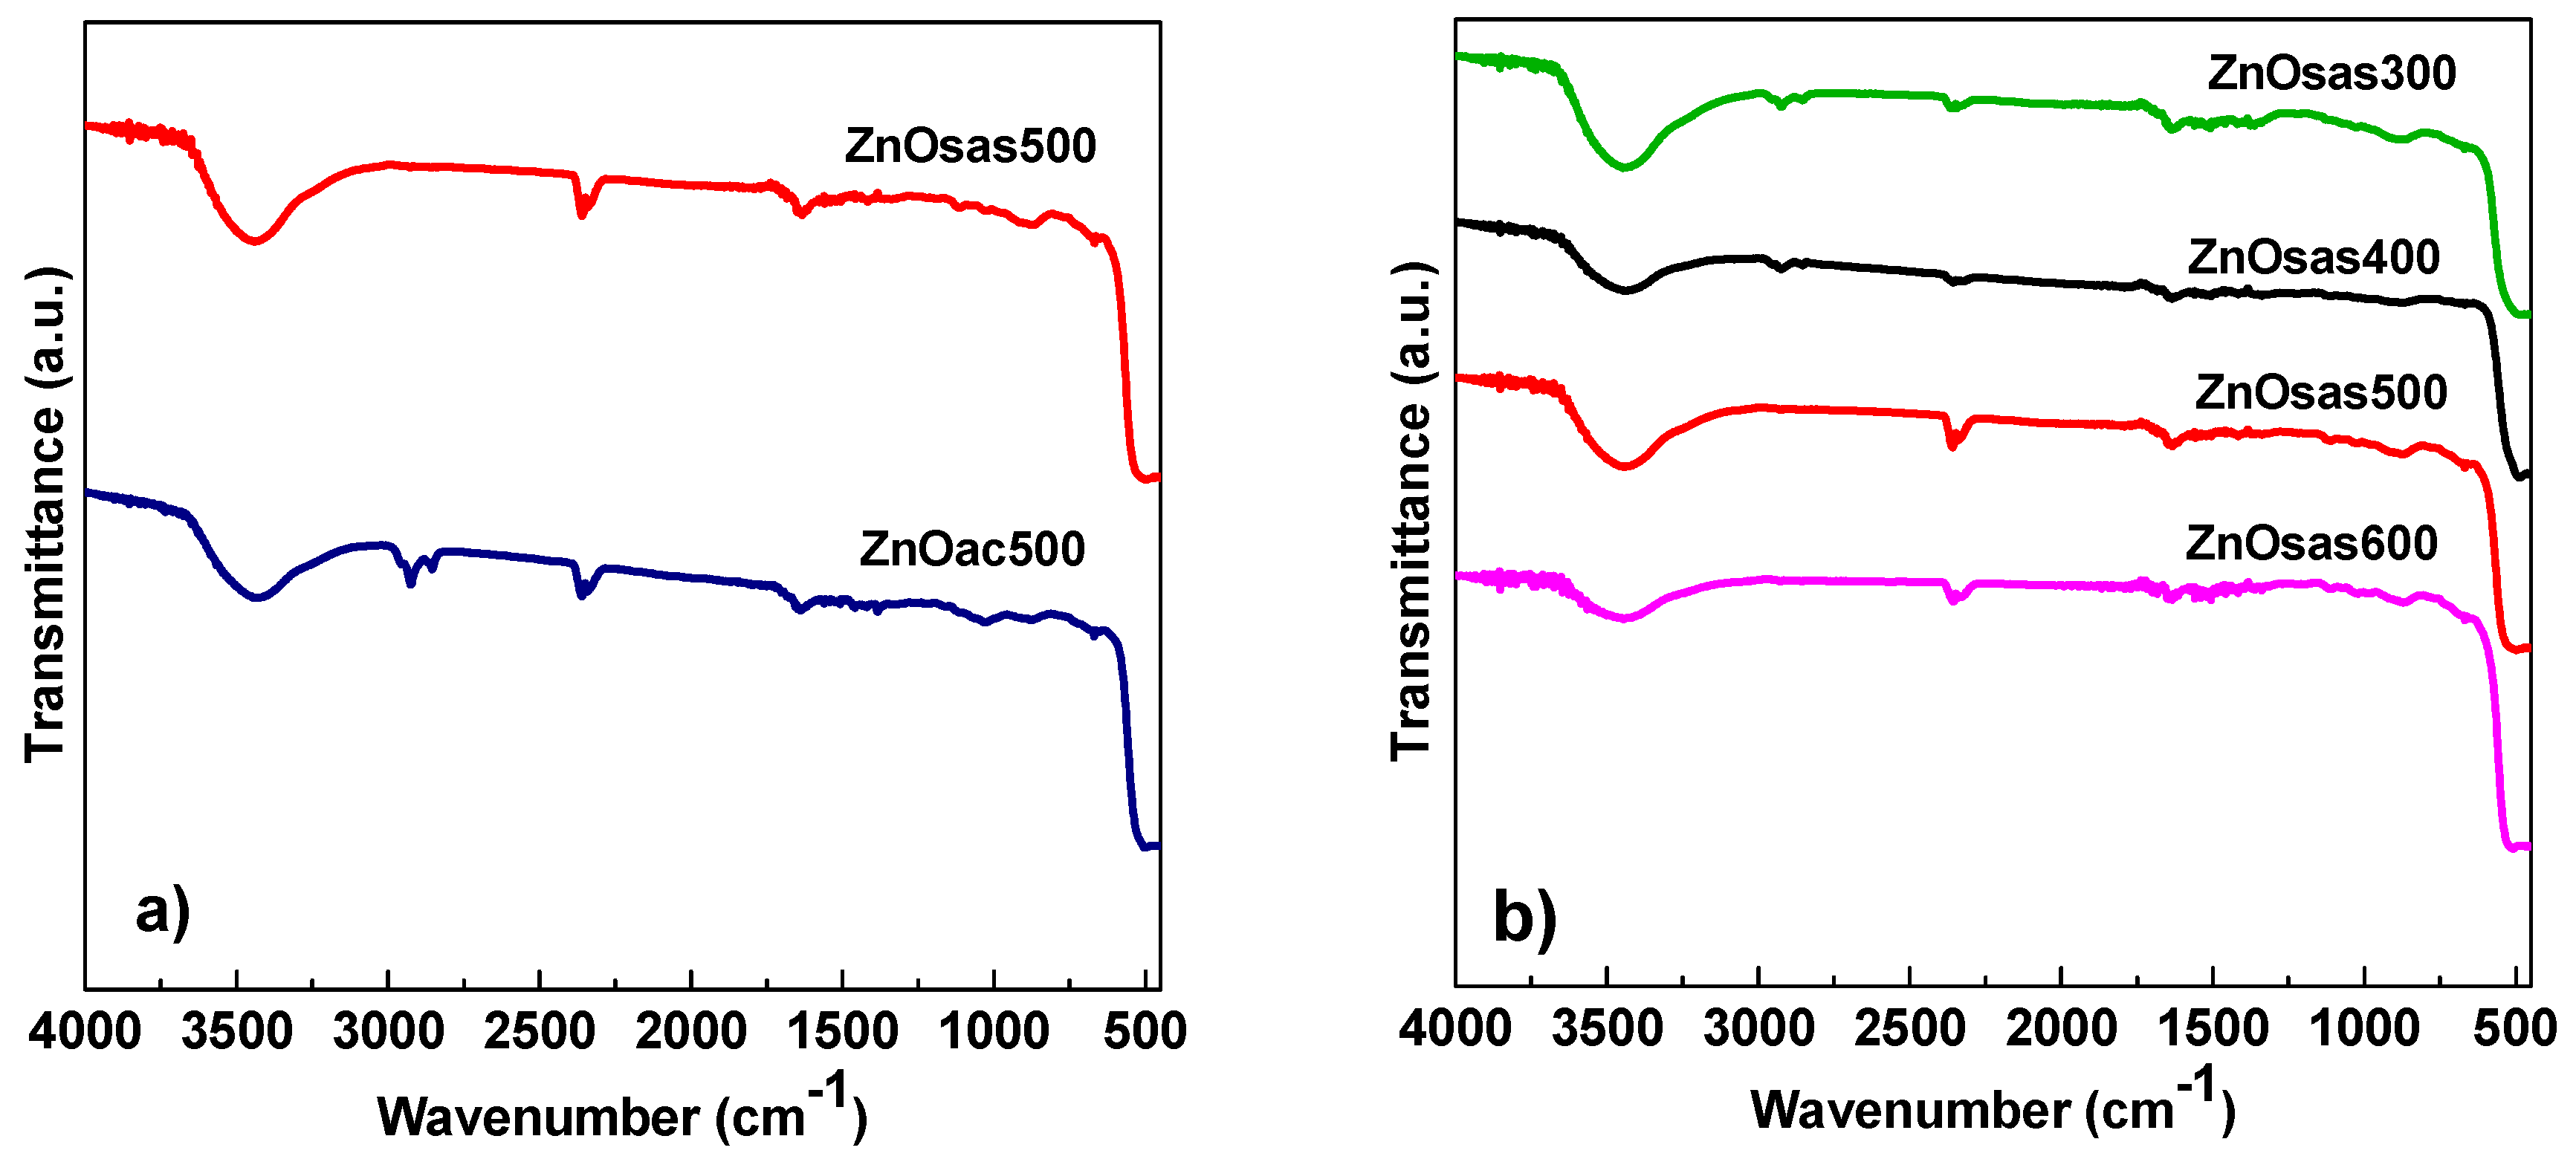
2.2. Characterization of ZnO Photocatalysts

With the aim of obtaining zinc oxide, ZnAc nanoparticles produced by SAS were calcined at different temperatures (300, 400, 500, and 600 °C) to investigate the effect of different calcination conditions, which can strongly influence the characteristics of the samples [42]. Moreover, in order to do a comparison, unprocessed ZnAc was also calcined at 500 °C to evaluate the potential of SAS process in the preparation of a ZnO photocatalyst.
A summary of the samples calcined at different temperatures is reported in Table 1 with the indication of the calcination temperature (Tc), morphology, mean diameter (m.d.), and standard deviation (s.d.) of particles, in addition to SSA and band-gap energy values.
FESEM images of the various ZnO samples are reported in Figure 3. It can be observed that ZnO obtained from unprocessed ZnAc was characterized by irregular tetrapods (Figure 3d). On the contrary, ZnO produced from SAS processed ZnAc showed in any case a regular nanometric structure (Figure 3a–d) with a mean diameter that increased by increasing the calcination temperature, probably due to the sintering phenomena. In particular, slightly coalescing nanoparticles were observed when ZnO was obtained with a calcination temperature of 600 °C.
The SSA of all the prepared ZnO samples is also reported in Table 1. From the BET measurement, it is evident that the ZnO sample obtained from the calcination of ZnAC micronized by the SAS technique at 500 °C (ZnOsas500) showed a higher specific surface area (12 m2 × g−1) than the one obtained from the unprocessed ZnAc sample obtained with the same calcination temperature (ZnOac500), being equal to 5 m2 × g−1. It is important to underline that generally a larger surface area offers more active adsorption sites that are catalytically active, which means that a higher surface area could result in a higher photocatalytic activity [43].
In order to identify the characteristic groups of zinc oxide, ZnO samples were analyzed by FT-IR spectroscopy as shown in Figure 4. According to the literature [44], in any case, FT-IR spectra of ZnO samples exhibited a peak at about 3450 cm−1 assigned to the vibrations of O-H and the bands attributed to the stretching vibrations of Zn-OH and Zn-O at about 900 cm−1 and 450 cm−1, respectively. The only difference was the presence of the strong peak related to the symmetric valency band of C-H at about 3000 cm−1 in the spectrum of ZnO from unprocessed ZnAc (ZnOac500). This peak was less evident in ZnO prepared from SAS ZnAc calcined at 300 and 400 °C and it seemed to completely disappear when SAS ZnAc nanoparticles were calcined at 500 and 600 °C (Figure 4b), probably as a result of a better removal of the organic parts due to the higher specific surface area. This achievement confirmed that the SAS micronization allowed production of very pure ZnO catalysts even at lower calcination temperatures. The Raman spectra of all ZnO samples in the range 200–2000 cm−1 are shown in Figure 5. All prepared ZnO samples, in the range 200–1200 cm−1 showed six main bands at 275, 333, 380.9, 436, 581, and 1150 cm−1, related to the zinc oxide [45]. The main band observed at 436 cm−1 corresponded to the non-polar optical phonons E2 (high) mode of ZnO in wurtzite ZnO form [46]. The features located at 333 and 380.9 cm−1 corresponded to the multi-phonon scattering process E2H–E2L and A1 (TO) phonons of ZnO crystal, respectively [13], while the peak at 581 cm−1 corresponded to E1 (LO) mode. The low intense bands in the range 1025–1200 cm−1 were attributed to the optical overtones and associated with the second-order Raman active modes of ZnO [47]. In the range 1200–2000 cm−1 the sample ZnOac500 showed strong Raman signals associated to the bending vibration of water at 1650 cm−1, to the symmetric and antisymmetric C-O vibrations as well as to two CH3 deformations (Figure 5a) [47]. It is important to underline that these bands almost disappeared when SAS ZnAc nanoparticles were calcined at 500 °C (ZnOsas500).
The optical properties (Figure 6) and electronic band gap energies (Table 1) of ZnO samples were analyzed using UV-Vis DRS spectroscopy. The reflectance spectrum of the two ZnO samples calcined at the same temperature (500 °C) exhibited a different trend (Figure 6a). In particular, the ZnOsas500 sample showed a decrease of the reflectance values from 440 nm while the absorption onset of ZnOac500 sample was lower and equal to 410 nm. This red shift may be attributed to the increase of agglomeration size occurring in the samples [48,49,50,51]. In fact, as previously observed from the FESEM images, the ZnOac550 sample appeared as nano tetrapods with mean size almost equal to 181 nm while the sample ZnOsas500 had a regular nanometric structure with mean size almost equal to 65 nm. Figure 6b shows the effect of calcination temperature on the reflectance spectrum of ZnO samples. Additionally, in this case, the trend was in good agreement with the mean size particles as evidenced from FESEM analysis; the increase of particles size (from 35 to 156 nm) due to the calcination temperature led to a little red shift of the absorption onset [51]. Based on the reflectance data, the optical band gap energy of the samples was measured by the extrapolation of the linear portion of the graph between the modified Kubelka-Munk function (F(R) × h × ν)2 versus the photon energy (h × ν); the obtained values are reported in Table 1. The optical band gap values were about 3.17 eV for ZnOac500 and 3.10 eV for ZnOsas500, confirming that the optical band gap of ZnO could be tuned by using different synthesis techniques [52]. In addition, the calcination temperature slightly influenced the band gap value that was equal to 3.12 eV (for ZnOsas300), 3.07 eV (for ZnOsas400), 3.10 eV (for ZnOsas500), and 3.15 eV (for ZnOsas600). Despite the calcination temperature inducing differences in the ZnO crystallinity [43], in our case, it could be argued that the increase of particle size with the increase of calcination temperature possessed low impact in the crystalline structure of ZnO and therefore, the defects were likely quite similar [53]. This probably induced no significantly differences in the UV absorption edge and, as a consequence, the band gap energy values were similar for the samples calcined at different temperature [53].

2.3. Photocatalytic Activity Results

Figure 7 shows the photocatalytic results of CV degradation using the ZnOac500 and ZnOsas500 samples under UV irradiation.
At irradiation times lower than 60 min, the C/C0 values for ZnOsas500 were always lower than the values observed for the ZnOac500 sample. Therefore, the photocatalytic activity results evidenced that the best CV decolorization performances were achieved using the ZnOsas500 sample, leading to the almost total CV decolorization after 60 min of UV irradiation. It is worthwhile to note that, in the case of ZnOac500 sample, an irradiation time noticeably higher (180 min) was necessary to reach the complete CV decolorization.
With the aim to analyze the influence of zinc acetate nanoparticles produced by SAS technique as precursor for ZnO particles, the photocatalytic activity data of ZnOac500 and ZnOsas500 were discussed considering the characterizations results. As pointed out above, the SAS technique is able to produce ZnAc nanoparticles having a surface area of 20 m2 × g−1, whereas unprocessed ZnAc is characterized by very large crystals, whose SSA is significantly lower, being equal to 3 m2 × g−1. These differences influenced the properties of ZnO obtained after the thermal treatment of SAS ZnAc and unprocessed ZnAc particles at 500 °C. In particular, FESEM results showed that the ZnOsas500 sample had a lower particle size and a higher SSA with respect to ZnOac500, which also showed a morphology characterized by irregular tetrapods. These features could explain the superior photocatalytic performances of the ZnOsas500 sample. In fact, it has been reported that, in most cases, the enhancement of photocatalytic activity is linked to the increase in SSA values that occurs when the nanoparticles become smaller [54,55], leading also to the fast charge migration from bulk to the surface of the photocatalyst since ZnOsas500 particles are regular in structure (Figure 3) [56]. However, it must be taken into account that, as shown in the FT-IR and Raman spectra, ZnOac500 showed the presence of organic impurities that instead were totally absent for the ZnOsas500 sample. Since the CV degradation typically depends on the charge transfer process at photocatalyst interface, the presence of surface organic impurity may negatively affect the photocatalytic performances [57]. In particular, the organic impurities in contact with photocatalyst surface could act as radical scavengers, influencing the charge recombination process [57,58] and hence worsening the photocatalytic activity of ZnOac500 with respect to ZnOsas500 photocatalyst. It is worthwhile to note that the photocatalytic performances achieved with ZnOsas500 photocatalyst were better than those reported in some research papers dealing with the photocatalytic degradation of CV dye using ZnO nanoparticles under UV irradiation [59,60]. In particular, it was evidenced that the complete CV decolorization was achieved for irradiation times generally higher than 80 min.
The effect of calcination temperature (Figure 8) on ZnAc micronized by the SAS technique was also investigated both in terms of CV decolorization (Figure 8a) and total organic carbon (TOC) removal (Figure 8b). Intentionally, TOC was analyzed together with the CV decolorization, since the rational pollutants abatement in aqueous matrices should involve also its complete mineralization rather than its transformation to other species, which could be more toxic than the initial molecule [61]. It is worthwhile to note that, within 60 min of UV irradiation, ZnOsas500 achieved total CV decolorization with a TOC removal equal to about 92% after 120 min, showing, therefore, the best photocatalytic performance under UV light. Moreover, it was possible to observe that the photocatalytic activity of the calcined ZnOsas samples increased with the increase in the calcination temperature up to 500 °C. Despite ZnOsas300 and ZnOsas400 being characterized by a higher SSA and lower particle size (Table 1) than ZnOsas500, the lower photocatalytic activity for the photocatalysts calcined at 300 and 400 °C could be ascribed to the presence of organic impurities (as observed from FT-IR spectra) that were instead absent in the sample calcined at 500 °C. On the other hand, the decrease of the photocatalytic activity observed for the ZnOsas600 sample could be due to the decrease of SSA and the increase of particle size (Table 1) with respect to ZnOsas500. In summary, the photocatalytic results showed an optimum calcination temperature able to assure the best photocatalytic performances towards the CV removal from aqueous solutions (almost total CV decolorization after 60 min).

3. Materials and Methods

3.1. Materials

Zinc acetate (ZnAc, purity ≥99%) and crystal violet (CV, purity ≥90%) were supplied by Sigma Aldrich (St. Louis, MO, USA). Dimethylsulfoxide (DMSO, purity 99.8%) was purchased from Carlo Erba (Milan, Italy). CO2 (purity 99%) was supplied by Morlando Group s.r.l. (Naples, Italy).

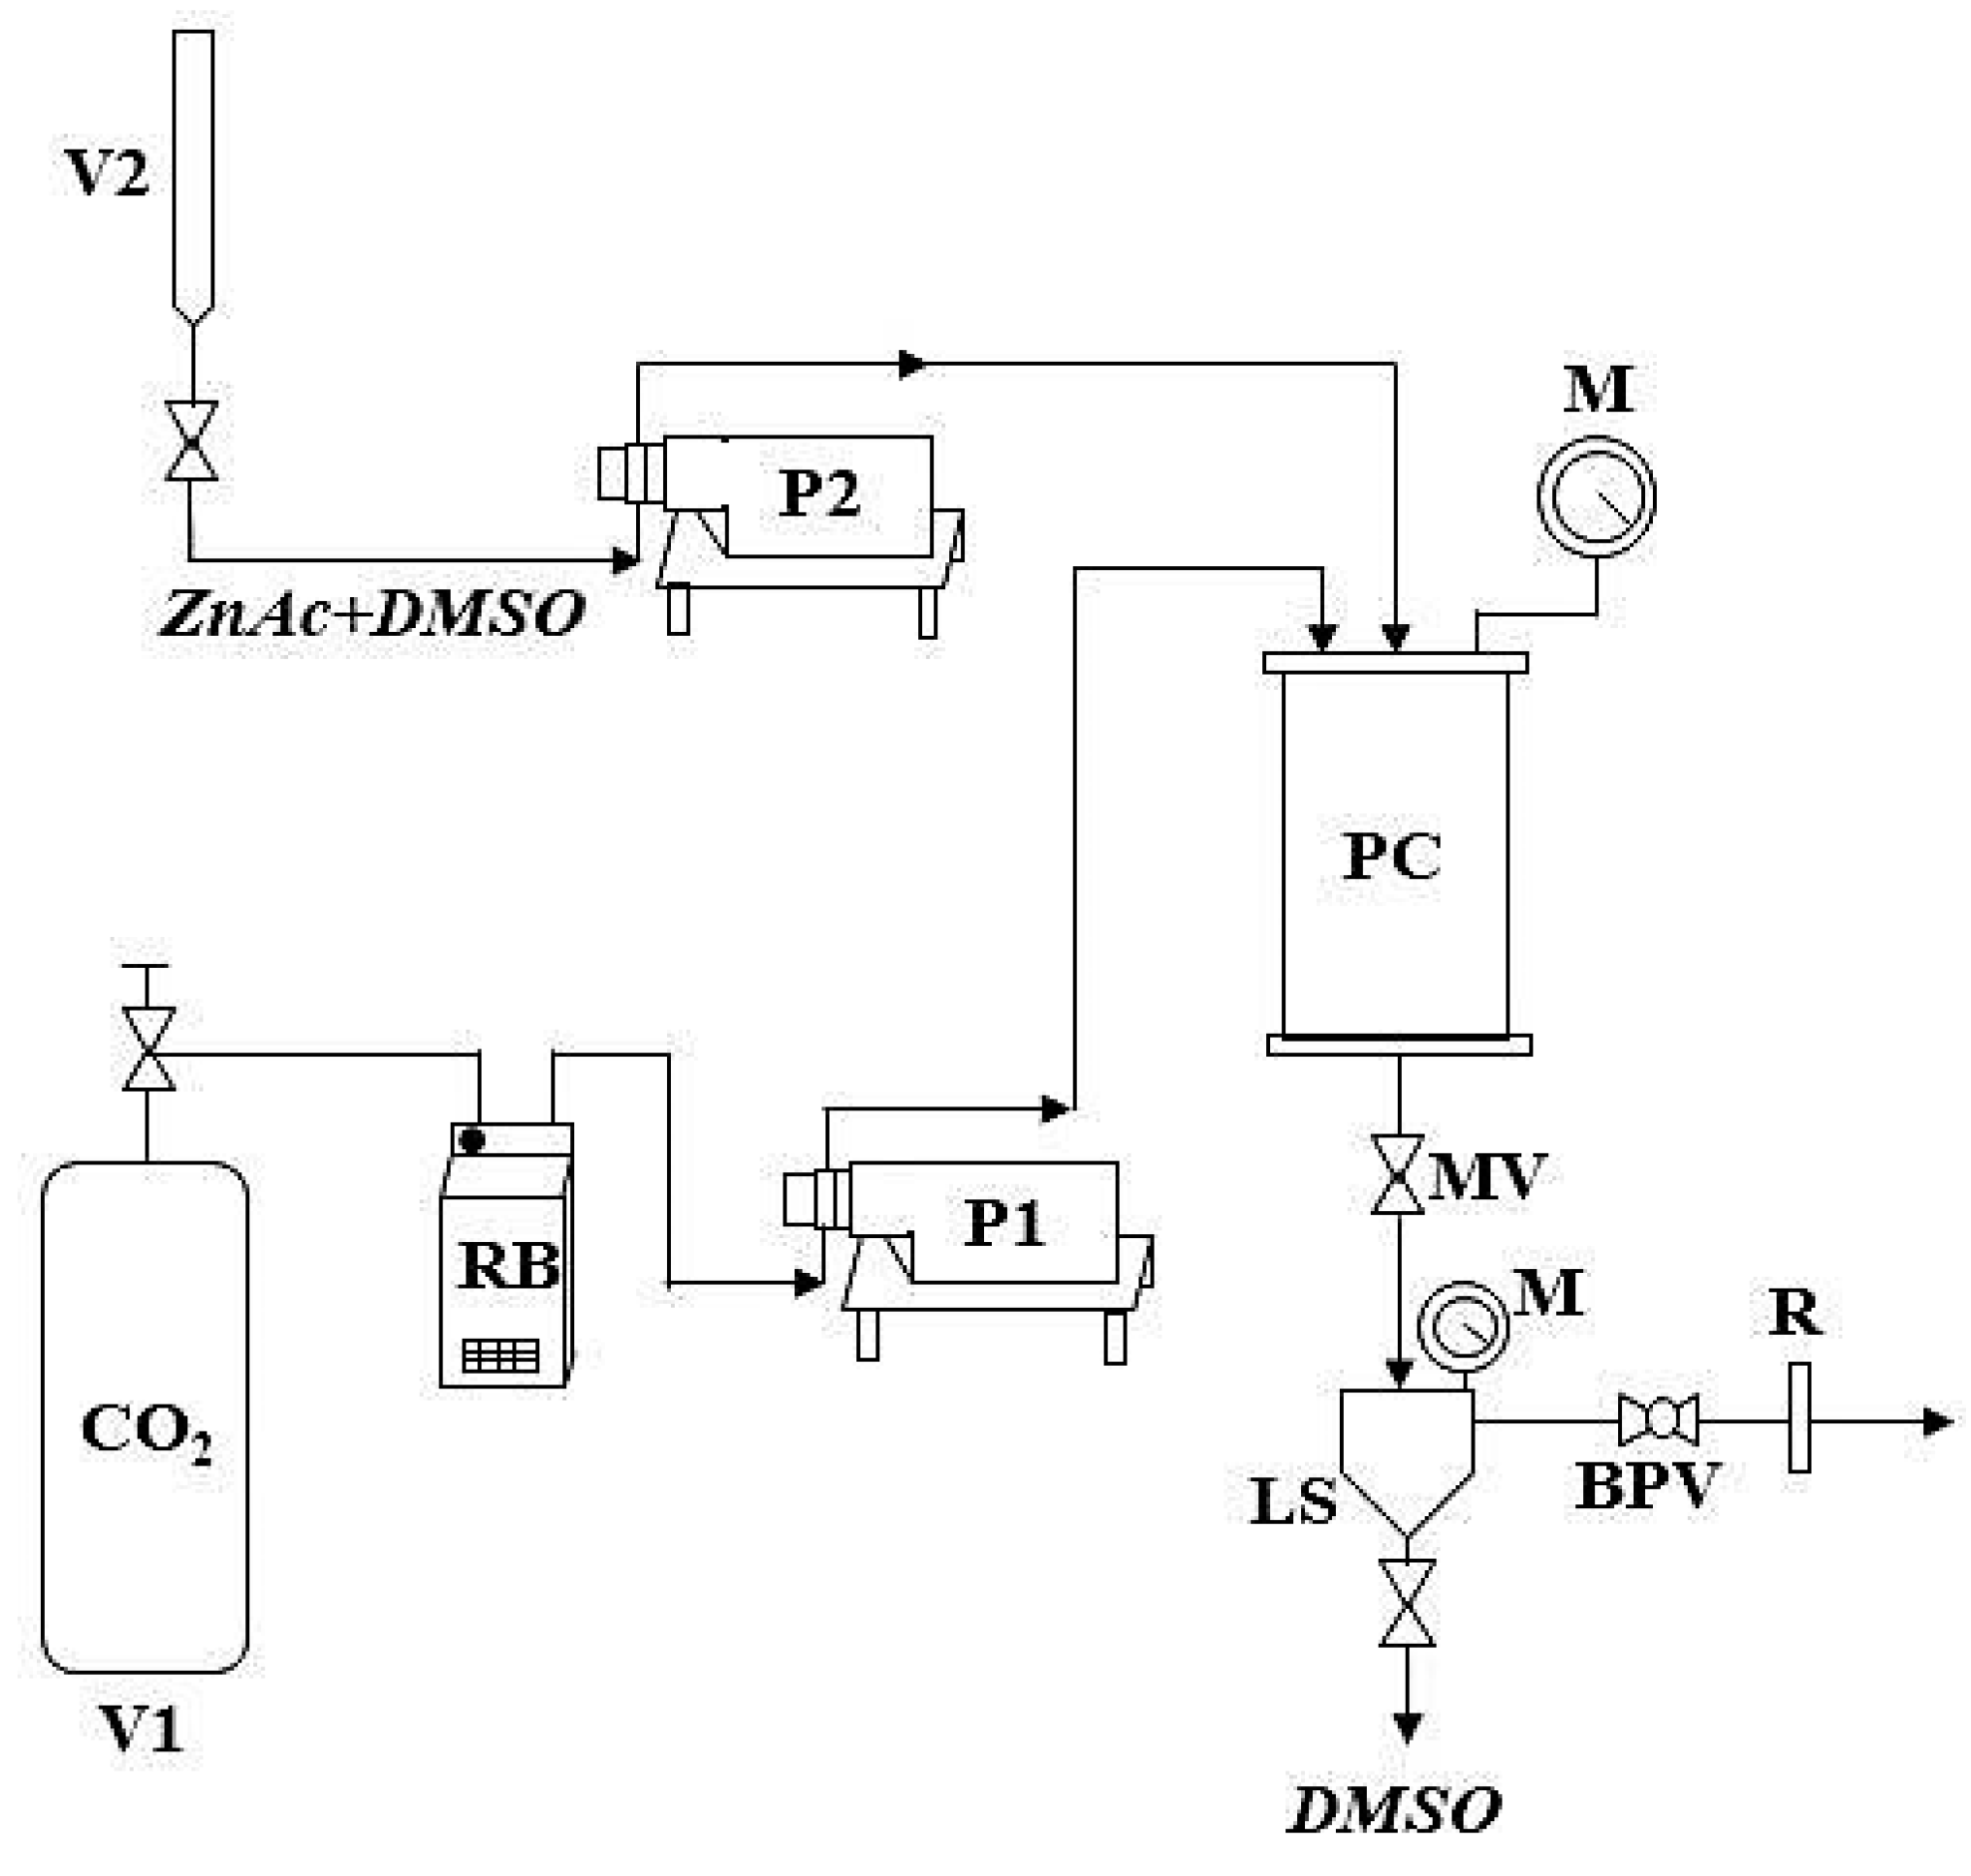
3.2. Micronization of ZnAc by SAS Technique and Preparation of ZnO Photocatalysts

ZnAc nanoparticles were produced by means of the SAS process. The homemade laboratory plant is sketched in Figure 9. The heart of the process is the precipitation chamber (PC), a cylindrical vessel with an internal volume equal to 500 cm3. Two high-pressure pumps P1 and P2 allow to feed, respectively, the CO2 (antisolvent) from the tank V1 and the liquid solution (DMSO + ZnAc) contained in a burette (V2). In particular, the liquid solution is injected in the precipitation chamber through a stainless steel nozzle with an internal diameter of 100 µm. Instead, the CO2 is pre-cooled through a refrigerating bath (RB) and, after a preheating, it is delivered to the chamber. The pressure in the PC is measured by a test gauge manometer (M) and regulated by a micrometering valve (MV). The operating temperature inside the chamber is ensured by a proportional integral derivative (PID) controller connected with electrically thin bands. A stainless steel filter, characterized by pores with a diameter of 0.1 μm, is located at the bottom of the PC to collect the precipitated powders and to permit the CO2-solvent mixture to pass through. Then, the liquid solvent is recovered in a second collection vessel (LS), whose pressure (approximately 20 bar) is regulated by a backpressure valve (BPV). The flow rate of CO2 and its total quantity delivered are measured by a rotameter (R) and a dry test meter, respectively.
A typical SAS experiment begins by sending the CO2 to the precipitation chamber until the desired pressure and temperature are reached. After, pure solvent (DMSO) is injected through the nozzle up until a quasi-steady state composition of solvent and antisolvent is achieved within the chamber. Finally, the liquid solution, containing the solute to be micronized, is fed through the nozzle, leading to the precipitation of the solute. At the end of the solution injection, CO2 continues to flow to completely remove the solvent residues. After this washing step, the CO2 pumping is stopped, and the precipitation chamber is slowly depressurized up to the atmospheric pressure. Thus, the precipitated powders are collected and characterized.
In order to obtain zinc oxide, ZnAc precursor prepared through SAS micronization was calcined in a muffle furnace at different temperatures (i.e., at 300, 400, 500, and 600 °C) to study the effect of different calcination conditions. In all cases, ZnAc was calcined for 2 h in air with a heating rate equal to 2 °C × min−1. Moreover, a comparison with a zinc oxide prepared by the calcination at 500 °C of unprocessed ZnAc (ZnOac500) was also performed to evaluate the effectiveness of the SAS technique in the production of ZnO photocatalyst.

3.3. Photocatalytic Tests

The photocatalytic tests were conducted in a cylindrical pyrex photoreactor (ID = 2.6 cm, LTOT = 41 cm, and VTOT = 200 mL, Microglass Heim Srl, Naples, Italy). The photoreactor was equipped with an air distributor device (Qair = 150 cm3 × min−1) and a peristaltic pump (Watson Marlow, Falmouth, United Kingdom) to maintain continuous recirculation of the suspension inside the reactor. A UV-LEDs strip (nominal power: 12 W, provided by LEDlightinghut (Shenzhen, China) emitting at 365 nm) was positioned around and in contact with the external body of the photoreactor in order to irradiate the volume of the solution uniformly. The initial CV concentration was 10 mg × L−1 while the solution volume, at the spontaneous pH (about 5.5), was 100 mL. A catalyst amount of 0.15 g was employed for the tests.
Before the irradiation, the suspension was left in dark conditions for 240 min to provide the adsorption/desorption equilibrium on the photocatalyst surface and, after this step, the photocatalytic test was begun by switching on the LEDs, and the overall irradiation time was 180 min. At fixed run time, almost 2 mL of liquid samples were withdrawn from the photoreactor and the residual CV concentration was analyzed through a UV-Vis spectrophotometer (Thermo Evolution 201, Thermo Fisher Scientific, Waltham, MA, USA) at the wavelength of 583 nm [3]. The total organic carbon (TOC) of the solutions as a function of irradiation time was measured by the high temperature combustion method described in our previous work [62].

3.4. Chemical-Physical Characterization Methods

A field emission scanning electron microscope (FESEM, mod. LEO 1525, Carl Zeiss SMT AG, Oberkochen, Germany) was used to observe the morphology of powders that were previously dispersed on a carbon tab stuck to an aluminum stub (Agar Scientific, Stansted, United Kingdom) and then coated with gold-palladium (layer thickness 250 Å) using a sputter coater (mod. 108 A, Agar Scientific). Considering approximately 1000 particles, mean diameter and standard deviation of particles were measured from FESEM images using the Sigma Scan Pro image analysis software (v5.0, Aspire Software International, Ashburn, VA, USA).
Fourier transform infrared (FT-IR) spectra were obtained via M2000 FT-IR (MIDAC Co, Costa Mesa, CA, USA), at a resolution of 0.5 cm−1. The scan wavenumber range was 4000–450 cm−1, and 16 scan signals were averaged to reduce the noise. Powder samples were well mixed with potassium bromide (KBr), which was used as the infrared transparent matrix. The discs, containing about 1 mg of sample and 100 mg of KBr, were prepared by compressing the powders through a hydraulic press. Laser Raman spectra were obtained at room temperature with a Dispersive MicroRaman (Invia, Renishaw, Wotton-under-Edge, United Kingdom), equipped with 514 nm laser, in the range of 100–2000 cm−1 Raman shift. The ultraviolet-visible diffuse reflectance spectra (UV-Vis DRS) of the samples were recorded using a Perkin Elmer spectrometer Lambda 35 spectrophotometer (Waltham, MA, USA) using an RSA-PE-20 reflectance spectroscopy accessory (Labsphere Inc., North Sutton, NH, USA). The band gap values of the samples were determined through the corresponding Kubelka-Munk function (KM) (which is proportional to the absorption of radiation) and by plotting (KM × h × ν2) against h × ν. The Brunauer, Emmett, and Teller (BET) surface area of the samples was measured from dynamic N2 adsorption measurement at −196 °C, performed by a Costech Sorptometer 1042 (Costech International S.p.A., Milan, Italy) after pre-treatment for 30 min in He flow at room temperature for the unprocessed and SAS processed ZnAC and at 150 °C for all the calcined samples.

4. Conclusions

This work studied the synthesis of ZnO photocatalyst from thermal decomposition of zinc acetate (ZnAc) nanoparticles obtained by the supercritical antisolvent (SAS) precipitation method under different calcination conditions (in the range 300–600 °C). The prepared photocatalysts were tested in the photocatalytic removal of crystal violet dye (CV) under UV irradiation. It was observed that the SAS technique was able to produce ZnAc in a regular nanometric structure (with a mean diameter of about 54.5 ± 11.5 nm) having a surface area of 20 m2 × g−1, whereas unprocessed ZnAc was characterized by very large crystals, whose specific surface area (SSA) was significantly lower and equal to 3 m2 × g−1. These differences influenced the properties of ZnO obtained after the thermal treatment of SAS ZnAc and unprocessed ZnAc particles. In fact, morphological analysis showed that the ZnO samples synthetized by thermal treatment at 500 °C of SAS ZnAc were characterized by a lower particle size (mean diameter: 65.0 ± 14.5 nm) and a higher SSA (12 m2 × g−1) with respect to the sample obtained by thermal treatment of unprocessed ZnAc particles, which showed a morphology characterized by irregular tetrapods with mean size equal to 181.1 ± 65.5 nm and SSA equal to 5 m2 × g−1. Moreover, spectroscopic studies showed that organic impurities totally disappeared for the sample calcined at 500 °C (ZnOsas500 sample). These features could explain the superior photocatalytic performances (complete CV decolorization in 60 min of UV irradiation time and a mineralization degree higher than 90% after 120 min of treatment time) of the ZnOsas500 sample with respect to the ZnO obtained from unprocessed ZnAc particles and with respect to the samples obtained at 300 and 400 °C calcination temperature. Finally, a higher calcination temperature (600 °C) induced a worsening of the photocatalytic performances due to the decrease of SSA and the increase of particle size with respect to ZnOsas500.

Author Contributions

O.S. and P.F. performed the experiments and wrote the manuscript. V.V. and I.D.M. provided the concept, experimental design of the study and reviewed the paper prior to submission. All authors discussed the results, analyzed the data, commented on and revised the manuscript.

Funding

This research received no external funding.

Conflicts of Interest

The authors declare no conflict of interest.

References

  1. Nagaveni, K.; Sivalingam, G.; Hegde, M.S.; Madras, G. Solar photocatalytic degradation of dyes: High activity of combustion synthesized nano TiO2. Appl. Catal. B 2004, 48, 83–93. [Google Scholar] [CrossRef]
  2. Vacchi, F.I.; de Souza Vendemiatti, J.A.; da Silva, B.F.; Zanoni, M.V.B.; Umbuzeiro, G.d.A. Quantifying the contribution of dyes to the mutagenicity of waters under the influence of textile activities. Sci. Total Environ. 2017, 601–602, 230–236. [Google Scholar] [CrossRef]
  3. Sacco, O.; Matarangolo, M.; Vaiano, V.; Libralato, G.; Guida, M.; Lofrano, G.; Carotenuto, M. Crystal violet and toxicity removal by adsorption and simultaneous photocatalysis in a continuous flow micro-reactor. Sci. Total Environ. 2018, 644, 430–438. [Google Scholar] [PubMed]
  4. Muhd Julkapli, N.; Bagheri, S.; Bee Abd Hamid, S. Recent advances in heterogeneous photocatalytic decolorization of synthetic dyes. Sci. World J. 2014, 2014, 692307. [Google Scholar] [CrossRef] [PubMed]
  5. Ghaffar, A.; Zhang, L.; Zhu, X.; Chen, B. Porous pvdf/go nanofibrous membranes for selective separation and recycling of charged organic dyes from water. Environ. Sci. Technol. 2018, 52, 4265–4274. [Google Scholar] [CrossRef]
  6. Pal, B.; Kaur, R.; Grover, I.S. Superior adsorption and photodegradation of eriochrome black-t dye by Fe3+ and Pt4+ impregnated TiO2 nanostructures of different shapes. J. Ind. Eng. Chem. 2016, 33, 178–184. [Google Scholar] [CrossRef]
  7. Ong, S.-T.; Cheong, W.-S.; Hung, Y.-T. Photodegradation of commercial dye, methylene blue using immobilized Ti2. In Proceedings of the 4th International Conference on Chemical, Biological and Environmental Engineering, Phuket, Thailand, 1–2 September 2012. [Google Scholar]
  8. Sacco, O.; Vaiano, V.; Han, C.; Sannino, D.; Dionysiou, D.D. Photocatalytic removal of atrazine using N-doped TiO2 supported on phosphors. Appl. Catal. B 2015, 164, 462–474. [Google Scholar] [CrossRef]
  9. Liu, F.-Y.; Li, B.-H.; Xu, Y.-S. Overview on heterogeneous photocatalytic degradation of organic contaminants in wastewater on semiconductors. Guangzhou Huaxue 2001, 26, 44–51. [Google Scholar]
  10. Sacco, O.; Vaiano, V.; Rizzo, L.; Sannino, D. Photocatalytic activity of a visible light active structured photocatalyst developed for municipal wastewater treatment. J. Cleaner Prod. 2018, 175, 38–49. [Google Scholar] [CrossRef]
  11. Rajamanickam, D.; Shanthi, M. Photocatalytic degradation of an organic pollutant by zinc oxide—Solar process. Arabian J. Chem 2016, 9, S1858–S1868. [Google Scholar]
  12. Akkari, M.; Aranda, P.; Belver, C.; Bedia, J.; Ben Haj Amara, A.; Ruiz-Hitzky, E. ZnO/sepiolite heterostructured materials for solar photocatalytic degradation of pharmaceuticals in wastewater. Appl. Clay Sci. 2018, 156, 104–109. [Google Scholar] [CrossRef]
  13. Vaiano, V.; Matarangolo, M.; Sacco, O.; Sannino, D. Photocatalytic treatment of aqueous solutions at high dye concentration using praseodymium-doped ZnO catalysts. Appl. Catal. B 2017, 209, 621–630. [Google Scholar] [CrossRef]
  14. Ong, C.B.; Ng, L.Y.; Mohammad, A.W. A review of zno nanoparticles as solar photocatalysts: Synthesis, mechanisms and applications. Renew. Sustain. Energy Rev. 2018, 81, 536–551. [Google Scholar] [CrossRef]
  15. Vaiano, V.; Matarangolo, M.; Sacco, O. UV-LEDs floating-bed photoreactor for the removal of caffeine and paracetamol using ZnO supported on polystyrene pellets. Chem. Eng. J. 2018, 350, 703–713. [Google Scholar] [CrossRef]
  16. Cataño, F.A.; Valencia, S.H.; Hincapié, E.A.; Restrepo, G.; Marín, J.M. A comparative study between TiO2 and ZnO photocatalysis: Photocatalytic degradation of cibacron yellow FN-2R dye. Lat. Am. Appl. Res. 2012, 42, 33–38. [Google Scholar]
  17. Murcia Mesa, J.J.; Arias Bolivar, L.G.; Sarmiento, H.A.R.; Martínez, E.G.Á.; Páez, C.J.; Lara, M.A.; Santos, J.A.N.; del Carmen Hidalgo López, M. Urban wastewater treatment by using Ag/ZnO and Pt/TiO2 photocatalysts. Environ. Sci. Pollut. Res. 2019, 26, 4171–4179. [Google Scholar] [CrossRef] [PubMed]
  18. Jaramillo-Páez, C.; Navío, J.A.; Hidalgo, M.C.; Macías, M. High uv-photocatalytic activity of ZnO and Ag/ZnO synthesized by a facile method. Catal. Today 2017, 284, 121–128. [Google Scholar] [CrossRef]
  19. Chen, P.K.; Lee, G.J.; Davies, S.; Masten, S.; Amutha, R.; Wu, J. Hydrothermal synthesis of coral-like au/zno catalyst and photocatalytic degradation of orange ii dye. Mater. Res. Bull. 2013, 48, 2375–2382. [Google Scholar] [CrossRef]
  20. Rokesh, K.; Jeganathan, K.; Jothivenkatachalam, K. Zinc oxide-palladium material an efficient solar-light driven photocatalyst for degradation of congo red. Nanosyst. Phys. Chem. Math. 2016, 7, 740–746. [Google Scholar] [CrossRef]
  21. Vaiano, V.; Iervolino, G.; Rizzo, L. Cu-doped ZnO as efficient photocatalyst for the oxidation of arsenite to arsenate under visible light. Appl. Catal. B 2018, 238, 471–479. [Google Scholar] [CrossRef]
  22. Vaiano, V.; Matarangolo, M.; Sacco, O.; Sannino, D. Photocatalytic removal of eriochrome blackT dye over ZnO nanoparticles doped with Pr, Ce or Eu. Chem. Eng. Trans. 2017, 57, 625–630. [Google Scholar]
  23. Fan, J.; Zhao, L.; Yu, J.; Liu, G. The effect of calcination temperature on the microstructure and photocatalytic activity of TiO2-based composite nanotubes prepared by an in situ template dissolution method. Nanoscale 2012, 4, 6597–6603. [Google Scholar] [CrossRef] [PubMed]
  24. Ul Haq, A.N.; Nadhman, A.; Ullah, I.; Mustafa, G.; Yasinzai, M.; Khan, I. Synthesis approaches of zinc oxide nanoparticles: The dilemma of ecotoxicity. J. Nanomater. 2017. [Google Scholar] [CrossRef]
  25. Zhang, J.; Zhao, B.; Pan, Z.; Gu, M.; Punnoose, A. Synthesis of zno nanoparticles with controlled shapes, sizes, aggregations, and surface complex compounds for tuning or switching the photoluminescence. Cryst. Growth Des. 2015, 15, 3144–3149. [Google Scholar] [CrossRef]
  26. Wojnarowicz, J.; Chudoba, T.; Malka, I.; Gierlotka, S.; Dworakowska, S.; Lojkowski, W. Size control mechanism of ZnO nanoparticles obtained in microwave solvothermal synthesis. Nanotechnology 2018, 29, 065601. [Google Scholar] [CrossRef] [PubMed]
  27. Lee, W.; Leem, J.-Y. Size control of ZnO nanorods using the hydrothermal method in conjunction with substrate rotation. J. Nanosci. Nanotechnol. 2017, 17, 7952–7956. [Google Scholar] [CrossRef]
  28. Kuriakose, S.; Satpati, B.; Mohapatra, S. Effects of solvent on structural, optical and photocatalytic properties of zno nanostructures. Adv. Mater. Lett. 2015, 6, 1104–1110. [Google Scholar] [CrossRef]
  29. Xu, L.; Hu, Y.-L.; Pelligra, C.; Chen, C.-H.; Jin, L.; Huang, H.; Sithambaram, S.; Aindow, M.; Joesten, R.; Suib, S.L. ZnO with different morphologies synthesized by solvothermal methods for enhanced photocatalytic activity. Chem. Mater. 2009, 21, 2875–2885. [Google Scholar] [CrossRef]
  30. Talebian, N.; Amininezhad, S.M.; Doudi, M. Controllable synthesis of ZnO nanoparticles and their morphology-dependent antibacterial and optical properties. J. Photochem. Photobiol. B 2013, 120, 66–73. [Google Scholar] [CrossRef]
  31. Belver, C.; Bedia, J.; Rodriguez, J.J. Zr-doped TiO2 supported on delaminated clay materials for solar photocatalytic treatment of emerging pollutants. J. Hazard. Mater. 2017, 322, 233–242. [Google Scholar] [CrossRef]
  32. Franco, P.; Martino, M.; Palma, V.; Scarpellini, A.; De Marco, I. Pt on SAS-CeO2 nanopowder as catalyst for the co-WGS reaction. Int. J. Hydrog. Energy 2018, 43, 19965–19975. [Google Scholar] [CrossRef]
  33. Tang, Z.-R.; Edwards, J.K.; Bartley, J.K.; Taylor, S.H.; Carley, A.F.; Herzing, A.A.; Kiely, C.J.; Hutchings, G.J. Nanocrystalline cerium oxide produced by supercritical antisolvent precipitation as a support for high-activity gold catalysts. J. Catal. 2007, 249, 208–219. [Google Scholar] [CrossRef]
  34. Marin, R.P.; Kondrat, S.A.; Davies, T.E.; Morgan, D.J.; Enache, D.I.; Combes, G.B.; Taylor, S.H.; Bartley, J.K.; Hutchings, G.J. Novel cobalt zinc oxide Fischer-Tropsch catalysts synthesised using supercritical anti-solvent precipitation. Catal. Sci. Technol. 2014, 4, 1970–1978. [Google Scholar] [CrossRef]
  35. Franco, P.; Reverchon, E.; De Marco, I. Zein/diclofenac sodium coprecipitation at micrometric and nanometric range by supercritical antisolvent processing. J. CO2 Util. 2018, 27, 366–373. [Google Scholar] [CrossRef]
  36. Reverchon, E.; De Marco, I.; Della Porta, G. Tailoring of nano- and micro-particles of some superconductor precursors by supercritical antisolvent precipitation. J. Supercrit. Fluids 2002, 23, 81–87. [Google Scholar] [CrossRef]
  37. Marin, R.P.; Ishikawa, S.; Bahruji, H.; Shaw, G.; Kondrat, S.A.; Miedziak, P.J.; Morgan, D.J.; Taylor, S.H.; Bartley, J.K.; Edwards, J.K.; et al. Supercritical antisolvent precipitation of TiO2 with tailored anatase/rutile composition for applications in redox catalysis and photocatalysis. Appl. Catal. A 2015, 504, 62–73. [Google Scholar] [CrossRef]
  38. Da Silva, E.P.; Winkler, M.E.G.; Giufrida, W.M.; Cardozo-Filho, L.; Alonso, C.G.; Lopes, J.B.O.; Rubira, A.F.; Silva, R. Effect of phase composition on the photocatalytic activity of titanium dioxide obtained from supercritical antisolvent. J. Colloid Interface Sci. 2019, 535, 245–254. [Google Scholar] [CrossRef]
  39. Mani, S.; Bharagava, R.N. Exposure to crystal violet, its toxic, genotoxic and carcinogenic effects on environment and its degradation and detoxification for environmental safety. Rev. Environ. Contam. Toxicol. 2015, 237, 71–104. [Google Scholar]
  40. Au, W.; Pathak, S.; Collie, C.J.; Hsu, T.C. Cytogenetic toxicity of gentian violet and crystal violet on mammalian cells in vitro. Mutat. Res. Genet. Toxicol. 1978, 58, 269–276. [Google Scholar] [CrossRef]
  41. Reverchon, E.; Della Porta, G.; Sannino, D.; Ciambelli, P. Supercritical antisolvent precipitation of nanoparticles of a zinc oxide precursor. Powder Technol. 1999, 102, 127–134. [Google Scholar] [CrossRef]
  42. Handoko, A.D.; Liew, L.-L.; Lin, M.; Sankar, G.; Du, Y.; Su, H.; Dong, Z.; Goh, G.K.L. Elucidation of thermally induced internal porosity in zinc oxide nanorods. Nano Res. 2018, 11, 2412–2423. [Google Scholar] [CrossRef]
  43. Vu, T.T.; Valdés-Solís, T.; Marbán, G. High surface area stainless steel wire mesh-supported TiO2 prepared by sacrificial template accelerated hydrolysis. A monolithic photocatalyst superior to P25 TiO2. J. Environ. Chem. Eng. 2014, 2, 2229–2235. [Google Scholar] [CrossRef]
  44. Kołodziejczak-Radzimska, A.; Markiewicz, E.; Jesionowski, T. Structural characterisation of ZnO particles obtained by the emulsion precipitation method. J. Nanomater. 2012, 2012. [Google Scholar] [CrossRef]
  45. Faisal, M.; Ismail, A.A.; Ibrahim, A.A.; Bouzid, H.; Al-Sayari, S.A. Highly efficient photocatalyst based on Ce doped ZnO nanorods: Controllable synthesis and enhanced photocatalytic activity. Chem. Eng. J. 2013, 229, 225–233. [Google Scholar] [CrossRef]
  46. Li, C.; Lv, Y.; Guo, L.; Xu, H.; Ai, X.; Zhang, J. Raman and excitonic photoluminescence characterizations of ZnO star-shaped nanocrystals. J. Lumin. 2007, 122–123, 415–417. [Google Scholar] [CrossRef]
  47. Yang, M.M.; Crerar, D.A.; Irish, D.E. A raman spectroscopic study of lead and zinc acetate complexes in hydrothermal solutions. Geochim. Cosmochim. Acta 1989, 53, 319–326. [Google Scholar] [CrossRef]
  48. Baruwati, B.; Kumar, D.K.; Manorama, S.V. Hydrothermal synthesis of highly crystalline ZnO nanoparticles: A competitive sensor for lpg and etoh. Sens. Actuators B 2006, 119, 676–682. [Google Scholar] [CrossRef]
  49. Anpo, M.; Shima, T.; Kodama, S.; Kubokawa, Y. Photocatalytic hydrogenation of propyne with water on small-particle titania: Size quantization effects and reaction intermediates. J. Phys. Chem. 1987, 91, 4305–4310. [Google Scholar] [CrossRef]
  50. Kormann, C.; Bahnemann, D.W.; Hoffmann, M.R. Preparation and characterization of quantum-size titanium dioxide. J. Phys. Chem. 1988, 92, 5196–5201. [Google Scholar] [CrossRef]
  51. Busuioc, C.; Evanghelidis, A.; Enculescu, M.; Enculescu, I. Optical and photocatalytic properties of electrospun ZnO fibers. Dig. J. Nanomater. Biostruct. 2015, 10, 957–965. [Google Scholar]
  52. Preda, N.; Enculescu, M.; Enculescu, I. Polysaccharide-assisted crystallization of ZnO micro/nanostructures. Mater. Lett. 2014, 115, 256–260. [Google Scholar] [CrossRef]
  53. Jiménez Reinosa, J.; Leret, P.; Álvarez-Docio, C.M.; del Campo, A.; Fernández, J.F. Enhancement of UV absorption behavior in ZnO–TiO2 composites. Boletín de la Sociedad Española de Cerámica y Vidrio 2016, 55, 55–62. [Google Scholar] [CrossRef]
  54. Wang, K.-H.; Hsieh, Y.-H.; Lin, T.-T.; Chang, C.-Y. Effects of temperature on the properties of TiO2 photocatalysts prepared by the chemical vapor deposition (CVD) method. React. Kinet. Catal. Lett. 2008, 95, 39–46. [Google Scholar] [CrossRef]
  55. Jang, H.D.; Kim, S.-K.; Kim, S.-J. Effect of particle size and phase composition of titanium dioxide nanoparticles on the photocatalytic properties. J. Nanopart. Res. 2001, 3, 141–147. [Google Scholar] [CrossRef]
  56. Sheikhnejad, O.; Feng, Z.; Rajabtabar, A.; Khodadad, E.; Yudong Huang, A. Precursor and reaction time effects in evaluation of photocatalytic properties of TiO2 nanoparticles synthesized via low temperature. Int. J. Electrochem. Sci. 2014, 9, 3068–3077. [Google Scholar]
  57. Flores, N.M.; Pal, U.; Galeazzi, R.; Sandoval, A. Effects of morphology, surface area, and defect content on the photocatalytic dye degradation performance of ZnO nanostructures. RSC Adv. 2014, 4, 41099–41110. [Google Scholar] [CrossRef]
  58. Giraldi, T.; Fonseca Santos, G.; De Mendonça, V.; Ribeiro, C.; Weber, I. Annealing effects on the photocatalytic activity of ZnO nanoparticles. J. Nanosci. Nanotechnol. 2011, 11, 3635–3640. [Google Scholar] [CrossRef]
  59. Rao, P.; Patel, G.; Sharma, S.L.; Ameta, S.C. Photocatalytic degradation of crystal violet over semiconductor zinc oxide powder suspended in aqueous solution. Toxicol. Environ. Chem. 1997, 60, 155–161. [Google Scholar] [CrossRef]
  60. Ameen, S.; Akhtar, M.S.; Nazim, M.; Shin, H.-S. Rapid photocatalytic degradation of crystal violet dye over zno flower nanomaterials. Mater. Lett. 2013, 96, 228–232. [Google Scholar] [CrossRef]
  61. Sacco, O.; Vaiano, V.; Sannino, D.; Ciambelli, P. Visible light driven mineralization of spiramycin over photostructured N-doped TiO2 on up conversion phosphors. J. Environ. Sci. 2017, 54, 268–276. [Google Scholar] [CrossRef]
  62. Sacco, O.; Sannino, D.; Vaiano, V. Packed bed photoreactor for the removal of water pollutants using visible light emitting diodes. App. Sci. 2019, 9, 472. [Google Scholar] [CrossRef]
Figure 1. Field emission scanning electron microscope (FESEM) images of unprocessed zinc acetate (ZnAc) (a) and supercritical antisolvent (SAS) ZnAc nanoparticles (b) precipitated from dimethylsulfoxide DMSO at 150 bar, 40 °C, and 15 mg × mL−1.
Catalysts 09 00346 g001
Figure 2. Fourier transform infrared (FT-IR) spectra of unprocessed and supercritical antisolvent (SAS) processed zinc acetate (ZnAc).
Catalysts 09 00346 g002
Figure 3. Field emission scanning electron microscope (FESEM) images of zinc oxide (ZnO) nanoparticles obtained from supercritical antisolvent (SAS) processed zinc acetate (ZnAc) calcined at 300 °C (a), 400 °C (b), 500 °C (c), and 600 °C (d); and ZnO produced from unprocessed ZnAc (e).
Catalysts 09 00346 g003
Figure 4. Fourier transform infrared (FT-IR) spectra of (a) zinc oxide (ZnO) from supercritical antisolvent (SAS) zinc acetate (ZnAc) nanoparticles calcined at 500 °C and ZnO from unprocessed ZnAc calcined at 500 °C; (b) ZnO from SAS ZnAc nanoparticles calcined at 300, 400, 500, and 600 °C.
Catalysts 09 00346 g004
Figure 5. Raman shift of (a) zinc oxide (ZnO) from supercritical antisolvent (SAS) zinc acetate (ZnAc) nanoparticles calcined at 500 °C and ZnO from unprocessed ZnAc calcined at 500 °C; (b) ZnO from SAS ZnAc nanoparticles calcined at 300, 400, 500, and 600 °C.
Catalysts 09 00346 g005
Figure 6. UV-Vis diffuse reflectance spectra of (a) zinc oxide (ZnO) from supercritical antisolvent (SAS) zinc acetate (ZnAc) nanoparticles calcined at 500 °C and ZnO from unprocessed ZnAc calcined at 500 °C; (b) ZnO from SAS ZnAc nanoparticles calcined at 300, 400, 500, and 600 °C.
Catalysts 09 00346 g006
Figure 7. Photocatalytic decolorization of crystal violet (CV) using ZnOac500 and ZnOsas500 under UV irradiation.
Catalysts 09 00346 g007
Figure 8. (a) Photocatalytic decolorization of crystal violet (CV) and (b) Total Organic Carbon (TOC) behavior under UV light using zinc oxide (ZnO) from supercritical antisolvent (SAS) zinc acetate (ZnAc) nanoparticles calcined at 300, 400, 500, and 600 °C.
Catalysts 09 00346 g008
Figure 9. Schematic representation of supercritical antisolvent (SAS) apparatus. V1 is tank, V2 is burette, RB is refrigerating bath, P1 and P2 are pumps, PC is precipitation chamber, M is test gauge manometer, MV is micrometering valve, LS is collection vessel, BPV is backpressure valve, R is rotameter.
Catalysts 09 00346 g009
Table 1. Summary of the experimental results (Tc = calcination temperature; NP = nanoparticles; m.d. = mean diameter; s.d. = standard deviation).
SampleTc (°C)Morphologym.d. ± s.d. (nm)BET Surface Area (m2 × g−1)Band-Gap Energy (eV)
ZnO SAS300NP38.6 ± 7.1333.12
400NP57.3 ± 10.5153.07
500NP65.0 ± 14.5123.10
600NP156.7 ± 30.163.15
ZnO from unprocessed ZnAc500Tetrapods181.1 ± 65.553.17

