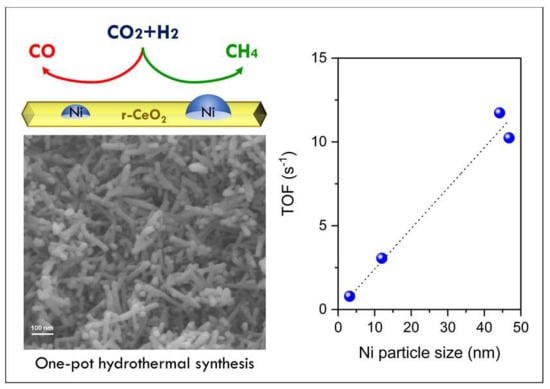
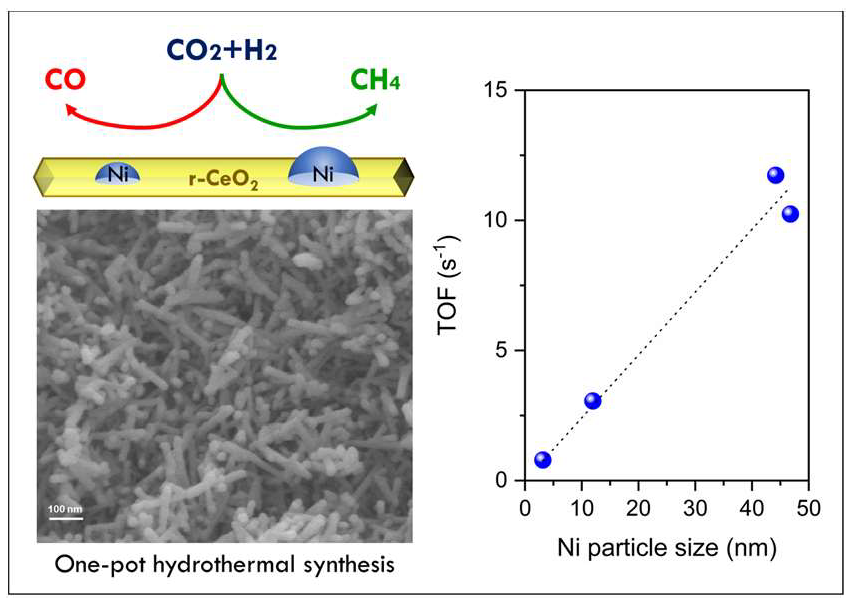
Structure-Sensitivity of CO2 Methanation over Nanostructured Ni Supported on CeO2 Nanorods


1
Department of Science, “Roma Tre” University, Via della Vasca Navale 79, 00146 Roma, Italy
2
Department of Energy Technologies, Italian National Agency for New Technologies, Energy and Sustainable Economic Development (ENEA), Via Anguillarese 301, 00123 Rome, Italy
*
Authors to whom correspondence should be addressed.
Catalysts 2019, 9(4), 375; https://doi.org/10.3390/catal9040375
Submission received: 28 March 2019
/
Revised: 17 April 2019
/
Accepted: 18 April 2019
/
Published: 22 April 2019
(This article belongs to the Special Issue Supported Catalysts for Carbon Oxides Methanation)
Abstract
:Ni-based oxides are widely investigated as catalysts for CO2 methanation due to their high activity, high selectivity and low cost. The catalytic performances of Ni-based catalysts depend on support properties that strongly influence the dispersion of the catalytic active phase and the Ni–support interaction. Although the CO2 methanation is widely studied, the structure sensitivity of methanation on nickel is not completely assessed. Ni/CeO2 nanorods with different nickel/ceria molar ratios (0.05, 0.10, 0.20, 0.30) were prepared by one-pot hydrothermal synthesis. The effect of nickel content and metal particle size on catalytic activity and selectivity for CO2 methanation were studied using CO2:H2 = 1:4 stoichiometric ratio at high space velocity (300 L g−1 h−1). Sample structure and morphology were studied by X-ray diffraction (XRD), Brunauer–Emmet–Teller (BET) analysis, field-emission scanning electron microscopy/energy-dispersive spectroscopy (FE-SEM/EDS), H2-temperature programmed reduction (TPR), H2-temperature-programmed desorption (TPD). Both the CO production and the turnover frequency appear depending on nickel particle size, suggesting a structure sensitivity of the CO2 methanation on nickel supported on ceria.
1. Introduction
Carbon dioxide is produced and released in industrial processes, energy production, biomass combustion and gasification, cement kilns and oil refinery. Reducing the CO2 emissions by prevention, storage [1] or recycling [2,3], is highly desirable to limit the greenhouse effects of high CO2 concentration in the atmosphere. In particular, the hydrogenation of CO2 into chemicals or fuels like methane, methanol, dimethyl ether [4,5,6], or the reduction into syn-gas (CO and H2) by dry reforming with methane (DRM) [7,8,9,10] are interesting research fields of CO2 utilization. In the power-to-gas process (PtG) the intermittent excess of electricity, produced by renewable power sources like solar or wind, highly dependent on daytime, season and weather, is utilized to decompose water into hydrogen and oxygen by electrolysis [11,12]. The produced H2 can be directly used as an energy carrier or it can be reacted with CO2 to produce methane by the Sabatier reaction (4H2 + CO2 → CH4 + 2H2O). Methane is an important energy carrier with existing distribution infrastructure. The synthetic methane contributes to the reduction of greenhouse gas emissions, replacing the natural fossil methane. The CO2 methanation is an exothermic and thermodynamically favored reaction (ΔH0 = −164 kJ/mol ΔG0 = −131 kJ/mol) but kinetically limited, being an 8-electron process occurring above 200 °C in the presence of catalysts. Generally, methanation is studied in the temperature range 200–500 °C, to limit the reverse water gas shift reaction (RWGS: CO2 + H2 → CO + H2O) producing CO at higher temperatures. Many catalysts, based on different noble or transition metals (Ru, Rh, Ir, Pd, Ni, Fe, Co) supported on oxides (α-Al2O3, γ-Al2O3, TiO2, SiO2, ZrO2, CeO2,) or mixed oxides (CeO2-Al2O3, SiO2-Al2O3, MgAl2O4, CeO2-ZrO2, Y2O3-ZrO2) show good catalytic performances for CO2 methanation, and have been investigated in the recent years [12,13,14,15]. Among these, Ni-based catalysts are the most extensively investigated materials due to their high activity, high selectivity and low cost. The main drawback of Ni-based catalysts is the carbon deposition due to the Boudouard reaction (2CO → C + CO2), carbon dioxide reduction (CO2 + 2H2 → C + 2H2O) and carbon monoxide reduction (CO + H2 → C + H2O). The catalytic performances of Ni catalysts depend on support properties that strongly influence the dispersion, the reducibility and the support interaction of nickel.
CeO2 is one of the most studied catalyst carriers in many catalytic oxidation reactions, due to its ability to store and release oxygen by Ce3+/Ce4+ sites on the surface. In CO2 methanation, the redox properties of CeO2 are considered to influence both carbon dioxide and hydrogen activation, and the catalyst’s basicity is considered to play a key role in the mechanism [16,17]. Ni-based CeO2 and Ce-Zr binary oxides exhibit excellent catalytic activity and stability attributed to the redox properties and to the ability to highly disperse nickel [17]. CeO2 can be prepared in different morphologies: nano-rod ceria (r-CeO2), nano-cubic ceria(c-CeO2) or nano-octaedral ceria (o-CeO2), that may have an effect on the catalytic performances [18]. Ni/r-CeO2 showed higher activity and coke resistance compared with other morphologies in the dry reforming of methane [19] or methanol [20].
Metal particle size is frequently discussed in the literature as a feature determining the CO/CH4 selectivity of CO2 methanation [5,21,22,23]. Small nanoparticles have been reported to promote CO formation instead of CH4. This should be due to different reaction pathways for CO2 methanation depending on the metal particle size. On both small and large Ni nanoparticles, the co-adsorbed CO2 and H2 reagents, form monodentate m-HCOO− as a key intermediate. On small metal particles, m-HCOO− intermediate is decomposed to CO that, following a consecutive reaction pathway, may be further hydrogenated to CH4. Whereas, on large metal particles m-HCOO− intermediate may be directly hydrogenated to CH4, due to the large H2 surface coverage, causing a higher CH4 production rate rather than CO production rate [21,22,23].
Recently, it has been reported by Beierlein at al. [24] that the CO2 methanation on highly loaded (14–88 wt%) Ni/Al2O3 catalysts is a structure-insensitive reaction and that the terrace atoms are the active sites, whereas parameters such as metal–support interaction or metal–support interface, do not have a significant influence on the activity. However, in our previous studies, for more diluted (5–12 wt%) Ni/YSZ catalysts, we found a dependence of the activity for methanation on nickel particle size (structure sensitivity): smaller Ni0 particles were more active for CO formation instead of CH4 formation [5], and had anti-coking properties [6].
As the structure sensitivity of the methanation reaction over nickel has not been completely assessed in the published literature, a series of Ni/nanorod-CeO2 catalysts with different Ni loading (2–13 wt%) and different Ni particle size, were studied in order to deepen the structure-sensitivity of methanation on nickel. Samples were characterized by X-ray diffraction (XRD), Brunauer–Emmet–Teller (BET) analysis, field-emission scanning elecron microscopy/energy-dispersive spectroscopy (FE-SEM/EDS), H2-temperature programmed reduction (TPR) and H2-temperature-programmed desorption (TPD) analysis.
2. Results
2.1. Catalysts’ Synthesis
Ni/CeO2 nanorods (r-CeO2) catalysts, containing different nickel nominal molar ratio, i = Ni/Ce (i = 0.05, i = 0.10, i = 0.20, i = 0.30), were prepared by hydrothermal one-pot synthesis as described in detail in Section 4.1. Synthetized catalysts were named for short NixCe, where x = i × 100. The chemical composition (%) was analyzed by energy-dispersive spectroscopy (EDS) and reported in Table 1.
2.2. X-ray Diffraction (XRD) Characterization of Calcined Samples
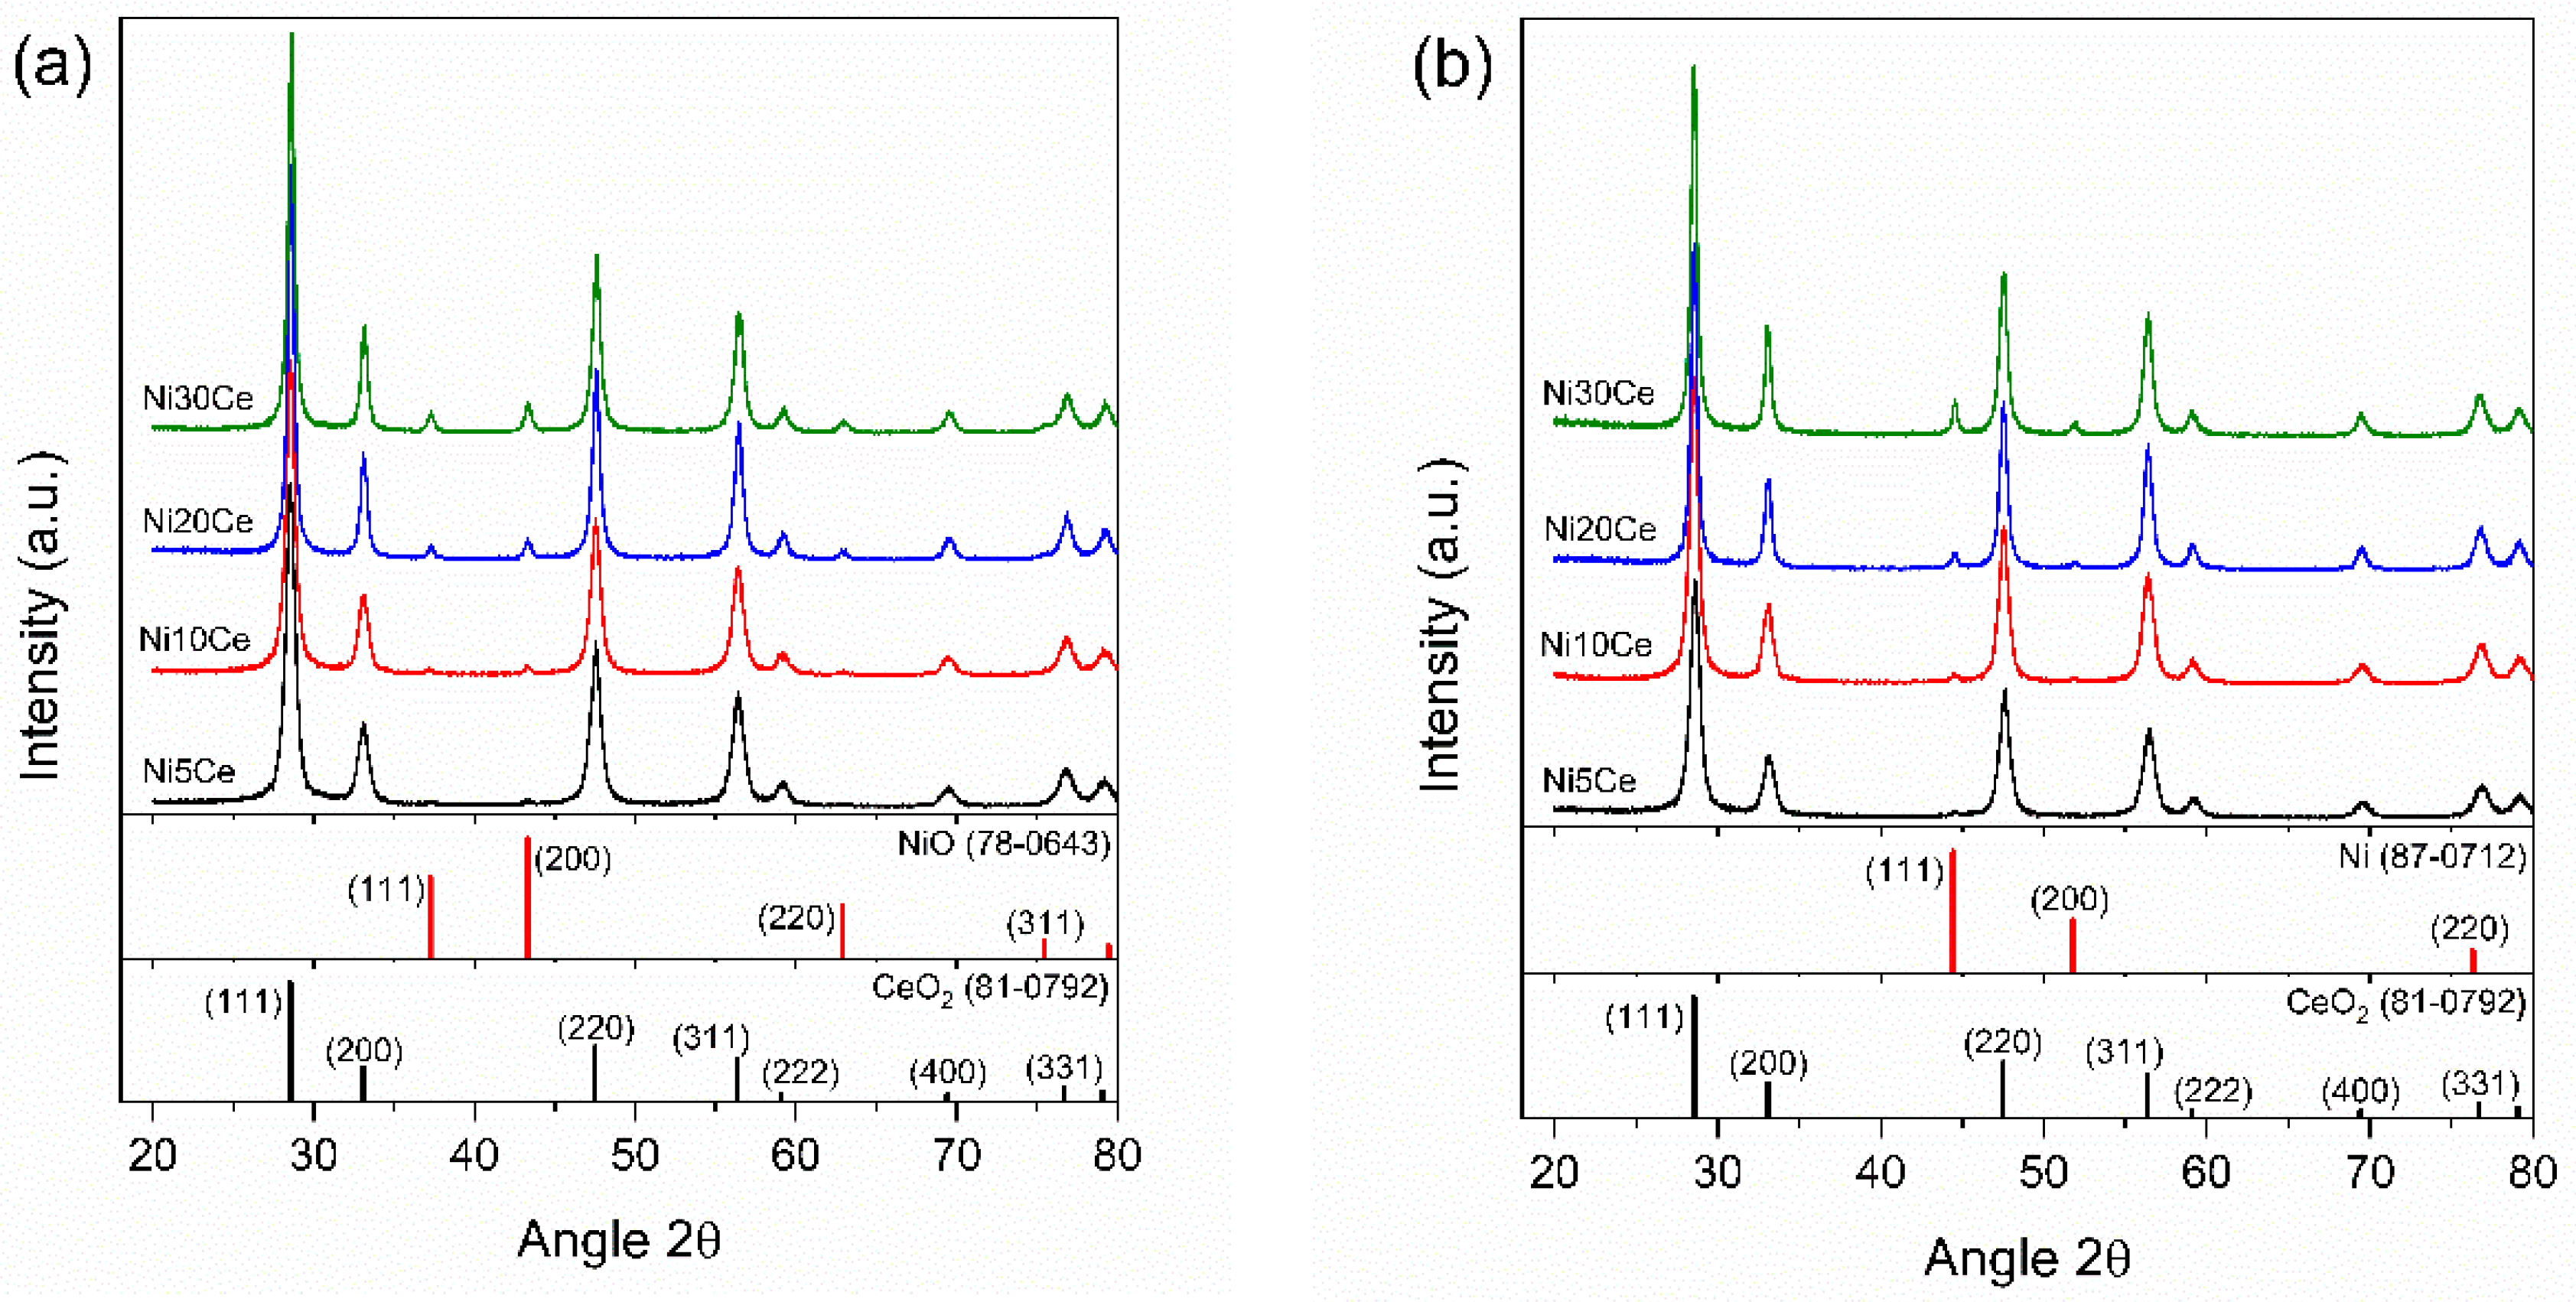
The X-ray diffractograms of Ni/r-CeO2 catalysts calcined at 500 °C, together with the CeO2 and NiO reference JCPDS (Joint Committee on Powder Diffraction Standards) cards, are shown in Figure 1a. All catalysts showed the main reflections at 2θ = 28.6° (111), 33.1° (200), 47.6° (220), 56.4° (311) typical of CeO2 fluorite cubic phase (JCPDS card 81-0792) and weak diffraction peaks at 2θ = 37.3° (111), 43.5° (200), 62.0° (222) assigned to NiO cubic phase (JCPDS card 78-0643). The NiO peaks intensity increased with the Ni content. There are not evidences of CeO2 reflections shift toward higher 2θ values, suggesting that the possible incorporation of Ni2+ ion on CeO2 lattice, forming a NixCe1-xO2-δ solid solution, is very limited. The mean crystallite size of CeO2, dCeO2XRD, determined from the (111) crystallographic plane by the Debye–Scherrer equation, increased with the nickel loading from about 12 nm up to 18–20 nm (Table 1). The average NiO crystallite size, dNiOXRD, calculated from the (200) reflection, increased from 13.6 nm for Ni5Ce up to 18–21 nm for Ni10Ce, Ni20Ce and Ni30Ce samples (Table 1).
2.3. Temperature-Programmed Reduction (TPR) and H2 Chemisorption
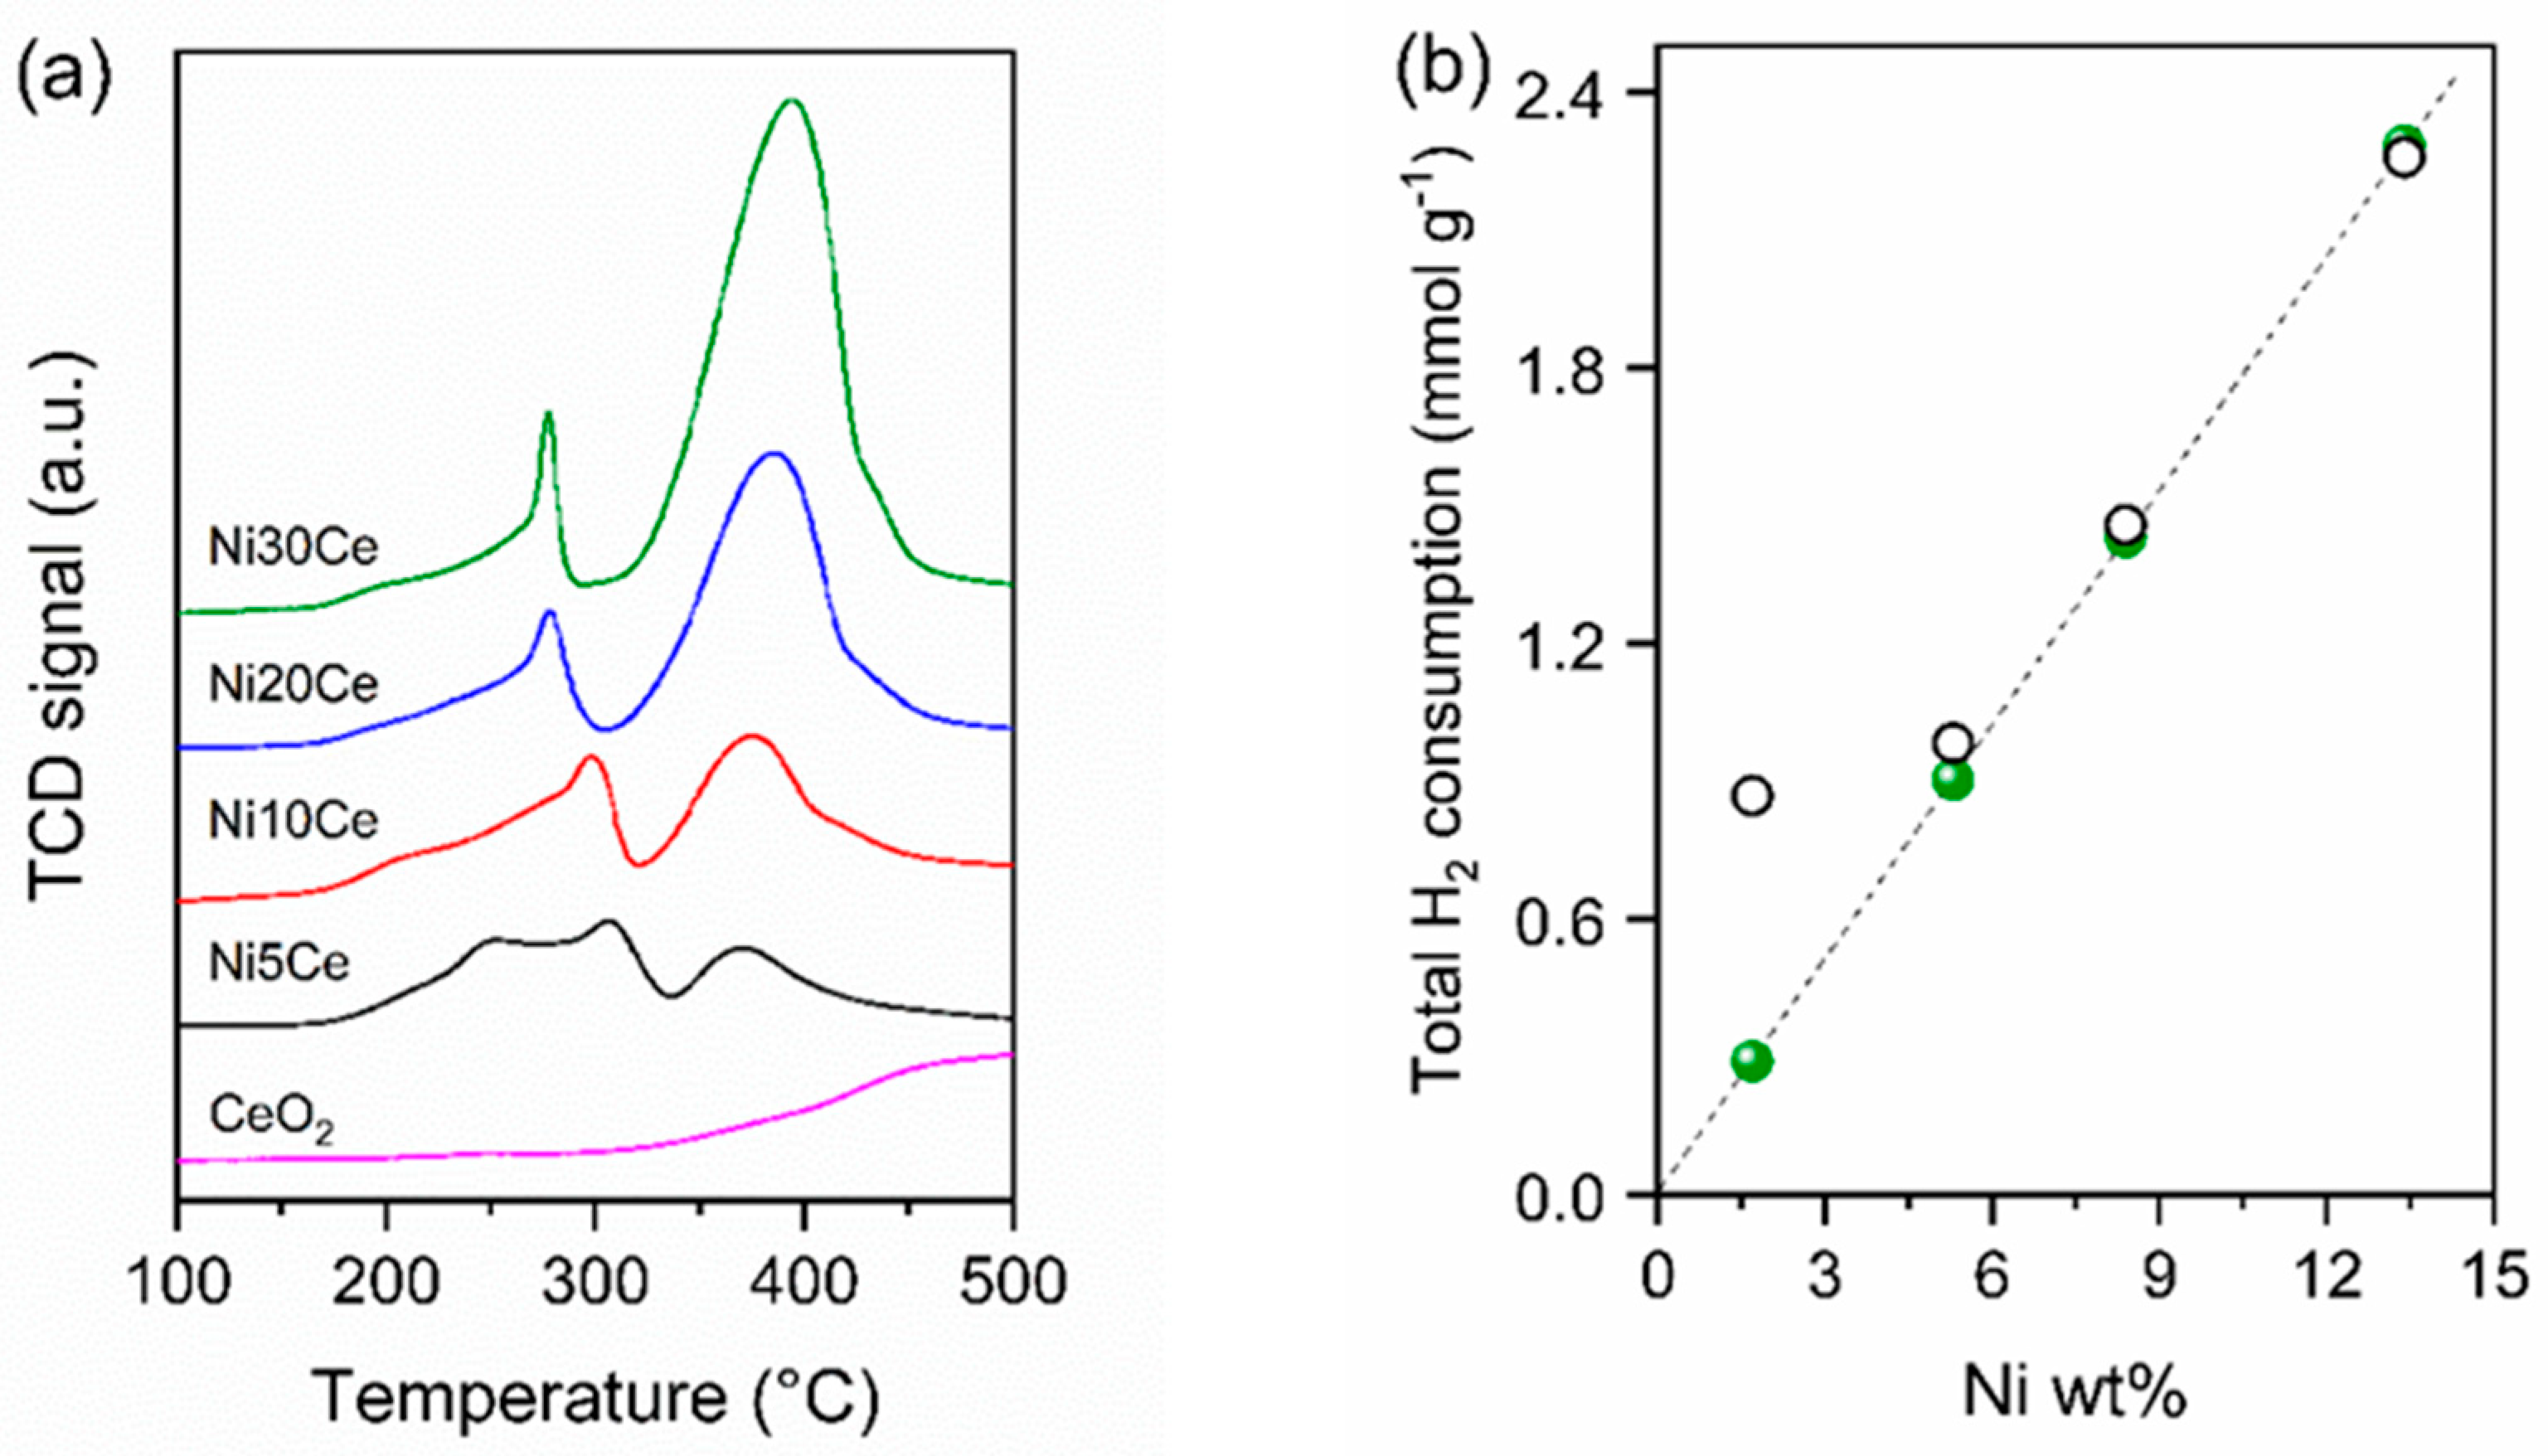
As is well known from the literature, H2-TPR profile of CeO2 shows reduction peaks in the 400–600 °C temperature range, due to the removal of labile oxygen from CeO2 on the surface, and in the 600–900 °C temperature range, due to reduction of bulk ceria [7,10]. The reduction of NiO supported on CeO2 generally occurs in the temperature range 400–700 °C, depending on the nickel particle size and on the strength of the nickel-support interactions [7,10]. Temperature-programmed reduction of pure r-CeO2 and NixCe catalysts were performed up to 500 °C (Figure 2a). On pure r-CeO2, the surface reduction Ce4+ → Ce3+, with formation of CeO2-δ, started above 300 °C, increased up to 500 °C and corresponded to a reduction of about 20% of Ce4+. H2-TPR profiles of NixCe samples showed reduction peaks in two temperature regions: above 350 °C and below 350 °C. Peaks below 350 °C, less intense, are assigned to the reduction of small NiO particles, or to a very small fraction of Ni2+ in solid solution with CeO2, Ni–O–Ce. This peak was not observed on the pure CeO2 support suggesting that it is related to the presence of nickel, which may facilitate the surface reduction of CeO2 according to the reactions (1) and (2) [25,26]. The peak at 380 °C, more intense, is assigned to the reduction of NiO particles highly dispersed on ceria, the weak shoulder above 400 °C is assigned to a small fraction of NiO having a strong Ni–support interaction [27].
Ni2+ + O2- + H2 → Ni0 + H2O + VO
2Ce4+ + Ni0 → 2Ce3+ + Ni2+
The total hydrogen consumption in the H2-TPR experiment up to 500 °C, maintaining the final temperature for 1 h, increased with nickel content (Table 2). If all nickel loaded on calcined sample was Ni2+ and if it was completely reduced below 500 °C, as suggested by the shape and the position of nickel peaks on H2-TPR profiles, the theoretical hydrogen consumption for Ni reduction should correspond to the molar ratio H2/Ni = 1. The difference between the total experimental and the total theoretical hydrogen consumption is due to the reduction of cerium 2Ce4+ + H2 → 2Ce3+ and allows evaluating the percentage of CeO2 reduced to Ce3+. The H2 consumption for Ce4+ reduction and the Ce3+ percentage are reported in Table 2. The experimental hydrogen consumption was much larger than 1 only for the most diluted samples Ni5Ce, corresponding to a reduction of 20% of ceria, whereas it was very close to 1 for the sample with greater Ni loading, corresponding to a maximum of 2.9% of ceria reduction. According with the literature, the reduction of CeO2 in the examined temperatures range depends on the textural properties of the samples, with a linear correlation between surface area and H2 consumption [28]. On the sample containing less Ni, with a high surface area, the contribution to the H2 consumption, due to the reduction of CeO2-surface, was significant. Whereas on the other samples, the H2 consumption due to the reduction of CeO2-surface, became negligible due to the surface area decrement. The total theoretical and experimental H2/Ni ratio are compared in Figure 2b.
Reduced samples were cooled in hydrogen down to room temperature and the chemisorbed hydrogen was quantified in the subsequent H2-TPD experiment. An evaluation of the size of active nickel particles, dNiTPD, and of the percentage of nickel dispersion, DNi, was obtained assuming as chemisorption stoichiometry Ni:H = 1:1 and are reported in Table 2. As expected, the nickel particle size, increased with nickel content from 3.2 nm up to 46.8 nm. In agreement with the increase of particle diameter, the corresponding nickel dispersion decreased from 32.0% down to 2.2%.
2.4. Characterization of Reduced Samples
2.4.1. XRD Characterization
The X-ray diffractograms of the Ni/rCeO2-δ samples, after reduction in H2 up to 500 °C, (Figure 1b) showed: (i) peaks of fluorite cubic CeO2, with the same position, intensity, and full width at half maximum (FWHM), showed by the calcined samples, indicating high sintering resistance of the r-ceria support; (ii) two weak diffraction peaks at 2θ = 44.5° and 51.8° assigned to (111) and (200) crystallographic plane of the face-centered cubic Ni0 phase (JCPDS 04-850); (iii) the absence of the NiO phase, indicating that NiO was completely reduced to metallic Ni0 during the catalytic pre-treatment at 500 °C for 1 h. Ni0 peaks intensity increased with the Ni content. The average Ni0 crystallite size, dNiXRD, on reduced samples with x = 5, 10, 20, is very close to the dimension of NiO crystallite before sample reduction, dNiOXRD, with no evidence of sintering (Table 1), suggesting a strong interaction of nickel with the ceria support. Only for the most concentrated sample, with a Ni/Ce molar ratio of 0.30, the nickel crystallite size increased from 18 nm for NiO on calcined sample, up to 27.3 nm for Ni0 after reduction, evidencing a restrained sintering and suggesting a weaker Ni-support interaction.
2.4.2. Brunauer–Emmet–Teller (BET) Characterization
The textural properties of the reduced samples are reported in Table 1. NixCe catalysts showed a physisorption isotherm classified as Type II (Figure 3a), typical of non-porous or macroporous material [29]. The N2 adsorption–desorption curves showed a hysteresis loop of H1 type, with the two branches almost vertical and nearly parallel, characteristic of uniform agglomerates and narrow distributions of pore size [29]. The specific surface area of hydrothermal synthetized pure r-ceria was 90 m2 g−1. The specific area S.A. of NixCe catalysts markedly decreased as a function of Ni content from 73 m2 g−1 for Ni5Ce to 28 m2 g−1 for Ni30Ce, in agreement with the decrease of the pore volume from 0.49 to 0.21 cm3 g−1. The specific area normalized by subtracting the mass of supported nickel, (S.A.)norm, also decreased, from 74 m2 g−1 for Ni5Ce to 32 m2 g−1 for Ni30Ce, confirming that nickel loading caused the blocking of the pores. By contrast, the pore diameter of samples was in range 30–39 nm and appeared not depending on nickel content, suggesting that the one-pot synthesis did not influence the ceria porosity much (Table 1). The pore size distribution (PSD) profiles of NixCe samples, reported in Figure 3b, showed a similar bimodal pore distribution, with a fraction of pores with diameter 3–6 nm and a fraction in range 20–90 nm. The small pores of 3–6 nm were assigned to the bulk structure of r-CeO2, whereas the pores in range 20–90 nm were assigned to the material agglomeration. The amount of small pores was nearly the same in all samples, whereas the amount of pores in range 20–90 nm markedly varied. The fraction of bulk structure pores was about 30% on samples Ni5Ce and Ni30Ce, whereas was about 15% on Ni10Ce and Ni20Ce.
2.4.3. Field-Emission Scanning Electron Microscopy (FE-SEM) Characterization
The FE-SEM images of the reduced catalysts with the corresponding length and width distribution histograms, related to about 100 nanorods, are reported in Figure 4. The frequency distribution histograms are plotted with bars that represent numbers of measurements within certain ranges of values, superimposed to a Gaussian curve. The average sizes are listed in Table 3. All samples showed an aspect ratio, length to width ratio, above 5 indicating a well-developed structural anisotropy characteristic of the rod-like morphology. The average length and width of the nanorods increased as the Ni content increases. In particular, the length increased from 145.9 nm of Ni5Ce sample up to 236.1 nm of Ni30Ce sample, and the corresponding width increased from 26.4 nm up to 39.6 nm. These morphological changes, related to Ni content, agree with the decrease of the specific surface area.
2.5. Catalytic Activity
The catalytic activity of Ni/r-CeO2-δ catalysts for CO2 methanation (CO2 + 4H2 → CH4 + 2H2O; H° = −164 kJ/mol), was studied in the 200–500 °C temperature range. At higher temperature, the thermodynamic predicts a decrease of CO2 conversion and the increase of produced CO, due to the reverse water-gas shift (RWGS) reaction (CO2 + H2 → CO + H2O; ΔH0 = +38 kJ/mol). In all the catalytic tests, carbon balance was closed between ±5% and CO was the only secondary product. CO2 conversion (panel a), CH4 yield (panel b) and CO yield (panel c) as a function of temperature are reported in Figure 5. r-CeO2 was inactive for the methanation reaction, the conversion being only 2% at 500 °C and CO being the only product. A small addition of Ni strongly increased the CO2 conversion. Ni5Ce catalyst, having only 1.7 wt% of Ni, showed a remarkable activity with CO2 conversion starting above 300 °C and increasing monotonically with temperature, reaching 43% at 500 °C. With increasing Ni loading, the CO2 conversion curves were shifted toward lower temperature starting above 250 °C and increasing much more rapidly. Above 400 °C they began to level off and at 500 °C showed very similar conversion of about 54% due to thermodynamic limitation. At lower temperature (T < 400 °C), the CO2 conversion increased almost linearly with the Ni loading.
The CH4 yield profiles showed a characteristic volcano behavior: the CH4 production increasing proportionally with the Ni loading and, at the same time, the maximum of CH4 yield shifting at lower temperature with the Ni loading. Specifically, the maximum CH4 yield was close to 500 °C for Ni5Ce and to 400 °C for Ni30Ce.
As explained above, the RWGS side reaction causes CO production in addition to methane. For all samples, the CO yield curves show similar onset temperature at 300 °C and increased with temperature, due to the endothermicity of RWGS [30].
Except for Ni5Ce catalyst, a close examination of the CO yield curves, reveals that the CO yield increased rapidly with temperature, showed a decreasing curve slope between 350–450 °C, and then increased again with temperature with the initial slope. In more detail, that “inflection point” in the CO yield curve occurred at 400–450 °C for Ni10Ce, and at 350–450 °C for Ni20Ce and Ni30Ce; therefore, at lower temperature by increasing Ni loading.
To further evaluate the effect of the Ni loading on the catalytic activity, the reaction was performed increasing the H2:CO2 ratio from 4 to 8. By increasing the hydrogen concentration, the overall catalytic performance increased, extending the operating temperature of the catalyst at higher temperature, with a substantial decrease of unwanted CO. Figure 5d shows the variation (%) of CO2 conversion, CH4 and CO yields using the enriched H2 mixture with respect to the stoichiometric one at 400 °C over the catalysts. The excess of hydrogen caused an increase of 40%–60% of CO2 conversion and of 70%–100% of CH4 yield, with a decrease of CO production up to 50%. The decrease of CO production depends on the nickel content and is larger on more concentrated samples.
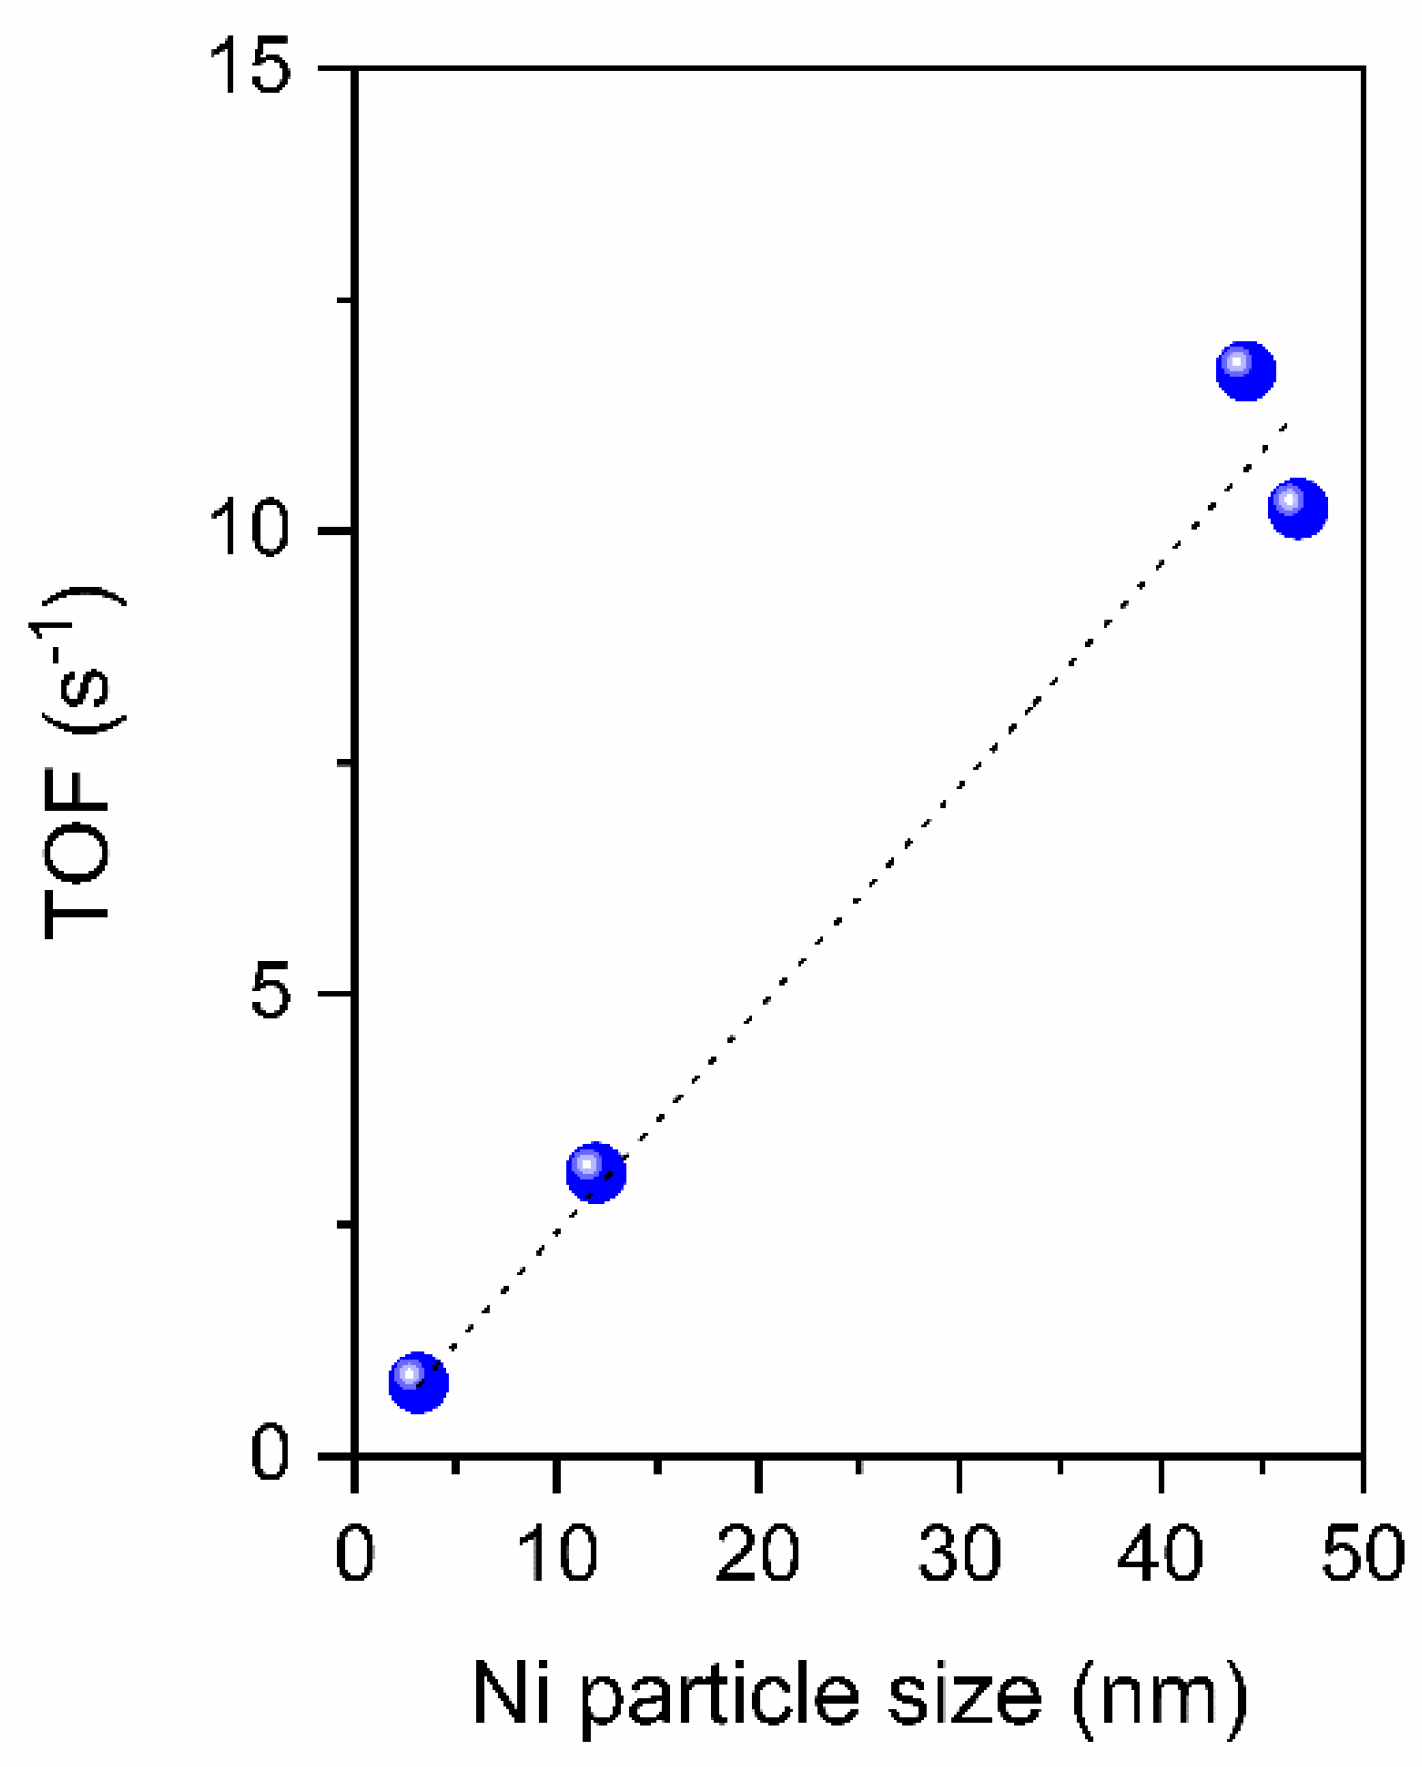
The turnover frequency (TOF) for CO2 conversion, obtained operating in differential conditions (T = 300 °C, CO2 conversion <10 %), increased linearly with Ni particles size as shown in Figure 6. Smaller nanoparticles appeared less active; such distinctive behavior has been reported already by other authors for Ru [21], Pd [22], Co [31] and Ni [23] supported catalysts.
A possible explanation of the observed catalytic activity is that small Ni metal nanoparticles with a greater susceptibility to oxidation [5], may have a different reaction mechanism for the CO2 hydrogenation, changing the dependence of CO/CH4 production on Ni particles size. CO is selectively produced on small Ni nanoparticles, whereas CH4 is selectively produced on larger Ni nanoparticles.
3. Discussion
The on-pot hydrothermal method allows us to synthetize, with a simple procedure, catalysts with homogeneous well-developed nanorod-CeO2 morphology and homogeneous nickel dispersion. As generally expected, the nickel particle size depends on nickel loading, increasing as the nickel content increases. The most diluted catalyst (1.69 wt%) has Ni particles of average diameter 3.2 nm, and eight times more concentrated catalyst (13.38 wt%) has Ni particles of average diameter 46 nm. The nickel loading causes a decrease of catalyst surface area that seems not to be influencing the catalytic activity, as the CO2 conversion is linearly proportional to the Ni loading.
For the CO2 methanation, two reaction mechanisms have been proposed in the literature [15]: the first involving the dissociation of CO2 into CO, that is then hydrogenated into CH4, the second involving the direct hydrogenation of CO2. The first mechanism, described more in detail, may include or not the formation of formiate (CHOO−) that is decomposed to CO. Anyhow, the CO intermediate is formed on the surface and then it may desorb or react with hydrogen to form CH4 with a “consecutive pathway”. Some literature results over Ni/SiO2 [23] indicated that the formation of m-HCOO− intermediate is an essential step in a very diluted Ni sample (0.5 wt%) and in a 10 wt% sample, but in the 10 wt% sample, formiate may be also directly reduced to CH4 by a “parallel pathway”. The m-HCOO− prefers the hydrogenation to CH4 instead of the decomposition to CO in the presence of high H2 coverage on a large Ni surface.
The CO2 methanation over Ni/r-CeO2, tested in the present paper, showed two catalytic behaviors depending on nickel particle size that confirm the previously described reaction mechanism and suggest a structure-sensitivity of the CO2 methanation on nickel supported on r-ceria:
- (1)
- The inflection point observed in the CO yield, occurs at lower temperature by increasing the Ni loading. That behavior may be explained assuming that CO is produced by a different reaction mechanism on Ni-active centers with different particle size. In agreement with the literature, we assume that on small Ni0 particles, the low H2 coverage, may favor the CO formation; whereas, on large Ni0 particles, due to the high H2 surface coverage, CO2 may be directly hydrogenated to CH4 therefore the rate of CH4 production is higher than that of CO;
- (2)
- The turnover frequency for CO2 conversion increases linearly with Ni particles size. Such behavior may be explained by the dependence of CO/CH4 production rate on the metal particle size.
Such a scenario may be further explained by the dependence of the chemical state of a metal on its particle size. Smaller particles, interacting with the support, are partially oxidized, and therefore are catalytically active for the reverse water gas shift, producing selectively CO. Increasing the metal loading results in larger particles, with a more metallic behavior, that favor the H2 chemisorption leading to pure methanation catalyst [28].
4. Materials and Methods
4.1. Catalysts’ Synthesis
Catalysts were prepared by hydrothermal one-pot method: stoichiometric amounts of cerium (III) nitrate hexahydrate and of nickel (II) nitrate hexahydrate were dissolved in 40 mL of water under stirring. The complete precipitation of salts was obtained adding drop by drop a solution NaOH 12 M up to reach pH = 8, and then stirring the slurry for 30 min. The slurry was then heated at 110 °C for 24 h in hydrothermal condition in a steel reactor with Teflon liner. The precipitated powder was filtered and washed, first with water and then with ethanol, up to neutral pH (pH = 6–7). The wet powder was dried in air and finally calcined at 500 °C for 5 h.
4.2. Catalysts’ Characterization
Powder X-ray diffraction was undertaken using a Philips X-Pert Pro 500 with a Cu Kα source (λ = 1.5418 Å) and a Brag-Brentano θ–θ configuration in 10°–80° = 2θ range (0.05° step size 3 s acquisition time). The crystallite sizes (d) were estimated from the Ni (111), NiO (200) and CeO2 (111) reflections by Scherrer’s Equation (3):
d = Kλ/(βcosθ)
The BET surface area of catalyst was measured using a Micromeritics Gemini V apparatus. Before measurement, catalysts were degassed at 300 °C in He for 1 h. The surface area was calculated by the BET method in the pressure range 0.05 < p/p° < 0.3. The BET surface area S.A. was normalized by the mass fraction of nickel (WNi) by Equation (4):
(S.A.)norm = (S.A.)/(1 − WNi)
The pore size distribution was obtained from the desorption branch by the Barrett–Halenda (BJH) method.
H2–TPR and H2–TPD were performed by a Thermo Scientific TPDRO1100 instrument. The calcined sample was pre-treated flowing 20 cm3 min−1 of 5% O2/He gas mixture at 500 °C for 1 h and then cooled down to 50 °C in He. Then, 5% H2/Ar gas mixture (30 cm3 min−1) was fed into the reactor and the temperature was raised to 500 °C, with a heating rate of 10 °C min−1, holding at 500 °C for 1 h. The sample was then cooled down to 50 °C. H2 desorption was subsequently performed flowing Ar from 50 °C up to 500 °C (30 cm3 min−1, heating rate 20 °C min−1). The active particle size of Ni, dNiTPD (nm), and the percentage of Ni dispersion, DNi (%), were calculated by Equations (5) and (6), respectively:
dNiTPD(nm) = (105fWNi)/(ρNiηH2NASfANi)
DNi (%) = 100 × ηH2SfMNi/WNi
- f = geometrical shape factor, 6 for a spherical particle
- WNi = Ni metal weight percentage in the sample
- ρNi = density of Ni: 8.9 g/cm3
- ηH2 = H2 desorbed in the H2-TPD experiment: mol/g of sample
- NA = 6.023 × 10²³
- Sf = stoichiometric factor for H2 chemisorption: metal mol/gas mol = 2
- ANi = area occupied by Ni surface atom: 6.51 × 10⁻¹⁶ cm2
- MNi = Ni atomic mass: 58.69 g/mol
Nanorod morphology and chemical composition of the samples were determined by a FE-SEM (ZEISS SIGMA 300) equipped with energy dispersive spectroscopy (EDS) at 15.0 kV under a high vacuum. EDS was performed pressing sample powder at 280 MPa into pellet and analyzing several spots with size 10 × 10 μm2. For each sample, the chemical composition was evaluated as mean value.
4.3. Catalytic Activity Tests
The activity of catalysts for the methanation of CO2 was measured in a quartz reactor (6 mm-diameter) operating at atmospheric pressure, connected to a flow line equipped with independent mass flow controllers. A mass of 0.040 g of catalyst, diluted with 0.100 g of silicon carbide was in situ reduced with 50% H2/N2 flow (50 cm3 min−1), increasing the temperature from room temperature (RT) up to 500 °C, and isothermally kept at this temperature for 1 h. The temperature was measured by a thermocouple in contact within the catalyst bed. Reaction feed was 10 cm3 min−1 for CO2, 40 cm3 min−1 for H2, 20 cm3 min−1 N2, 130 cm3 min−1 He, total flow 200 cm3 min−1. After catalyst reduction, the reaction mixture feed was flowed through the reactor at 500 °C. The catalytic run was performed in temperature range 500 °C to 250 °C with decrements of 25 °C. Each temperature step was maintained for 30 min. H2O was removed from the flow before the analysis by a cold trap. The dry gas was analyzed online by a gas chromatograph (Agilent 7820) equipped with a Molecular Sieve X13 and a Hayesep Q columns and a thermal conductivity detector (TCD). CO2 conversion (XCO2), CH4 yield (YCH4) and CO yield (YCO) were calculated using Equations (7)–(9), respectively, where %CO2, %CH4 and %CO are the OUTLET gas volume concentrations:
XCO2 = 100 × (%CO + %CH4)/(%CO2 + %CO+ %CH4)
YCH4 = 100 × %CH4/(%CO2 + %CO + %CH4)
YCO = 100 × %CO/(%CO2 + %CO + %CH4)
Carbon balance (Cbalance) was calculated by Equation (10):
where Fin and Fout and are the inlet and outlet flows respectively. Carbon balance was very close to 100% at each temperature.
Cbalance (%) = 100 × Fout (%CO2 + %CO + %CH4)out/Fin × %CO2in
The TOF for CO2 conversion was calculated using the following Equation (11):
TOF (s−1) = 104 FCO2XCO2MNi/(mWNiDNi)
- FCO2 = molar flow of CO2: mol/s
- XCO2 = conversion of CO2: %
- m = catalyst mass: g
5. Conclusions
The turnover frequency for CO2 conversion increased linearly with Ni particle size. Smaller Ni nanoparticles appeared less active.
The excess of hydrogen in the reagent mixture caused an increase of 40%–60% of CO2 conversion and of 70%–100% of CH4 yield, with a decrease of CO production up to 50%. The selectivity to methane depended on nickel content, being larger on more concentrated samples.
The CO2 methanation over nickel supported on ceria with nanorod morphology showed catalytic behaviors that can be explained by the dependence of CO/CH4 selectivity on nickel particle size, suggesting a structure-sensitivity of the reaction.
Author Contributions
Conceptualization, S.T. and I.L.; methodology, S.T. and I.L.; investigation, E.M.; writing—original draft preparation, S.T. and I.L.; writing—review and editing, S.T. and I.L.
Funding
This research received no external funding.
Conflicts of Interest
The authors declare no conflict of interest.
References
- De Vito, C.; Ferrini, V.; Mignardi, S.; Cagnetti, M.; Leccese, F. Progress in carbon dioxide sequestration via carbonation of aqueous saline wastes. Periodico di Mineralogia 2012, 81, 333–344. [Google Scholar] [CrossRef]
- Tuti, S.; Luisetto, I.; Leccese, F.; Kesavan, J.K.; Casciardi, S. Nickel supported on Y2O3-ZrO2 as highly selective and stable CO2 methanation catalyst for in-situ propellant production on Mars. In Proceedings of the 2018 5th IEEE International Workshop on Metrology for AeroSpace (MetroAeroSpace), Rome, Italy, 20–22 June 2018; pp. 435–439. [Google Scholar] [CrossRef]
- Della Pietra, M.; Santarelli, M.; Stendardo, S.; McPhail, S.; Perez-Trujillo, J.P.; Elizalde-Blancas, F. Integration of a calcium looping process (CaL) to molten carbonate fuel cells (MCFCs), as carbon concentration system: First findings. J. CO2 Util. 2018, 25, 14–21. [Google Scholar] [CrossRef]
- Wang, W.; Wang, S.; Ma, X.; Gong, J. Recent advances in catalytic hydrogenation of carbon dioxide. Chem. Soc. Rev. 2011, 40, 3703–3727. [Google Scholar] [CrossRef] [PubMed]
- Kesavan, J.K.; Luisetto, I.; Tuti, S.; Meneghini, C.; Battocchio, C.; Iucci, G. Ni supported on YSZ: XAS and XPS characterization and catalytic activity for CO2 methanation. J. Mater. Sci. 2017, 52, 10331–10340. [Google Scholar] [CrossRef]
- Kesavan, J.K.; Luisetto, I.; Tuti, S.; Meneghini, C.; Iucci, G.; Battocchio, C.; Mobilio, S.; Casciardi, S.; Sisto, R. Nickel supported on YSZ: The effect of Ni particle size on the catalytic activity for CO2 methanation. J. CO2 Util. 2018, 23, 200–211. [Google Scholar] [CrossRef]
- Luisetto, I.; Tuti, S.; Romano, C.; Boaro, M.; Di Bartolomeo, E. Dry reforming of methane over Ni supported on doped CeO2: New insight on the role of dopants for CO2 activation. J. CO2 Util. 2019, 30, 63–78. [Google Scholar] [CrossRef]
- Luisetto, I.; Sarno, C.; De Felicis, D.; Basoli, F.; Battocchio, C.; Tuti, S.; Licoccia, S.; Di Bartolomeo, E. Ni supported on γ-Al2O3 promoted by Ru for the dry reforming of methane in packed and monolithic reactors. Fuel Process. Technol. 2017, 158, 130–140. [Google Scholar] [CrossRef]
- Luisetto, I.; Tuti, S.; Battocchio, C.; Lo Mastro, S.; Sodo, A. Ni/CeO2-Al2O3 catalysts for the dry reforming of methane: The effect of CeAlO3 content and nickel crystallite size on catalytic activity and coke resistance. Appl. Catal. A Gen. 2015, 500, 12–22. [Google Scholar] [CrossRef]
- Luisetto, I.; Tuti, S.; Di Bartolomeo, E. Co and Ni supported on CeO2 as selective bimetallic catalyst for dry reforming of methane. Int. J. Hydrog. Energy 2012, 37, 15992–15999. [Google Scholar] [CrossRef]
- Meylan, F.D.; Moreau, V.; Erkman, S. Material constraints related to storage of future European renewable electricity surpluses with CO2 methanation. Energy Policy 2016, 94, 366–376. [Google Scholar] [CrossRef]
- Rönsch, S.; Schneider, J.; Matthischke, S.; Schlüter, M.; Götz, M.; Lefebvre, J.; Prabhakaran, P.; Bajohr, S. Review on methanation—From fundamentals to current projects. Fuel 2016, 166, 276–296. [Google Scholar] [CrossRef]
- Frontera, P.; Macario, A.; Ferraro, M.; Antonucci, P. Supported Catalysts for CO2 Methanation: A Review. Catalysts 2017, 7, 59. [Google Scholar] [CrossRef]
- Aziz, M.A.A.; Jalil, A.A.; Triwahyono, S.; Ahmad, A. CO2 methanation over heterogeneous catalysts: Recent progress and future prospects. Green Chem. 2015, 17, 2647–2663. [Google Scholar] [CrossRef]
- Younas, M.; Loong Kong, L.; Bashir, M.J.K.; Nadeem, H.; Shehzad, A.; Sethupathi, S. Recent Advancements, Fundamental Challenges, and Opportunities in Catalytic Methanation of CO2. Energy Fuels 2016, 30, 8815–8831. [Google Scholar] [CrossRef]
- Ocampo, F.; Louis, B.; Roger, A.-C. Methanation of carbon dioxide over nickel-based Ce0.72Zr0.28O2 mixed oxide catalysts prepared by sol–gel method. Appl. Catal. A 2009, 369, 90–96. [Google Scholar] [CrossRef]
- Iglesias, I.; Quindimil, A.; Mariño, F.; De-La-Torre, U.; González-Velasco, J.R. Zr promotion effect in CO2 methanation over ceria supported nickel catalysts. Int. J. Hydrog. Energy 2019, 44, 1710–1719. [Google Scholar] [CrossRef]
- Lei, Y.; Li, W.; Liu, Q.; Lin, Q.; Zheng, X.; Huang, Q.; Guan, S.; Wang, X.; Wang, C.; Li, F. Typical crystal face effects of different morphology ceria on the activity of Pd/CeO2 catalysts for lean methane combustion. Fuel 2018, 233, 10–20. [Google Scholar] [CrossRef]
- Du, X.; Zhang, D.; Shi, L.; Gao, R.; Zhang, J. Morphology Dependence of Catalytic Properties of Ni/CeO2 Nanostructures for Carbon Dioxide Reforming of Methane. J. Chem. Chem. C 2012, 116, 10009–10016. [Google Scholar] [CrossRef]
- Wang, S.; Zhao, L.; Wang, W.; Zhao, Y.; Zhang, G.; Ma, X.; Gong, J. Morphology control of ceria nanocrystals for catalytic conversion of CO2 with methanol. Nanoscale 2013, 5, 5582–5588. [Google Scholar] [CrossRef]
- Kwak, J.H.; Kovarik, L.; Szanyi, J. CO2 Reduction on Supported Ru/Al2O3 Catalysts: Cluster Size Dependence of Product Selectivity. ACS Catal. 2013, 3, 2449–2455. [Google Scholar] [CrossRef]
- Kwak, J.H.; Kovarik, L.; Szanyi, J. Heterogeneous Catalysis on Atomically Dispersed Supported Metals: CO2 Reduction on Multifunctional Pd Catalysts. ACS Catal. 2013, 3, 2094–2100. [Google Scholar] [CrossRef]
- Wu, H.C.; Chang, Y.C.; Wu, J.H.; Lin, J.H.; Lin, I.K.; Chen, C.S. Methanation of CO2 and reverse water gas shift reactions on Ni/SiO2 catalysts: The influence of particle size on selectivity and reaction pathway. Catal. Sci. Technol. 2015, 5, 4154–4163. [Google Scholar] [CrossRef]
- Beierlein, D.; Häussermann, D.; Pfeifer, M.; Schwarz, T.; Stöwe, K.; Traa, Y.; Klemm, E. Is the CO2 methanation on highly loaded Ni-Al2O3 catalysts really structure-sensitive? Appl. Catal. B Environ. 2019, 247, 200–219. [Google Scholar] [CrossRef]
- Takeguchi, T.; Furukawa, S.-n.; Inoue, M. Hydrogen Spillover from NiO to the Large Surface Area CeO2–ZrO2 Solid Solutions and Activity of the NiO/CeO2–ZrO2 Catalysts for Partial Oxidation of Methane. J. Catal. 2001, 202, 14–24. [Google Scholar] [CrossRef]
- Jalowiecki-Duhamel, L.; Zarrou, H.; D’Huysser, A. Hydrogen production at low temperature from methane on cerium and nickel based mixed oxides. Int. J. Hydrog. Energy 2008, 33, 5527–5534. [Google Scholar] [CrossRef]
- Zhang, Y.; Liu, B.; Tu, B.; Dong, Y.; Cheng, M. Redox cycling of Ni–YSZ anode investigated by TPR technique. Solid State Ion. 2005, 176, 2193–2199. [Google Scholar] [CrossRef]
- Perrichon, V.; Laachir, A.; Bergeret, G.; Fréty, R.; Tournayan, L.; Touret, O. Reduction of cerias with different textures by hydrogen and their reoxidation by oxygen. J. Chem. Soc. Faraday Trans. 1994, 90, 773–781. [Google Scholar] [CrossRef]
- Sing, K.S.W.; Everett, D.H.; Haul, R.A.W.; Moscou, L.; Pierotti, R.A.; Rouquerol, J.; Siemieniewska, T. Reporting Physisorption Data for Gas Solid Systems with Special Reference to the Determination of Surface–Area and Porosity (Recommendations 1984). Pure Appl. Chem. 1985, 57, 603–619. [Google Scholar] [CrossRef]
- Gao, J.; Wang, Y.; Ping, Y.; Hu, D.; Xu, G.; Gu, F.; Su, F. A thermodynamic analysis of methanation reactions of carbon oxides for the production of synthetic natural gas. RSC Adv. 2012, 2, 2358. [Google Scholar] [CrossRef]
- Yabe, T.; Sekine, Y. Methane conversion using carbon dioxide as an oxidizing agent: A review. Fuel Process. Technol. 2018, 181, 187–198. [Google Scholar] [CrossRef]
Figure 1.
X-ray diffraction (XRD) patterns of NixCe catalysts: (a) calcined; (b) reduced at 500 °C.

Figure 2.
H2-temperature-programmed reduction (TPR) analysis: (a) profiles of pure r-CeO2 and NixCe catalysts; (b) theoretical (●) and experimental (o) total H2 consumption as a function of Ni wt%. The Ni wt% of samples are reported in Table 1.
Figure 2.
H2-temperature-programmed reduction (TPR) analysis: (a) profiles of pure r-CeO2 and NixCe catalysts; (b) theoretical (●) and experimental (o) total H2 consumption as a function of Ni wt%. The Ni wt% of samples are reported in Table 1.

Figure 3.
Brunauer–Emmet–Teller (BET) analysis of NixCe catalysts: (a) nitrogen adsorption and desorption isotherms as a function of p/p°; (b) PSD pore size distribution.
Figure 3.
Brunauer–Emmet–Teller (BET) analysis of NixCe catalysts: (a) nitrogen adsorption and desorption isotherms as a function of p/p°; (b) PSD pore size distribution.
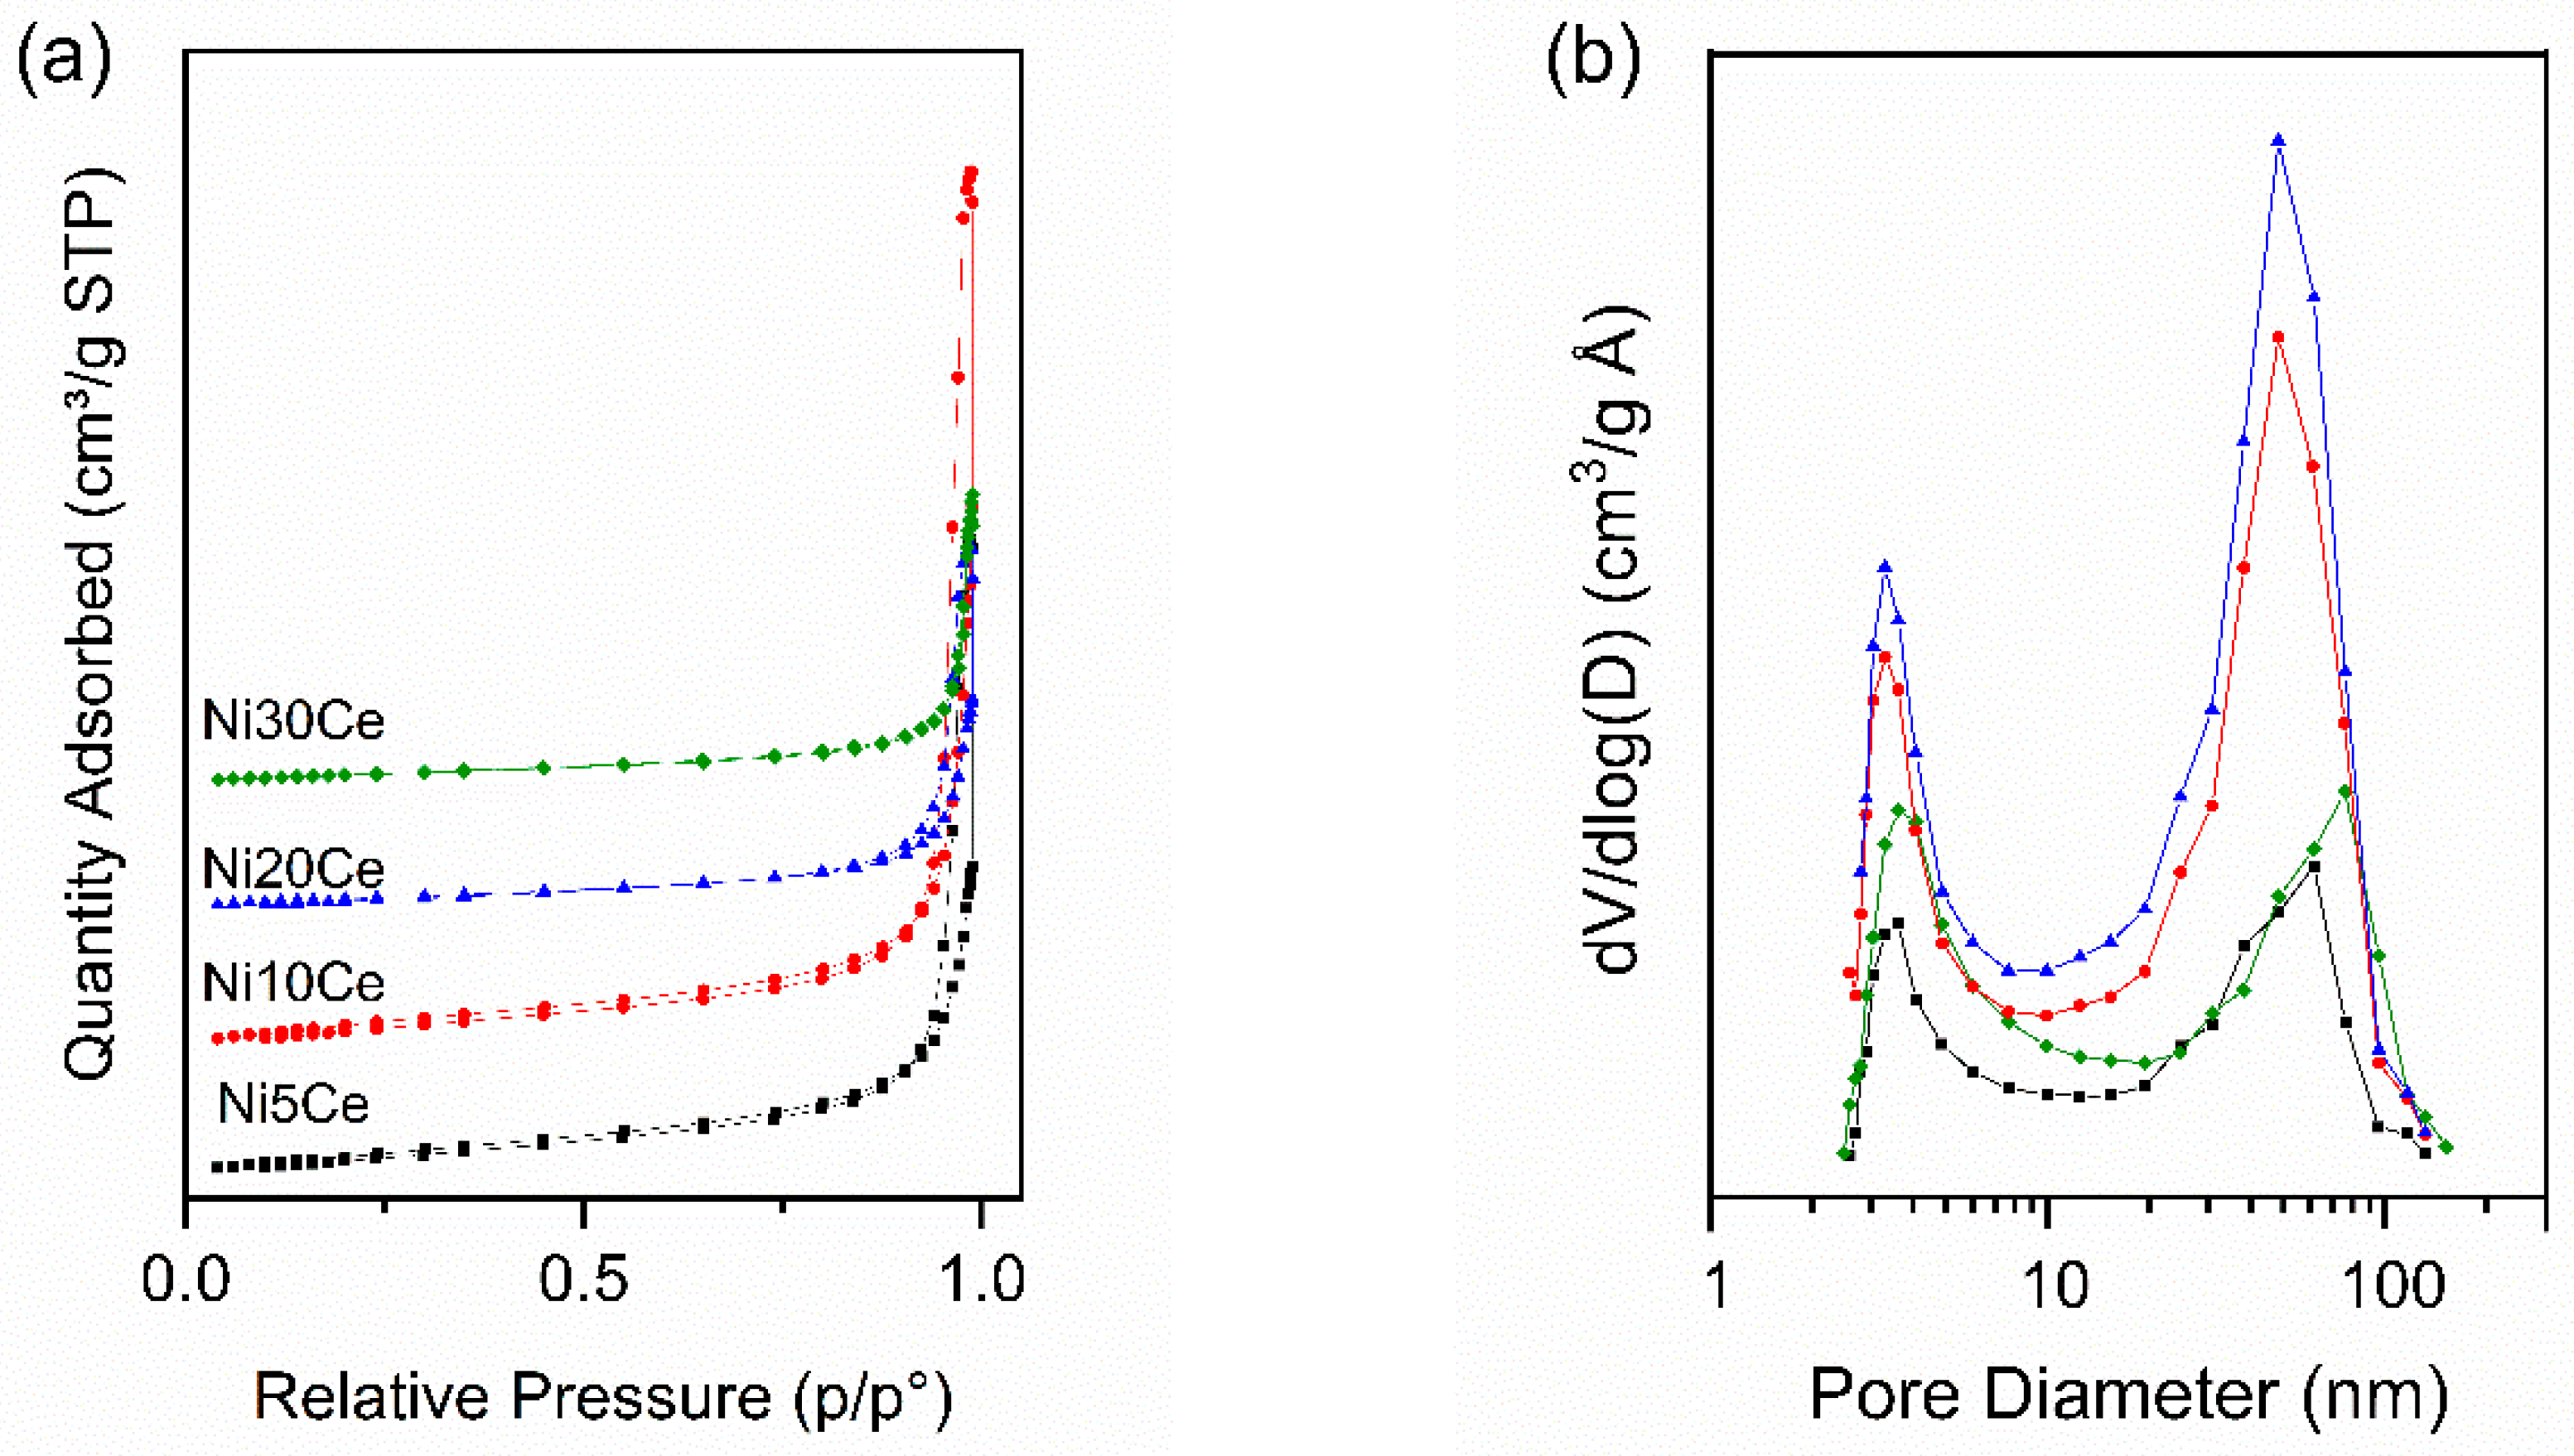
Figure 4.
Field-emission scanning electron microscopy (FE-SEM) images of catalysts reduced at 500 °C with the corresponding length and width histogram distributions.
Figure 4.
Field-emission scanning electron microscopy (FE-SEM) images of catalysts reduced at 500 °C with the corresponding length and width histogram distributions.
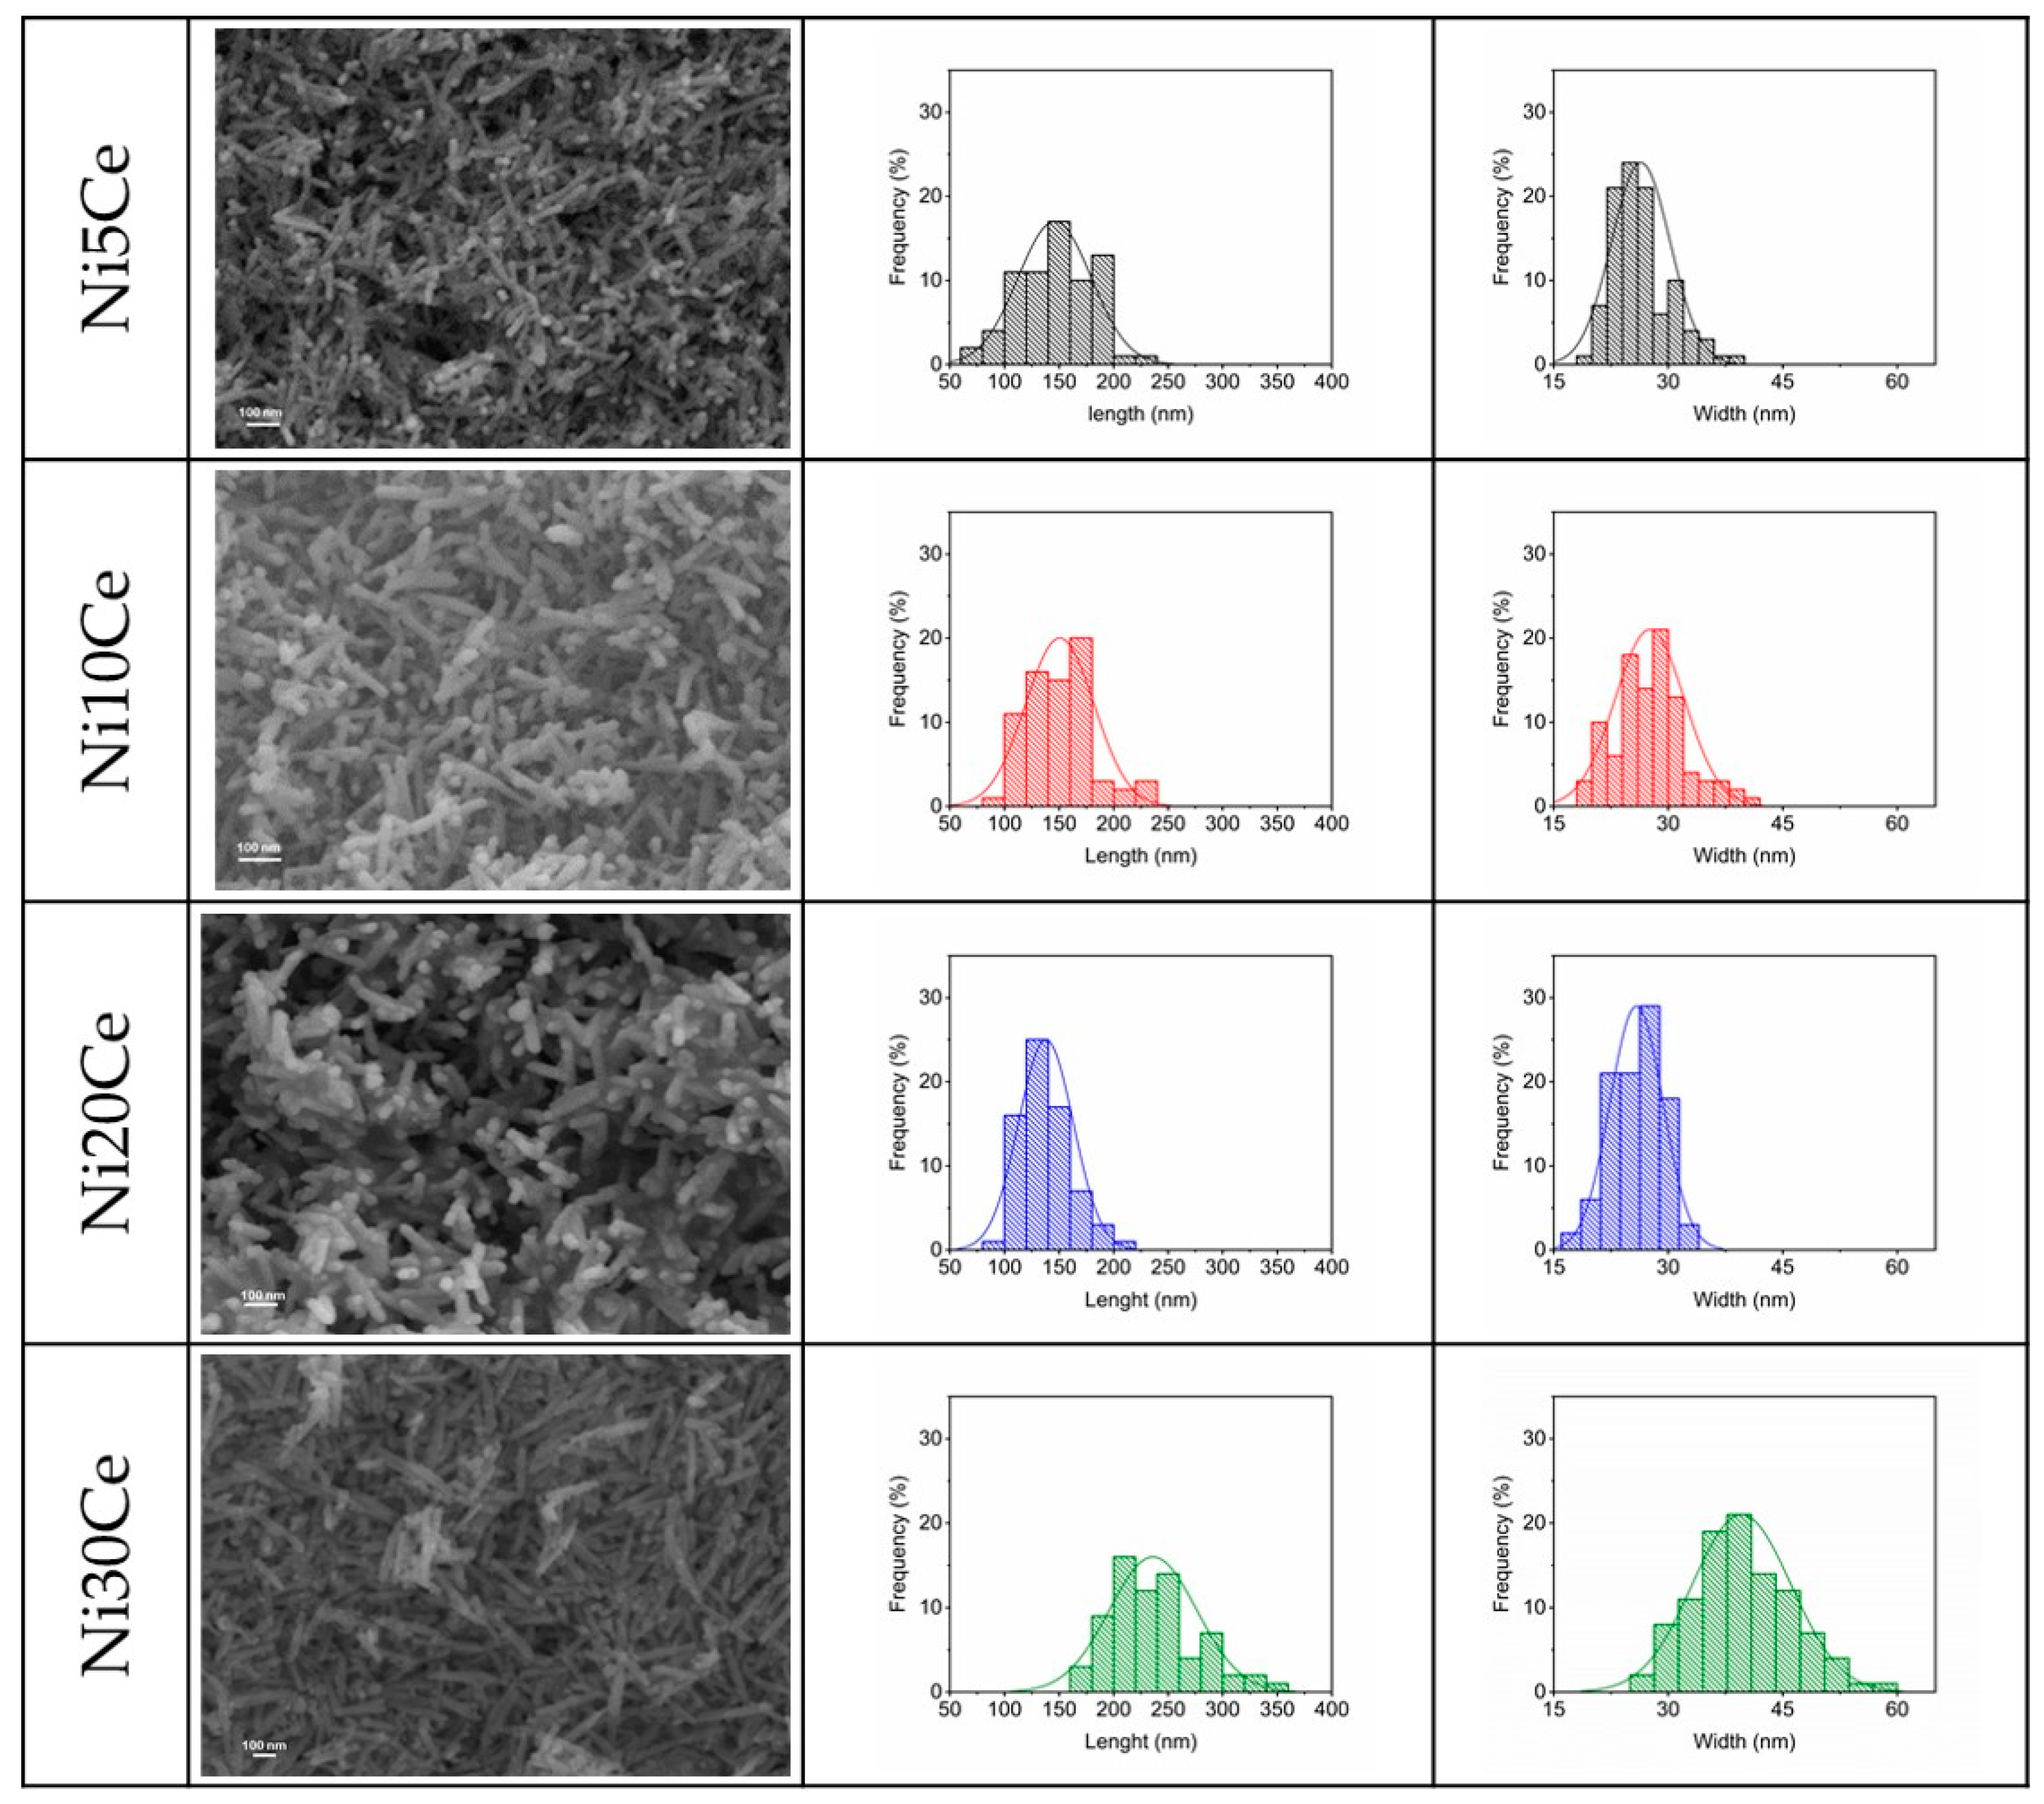
Figure 5.
Catalytic activity: CO2 conversion (a), CH4 yield (b) and CO yield (c) as a function of temperature; reaction conditions: reactant mixture CO2:H2:N2:He = 1:4:2:13, catalyst mass = 40 mg, gas hourly space velocity (GHSV) = 300 L g−1 h−1. Percentage variation of the CO2 conversion, CH4 yield and CO yield, increasing the H2/CO2 ratio from 4 to 8 (d): reactant mixture CO2:H2:N2:He = 1:8:2:9, catalyst mass = 40 mg, GHSV = 300 L g−1 h−1.
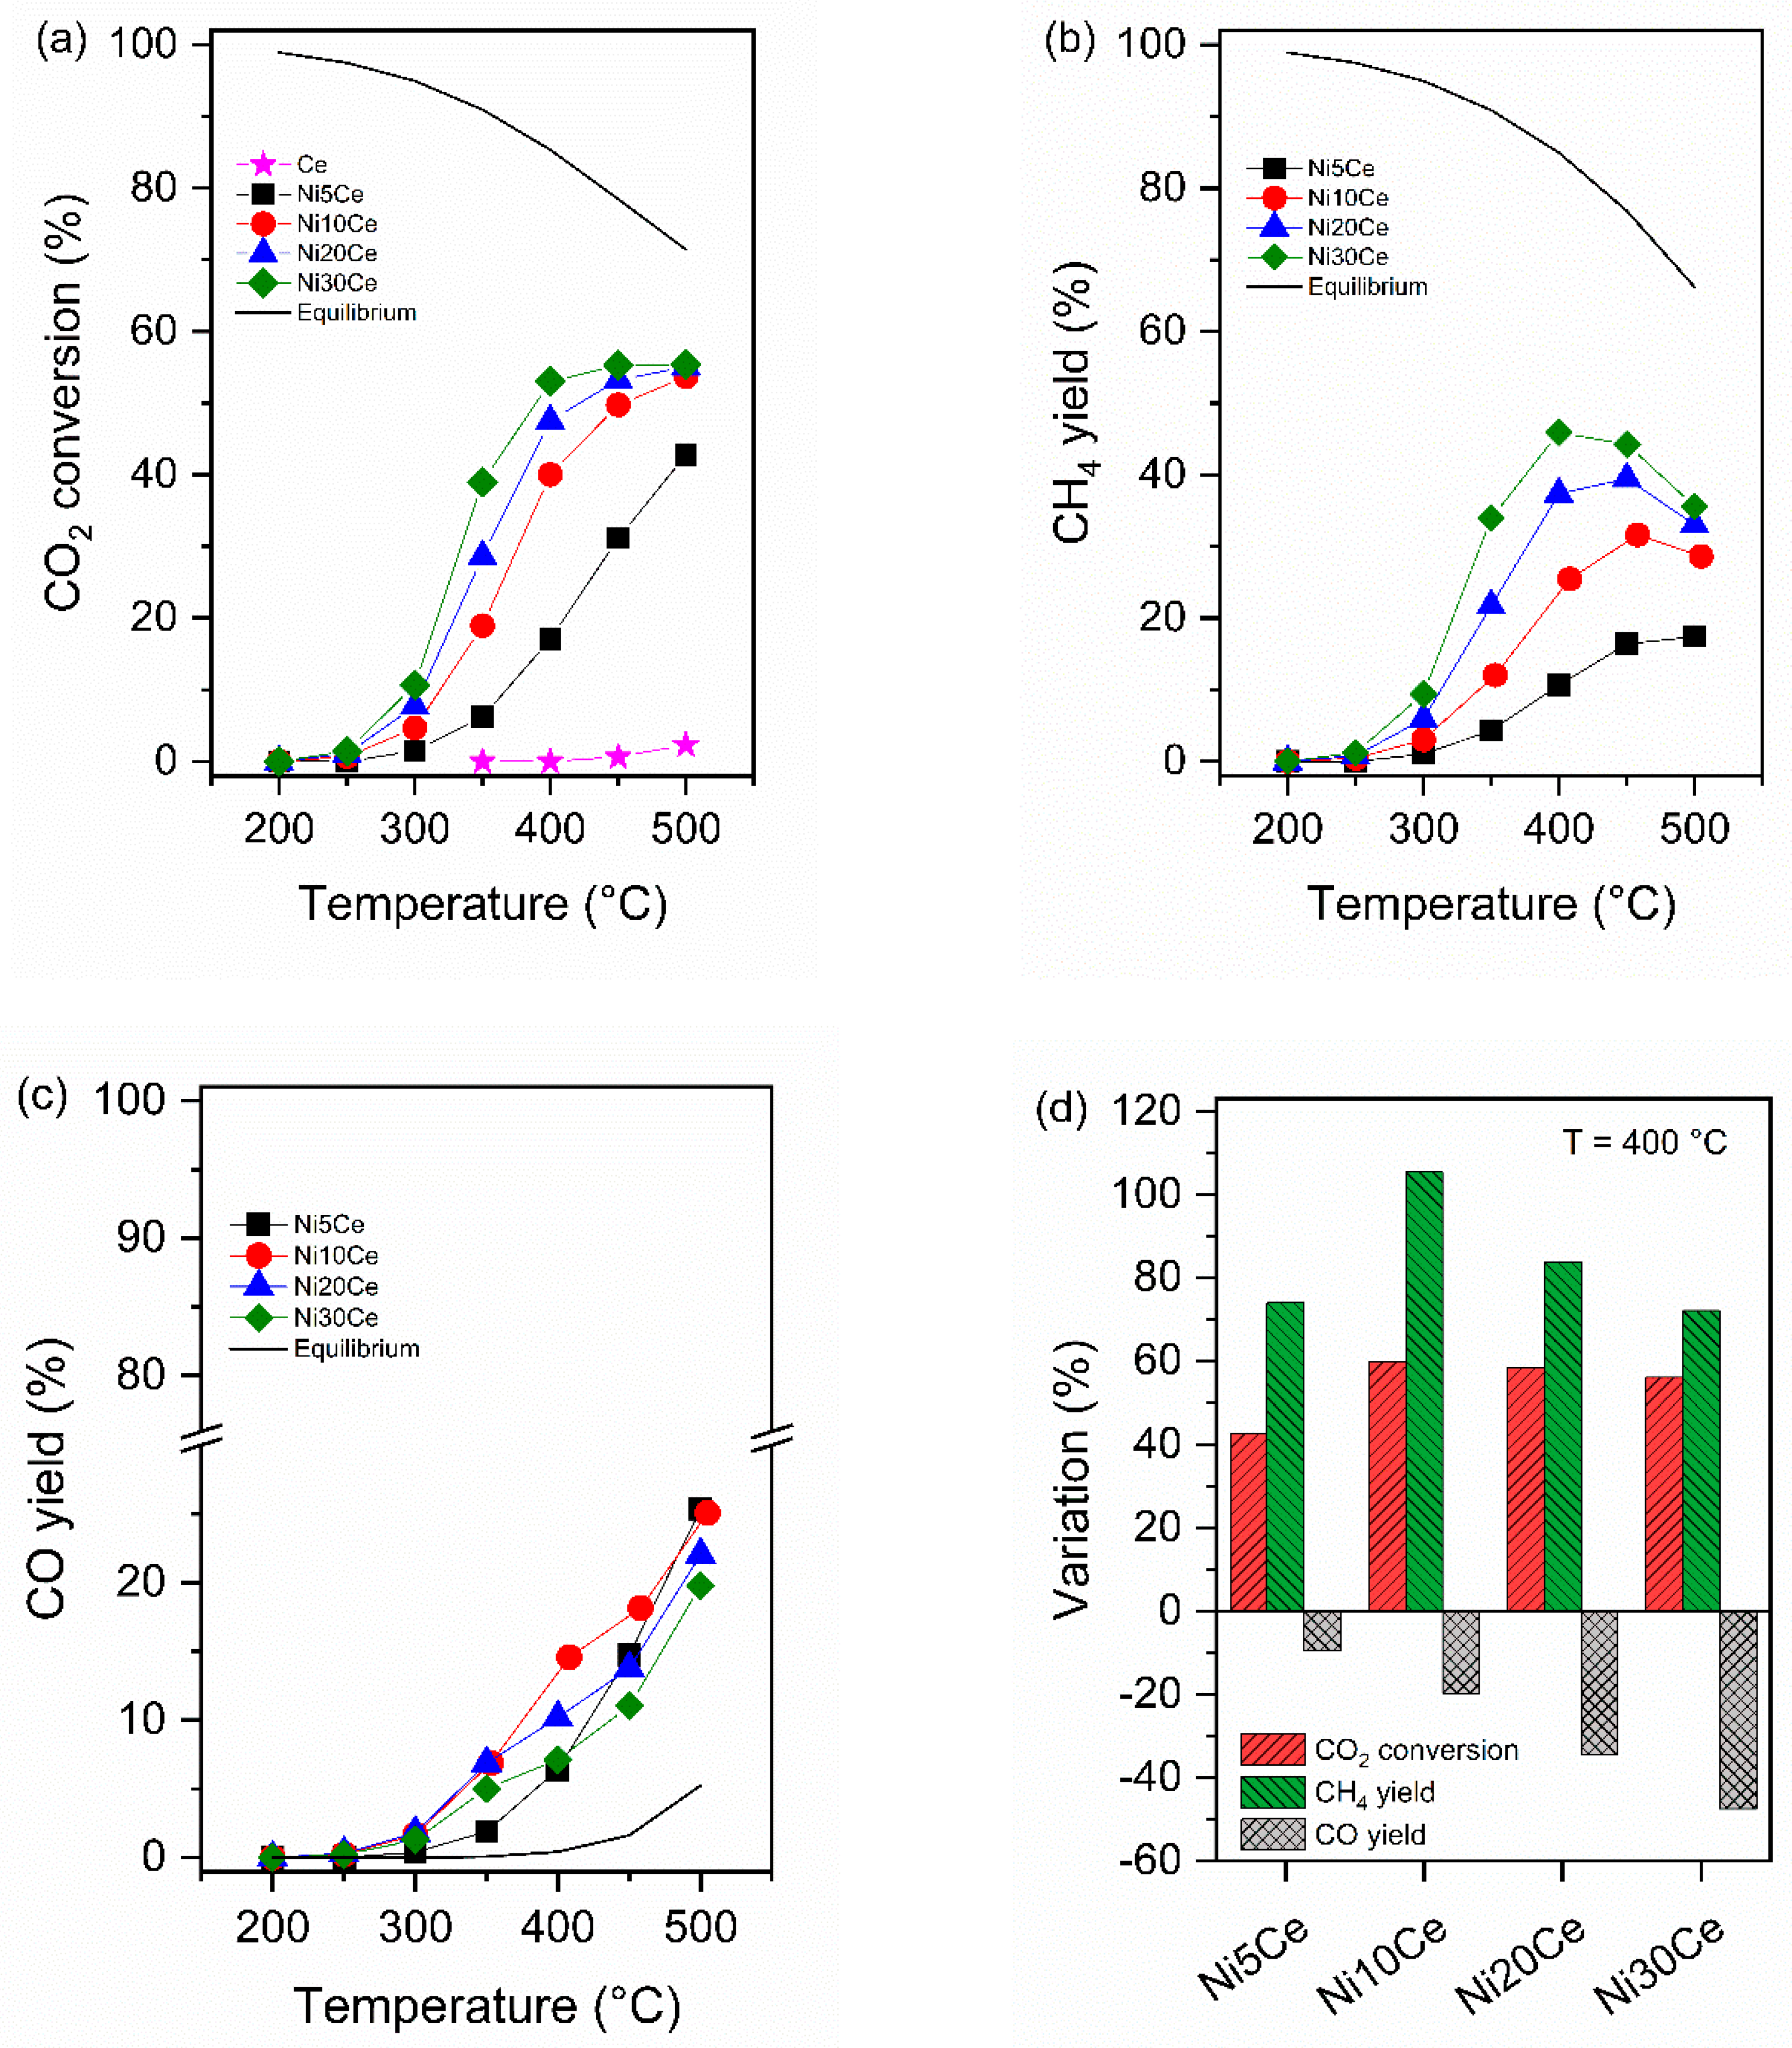
Figure 6.
Turnover frequency of CO2 conversion as a function of the average Ni particle size; reaction conditions: reactant mixture CO2:H2:N2:He = 1:4:2:13, catalyst mass = 40 mg, GHSV = 300 L g−1 h−1.
Figure 6.
Turnover frequency of CO2 conversion as a function of the average Ni particle size; reaction conditions: reactant mixture CO2:H2:N2:He = 1:4:2:13, catalyst mass = 40 mg, GHSV = 300 L g−1 h−1.


Table 1.
Chemical composition, textural properties and crystallite size of catalysts.
| Chemical CompositionEDAX (wt%) | S.A. (m2g−1) | S.A.norm (m2g−1) | Pore Volume (cm3g−1) | Pore Size (nm) | dCeO2XRD (nm) | dNiOXRD (nm) | dNiXRD1 (nm) | ||
|---|---|---|---|---|---|---|---|---|---|
| Ni | Ce | ||||||||
| Ni5Ce | 1.69 | 84.31 | 73 | 74 | 0.49 | 32 | 11.9 | 13.6 | 14.9 |
| Ni10Ce | 5.38 | 83.12 | 65 | 69 | 0.68 | 39 | 12.8 | 21.0 | 19.0 |
| Ni20Ce | 8.46 | 81.64 | 34 | 37 | 0.28 | 32 | 20.2 | 19.7 | 21.0 |
| Ni30Ce | 13.38 | 73.90 | 28 | 32 | 0.21 | 30 | 18.1 | 18.1 | 27.3 |
1 on reduced samples.
Table 2.
Cerium reducibility and nickel dispersion.
| Sample | Ni mmol/g | Ce mmol/g | Total H2 Consumption 1 mmol/g | H2/Ni 2 mmol/mmol | H2 Consumption for Ce4+ Reduction 3 (mmol g−1) | Ce3+ 4 (%) | dNiTPD (nm) | DNi (%) |
|---|---|---|---|---|---|---|---|---|
| Ni5Ce | 0.29 | 5.71 | 0.87 | 3.00 | 0.58 | 20 | 3.2 | 32.0 |
| Ni10Ce | 0.92 | 5.54 | 0.98 | 1.06 | 0.08 | 2.9 | 12.0 | 8.5 |
| Ni20Ce | 1.44 | 5.24 | 1.46 | 1.02 | 0.02 | 1.0 | 44.2 | 2.3 |
| Ni30Ce | 2.28 | 4.90 | 2.26 | 1.00 | 0.0 | 0.0 | 46.8 | 2.2 |
1 Experimental total H2 consumption up to 500 °C. 2 Experimental ratio: (total H2 mol)/(Ni mol). 3 H2 consumed in Ce4+ reduction, calculated as: total H2 for nickel reduction minus theoretical H2 for nickel reduction: Ni2+ + H2 → Ni0 + 2H+. 4 Ce4+ reduced to Ce3+ (as percentage): 2Ce4+ + H2 → 2Ce3+ + 2H+.
Table 3.
Average values with standard deviation of length, width and aspect ratio of ceria nanorods.
Table 3.
Average values with standard deviation of length, width and aspect ratio of ceria nanorods.
| Length (nm) | Width (nm) | Aspect Ratio | |
|---|---|---|---|
| Ni5Ce | 145.9 ± 33.6 | 26.4 ± 3.9 | 5.5 ± 2.1 |
| Ni10Ce | 150.5 ± 31.4 | 27.6 ± 4.6 | 5.4 ± 2.1 |
| Ni20Ce | 137.8 ± 25.0 | 25.8 ± 3.5 | 5.3 ± 1.7 |
| Ni30Ce | 236.1 ± 40.2 | 39.6 ± 6.5 | 6.0 ± 1.9 |
© 2019 by the authors. Licensee MDPI, Basel, Switzerland. This article is an open access article distributed under the terms and conditions of the Creative Commons Attribution (CC BY) license (http://creativecommons.org/licenses/by/4.0/).
Share and Cite
MDPI and ACS Style
Marconi, E.; Tuti, S.; Luisetto, I. Structure-Sensitivity of CO2 Methanation over Nanostructured Ni Supported on CeO2 Nanorods. Catalysts 2019, 9, 375. https://doi.org/10.3390/catal9040375
AMA Style
Marconi E, Tuti S, Luisetto I. Structure-Sensitivity of CO2 Methanation over Nanostructured Ni Supported on CeO2 Nanorods. Catalysts. 2019; 9(4):375. https://doi.org/10.3390/catal9040375
Chicago/Turabian StyleMarconi, Eleonora, Simonetta Tuti, and Igor Luisetto. 2019. "Structure-Sensitivity of CO2 Methanation over Nanostructured Ni Supported on CeO2 Nanorods" Catalysts 9, no. 4: 375. https://doi.org/10.3390/catal9040375
Note that from the first issue of 2016, this journal uses article numbers instead of page numbers. See further details here.