1. Introduction
Solid oxide fuel cells (SOFCs) have been developed for several decades as a power production technology [
1]. More recently, their suitability in “power to gas” or “power to chemicals” processes as efficient energy converters was pointed out in several studies addressing the need to store/convert peak and intermittent energy production from renewable sources [
2,
3]. For these reasons, scientific and technological development of SOFCs is still highly pursued, aiming to better cell architectures and materials, among other aspects. Standard SOFCs are configured as anode-supported cells, but lots of work is being dedicated to metal-supported [
4], protonic [
5], and dual cells [
6,
7].
Regardless of the architecture, the cathode is the major source of energy losses, due to limited activity towards the oxygen reduction reaction (ORR), deriving from intrinsic electrocatalytic properties of active materials as well as from the microstructure [
8,
9,
10].
State of the art cathodes are made of an oxide ion conductor, typically doped ceria, and a mixed ionic–electronic conductor, like (La,Sr)(Co,Fe)O
3 with perovskite structure (LSCF). A number of alternative compositions have been proposed to reduce the polarization losses of SOFC cathodes, including Ba-based perovskites, like Ba
0.5Sr
0.5Co
0.8Fe
0.2O
3−δ (BSCF) [
11,
12,
13]. This material has shown high efficiency thanks to the possibility to stabilize oxygen vacancies at a high concentration within its structure. Oxygen stoichiometry is also believed to influence the electronic properties of BSCF, as metallic behavior was reported for heavily oxidized material [
14]. However, structural instability has been thoroughly reported at temperatures of interest for SOFCs, i.e., in the range 600–800 °C, resulting in the formation of a hexagonal structure with a similar composition but poor conductivity and, sometimes, also associated with the formation of other oxides, like CoO and Ba
0.4Sr
0.6O [
15,
16]. The phase transition is believed to be related to the oxidation and spin-state transition of Co ions, which are characterized by slow kinetics; for this reason, a progressive deterioration of performance is observed in BSCF cathodes over many hundreds of hours [
17]. The detailed mechanism was elucidated by a series of studies, combining several analysis techniques and first principles calculations [
18,
19,
20,
21]. In summary, if the Fermi level is located at a Co–O band, any variation in the concentration of oxygen vacancies will affect the electron configuration of the Co ions [
22]. Therefore, when the temperature is raised, e.g., during sintering, oxygen is released from structure and electrons are accumulated in the Co band (Co reduction). On the contrary, when BSCF is equilibrated at intermediate temperatures, oxygen is incorporated again, its band occupancy increases as well as the valence of Co. The first consequence is the quick formation of an intermediate phase, characterized by a stacked sequence of layers with cubic or hexagonal structure and by barium cobaltites with various stoichiometries. Grains of this phase have plate-like shape and composition similar to that of BSCF, with some enrichment in Co.
The plate-like phase is preferentially formed at grain boundaries and at the surface of CoO particles, if present. After 50–100 h of equilibration at T = 700–800 °C, the plate-like phase transforms into the hexagonal one, which is believed to be detrimental for oxide ionic conduction [
23].
Reactivity of BSCF with CO
2 has also been investigated in order to explain the conductivity drop in gas separation membranes and fuel cells when CO
2 is employed as a sweep gas. Formation of carbonates at the surface was observed when exposing BSCF to 1% of CO
2 at low temperature (450 °C) [
24].
Impedance spectroscopy is a powerful tool routinely employed to study polarization phenomena in SOFC electrodes. Extraction of information needs processing of impedance spectra, which can be carried out at various levels of precision and complexity. For a rough global description of the system, complex impedance (Z) data are arranged into Nyquist (−ImZ vs. ReZ) or spectroscopic (ReZ vs. f or −ImZ vs. f) Bode plots and visual or graphical inspection is carried out. For more detailed analysis, fitting data to a model impedance function corresponding to a linear combination of ideal equivalent circuits (EqC) is applied [
25]. The EqC method allows for easy assignment of various parts of the spectra to different microscopic phenomena, provided that a reliable physical model is available for the system under study. In order to analyze data without the need of underlying models, a different approach can be used, based on the determination of a distribution function of relaxation times (RTs) which completely describes the system [
26]. The distribution function can be obtained by solving an equation of the type:
where
are the impedance experimental data,
is the resistance at high frequency,
is the polarization resistance, and
is a normalized function:
This is an ill-posed inverse problem and many different solutions (
) are possible. In addition, the solution might be unstable so that different approaches for the regularization are available in the literature [
27]. DRT analysis is generally useful to evaluate time constants of main phenomena taking place in the system but can also be considered as a tool to help finding an equivalent circuit that can be used to fit impedance.
In previous works, some of the authors investigated the stability of BSCF cathodes both under different cathodic polarization conditions and for long operation at open circuit voltage (OCV) conditions, reporting the formation of the hexagonal phase and an increasing total polarization resistance with time [
28,
29].
In this work, some experimental data about BSCF cathodes are presented and analyzed by both the EqC and the DRT methods, in order to get insight into the degradation of this material over 250 h of operation and to make a comparison between the two methods of analysis of impedance data.
2. Results
XRD characterization of as-combusted powders showed the presence of carbonates, spinel phase, and some Co in metallic state, without any detectable amount of the perovskite. After calcination at 950 °C, the abovementioned mixture was completely converted into the cubic (Pm-3m) perovskite phase (ICDD, 109462). More details are reported elsewhere [
28,
30].
The microstructure of a BSCF cathode is presented in
Figure 1, both as-sintered and after electrochemical testing. The as-sintered layer is characterized by large pores, in the 10 µm range, quite homogenously distributed in the whole volume. Some submicron particles are present at the surface of the grains, which were already reported in BSCF powders prepared by combustion synthesis and calcined at 950 °C [
30]. Some modifications appear at the surface of grains, where acicular particles are formed. Such structures are reported as a hexagonal phase with composition Ba
0.75Sr
0.25CoO
3 [
28] and originating from the decomposition of cubic BSCF taking place at temperatures below 800 °C [
31].
Impedance data collected at 600 °C and with different cathodic polarization (bias) values are reported in
Figure 2 as Bode plots. One major relaxation is visible in the plots as indicated by the broad peak in
Figure 2b centered at about 1 Hz. The asymmetric shape of this peak suggests the presence of another process with a quite similar time constant. For this reason, data were fitted to an equivalent circuit model composed by a series of three loops, in agreement with previous work on similar systems [
28]: a resistance (R
0), a parallel resistance/constant phase element (R
i/CPE), and a parallel resistance/capacitance (R
s/C
chem).
Impedance measurements were also carried out at 700 °C under the same conditions and fitted with the same equivalent circuit model. Results are shown in
Figure 3, where it is possible to see that, at higher temperature, relaxations are shifted towards higher frequency in comparison with data recorded at 600 °C.
From each spectrum at both temperatures and for each bias level, the RT (τ) of each reactive loop was obtained by the relation:
where, in case of the CPE element, the capacitance
Cel is given by
and
Ri,
Q,
n are the parameters of the
Ri/CPE loop.
The DRT analyses carried out on the same abovementioned impedance measurements are reported in
Figure 4. The distribution function G is represented vs. frequency (
f), which is linked to RT (
τ) by the formula:
At 600 °C (
Figure 4a), all distribution functions present three peaks, significantly affected by bias potential, except the one at 300 Hz. In raising the temperature to 700 °C (
Figure 4b), the main peak was shifted towards higher frequency, while the one at 300 Hz was not affected by temperature or by bias potential. The RTs were calculated using Equation (5), after fitting the resolved DRT peaks with Gaussian functions and using the frequency of their maxima as characteristic frequency of each component. An example of fitting with Gaussian components is shown in
Figure 4c, where solid, dashed, and dotted black lines refer to the three main contributions to DRT function.
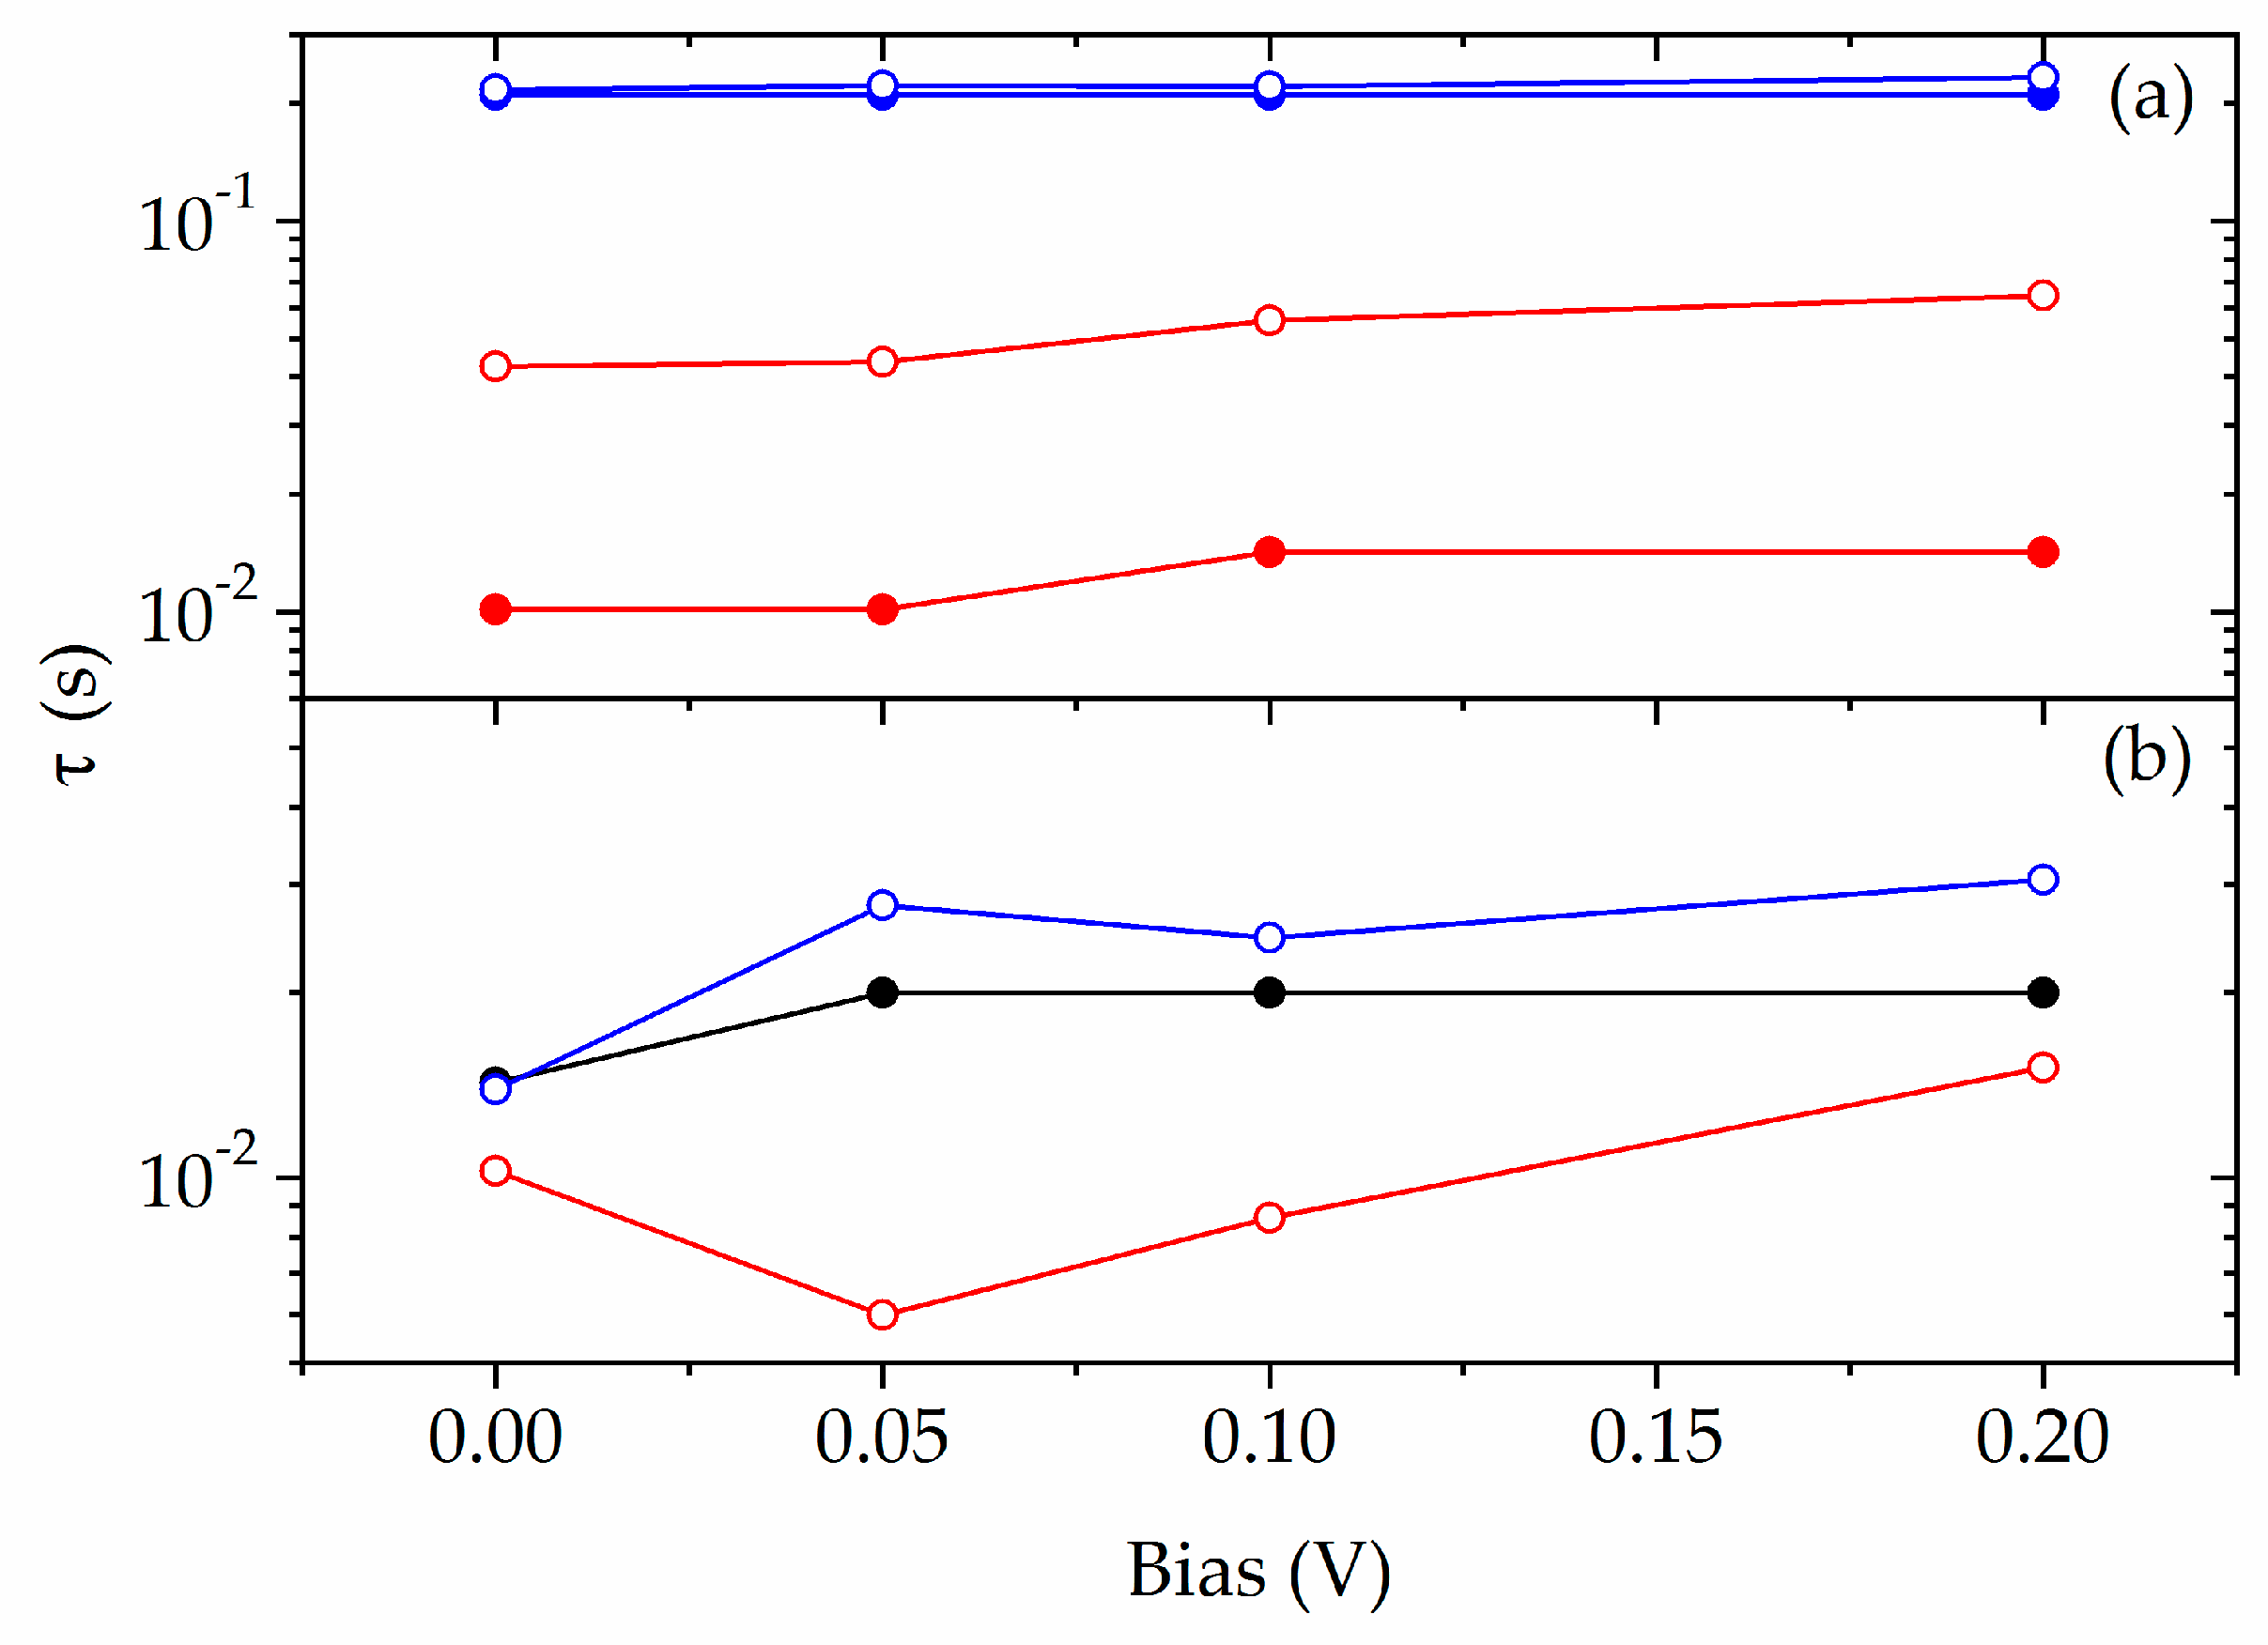
In
Figure 5, the comparison among RTs obtained by both EqC and DRT methods is presented. In general, there is a good agreement among the RTs, especially at 600 °C (
Figure 5a) in the main component at τ ≈ 0.2 s. On the contrary, a systematic shift towards lower values is observed in the τ obtained by DRT for the other component, which is associated with lower resistance (
Figure 5a). At 700 °C (
Figure 5b), only one component could be resolved by DRT (black points), with an RT close to that of the EqC component at about 0.03 s (blue points).
The effects of long time permanence at 700 °C on the electrochemical behavior of BSCF cathodes were also investigated. The results of impedance measurements at various times between 0 and 250 h are reported in
Figure 6a, together with the result of fittings by the EqC method. It can be observed that the relaxation peak is progressively shifted towards lower frequencies and its shape is distorted. This evolution is better highlighted by the DRT analysis, presented in
Figure 6b.
The apparently single component which is visible at 10 Hz at the beginning of the test is progressively resolved into two components that appear well separated after 250 h. The RTs obtained for this series of measurements are shown in
Figure 7a. During the first 50 h, only one time constant is available from DRT (black points), which is an average of RT extracted from EqC. On the contrary, there is a very good agreement between EqC and DRT after 100 h, i.e. when the DRT starts to be resolved in two components (red and blue points). From the figure, it can be estimated that the RTs of two components need to differ by at least one order of magnitude to be adequately separated in the DRT plot.
Figure 7b reports the total polarization resistance, which increases all along the duration of the aging, together with R
s and R
i calculated by the EqC method. It must be pointed out that the main contribution to polarization at long times is due to the component at higher frequency, as indicated by the shape of DRT curves in
Figure 6b and of Ri in 7b.
3. Discussion
The DRT analysis of impedance spectroscopy data collected on BSCF cathodes was demonstrated to be a useful guide for more detailed analyses to be carried out by using the EqC method. However, DRT results cannot be taken without some critical insight, which is necessary to avoid misinterpretation.
In particular, it is known that when the number of measurements is less than 50–100 points per decade (ppd), some apparent relaxations are present in the distribution function plot of distributed elements. Specifically, when dealing with CPE elements, a small peak at high frequency, approximately 2 orders of magnitudes apart from the main resonant frequency, appears at about 10 ppd [
32]. Resolution of multiple time constants is also deeply affected by ppd, requiring a frequency separation larger than one order of magnitude when standard ppd not exceeding 10 is used, due to broadening of the distribution function [
32].
Therefore, it can be assumed that the peak at about 300 Hz, which is always present in the DRT plots and is not influenced by operative parameters (time, temperature, and bias voltage), is only due to discretization of impedance data and can be neglected in the discussion of material properties.
From data collected at 600 °C and at various bias potentials, it looks reasonable to describe the system with two time constants (
Figure 4a), i.e., with equivalent circuit with two loops. In
Figure 4b, the shape of DRT function does not allow for extraction of two time constants, but for consistency with measurements at lower T, it can be assumed that the RTs are closer than 1 order of magnitude (more precisely, the ratio of larger to lower RT is less than 10). The physical description of the electrochemical behavior of a mixed ionic–electronic cathode on a pure ionic conductor was given, for instance in [
33]. The oxygen exchange reaction is well approximated by a R
s/C
chem loop, where the capacitive term is defined “chemical capacitance” and is associated to the volume density of charged point defects, like oxygen vacancies. The second term is also approximated by a R/C or R
i/CPE and is associated with ionic conduction and charge transfer at electrode–electrolyte interface [
28]. The chemical capacitance loop is characterized by larger time constant because is relevant to phenomena taking place at the gas–solid interface; consequently, it will be associated with the low-frequency section of the impedance spectrum. RT values presented in
Figure 5 are in agreement with abovementioned considerations: two time constants are individuated in the DRT at 600 °C, separated by more than one order of magnitude, which is no longer the case at 700 °C. In fact, at this temperature, the ratio of the two RTs obtained by EqC ranges between 2 and 4, depending on the bias voltage, and the single DRT time constant is closer to the step with larger resistance, i.e., at the low frequency.
Extending the 700 °C test up to 250 h allowed resolving the two time constants, again, because their ratio exceeded 10, starting from about 100 h. Looking at
Figure 7a, it is clear that both RTs keep increasing with time but with different rates, with that at low frequency being the fastest.
These analyses indicate that:
Oxygen surface exchange is the limiting step in pristine BSCF when T < 700 °C;
At 700 °C, the surface exchange kinetics, expressed by Rs, are much faster so that most of losses are due to ionic conduction inside the bulk of the electrode and at the electrode–electrolyte interface.
This is demonstrated by the significant increase of the RT associated to surface reaction and, more clearly, by the comparison of R
s with R
i shown in
Figure 7b.
Isothermal operation of the BSCF electrode mainly resulted in an increase of R
i along the aging time. The explanation of such behavior can be found in the formation of a secondary phase with poor ionic conductivity which reduces overall conduction, as mentioned in the introduction. This is also in agreement with previous results on samples prepared by the same technique and analyzed by X-ray diffraction after electrochemical tests [
28]. This phase decorates grain boundaries, as can be seen in
Figure 1b,d and, therefore, affects conductivity. On the contrary, R
s remained almost stable, indicating that oxygen surface exchange is not affected by long-term operation, although the significant increase of its time constant (
Figure 7a) implies the increase of the associated chemical capacitance. As the C
chem is proportional to charge stored in form of oxygen vacancies [
33], a progressive increase of this quantity would be derived from above considerations. As already mentioned, previous works about BSCF decomposition reported the sluggish formation of secondary phases with hexagonal structure and with general formulae Ba
0.6Sr
0.4CoO
3−δ or Ba
1−xSr
xCo
2−yFe
yO
5−δ, which leave the parent BSCF structure with excess Sr and Fe [
31]. The oxygen non-stoichiometry of the cubic–hexagonal mixture is generally lower than that of pure cubic BSCF [
17], meaning that phase transition is expected to reduce oxygen vacancies concentration. In order to rationalize the opposite behavior found here, it can be noted that impedance is sensitive to series combination only, meaning that if the secondary phases are organized as isolated domains, then low-frequency impedance, in particular, will be scarcely affected by their presence. Therefore, oxygen non-stoichiometry contributing to C
chem is that of a cubic BSCF, possibly increased by an excess of Sr and Fe. The overall impact of secondary phases formation is negative in any case, because of their reduced ionic conductivity.
4. Materials and Methods
BSCF powders were prepared by solution combustion synthesis starting from a sucrose (Eridania Italia S.p.A., Bologna, Italy) and polyethylene glycol (PEG, MW 20000, purum Fluka Chemie, GmbH, Buchs, Switzerland) fuel mixture. Ba(NO3)2 (99.1% WWR International, Fontenay-sous-Bois, France), Sr(NO3)2 (≥99.97% Alfa Aesar GmbH & Co KG, Karlsruhe, Germany), Co(NO3)2·6H2O (99.0% Fluka-Sigma-Aldrich Chemie GmbH, Steinheim, Germany) and Fe(NO3)3·9H2O (99.95% Sigma-Aldrich Chemie, GmbH, Schnelldorf; Germany) as metal precursors were intimately mixed with the fuel. The sucrose-to-metal cations and the reducer-to-oxidizer molar ratios were set at 2 and 3.1, respectively, by adding proper amounts of fuel mixture and NH4NO3 (≥99.5% BioXtra-Sigma-Aldrich Chemie, GmbH, Schnelldorf, Germany).
Mixtures were kept at 80 °C, under stirring, in order to form a gel, and then heated on a hot plate to initiate the combustion. The resulting black powder was eventually calcined in air at 950 °C for 5 h to allow for crystallization of desired phase.
Electrolyte-supported half-cells were prepared, starting from Ce
0.8Sm
0.2O
2−δ powder (SDC20-HP, Fuel Cell Materials). For each electrolyte support, 6.5 g of powder was weighed out and cold-pressed at 60 MPa. After sintering at 1500 °C for 5 h in air, SDC disk-shaped pellets with a diameter of 25 mm and a thickness of 1.2 mm were obtained. The electrodes were prepared as follows: the BSCF powder was mixed with alpha-terpineol (Sigma-Aldrich) and manually ground in a mortar, to form a paste suitable to be slurry-coated on the SDC surfaces. Two symmetrical circular electrodes, acting as the working and the counter electrode (WE and CE, respectively), were obtained. A ring-shaped electrode (1 mm wide) made of the same BSCF mixture was deposited around the WE at a distance equal to three-times the electrolyte thickness, to be used as reference electrode (RE) in the three-electrode configuration measurements [
34]. Surfaces of the electrolytes were scraped before electrode deposition in order to improve adhesion. After sintering at 1100 °C for 2 h, the thickness of WE and CE was 20 µm while their apparent geometric area was 0.28 cm
2.
The phase composition of powders and ceramics was analyzed by X-ray diffraction (XRD, D5000 Siemens-Bruker AXS Inc., Berlin, Germany)) and detailed results are reported in [
28], while the microstructure was determined by scanning electron microscopy (SEM, LEO 1450vp, Carl Zeiss Jena GmbH, Oberkochen , Germany) and energy dispersive X-ray spectroscopy (EDX, Oxford Instruments, Abingdon-on-Thames, UK).
The electrochemical behavior of the cathode/electrolyte system was investigated through impedance spectroscopy, placing the cell inside a home-designed test station, connected to a potentiostat coupled to a frequency response analyzer (PGSTAT302N, Metrohom Autolab B.V., Utrecht, NL). Different cathodic overpotentials (from 0.05 to 0.2 V) were superimposed to the perturbation voltage (amplitude 20 mV, 8 points per decade) to check the redox behavior of the system and to get information in real operating conditions. A Pt net was placed both on the WE and on the CE to collect the current, while three-electrode impedances (using a RE) were extracted. Impedance spectra were analyzed by the equivalent circuit fitting method (ZView, Scribner Associates) and by the distribution of relaxation times (DRT) approach.
In this paper, the DRT technique was applied following Ciucci group’s approach and tool [
35].

 ,
, 


