Article

Effect of Metal Loading in Unpromoted and Promoted CoMo/Al2O3–TiO2 Catalysts for the Hydrodeoxygenation of Phenol

by
J. Andrés Tavizón-Pozos
1,2,*,
Carlos E. Santolalla-Vargas
3,
Omar U. Valdés-Martínez
1 and
José Antonio de los Reyes Heredia
1,*
1
Departamento de Ingeniería de Procesos e Hidráulica, Universidad Autónoma Metropolitana-Iztapalapa, Av. San Rafael Atlixco No. 86, Col. Leyes de Reforma 1ª Secc., Iztapalapa, C.P. 09310 Ciudad de México, Mexico
2
Cátedras CONACyT-Área Académica de Química, Universidad Autónoma del Estado de 5 Hidalgo, Carr. Pachuca-Tulancingo Km. 4.5, C.P. 42184 Pachuca, Hidalgo, Mexico
3
Departamento de Biociencias e Ingeniería, Centro Interdisciplinario de Investigaciones y Estudios sobre Medio Ambiente y Desarrollo, Instituto Politécnico Nacional, C.P. 07340 Ciudad de Mexico, Mexico
*
Authors to whom correspondence should be addressed.
Catalysts 2019, 9(6), 550; https://doi.org/10.3390/catal9060550
Submission received: 29 May 2019 / Revised: 7 June 2019 / Accepted: 14 June 2019 / Published: 19 June 2019

Abstract

:
This paper reports the effects of changes in the supported active phase concentration over titania containing mixed oxides catalysts for hydrodeoxygenation (HDO). Mo and CoMo supported on sol–gel Al2O3–TiO2 (Al/Ti = 2) were synthetized and tested for the HDO of phenol in a batch reactor at 5.5 MPa, 593 K, and 100 ppm S. Characterization results showed that the increase in Mo loading led to an increase in the amount of oxide Mo species with octahedral coordination (MoOh), which produced more active sites and augmented the catalytic activity. The study of the change of Co concentration allowed prototypes of the oxide species and their relationship with the CoMo/AT2 activity to be described. Catalysts were tested at four different Co/(Co + Mo) ratios. The results presented a correlation between the available fraction of CoOh and the catalytic performance. At low CoOh fractions (Co/(Co + Mo) = 0.1), Co could not promote all MoS2 slabs and metallic sites from this latter phase performed the reaction. Also, at high Co/(Co + Mo) ratios (0.3 and 0.4), there was a loss of Co species. The Co/(Co + Mo) = 0.2 ratio presented an optimum amount of available CoOh and catalytic activity since the XPS results indicated a higher concentration of the CoMoS phase than at a higher ratio.

Graphical Abstract

1. Introduction

Studies on the transformation of fast pyrolysis oils from lignocellulosic biomass as an alternative to produce clean and renewable transportation fuels have been increasing for the last years [1,2,3]. Bio-oil, rich in oxygenated compounds (30%–40%), needs to be upgraded to enhance its heating value, chemical and thermal stability, and miscibility with fossil fuels [4]. To achieve this, catalytic hydrodeoxygenation (HDO) can be used to eliminate oxygen and to hydrogenate instaurations for hydrocarbons chains. HDO can proceed in a wide range of temperatures (200–400 °C) and pressure (1–7 MPa) [5,6]. Also, as some oxygenated molecules present in pyrolysis oils are soluble in water, aqueous phase reactions can be carried out in the presence of a catalyst [7,8]. However, the aqueous hydrodeoxygenation may only be effective for some fractions of the bio-oil. For the more refractory molecules, this process could take advantage of the current technology of typical hydrotreatment processes used for petroleum feeds since upgraded bio-oil can be blended with them and be transformed in the same step [5]. Several works have been focused on the improvement of their catalytic properties, for instance selectivity, activity, and active phase dispersion [2,9,10,11,12]. These studies have used resulting lignin representative probe molecules, for example, guaiacol, eugenol, furans, cresol, catechol, anisole, and phenol, to understand catalytic performance and functionalities [7,13,14,15]. Particularly, phenol has been used as a probe molecule since its reactions could expose information about the reactivity of the CAR–OH bond and hydrogenation capacity of the catalyst. Additionally, it is formed as a remnant of more complicated oxygen containing molecules [10,14,16,17]. HDO of phenol can proceed by two pathways: Hydrogenolysis or direct dehydrogenation (DDO) and hydrogenation (HYD) [10,17]. The DDO route consists in the cleavage of the CAR–OH bond (414 kJ/mol) to form benzene. For its part, the HYD route proceeds by hydrogenation of the π bonds of the aromatic ring to generate an oxygenated intermediate (O–I, cyclohexanol, and cyclohexanone). Therefore, the C–OH bond splits to produce cyclohexene and subsequently cyclohexane [10,17].
Typical hydrotreatment CoMo/Al2O3 sulfided catalysts have been used in HDO with probe molecules with promising results [10,13,18,19]. It is widely accepted that the active sites are located at the edges of the formed sulfided slabs. The Mo-edge has been attributed the role of hydrogenation due to its metallic character, whereas the active sites for hydrogenolysis path (C–O scission) have been identified as coordinatively unsaturated sites (CUSs) of sulfur at the S-edge on the MoS2 phase [20,21]. These sulfided vacancies possess an electrophilic character, where oxygen from phenol can adsorb and SH groups provide hydrogen to carry out the C–O bond cleavage [5,22]. When Co is added as a promoter atom, hydrotreatment activity increases significantly by the formation of the CoMoS II phase as proposed by Topsoe et al. [21]. In this highly active phase, it has been proposed that Co has a preference to be located at the S-edge on the MoS2 phase, which may promote the hydrogenolysis pathway [22,23]. Nonetheless, in HDO reactions, there is still debate concerning the way that the oxygenated functional groups of the molecules react on the different sulfide phases. On this regard, to achieve improvements of the catalysts by increasing the concentration of the CoMoS phase, the synergic effect of the Co concentration in the active sites for these reactions needs to be understood [24,25,26].
To develop highly active CoMoS catalysts supported on alumina, metal–support interaction (MSI) between oxide precursors for both metal sulfides is an important factor to tune for the supported active phase structure, dispersion, reducibility, and promotion [20,21,22]. One possible way is to modify Al-based mixed oxides, such as Al2O3–TiO2 (AT). This mixed oxide has been proposed as an alternative support to take advantage of the combined properties of alumina and titania [27,28,29,30,31,32,33]. It had displayed notorious improvements in the textural and physicochemical properties in comparison to alumina or titania supports [30,31,32,33,34]. Particularly, CoMoS supported over sol–gel synthetized Al2O3–TiO2 catalysts with an Al/Ti = 2 ratio (called “AT2”) showed that the interactions between the metal oxide phases and the support enhance the formation of the sulfided active phases compared to alumina, leading to higher activities [32,35,36,37]. In a previous work of the HDO of phenol, it was shown that CoMo/AT2 was twice as active and was more selective to the DDO route than CoMo/Al2O3 catalyst [34]. These results were attributed to a decrease in the MSI due to the presence of titania in the support. The differences in activity and selectivity were attributed to a higher fraction of supported MoOx species with octahedral coordination (MoOh) on AT2 than on alumina. These MoOh species are easier to reduce than MoOx with tetrahedral coordination (MoTh), which were more abundant on alumina [34]. As it has been reported, variations on metal loading may be induced in the formation of oxide species and therefore in the active phase formation [26]. Additionally, the Co/(Co + Mo) ratio must be optimized in order to avoid promoter loss into the support and segregation to complete the understanding of the synergic effect of the promoter on the MoS2 in CoMo/AT2 catalysts. However, there is no information about the effects of metal loadings on the formation of different species over AT supports, and their impact on the activity and selectivity of HDO reactions. Therefore, the objective of this work was gain further insight on the Co/(Co + Mo) ratio and its effect on C–O bond cleavage of CoMoS/AT catalyst for the HDO process using phenol as the model molecule.

2. Results and Discussion

2.1. Effect of Mo Loading

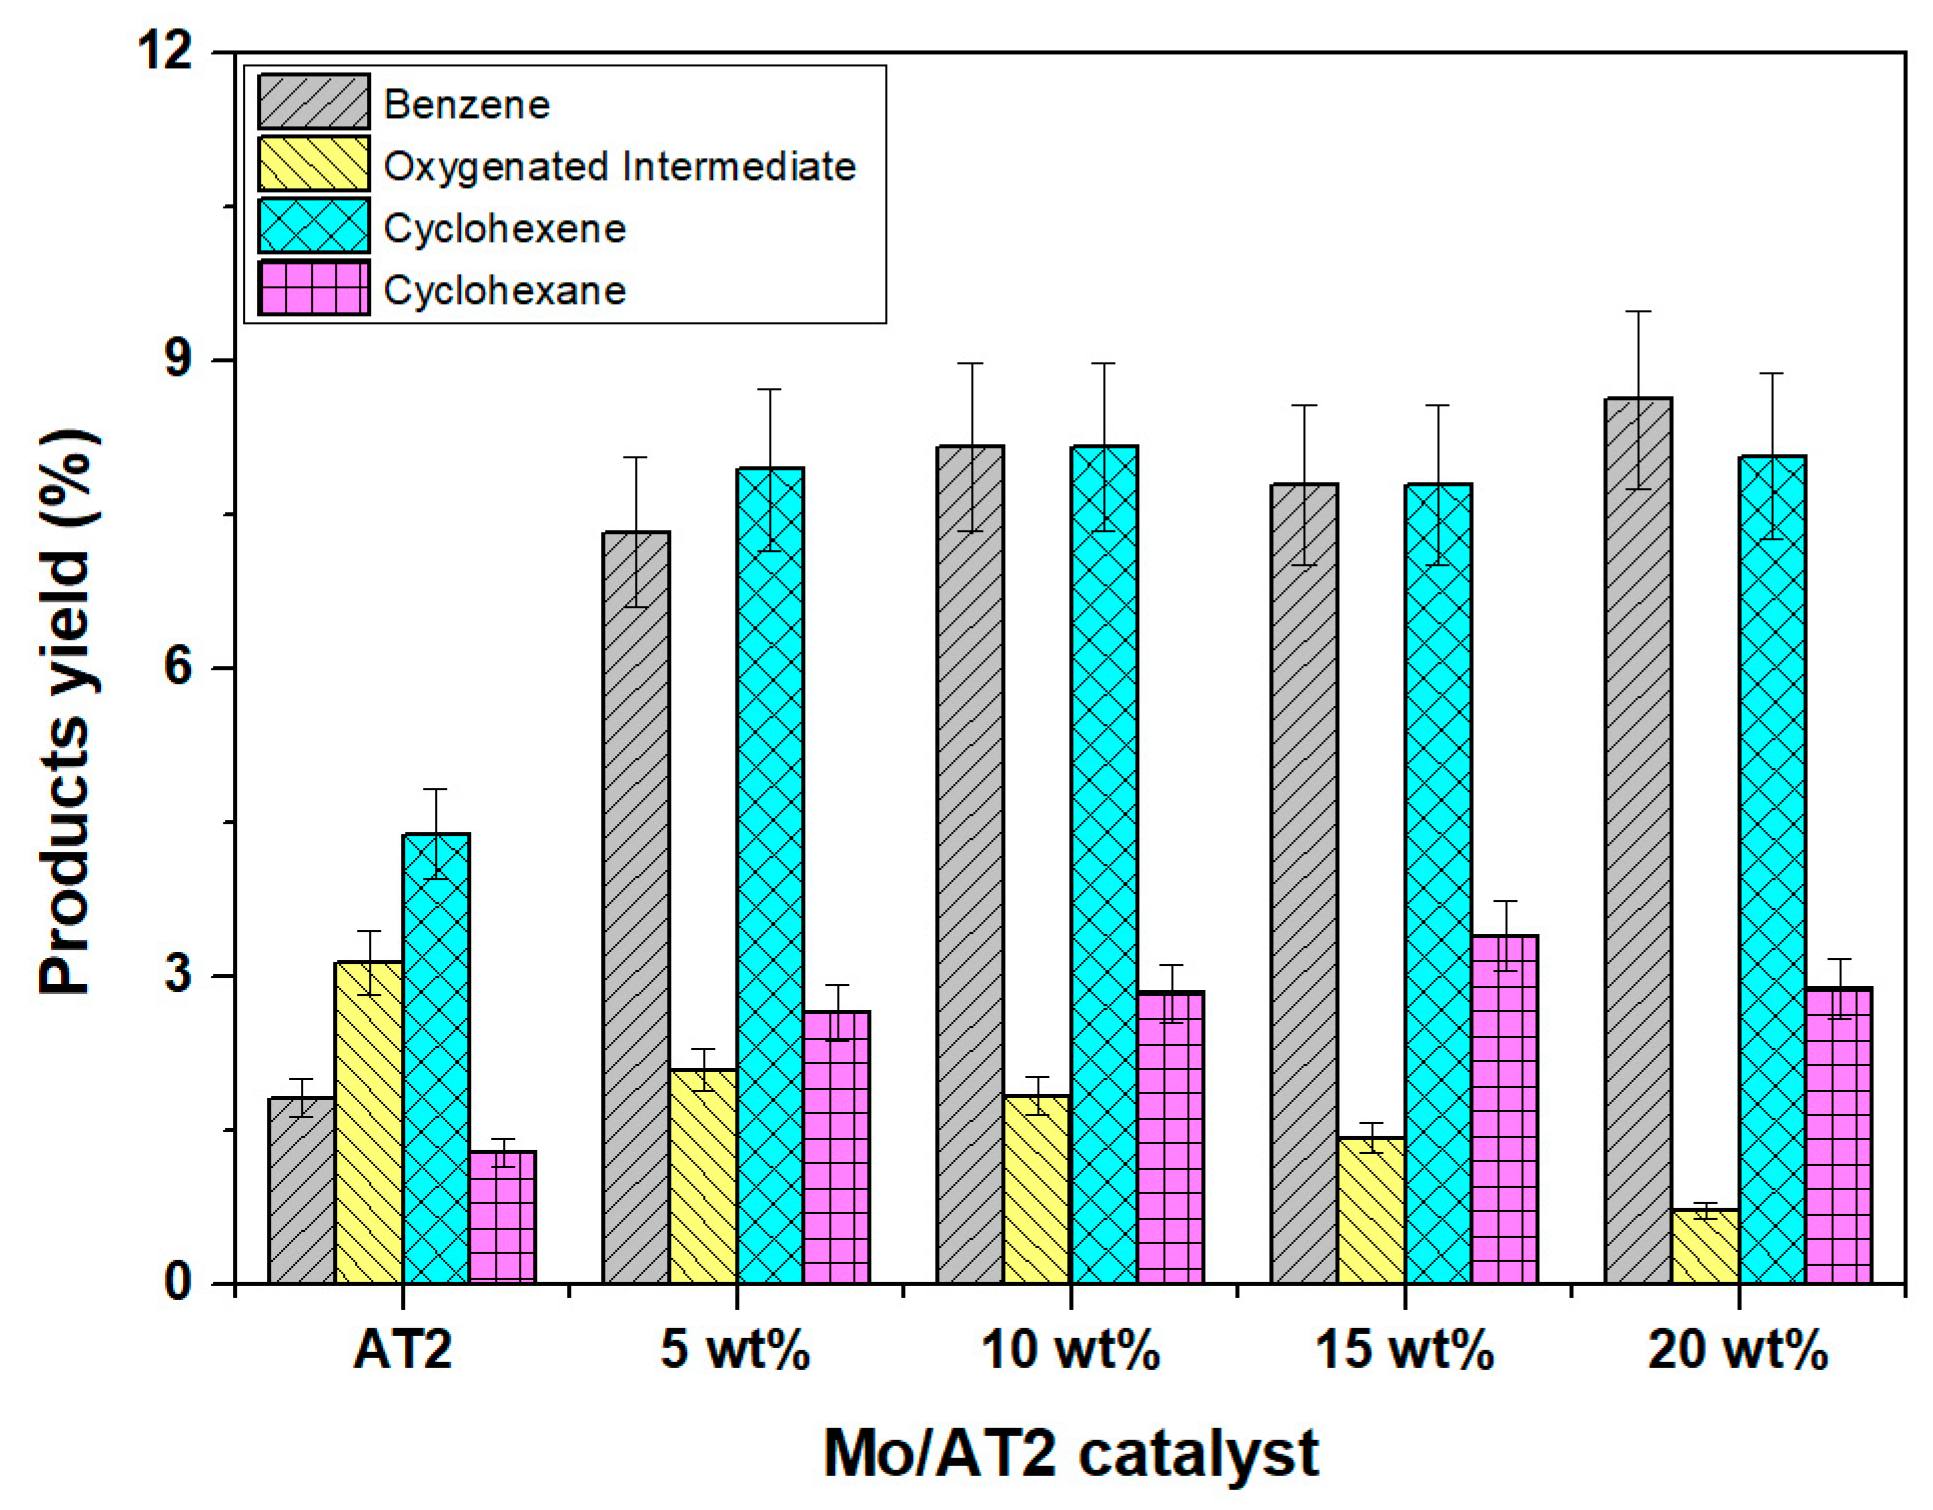
2.1.1. Catalytic Activity

The catalytic hydrodeoxygenation (HDO) experiments results, for non-promoted Mo catalysts are shown in Figure 1.
These results showed that the AT2 support was active and the initial reaction rate increased linearly with the Mo loading. Specifically, 5 wt.% Mo exhibited twice the activity of the support, while the activity for the 20 wt.% Mo catalyst was also five times higher. When the initial reaction rates were quantified by gram of supported Mo, a decrease was observed when the metal loading increased. However, at loadings higher than 10 wt.% Mo, activity remained constant. This may indicate that at this Mo loading, a monolayer was achieved. This result seems to be adequate to the system, since the Mo/Al2O3 monolayer coverage was near 10 wt.% Mo and 6.6 wt.% for Mo/TiO2 [38,39,40]. Selectivity data at 20% of phenol conversion are presented in Figure 2.
It was observed that the AT2 support alone mainly generated incomplete hydrogenation products, i.e., oxygenated intermediates (O–I, cyclohexanone, and cyclohexanol) and cyclohexene. Therefore, AT2 support presented a higher hydrogenation functionality than hydrogenolysis. However, it is possible that there were not enough sites to achieve cyclohexene hydrogenation. When Mo was added, even at low loadings, the product yields changed to an increase in benzene and cyclohexene production compared with the AT2 support. Also, as all Mo catalyst yields did not present significant changes, it is possible that the active sites’ nature was the same.
It has been suggested that S-edge sites are responsible for the hydrogenolysis pathway, while Mo-edge sites are responsible for hydrogenation reactions [5]. On this basis, it is possible to suggest that S-edge sites predominate in all Mo/AT2 catalysts since the hydrogenation of cyclohexene to cyclohexane was limited. This resulted in the capability to cleave the CAR–OH and the C–OH (C = O) bonds from the O–I to produce benzene and cyclohexene, respectively. However, the O–I yield decreased with the Mo loading. Therefore, it is possible to propose that both hydrogenolysis processes may occur in the same type of sites and their abundance increased with the Mo loading.

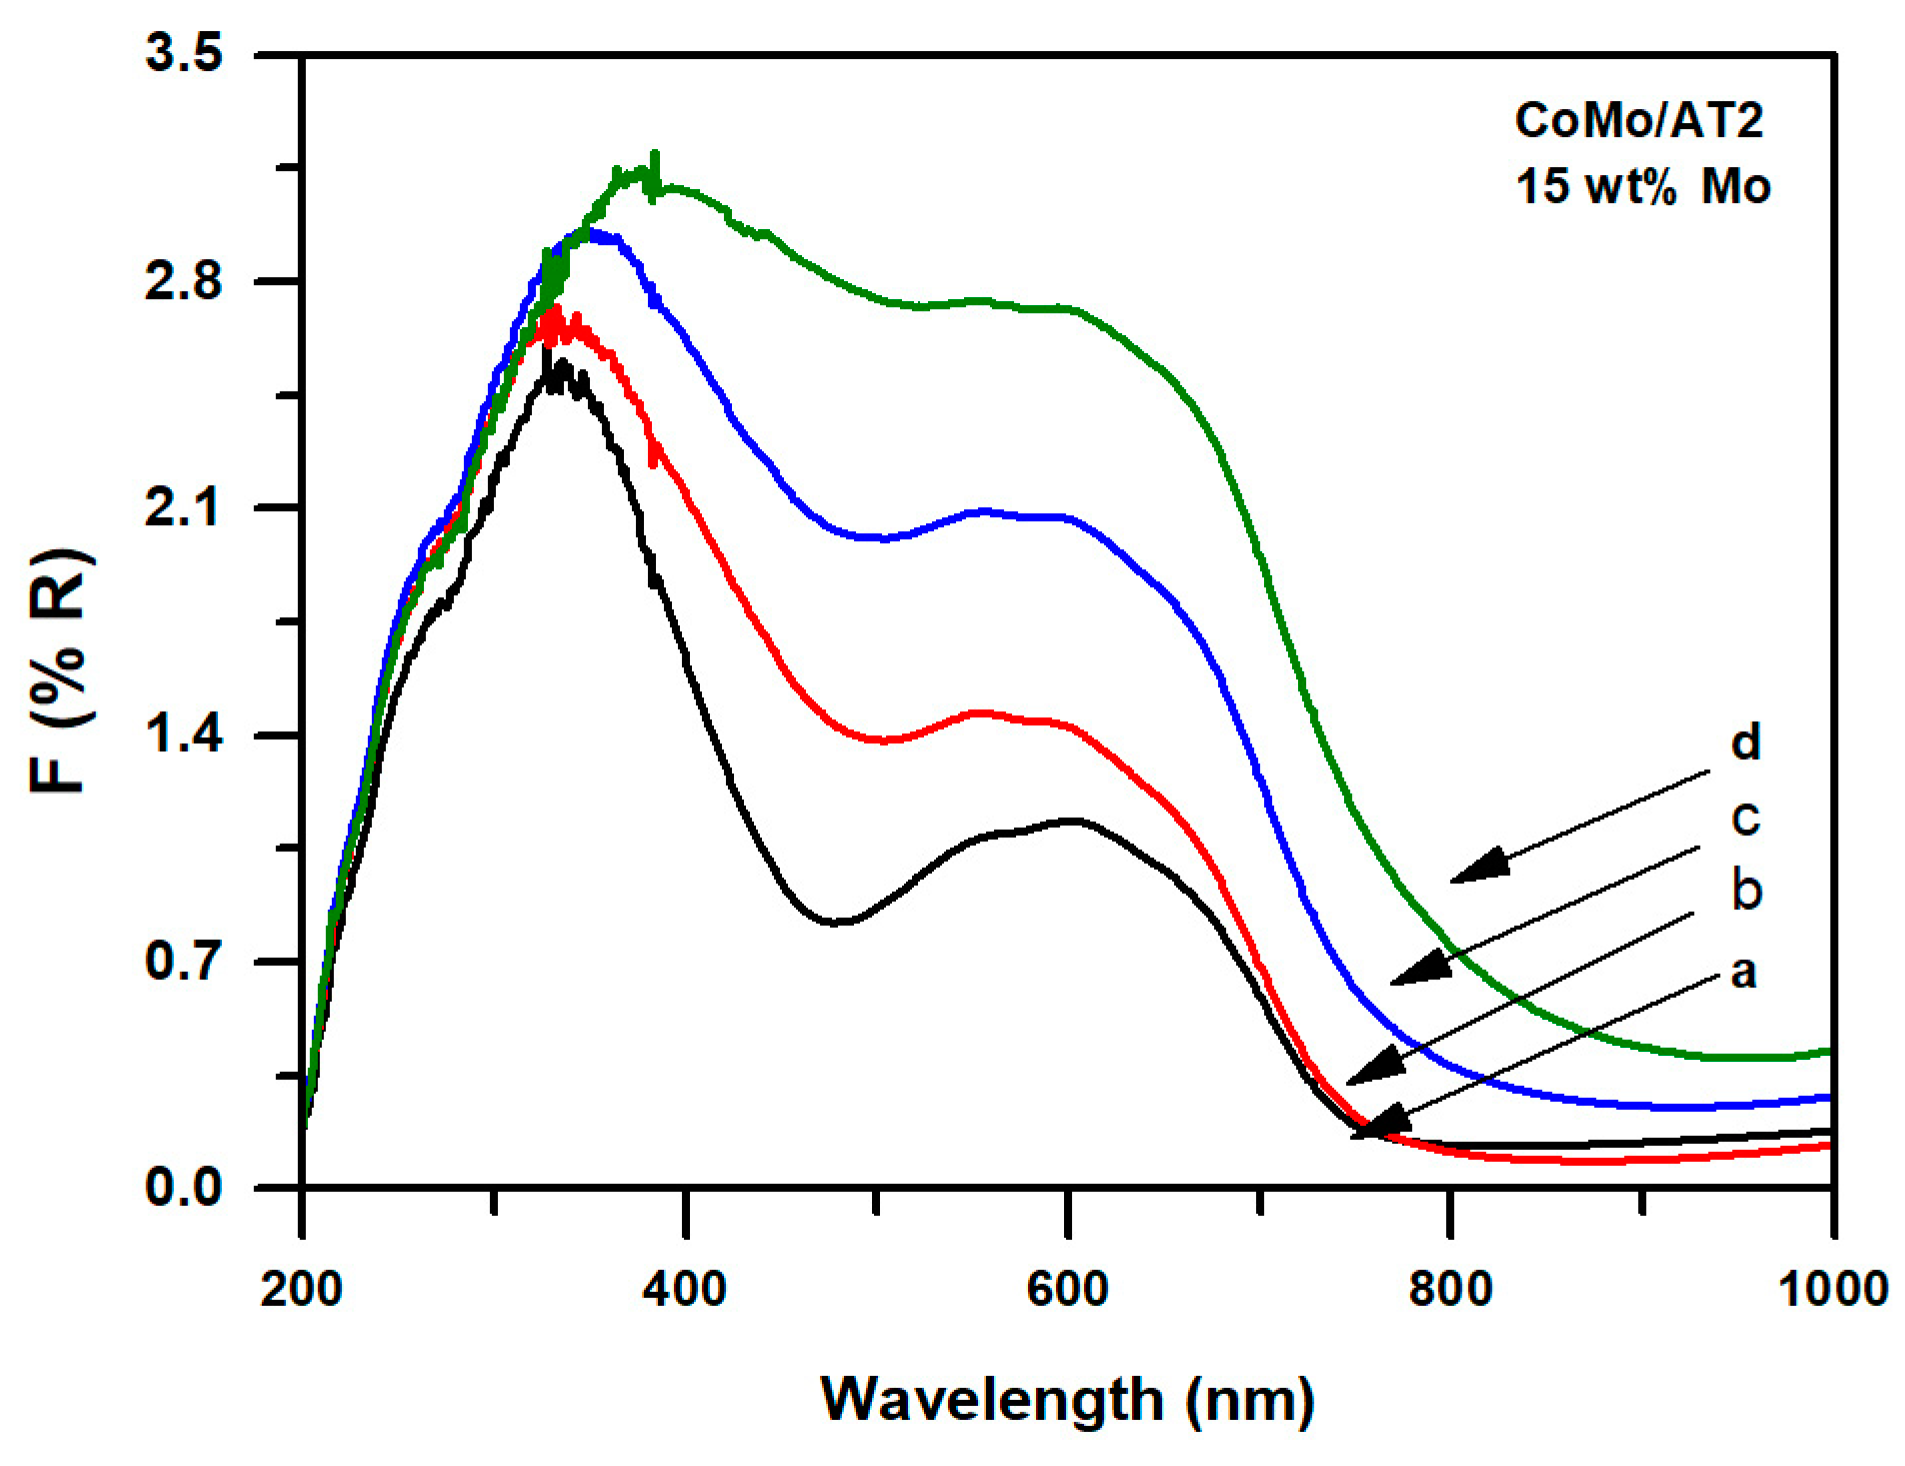
2.1.2. Diffuse Reflectance Spectroscopy UV-Vis

Figure 3 gives the DRS UV-vis spectra for the calcined MoOx catalysts supported on AT2. For all studied samples, DRS UV-vis spectra showed a single signal located from 200 to 600 nm. For the AT2 sample, a simple band was visible between 200 and 350 nm and corresponds to the metal–ligand charge transfer (MLCT) for O2− → Ti4+ [41].
For the supported Mo catalysts, it could be considered that the band between 200 and 400 nm included the signals of Mo and titania [36]. The MLCT band for O2− → Mo6+ was located between 200 and 400 nm. In this band, Mo with tetrahedral coordination (MoTh) (MoO42−, Mo2O72−) were located in the 200–300 nm range. Besides, Mo with octahedral coordination (MoOh) from heptamolybdates and octamolybdates were included between 300 and 400 nm [41,42,43]. Even when a clear band assignation is complex, in a comparison between AT2 support with the different catalysts, it is possible to observe a shift in the reflectance bands to longer wavelengths with increments of the Mo loading. This could indicate a higher concentration of MoOh compared with MoTh at high Mo loadings.

2.1.3. Laser Raman Spectroscopy

Figure 4 displays the laser Raman spectra for 10 and 15 wt.% Mo calcined catalysts.
For the 10 wt.% catalyst, four peaks were displayed at 664, 815, 950, and 992 cm−1. These signals presented a slight shift to a higher stretching frequency for 15 wt.% Mo due to the increment of metal content. The band located at 664 cm−1 was attributed to symmetric Mo-O-Mo deformations. Besides, 815 and 992 cm−1 frequencies were related to antisymmetric Mo-O-Mo stretching for bulk-like MoO3 crystallites [26,44]. The band at 950 cm−1 was assigned to terminal Mo = O symmetric and asymmetric stretching bonds for coexisting polymolybdates (Mo7O246- and Mo8O364−, MoOh). The intensity of this signal increased for the 15 wt.% Mo loading, suggesting that more octahedral species could be present compared with the 10 wt.% Mo sample, in agreement with UV-vis results. This signal involved heptamolybdates and octamolybdates species, which were normally found around 920, 945, and 965 cm−1 [45,46]. Hence, this could indicate that MoO3 structures are formed before the total coverage of the monolayer.

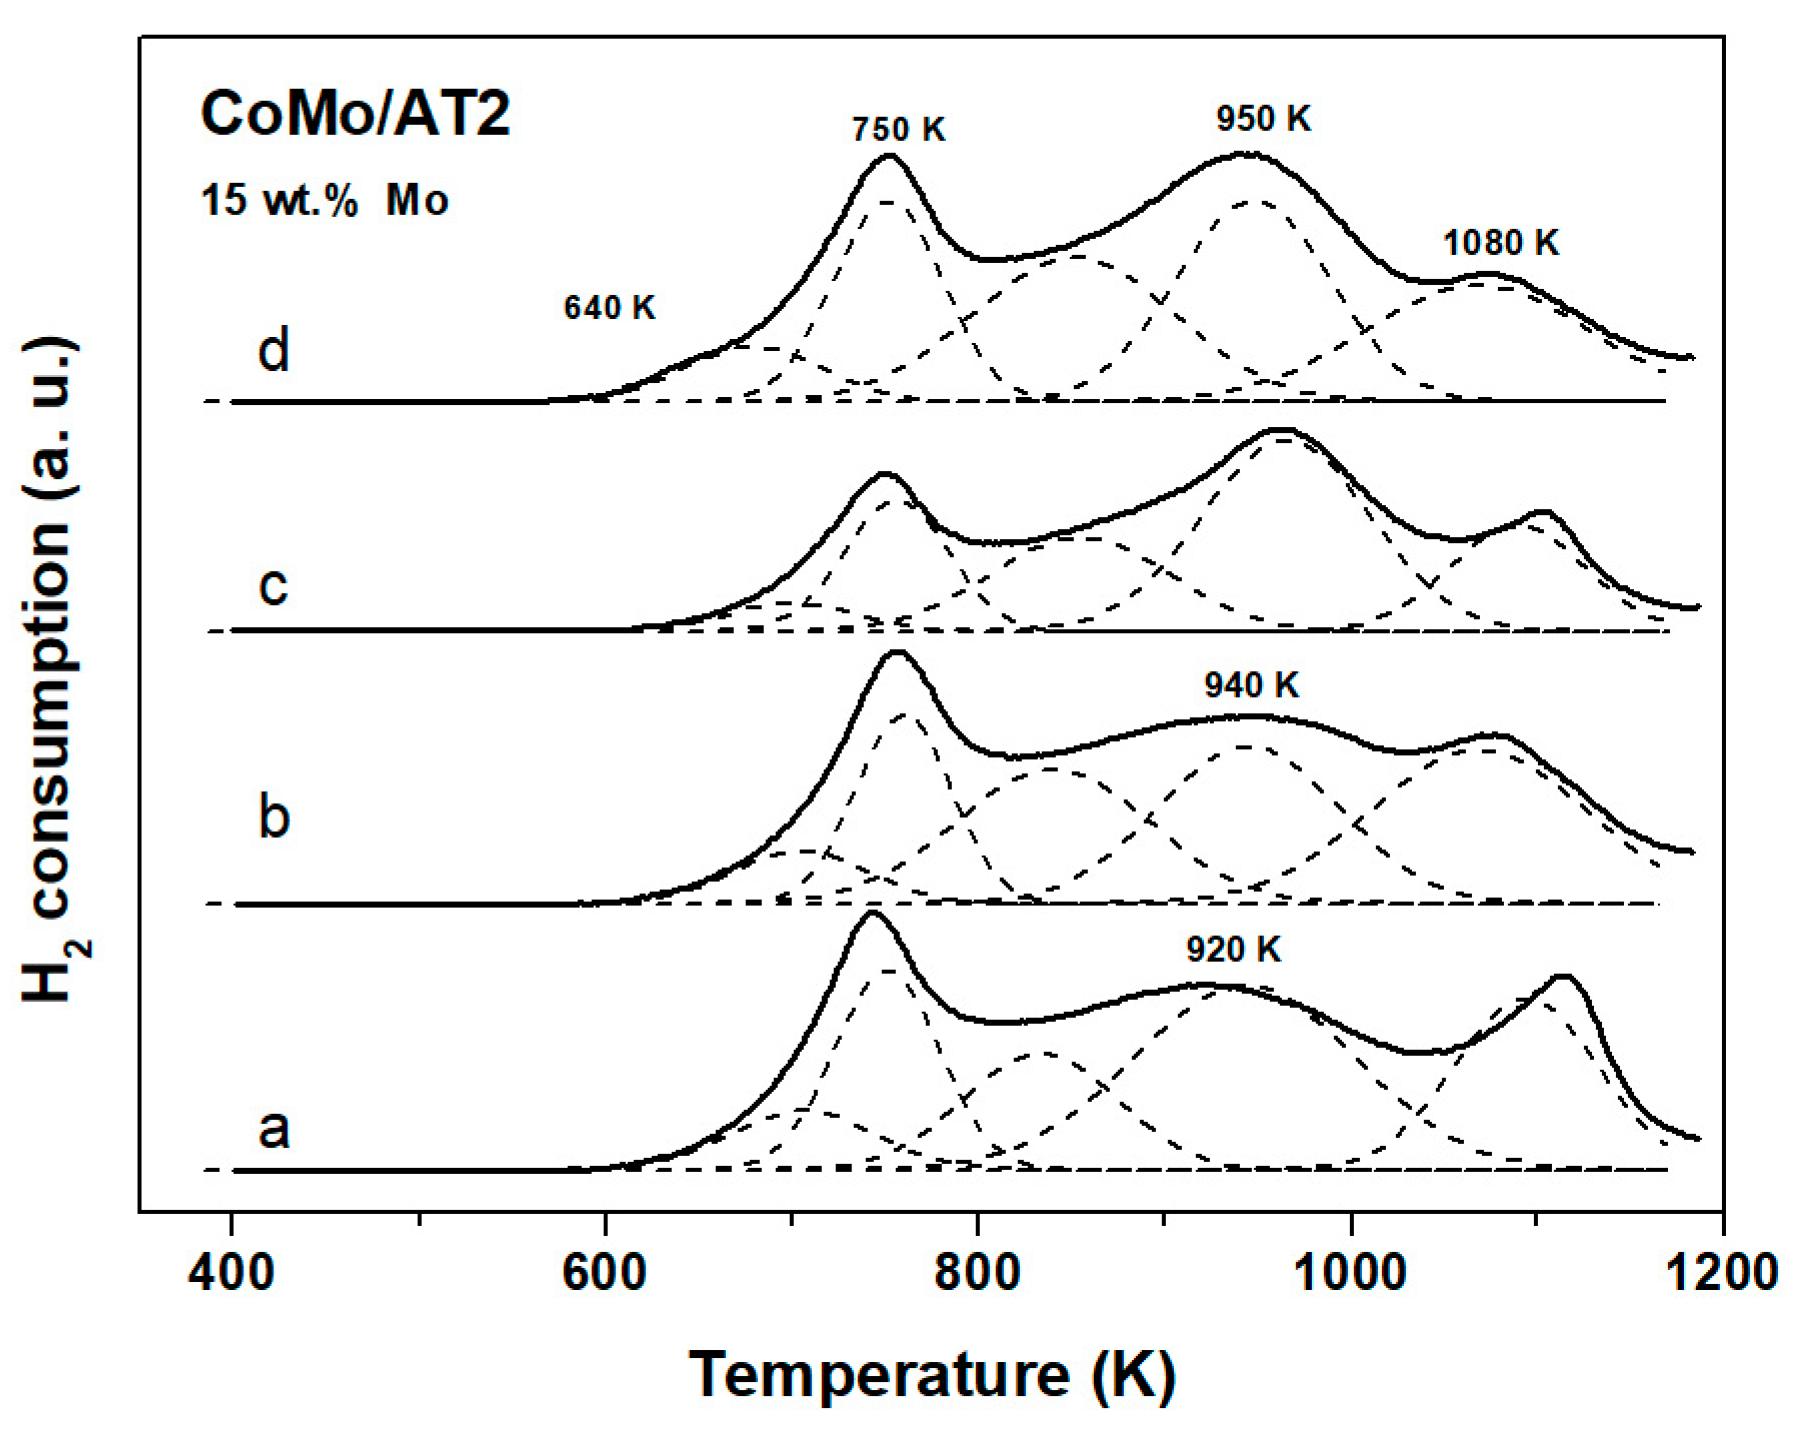
2.1.4. Temperature Programed Reduction

Unpromoted oxide Mo catalysts and AT2 support TPR profiles are shown in Figure 5. The AT2 TPR profile (Figure 5a) presented two reduction peaks attributed to the reduction of surface Ti species at 900 K and bulk Ti species (Ti4+ → Ti3+) at 1050 K [31,47].
However, according to Platanitis et al. [47], only approximately 24% of anatase could be reduced on pure TiO2. Hence, it is expected that less than this percentage of titania could be reduced in the mixed oxide support. In the Mo containing samples, all catalysts showed reduction peaks corresponding to Mo6+ → Mo4+ and Mo4+ → Mo0 at low temperatures (400–800 K) and high temperatures (>800 K), respectively [48,49,50]. Particularly, for the 5 wt.% Mo catalysts, a peak centered at 740 K corresponded to an easily reducible Mo species, possibly in octahedral coordination [50]. The signal located at 940 K was attributed to Mo strongly interacting with the support. Furthermore, the 10 wt.% Mo catalysts also showed two signals at 740 and 940 K. However, it is possible that the 940 K peak could not only be assigned for the MoTh species reduction, but also to a contribution from the MoO3 species, as LRS results showed. The TPR profile of 15 and 20 wt.% Mo catalysts presented four signals at 780, 850, 880, and 1000 K. The peaks located between 780 and 900 K could be attributed to the reduction of MoOh and a mixture of MoOh and MoTh, respectively. The high temperature peaks (880 and 1000 K) could be caused by the presence of MoTh and bulk MoO3 [47,49,50]. The absence of an 850 K peak at 5 and 10 wt.% Mo would indicate that at low Mo loadings, there may not be a notorious mixture of MoOh and MoTh and more MoOh was formed when Mo loading was augmented.
From the impregnation of Mo, the ammonium heptamolybdate solution for the 5 wt.% Mo catalyst’s pH value was 5.2 and decreased to 4.5 for the 20 wt.% Mo catalyst. Consequently, ionic polymolybdates complexes, including [H3MoO24]3−, [H2Mo7O24]4−, [Mo7O24]6− [Mo8O26]4−, and [HMo7O24]5− species, were predominant in the solution as has been mentioned by the literature [46,51]. Additionally, since the AT2 isoelectric point value was 7.6, acid terminal OH groups were predominant on the surface at the impregnation pH. Hence, anionic polymolybdates species could anchor to the support by electrostatic interactions [52]. On this basis, at low metal loadings (5 wt.% Mo), the anionic Mo species could be well dispersed on the surface. As the metal loading increased, the anionic species were closer to each other and conglomerated, generating large Mo species that would have a weaker metal–support interaction than those present at low metal loadings. Characterization analysis showed that MoOh oxide species increased with the metal loading. However, as MoTh species are not clearly visible in the DRS results, the Raman and TPR profiles confirmed the presence of a fraction of them and MoO3 crystallites. These results may indicate that Mo dispersion decreased at high Mo loadings.
The presence of MoO3 at the 10 wt.% Mo catalyst, and the catalytic results shown in Figure 1, indicated that the monolayer coverage would be complete at 20 wt.% Mo and that MoO3 can be formed before it [42,53]. This behavior seems to be quite similar to the Mo/Al2O3 catalyst, which due to the parallel configuration of the hydroxyl groups of the support, leads to a rearrangement of the Mo species during calcination. In contrast, Mo/TiO2 tends to form MoO3 after total coverage of the monolayer, caused by the homogeneity of its hydroxyl groups [26]. Therefore, supported polymolybdates on AT2 may present a configuration more alike to alumina than titania. However, due to the presence of the latter, the generation of MoO3 was delayed. On this basis, it can be suggested that this could occur just before the total formation of the monolayer.
Catalytic evaluation indicated that the AT2 support was active and presented a selectivity to partial hydrogenation. In contrast, when Mo was supported, even at low metal loadings, the selectivity changed to cyclohexane and benzene production. Nevertheless, since all unpromoted catalysts’ selectivity did not present significant changes, it is possible to suggest that the generation of products was due to a high number of active sites with the same nature. Consequently, the non-covered parts of the support could contribute slightly to the production of the O–I and cyclohexene, whereas the MoS2 phase contributed to the generation of DDO and HYD sites. Considering that MoOh were easier to reduce than MoTh, more MoS2 would be present at high Mo loadings (>10 wt.% Mo). In this sense, MoTh species may not change the selectivity; however, some of them would not be completely sulfided, i.e., only the number of active sites changed. This is deduced by the fact that even in the presence of CS2, benzene was still produced. Due to the presence of a sulfiding agent (CS2), the production of benzene was limited by the competition of CS2 for the electrophilic sites located at the S-edge [5,10,34,54]. Then, as MoOh increased, more S-edge sites were formed, and the resistance to inhibition was improved.

2.2. Effect of Co Loading

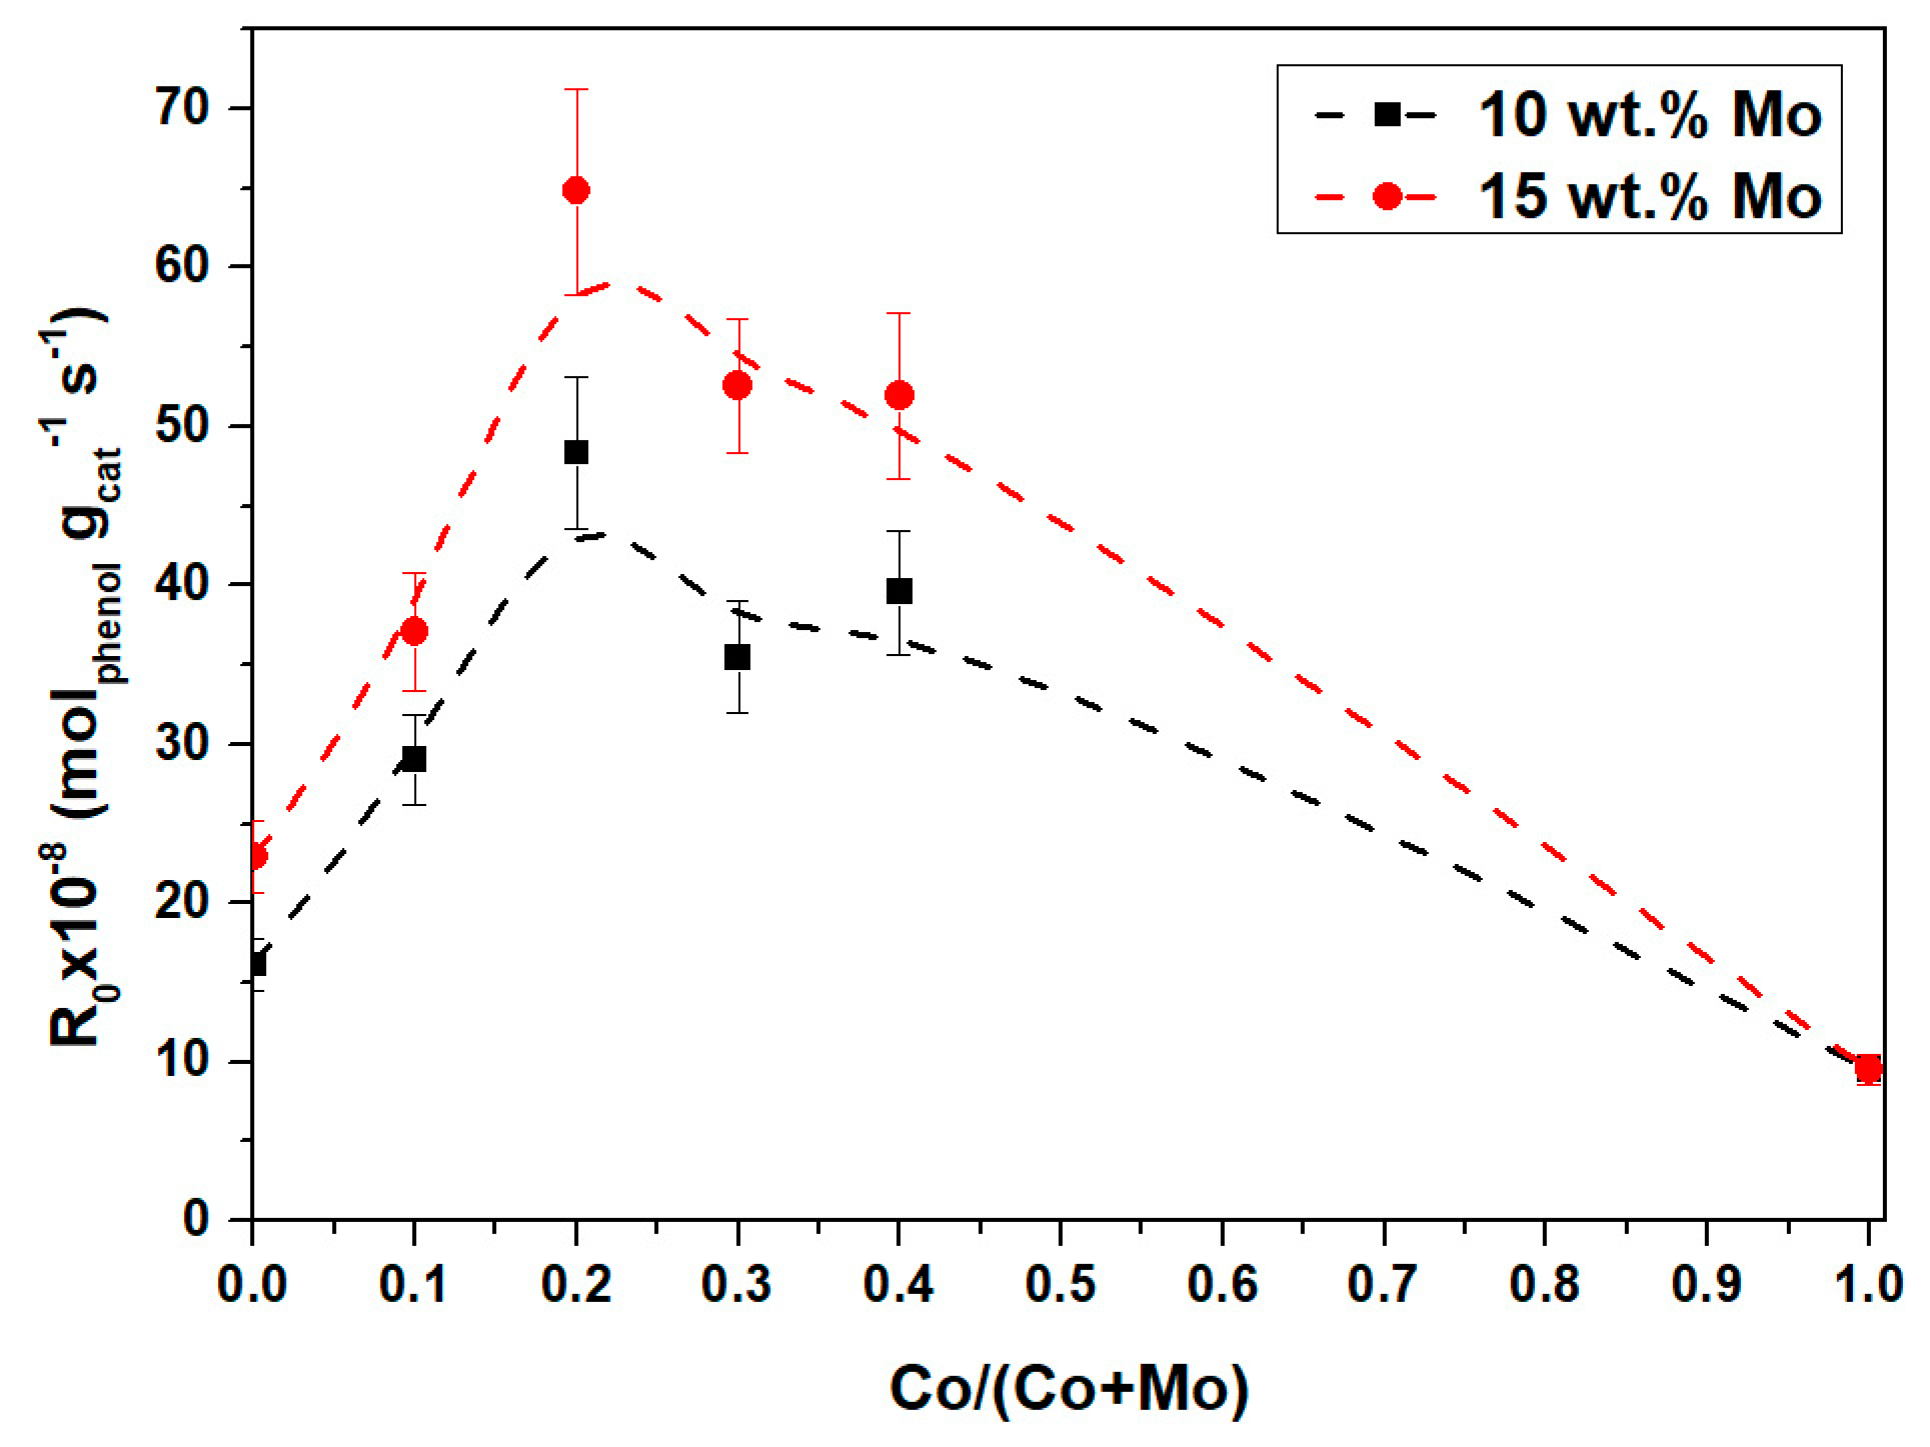
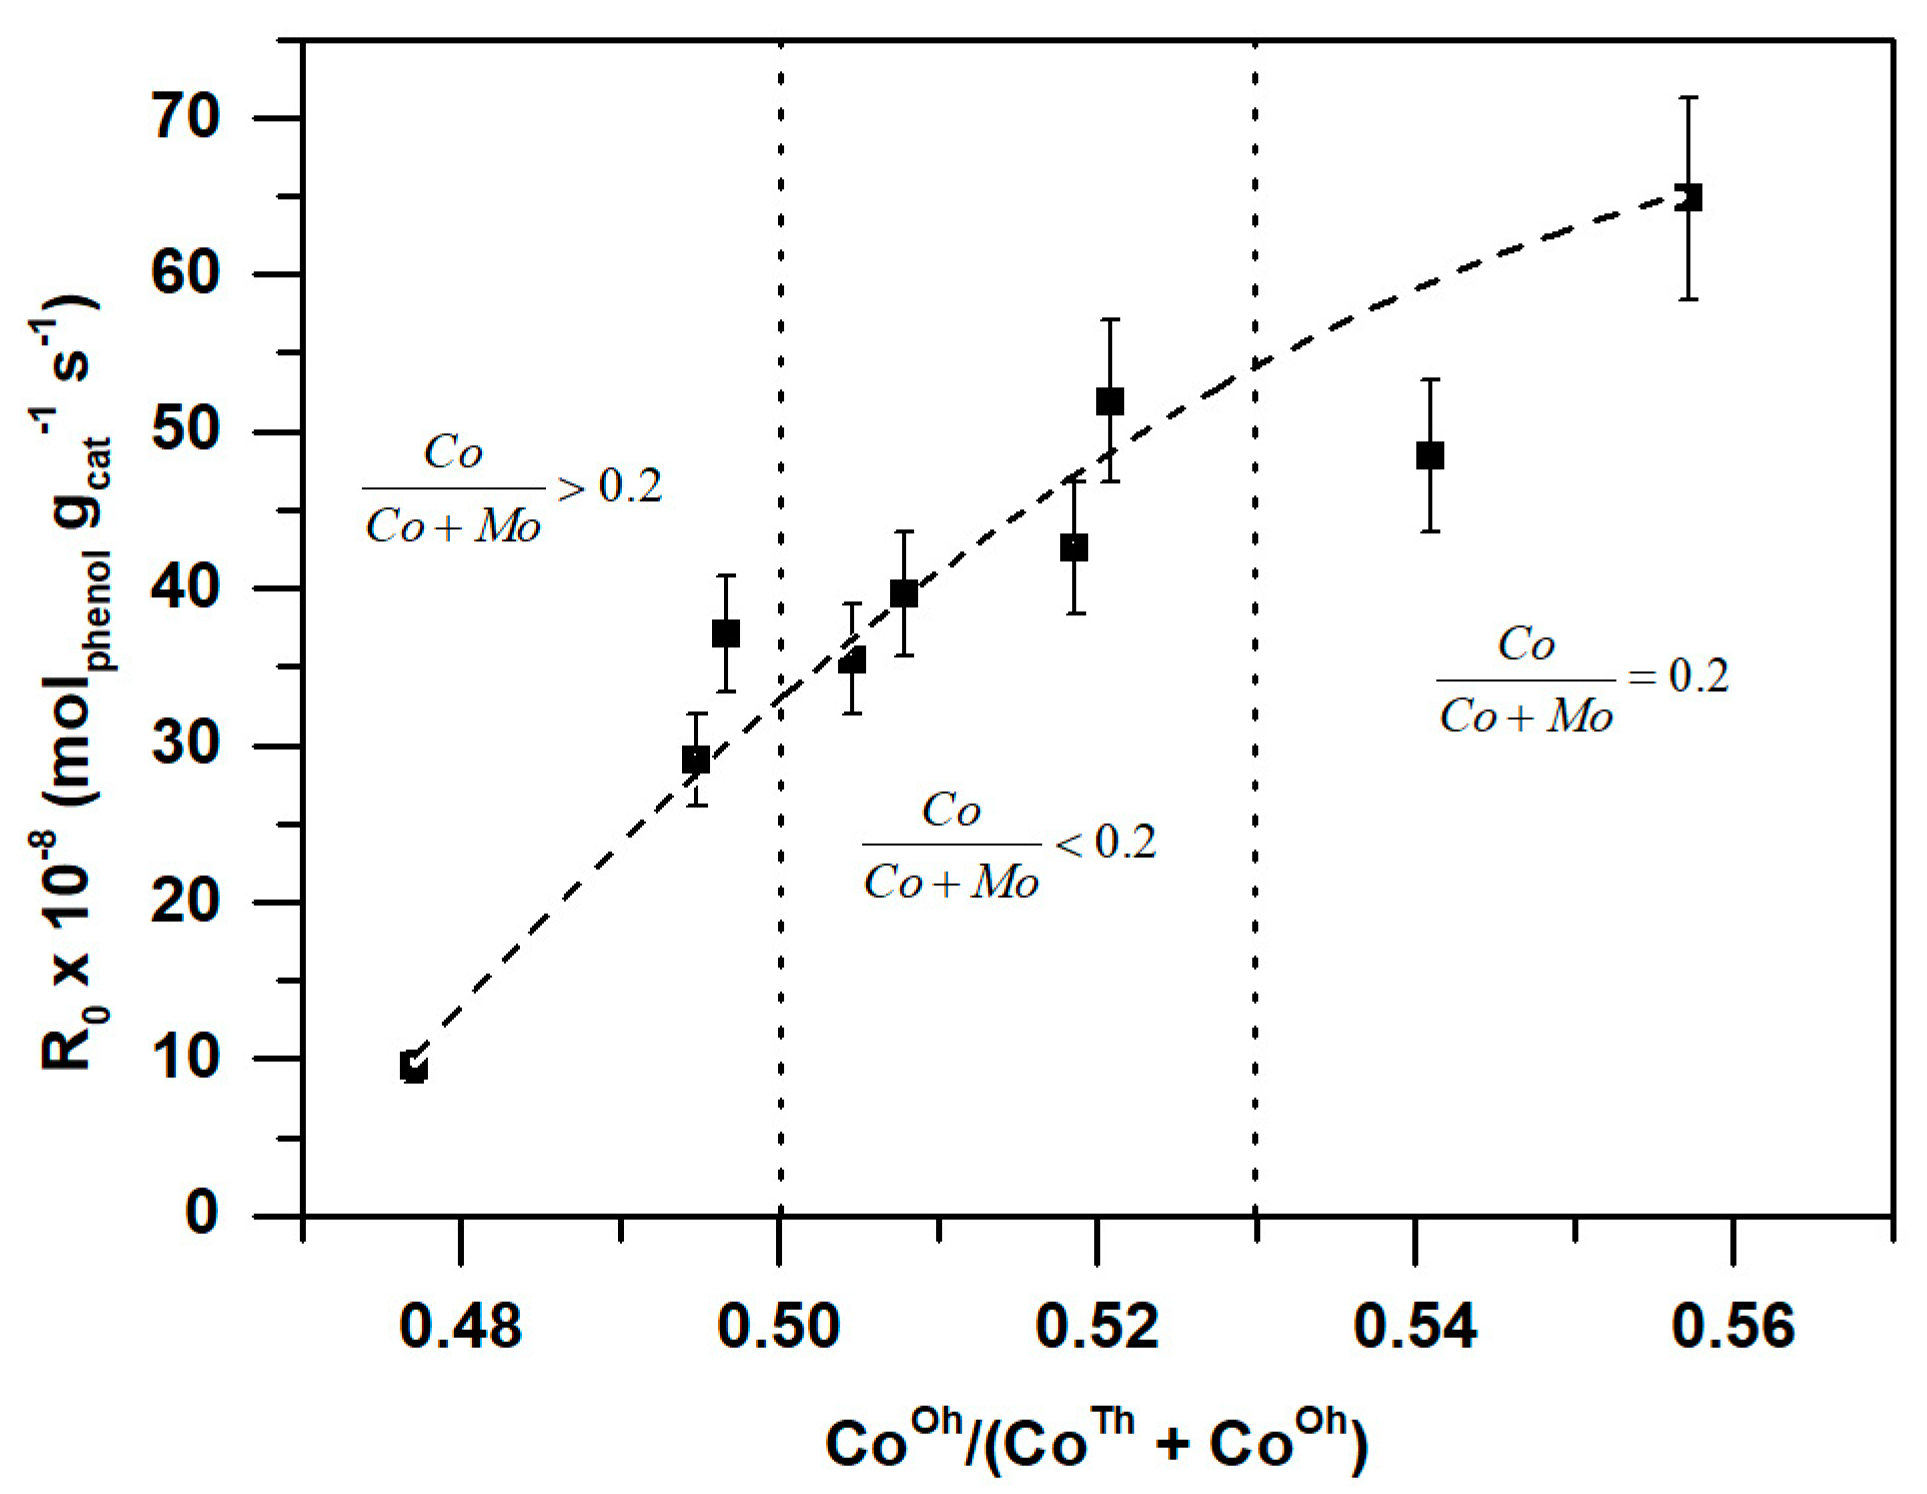
2.2.1. Catalytic Activity

The initial reaction rates for Co/AT2 and AT2 are presented in Table 1. The Co/AT2 catalyst was 1.3 times more active than the AT2 support. This means that Co containing sample presented active sites that improved the catalytic activity. Nevertheless, this activity was 0.3 times lower than that for the 5 wt.% Mo/AT2 sample (see Figure 1). The selectivity showed that cyclohexane was the main product on Co/AT2 in contrast with cyclohexene on AT2.
The O–I yield decreased when Co was present on the catalyst, while benzene production remained the same. On this basis, the Co sulfide phase did not provide enough sites to cleave the CAR–OH bond (468 kJ/mol). However, the high production of cyclohexane indicated that O–I could transform (339 kJ/mol) into cyclohexene to hydrogenate in a further step [17]. Nevertheless, these active sites presented a more hydrogenating character than hydrogenolysis, leading to cyclohexane. Furthermore, since Co did not cover the entire surface of the support, the AT2 support may have had a role. Since the AT2 support showed selectivity to O–I and cyclohexene, it is possible that these products were generated by the support in Co/AT2. In this sense, the AT2 support could have provided Bronsted acid sites, whereas the Co9S8 phase provided metallic sites, which have a hydrogenating character.
The synergic effect of Co for the HDO of phenol activity is presented in Figure 6.
For both series, the dependence of the activity by the concentration of Co on the catalyst presented parallel volcano type curves with a maximum at Co/(Co + Mo) = 0.2. Since the concentration of Mo was higher at the promoted 15 wt.% Mo catalysts than the 10 wt.% Mo catalysts, the initial reaction rate increased 1.3 times. Table 2 presents a synergic factor to compare the activity of the promoted with the unpromoted catalysts, at different Co/(Co + Mo) ratios.
Following the volcano like curve, the Co/(Co + Mo) = 0.1 ratio presented a lower promoting factor (1.6) compared with the other samples. At an atomic ratio of 0.2, a maximum synergic factor was found (2.8) and this decreased by 20% when Co was loaded at higher atomic ratios. This indicated that Co loading played an important role in the interaction with MoS2 slabs and subsequently the promotion of active sites. The selectivity changed for the different atomic ratios as illustrated in Table 3.
In all catalysts, phenol was the main product, following the direct deoxygenation (DDO) route by direct incision of the CAR–OH bond. However, hydrogenated products (HYD), including O–I, cyclohexene, and cyclohexane, increased with the Co loading. As Co/AT2 showed, Co9S8 functionalities promoted the HYD route, thus the increment of the Co concentration led to the formation of this sulfide. At low Co loadings (Co/(Co + Mo) = 0.1), a fraction of DDO sites were promoted by this element at the edges of the MoS2 phase [55]. At the Co/(Co + Mo) = 0.2 ratio, a high concentration of the CoMoS phase could be formed due to this ratio presenting the higher activity. Since not all MoS2 would be promoted, the presence of Co9S8 could increase, leading to an increase in HYD selectivity. In this sense, at the Co/(Co + Mo) = 0.3 and 0.4 ratios, Co not only promoted the DDO route at the edges of the CoMoS phase but also contributed to the HYD route due to the presence of the Co9S8 segregated phase.

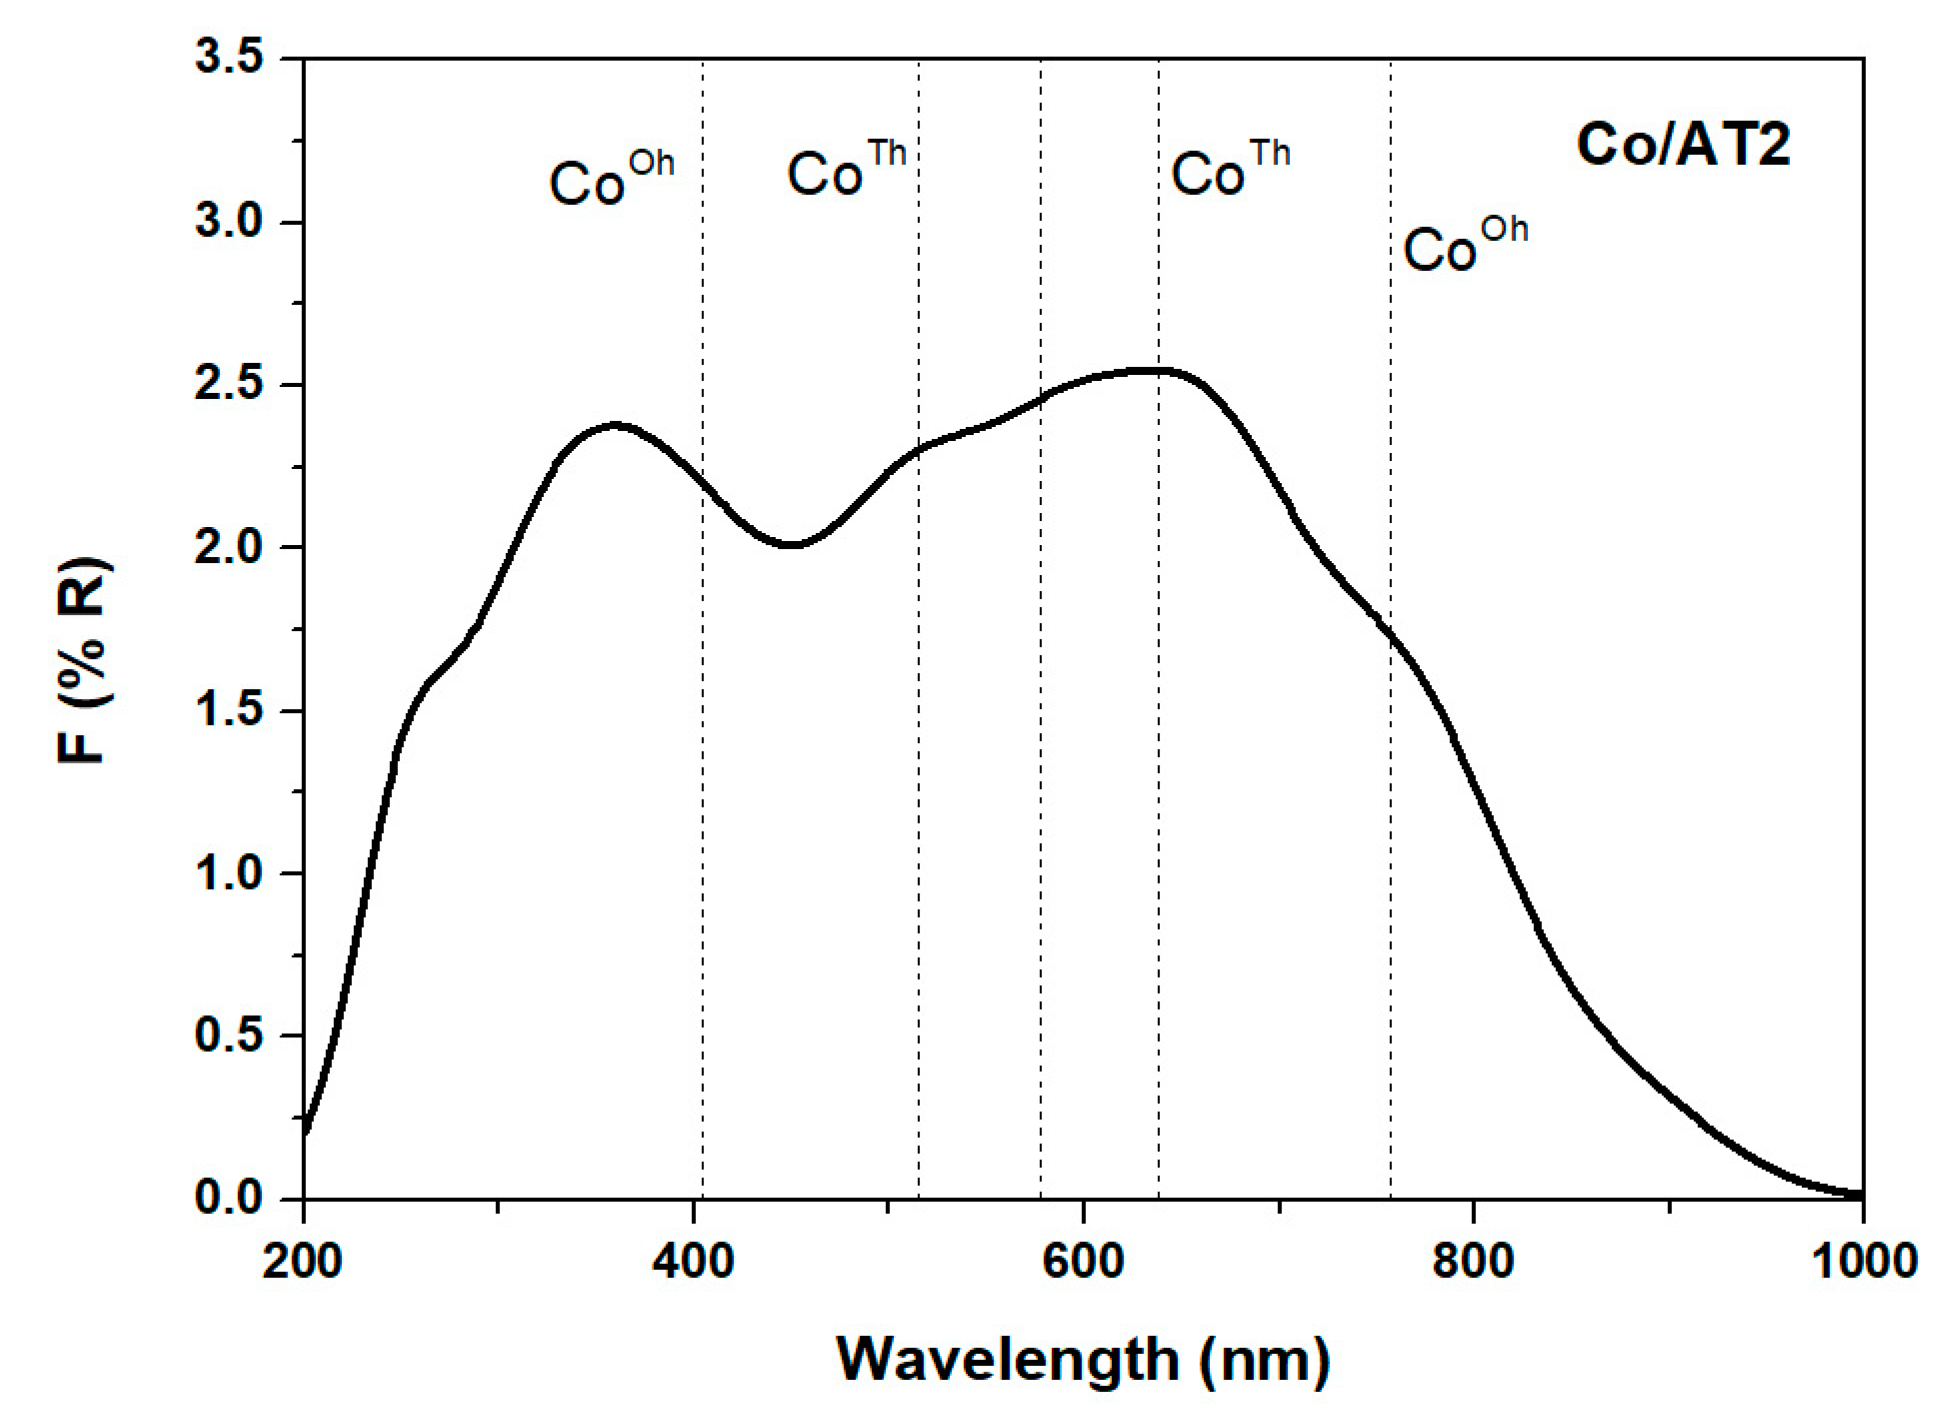
2.2.2. Diffuse Reflectance Spectroscopy UV-Vis

The Co/AT2 calcined catalyst spectra are presented in Figure 7.
It is possible to observe a shoulder centered at 260 nm corresponding to the MLCT O2− → TiO4+ bands. Then, the Co transition bands were in a wide signal between 400 and 1000 nm. The first signal at 400 nm was attributed to the Co2+ species with octahedral coordination (CoOh) [56]. However, like the Mo results, this band was overlaid with the titania MLCT and the analysis was difficult. The wide signal involves a triplet centered at 500, 580, and 630 nm, corresponding to d–d transitions of the Co2+ species with tetrahedral coordination (CoTh) and strongly interacting with alumina (CoAl2O4) [57]. Finally, a band near 750 nm was assigned to Co3+ and Co2+ species with octahedral coordination in Co3O4 [57]. On this basis, CoTh species were more abundant than CoOh species since the respective were more intense. This was due to the absence of Mo and the low Co loading (2 wt.%) on the support. Co could be well dispersed on the support in small particles, which interacted strongly with the alumina present in the support. Nonetheless, as titania was highly dispersed in the alumina matrix [58], it could avoid the migration of Co into the support. This could promote the formation of CoOh, which is a Co9S8 precursor. The promoted supported catalysts’ DR spectra are presented in Figure 8, showing two main bands, one located at 200–400 nm, and the other at 500 – 800 nm.
Considering the previous unpromoted Mo and Co supported catalyst spectra, the fist signal (200–400 nm) involved the titania, and Mo and Co bands. However, the second signal only involved the Co species. In comparison to Figure 7, it is possible to observe an increase in the intensity of these bands with the Co/(Co + Mo) ratio. Also, a shift to near infrared was detected as the Co loading was increased. Additionally, the shoulder located at 400 nm (CoOh) increased its intensity at high atomic ratios. This may indicate that more Co with octahedral coordination was present at Co/(Co + Mo) = 0.4 compared with the other catalysts. Nevertheless, the CoTh transition bands increased as well. Since Co may find its migration into the titania support difficult, these Co species could be part of CoMoO4 in which Co was in octahedral coordination [59,60]. To achieve a proper comparison between the CoOh and CoTh species, Gaussian deconvolution (not showed) was carried out considering the representative signals reported in the literature [56,57,61]. Since CoMoO4 is considered a bad precursor for the CoMoS phase [62], the CoOh present in this oxide complex was considered as CoTh. It is possible to calculate the ratio between CoOh and CoTh with the area under each peak and using the F(R∞)Oh/(F(R∞)Oh + F(R∞)Th) equation [63]. The results are shown in Figure 9.
The correlation between CoOh and Co loading presented a volcano type curve with a maximum at the Co/(Co + Mo) = 0.2 ratio. At low Co/(Co + Mo) ratios, the concentration of the promoting atom was inadequate to interact with Mo. Hence, it resulted in small particles that interacted strongly with the support, leading to an incomplete promotion. In contrast, at high Co/(Co + Mo) ratios, the promoting atom was in excess. Thus, it resulted in the formation of CoMoO4 and highly dispersed particles, which did not interact with Mo but with the support. In this sense, at the maximum CoOh ratio, there was enough CoOh to interact properly with the MoOX species, leading to the formation of the CoMoS phase. The amount of CoOh and CoTh obtained from DRS UV-vis analysis was correlated with the activity, as presented in Figure 10.
This correlation showed that as CoOh was increased, the initial reaction rate also increased. This is due to the proper promotion of Mo with CoOh to form the CoMoS phase. At low Co loadings, more CoTh species were present on the support and their sulfidation was less than the CoOh species, as has been reported before [34,64]. At the optimum Co/(Co + Mo) ratio, the amount of CoOh promoted the proper formation of the CoMoS phase and a fraction of Co could be CoTh. When Co was in excess, a fraction of it promoted the CoMoS phase, but also a fraction interacted strongly with Mo, giving place to CoMoO4. However, the Co3O4 phase was also be present and could be transformed into Co9S8.

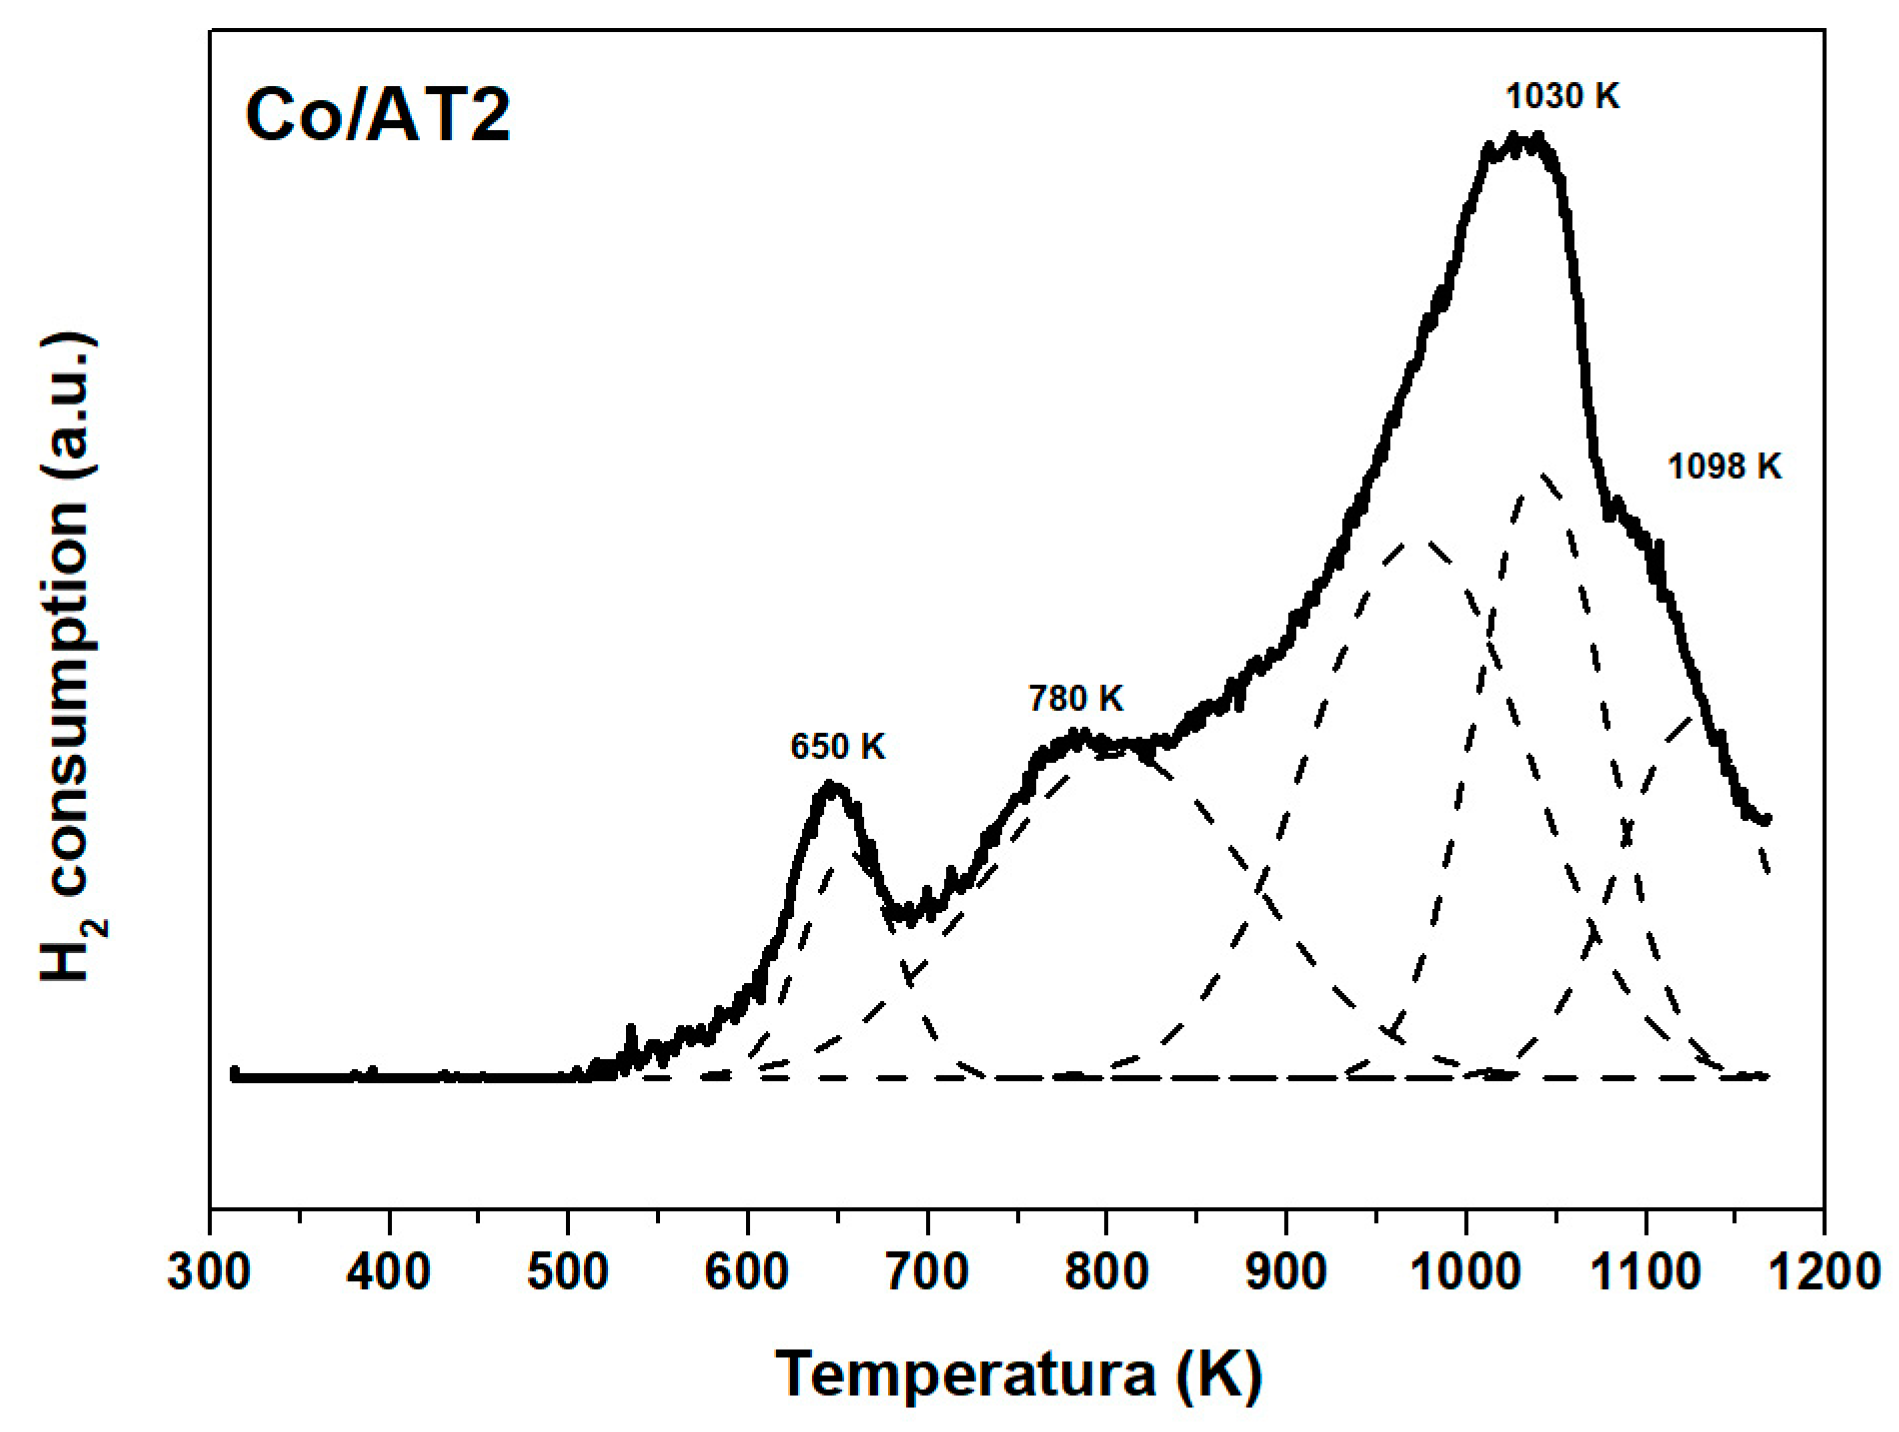
2.2.3. Temperature Programmed Reduction

In Figure 11, the Co/AT2 calcined catalyst’s TPR profile is presented. It is possible to observe four signals centered at 650, 780, 1030, and 1098 K.
By Gaussian deconvolution, an extra peak was found in the 1030 K peak. The first signal (650 K) was assigned to the reduction of Co3O4 crystals to CoO, i.e., the CoOh, Co3+ → Co2+ [65,66]. The signal at 780 K corresponded to the reduction of superficial well dispersed Co3+ species. Also, the deconvolution resulting peak at 923 K could be attributable to Co2+ → Co0, whereas, the second resulting peak at 1040 K may be referred to the CoAl2O4 species [50]. However, these peaks may have contributed to the initial titania ions’ reduction to Ti3+. Finally, the last peak at 1090 K was the result of the Ti4+ → Ti3+ reduction. Note that the CoTh species, with strong interaction with the support, were more abundant than CoOh. This result confirms the DR UV-vis results since the Co metal–support interaction is strong enough to generate CoTh species that are difficult to reduce. Therefore, their sulfidation was incomplete and less active phase was formed. As was previously seen in the literature [67], Co metal–support interactions decrease when Mo is present on the surface of the support. According to these results, the Co/AT2 catalyst presented a higher amount of CoTh than CoOh due to the interaction with alumina. However, both species could be sulfided and form Co9S8, which had metallic sites with selectivity to the HYD route. The benzene production was inhibited by competition for the hydrogenolysis active sites by the presence of H2S in the reactor. Additionally, the amount of these sites would be less than the hydrogenation sites. Since Co did not totally cover the support, the latter could contribute to the production of the O–I and cyclohexene.
The CoMo/AT2 catalyst’s TPR profiles are presented in Figure 12. In general, all TPR profiles were similar to each other and showed three main peaks at 750, 950, and 1080 K.
The Gaussian deconvolution of these TPR profiles developed two additional peaks at 640 K and 820 K. The peak at 640 K corresponded to CoOh, Co3+ → Co2+ as shown in Figure 11 as well. The second peak, at 750 K, was assigned to the Mo6+ → Mo4+ reduction [51]. The third peak, at 820 K, could be assigned to a mixture of Co2+ → Co0 and Mo4+ → Mo0 [68]. The fourth peak near 940 K was caused by Mo strongly interacting with the support and involved CoMoO4 and CoAl4O3 species [63]. Finally, the last high temperature peak belonged to the support.
In general, the reduction peaks did not present significant shifts to low temperatures with the increase in the Co loading. The Co/(Co + Mo) = 0.1 ratio catalyst showed a slight shift of the second main peak to low temperatures due to the low Co concentration, i.e., the contribution by the Mo reduction was predominant. By its part, the Co/(Co + Mo) = 0.2 catalyst consumed more H2 in the first peak than in the second one, meaning that more octahedral Co and Mo species were present in this catalyst. This could lead to a better promotion of the active phase and therefore an improvement of the activity. At Co/(Co + Mo) = 0.4, the peak located at 640 K was more intense than in the other samples. This signal could be the result of the high concentration of segregated Co3O4. Additionally, since more segregated Co was present on these catalysts, CoTh was present in a minor fraction.

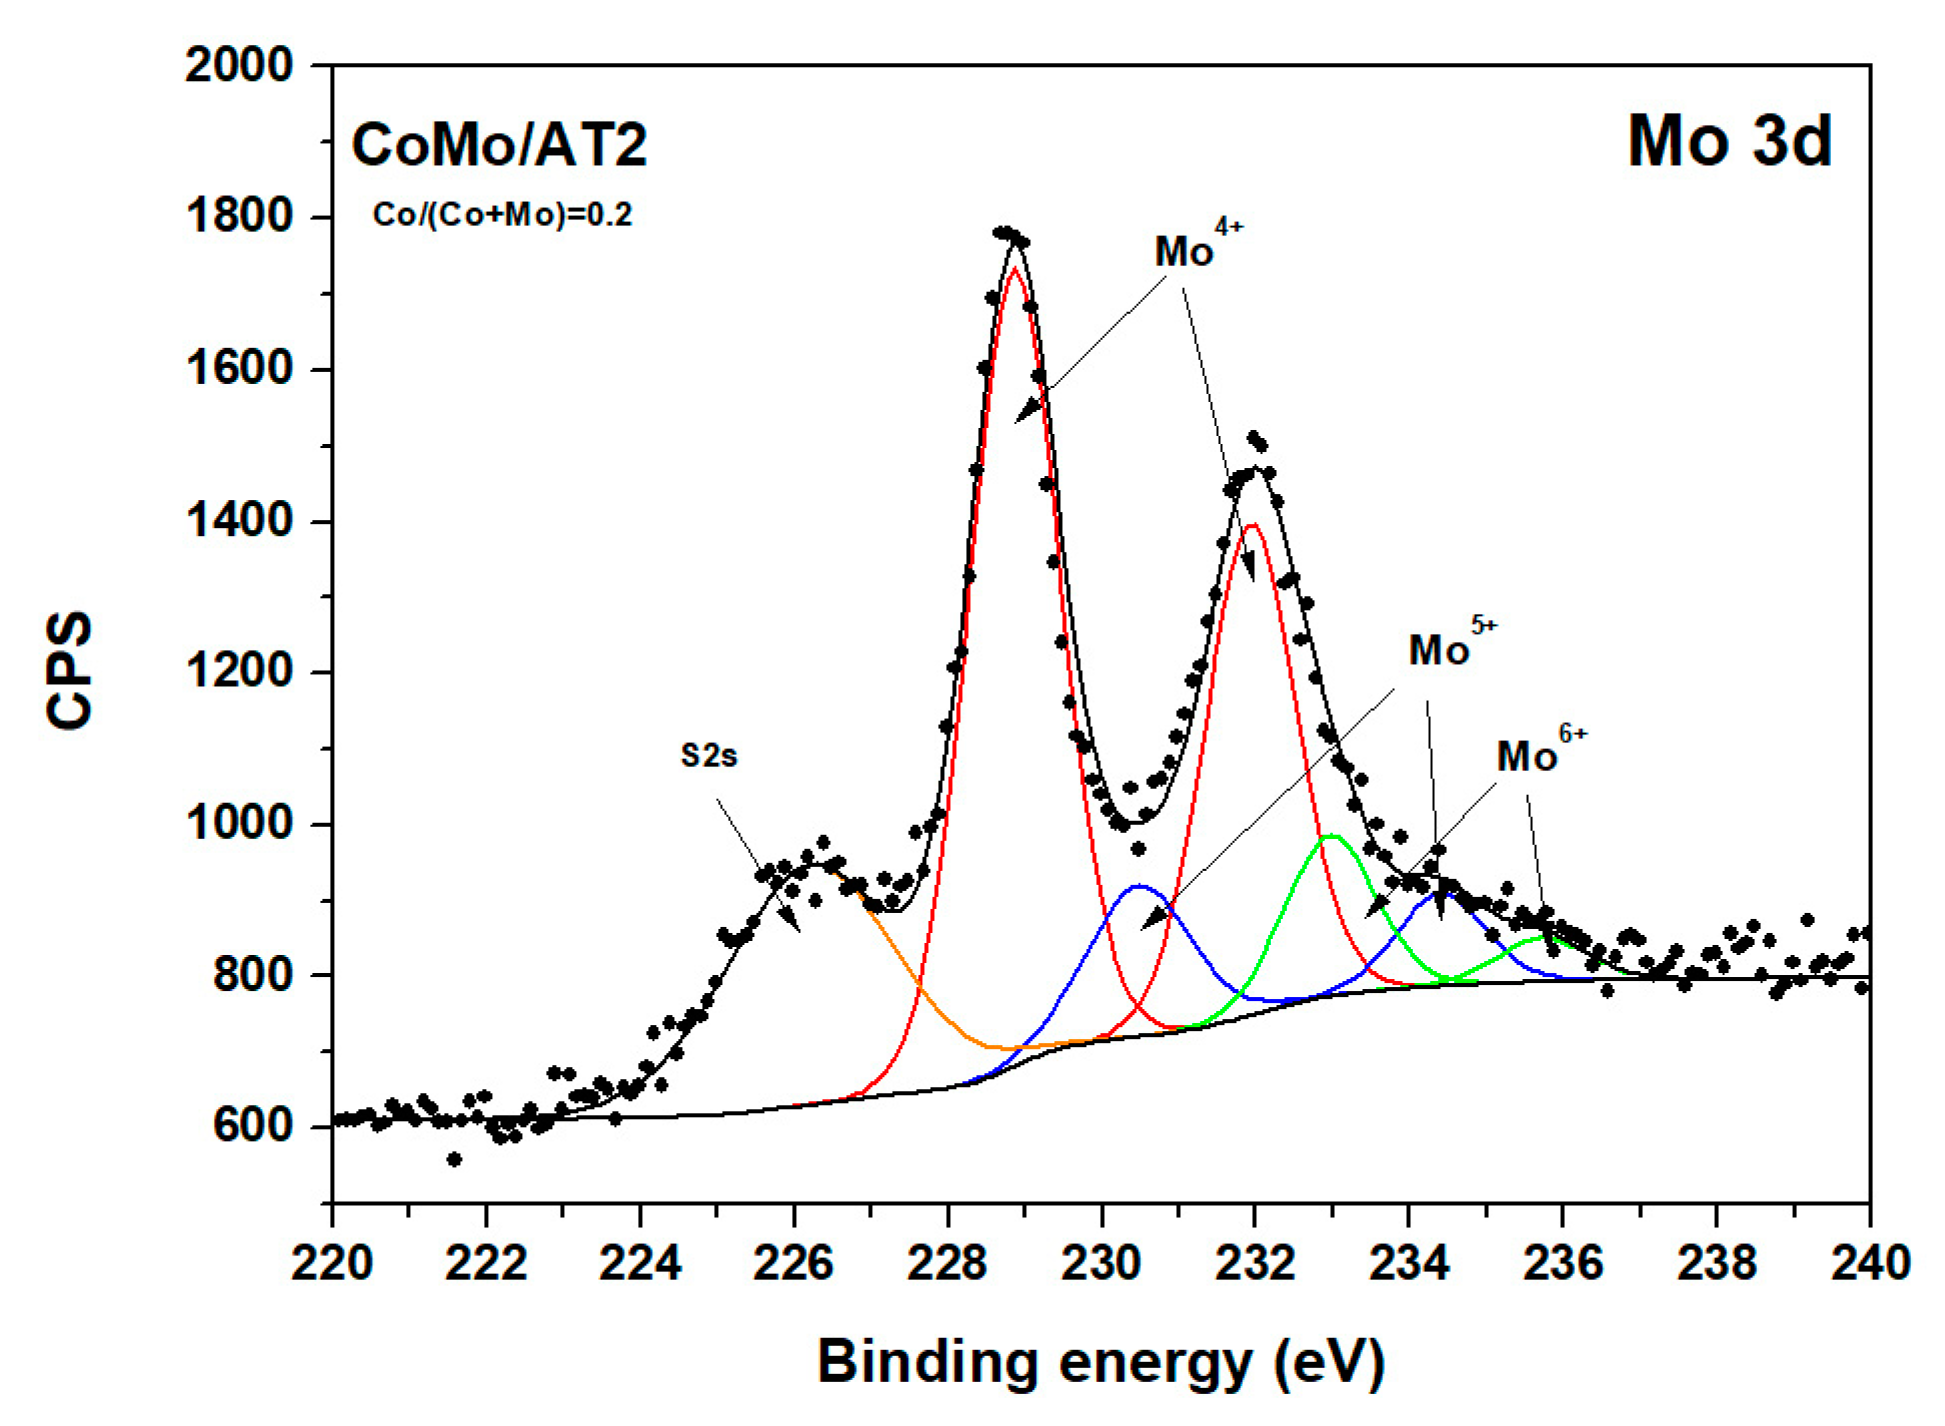
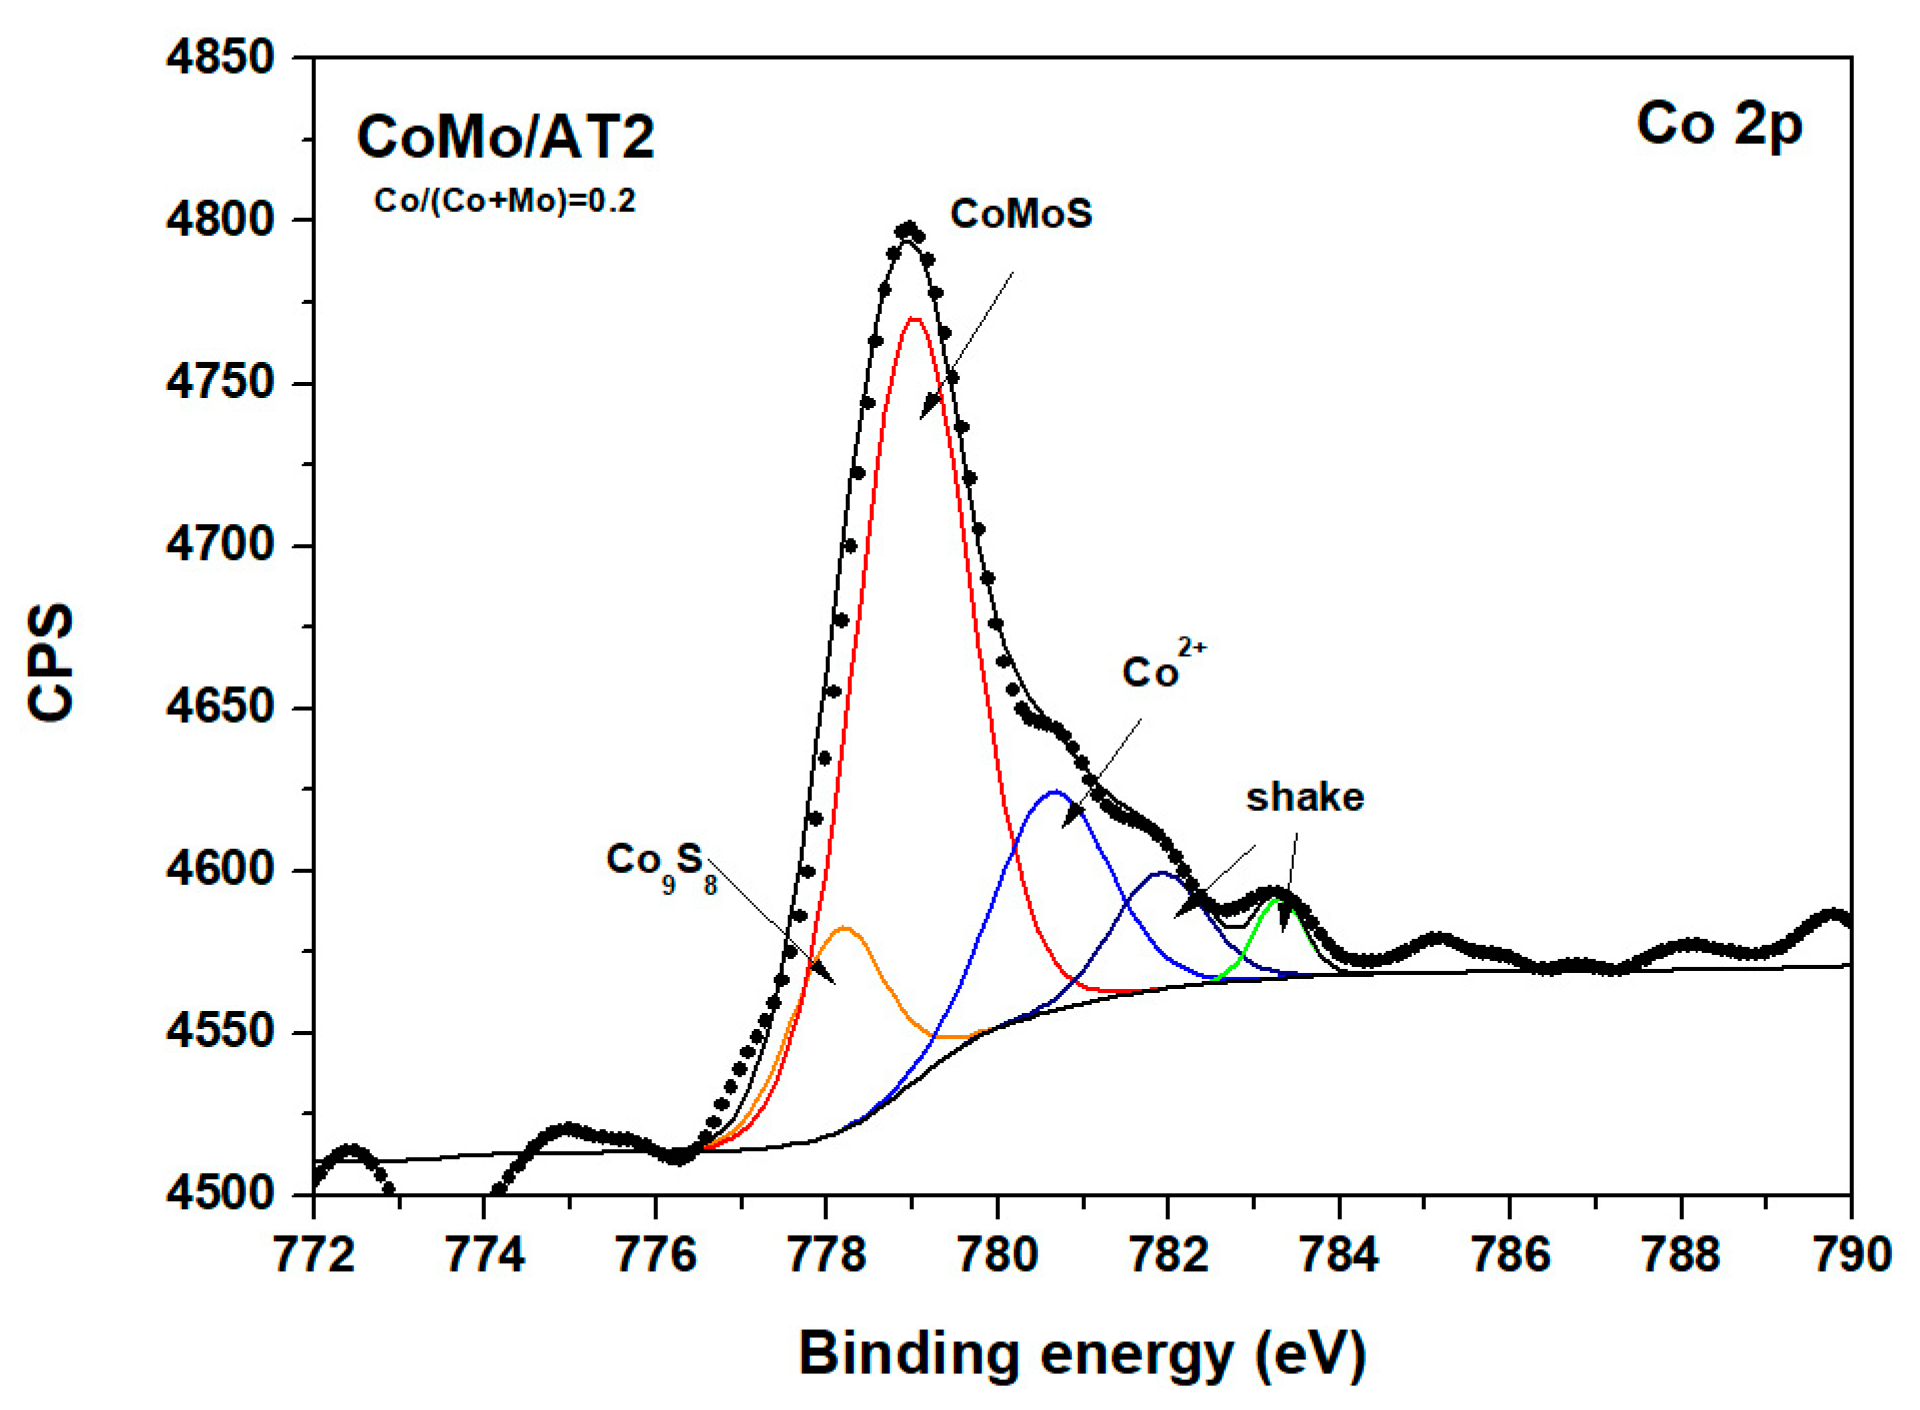
2.2.4. X-Ray Photoelectron Spectroscopy

Figure 13 and Figure 14 exhibit the XPS spectra for Mo3d and Co2p core levels for sulfided CoMo/AT2 catalysts at the Co/(Co + Mo) = 0.2 ratio with 15 wt.% Mo.
The Mo3d spectra displayed a doublet for the two spin orbit components, 3d5/2 and 3d3/2, located at 228.76 and 231.8 eV, respectively. Additionally, the S2s core levels’ band was detected at 226.3 eV. The XPS for the Mo3d5/2 decomposition showed peaks attributed to Mo in sulfide (Mo4+), oxysulfide (Mo5+), and oxidic (Mo6+) species. These peaks were located at 228.79 eV, 230.4 eV, and 232.80 eV, respectively [38,69,70].
For the Co2p3/2 core levels displayed in Figure 14, the Co9S8, CoMoS, and Co2+ oxide species were found by decomposition of the main signal. The binding energies for Co species were identified at 778.16 eV for Co9S8, at 778.76 eV for CoMoS, and at 780.7 eV for oxidic Co2+ [38,69,71]. The CoMo/AT2 catalyst at the Co/(Co + Mo) = 0.4 ratio is not shown since it presented similar signals. In these samples, sulfidation of Co and Mo was incomplete since the presence of oxysulfide and oxidic species was detected. However, the presence of oxysulfide molybdenum species indicated the transition of Mo6+ to Mo5+ during the sulfidation process. Despite this, sulfided phases, such as MoS2, Co9S8, and CoMoS, were predominant on 10 wt.% and 15 wt.% Mo supported catalysts. The relative contributions of Mo and Co species from the data obtained from sulfide CoMo/AT2 catalysts at Co/(Co + Mo) = 0.2 and 0.4 ratios are presented in Table 4 and Table 5.
Table 4 shows that MoS2 species were the main phase on both catalysts (69%–59%), while oxysulfide and oxide species represented about 30% to 19% and 12% to 10%, respectively. It is possible to observe that a fraction of the MoS2 phase decreased by 14% at high Co loadings, indicating that the sulfidation degree was higher for the Co/(Co + Mo) = 0.2 ratio than the Co/(Co + Mo) = 0.4. However, since the oxide Mo6+ species were the same, a partial sulfidation of Mo species occurred at high Co loadings due to the presence of 60% more oxysulfide species than at low Co concentrations. This could indicate that the excess of Co caused a decrease in the capacity of sulfidation of the Mo species due to the formation of the CoMoO4 phase [72]. The Co species’ contributions shown in Table 5 indicated that the mixed phase CoMoS represented 51% to 44%.
Besides, the Co9S8 and oxide phase contributed to 19% to 13% and about 37% of the Co supported on both catalysts. At Co/(Co + Mo) = 0.4, the amount of Co9S8 phase increased by 20%, whereas the CoMoS phase decreased by 15% and the oxide form was essentially the same. A high concentration of Co induced the formation of Co9S8 over the CoMoS phase due to the presence of CoMoO4 species, which were difficult to sulfide. Therefore, the segregated CoOh was easily reduced and formed its sulfided phase. At low Co concentrations, Co was capable of occupying the octahedral sites of the MoS2 phase. Thus, as this latter phase was more abundant, it led to an increase of the CoMoS phase concentration. Therefore, the Co/(Co + Mo) = 0.2 ratio was adequate for generation of the CoMoS phase, which is widely accepted to be the most active phase. Since the Co loading was different, a normalization of the fraction of each phase was carried out. Results of the concentration and mass fraction of the sulfided species are displayed in Table 6.
It is possible to observe that the concentration of sulfided and oxide Co species increased with the Co loading, whereas the MoS2 concentration dropped. Nevertheless, the CoMoS/Co9S8 and CoMoS/Co2+ fractions decreased by 40% and 16%, respectively at Co/(Co + Mo) = 0.4. This means that as more Co was interacting with Mo at high Co concentrations, less MoS2 could be formed. In other words, the formation of the CoMoS phase was limited due to the formation of CoMoO4 and the sulfidation of the active phase was not complete. At low Co loadings, less Co9S8 and Co2+ were present on the catalyst than at high Co loadings. As Figure 10 indicates, more CoOh was present at the Co/(Co + Mo) = 0.2 ratio than at 0.4. Hence, these CoOh species interacted with Mo species to form the CoMoS phase. However, the Co concentration was not enough to promote all Mo species, and more MoS2 was generated, i.e., a higher promotion of the active sites was achieved (see Table 2). In contrast, the excess Co provoked segregated species that could either form Co9S8 or Co oxide. Since, at high Co loadings, segregated Co oxide species in octahedral coordination were present on the surface, the sulfided Co phase tended to form. In comparison, the Co oxide species with tetrahedral coordination were difficult to sulfide and were more abundant at Co/(Co + Mo) = 0.4 than at Co/(Co + Mo) = 0.2.
The formation of the CoMoS phase provided electrophilic active sites that were selective to the hydrogenolysis route [5,73]. However, when the Co loading was increased, the HYD route did as well, due to the presence of more CoOh species. At Co/(Co + Mo) = 0.1, the production of benzene was higher than at the other ratios, indicating the presence of the CoMoS phase with hydrogenolysis sites. Nevertheless, the Co concentration was not enough to promote all MoS2 slabs. Hence, a fraction of Co was segregated in the Co9S8 phase and a minor fraction interacted with the support. In this sense, the HYD route was mainly caused by metallic sites from unpromoted MoS2 and Co9S8 phases than by CoMoS. The Co/(Co + Mo) = 0.2 ratio presented a higher catalytic activity and amount of CoMoS. This means that at this ratio, the amount of Co was adequate for direct interaction with Mo during the sulfidation process. The CoOh was available to promote the MoS2 phase and generate the CoMoS phase over the other sulfided phases. At Co/(Co + Mo) > 0.2, activity decreased; however, the HYD route was enhanced. In these cases, there was enough Co to promote the MoS2 phase. Nonetheless, the excess Co led to the production of a more segregated Co9S8 phase than at lower ratios. Hence, the metallic sites responsible for hydrogenation reactions increased their number. As more Co was added, more CoTh and CoMoO4 phase could have been formed, which were difficult to sulfide and consequently, sulfidation was not optimal.

3. Materials and Methods

3.1. Support and Catalysts Synthesis

3.1.1. Support Synthesis

Mixed oxide Al2O3–TiO2, (Al/Ti = 2 labelled as AT2) support was synthesized by the sol–gel method as described in a previous work [34]. As organic precursors, tri-sec-butoxide (Al (OCH(CH3) C2H5)3; Aldrich 99.9%, St. Louis, MI, USA) and titanium isopropoxide (Ti (OCH3H7)4; Aldrich 98%, St. Louis, MI, USA) were employed. As a solvent, 2-propanol (CH3)2CHOH; Baker 99.5%, Ecatepec, Estado de Mexico, Mexico), and, as hydrolysis catalyst, nitric acid (HNO3) were used. The nominal molar ratio used in all supports was 2-proponol:H2O:alkoxide:HNO3 = 325:100:5:1 [30]. 2-Propanol was cooled to 0 °C and under vigorous stirring, the theoretical amounts of Al and Ti were added. Then, HNO3 aqueous solution was added dropwise. The obtained gel was aged for 24 h at 273 K. Subsequently, it was dried at 333 K. Finally, the dried gel was calcined for 3 h at 773 K with a rate of 3 K min−1. AT2 support textural properties were: SBET = 359 m2 g−1, Vp = 1.1 cm3 g−1, Dp = 7.7 nm, and PZC = 7.6, as previously reported by [32,34].

3.1.2. Catalyst Synthesis

The Al2O3–TiO2 support was impregnated by the successive wetness impregnation method using an aqueous solution of ammonium heptamolybdate ((NH4)6Mo7O24·4H2O; Aldrich 99.9%, St. Louis, MI, USA) and cobalt nitrate ((Co(NO3)2·6H2O; Aldrich 99%, St. Louis, MI, USA). The non-promoted Mo series were loaded at 5, 10, 15, and 20 wt.% Mo, while only Co catalyst was loaded at 2 wt.%. The promoted CoMo catalyst series were impregnated following four different molar Co/(Co + Mo) ratios: 0.1, 0.2, 0.3, and 0.4. For monometallic catalysts, the Mo (or Co) solution was impregnated on AT2 support and was macerated at room conditions for 12 h. After that, it was dried at 393 K and calcinated at 673 K for 5 h. For the promoted catalyst, the Mo calcined materials were impregnated with the cobalt solution and the heat treatment was repeated. Before XPS analysis and the HDO of phenol tests, calcined CoMo samples were sulfided ex-situ in a glass tube reactor with a 10 vol.-% H2S/H2 mixture at 673 K for 2 h. After this, sulfided catalysts were immediately immersed in dodecane to avoid oxidation from air.

3.2. Materials Characterization

3.2.1. Diffuse Reflectance Ultraviolet-Visible Spectroscopy

The diffuse reflectance UV-Vis (DRS UV-Vis) spectra of the synthesized support and promoted and unpromoted oxide catalyst series were recorded with a Lambda 35 spectrometer equipped with an integration sphere (Labsphere RSA-PE-20, North Sutton, NH, USA). The data acquisition was in the 200–1000 nm range with an interval of 0.5 nm and a scan speed of 240 nm−1. The spectra were recorded in the reflectance mode for infinitely thick samples (R) using the reflectance of MgO as a reference.

3.2.2. Laser Raman Spectroscopy

Laser Raman spectroscopy (LRS) of unpromoted Mo catalyst at 10 and 15 wt.% were analyzed with a Perkin Elmer GX Raman FT-IR (Waltham, MA, USA), equipped with an Nd: YAG (1064 nm) laser and InGaAs detector. The data acquisition was carried out with a laser power of 40 to 300 mW at the 3600 to 100 cm−1 Raman shift range with a resolution of 2 to 4 cm−1.

3.2.3. Temperature Programmed Reduction

Temperature programmed reduction (TPR) experiments of the promoted and unpromoted oxide catalysts series were carried out with in an Altamira Instruments AMI-80 (Pittsburgh, PA, USA) apparatus provided with a thermal conductivity detector (TCD) interfaced to a data station. For each TPR test, 50 mg of catalyst precursor were set into a U-shaped quartz cell and pretreated in situ at 523 K for 1 h under 35 mL min−1 He flow. After this, the catalyst precursor was cooled to room temperature. TPR analysis was performed under a stream of 10 vol% of H2/Ar, with a heating rate of 15 °C min−1 up to 1100 K. A moisture trap was used to avoid measurement interference.

3.2.4. X-Ray Photoelectron Spectroscopy (XPS)

The sulfided catalyst were analyzed in a K-alpha Thermo Fischer Scientific spectrometer equipped (Waltham, MA, USA) with a hemispherical electron analyzer and an Al Kα (hν = 1486.6 eV) X-ray source. The residual pressure was kept below 7 × 10⁻⁷ Pa during data acquisition. The binding energies (BEs) were referenced to the C 1s peak (284.9 eV) to account for the charging effects. The areas of the peaks were computed after fitting the experimental spectra to Gaussian/Lorentzian curves and removing the background (Shirley function). After that, surface atomic ratios were calculated from the peak area ratios normalized by the corresponding atomic sensitivity factors. The spectra were analyzed from the 222 to 244 eV region where the Mo 3d levels were located. The surface relative abundance percentages of the Mo and Co species were calculated according to the methodology proposed by Chen et al. [38]. Moreover, we estimated the relative amount of the CoMoS mixed phase, considering the Co species in this phase:
[ Mo 4 + ] ( % )   =   A Mo 4 + A Mo 4 + + A Mo 5 + + A Mo 6 + × 100 ,
[ CoMoS ] ( % )   = A CoMoS A CoMoS + A Co 9 S 8 + A Co 2 + × 100 ,
C ( MoS 2 ) = C ( Mo ) [ Mo 4 + ] / 100 ,
C ( CoMoS ) = C ( Co ) [ CoMoS ] / 100 ,
f CoMoS MoS 2   =   C ( CoMoS ) C ( MoS 2 ) ,
where AMo4+, AMo5+, AMo6+, ACoMoS, ACo9S8, and ACo2+ are the area of each species fitted from the Mo3d and Co2p XPS spectra; C(Mo) and C(Co) are the theoretical mass concentrations of Mo and Co per gram of oxidic catalyst (gmetal/gcatalyts); C(MoS2) and C(CoMoS) are the mass concentrations of MoS2 and CoMoS species per gram of catalyst; and fCoMoS/MoS2 is the mass ratio of the CoMoS and MoS2 species. The C(Co9S8) and C(Co2+) concentrations and mass ratios were quantified in the same way.

3.2.5. Catalytic Performance

To evaluate the catalytic performance of the Mo, Co, and CoMo sulfided catalyst, hydrodeoxygenation of phenol was carried out. HDO of phenol facilitates an understanding of the functionality and reaction mechanisms in catalytic tests since it is a relatively simple molecule and it constitutes the main component in the remnant of the HDO of guaiacol [40]. The reaction took place in a Parr Series 4540 high-pressure batch reactor (Parr Instrument Co., Moline, IL, USA) equipped with a Parr 4842 controller, mechanic impeller, wall-baffles, liquid and gas inlet/outlet gas valves, internal thermocouple, and pressure gauge. The reaction mixture consisted of phenol (500 ppm of oxygen) and CS2 (100 ppm of sulfur) dissolved in 100 mL of n-dodecane and 0.1 g of freshly sulfide catalysts with a particle size between 150 and 180 µm. Catalyst sulfidation was carried out as was described in the XPS methodology. The reactor was pressurized up to 1.4 MPa with N2 to flush air and to prevent oxidation of the sulfide catalysts. After this, the reactor was heated up to 593 K and kept an isothermal operation mode during the reaction. Then, N2 was vented slowly, and hydrogen was introduced up to 5.5 MPa. The reactor operated in an isobaric mode during the reaction time with manual addition of H2 and vigorous agitation of 1000 rpm. The reaction time started from the incorporation of H2. Small samples were collected (0, 10, 20, 30, 45, 60, 90, 120, 180, 240, and 300 min), ensuring that the sum of the volume samples was less than 5% of the initial volume. A gas chromatograph (Agilent 7820A, Santa Clara, CA, USA) equipped with a CP Sil-5 CB capillary column (100% dimethylpolysiloxane, 60 m × 0.32 mm) and a flame ionized detector (FID) were used for the quantification of the products’ concentrations. The initial reaction rates, reagent mol transformed per time of reaction, and mass of a sulfided catalyst (mol g−1s−1) were compared.

4. Conclusions

In the unpromoted catalysts at high Mo loadings, more easily reduced MoOh species were formed, and more active sites were present on these catalysts than at low Mo loadings. Nevertheless, a hardly reduced MoO3 presence was detected at a high Mo content. On the other hand, the functionalities to produce benzene and cyclohexene did not change with the Mo content since all catalysts showed the same selectivity. This indicated that the active sites could cleave the CAR–OH bond but could not properly hydrogenate the π-bonds of the cyclic compounds, i.e., S-edges sites played a more major role than Mo-edges.
Catalytic activity and selectivity were related to the CoOh content. A Co/(Co + Mo) = 0.2 ratio presented a maximum activity for these catalysts. At this Co concentration, CoOh was the main Co oxide coordination species. These CoOh species properly promoted the Mo oxide species and subsequently formed more CoMoS phase than at higher ratios. At a low Co content, it was insufficient to totally promote the Mo oxide species. Therefore, CoMoS phase formation was limited and the MoS2 phase was predominant since benzene was the main product. Plus, Co may have generated CoTh species that were difficult to reduce. At high ratios, the excess Co concentration led to the CoMoO4 phase, and the formation of the CoMoS phase was inadequate. Hence, activity dropped compared with the Co/(Co + Mo) = 0.2 ratio. Moreover, the surplus of Co was segregated and formed CoOh, which transformed into the Co9S8 phase, leading to an enhancement of the HYD route. Finally, the segregated Co oxide species may have formed CoTh as well; thus, catalytic activity decreased.

Author Contributions

C.E.S.-V. and O.U.V.-M. performed and analyzed the characterization experiments and data; J.A.T.-P. conceived, designed, and performed experiments, analyzed the data, and wrote the manuscript; J.A.d.l.R.H. contributed to writing—review of the manuscript, funding acquisition, and was the project administrator and laboratory chief.

Funding

This research was funded by Consejo Nacional de Ciencia y Tenología (CONACYT—Mexico), grant number 237857.

Acknowledgments

The authors are grateful to CONACYT for the financial support 237857 and for the scholarship of J.A. Tavizón-Pozos with number 221991. The authors acknowledge financial support from Instituto Politénico Nacional (Proyecto SIP 20196722) and CONACYT for the projects CB-2017-2018 #A1-S-32418 and the Cátedras-CONACYT number 216.

Conflicts of Interest

The authors declare no conflict of interest.

References

  1. Pourzolfaghar, H.; Abnisa, F.; Wan Daud, W.M.A.; Aroua, M.K. Atmospheric Hydrodeoxygenation of Bio-Oil Oxygenated Model Compounds: A Review. J. Anal. Appl. Pyrolysis 2018, 133, 117–127. [Google Scholar] [CrossRef]
  2. Li, X.; Chen, G.; Liu, C.; Ma, W.; Yan, B.; Zhang, J. Hydrodeoxygenation of Lignin-Derived Bio-Oil Using Molecular Sieves Supported Metal Catalysts: A Critical Review. Renew. Sustain. Energy Rev. 2017, 71, 296–308. [Google Scholar] [CrossRef]
  3. Dabros, T.M.H.; Stummann, M.Z.; Høj, M.; Jensen, P.A.; Grunwaldt, J.-D.; Gabrielsen, J.; Mortensen, P.M.; Jensen, A.D. Transportation Fuels from Biomass Fast Pyrolysis, Catalytic Hydrodeoxygenation, and Catalytic Fast Hydropyrolysis. Prog. Energy Combust. Sci. 2018, 68, 268–309. [Google Scholar] [CrossRef]
  4. Linck, M.; Felix, L.; Marker, T.; Roberts, M. Integrated Biomass Hydropyrolysis and Hydrotreating: A Brief Review. Wiley Interdiscip. Rev. Energy Environ. 2014, 3, 575–581. [Google Scholar] [CrossRef]
  5. Furimsky, E. Hydroprocessing Challenges in Biofuels Production. Catal. Today 2013, 217, 13–56. [Google Scholar] [CrossRef]
  6. Huber, G.W.; Iborra, S.; Corma, A. Synthesis of Transportation Fuels from Biomass Chemistry Catalysts and Enginneering. Chem. Rev. 2006, 106, 4044–4098. [Google Scholar] [CrossRef] [PubMed]
  7. Li, X.; Zhang, J.; Liu, B.; Liu, J.; Wang, C.; Chen, G. Hydrodeoxygenation of Lignin-Derived Phenols to Produce Hydrocarbons over Ni/Al-SBA-15 Prepared with Different Impregnants. Fuel 2019, 243, 314–321. [Google Scholar] [CrossRef]
  8. Jahromi, H.; Agblevor, F. Hydrogenation of Aqueous-Phase Catalytic Pyrolysis Oil to Liquid Hydrocarbons Using Multifunctional Nickel Catalyst. Ind. Eng. Chem. Res. 2018, 57, 13257–13268. [Google Scholar] [CrossRef]
  9. Bui, V.N.; Laurenti, D.; Delichère, P.; Geantet, C. Hydrodeoxygenation of Guaiacol: Part II: Support Effect for CoMoS Catalysts on HDO Activity and Selectivity. Appl. Catal. B Environ. 2011, 101, 246–255. [Google Scholar] [CrossRef]
  10. Şenol, O.İ.; Ryymin, E.-M.; Viljava, T.-R.; Krause, A.O.I. Effect of Hydrogen Sulphide on the Hydrodeoxygenation of Aromatic and Aliphatic Oxygenates on Sulphided Catalysts. J. Mol. Catal. A Chem. 2007, 277, 107–112. [Google Scholar] [CrossRef]
  11. Bu, Q.; Lei, H.; Zacher, A.H.; Wang, L.; Ren, S.; Liang, J.; Wei, Y.; Liu, Y.; Tang, J.; Zhang, Q.; et al. A Review of Catalytic Hydrodeoxygenation of Lignin-Derived Phenols from Biomass Pyrolysis. Bioresour. Technol. 2012, 124, 470–477. [Google Scholar] [CrossRef] [PubMed]
  12. Echeandia, S.; Arias, P.L.; Barrio, V.L.; Pawelec, B.; Fierro, J.L.G. Synergy Effect in the HDO of Phenol over Ni–W Catalysts Supported on Active Carbon: Effect of Tungsten Precursors. Appl. Catal. B Environ. 2010, 101, 1–12. [Google Scholar] [CrossRef]
  13. Bui, V.N.; Laurenti, D.; Afanasiev, P.; Geantet, C. Hydrodeoxygenation of Guaiacol with CoMo Catalysts. Part I: Promoting Effect of Cobalt on HDO Selectivity and Activity. Appl. Catal. B Environ. 2011, 101, 239–245. [Google Scholar] [CrossRef]
  14. Honkela, M.L.; Viljava, T.-R.; Gutierrez, A.; Krause, A.O.I. Chapter 11 Hydrotreating for Bio-Oil Upgrading. In Thermochemical Conversion of Biomass to Liquid Fuels and Chemicals; Crocker, M., Ed.; The Royal Society of Chemistry: London, UK, 2010; pp. 288–306. [Google Scholar]
  15. Zhang, J.; Dong, K.; Luo, W. PdCl2-Catalyzed Hydrodeoxygenation of 5-Hydroxymethylfurfural into 2,5-Dimethylfuran at Room-Temperature using Polymethylhydrosiloxane as the Hydrogen Donor. Chem. Eng. Sci. 2019, 201, 467–474. [Google Scholar] [CrossRef]
  16. Viljava, T.-R.; Komulainen, S.; Selvam, T.; Krause, A.O.I. Stability of CoMo/Al2O3 Catalysts: Effect of HDO Cycles on HDS. In Studies in Surface Science and Catalysis: Hydrotreatment and Hydrocracking of Oil Fractions Proceedings of the 2nd International Symposium/7th European Workshop; Delmon, B., Froment, G.F., Grange, P., Eds.; Elsevier: Antwerpen, Belgium, 1999; Volume 127, pp. 145–152. [Google Scholar] [CrossRef]
  17. Massoth, F.E.; Politzer, P.; Concha, M.C.; Murray, J.S.; Jakowski, J.; Simons, J. Catalytic Hydrodeoxygenation of Methyl-Substituted Phenols: Correlations of Kinetic Parameters with Molecular Properties. J. Phys. Chem. B 2006, 110, 14283–14291. [Google Scholar] [CrossRef] [PubMed] [Green Version]
  18. Badawi, M.; Paul, J.F.; Cristol, S.; Payen, E.; Romero, Y.; Richard, F.; Brunet, S.; Lambert, D.; Portier, X.; Popov, A.; et al. Effect of Water on the Stability of Mo and CoMo Hydrodeoxygenation Catalysts: A Combined Experimental and DFT Study. J. Catal. 2011, 282, 155–164. [Google Scholar] [CrossRef]
  19. Wildschut, J.; Mahfud, F.H.; Venderbosch, R.H.; Heeres, H.J. Hydrotreatment of Fast Pyrolysis Oil Using Heterogeneous Noble-Metal Catalysts. Ind. Eng. Chem. Res. 2009, 48, 10324–10334. [Google Scholar] [CrossRef]
  20. Lauritsen, J.V.; Besenbacher, F. Atom-Resolved Scanning Tunneling Microscopy Investigations of Molecular Adsorption on MoS2 and CoMoS Hydrodesulfurization Catalysts. J. Catal. 2015, 328, 49–58. [Google Scholar] [CrossRef]
  21. Topsøe, H.; Clausen, B.S.; Massoth, F.E. Hydrotreating Catalysis BT—Catalysis: Science and Technology; Anderson, J.R., Boudart, M., Eds.; Springer Berlin Heidelberg: Berlin/Heidelberg, Germany, 1996; 269p. [Google Scholar]
  22. Lauritsen, J.V.; Nyberg, M.; Nørskov, J.K.; Clausen, B.S.; Topsøe, H.; Lægsgaard, E.; Besenbacher, F. Hydrodesulfurization Reaction Pathways on MoS2 Nanoclusters Revealed by Scanning Tunneling Microscopy. J. Catal. 2004, 224, 94–106. [Google Scholar] [CrossRef]
  23. Zhu, Y.; Ramasse, Q.M.; Brorson, M.; Moses, P.G.; Hansen, L.P.; Topsøe, H.; Kisielowski, C.F.; Helveg, S. Location of Co and Ni Promoter Atoms in Multi-Layer MoS2 Nanocrystals for Hydrotreating Catalysis. Catal. Today 2016, 261, 75–81. [Google Scholar] [CrossRef]
  24. Liu, B.; Liu, L.; Chai, Y.; Zhao, J.; Liu, C. Essential Role of Promoter Co on the MoS2 Catalyst in Selective Hydrodesulfurization of FCC Gasoline. J. Fuel Chem. Technol. 2018, 46, 441–450. [Google Scholar] [CrossRef]
  25. Kim, D.S.; Segawa, K.; Soeya, T.; Wachs, I.E. Surface Structures of Supported Molybdenum Oxide Catalysts under Ambient Conditions. J. Catal. 1992, 136, 539–553. [Google Scholar] [CrossRef]
  26. Ng, K.Y.S.; Gulari, E. Molybdena on Titania: I. Preparation and Characterization by Raman and Fourier Transform Infrared Spectroscopy. J. Catal. 1985, 92, 340–354. [Google Scholar] [CrossRef]
  27. Cáceres, C.V.; Fierro, J.L.G.; Lázaro, J.; López Agudo, A.; Soria, J. Effect of Support on the Surface Characteristics of Supported Molybdena Catalysts. J. Catal. 1990, 122, 113–125. [Google Scholar] [CrossRef]
  28. Breysse, M.; Afanasiev, P.; Geantet, C.; Vrinat, M. Overview of Support Effects in Hydrotreating Catalysts. Catal. Today 2003, 86, 5–16. [Google Scholar] [CrossRef]
  29. Gutiérrez-Alejandre, A.; Ramírez, J.; Val, I.J.; Peñuelas-Galaz, M.; Sánchez-Neri, P.; Torres-Mancera, P. Activity of NiW Catalysts Supported on TiO2-Al2O3 Mixed Oxides: Effect of Ti Incorporation Method on the HDS of 4,6-DMDBT. Catal. Today 2005, 107–108, 879–884. [Google Scholar] [CrossRef]
  30. Escobar, J.; Antonio De Los Reyes, J.; Viveros, T. Nickel on TiO2-Modified Al2O3 Sol–Gel Oxides: Effect of Synthesis Parameters on the Supported Phase Properties. Appl. Catal. A Gen. 2003, 253, 151–163. [Google Scholar] [CrossRef]
  31. Núñez, S.; Escobar, J.; Vázquez, A.; de los Reyes, J.A.; Hernández-Barrera, M. 4,6-Dimethyl-Dibenzothiophene Conversion over Al2O3–TiO2-Supported Noble Metal Catalysts. Mater. Chem. Phys. 2011, 126, 237–247. [Google Scholar] [CrossRef]
  32. Tavizón-Pozos, J.A.; Suárez-Toriello, V.A.; de los Reyes, J.A.; Guevara-Lara, A.; Pawelec, B.; Fierro, J.L.G.; Vrinat, M.; Geantet, C. Deep Hydrodesulfurization of Dibenzothiophenes Over NiW Sulfide Catalysts Supported on Sol–Gel Titania–Alumina. Top. Catal. 2016, 59, 241–251. [Google Scholar] [CrossRef]
  33. Suárez-Toriello, V.A.; Santolalla-Vargas, C.E.; de los Reyes, J.A.; Vázquez-Zavala, A.; Vrinat, M.; Geantet, C. Influence of the Solution PH in Impregnation with Citric Acid and Activity of Ni/W/Al2O3 Catalysts. J. Mol. Catal. A Chem. 2015, 404–405, 36–46. [Google Scholar] [CrossRef]
  34. Tavizón-Pozos, J.A.; Suárez-Toriello, V.A.; del Ángel, P.; de los Reyes, J.A. Hydrodeoxygenation of Phenol Over Sulfided CoMo Catalysts Supported on a Mixed Al2O3-TiO2 Oxide. Int. J. Chem. React. Eng. 2016, 14, 1211–1223. [Google Scholar] [CrossRef]
  35. Escobar, J.; Núñez, S.; Montesinos-Castellanos, A.; de los Reyes, J.A.; Rodríguez, Y.; González, O.A. Dibenzothiophene Hydrodesulfurization over PdPt/Al2O3–TiO2. Influence of Ti-Addition on Hydrogenating Properties. Mater. Chem. Phys. 2016, 171, 185–194. [Google Scholar] [CrossRef]
  36. Olguin, E.; Vrinat, M.; Cedeño, L.; Ramirez, J.; Borque, M.; López-Agudo, A. The Use of TiO2—Al2O3 Binary Oxides as Supports for Mo-Based Catalysts in Hydrodesulfurization of Thiophene and Dibenzothiophene. Appl. Catal. A Gen. 1997, 165, 1–13. [Google Scholar] [CrossRef]
  37. Ramírez, J.; Macías, G.; Cedeño, L.; Gutiérrez-Alejandre, A.; Cuevas, R.; Castillo, P. The Role of Titania in Supported Mo, CoMo, NiMo, and NiW Hydrodesulfurization Catalysts: Analysis of Past and New Evidences. Catal. Today 2004, 98, 19–30. [Google Scholar] [CrossRef]
  38. Chen, W.; Long, X.; Li, M.; Nie, H.; Li, D. Influence of Active Phase Structure of CoMo/Al2O3 Catalyst on the Selectivity of Hydrodesulfurization and Hydrodearomatization. Catal. Today 2017, 292, 97–109. [Google Scholar] [CrossRef]
  39. Wang, L.; Hall, W.K. On the Genesis of Molybdena-Alumina Catalyst. J. Catal. 1980, 66, 251–255. [Google Scholar] [CrossRef]
  40. Kim, D.S.; Kurusu, Y.; Wachs, I.E.; Hardcastle, F.D.; Segawa, K. Physicochemical Properties of MoO3 TiO2 Prepared by an Equilibrium Adsorption Method. J. Catal. 1989, 120, 325–336. [Google Scholar] [CrossRef]
  41. Afanasiev, P.; Geantet, C.; Breysse, M. Preparation of High-Surface-Area Mo/ZrO2 Catalysts by a Molten Salt Method: Application to Hydrodesulfurization. J. Catal. 1995, 153, 17–24. [Google Scholar] [CrossRef]
  42. Williams, C.C.; Ekerdt, J.G.; Jehng, J.M.; Hardcastle, F.D.; Wachs, I.E. A Raman and Ultraviolet Diffuse Reflectance Spectroscopic Investigation of Alumina-Supported Molybdenum Oxide. J. Phys. Chem. 1991, 95, 8791–8797. [Google Scholar] [CrossRef]
  43. Xiong, G.; Li, C.; Feng, Z.; Ying, P.; Xin, Q.; Liu, J. Surface Coordination Structure of Molybdate with Extremely Low Loading on γ-Alumina Characterized by UV Resonance Raman Spectroscopy. J. Catal. 1999, 186, 234–237. [Google Scholar] [CrossRef]
  44. Stencel, J.M. Raman Spectroscopy for Catalysis, 1st ed.; Davis, B., Ed.; Van Nostrand Reinhold: New York, NY, USA, 1990. [Google Scholar]
  45. Lozano-Hernández, G.; Lozada-Ascencio, E.M.; Guevara-Lara, A. Support Composition Effect on Superficial Structures of Nickel and Molybdenum Oxides Supported on TiO2-Al2O3 Mixed Oxides. Rev. Mex. Ing. Química 2006, 5, 311–320. [Google Scholar]
  46. Aveston, J.; Anacker, E.W.; Johnson, J.S. Hydrolysis of Molybdenum(VI). Ultracentrifugation, Acidity Measurements, and Raman Spectra of Polymolybdates. Inorg. Chem. 1964, 3, 735–746. [Google Scholar] [CrossRef]
  47. Platanitis, P.; Panagiotou, G.D.; Bourikas, K.; Kordulis, C.; Fierro, J.L.G.; Lycourghiotis, A. Preparation of Un-Promoted Molybdenum HDS Catalysts Supported on Titania by Equilibrium Deposition Filtration: Optimization of the Preparative Parameters and Investigation of the Promoting Action of Titania. J. Mol. Catal. A Chem. 2016, 412, 1–12. [Google Scholar] [CrossRef]
  48. Vakros, J.; Lycourghiotis, A.; Voyiatzis, G.A.; Siokou, A.; Kordulis, C. CoMo/Al2O3-SiO2 Catalysts Prepared by Co-Equilibrium Deposition Filtration: Characterization and Catalytic Behavior for the Hydrodesulphurization of Thiophene. Appl. Catal. B Environ. 2010, 96, 496–507. [Google Scholar] [CrossRef]
  49. Malaibari, Z.O.; Croiset, E.; Amin, A.; Epling, W. Effect of Interactions between Ni and Mo on Catalytic Properties of a Bimetallic Ni-Mo/Al2O3 Propane Reforming Catalyst. Appl. Catal. A Gen. 2015, 490, 80–92. [Google Scholar] [CrossRef]
  50. Arnoldy, P.; Franken, M.C.; Scheffer, B.; Moulijn, J.A. Temperature-Programmed Reduction of CoO MoO3Al2O3 Catalysts. J. Catal. 1985, 96, 381–395. [Google Scholar] [CrossRef]
  51. Bergwerff, J.A.; Visser, T.; Weckhuysen, B.M. On the Interaction between Co- and Mo-Complexes in Impregnation Solutions Used for the Preparation of Al2O3-Supported HDS Catalysts: A Combined Raman/UV–Vis–NIR Spectroscopy Study. Catal. Today 2008, 130, 117–125. [Google Scholar] [CrossRef]
  52. Okamoto, Y.; Imanaka, T. Interaction Chemistry between Molybdena and Alumina: Infrared Studies of Surface Hydroxyl Groups and Adsorbed Carbon Dioxide on Aluminas Modified with Molybdate, Sulfate, or Fluorine Anions. J. Phys. Chem. 1988, 92, 7102–7112. [Google Scholar] [CrossRef]
  53. Topsoe, N.Y.; Topsoe, H. FTIR Studies of Mo/Al2O3-Based Catalysts: I. Morphology and Structure of Calcined and Sulfided Catalysts. J. Catal. 1993, 139, 631–640. [Google Scholar] [CrossRef]
  54. Besenbacher, F.; Brorson, M.; Clausen, B.S.; Helveg, S.; Hinnemann, B.; Kibsgaard, J.; Lauritsen, J.V.; Moses, P.G.; Nørskov, J.K.; Topsøe, H. Recent STM, DFT and HAADF-STEM Studies of Sulfide-Based Hydrotreating Catalysts: Insight into Mechanistic, Structural and Particle Size Effects. Catal. Today 2008, 130, 86–96. [Google Scholar] [CrossRef]
  55. Lauritsen, J.V.; Kibsgaard, J.; Olesen, G.H.; Moses, P.G.; Hinnemann, B.; Helveg, S.; Nørskov, J.K.; Clausen, B.S.; Topsøe, H.; Lægsgaard, E.; et al. Location and Coordination of Promoter Atoms in Co- and Ni-Promoted MoS2-Based Hydrotreating Catalysts. J. Catal. 2007, 249, 220–233. [Google Scholar] [CrossRef]
  56. Vrinat, M.; Letourneur, D.; Bacaud, R.; Harlé, V.; Jouguet, B.; Leclercq, C. CoMo/Al2O3 and CoMo/TiO2-Al2O3 Catalysts in Hydrodesulfurization: Relationship between the Promoting Effect of Cobalt and the Nature of the Support. In Studies in Surface Science and Catalysis: Hydrotreatment and Hydrocracking of Oil Fractions Proceedings ofthe 2nd International Symposium/7th European Workshop; Delmon, B., Froment, G.F., Grange, P., Eds.; Elsevier: Antwerpen, Belgium, 1999; Volume 127, pp. 153–160. [Google Scholar]
  57. Vakros, J.; Papadopoulou, C.; Lycourghiotis, A.; Kordulis, C. Hydrodesulfurization Catalyst Bodies with Various Co and Mo Profiles. Appl. Catal. A Gen. 2011, 399, 211–220. [Google Scholar] [CrossRef]
  58. Montoya, J.A.; del Angel, P.; Viveros, T. The Effect of Temperature on the Structural and Textural Evolution of Sol-Gel AlO-TiO Mixed Oxides. J. Mater. Chem. 2001, 11, 944–950. [Google Scholar] [CrossRef]
  59. Herrera, J.E.; Resasco, D.E. Loss of Single-Walled Carbon Nanotubes Selectivity by Disruption of the Co–Mo Interaction in the Catalyst. J. Catal. 2004, 221, 354–364. [Google Scholar] [CrossRef]
  60. Vakros, J.; Bourikas, K.; Perlepes, S.; Kordulis, C.; Lycourghiotis, A. Adsorption of Cobalt Ions on the “Electrolytic Solution/γ-Alumina” Interface Studied by Diffuse Reflectance Spectroscopy (DRS). Langmuir 2004, 20, 10542–10550. [Google Scholar] [CrossRef] [PubMed]
  61. Papadopoulou, C.; Vakros, J.; Matralis, H.K.; Voyiatzis, G.A.; Kordulis, C. Preparation, Characterization, and Catalytic Activity of CoMo/γ-Al2O3 Catalysts Prepared by Equilibrium Deposition Filtration and Conventional Impregnation Techniques. J. Colloid Interface Sci. 2004, 274, 159–166. [Google Scholar] [CrossRef]
  62. Brito, J.L.; Barbosa, A.L. Effect of Phase Composition of the Oxidic Precursor on the HDS Activity of the Sulfided Molybdates of Fe(II), Co(II), and Ni(II). J. Catal. 1997, 171, 467–475. [Google Scholar] [CrossRef]
  63. Papadopoulou, C.; Vakros, J.; Matralis, H.K.; Kordulis, C.; Lycourghiotis, A. On the Relationship between the Preparation Method and the Physicochemical and Catalytic Properties of the CoMo/γ-Al2O3 Hydrodesulfurization Catalysts. J. Colloid Interface Sci. 2003, 261, 146–153. [Google Scholar] [CrossRef]
  64. Zhang, Z.; Zhang, Q.; Jia, L.; Wang, W.; Zhang, T.; Han, Y.; Tsubaki, N.; Tan, Y. Effects of Tetrahedral Molybdenum Oxide Species and MoOx Domains on the Selective Oxidation of Dimethyl Ether under Mild Conditions. Catal. Sci. Technol. 2016, 6, 2975–2983. [Google Scholar] [CrossRef]
  65. Jermwongratanachai, T.; Jacobs, G.; Shafer, W.D.; Pendyala, V.R.R.; Ma, W.; Gnanamani, M.K.; Hopps, S.; Thomas, G.A.; Kitiyanan, B.; Khalid, S.; et al. Fischer–Tropsch Synthesis: TPR and XANES Analysis of the Impact of Simulated Regeneration Cycles on the Reducibility of Co/Alumina Catalysts with Different Promoters (Pt, Ru, Re, Ag, Au, Rh, Ir). Catal. Today 2014, 228, 15–21. [Google Scholar] [CrossRef]
  66. Jacobs, G.; Ji, Y.; Davis, B.H.; Cronauer, D.; Kropf, A.J.; Marshall, C.L. Fischer–Tropsch Synthesis: Temperature Programmed EXAFS/XANES Investigation of the Influence of Support Type, Cobalt Loading, and Noble Metal Promoter Addition to the Reduction Behavior of Cobalt Oxide Particles. Appl. Catal. A Gen. 2007, 333, 177–191. [Google Scholar] [CrossRef]
  67. Yamada, M.; Kasahara, S.; Kawahara, K. Interaction between Co Species and Mo Species in C0O-M0O3/AI2O3. In Studies in Surface Science and Catalysis: New Aspects of Spillover Effect in Catalysis; lnui, T., Fujimoto, K., Uchijima, T., Masai, M., Eds.; Elsevier: Kyoto, Japan, 1993; Volume 77, pp. 349–352. [Google Scholar] [CrossRef]
  68. Guo, C.; Wu, Y.; Wang, X.; Yang, B. Effect of the Support Calcination Temperature on Selective Hydrodesulfurization of TiO2 Nanotubes Supported CoMo Catalysts. J. Energy Chem. 2013, 22, 517–523. [Google Scholar] [CrossRef]
  69. Gandubert, A.D.; Krebs, E.; Legens, C.; Costa, D.; Guillaume, D.; Raybaud, P. Optimal Promoter Edge Decoration of CoMoS Catalysts: A Combined Theoretical and Experimental Study. Catal. Today 2008, 130, 149–159. [Google Scholar] [CrossRef]
  70. Ninh, T.K.T.; Laurenti, D.; Leclerc, E.; Vrinat, M. Support Effect for CoMoS and CoNiMoS Hydrodesulfurization Catalysts Prepared by Controlled Method. Appl. Catal. A Gen. 2014, 487, 210–218. [Google Scholar] [CrossRef]
  71. Laurenti, D.; Phung-Ngoc, B.; Roukoss, C.; Devers, E.; Marchand, K.; Massin, L.; Lemaitre, L.; Legens, C.; Quoineaud, A.-A.; Vrinat, M. Intrinsic Potential of Alumina-Supported CoMo Catalysts in HDS: Comparison between Γc, ΓT, and δ-Alumina. J. Catal. 2013, 297, 165–175. [Google Scholar] [CrossRef]
  72. La Parola, V.; Dragoi, B.; Ungureanu, A.; Dumitriu, E.; Venezia, A.M. New HDS Catalysts Based on Thiol Functionalized Mesoporous Silica Supports. Appl. Catal. A Gen. 2010, 386, 43–50. [Google Scholar] [CrossRef]
  73. Brorson, M.; Carlsson, A.; Topsøe, H. The Morphology of MoS2, WS2, Co–Mo–S, Ni–Mo–S and Ni–W–S Nanoclusters in Hydrodesulfurization Catalysts Revealed by HAADF-STEM. Catal. Today 2007, 123, 31–36. [Google Scholar] [CrossRef]
Figure 1. Normalized initial reaction rate of HDO of phenol for unpromoted Mo/AT2 catalysts at different Mo loadings at 5.5 MPa, 593 K, and 100 ppm S, (■) by gram of catalyst, (▲) by gram of Mo.
Catalysts 09 00550 g001
Figure 2. Products yields of HDO of phenol for unpromoted Mo/AT2 catalysts at different Mo loadings at 5.5 MPa, 593 K, and 100 ppm S.
Catalysts 09 00550 g002
Figure 3. Diffuse reflectance UV-vis spectra of the unpromoted Mo/AT2 catalysts calcined at 673 K with different Mo loadings: a) AT2, (b) 5 wt.%, (c) 10 wt.%, (d) 15 wt.%, and (e) 20 wt.%.
Catalysts 09 00550 g003
Figure 4. Laser Raman spectra of Mo/AT2 catalyst calcined at 673 K with different Mo loadings: (a) 10 wt.%, (b) 15 wt.%.
Catalysts 09 00550 g004
Figure 5. TPR profiles for unpromoted Mo/AT2 catalysts calcined at 673 K at different Mo loadings. (a) AT2, (b) 5 wt.%, (c) 10 wt.%, (d) 15 wt.%, and (e) 20 wt.%.
Catalysts 09 00550 g005
Figure 6. Initial reaction rates of HDO of phenol at different Co/(Co + Mo) ratios in the promoted CoMo/AT2 catalyst (■) at 10 wt.% Mo and (●) 15 wt.% Mo.
Catalysts 09 00550 g006
Figure 7. DR UV-vis spectra of the Co/AT2 calcined at 673 K.
Catalysts 09 00550 g007
Figure 8. DR UV-vis spectra of the CoMo supported catalysts calcined at 673 K at different Co/(Co + Mo) ratios: (a) 0.1, (b) 0.2, (c) 0.3, and (d) 0.4.
Catalysts 09 00550 g008
Figure 9. Correlation between CoOh and Co loading of the promoted CoMo catalyst with 10 wt.% and 15 wt.% Mo calcined at 673 K.
Catalysts 09 00550 g009
Figure 10. Correlation between the initial reaction rate of the HDO of phenol and octahedral Co of 10 wt.% and 15 wt.% Mo supported catalysts.
Catalysts 09 00550 g010
Figure 11. TPR profile of Co/AT2 catalyst calcined at 673 K.
Catalysts 09 00550 g011
Figure 12. TPR profiles of CoMo/AT2 calcined catalyst at 15 wt.% Mo with different Co/(Co + Mo) ratios: (a) 0.1, (b) 0.2, (c) 0.3, and (d) 0.4.
Catalysts 09 00550 g012
Figure 13. XPS deconvolution of Mo3d core level for sulfided 15 wt.% Mo CoMo/AT2 catalysts at the Co/(Co + Mo) = 0.2 ratio.
Catalysts 09 00550 g013
Figure 14. XPS deconvolution of Co 2p core level for sulfided 15 wt.% Mo CoMo/AT2 catalysts at the Co/(Co + Mo) = 0.2 ratio.
Catalysts 09 00550 g014
Table 1. Initial reaction rate of the HDO of phenol at 5.5 MPa and 593 K and product yields at 15% of the conversion for AT2 support and Co/AT2 sulfided catalyst.
CatalystR0
(×108mol∙(gcat·s)−1)
Product Yields at 15% of Phenol Conversion
Benzene
(%)
O-I
(%)
Cyclohexene
(%)
Cyclohexane
(%)
AT26.6 ± 0.63462
Co/AT29.1 ± 0.93129
Table 2. Synergic effect in the HDO of phenol with CoMo/AT2 at different Co concentrations.
Co/(Co + Mo)Synergic Factor
0.11.6
0.22.8
0.32.3
0.42.2
Table 3. Direct deoxygenation and hydrogenation route ratio of HDO of phenol at 20% of the phenol conversion for the CoMo/AT2 catalyst.
Co/(Co + Mo)DDO/HYD
0.11.75 ± 0.1
0.21.60 ± 0.1
0.31.36 ± 0.1
0.41.27 ± 0.1
Table 4. Binding energies of the Mo 3d5/2 contributions obtained for sulfided 15 wt.% Mo CoMo/AT2 catalysts at Co/(Co + Mo) = 0.2 and 0.4.
CatalystsMo4+Mo5+Mo6+
BE (eV)%BE (eV)%BE (eV)%
CoMo/AT2 (0.2)228.7669230.4019232.8012
CoMo/AT2 (0.4)228.7959230.2830232.5011
Table 5. Binding energies of the Co 2p3/2 contributions obtained for sulfided 15 wt.% Mo CoMo/AT2 catalysts at Co/(Co + Mo) = 0.2 and 0.4.
CatalystCo9S8CoMoSCo2+
BE (eV)%BE (eV)%BE (eV)%
CoMo/AT2 (0.2)778.1613778.7651780.736
CoMo/AT2 (0.4)778.3019778.8044780.837
Table 6. Concentrations and atomic ratios of the Co and Mo species of the 15 wt.% Mo CoMo/AT2 catalyst at Co/(Co + Mo) = 0.2 and 0.4.
CatalystsConcentration (gmetal·gcat−1)Fraction
MoS2Co9S8CoMoSCo2+fCoMos/MoS2fCoMoS/Co9S8fCoMoS/Co2+
CoMo/AT2 (0.2)0.1040.0040.0140.0100.143.921.42
CoMo/AT2 (0.4)0.0890.0110.0260.0220.292.321.19

