Monodispersed Pt3Ni Nanoparticles as a Highly Efficient Electrocatalyst for PEMFCs
by
 , and
, and
Delong Yang
1,†, 
Jun Gu
1,*,†,
Xiaomeng Liu
1,
Haitong He
1,
Meiyu Wang
2,
Peng Wang
2,
Yong Zhu
1,
Qi Fan
3,* and
Runsheng Huang
1,* 1
College of Physics, Nanjing University, Nanjing 210093, China
2
National Laboratory of Solid State Microstructures, College of Engineering and Applied Sciences and Collaborative Innovation Center of Advanced Microstructures, Nanjing University, Nanjing 210093, China
3
School of Materials Science and Engineering, Southeast University, Nanjing 210096, China
*
Authors to whom correspondence should be addressed.
†
D.Y. and J.G. contributed equally.
Catalysts 2019, 9(7), 588; https://doi.org/10.3390/catal9070588
Submission received: 6 June 2019
/
Revised: 2 July 2019
/
Accepted: 4 July 2019
/
Published: 5 July 2019
(This article belongs to the Special Issue Recent Advances in Pt-Based Catalysts: Theoretical and Experimental Results)
Abstract
:A facile strategy is proposed to synthesize monodispersed Pt3Ni nanoparticles. Such a kind of electrocatalyst shows a larger electrochemical surface area (98.9 m2 gpt−1) and double the mass activity of the oxygen reduction reaction activity compared to commercial Pt/C catalyst. The results show that the suitable addition of Ni and triethylamine in the reduction process plays an important role in controlling the size and dispersion of Pt3Ni nanoparticles. A further membrane electrode assembly test proves that as-prepared Pt3Ni nanoparticles can greatly enhance the electrochemical performance of a proton exchange membrane fuel cell, which exhibits a great potential of application in fuel cells.
1. Introduction
One of the most competitive substitutions to combustion engines as power sources for vehicles, proton exchange membrane fuel cells (PEMFCs), has attracted much attention because of the high power conversion efficiency, environmentally-friendly characteristic, low operational temperature, and flexible power ranges in applications [1,2]. In recent years, the rapid development of low-platinum electrocatalysts greatly reduced the cost of PEMFCs [3,4], which promoted the commercialization of PEMFCs. Considering the strain and ligand effects on the electrocatalytic activity for the oxygen reduction reaction (ORR), PtNi electrocatalysts with ultrafine nanostructures such as nanowire [5], octahedron [6,7], and nanoframe [8], have shown great improvements in accelerating the sluggish ORR, owing to their exclusive (111)-oriented facets [9]. The majority of the above advanced PtNi materials are synthesized in the milligram scale by the solvothermal method or oil bath. Using Pt(acac)2 and Ni(acac)2 as precursors, PtNi octahedrons with an average size of 4.2 ± 0.2 nm are synthesized in the heated organic solvent dimethylformamide [6]. Although all these kinds of electrocatalysts have intrinsically exhibited great catalytic activity for ORR, it is still a big challenge to achieve their excellent mass activity in the test of practical membrane electrode assemblies (MEAs) [10]. Furthermore, recent reports have demonstrated that a large electrochemically-active surface area (ECSA) is one of the key factors to maximize the power output in the PEMFCs [4,10]. Therefore, how to keep the relatively high catalytic activity of Pt-Ni nanomaterials and maintain a large ECSA in a convenient way is still a big issue with which to deal.
Sodium borohydride (NaBH4), as a strong reductant, has been frequently used in the synthesis of Pt-based nanomaterials [11,12,13]. It is known that the size and aggregation of the Pt-based nanoparticles can greatly affect the electrocatalysts’ ECSA and the intrinsic catalytic activity for ORR [14]. One way to solve this is by controlling the reduction rate to minimize the size and prevent the particle aggregation of the nanocatalysts [15,16]; the other way is minimizing metallic nanoparticle aggregation by introducing a suitable chemical surfactant to protect the nanoparticle nuclei’s surfaces [11,17,18]. The most effective way to control the reduction rate of NaBH4 is controlling the pH and temperature of the solvent. In aqueous solution, sodium hydroxide (NaOH) is commonly used to adjust the solvents’ pH to a suitable value in order to make uniform nanoparticles. However, this strategy is not effective enough in organic solvent. In recent reports, triethylamine (TEA) had been successfully used to synthesize single-crystalline platinum nanowires in a mixed organic solvent with a high aspect ratio of ca. 2.0 nm in diameter by stabilizing Pt(0) nuclei [11,19]. Besides, monodispersed silver nanoparticles were synthesized by using TEA as a reductant and surfactant [20]. Considering its alkalescence, it can be a promising surfactant to synthesize monodispersed Pt-based nanoparticles in organic solvent using NaBH4 as a reductant.
In this work, a facile route is presented to synthesize monodispersed PtNi nanoparticles supported on carbon black with the help of NaBH4 and TEA. The morphology, size, composition, and distribution of the synthesized samples were characterized, and the electrochemical activity and durability of the products were tested in both a rotating disk electrode (RDE) and membrane electrode assembly (MEA) as compared to commercial Pt/C catalyst. Finally, comparison of the optimal catalyst and state-of-the art are given in Table S1.
2. Results and Discussion
The typical syntheses of Pt/EC-600 (EC-600, carbon black from Ketjenblack), NT (no TEA)-Pt3Ni/EC-600, Pt3Ni/EC-600, and PtNi/EC-600 are shown in Section 3.2. The X-ray diffraction (XRD) patterns of as-prepared Pt/EC-600, NT-Pt3Ni/EC-600, Pt3Ni/EC-600, and PtNi/EC-600 are shown in Figure 1. All of the samples had the representative face-centered cubic (fcc) structure corresponding to Pt and PtNi phases. With the addition of Ni in the above samples, 2θ values of the corresponding diffraction peaks were becoming a little bit bigger compared to the pure Pt phase, which shows a high degree of consistency with Vegard’s laws [21]. A diffraction peak between 20° and 30° can be indexed to carbon black [22], and no extra peaks for phase separated structures such as a pure Ni or its oxides were observed, which indicates a good degree of alloying between Pt and Ni. According to the Scherrer equation, the average grain sizes of Pt/EC-600, NT-Pt3Ni/EC-600, Pt3Ni/EC-600, and PtNi/EC-600 were 3.4 nm, 2.8 nm, 2.4 nm, and 3.1 nm, which suggests a smaller grain size of PtNi nanoparticles formed with the suitable addition of Ni.
Transmission electron microscopy (TEM) images of as-prepared Pt-based particles are shown in Figure 2 and Figure 3. The major morphologies of PtNi/EC-600, Pt3Ni/EC-600, and NT-Pt3Ni/EC-600 were spherical, while an irregular morphology can be observed in Pt/EC-600. This suggests that the addition of Ni can greatly influence the growth mechanism of Pt-based nanoparticles. Besides, in comparison with the monodispersed Pt3Ni/EC-600, there are different degrees of nanoparticle agglomeration in Pt/EC-600, PtNi/EC-600, and NT-Pt3Ni/EC-600 in Figure 3, which indicates that precisely controlling the addition of Ni and TEA can make a big contribution to the uniform distribution of Pt-based nanoparticles. The average particle sizes of NT-Pt3Ni/EC-600, Pt3Ni/EC-600, Pt/EC-600, and PtNi/EC-600 were 3.97, 2.80, 2.52, and 2.56 nm by measuring 100 randomly-selected particles, respectively. This suggests that TEA was crucial to control the growth of the Pt-based nanoparticles, and the as-prepared Pt-based particles were single crystals according to the calculations of the crystal size (2.4−3.4 nm) from XRD experiments. Besides, Figure 2d shows that Pt3Ni/EC-600 had a relatively narrower size distribution in contrast with the size histograms of other Pt-based nanoparticles in Figure 3. Furthermore, the lattice spacing of well-dispersed Pt3Ni/EC-600 was 0.220 nm by high-resolution TEM images, which agrees well with reported PtNi alloys [1,23]. TEM images and the corresponding size histogram of NC (no carbon black)-Pt3Ni and commercial Pt/C (60 wt%, JM Inc.) are given in Figure S1. The average particle size (2.66 nm) and lattice spacing (0.220 nm) of NC-Pt3Ni nanoparticles were almost the same as Pt3Ni/EC-600 (Figure S1a). Nevertheless, Pt3Ni nanoparticles without carbon support were severely agglomerated compared to Pt3Ni/EC-600. This indicates that carbon support plays a crucial role in preventing severe agglomeration and improving dispersion of PtNi nanoparticles by physical adsorption. In comparison with Pt3Ni/EC-600, although commercial Pt/C had almost the same particle size (2.77 nm), it showed a wider size distribution and severer nanoparticles agglomeration (Figure S1b). Finally, to confirm the chemical composition, atomic absorption spectroscopy (AAS) was used to find the actual elementary composition of Pt3Ni/EC-600, NT-Pt3Ni/EC-600, Pt/EC-600, and PtNi/EC-600. The values were just nearly consistent with the initial Pt/Ni ratios, and the Pt loadings on EC-600 were all nearly 20 wt%, as hoped.
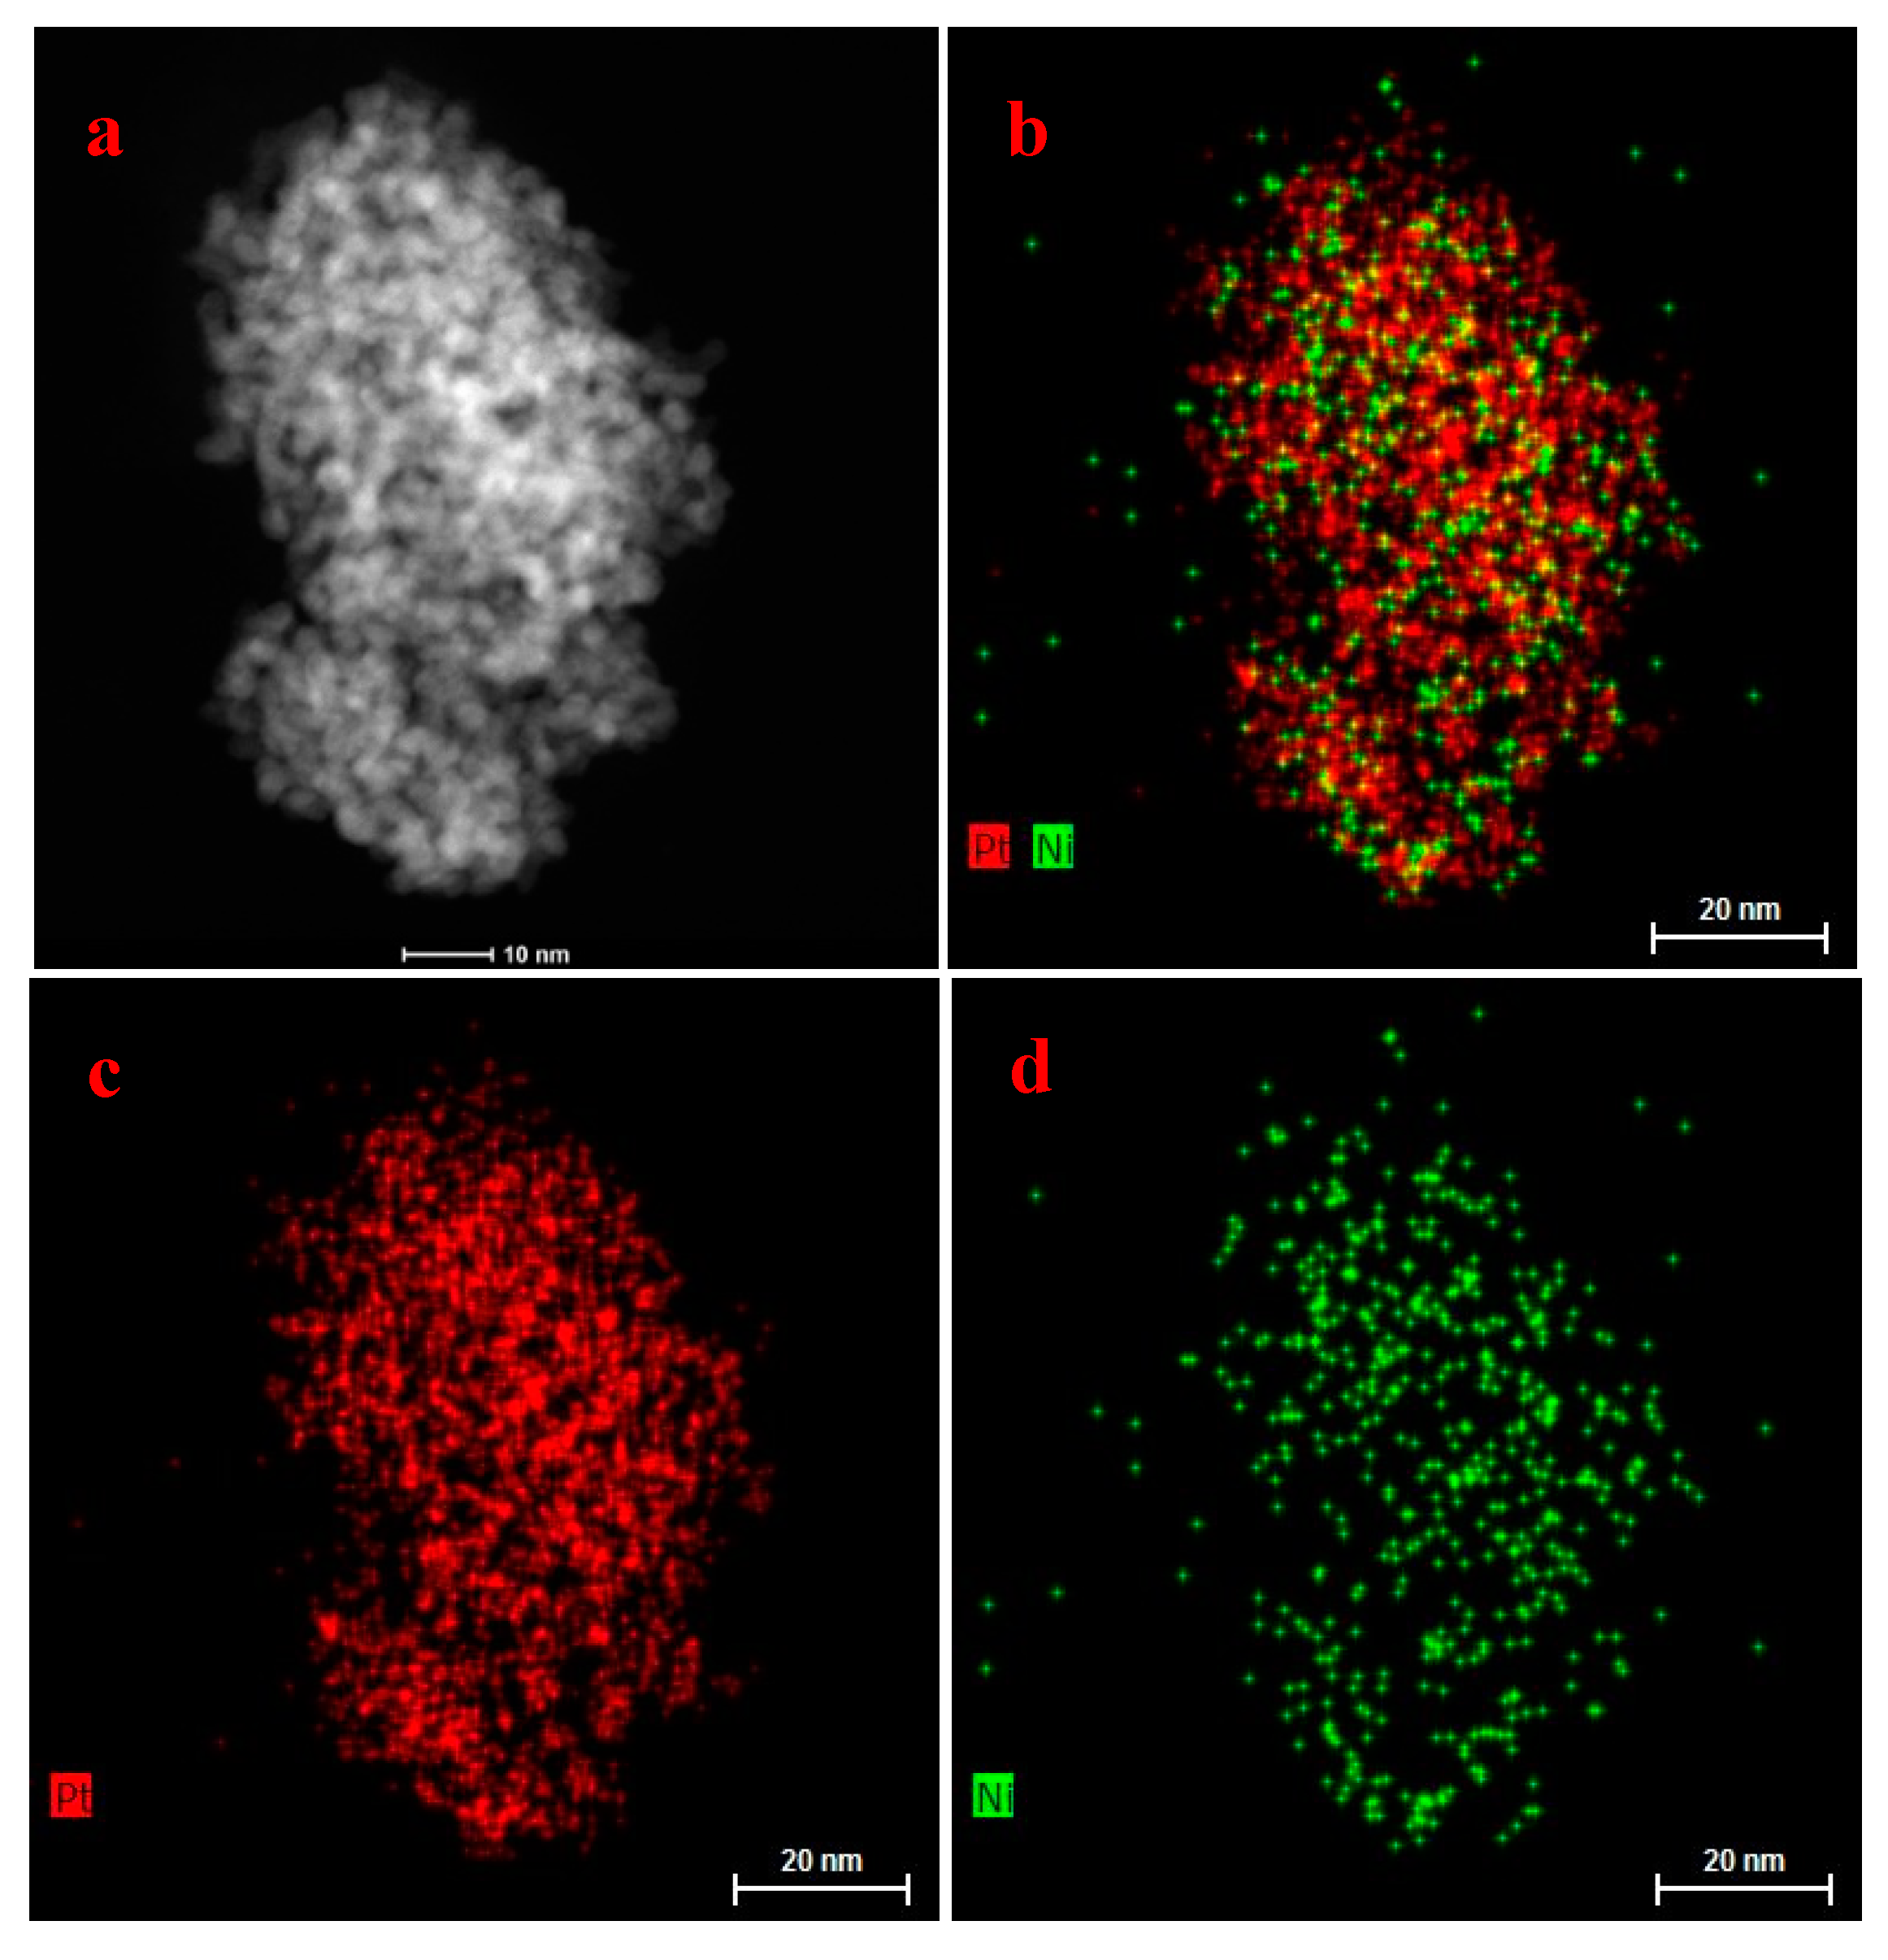
Moreover, X-ray energy dispersive spectrometry (EDS) mapping of Pt3Ni/EC-600 and NC-Pt3Ni was also done on several nanoparticles, as shown in Figure 4 and Figures S2–S3. It can be seen that both signals of Pt and Ni existed uniformly on the nanoparticles, but the signals of Pt were stronger than those of Ni in Figure 4. The EDS spectra of Pt3Ni/EC-600 and NC-Pt3Ni showed that the atomic ratio of Pt and Ni was approximately 3:1 (Figure S2). The results were consistent with the fact that there were more platinum atoms in Pt3Ni nanoparticles with or without carbon support. Besides, Table S1 shows the comparison of optimal Pt3Ni/EC-600 with state-of-the-art PtNi nanoparticles. The results showed that the as-prepared optimal catalysts had a smaller particle size, narrower size distribution, and better dispersion on carbon support. Above all, we successfully synthesized Pt3Ni nanoparticles with a high dispersion and narrow size distribution on carbon black (EC-600).
Based on the above results of TEM and relevant research, we speculated the possible reaction mechanism in Scheme 1. The action of TEA was undoubtedly very important in this experiment. Recent research showed that excess NaBH4 can act as an adsorbent to stabilize the Pt(0) nuclei reduced from PtCl62−, and the TEA can not only prevent the decomposition of NaBH4 in an acid environment, but also act as a surfactant to prevent agglomeration of nanoparticles [11,20]. This mechanism was verified by comparing the dispersion and size distribution of Pt3Ni nanoparticles with or without TEA (Figure 2 and Figure 3e–f). At the same time, TEA can react with inorganic acid to form corresponding salts [24]. For instance, triethylamine ((CH2CH3)3N) can combine with hydrogen chloride (HCl) to form the salt triethylamine hydrochloride ((CH3CH2)3NH+Cl−. It can be extrapolated that TEA formed a complex structure with chloroplatinic acid. This idea was strongly supported by the fact that a colloid solution was formed after the addition of TEA to the yellow transparent solution of H2PtCl6 (Figure S4a,b). Ten minutes after the addition of TEA without sonication, yellow precipitation was found at the bottom of the beaker, and the solution became nearly colorless and transparent (Figure S4c). This kind of compound was anchored onto carbon black through physical adsorption with the help of sonication [25]. Furthermore, by comparing the dispersion and size distribution of Pt/EC-600, Pt3Ni/EC-600, and PtNi/EC-600 (Figure 2 and Figure 3a–d), it is strongly suggested that doping a suitable amount of nickel can make contribution to the uniform distribution of PtNi nanoparticles. Through the treatment of filtration and 80 °C drying, excess NaBH4 and TEA was completely removed and confirmed by the weighing method. Hence, the agglomeration of platinum particles and the growth of platinum particles in the reduction process could be greatly avoided. Finally, PtNi nanoparticles were synthesized, with a narrow size distribution and high dispersion on carbon black.
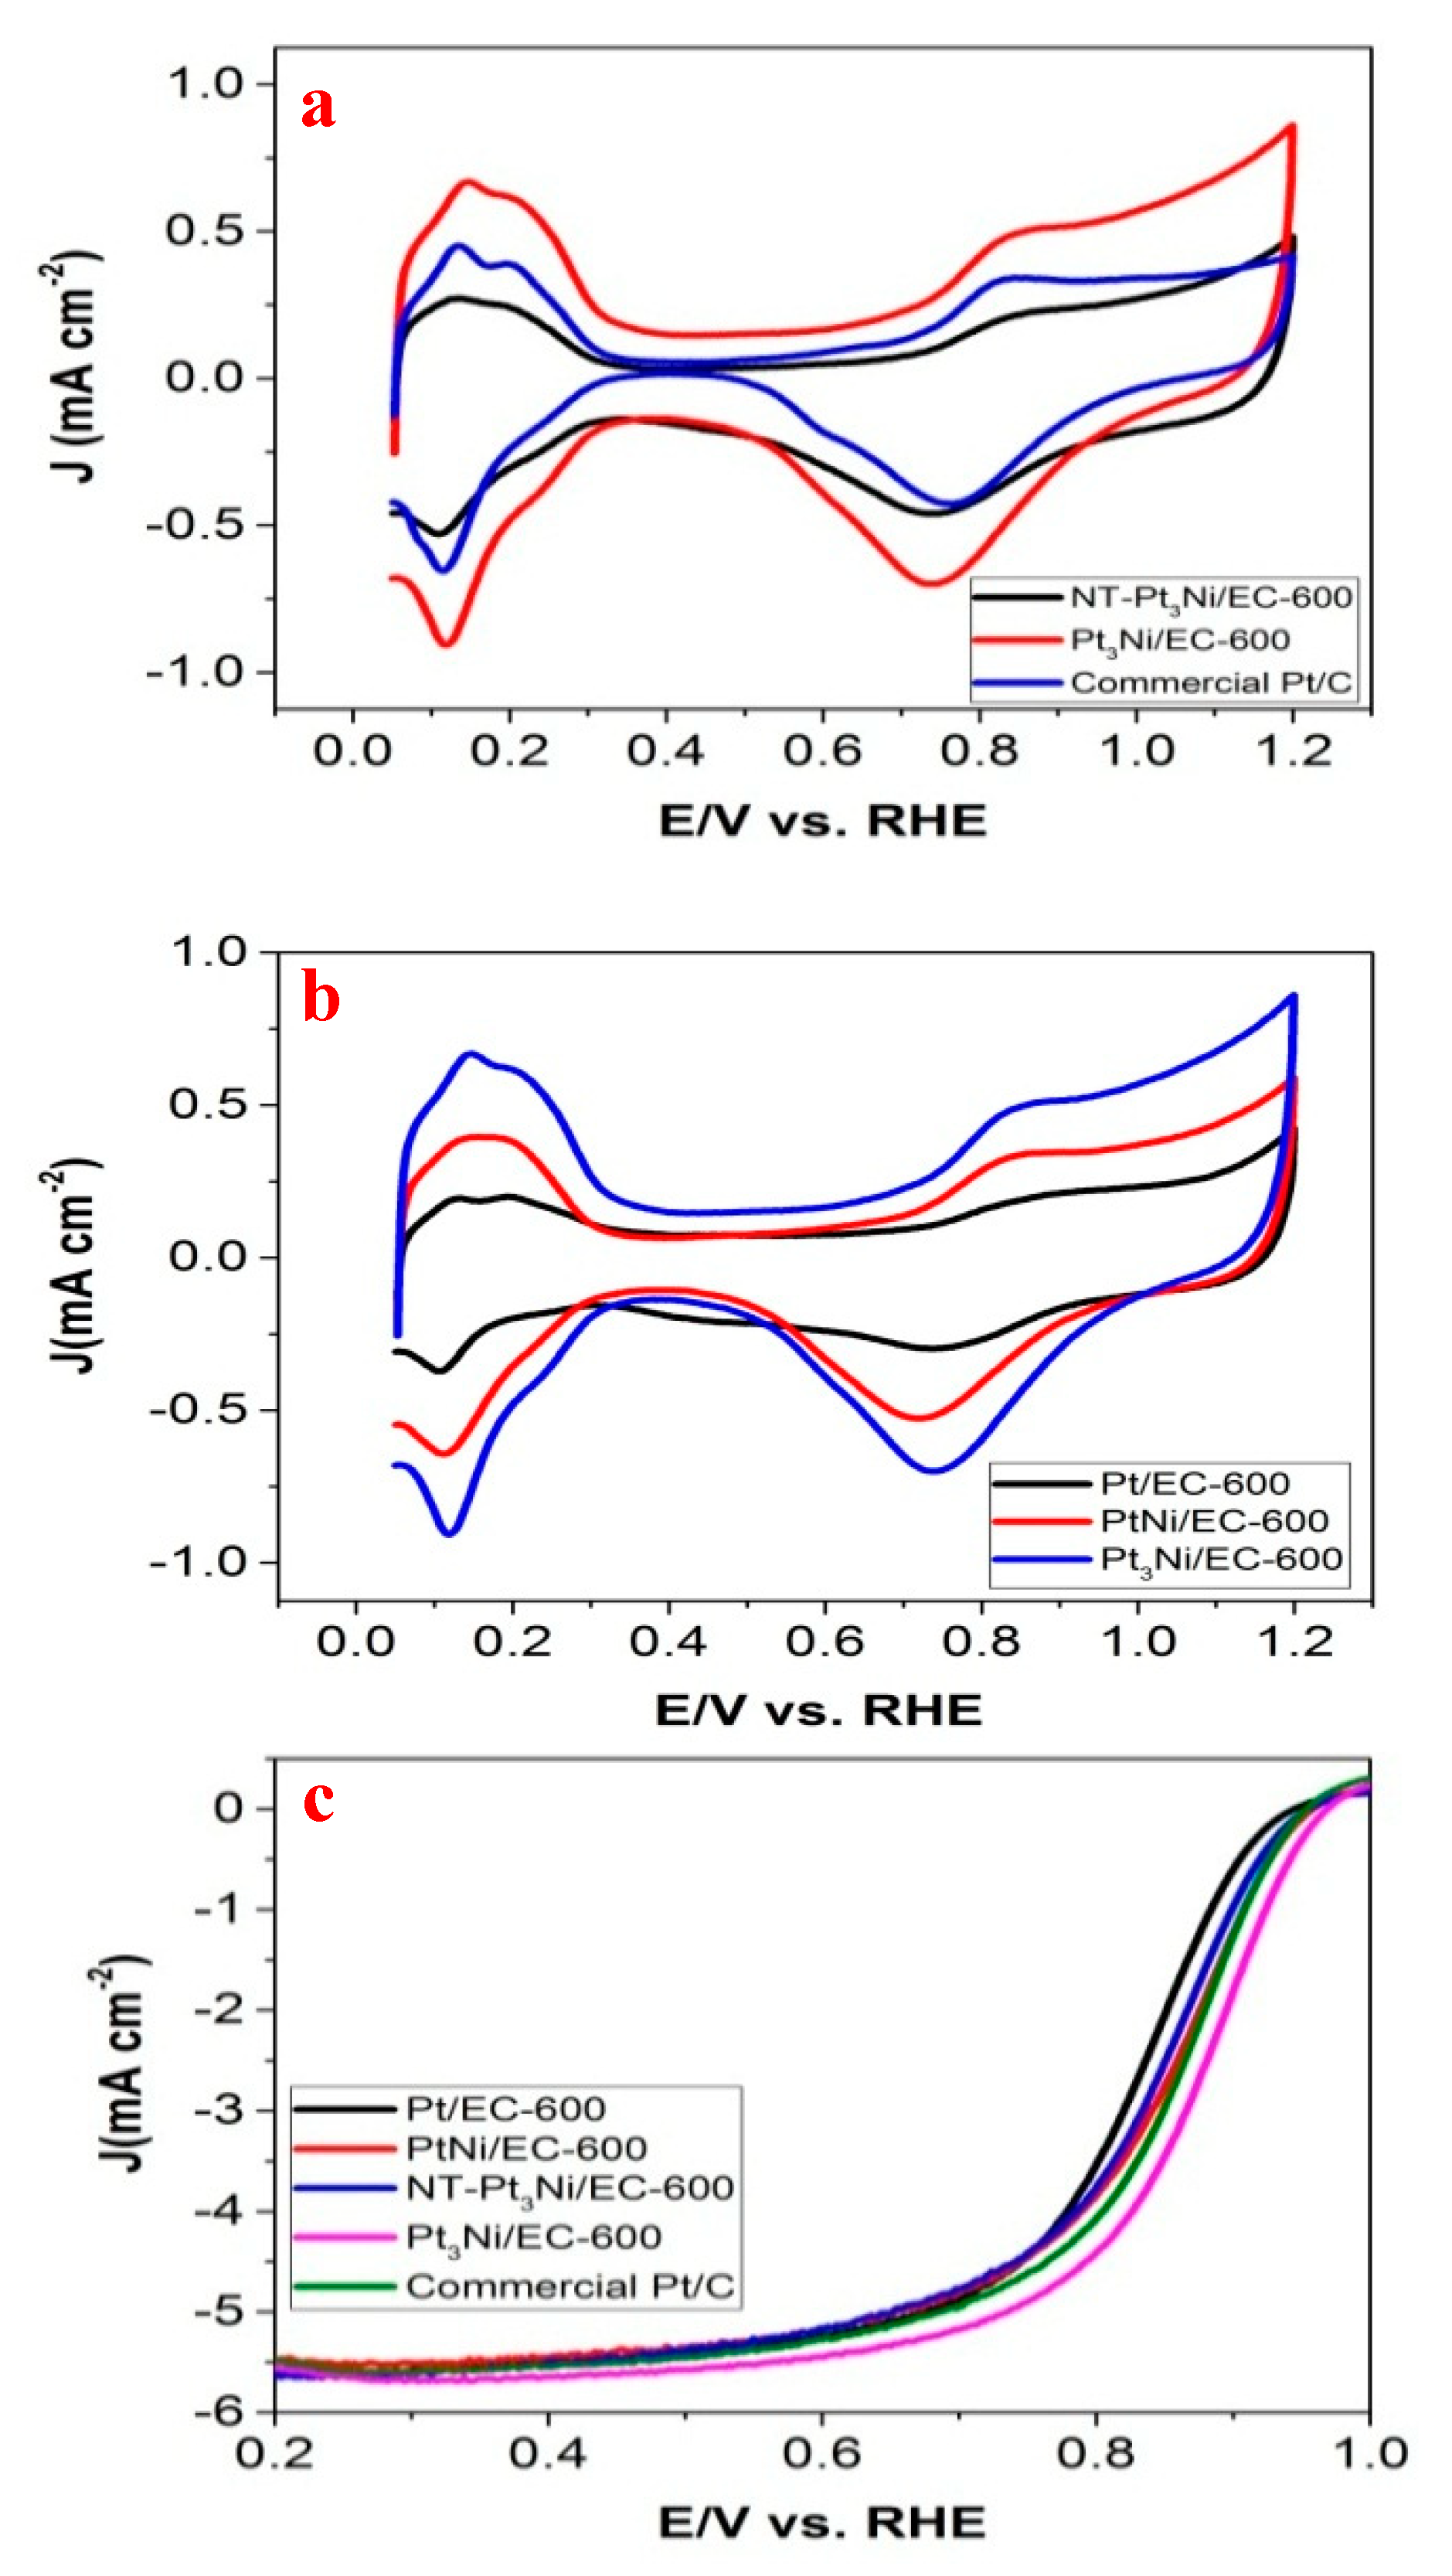
To find out the internal relationship between microscopic parameters (size distribution, dispersion, particle size, etc.) and macroscopic electrochemical properties (ECSA, mass activity (MA), specific activity (SA), etc.), the as-prepared Pt/EC-600, NT-Pt3Ni/EC-600, Pt3Ni/EC-600, PtNi/EC-600, and commercial Pt/C were studied as electrocatalysts for ORR. Commercial Pt/C was chosen as a standard for comparison. The cyclic voltammograms (CVs) of these catalysts were recorded in a N2-saturated 0.1 M HClO4 solution at a sweep rate of 20 mV s−1. The ECSA was measured by integrating the underpotentially-deposited hydrogen adsorption charge. In addition, the ORR polarization curves were recorded at room temperature at a sweep rate of 10 mV s−1 and a rotation rate of 1600 rpm in O2-saturated 0.1 M HClO4. Considering mass-transport correction, kinetic currents were calculated from the value from the 0.9 V vs. RHE (reversible hydrogen electrode) in the polarization curve, which could be normalized to ECSA to get specific activity (SA) and Pt loading to get mass activity (MA), respectively [6]. The detailed testing conditions are described below in Section 3.4. Figure 5a,b reflect that Pt3Ni/EC-600 was rather high compared with commercial Pt/C and the rest of the as-prepared samples. It is easy to see that Pt3Ni/EC-600 showed the best electrochemical activity among all the as-prepared Pt-based nanoparticles and commercial Pt/C in Figure 5c. All ECSA, MA, and SA of the corresponding Pt-based nanoparticles are shown in Table 1.
As shown in Table 1, the ECSA, SA, and MA of Pt3Ni/EC-600 (ECSA: 98.9 m2 gpt−1, SA: 0.141 mA cm−2, MA: 0.139 A mgpt−1) were largest among all the as-prepared Pt-based nanoparticles and the commercial Pt/C. The half-wave potential of Pt3Ni/EC-600 was 30 mV positive compared to the others. Without the addition of TEA, the ECSA of NT-Pt3Ni/EC-600 (43.98 m2 gpt−1) was nearly half of Pt3Ni/EC-600. It is known that ECSA is deeply influenced by the particle size and dispersion of nanoparticles [14]. The difference of ECSA between NT-Pt3Ni/EC-600 and Pt3Ni/EC-600 indicates that TEA was one of the key factors to control the particle size and avoid agglomeration during the reaction, which was proven by TEM images (Figure 2 and Figure 3). Figure 5b shows the CVs of Pt/EC-600, PtNi/EC-600, and Pt3Ni/EC-600. Obviously, Pt/EC-600, without the addition of Ni, which showed a severe aggregation in Figure 3a, had a relatively small ECSA (22.97 m2 gpt−1). Besides, PtNi/EC-600′s ECSA (59.87 m2 gpt−1) was much lower than Pt3Ni/EC-600. The average particle sizes of Pt/EC-600, PtNi/EC-600, and Pt3Ni/EC-600 were almost the same, but they had a huge difference in the dispersion and size distribution shown by the TEM images in Figure 2 and Figure 3. This phenomenon suggests that the ECSA of electrocatalysts was greatly affected by the dispersion on carbon black and the size distribution of nanoparticles.
Besides the electrocatalysts mentioned above, numerous experiments were done to find the best synthesis conditions to get higher ECSA. The changes of ECSA under various synthesis conditions are summarized in Figure S5. As shown in Figure S5, ECSA was not only influenced by the addition amount of NiCl2•6H2O and TEA, but also the addition amount and addition rate of NaBH4 and the types of carbon black. Among all the commercial carbon black used in this paper, the EC-600 carbon black has an extremely high specific area (1410 m2 g−1, measured by BET method), which is six-times more than that of XC-72R carbon black (254 m2 g−1). Such a high specific area of EC-600 carbon black makes it an ideal carrier of PtNi nanoparticles.
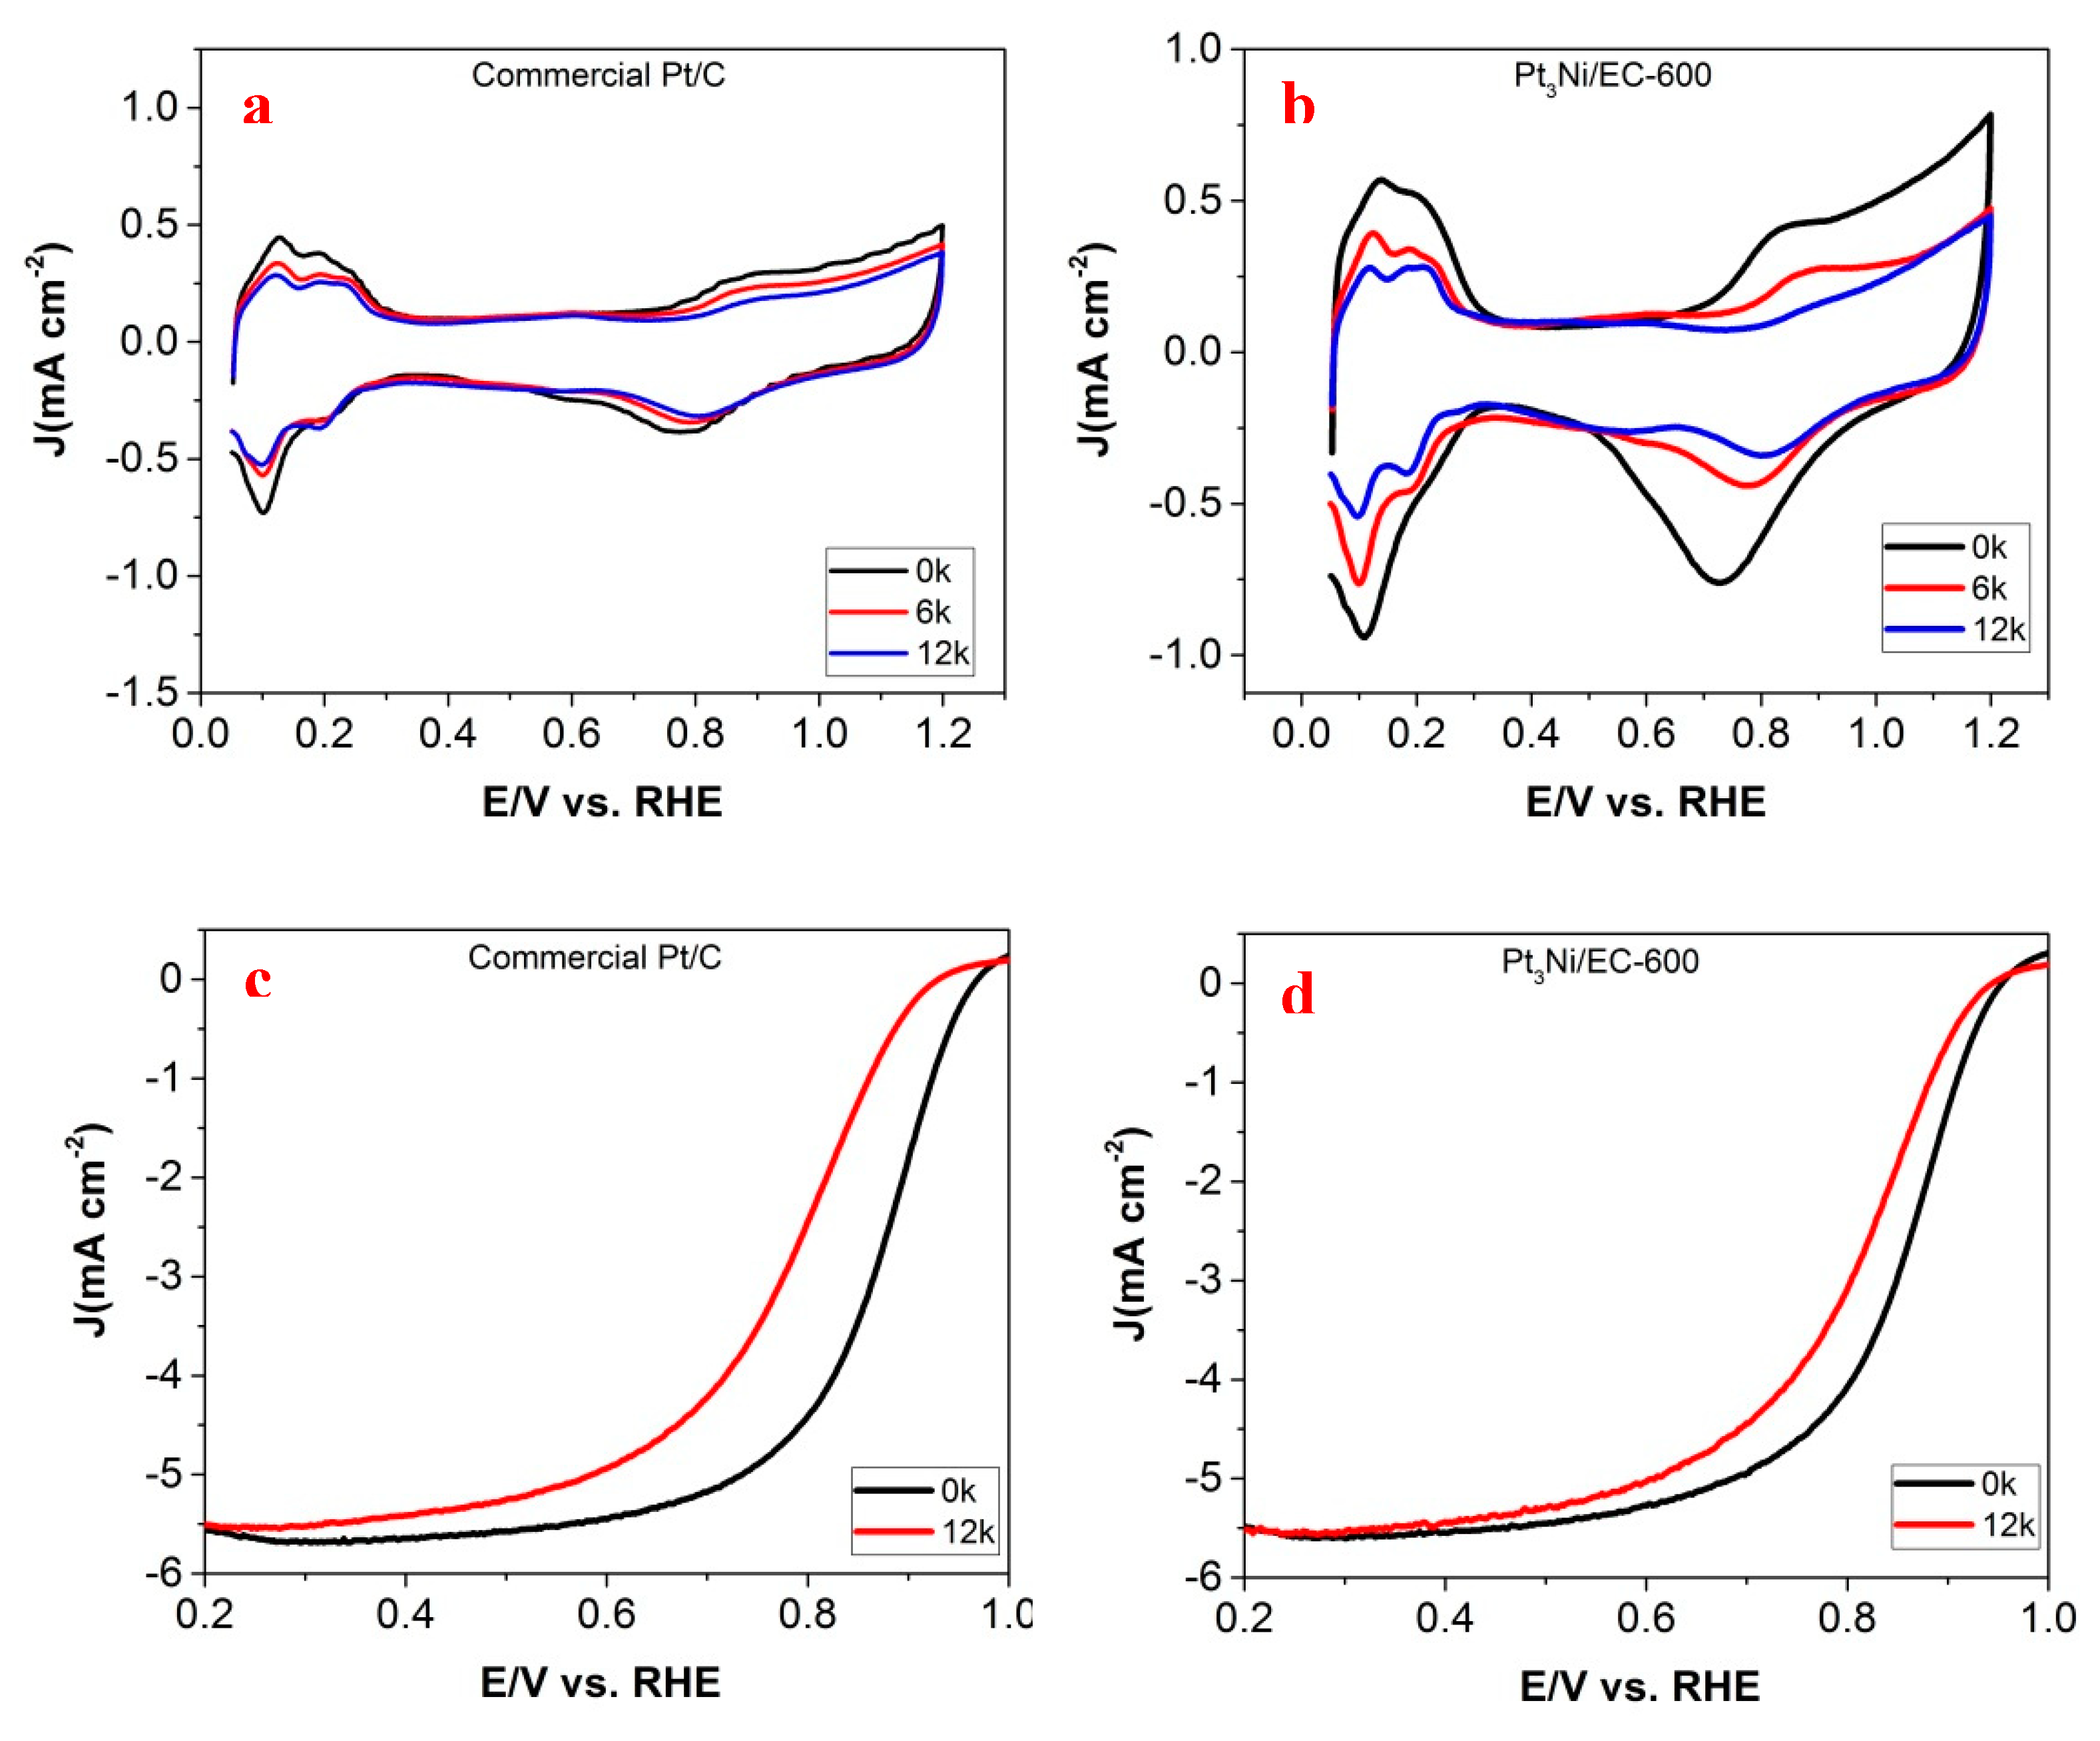
To compare this further, Pt3Ni/EC-600 and commercial Pt/C were chosen to test the electrochemical stability because of their better performance of ORR. The accelerated durability tests (ADTs) were conducted in 0.1 M O2-saturated HClO4 at a scan rate of 100 mV s−1 between 0.6 and 1.1 V (versus RHE). The results are shown in Figure 6. After 12k potential cycles, ECSA loss of Pt3Ni/EC-600 (66.4%) was greater than commercial Pt/C (45.9%) (Figure 6a,b). The half-wave potential loss of Pt3Ni/EC-600 (42.6 mV) was less than commercial Pt/C (88 mV) (Figure 6c,d). These results showed the potential electrochemical instability of Pt3Ni/EC-600 and commercial Pt/C. Both electrocatalysts were not stable enough compared to the other catalysts with ultrafine nanostructures [5,6,8]. From the TEM images of Pt3Ni/EC-600 taken after initial electro-cycling and the ADTs (Figures S6 and S7), it can be seen that there were no obvious changes in the size distribution, dispersion, and lattice spacing of Pt3Ni/EC-600 after electro-activation. However, partial nanoparticles were aggregated after ADTs. The average particle size was changed from 2.80 nm to 4.06 nm, and the lattice spacing is changed from 0.220 nm to 0.213 nm after ADTs. These changes might be due to the corrosion of carbon black, dissolution of PtNi nanoparticles, and aggregation of spherical nanoparticles caused by Ostwald ripening under the acid environment at high potential [26,27].
For further study, the effects of Pt3Ni/EC-600 and commercial Pt/C were investigated on the electrical performance of PEMFC to test the practicability. The catalysts to be tested were used as cathodic catalysts, and the load was 0.4 mgpt cm−2. The anodic catalysts were all commercial Pt/C with the loading of 0.1 mgpt cm−2. The testing conditions are described below in Section 3.5. The air polarization curves are shown in Figure 7a. Pt3Ni/EC-600 showed a better performance than commercial Pt/C in the testing of PEMFC, which had a high degree of consistency with the test result of ORR. The open circuit potentials (OCPs) of Pt3Ni/EC-600 and commercial Pt/C were 0.931 and 0.933 V, while the power densities (MPDs) in 0.65 V were 0.7865 and 0.6825 W cm−2, respectively. The single cell prepared by using Pt3Ni/EC-600 showed 15% PEMFC performance enhancements compared to commercial Pt/C. The O2 polarization curves are shown in Figure 7b. The mass activities in 0.9 V of Pt3Ni/EC-600 and commercial Pt/C were 0.108 and 0.058 A mgpt−1, which is highly similar to the RDE testing results in Table 1. High-power performance deeply depended on whether there was sufficient oxygen transferred to the Pt surface. The performance loss caused by this is named O2 transport resistance and can be reduced by the increased ECSA [4]. This may be the reason why the performance of so many reported electrocatalysts [4,10] with a relatively smaller ECSA on the PEMFCs do not match their superior mass activities in the test of ORR. Furthermore, the above single cell results highly agreed with the idea that a large enough electrochemically active surface area (ECSA) is still one of the key factors to determine high-power performance on the PEMFCs. Therefore, in order to get a superior ECSA, it is essential to control the particle size, size distribution, and the dispersion of nanoparticles. The detailed studies deeply revealed how the microscopic parameters like the size distribution and dispersion of nanoparticles affect the macroscopic electrochemical properties.
3. Materials and Methods
3.1. Chemicals
Nickel chloride (NiCl2•6H2O, 99.0%), sodium borohydride (NaBH4, 99.0%), chloroplatinic acid hexahydrate (H2PtCl6•6H2O, 99.0%), triethylamine (C6H15N, 99.0%), perchloric acid (HClO4, 70.0~72.0%), anhydrous ethanol (C2H6O, 99.7%), and isopropanol (C3H8O, 99.7%) were all obtained from Sinopharm (Shanghai, China). Commercial Pt/C (60 wt%) was obtained from Johnson Matthey (London, U.K.). The types of carbon black included XC-72R, CHEZACARB AC 30, Ketjenblack EC-600, long-chain carbon nanotubes (L-CNT), and short-chain carbon nanotube (S-CNT). All aqueous solutions were prepared using ultra-pure water (18.25 MΩ cm−1) purged by an ultra-pure purification system (EPED-10TS, Chinese EPED Corporation, Shanghai, China).
3.2. Sample Preparation
The anhydrous ethanol (AE) was chosen as a solvent because it possessed a low oxygen content and had been reported to achieve a high degree of alloying level in the PtNi nanoparticles [13]. In a typical synthesis, 518 mg of H2PtCl6•6H2O and 7.8 mg of NiCl2•6H2O were dissolved in 200 µL of water, and then, the mixture was sonicated for 10 min in ice-cold water with the addition of 50 µL TEA. Twenty five milliliters anhydrous alcohol were added into the aqueous solution and also sonicated for another 10 min. The resulting solution was mixed with EC-600 under sonication. After 1 h of sonication, the mixture was stirred (1000 rpm), and 40 mg NaBH4 dissolved in 5 mL alcohol were rapidly put into the black mixed solution. The solution was filtrated 3 times using 2 L of ultra-pure water and dried in the vacuum drying oven for 24 h at 80 degrees centigrade. The final products were named Pt/EC-600, Pt3Ni/EC-600, and PtNi/EC-600 according to the addition ratio of Pt to Ni, respectively. One kind of product synthesized just as the procedure of Pt3Ni/EC-600 without the addition of TEA was named NT-Pt3Ni/EC-600. Another kind of product synthesized just as the procedure of Pt3Ni/EC-600 without the addition of carbon support EC-600 was named NC-Pt3Ni.
3.3. Characterization
Power X-ray diffraction (PXRD) patterns were recorded using a Bruker D8 Advance diffractometer (Billerica, MA, USA) equipped with a Cu-Kαradiation source. TEM images were taken on a Tecnai F20 (Hillsboro, OR, USA) at an accelerating voltage of 200 KV. EDS mapping and high-angle annular dark field (HAADF)-scanning transmission electron microscopy (STEM) were taken on an FEI Titan G2 60-300 S/TEM equipped with a double-aberration corrector. For SEM observations, a drop of the sample dispersion was placed on a silicon wafer and dried under ambient conditions. For TEM observations, a drop of dispersion was placed on a carbon film-coated copper grid, followed by solvent evaporation under ambient conditions. Atomic absorption spectroscopy was conducted on a Hitachi 180-80 to find the accurate metal content on carbon black. Electrochemical measurement was conducted on the electrochemical station (Gamry Reference 3000, Warminster, PA, USA).
3.4. Electrochemical Measurements
All the electrochemical measurements were conducted using a three-electrode cell system provided by Gamry instruments. The working electrode used in this work was a glassy-carbon rotating disk electrode (RDE, Pine Research Instrumentation, diameter: 5 mm, area: 0.196 cm2). All the measured currents in RDE tests were normalized by the geometric area of glassy-carbon electrode (Figure 5 and Figure 6). Pt wire and a saturated calomel electrode (SCE) were used as the counter and reference electrodes, respectively. Thin films on the RDE were prepared by dropping 10 μL of catalyst ink with the following components: 2 mg of catalyst, 200 μL of IPA, 600 μL of DI water, and 50 μL of 5 wt% Nafion. The ink was dried in the ambient environment.
Before measuring the ECSA, CV activations should be performed in N2-saturated 0.1 M HClO4 electrolyte with a potential scan rate of 200 mV s−1 for 20 cycles. ECSA was then determined by integrating the hydrogen desorption area on CV at room temperature in nitrogen-saturated 0.1 M HClO4 electrolyte. The potential scan rate was 20 mV s−1 for the CV measurements [28]. The potential sweep range was from 0.05–1.0 V versus RHE.
OORR measurements were conducted in oxygen-saturated 0.1 M HClO4 electrolyte. The ORR polarization curves were obtained with the potential scan rate of 10 mV s−1 and the rotation rate of 1600 rpm.
The ADTs were performed in oxygen-saturated 0.1 M HClO4 electrolyte. The cyclic potentials’ sweep measurements were conducted with a potential scan rate of 100 mV s−1 for 12,000 cycles.
3.5. Electrochemical Single-Cell Measurements
Following the RDE tests, single cell tests were carried out to evaluate the fuel cell performance [29]. MEAs with an active area of 25 cm2 were prepared by the catalyst-coated membrane (CCM) method. In this method, commercial Pt/C was used as the anodic catalyst, while commercial Pt/C and Pt3Ni/EC-600 served as cathodic catalysts, respectively. The catalyst powders were first mixed with deionized water, isopropanol, and 5 wt% Nafion solution (DuPont Inc., D520) to prepare catalyst inks. The weight ratios of ionomer to carbon (I/C ratio) in catalysts inks were all at 0.7. In the next step, the catalyst inks became homogeneous after one hour of ultrasonic treatment and then were directly air-sprayed onto both sides of the Nafion membrane (Dongyue Federation). The loading of metal catalysts was kept at 0.1 mgpt cm−2 in the anodic electrode and 0.4 mgpt cm−2 in the cathodic electrode, respectively. Two gas diffusion layers (GDL, SIGRACET Inc.) with a 0.235-mm cloth thickness and 23% polytetrafluoroethylene (PTFE) covered both sides of the membrane, and a suitable gasket was also used to avoid the leakage of gas. Finally, two graphite plates engraved with serpentine flow channels were assembled on both sides of the MEAs.
The assembly of the single cell was completed following the above procedure. Then, a fuel cell test station (HEPHAS Inc.) was used to test the real performance of the as-prepared MEAs. The proton exchange membrane fuel cell single cell temperature was maintained at 75 °C under 0.1 MPa for H2/air (anode/cathode) and 0.15 MPa for H2/O2 (anode/cathode), while 100% humidified H2 (anode) and air/O2 (cathode) were provided to the anode and cathode with a stoichiometric ratio of 1.5:2.5, respectively. Before the test, MEAs were activated at 0.25 V until the current value became constant. The current density was controlled at 0.04, 0.08, 0.12, 0.16, 0.20, 0.40, 0.60, 0.80, 1.00, 1.20, and 1.40 A cm−2. The corresponding voltage was obtained until the fuel cell voltage was stabilized. The electrochemical catalytic activity of the cathode catalysts was obtained at 0.9 V (vs. RHE) in the H2/O2 PEMFC test without high-frequency resistance (HFR) correction.
4. Conclusions
In summary, we successfully synthesized monodispersed Pt3Ni nanoparticles in a facile way. Through a series of characterizations, the results showed that TEA can be an effective reagent to control the particle size of Pt-based nanoparticles and avoid aggregation when using NaBH4 as a reductant in the organic solvent system. The dispersion and size distribution of PtNi nanoparticles were affected by the addition of the amount of nickel and TEA. In the electrochemical test, Pt3Ni/EC-600 showed the largest, ECSA attributed to its uniform dispersion on carbon black and superior size distribution of the nanoparticles. Moreover, by comparing the performance of Pt3Ni/EC-600 and commercial Pt/C, Pt3Ni/EC-600 with higher ECSA presented a better electrochemical performance in MEA. This suggests that the ECSA of Pt-based catalyst is still one of the crucial factors to determine the high-power performance in PEMFCs [4]. Therefore, Pt3Ni/EC-600 nanoparticles can be a potentially applicable material for PEMFCs considering its simple synthesis and improved performance.
Supplementary Materials
The following are available online at https://www.mdpi.com/2073-4344/9/7/588/s1: Figure S1: TEM images and size histogram of NC-Pt3Ni nanoparticles and commercial Pt/C, Figure S2: EDS spectra of Pt3Ni/EC-600 and NC-Pt3Ni, Figure S3: STEM-EDX elemental mapping of Pt3Ni/EC-600, Figure S4: Optical images of precursor solution, Figure S5: Changes of ECSA under various synthesis conditions, Figure S6: TEM images and size histogram of Pt3Ni/EC-600 after initial electro-cycling, Figure S7: TEM images and size histogram of Pt3Ni/EC-600 after accelerated durability tests, Table S1: Comparison of optimal as-prepared catalysts and state-of-the-art PtNi nanoparticles.
Author Contributions
Conceptualization, J.G. and D.Y.; methodology, J.G and D.Y.; formal analysis, J.G., D.Y., X.L., H.H., M.W., and P.W.; investigation, M.W., P.W., D.Y., H.H., and Y.Z.; writing, original draft preparation, D.Y.; writing, review and editing, X.L., Q.F., and R.H.; supervision, J.G., X.L., Q.F., and R.H.; project administration, J.G.
Funding
This work was funded by the Natural Science Foundation of Jiangsu Province (No. SBK2017021667). P.W. and M.W. acknowledge funding from the National Natural Science Foundation of China (11874199).
Conflicts of Interest
The authors declare no conflict of interest.
References
- Peng, X.; Zhao, S.; Omasta, T.J.; Roller, J.M.; Mustain, W.E. Activity and durability of Pt-Ni nanocage electocatalysts in proton exchange membrane fuel cells. Appl. Catal. B Environ. 2017, 203, 927–935. [Google Scholar] [CrossRef] [Green Version]
- Lu, Y.; Du, S.; Steinberger-Wilckens, R. One-dimensional nanostructured electrocatalysts for polymer electrolyte membrane fuel cells-A review. Appl. Catal. B Environ. 2016, 199, 292–314. [Google Scholar] [CrossRef]
- Shao, M.H.; Chang, Q.W.; Dodelet, J.P.; Chenitz, R. Recent Advances in Electrocatalysts for Oxygen Reduction Reaction. Chem. Rev. 2016, 116, 3594–3657. [Google Scholar] [CrossRef] [Green Version]
- Kongkanand, A.; Mathias, M.F. The Priority and Challenge of High-Power Performance of Low-Platinum Proton-Exchange Membrane Fuel Cells. J. Phys. Chem. Lett. 2016, 7, 1127–1137. [Google Scholar] [CrossRef] [PubMed]
- Li, M.; Zhao, Z.; Cheng, T.; Fortunelli, A.; Chen, C.Y.; Yu, R.; Zhang, Q.; Gu, L.; Merinov, B.V.; Lin, Z.; et al. Ultrafine jagged platinum nanowires enable ultrahigh mass activity for the oxygen reduction reaction. Science 2016, 354, 1414–1419. [Google Scholar] [CrossRef] [PubMed] [Green Version]
- Huang, X.; Zhao, Z.; Cao, L.; Chen, Y.; Zhu, E.; Lin, Z.; Li, M.; Yan, A.; Zettl, A.; Wang, Y.M.; et al. High-performance transition metal-doped Pt3Ni octahedra for oxygen reduction reaction. Science 2015, 348, 1230–1234. [Google Scholar] [CrossRef]
- Cui, C.; Gan, L.; Li, H.; Yu, S.; Heggen, M.; Strasser, P. Octahedral PtNi Nanoparticle Catalysts: Exceptional Oxygen Reduction Activity by Tuning the Alloy Particle Surface Composition. Nano Lett. 2012, 12, 5885–5889. [Google Scholar] [CrossRef]
- Chen, C.; Kang, Y.; Huo, Z.; Zhu, Z.; Huang, W.; Xin, H.L.; Snyder, J.D.; Li, D.; Herron, J.A.; Mavrikakis, M.; et al. Highly Crystalline Multimetallic Nanoframes with Three-Dimensional Electrocatalytic Surfaces. Science 2014, 343, 1339–1343. [Google Scholar] [CrossRef]
- Stamenkovic, V.R.; Fowler, B.; Mun, B.S.; Wang, G.; Ross, P.N.; Lucas, C.A.; Markovic, N.M. Improved oxygen reduction activity on Pt3Ni(111) via increased surface site availability. Science 2007, 315, 493–497. [Google Scholar] [CrossRef] [PubMed]
- Stephens, I.E.L.; Rossmeisl, J.; Chorkendorff, I. Toward sustainable fuel cells. Science 2016, 354, 1378–1379. [Google Scholar] [CrossRef]
- Shen, Z.; Yamada, M.; Miyake, M. Preparation of single-crystalline platinum nanowires with small diameters under mild conditions. Chem. Commun. 2007, 3, 245–247. [Google Scholar] [CrossRef] [PubMed]
- Shi, Y.; Yuan, T.; Feng, J.; Yuan, J.; Wang, A. Rapid fabrication of support-free trimetallic Pt 53 Ru 39 Ni 8 nanosponges with enhanced electrocatalytic activity for hydrogen evolution and hydrazine oxidation reactions. J. Colloid Interface Sci. 2017, 505, 14–22. [Google Scholar] [CrossRef] [PubMed]
- Varshney, M.; Sharma, A.; Shin, H.; Lee, H.H.; Jeon, T.; Lee, B.; Chae, K.; Won, S.O. Influence of Ni doping on PtNi nanoparticles: Synthesis, electronic/atomic structure and photocatalyst investigations. J. Phys. Chem. Solids 2017, 110, 187–194. [Google Scholar] [CrossRef]
- Nesselberger, M.; Ashton, S.; Meier, J.C.; Katsounaros, I.; Mayrhofer, K.J.J.; Arenz, M. The Particle Size Effect on the Oxygen Reduction Reaction Activity of Pt Catalysts: Influence of Electrolyte and Relation to Single Crystal Models. J. Am. Chem. Soc. 2011, 133, 17428–17433. [Google Scholar] [CrossRef] [PubMed]
- Nesselberger, M.; Roefzaad, M.; Hamou, R.F.; Biedermann, P.U.; Schweinberger, F.F.; Kunz, S.; Schloegl, K.; Wiberg, G.K.H.; Ashton, S.; Heiz, U.; et al. The effect of particle proximity on the oxygen reduction rate of size-selected platinum clusters. Nat. Mater. 2013, 12, 919–924. [Google Scholar] [CrossRef] [PubMed]
- Sui, S.; Wang, X.; Zhou, X.; Su, Y.; Riffatc, S.; Liu, C. A comprehensive review of Pt electrocatalysts for the oxygen reduction reaction: Nanostructure, activity, mechanism and carbon support in PEM fuel cells. J. Mater. Chem. A 2017, 5, 1808–1825. [Google Scholar] [CrossRef]
- Yamada, M.; Kon, S.; Miyake, M. Synthesis and size control of Pt nanocubes with high selectivity using the additive effect of NaI. Chem. Lett. 2005, 34, 1050–1051. [Google Scholar] [CrossRef]
- Miyabayashi, K.; Nakamura, S.; Miyake, M. Synthesis of Small Platinum Cube with Less Than 3 nm by the Control of Growth Kinetics. Cryst. Growth Des. 2011, 11, 4292–4295. [Google Scholar] [CrossRef]
- Koenigsmann, C.; Zhou, W.; Adzic, R.R.; Sutter, E.; Wong, S.S. Size-Dependent Enhancement of Electrocatalytic Performance in Relatively Defect-Free, Processed Ultrathin Platinum Nanowires. Nano Lett. 2010, 10, 2806–2811. [Google Scholar] [CrossRef]
- Wu, J.; Hsu, S.L. Preparation of triethylamine stabilized silver nanoparticles for low-temperature sintering. J. Nanoparticle Res. 2011, 13, 3877–3883. [Google Scholar] [CrossRef]
- Denton, A.R.; Ashcroft, N.W. Vegard LAW. Phys. Rev. A 1991, 43, 3161–3164. [Google Scholar] [CrossRef] [PubMed]
- Xin, Y.; Liu, J.; Zhou, Y.; Liu, W.; Gao, J.; Xie, Y.; Yin, Y.; Zou, Z. Preparation and characterization of Pt supported on graphene with enhanced electrocatalytic activity in fuel cell. J. Power Sources 2011, 196, 1012–1018. [Google Scholar] [CrossRef]
- Chang, F.; Yu, G.; Shan, S.; Skeete, Z.; Wu, J.; Luo, J.; Ren, Y.; Petkov, V.; Zhong, C. Platinum–nickel nanowire catalysts with composition-tunable alloying and faceting for the oxygen reduction reaction. J. Mater. Chem. A 2017, 5, 12557–12568. [Google Scholar] [CrossRef]
- Sorgi, K.L. Triethylamine. In Encyclopedia of Reagents for Organic Synthesis; John Wiley Sons, Ltd.: Chichester, UK, 2001. [Google Scholar]
- Yao, S.; Feng, L.; Zhao, X.; Liu, C.; Xing, W. Pt/C catalysts with narrow size distribution prepared by colloidal-precipitation method for methanol electrooxidation. J. Power Sources 2012, 217, 280–286. [Google Scholar] [CrossRef]
- Sun, S.; Zhang, G.; Geng, D.; Chen, Y.; Li, R.; Cai, M.; Sun, X. A Highly Durable Platinum Nanocatalyst for Proton Exchange Membrane Fuel Cells: Multiarmed Starlike Nanowire Single Crystal. Angew. Chem. Int. Ed. 2011, 50, 422–426. [Google Scholar] [CrossRef] [PubMed]
- Lin, R.; Cai, X.; Zeng, H.; Yu, Z. Stability of High-Performance Pt-Based Catalysts for Oxygen Reduction Reactions. Adv. Mater. 2018, 30. [Google Scholar] [CrossRef] [PubMed]
- Jiang, K.; Zhao, D.; Guo, S.; Zhang, X.; Zhu, X.; Guo, J.; Lu, G.; Huang, X. Efficient oxygen reduction catalysis by subnanometer Pt alloy nanowires. Sci. Adv. 2017, 3, e1601705. [Google Scholar] [CrossRef]
- Hyun, K.; Lee, J.H.; Yoon, C.W.; Kwon, Y. The Effect of Platinum Based Bimetallic Electrocatalysts on Oxygen Reduction Reaction of Proton Exchange Membrane Fuel Cells. Int. J. Electrochem. Sci. 2013, 8, 11752–11767. [Google Scholar]
Figure 1.
XRD patterns of as-prepared Pt-based nanoparticles with different Pt/Ni ratios in the precursor. (a) Pt3Ni/EC-600, (b) NT-Pt3Ni/EC-600, (c) Pt/EC-600, (d) PtNi/EC-600.
Figure 1.
XRD patterns of as-prepared Pt-based nanoparticles with different Pt/Ni ratios in the precursor. (a) Pt3Ni/EC-600, (b) NT-Pt3Ni/EC-600, (c) Pt/EC-600, (d) PtNi/EC-600.

Figure 2.
TEM images (a,b), HRTEM (c), and size histogram (d) of Pt3Ni/EC-600.

Figure 3.
TEM images and size histogram of as-prepared Pt-based particles ((a,b) Pt/EC-600; (c,d) PtNi/EC-600; (e,f) NT-Pt3Ni/EC-600).
Figure 3.
TEM images and size histogram of as-prepared Pt-based particles ((a,b) Pt/EC-600; (c,d) PtNi/EC-600; (e,f) NT-Pt3Ni/EC-600).

Figure 4.
STEM-EDS mapping of NC-Pt3Ni: (a) high-angle annular dark field (HAADF)-STEM image, (b) EDS mapping of Pt and Ni, (c) Pt mapping in red, and (d) the Ni mapping in green.
Figure 4.
STEM-EDS mapping of NC-Pt3Ni: (a) high-angle annular dark field (HAADF)-STEM image, (b) EDS mapping of Pt and Ni, (c) Pt mapping in red, and (d) the Ni mapping in green.

Scheme 1.
Schematic presentation of the synthesis of Pt3Ni nanoparticles with or without triethylamine (TEA).
Scheme 1.
Schematic presentation of the synthesis of Pt3Ni nanoparticles with or without triethylamine (TEA).

Figure 5.
Electrocatalytic performance of as-prepared Pt-based nanoparticles. (a) Cyclic voltammograms (CVs) of no TEA (NT)-Pt3Ni/EC-600, Pt3Ni/EC-600, and commercial Pt/C. (b) CVs of Pt/EC-600, PtNi/EC-600, and Pt3Ni/EC-600. CVs were recorded at room temperature in a 0.1 M HClO4 solution at a sweep rate of 20 mV s−1. (c) ORR was recorded at room temperature in an O2-saturated 0.1 M HClO4 aqueous solution at a sweep rate of 10mV s−1 and a rotation rate of 1600 rpm. RHE, reversible hydrogen electrode.

Figure 6.
Electrocatalytic durability of commercial Pt/C and Pt3Ni/EC-600. CVs of commercial Pt/C (a) and Pt3Ni/EC-600 (b) were recorded at room temperature in 0.1 M HClO4 solution at a sweep rate of 20 mV s−1. ORR polarization curves of commercial Pt/C (c) and Pt3Ni/EC-600 (d) in different potential cycles between 0.6 and 1.1 V versus RHE. The ORR polarization curves were recorded at room temperature in an O2-saturated 0.1 M HClO4 aqueous solution at a sweep rate of 10 mV s−1 and rotation rate of 1600 rpm in different potential cycles between 0.6 and 1.1 V versus RHE.

Figure 7.
(a) Air polarization curves in membrane electrode assembly (MEA) tests for commercial Pt/C catalyst and Pt3Ni/EC-600 catalyst. (b) O2 polarization curves in the MEA tests for commercial Pt/C catalyst and Pt3Ni/EC-600 catalyst.
Figure 7.
(a) Air polarization curves in membrane electrode assembly (MEA) tests for commercial Pt/C catalyst and Pt3Ni/EC-600 catalyst. (b) O2 polarization curves in the MEA tests for commercial Pt/C catalyst and Pt3Ni/EC-600 catalyst.


Table 1.
The electrochemically-active surface area (ECSA), mass activity (MA), and specific activity (SA) of corresponding Pt-based nanoparticles in the rotating disk electrode (RDE) testing.
Table 1.
The electrochemically-active surface area (ECSA), mass activity (MA), and specific activity (SA) of corresponding Pt-based nanoparticles in the rotating disk electrode (RDE) testing.
| RDE TESTING | ECSA (m2 gpt−1) | MA (A mgpt−1) @ 0.9 V | SA (mA cm−2) @ 0.9 V |
|---|---|---|---|
| Commercial Pt/C (60 wt%, JM) | 63.37 | 0.06 | 0.095 |
| Pt3Ni/EC-600 | 98.9 | 0.139 | 0.141 |
| NT-Pt3Ni/EC-600 | 43.98 | 0.054 | 0.123 |
| Pt/EC-600 | 22.97 | 0.031 | 0.135 |
| PtNi/EC-600 | 59.87 | 0.064 | 0.107 |
© 2019 by the authors. Licensee MDPI, Basel, Switzerland. This article is an open access article distributed under the terms and conditions of the Creative Commons Attribution (CC BY) license (http://creativecommons.org/licenses/by/4.0/).
Share and Cite
MDPI and ACS Style
Yang, D.; Gu, J.; Liu, X.; He, H.; Wang, M.; Wang, P.; Zhu, Y.; Fan, Q.; Huang, R. Monodispersed Pt3Ni Nanoparticles as a Highly Efficient Electrocatalyst for PEMFCs. Catalysts 2019, 9, 588. https://doi.org/10.3390/catal9070588
AMA Style
Yang D, Gu J, Liu X, He H, Wang M, Wang P, Zhu Y, Fan Q, Huang R. Monodispersed Pt3Ni Nanoparticles as a Highly Efficient Electrocatalyst for PEMFCs. Catalysts. 2019; 9(7):588. https://doi.org/10.3390/catal9070588
Chicago/Turabian StyleYang, Delong, Jun Gu, Xiaomeng Liu, Haitong He, Meiyu Wang, Peng Wang, Yong Zhu, Qi Fan, and Runsheng Huang. 2019. "Monodispersed Pt3Ni Nanoparticles as a Highly Efficient Electrocatalyst for PEMFCs" Catalysts 9, no. 7: 588. https://doi.org/10.3390/catal9070588
Note that from the first issue of 2016, this journal uses article numbers instead of page numbers. See further details here.