In Situ Encapsulated Pt Nanoparticles Dispersed in Low Temperature Oxygen for Partial Oxidation of Methane to Syngas

College of Chemistry & Chemical Engineering, Taiyuan University of Technology, Taiyuan 030024, China
*
Authors to whom correspondence should be addressed.
Catalysts 2019, 9(9), 720; https://doi.org/10.3390/catal9090720
Submission received: 7 August 2019
/
Revised: 16 August 2019
/
Accepted: 21 August 2019
/
Published: 27 August 2019
(This article belongs to the Special Issue Catalysts for Production and Conversion of Syngas)
Abstract
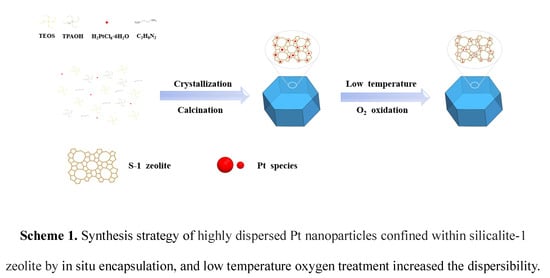
:Highly dispersed ultra-small Pt nanoparticles limited in nanosized silicalite-1 zeolite were prepared by in situ encapsulation strategy using H2PtCl6·6H2O as a precursor and tetrapropylammonium hydroxide as a template. The prepared Pt@S-1 catalyst was characterized by X-ray diffraction (XRD), inductively coupled plasma (ICP), transmission electron microscopy (TEM), scanning transmission electron microscopy (STEM), N2 adsorption-desorption, CO adsorption, and TGA techniques and exhibited unmatched catalytic activity and sintering resistance in the partial oxidation of methane to syngas. Strikingly, Pt@S-1 catalyst with further reduced size and increased dispersibility of Pt nanoparticles showed enhanced catalytic activity after low-temperature oxygen calcination. However, for Pt/S-1 catalyst, low-temperature oxygen calcination did not improve its catalytic activity.
1. Introduction
Recently, methane has received extensive attention as a clean and efficient resource. Methane utilization is divided into direct utilization and indirect utilization and the route of indirect use of methane to syngas is economically feasible [1,2]. Nowadays, there are three common methods for producing synthesis gas from methane: The steam reforming [3,4], the dry reforming [5,6] and the partial oxidation of methane (POM) [7,8]. POM is one of the most powerful processes for the production of downstream chemical products, especially methanol and Fischer–Tropsch synthesis [9,10,11]. Compared to transition metals, noble metals catalyzed by POM reactions exhibit incomparable catalytic performance and carbon deposition resistance [12,13]. However, thanks to the high price of noble metals, its research and application are limited.
In order to increase the atomic utilization of noble metals, reduce metals nanoparticle sintering, and resolve the stability issue of nanoparticle-based catalysts, researchers have proposed many ideas [14,15,16,17]. Typically, the nanoparticles are dispersed on/in solid support to prevent the nanoparticles from sintering in a high temperature environment [18], the most effective of which is to encapsulate the noble metal nanoparticles.
Owing to the regular channels, adjustable pH, high chemical and thermal stability, zeolites are attracting increasing attention as ideal support for limiting metal nanoparticles [19,20]. The zeolite pores can inhibit the aggregation of the metal nanoparticles, thereby improving the stability of the catalyst. Generally, the use of post-treatment methods to achieve encapsulation of metal nanoparticles may result in nonuniform dispersion of nanoparticles and unsatisfactory catalytic activity [21]. In contrast, in situ encapsulation of metal nanoparticles within zeolite is a good strategy for controlling particle size and achieving uniform dispersion. Goel et al. reported synthetic schemes for the confinement of active metals within small voids zeolites. It also showed that these zeolite structures can protect noble metal clusters from sintering [22]. However, the Al sites bring acidity and the hydrothermal stability of low-silica zeolites is poor, which limit their applications [23]. The preparation of metal nanoparticles limited in high-silicon or even all-silicon zeolites would be of great significance.
In recent years, research on all-silicon molecular sieve encapsulation of metal nanoparticle catalysts has attracted the attention of scholars. Silicalite-1 (S-1) zeolite with MFI type structure (a structural type code for molecular sieves) is ideal catalyst support in many industrial processes. For example, Wang et al. prepared Pd clusters with good dispersion in nanosized S-1 under direct hydrothermal conditions for efficient catalytic hydrogen production [24].
Here, the Pt nanoparticles confined in S-1 have been successfully synthesized under hydrothermal conditions. The catalyst prepared by in situ encapsulation strategy shows great catalytic activity and resistance to sintering in partial oxidation of methane to syngas. Strikingly, Pt@S-1 sample with further reduced size and increased dispersibility of Pt nanoparticles shows enhanced catalytic activity after low-temperature oxygen calcination.
2. Results and Discussion
2.1. Characterization
2.1.1. Phase Composition
X-ray diffraction analysis of the as-synthesized samples was carried out for phase identification, and the results were shown in Figure S1. These patterns displayed similar characteristic diffraction, and the large diffraction peaks were exhibited in the ranges of 8°–10° and 22°–25° [25,26]. Additionally, the introduction of Pt species within the nanosized S-1 zeolite had a scarce effect on the crystallinity, which can be demonstrated by the fact that the peaks associated with the MFI structure in the X-ray diffraction (XRD) patterns were unchanged. Further, although the loading amounts of platinum were tiny (the loading amounts of platinum of the Pt/S-1 sample were 0.382% and the loading amounts of platinum of the Pt@S-1 sample were 0.312%), small sharp peaks of the (111) crystal plane of Pt at 2θ = 39.78° (JCPDS Card No. 65-2868) and the (004) crystal plane of PtO2 at 2θ = 43.44° (JCPDS Card No. 73-2360) were still observed in the XRD patterns of the Pt/S-1 and Pt@S-1 samples [27,28]. This represented that the Pt element existed in two forms of metal (Pt) and tetravalent metal oxide (PtO2).
After calcination at 300 °C and 700 °C for 2 h in O2 atmosphere, the morphology and crystallinity were still well maintained (as shown in Figure S2). A very weak diffraction peak of the (111) lattice plane belonging to Pt at 2θ = 39.78° can be discriminated from the XRD pattern of the Pt@S-1 sample, but the small peak disappeared after calcination at 300 °C in O2 atmosphere, i.e., no diffraction peak of the platinum (111) crystal plane appeared in the XRD pattern of the Pt@S-1-300O2 sample, and no other diffraction peaks belonging to PtO2, which showed that low temperature oxygen calcination can reduce the diameter of nanoparticles and increase the dispersion of platinum species, so that X-ray diffraction was not sufficient to detect the presence of platinum species in the case of same loading amounts of platinum [29]. This conclusion can be confirmed again by transmission electron microscopy (TEM) and CO adsorption. However, after calcination at 700 °C, the diffraction intensity was enhanced there, simultaneously, we can see not only the diffraction peak of the Pt (111) crystal plane at 2θ = 39.78°, but the new diffraction peak attributed to Pt (220) crystal plane appeared at 2θ = 67.3° on the XRD pattern of the Pt@S-1-700O2 sample [30,31]. This may be because high-temperature calcination led to thermal reduction of platinum cations, even in an oxygen-containing atmosphere.
2.1.2. TEM
Transmission electron microscopy (TEM) images and scanning transmission electron microscopy (STEM) images, as well as the particle size distributions of Pt nanoparticles in the synthesized samples before and after calcination in O2 atmosphere and the samples after reaction, were shown in Figure 1 and Figure 2, respectively. Single crystal S-1 zeolite with regular morphology and uniform size can be seen from the TEM images. And the Pt nanoparticles encapsulated within the nano-S-1 zeolite were well dispersed and evenly distributed throughout the zeolite crystals. The average size of in situ encapsulated Pt nanoparticles was 3.67 nm, which was much smaller than the average size of the impregnated Pt particles, indicating that in situ encapsulated within the nano-S-1 zeolite can limit the agglomeration of metal. However, the size of Pt nanoparticles in situ encapsulated was much larger than the MFI channel (0.53 × 0.56 nm) and the cross channel (~0.9 nm) [32,33].
Notably, the size of Pt nanoparticles became smaller after calcination at 300 °C in O2 atmosphere. The Pt@S-1-300O2 sample showed the minimum and narrowest Pt particle distribution (Figure 1), with an average particle size of ~2.32 nm. But after calcination in O2 atmosphere at 700 °C, the Pt@S-1-700O2 sample showed an increase in Pt particle size and broad distribution. Based on this, we can infer that for the Pt@S-1 sample, low-temperature oxygen calcination was beneficial to the dispersion of Pt particles, while high-temperature oxygen calcination would cause significant sintering.
This result drastically contrasted with that observed for Pt/S-1-300O2 sample. The sample prepared by impregnating the Pt particles on the crystal surface did not achieve dispersion in 300 °C oxygen atmosphere, but aggregation of the Pt particles occurred. Avelino Corma reported that small Pt nanoparticles located in the MCM-22 crystallites seem easier to become redispersed than those larger Pt nanoparticles located on the external surface of MCM-22 [34]. Therefore, we concluded that the size of Pt particles in Pt/S-1 was too large to affect their disintegration in O2 under relatively mild conditions.
After the reaction, it can be seen that the size of Pt particles in both catalysts increased to varying degrees. Pt species were located in the internal space of S-1 crystallites, which were protected by the zeolite framework, and to some extent avoided the agglomeration into large nanoparticles during the reaction. However, Pt/S-1 sample showed obvious aggregation. The results suggested that trapping Pt nanoparticles within small-pore zeolites was an effective method to enhance the sinter resistance of metals. Its effect on catalytic performance would be discussed later in the article.
STEM image and the corresponding elemental mappings for Si, O and Pt elements were used to illustrate that the dispersion of Pt in the Pt@S-1 sample prepared by in situ confinement was better, which can be mutually confirmed with CO adsorption data.
2.1.3. CO Adsorption
Table 1 summarizes the dispersion of Pt, metal surface area and crystallite size as measured by CO adsorption. Obviously, the dispersion of Pt increased sharply from 37.25% of the Pt/S-1 sample to 86.49% of the Pt@S-1 sample, which indicated that the in situ encapsulation has a significant effect on increasing the dispersion. The highest dispersion of Pt (89.41%) was detected in Pt@S-1-300O2 signifying that low-temperature oxygen calcination was beneficial to the dispersion. The lowest Pt dispersion (31.72%) was detected in Pt@S-1-700O2 (regardless of Pt/S-1) demonstrating that high-temperature oxygen calcination would cause significant sintering. In contrast, treatment of Pt/S-1 sample under conditions similar to low-temperature oxygen calcination led to substantial sintering of the metal phase resulting in a decrease of the dispersion of Pt. The surface-weighted mean nanoparticle diameter in TEM image (summarized in Table 1) was calculated by dTEM = ∑nidi3/∑nidi2, where ni was the number of crystallites having diameter di [20]. It can be found that the particle size calculated by TEM was consistent with the particle size measured by CO adsorption.
2.1.4. N2 Adsorption-Desorption
The N2 adsorption-desorption isotherms and pore size distributions of the as-prepared samples were shown in Figure S3. All of the samples showed a similar type IV isotherm with only a high nitrogen uptake at low relative pressure (P/P0 < 0.1). Moreover, a smaller hysteresis loop was observed in their isotherms at a high relative pressure (P/P0 > 0.9), which illustrated that a small amount of mesopores formed by the accumulation of crystals existed in the as-prepared samples. Compared to the parent S-1 zeolite and Pt/S-1 sample, the Pt@S-1 sample showed reduced adsorption within the entire relative pressure range, especially in a high relative pressure area. At high P/P0, the enhancement of nitrogen absorption of the S-1 zeolite and Pt/S-1 sample was the connection with the capillary condensation of nitrogen in the pores inside the crystal [35].
The textural properties of the as-prepared samples were listed in Table 2. The introduction of Pt species into the parent S-1 zeolite reduced the surface area and pore volume. As shown in Figure S3b–d, the pore size distributions were determined by the HK method, which also confirmed that the introduction of Pt species would also reduce the pore size of the zeolite.
2.1.5. TGA
In order to study the carbon deposition of the catalyst after the reaction, we performed thermogravimetry-differential thermal analysis. Figure 3 shows the TGA–DTG curves after reaction at 800 °C for 100 h. It can be seen that the Pt/S-1 catalyst exhibited a slight weight loss at low-temperature in the range of 50–100 °C, whereas the mass of the used Pt@S-1 catalyst was not reduced at this temperature, indicating that the Pt@S-1 catalyst had excellent carbon deposition resistance. This was consistent with the trend of catalytic activity in long-term stability tests. No other weight loss peak was observed, and therefore, suggested that the calculation process in air was sufficient to remove surfactants and organic templating agents [36]. We found a significant increase in the quality of the two catalysts, and the cause of this phenomenon was the oxidation of Pt species [37,38]. The quality increase trend of Pt@S-1 was greater than that of Pt/S-1 catalyst, which strongly suggested more active sites were formed over Pt@S-1 catalyst [39].
2.2. POM Catalytic Activity and Stability
2.2.1. The Catalytic Activity and Stability Comparison of Pt/S-1 and Pt@S-1
CH4 conversion and H2, CO selectivity of the Pt/S-1 and Pt@S-1 catalysts were displayed on Figure 4. Both of the catalysts performed POM at 800 °C with a GHSV of 14.4 L h−1 g−1. Compared with the catalyst prepared by the impregnation method, the Pt@S-1 catalyst prepared by in situ encapsulation exhibited excellent catalytic activity, and the conversion of methane was close to 80%, whereas the conversion on the Pt/S-1 was barely 45%. The reason for this result was that after the low-temperature oxygen pretreatment process, the particle size of Pt nanoparticles on the Pt/S-1 catalyst was significantly augmented, the dispersion was reduced, while the Pt particles on the Pt@S-1 catalyst were dispersed into smaller particles, which produced more active sites. Physical barriers helped to increase metal dispersion [40]. Therefore, even under harsh reaction conditions for 40 h, CH4 conversion and product selectivity were all within acceptable limits. However, for the Pt/S-1 catalyst, when the reaction lasted for 25 h, the catalytic activity decreased significantly.
Obviously, Pt/S-1 catalyst exhibited visible induction period, which is, the values of CH4 conversion and H2 selectivity reached a maximum after 7 h of reaction. This may be characteristic of solid-state reactions [41]. It was worth noting that the value of the H2 selectivity on Pt@S-1 sample exceeded 1, and the H2/CO ratio was significantly greater than the stoichiometric ratio of POM, indicating that other reactions occurred under the experimental conditions studied. In the POM, water formed as a by-product of the reaction underwent water gas shift (WGS) reaction with CO formed as a reaction product, and consumed CO to generate CO2 and H2. This resulted in an increase in the H2 selectivity and a decrease in the CO selectivity [42,43,44].
2.2.2. Effect of Different Oxygen Temperatures on Catalyst Performance
Figure 5 shows the effect of oxygen treatment at different temperatures on catalytic performance. It can be observed that as the pre-oxidation treatment temperature increased from 300 °C to 700 °C, the CH4 conversion decreased dramatically. Combined with the analysis of the previous TEM and CO adsorption tests, we can conclude that low-temperature oxidation was beneficial to the dispersion of platinum nanoparticles, resulting in more active sites, and high-temperature oxidation would agglomerate the metal particles, resulting in poor catalytic activity. However, for the H2 selectivity, there was no significant difference in oxidation treatment at 300 °C or 400 °C, and the selectivity was close to 1. No matter how many degrees of oxidation treatment, the CO selectivity was relatively lower, thus showing that side reaction was inevitable.
According to reports in the literature, the most common method of inducing redispersion was oxidation-reduction cycles, where the active phase was redispersed during the oxidation process, and the dispersed species aggregated during the reduction process [45]. It was also believed that the oxidation temperature inducing metal dispersion was related to the size of the active phase and the catalyst support [45,46,47]. In most cases, high temperatures were required during the oxidation step to induce the redispersion [47]. However, there were also different voices in the literature. Moliner et al. reported such fine, cyclic control of metal species often required mild temperatures to avoid irreversible formation of large metal aggregated upon sintering [48]. Morgan et al. also put forward for Pt/Al2O3 catalyst, the maximum dispersion was observed after oxidation at 550 °C, and sintering began to occur again at temperatures greater than this [47]. Therefore, there was controversy about the optimum temperatures for metal dispersion. We believed that the sintering and dispersion of the active phase was in a dynamic equilibrium during the oxygen treatment. The sintering rate was higher than the dispersion rate at high-temperature oxidation, eventually leading to metal agglomeration.
2.2.3. Effect of Different Reaction Temperatures on Catalyst Performance
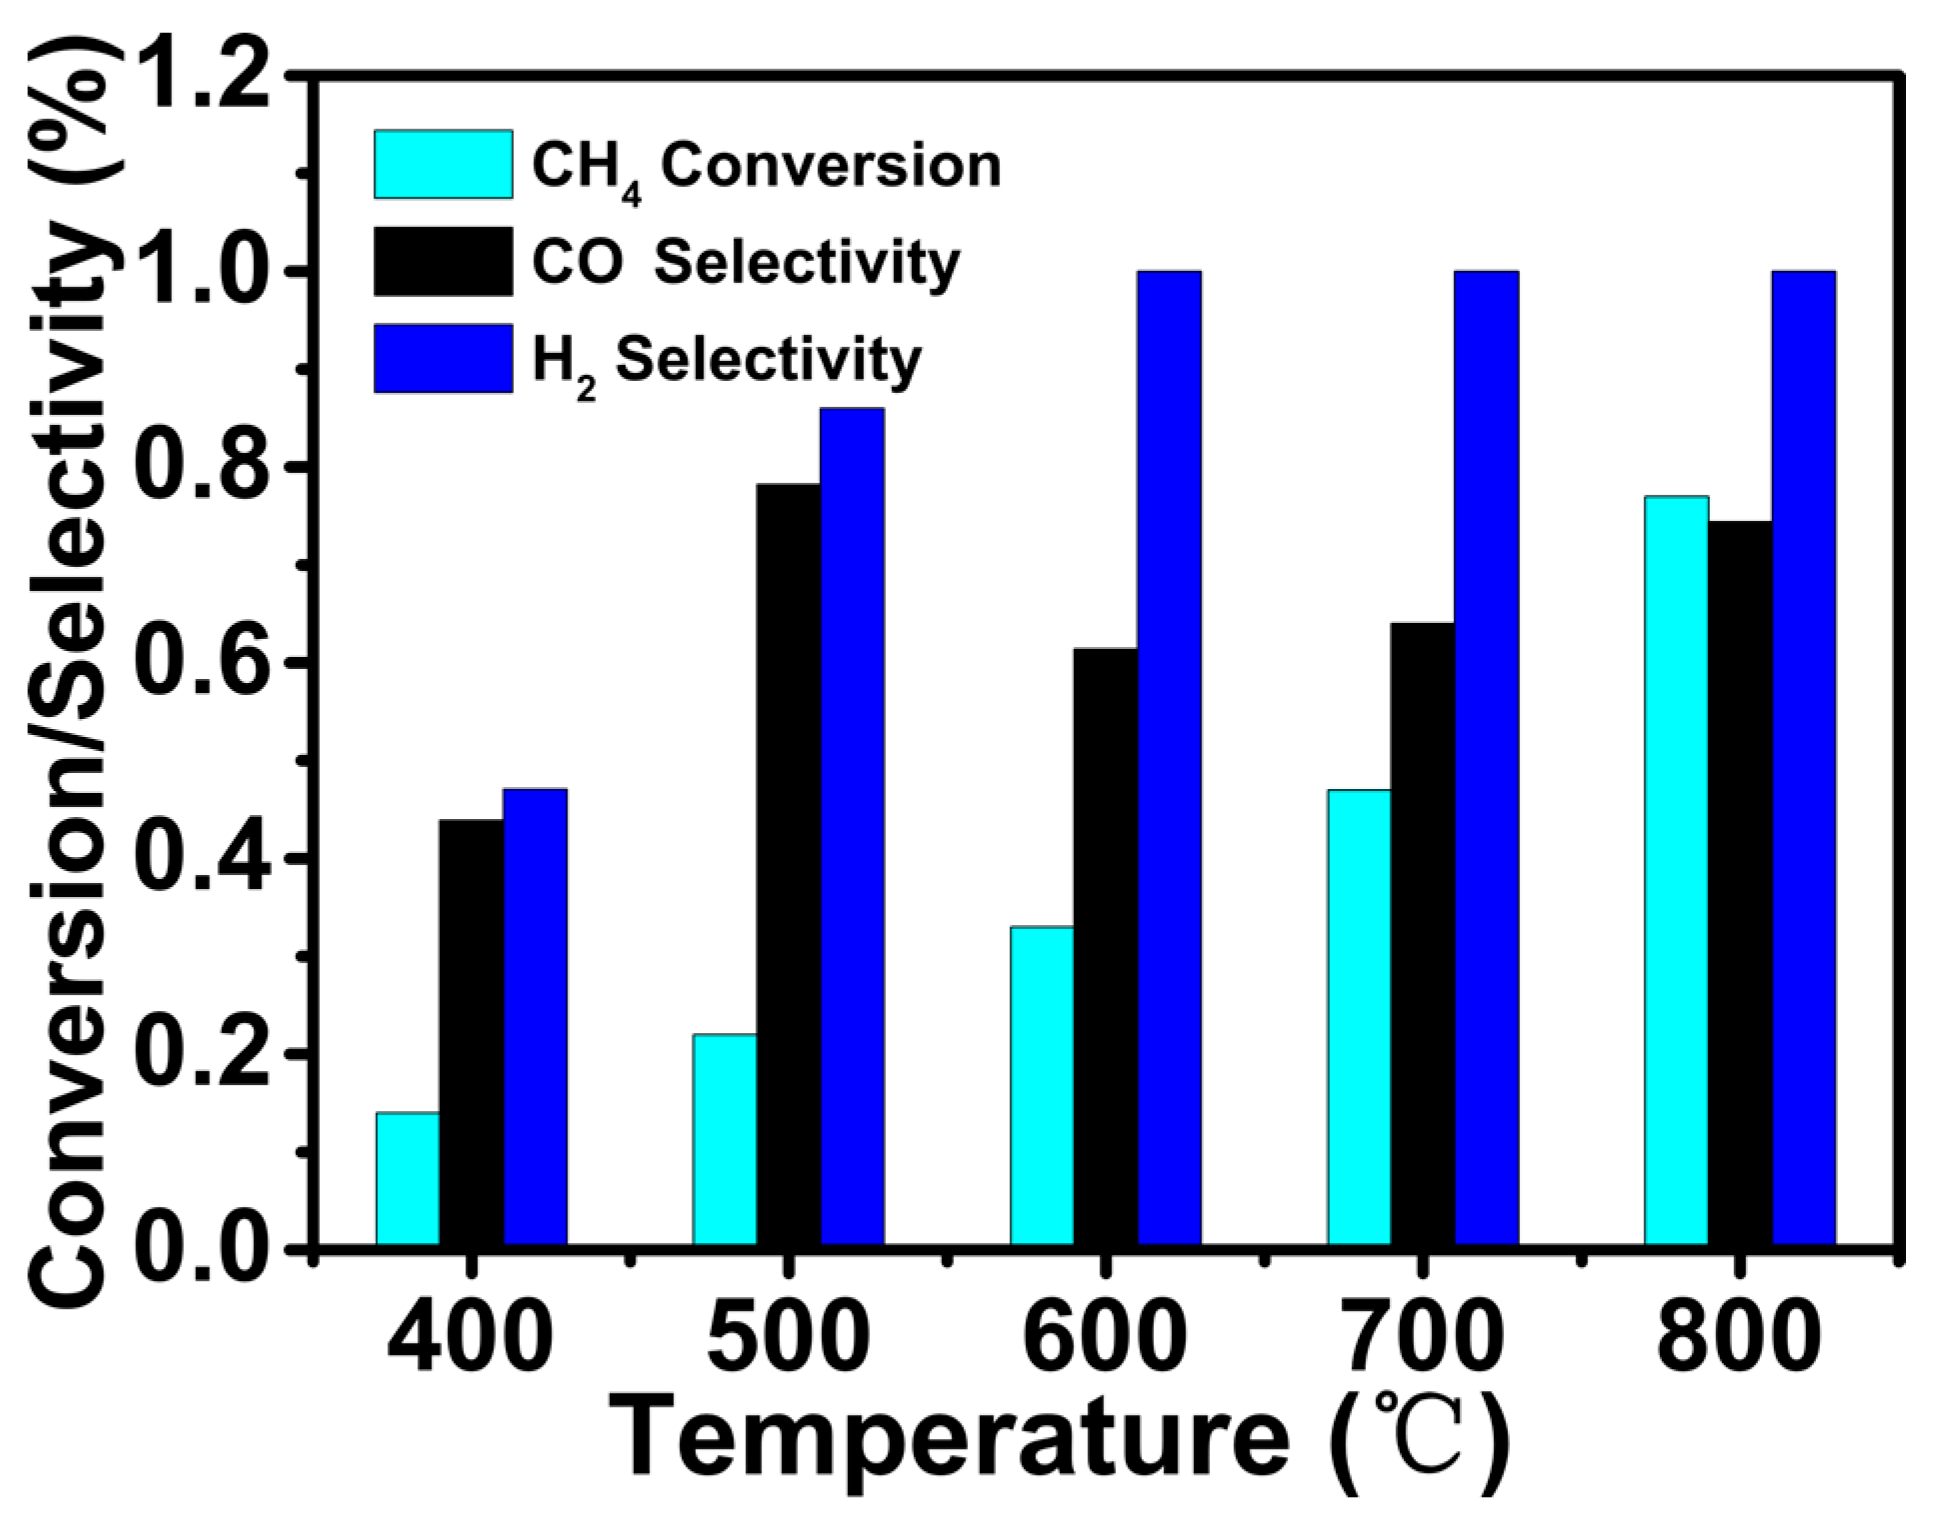
Figure 6 shows CH4 conversion, product selectivity of the Pt-based catalyst confined within the nano-S-1 zeolite changed as a function of temperature. It was observed that under 400 °C both the conversion of CH4 and the selectivity to CO and H2 were very low, in addition, high temperature was more conducive to the conversion of CH4 and the CH4 conversion reached the maximum value of 80% at 800 °C. Under harsh reaction conditions, CH4 conversion, product selectivity remained almost constant and no deactivation was observed after 25 h on stream. We found that the CO selectivity did not increase linearly with increasing temperature. In contrast, the reaction temperature of 500 °C was more favorable for CO formation.
3. Materials and Methods
3.1. Materials
All the reagents were analytical grade. Tetrapropylammonium hydroxide solution (TPAOH, 25 wt%) was purchased from Tianjin Guangfu Fine Chemical Research Institute. Tetraethyl orthsilicate (TEOS) was purchased from Shanghai-based Sinopharm Chemical Reagent Co., Ltd. Ethylenediamine (NH2CH2CH2NH2, 99%) was purchased from Tianjin Fuchen Chemical Reagents Factory. Chloroplatinic acid (H2PtCl6·6H2O) was purchased from Shanghai-based Saan Chemical Technology Co., Ltd. And deionized water from the laboratory.
3.2. Catalyst Preparation
3.2.1. Synthesis of S-1 Zeolite
Briefly, 13 mL of TPAOH solution was diluted in 34 mL of deionized water, then TEOS was added dropwise to the mixture and stirred to obtain the molar composition of the sample which was 1.0 SiO2:0.4 TPAOH:37 H2O. Then, the synthesis gel was hydrothermally crystallized at 170 °C for 3 days. Centrifugation, washing, drying overnight, and finally calcination in air at 550 °C for 6 h. The prepared sample was labeled as S-1 [49].
3.2.2. Synthesis of Pt/S-1 Zeolite
Simply, the S-1 zeolite was vacuum dried at 60 °C for 6 h to remove adsorbed moisture and impurities. Afterward, a certain concentration of H2PtCl6·6H2O solution was added dropwise to the treated S-1 zeolite and stirred slowly, further dried and calcined in air. Finally, the sample with molar ratio was 1.0 SiO2: 0.4 TPAOH: 37 H2O: 0.004 Pt was obtained. The prepared sample was labeled as Pt/S-1. The oxygen-treated sample was labeled as Pt/S-1-yO2 (y represented the treatment temperature of oxygen). The sample after the reaction was labeled as Pt/S-1-yO2-z (z represented the reaction temperature).
3.2.3. Synthesis of Pt@S-1 Zeolite
Pt@S-1 catalyst was synthesized by hydrothermal crystallization with the molar composition of 1.0 SiO2: 0.4 TPAOH: 37 H2O: 0.004 Pt. First, 13 mL of TPAOH was mixed with water and 8.9 mL of TEOS solution and stirred well to make the solution clear. After that, H2PtCl6·6H2O was mixed with 1 mL of ethylenediamine solution to form a complex and stirred at a certain temperature. Next, the complex was slowly added to the above clear solution. The pH of the mixture was adjusted to 11 and stirring was continued for 6 h. Then, the synthesis gel was crystallized at 170 °C for 3 days. It was followed by centrifugation, washing, drying, and finally calcination in air for 6 h. The prepared sample was labeled as Pt@S-1. The oxygen-treated sample was labeled as Pt@S-1-yO2 (y represented the treatment temperature of oxygen). The sample after the reaction was labeled as Pt@S-1-yO2-z (z represented the reaction temperature).
3.3. Catalyst Characterization
Powder X-ray diffraction (XRD) measurements were carried out on a SHIMADZU-6000 automated powder diffractometer with Cu Kα X-ray source. XRD patterns were recorded in the range of 2θ = 5–80°. The voltage and current were 40 kV and 30 mA, respectively. The transmission electron microscopy (TEM) images and corresponding energy dispersive X-ray (EDX) spectrometry and scanning transmission electron microscopy (STEM) images were measured with a JEM-2100F transmission electron microscope. N2 adsorption-desorption isotherms at −196 °C was measured on a BELSORP-max gas adsorption analyzer. The total surface area was calculated using the multipoint BET analysis method, and the t-plot method distinguished the micropore area and the external surface area. The HK method was used to determine the pore size distributions. The metal loading of the prepared catalysts was determined on an inductively coupled plasma atomic emission spectroscopy (ICP-AES, Thermo iCAP6300) and these data were summarized in Table 1. CO acted as a probe molecule to determine metal dispersion, metal surface area and crystallite size of the catalysts. The CO adsorption was considered complete when three consecutive peaks showed the same peak areas [50,51]. The amount of carbon deposited on the spent catalyst was determined by calculating the weight loss of the sample after combustion of the carbon component in the thermogravimetric analyzer. TG data were recorded on a SETARAM Setsys Evolution.
3.4. Catalyst Evaluation
The partial oxidation of methane (POM) was tested in a fixed bed reactor at atmospheric pressure. The catalysts of 500 mg were placed in the middle of the quartz tube and clamped with quartz wool at both ends of the catalysts. A thermocouple was inserted into the catalyst for temperature measurement. Before reaction, the prepared samples were oxidized in O2 with a flow rate of 60 mL/min at different temperature for 2 h. The catalysts were tested in the temperature range of 800 °C. A reactant feed gas consisting of CH4 and O2 (2:1, molar ratio) with a total flow of 120 mL min−1 (GHSV =14.4 L h−1 g−1) was simultaneously passed through the quartz tube. The outlet gas was analyzed by gas chromatograph (Haixin GC 920) equipped with a thermal conductivity detector (TCD) and a flame ionization detector (FID).
All the performance data of catalysts were calculated with the following equations:
In these equations, FCH4, in, FCH4, out denoted the import mole of CH4 and the export mole of CH4, respectively. FH2, out, FCO, out denoted the outlet gas the mole of H2 and CO, respectively.
4. Conclusions
In summary, well dispersed and ultra-small Pt nanoparticles limited in nanosized silicalite-1 zeolite were prepared in situ encapsulation strategy and exhibited unmatched catalytic activity and sintering resistance in the partial oxidation of methane to syngas. The key to achieving this success was the combination of Pt nanoparticles and zeolite micropores. Pt nanoparticles were active sites, and the regular pores of the zeolite limited their agglomeration during the reaction. Strikingly, Pt@S-1 catalyst with further reduced size and increased the dispersibility of Pt nanoparticles showed enhanced catalytic activity after low-temperature oxygen calcination, which was of great significance for increasing metal utilization and reducing catalyst costs. Moreover, the Pt@S-1 catalyst prepared by in situ encapsulation can be widely used in various catalytic fields.
Supplementary Materials
The following are available online at https://www.mdpi.com/2073-4344/9/9/720/s1, Figure S1: XRD patterns of the as -prepared samples (a), XRD partial enlargement of S-1 zeolite (b). Figure S2: XRD patterns of the Pt@S-1catalyst after oxygen calcination and reaction at different temperatures. Figure S3: TEM images of the fresh Pt@S-1 catalyst. Figure S4: TEM images of the oxygen calcinated Pt@S-1-300O2 catalyst. Figure S5. N2 adsorption–desorption isotherms (a) and pore size distribution (b–d) of as-prepared samples.
Author Contributions
Conceptualization, J.W.; methodology, J.W. and C.D.; software, Y.Z. and Z.G.; validation, L.M. and Y.X.; formal analysis, J.W. and L.M.; investigation, L.M.; writing, J.W.; visualization, L.M.
Funding
The Natural Science Foundation of China, grant number 21978189.
Acknowledgments
The authors gratefully acknowledge the financial support from Natural Science Foundation of China 21706178, Natural Science Foundation of Shanxi Province 201801D221074 and 201801D121058, Postdoctoral Science Foundation of China 2019M651079.
Conflicts of Interest
The authors have no conflict of interest to declare.
References
- Vora, B.; Chen, J.Q.; Bozzano, A.; Glover, B.; Barger, P. Various routes to methane utilization-SAPO-34 catalysis offers the best option. Catal. Today 2009, 141, 77–83. [Google Scholar] [CrossRef]
- Pei, S.; Kleefisch, M.S.; Kobylinski, T.P.; Faber, J.; Udovich, C.A.; Zhang-McCoy, V.; Dabrowski, B.; Balachandran, U.; Mieville, R.L.; Poeppel, R.B. Failure mechanisms of ceramic membrane reactors in partial oxidation of methane to synthesis gas. Catal. Lett. 1994, 30, 201–212. [Google Scholar] [CrossRef]
- Freni, S.; Calogero, G.; Cavallaro, S. Hydrogen production from methane through catalytic partial oxidation reactions. J. Power Sources 2000, 87, 28–38. [Google Scholar] [CrossRef]
- Rostrup-Nielsen, T. Manufacture of hydrogen. Catal. Today 2005, 106, 293–296. [Google Scholar] [CrossRef]
- Fakeeha, A.H.; Al-Fatesh, A.S.; Abasaeed, A.E. Modification of alumina support with TiO2-P25 in CO2 reforming of CH4. J. Ind. Eng. Chem. 2012, 18, 212–217. [Google Scholar] [CrossRef]
- Cheng, Z.X.; Zhao, X.G.; Li, J.L.; Zhu, Q.M. Role of support in CO2 reforming of CH4 over a Ni/γ-Al2O3 catalyst. Appl. Catal. A Gen. 2001, 205, 31–36. [Google Scholar] [CrossRef]
- Hohn, K.L.; Schmidt, L.D. Partial oxidation of methane to syngas at high space velocities over Rh-coated spheres. Appl. Catal. A Gen. 2001, 211, 53–68. [Google Scholar] [CrossRef]
- Li, K.; Wang, H.; Wei, Y.; Yan, D. Syngas production from methane and air via a redox process using Ce–Fe mixed oxides as oxygen carriers. Appl. Catal. B 2010, 97, 361–372. [Google Scholar] [CrossRef]
- Eriksson, S.; Rojas, S.; Boutonnet, M.; Fierro, J. Effect of Ce-doping on Rh/ZrO2 catalysts for partial oxidation of methane. Appl. Catal. A Gen. 2007, 326, 8–16. [Google Scholar] [CrossRef]
- Enger, B.C.; Lødeng, R.; Holmen, A. A review of catalytic partial oxidation of methane to synthesis gas with emphasis on reaction mechanisms over transition metal catalysts. Appl. Catal. A Gen. 2008, 346, 1–27. [Google Scholar] [CrossRef]
- Nematollahi, B.; Rezaei, M.; Khajenoori, M. Combined dry reforming and partial oxidation of methane to synthesis gas on noble metal catalysts. Int. J. Hydrogen Energy 2011, 36, 2969–2978. [Google Scholar] [CrossRef]
- Khajenoori, M.; Rezaei, M.; Nematollahi, B. Preparation of noble metal nanocatalysts and their applications in catalytic partial oxidation of methane. J. Ind. Eng. Chem. 2013, 19, 981–986. [Google Scholar] [CrossRef]
- Sun, W.Z.; Jin, G.Q.; Guo, X.Y. Partial oxidation of methane to syngas over Ni/SiC catalysts. Catal. Commun. 2005, 6, 135–139. [Google Scholar] [CrossRef]
- Hunt, S.T.; Milina, M.; Alba-Rubio, A.C.; Hendon, C.H.; Dumesic, J.A.; Román-Leshkov, Y. Self-assembly of noble metal monolayers on transition metal carbide nanoparticle catalysts. Science 2016, 352, 974–978. [Google Scholar] [CrossRef] [Green Version]
- Yue, Q.; Zhang, Y.; Wang, C.; Wang, X.; Sun, Z.; Hou, X.; Zhao, D.; Deng, Y. Magnetic yolk-shell mesoporous silica microspheres with supported Au nanoparticles as recyclable high-performance nanocatalysts. J. Mater. Chem. A 2015, 3, 4586–4594. [Google Scholar] [CrossRef]
- Zhu, Q.L.; Li, J.; Xu, Q. Immobilizing metal nanoparticles to metal-organic frameworks with size and location control for optimizing catalytic performance. J. Am. Chem. Soc. 2013, 135, 10210–10213. [Google Scholar] [CrossRef]
- Li, G.; Kobayashi, H.; Taylor, J.M.; Ikeda, R.; Kubota, Y.; Kato, K.; Takata, M.; Yamamoto, T.; Toh, S.; Matsumura, S.; et al. Hydrogen storage in Pd nanocrystals covered with a metal-organic framework. Nat. Mater. 2014, 13, 802–806. [Google Scholar] [CrossRef]
- Arnal, P.M.; Weidenthaler, C.; Schüth, F. Highly monodisperse zirconia-coated silica spheres and zirconia/silica hollow spheres with remarkable textural properties. Chem. Mater. 2006, 18, 2733–2739. [Google Scholar] [CrossRef]
- Farrusseng, D.; Tuel, A. Perspectives on zeolite-encapsulated metal nanoparticles and their applications in catalysis. New J. Chem. 2016, 40, 3933–3949. [Google Scholar] [CrossRef]
- Choi, M.; Wu, Z.; Iglesia, E. Mercaptosilane-assisted synthesis of metal clusters within zeolites and catalytic consequences of encapsulation. J. Am. Chem. Soc. 2010, 132, 9129–9137. [Google Scholar] [CrossRef]
- Yang, H.; Chen, H.; Chen, J.; Omotoso, O.; Ring, Z. Shape selective and hydrogen spillover approach in the design of sulfur-tolerant hydrogenation catalysts. J. Catal. 2006, 243, 36–42. [Google Scholar] [CrossRef]
- Goel, S.; Wu, Z.; Zones, S.I.; Iglesia, E. Synthesis and catalytic properties of metal clusters encapsulated within small-pore (SOD, GIS, ANA) zeolites. J. Am. Chem. Soc. 2012, 134, 17688–17695. [Google Scholar] [CrossRef]
- Liu, L.C.; Díaz, U.; Arenal, R.; Agostini, G.; Concepción, P.; Corma, A. Generation of subnanometric platinum with high stability during transformation of a 2D zeolite into 3D. Nat. Mater. 2017, 16, 132–138. [Google Scholar] [CrossRef]
- Wang, C.; Wang, L.; Zhang, J.; Wang, H.; Lewis, J.P.; Xiao, F.S. Product selectivity controlled by zeolite crystals in biomass hydrogenation over a palladium catalyst. J. Am. Chem. Soc. 2016, 138, 7880–7883. [Google Scholar] [CrossRef]
- Niu, X.; Gao, J.; Miao, Q.; Dong, M.; Wang, G.; Fan, W.; Qin, Z.; Wang, J. Influence of preparation method on the performance of Zn-containing HZSM-5 catalysts in methanol-to-aromatics. Microporous Mesoporous Mater. 2014, 197, 252–261. [Google Scholar] [CrossRef]
- Di, Z.; Yang, C.; Jiao, X.; Li, J.; Wu, J.; Zhang, D. A ZSM-5/MCM-48 based catalyst for methanol to gasoline conversion. Fuel 2013, 104, 878–881. [Google Scholar] [CrossRef]
- Bera, P.; Priolkar, K.R.; Gayen, A.; Sarode, P.R.; Hegde, M.S.; Emura, S.; Kumashiro, R.; Jayaram, V.; Subbanna, G.N. Ionic dispersion of Pt over CeO2 by the combustion method: Structural investigation by XRD, TEM, XPS, and EXAFS. Chem. Mater. 2003, 15, 2049–2060. [Google Scholar] [CrossRef]
- Liu, X.; Chen, N.; Han, B.; Xiao, X.; Chen, G.; Djerdj, I.; Wang, Y. Nanoparticle cluster gas sensor: Pt activated SnO2 nanoparticles for NH3 detection with ultrahigh sensitivity. Nanoscale 2015, 7, 14872–14880. [Google Scholar] [CrossRef]
- Zhang, Z.; Chen, M.; Jiang, Z.; Shangguan, W. Low-temperature selective catalytic reduction of NO with propylene in excess oxygen over the Pt/ZSM-5 catalyst. J. Hazard. Mater. 2011, 193, 330–334. [Google Scholar] [CrossRef]
- Li, N.; Hu, Z.; Zheng, M.; Lu, H.; Zhao, B.; Zhang, S.; Zheng, J.; Ji, G.; Cao, J. Formation of Pt nanoparticles in mesoporous silica channels via direct low-temperature decomposition of H2PtCl6·6H2O. Mater. Lett. 2013, 106, 193–196. [Google Scholar] [CrossRef]
- Luo, M.; Yao, W.; Huang, C.; Wu, Q.; Xu, Q. Shape effects of Pt nanoparticles on hydrogen production via Pt/CdS photocatalysts under visible light. J. Mater. Chem. A 2015, 3, 13884–13891. [Google Scholar] [CrossRef]
- Kim, J.; Jo, C.; Lee, S.; Ryoo, R. Bulk crystal seeding in the generation of mesopores by organosilane surfactants in zeolite synthesis. J. Mater. Chem. A 2014, 2, 11905–11912. [Google Scholar] [CrossRef]
- Ahn, J.H.; Kolvenbach, R.; Al-Khattaf, S.S.; Jentys, A.; Lercher, J.A. Methanol usage in toluene methylation with medium and large pore zeolites. ACS Catal. 2013, 3, 817–825. [Google Scholar] [CrossRef]
- Liu, L.; Zakharov, D.N.; Arenal, R.; Concepcion, P.; Stach, E.A.; Corma, A. Evolution and stabilization of subnanometric metal species in confined space by in situ TEM. Nat. Commun. 2018, 9, 574. [Google Scholar] [CrossRef]
- Thommes, M. Physical adsorption characterization of nanoporous materials. Chem. Ing. Tech. 2010, 82, 1059–1073. [Google Scholar] [CrossRef]
- Lim, D.H.; Lee, W.D.; Choi, D.H.; Park, D.R.; Lee, H.I. Preparation of platinum nanoparticles on carbon black with mixed binary surfactants: Characterization and evaluation as anode catalyst for low-temperature fuel cell. J. Power Sources 2008, 185, 159–165. [Google Scholar] [CrossRef]
- Rabe, S.; Nachtegaal, M.; Vogel, F. Catalytic partial oxidation of methane to synthesis gas over a ruthenium catalyst: The role of the oxidation state. Phys. Chem. Chem. Phys. 2007, 9, 1461–1468. [Google Scholar] [CrossRef]
- Duan, Q.; Wang, J.; Ding, C.; Ding, H.; Guo, S.; Jia, Y.; Liu, P.; Zhang, K. Partial oxidation of methane over Ni based catalyst derived from order mesoporous LaNiO3 perovskite prepared by modified nanocasting method. Fuel 2017, 193, 112–118. [Google Scholar] [CrossRef]
- Liu, D.; Cheo, W.N.E.; Lim, Y.W.Y.; Borgna, A.; Lau, R.; Yang, Y. A comparative study on catalyst deactivation of nickel and cobalt incorporated MCM-41 catalysts modified by platinum in methane reforming with carbon dioxide. Catal. Today 2010, 154, 229–236. [Google Scholar] [CrossRef]
- Guo, S.; Wang, J.; Ding, C.; Duan, Q.; Ma, Q.; Zhang, K.; Liu, P. Confining Ni nanoparticles in honeycomb-like silica for coking and sintering resistant partial oxidation of methane. Int. J. Hydrogen Energy 2018, 43, 6603–6613. [Google Scholar] [CrossRef]
- Dedov, A.G.; Loktev, A.S.; Komissarenko, D.A.; Mazo, G.N.; Shlyakhtin, O.A.; Parkhomenko, K.V.; Kiennemann, A.A.; Roger, A.C.; Ishmurzin, A.V.; Moiseev, I.I. Partial oxidation of methane to produce syngas over a neodymium–calcium cobaltate-based catalyst. Appl. Catal. A Gen. 2015, 489, 140–146. [Google Scholar] [CrossRef]
- Basile, A.; Paturzo, L.; Lganà, F. The partial oxidation of methane to syngas in a palladium membrane reactor: Simulation and experimental studies. Catal. Today 2001, 67, 65–75. [Google Scholar] [CrossRef]
- Özdemir, H.; Öksüzömer, M.A.F.; Gürkaynak, M.A. Preparation and characterization of Ni based catalysts for the catalytic partial oxidation of methane: Effect of support basicity on H2/CO ratio and carbon deposition. Int. J. Hydrogen Energy 2010, 35, 12147–12160. [Google Scholar] [CrossRef]
- López-Fonseca, R.; Jiménez-González, C.; de Rivas, B.; Gutiérrez-Ortiz, J.I. Partial oxidation of methane to syngas on bulk NiAl2O4 catalyst. Comparison with alumina supported nickel, platinum and rhodium catalysts. Appl. Catal. A Gen. 2012, 437, 53–62. [Google Scholar] [CrossRef]
- Aitbekova, A.; Wu, L.; Wrasman, C.J.; Boubnov, A.; Hoffman, A.S.; Goodman, E.D.; Bare, S.R.; Cargnello, M. Low-Temperature Restructuring of CeO2-Supported Ru Nanoparticles Determines Selectivity in CO2 Catalytic Reduction. J. Am. Chem. Soc. 2018, 140, 13736–13745. [Google Scholar] [CrossRef]
- Kim, D.; Becknell, N.; Yu, Y.; Yang, P. Room-temperature dynamics of vanishing copper nanoparticles supported on silica. Nano Lett. 2017, 17, 2732–2737. [Google Scholar] [CrossRef]
- Morgan, K.; Goguet, A.; Hardacre, C. Metal redispersion strategies for recycling of supported metal catalysts: A perspective. ACS Catal. 2015, 5, 3430–3445. [Google Scholar] [CrossRef]
- Moliner, M.; Gabay, J.E.; Kliewer, C.E.; Carr, R.T.; Guzman, J.; Casty, G.L.; Serna, P.; Corma, A. Reversible transformation of Pt nanoparticles into single atoms inside high-silica chabazite zeolite. J. Am. Chem. Soc. 2016, 138, 15743–15750. [Google Scholar] [CrossRef]
- Dai, C.; Li, X.; Zhang, A.; Liu, C.; Song, C.; Guo, X. Pd and Pd-CuO nanoparticles in hollow silicalite-1 single crystals for enhancing selectivity and activity for the Suzuki-Miyaura reaction. RSC Adv. 2015, 5, 40297–40302. [Google Scholar] [CrossRef]
- Chary, K.V.; Naresh, D.; Vishwanathan, V.; Sadakane, M.; Ueda, W. Vapour phase hydrogenation of phenol over Pd/C catalysts: A relationship between dispersion, metal area and hydrogenation activity. Catal. Commun. 2007, 8, 471–477. [Google Scholar] [CrossRef]
- Nie, R.; Liang, D.; Shen, L.; Gao, J.; Chen, P.; Hou, Z. Selective oxidation of glycerol with oxygen in base-free solution over MWCNTs supported PtSb alloy nanoparticles. Appl. Catal. B Environ. 2012, 127, 212–220. [Google Scholar] [CrossRef]
Figure 1.
Transmission electron microscopy (TEM) images of the fresh Pt/S-1 (a), Pt@S-1 (b) catalysts, the oxygen calcinated Pt/S-1-300O2 (c), Pt@S-1-300O2 (d), Pt@S-1-700O2 (e) catalysts, the used Pt/S-1-300O2-800 (f), Pt@S-1-300O2-800 (g), Pt@S-1-700O2-800 (h) catalysts, and the corresponding particle size distribution of Pt nanoparticles.
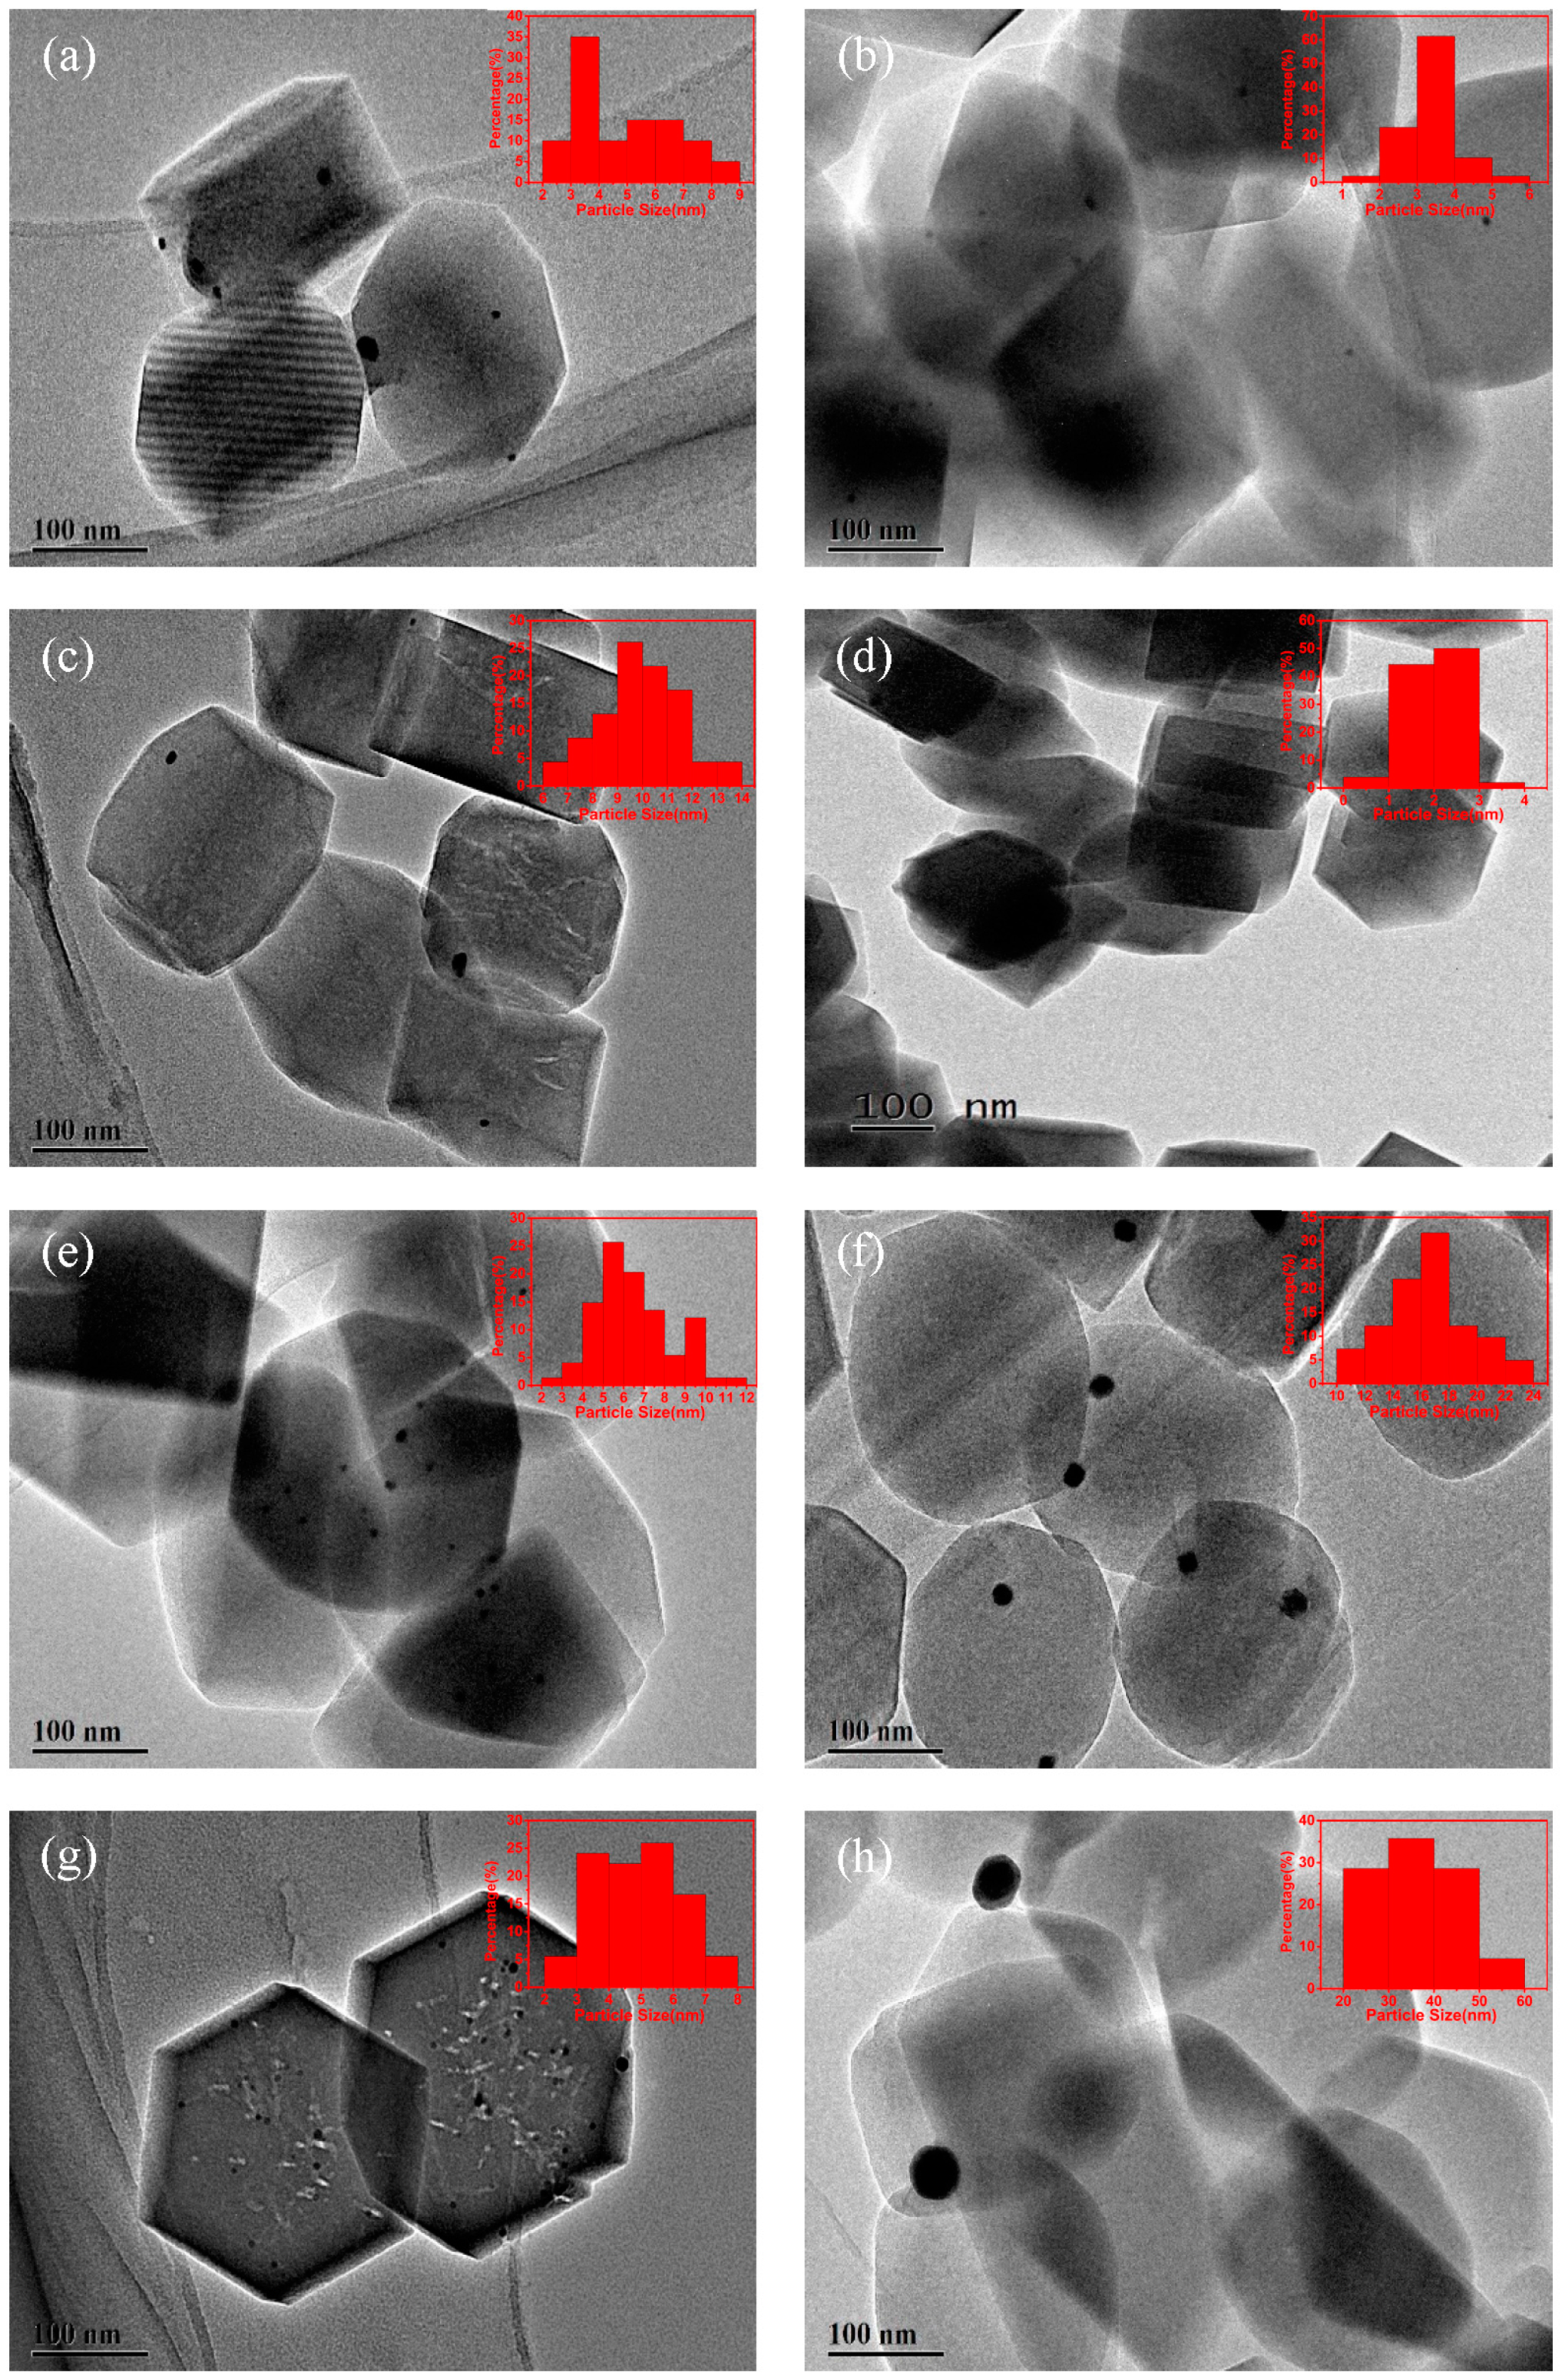
Figure 2.
Scanning transmission electron microscopy (STEM) images of the fresh Pt@S-1 sample and elemental mappings for Si, O, and Pt elements (a). Energy dispersive X-ray (EDX) spectrum of Pt@S-1 (b).
Figure 2.
Scanning transmission electron microscopy (STEM) images of the fresh Pt@S-1 sample and elemental mappings for Si, O, and Pt elements (a). Energy dispersive X-ray (EDX) spectrum of Pt@S-1 (b).

Figure 3.
TGA–DTG curves of the used Pt/S-1 (a) and Pt@S-1 (b) catalysts after reaction at 800 °C for 100 h.
Figure 3.
TGA–DTG curves of the used Pt/S-1 (a) and Pt@S-1 (b) catalysts after reaction at 800 °C for 100 h.
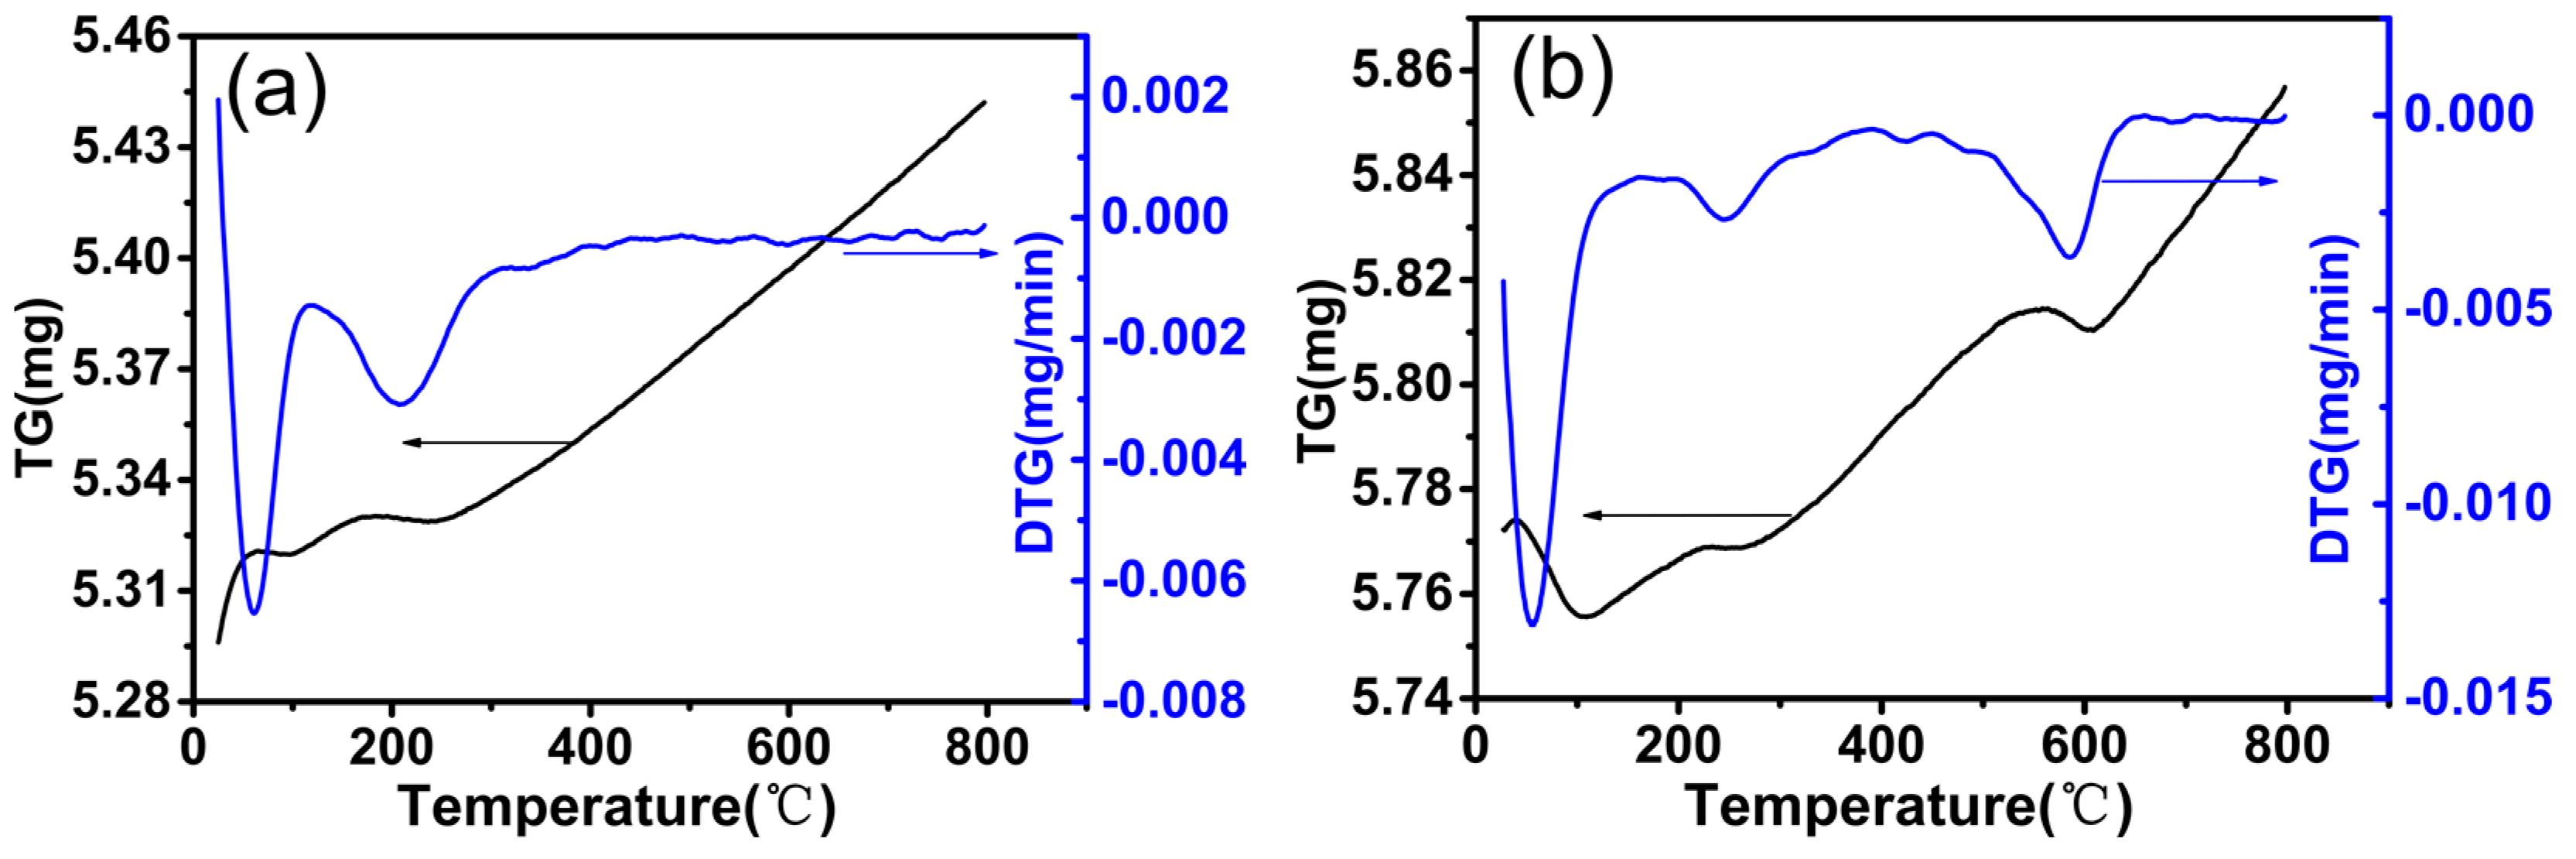
Figure 4.
CH4 conversion (a) and product selectivity (b) varied with time in the partial oxidation of methane (POM) reaction at 800 °C. GHSV = 14.4 L h−1 g−1, atmospheric pressure.
Figure 4.
CH4 conversion (a) and product selectivity (b) varied with time in the partial oxidation of methane (POM) reaction at 800 °C. GHSV = 14.4 L h−1 g−1, atmospheric pressure.
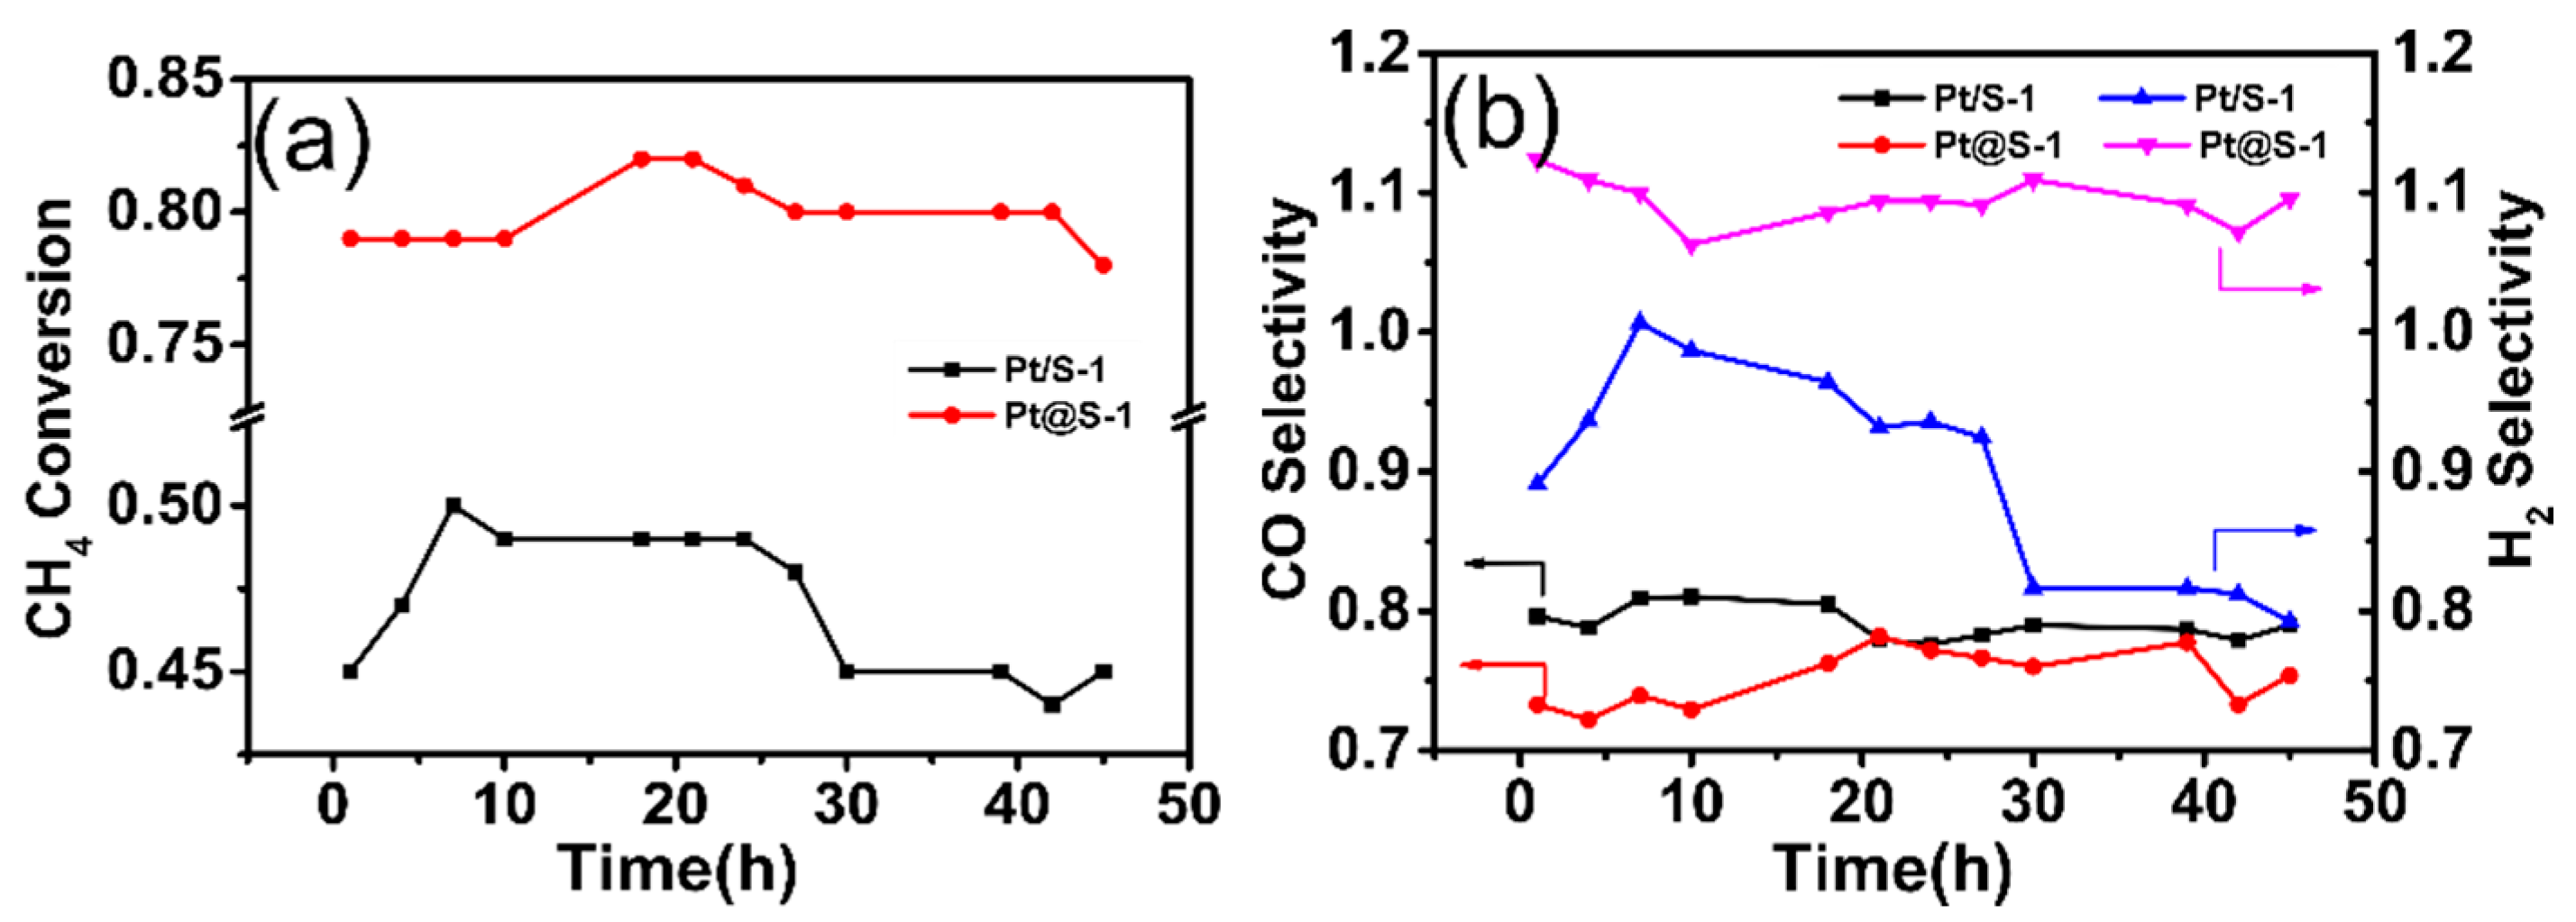
Figure 5.
The catalytic performance of the Pt@S-1 catalyst at various oxygen treatment temperature. CH4 conversion (a), CO selectivity (b) and H2 selectivity (c). GHSV = 14.4 L h−1 g−1, atmospheric pressure.
Figure 5.
The catalytic performance of the Pt@S-1 catalyst at various oxygen treatment temperature. CH4 conversion (a), CO selectivity (b) and H2 selectivity (c). GHSV = 14.4 L h−1 g−1, atmospheric pressure.

Figure 6.
The catalytic activity of Pt@S-1 catalyst in a range of 400–800 °C. GHSV = 14.4 L h−1 g−1, atmospheric pressure.
Figure 6.
The catalytic activity of Pt@S-1 catalyst in a range of 400–800 °C. GHSV = 14.4 L h−1 g−1, atmospheric pressure.

Table 1.
Composition and Pt dispersion.
| Catalyst | Pt Loading (wt %) a | Pt Dispersion b | CO Uptake (μmolg−1 cat) b | Particle Size (nm) | ||
|---|---|---|---|---|---|---|
| Pt Area (m2g−1 cat) | Dispersion (%) | CO b | TEM c | |||
| Pt/S-1 | 0.382 | 0.16 | 37.25 | 3.22 | 6.14 | 6.09 |
| Pt@S-1 | 0.312 | 0.24 | 86.49 | 5.08 | 3.57 | 3.67 |
| Pt@S-1-300O2 | 0.312 | 0.56 | 89.41 | 13.70 | 2.41 | 2.32 |
| Pt@S-1-700O2 | 0.312 | 0.12 | 31.72 | 2.74 | 7.57 | 7.54 |
a Determined by inductively coupled plasma (ICP) analysis. b Determined by CO chemisorption. c Calculated by TEM.
Table 2.
Textural properties of as-prepared samples.
| Sample | SBET (m2g−1) a | Smicro (m2g−1) b | Sext (m2g−1) b | Vtotal (cm3g−1) c | Vmicro (cm3g−1) d |
|---|---|---|---|---|---|
| S-1 | 460 | 283 | 176.48 | 0.37 | 0.11 |
| Pt/S-1 | 435 | 318 | 116.73 | 0.37 | 0.13 |
| Pt@S-1 | 374 | 235 | 139.43 | 0.27 | 0.09 |
a SBET (total surface area) calculated by applying the BET equation using the linear part (0.05 < P/P0 < 0.30) of the adsorption isotherm. b Smicro (micropore area) and Sext (external surface area) calculated using the t-plot method. c Vtotal (total pore volume) estimated by the adsorption capacity at P/P0 = 0.99. d Vmicro (micropore volume) determined by t-plot.
© 2019 by the authors. Licensee MDPI, Basel, Switzerland. This article is an open access article distributed under the terms and conditions of the Creative Commons Attribution (CC BY) license (http://creativecommons.org/licenses/by/4.0/).
Share and Cite
MDPI and ACS Style
Wang, J.; Ma, L.; Ding, C.; Xue, Y.; Zhang, Y.; Gao, Z. In Situ Encapsulated Pt Nanoparticles Dispersed in Low Temperature Oxygen for Partial Oxidation of Methane to Syngas. Catalysts 2019, 9, 720. https://doi.org/10.3390/catal9090720
AMA Style
Wang J, Ma L, Ding C, Xue Y, Zhang Y, Gao Z. In Situ Encapsulated Pt Nanoparticles Dispersed in Low Temperature Oxygen for Partial Oxidation of Methane to Syngas. Catalysts. 2019; 9(9):720. https://doi.org/10.3390/catal9090720
Chicago/Turabian StyleWang, Junwen, Lichao Ma, Chuanmin Ding, Yanan Xue, Yongkang Zhang, and Zhiting Gao. 2019. "In Situ Encapsulated Pt Nanoparticles Dispersed in Low Temperature Oxygen for Partial Oxidation of Methane to Syngas" Catalysts 9, no. 9: 720. https://doi.org/10.3390/catal9090720
Note that from the first issue of 2016, this journal uses article numbers instead of page numbers. See further details here.