The Photothermal Stability Study of Quantum Dots Embedded in Sodium Chlorides

 ,
, 

Abstract
:1. Introduction
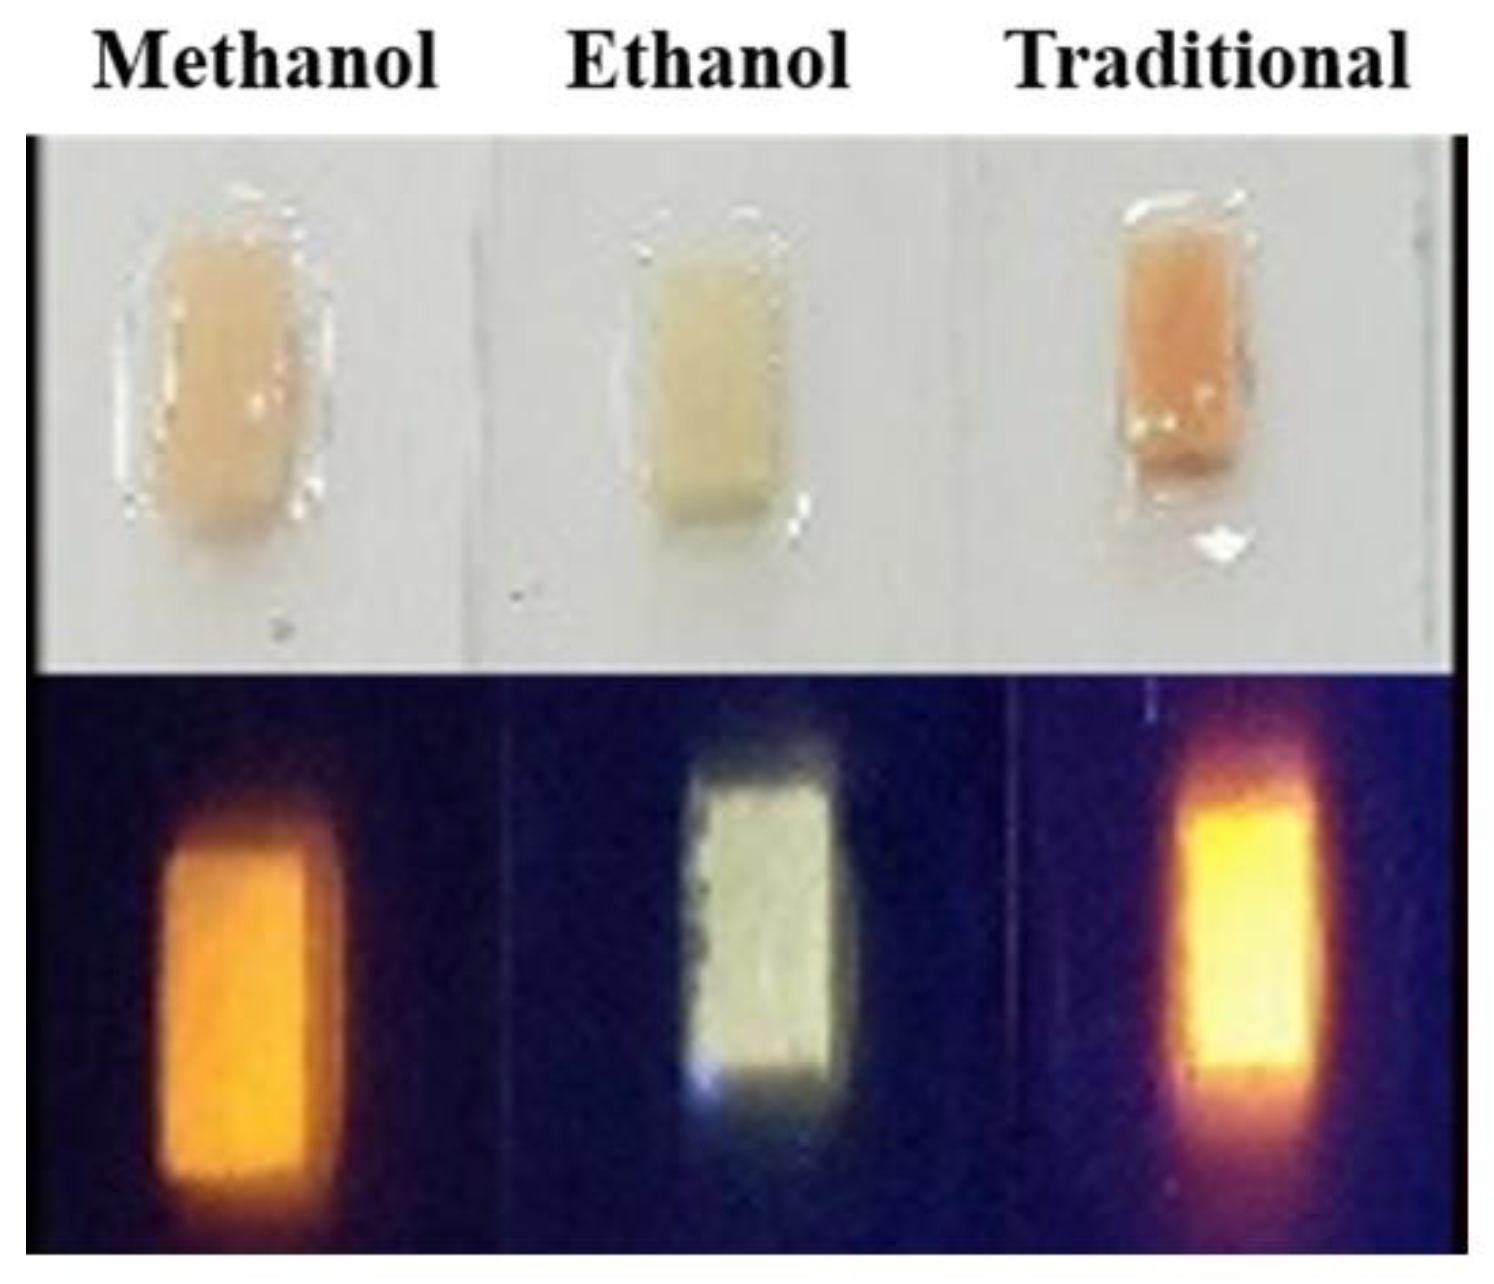
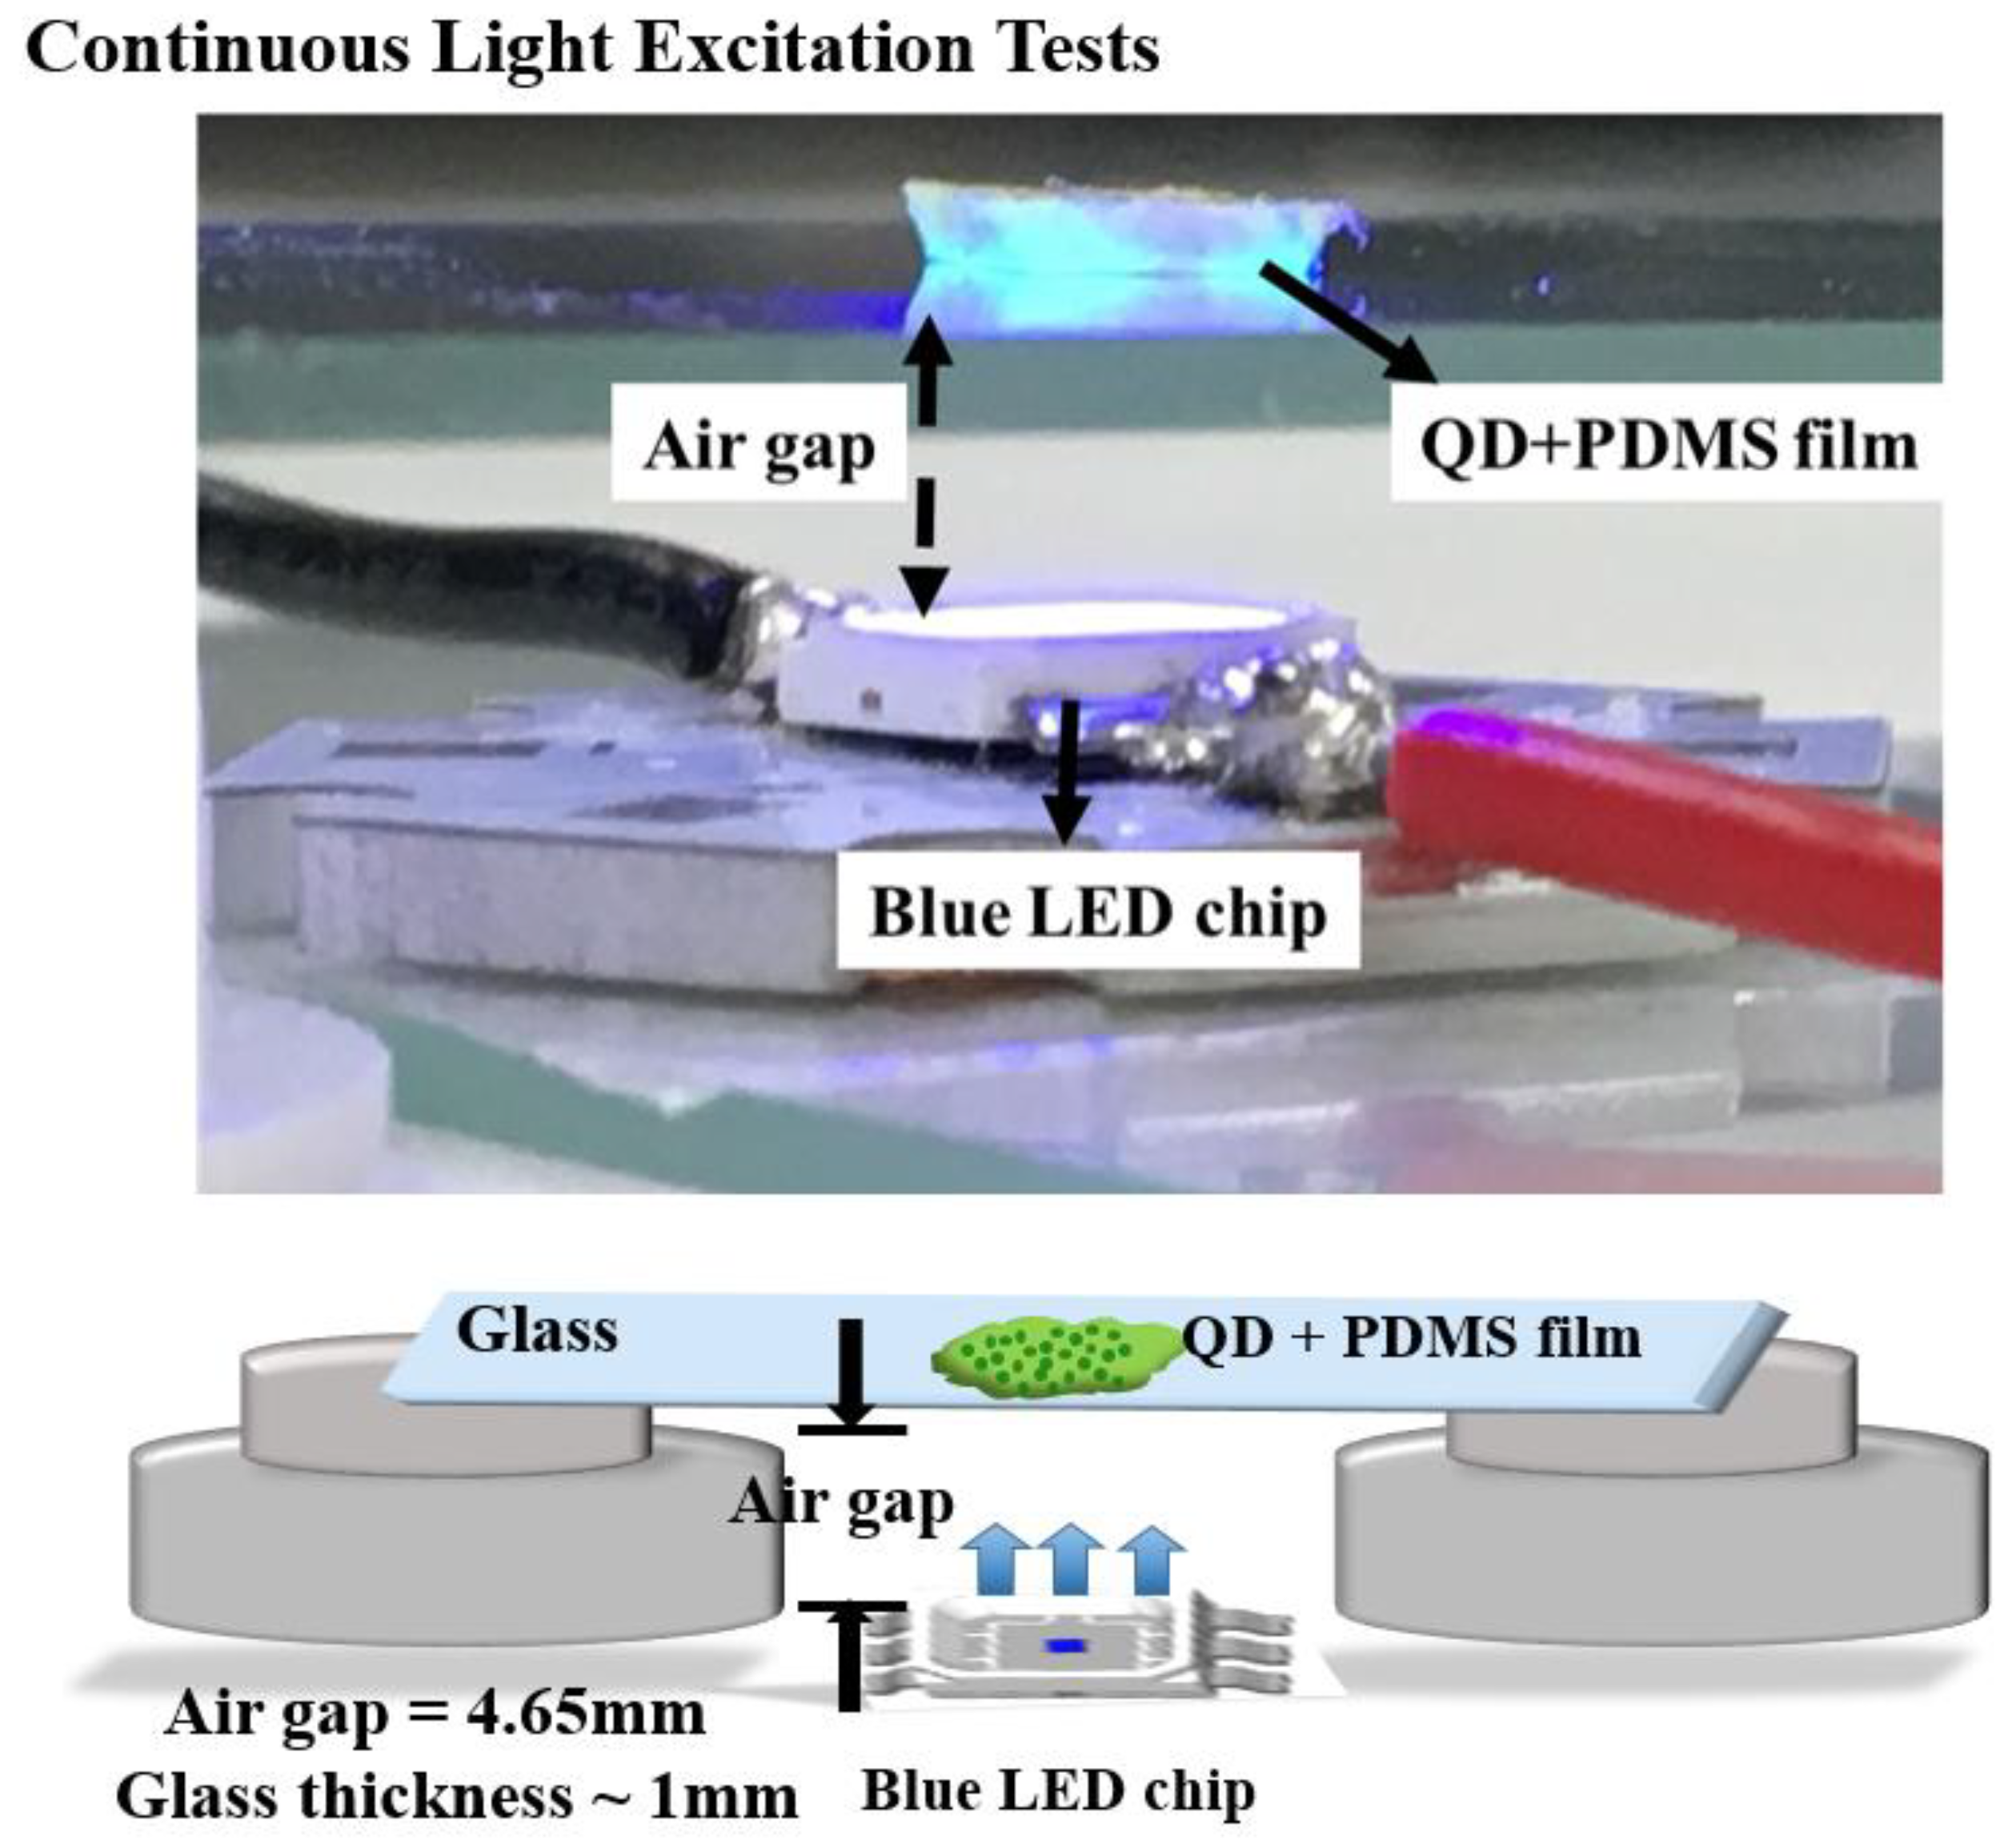
2. Sample Preparation and Experiment
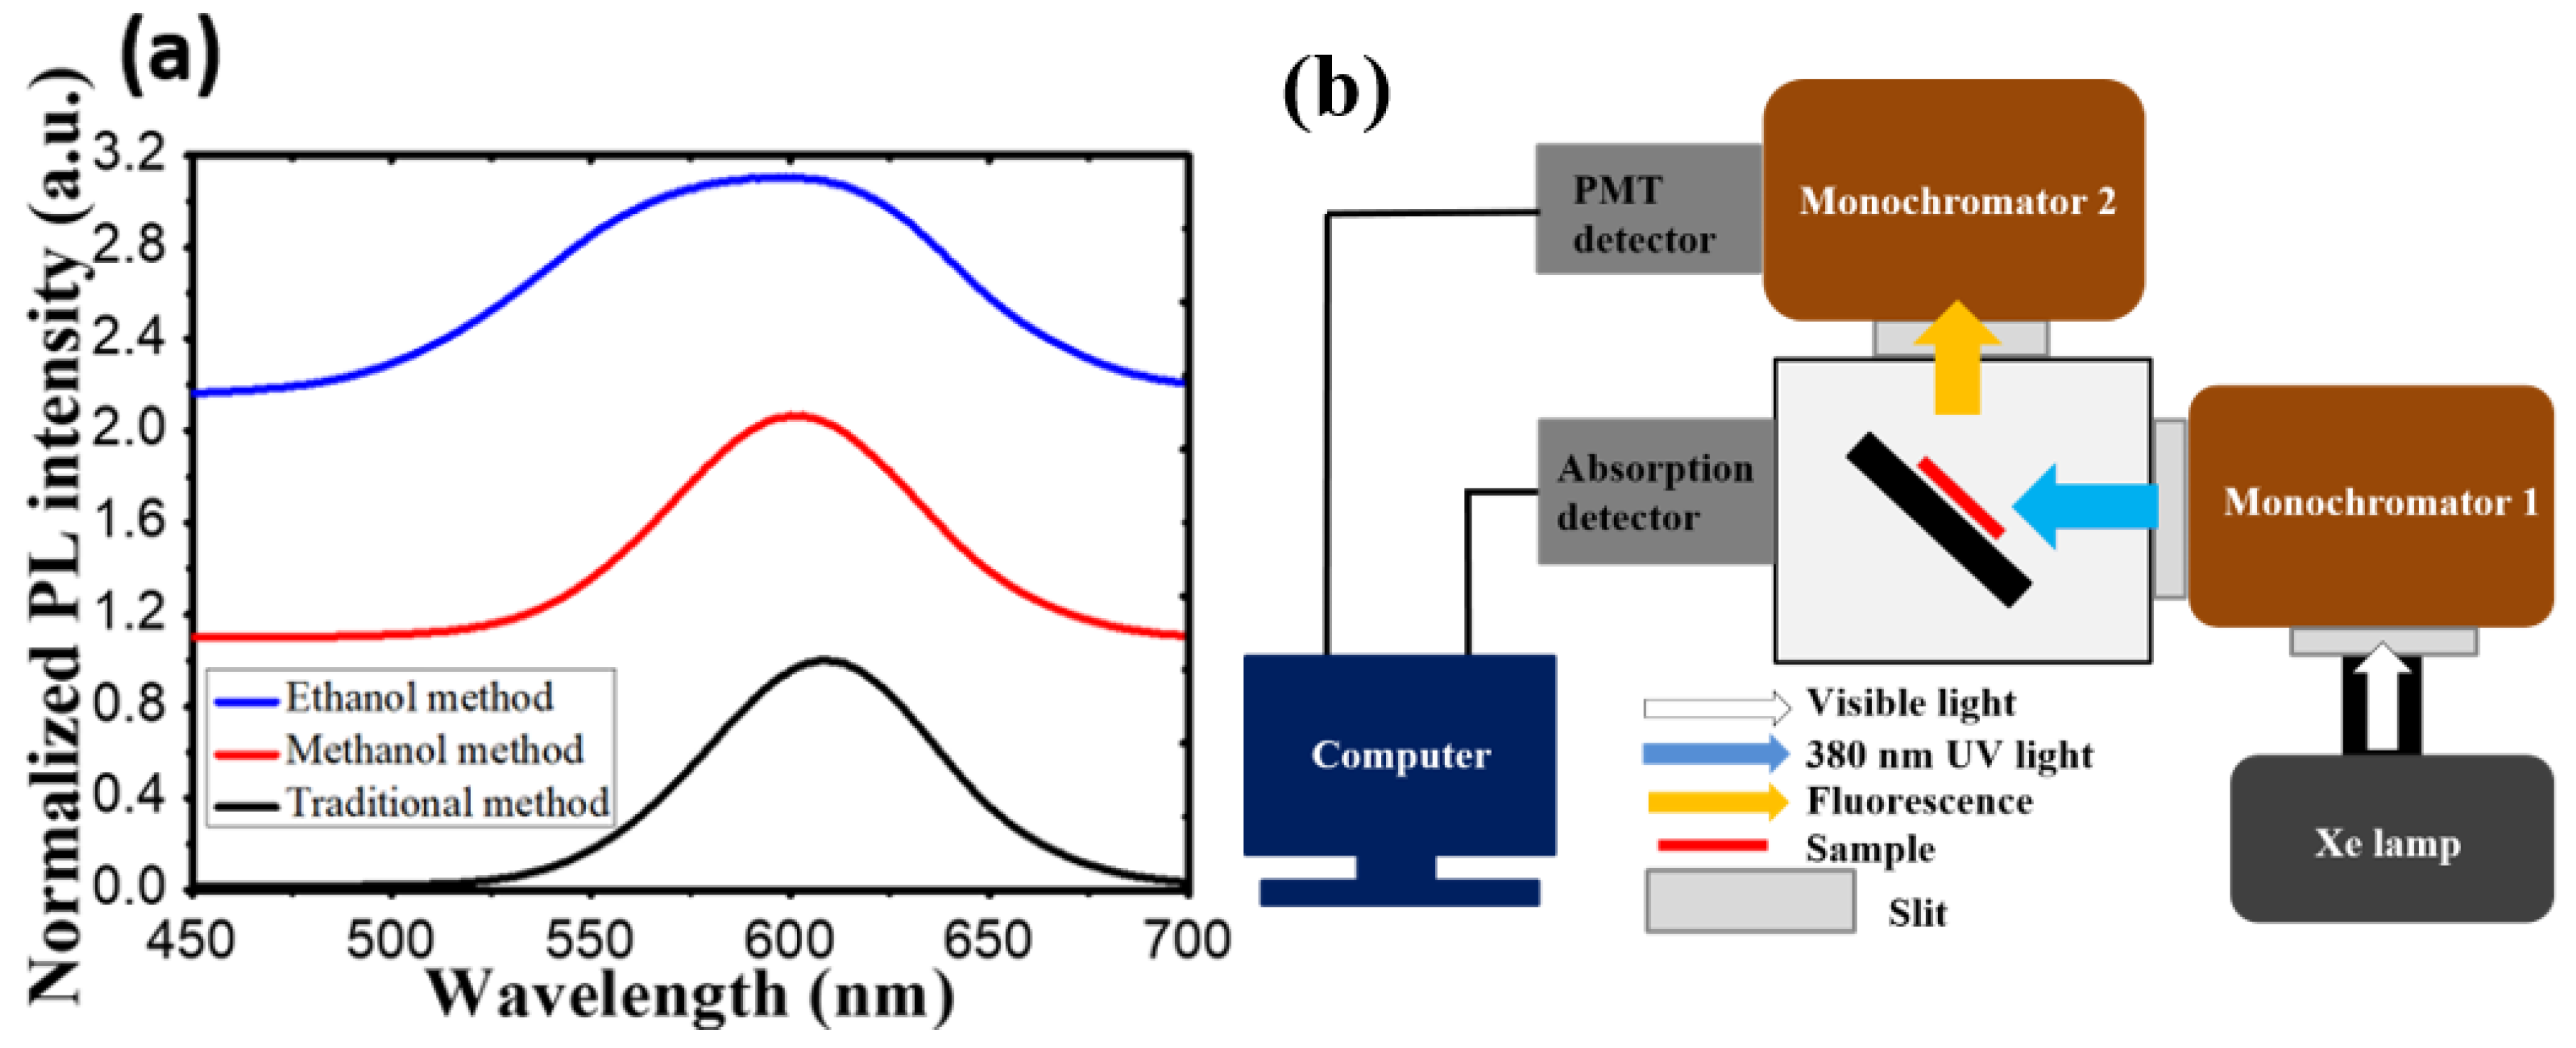
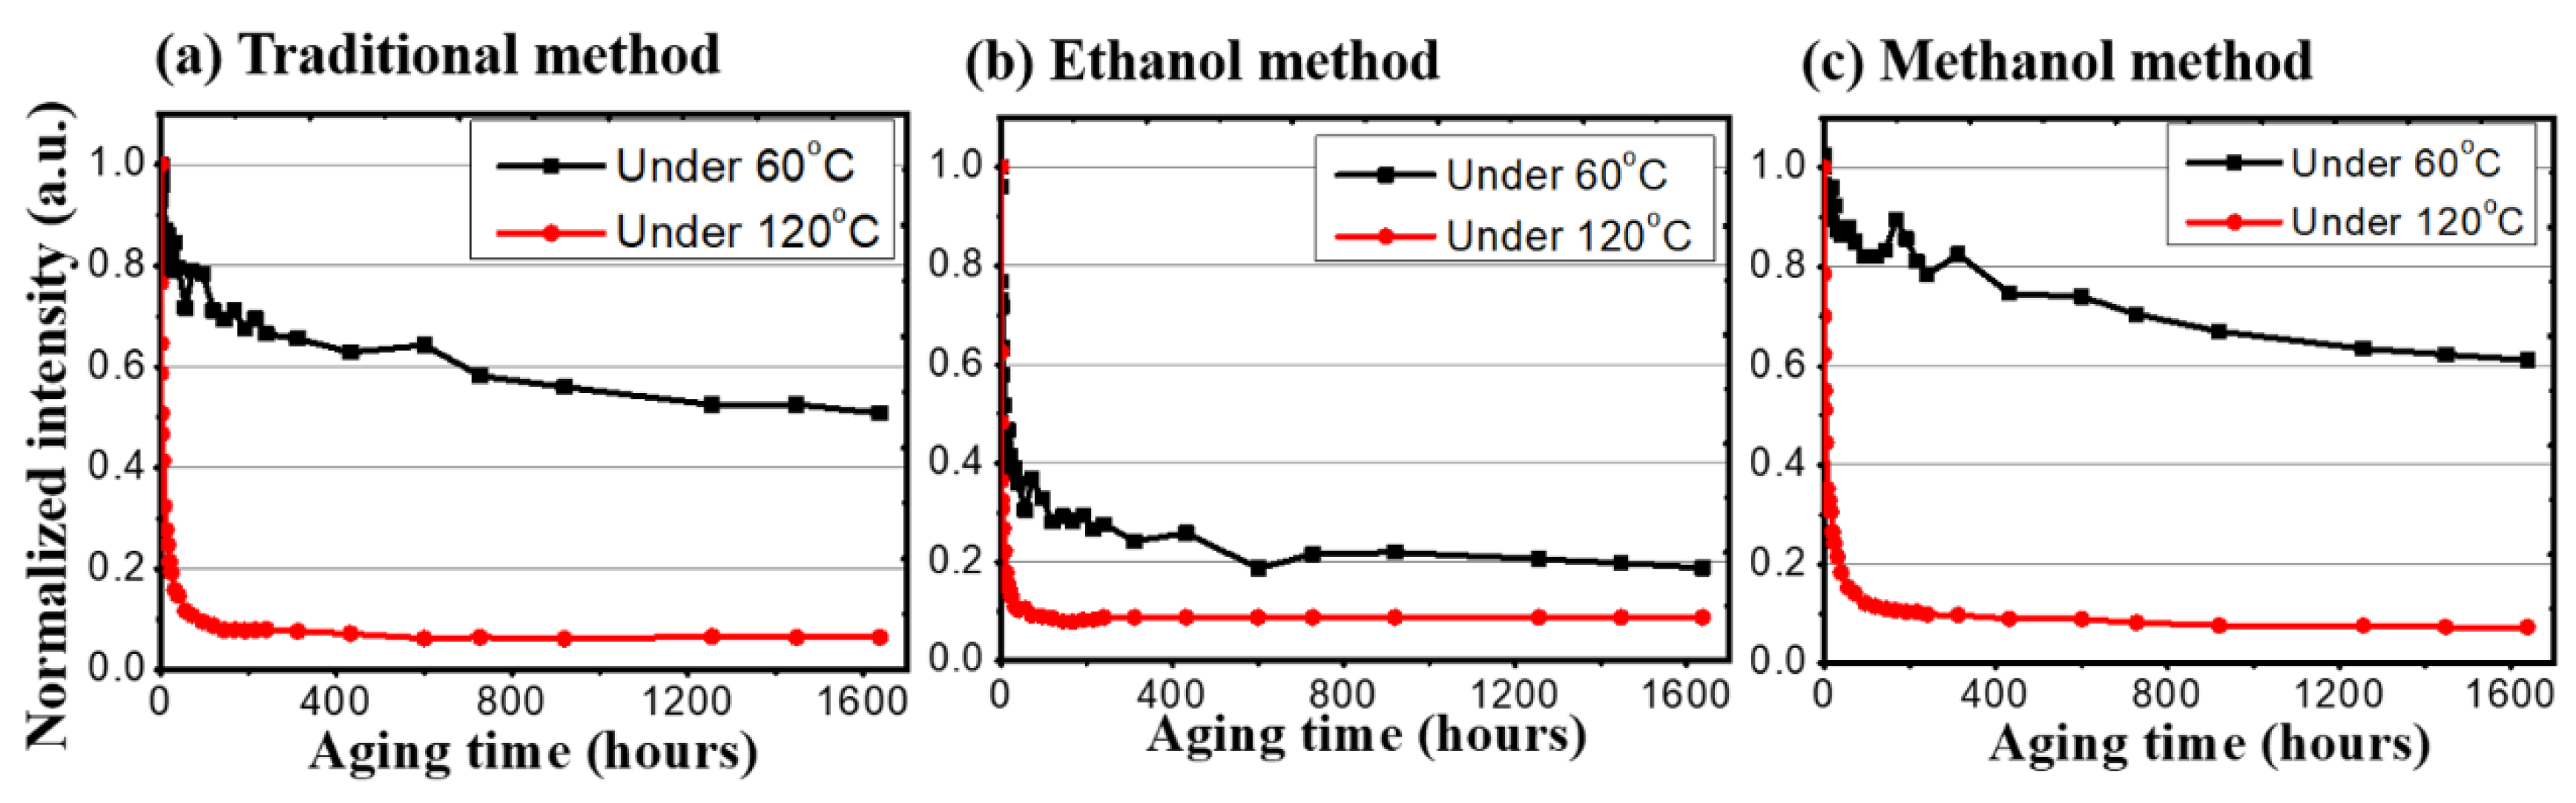
3. Results and Discussion
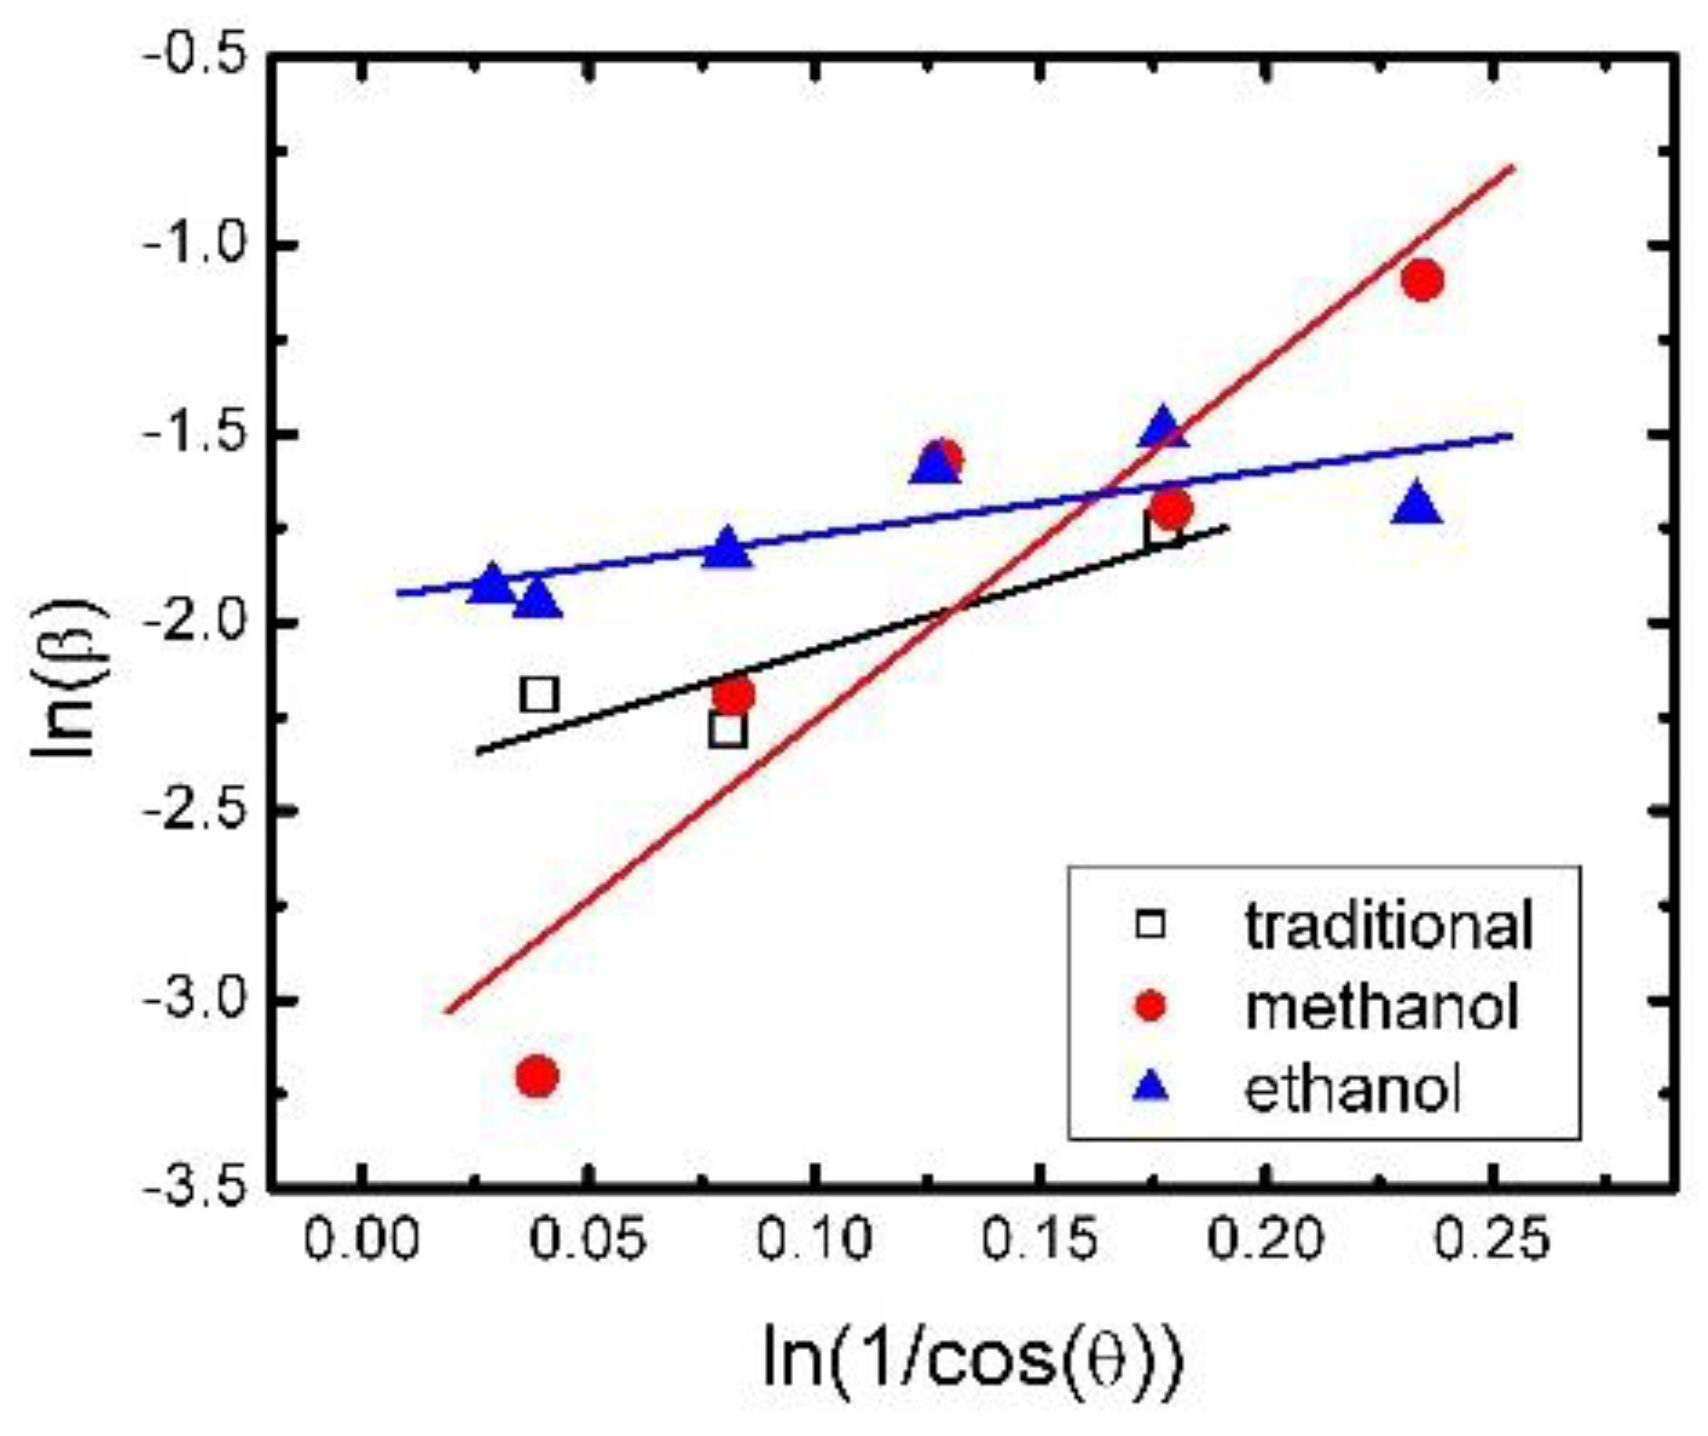
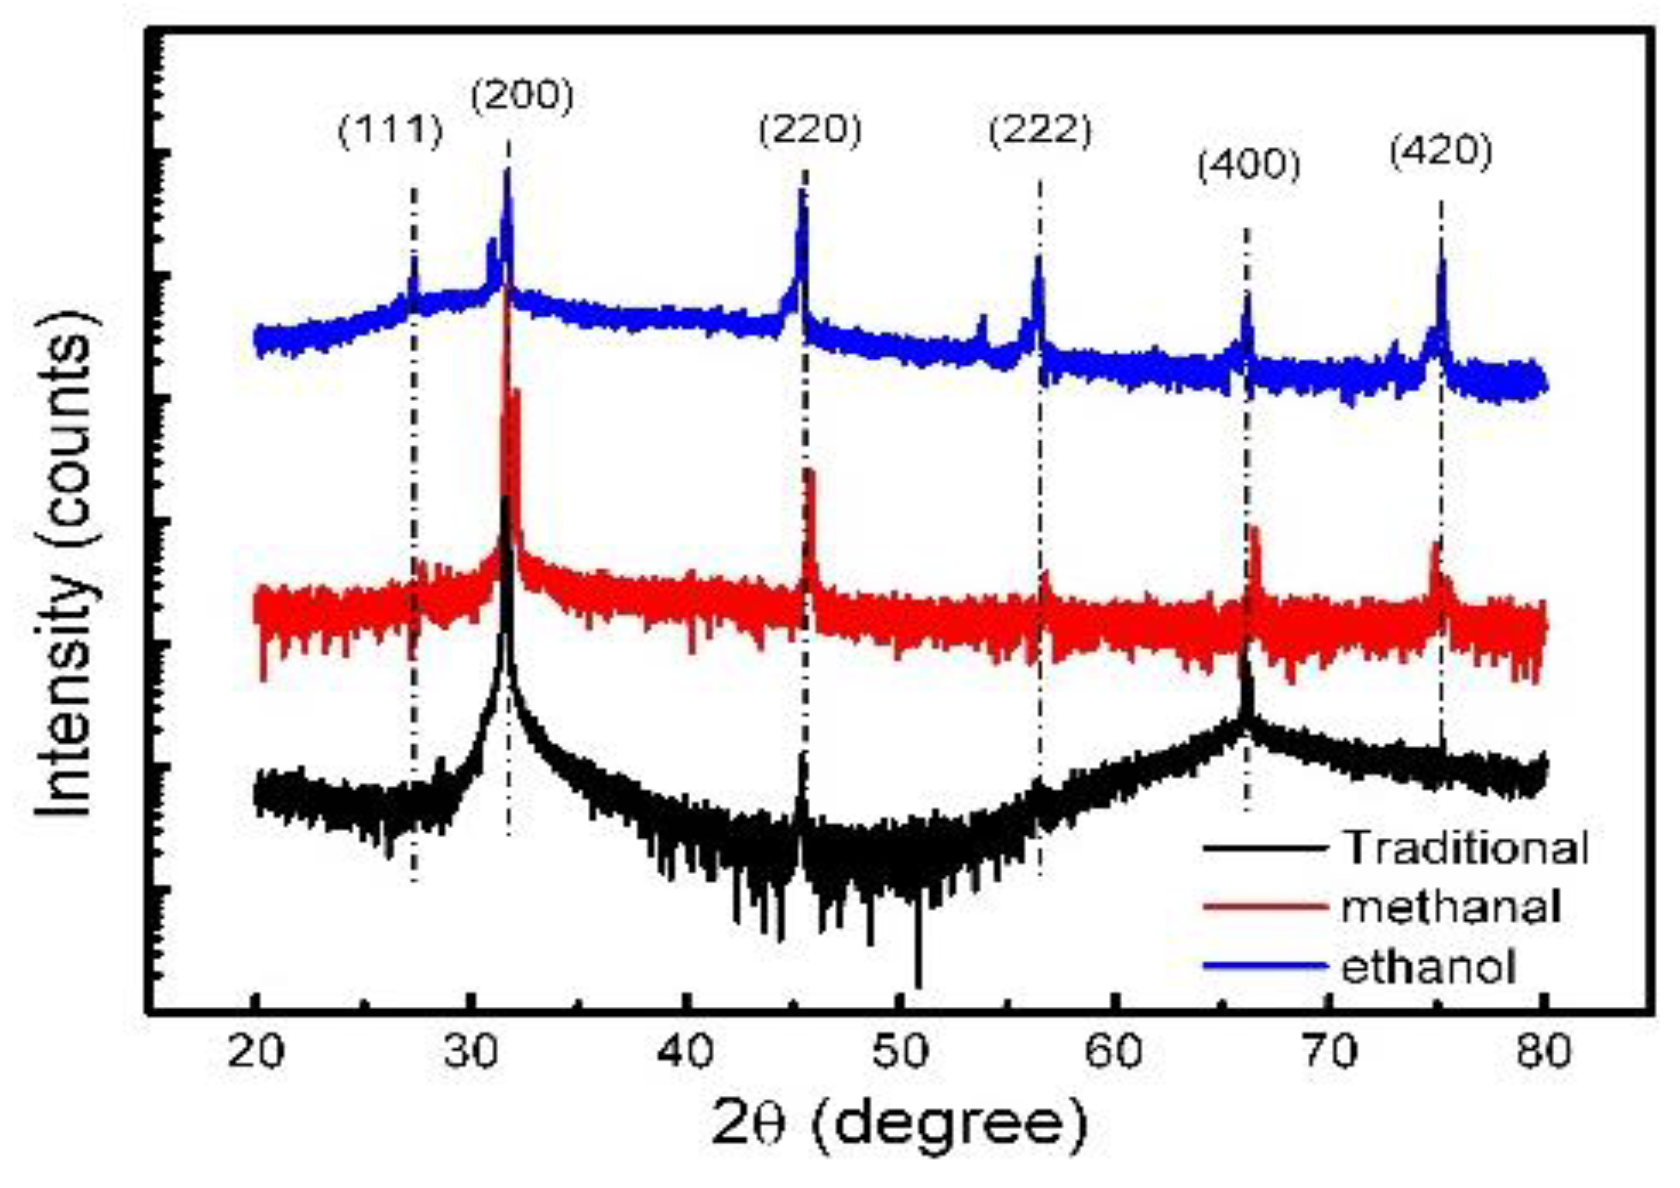
4. Micro-Scale Crystal Analysis
5. Conclusions
Author Contributions
Funding
Conflicts of Interest
References
- Pal, B.N.; Ghosh, Y.; Brovelli, S.; Laocharoensuk, R.; Klimov, V.; Hollingsworth, J.A.; Htoon, H. ‘Giant’CdSe/CdS core/shell nanocrystal quantum dots as efficient electroluminescent materials: Strong influence of shell thickness on light-emitting diode performance. Nano Lett. 2011, 12, 331–336. [Google Scholar] [CrossRef] [PubMed]
- Sun, C.; Zhang, Y.; Ruan, C.; Yin, C.; Wang, X.; Wang, Y.; Yu, W.W. Efficient and Stable White LEDs with Silica-Coated Inorganic Perovskite Quantum Dots. Adv. Mater. 2016, 28, 10088–10094. [Google Scholar] [CrossRef] [PubMed]
- Lee, K.-H.; Han, C.-Y.; Kang, H.-D.; Ko, H.; Lee, C.; Lee, J.; Myoung, N.; Yim, S.-Y.; Yang, H. Highly efficient, color-reproducible full-color electroluminescent devices based on red/green/blue quantum dot-mixed multilayer. ACS nano 2015, 9, 10941–10949. [Google Scholar] [CrossRef] [PubMed]
- Hsu, S.-C.; Chen, Y.-H.; Tu, Z.-Y.; Han, H.-V.; Lin, S.-L.; Chen, T.-M.; Kuo, H.-C.; Lin, C.-C. Highly stable and efficient hybrid quantum dot light-emitting diodes. IEEE Photonics J. 2015, 7, 1–10. [Google Scholar] [CrossRef]
- Guzelturk, B.; Kelestemur, Y.; Olutas, M.; Delikanli, S.; Demir, H.V. Amplified spontaneous emission and lasing in colloidal nanoplatelets. Acs Nano 2014, 8, 6599–6605. [Google Scholar] [CrossRef] [PubMed]
- Demir, H.V.; Nizamoglu, S.; Erdem, T.; Mutlugun, E.; Gaponik, N.; Eychmüller, A. Quantum dot integrated LEDs using photonic and excitonic color conversion. Nano Today 2011, 6, 632–647. [Google Scholar] [CrossRef]
- Klimov, V.I.; Ivanov, S.A.; Nanda, J.; Achermann, M.; Bezel, I.; McGuire, J.A.; Piryatinski, A. Single-exciton optical gain in semiconductor nanocrystals. Nature 2007, 447, 441. [Google Scholar] [CrossRef]
- Klimov, V.; Mikhailovsky, A.; Xu, S.; Malko, A.; Hollingsworth, J.; Leatherdale, C.; Eisler, H.-J.; Bawendi, M. Optical gain and stimulated emission in nanocrystal quantum dots. Science 2000, 290, 314–317. [Google Scholar] [CrossRef] [Green Version]
- Chen, B.; Zhong, H.; Zhang, W.; Tan, Z.; Li, Y.; Yu, C.; Zhai, T.; Bando, Y.; Yang, S.; Zou, B. Highly emissive and color-tunable CuInS2-based colloidal semiconductor nanocrystals: Off-stoichiometry effects and improved electroluminescence performance. Adv. Funct. Mater. 2012, 22, 2081–2088. [Google Scholar] [CrossRef]
- Dai, Q.; Duty, C.E.; Hu, M.Z. Semiconductor-Nanocrystals-Based White Light-Emitting Diodes. small 2010, 6, 1577–1588. [Google Scholar] [CrossRef]
- Zhang, Y.; Xie, C.; Su, H.; Liu, J.; Pickering, S.; Wang, J.; Wang, Y.; Hahm, J.-I. Employing heavy metal-free colloidal quantum dots in solution-processed white light-emitting diodes. Nano Lett. 2010, 11, 329–332. [Google Scholar] [CrossRef] [PubMed]
- Alivisatos, A.P. Semiconductor clusters, nanocrystals, and quantum dots. Science 1996, 271, 933–937. [Google Scholar] [CrossRef] [Green Version]
- Rogach, A.L.; Gaponik, N.; Lupton, J.M.; Bertoni, C.; Gallardo, D.E.; Dunn, S.; Li Pira, N.; Paderi, M.; Repetto, P.; Romanov, S.G. Light-emitting diodes with semiconductor nanocrystals. Angew. Chem. Int. Ed. 2008, 47, 6538–6549. [Google Scholar] [CrossRef] [PubMed]
- Su, L.; Zhang, X.; Zhang, Y.; Rogach, A.L. Recent progress in quantum dot based white light-emitting devices. In Photoactive Semiconductor Nanocrystal Quantum Dots; Springer: Cham, Switzerland, 2017; pp. 123–147. [Google Scholar]
- Shirasaki, Y.; Supran, G.J.; Bawendi, M.G.; Bulović, V. Emergence of colloidal quantum-dot light-emitting technologies. Nat. Photonics 2013, 7, 13. [Google Scholar] [CrossRef]
- Nazzal, A.Y.; Wang, X.; Qu, L.; Yu, W.; Wang, Y.; Peng, X.; Xiao, M. Environmental effects on photoluminescence of highly luminescent CdSe and CdSe/ZnS core/shell nanocrystals in polymer thin films. J. Phys. Chem. B 2004, 108, 5507–5515. [Google Scholar] [CrossRef]
- Jang, E.; Jun, S.; Jang, H.; Lim, J.; Kim, B.; Kim, Y. White-light-emitting diodes with quantum dot color converters for display backlights. Adv. Mater. 2010, 22, 3076–3080. [Google Scholar] [CrossRef]
- Ihly, R.; Tolentino, J.; Liu, Y.; Gibbs, M.; Law, M. The photothermal stability of PbS quantum dot solids. ACS Nano 2011, 5, 8175–8186. [Google Scholar] [CrossRef]
- Sher, C.-W.; Lin, C.-H.; Lin, H.-Y.; Lin, C.-C.; Huang, C.-H.; Chen, K.-J.; Li, J.-R.; Wang, K.-Y.; Tu, H.-H.; Fu, C.-C. A high quality liquid-type quantum dot white light-emitting diode. Nanoscale 2015, 8, 1117–1122. [Google Scholar] [CrossRef]
- Ziegler, J.; Xu, S.; Kucur, E.; Meister, F.; Batentschuk, M.; Gindele, F.; Nann, T. Silica-coated InP/ZnS nanocrystals as converter material in white LEDs. Adv. Mater. 2008, 20, 4068–4073. [Google Scholar] [CrossRef]
- Adam, M.; Wang, Z.; Dubavik, A.; Stachowski, G.M.; Meerbach, C.; Soran-Erdem, Z.; Rengers, C.; Demir, H.V.; Gaponik, N.; Eychmüller, A. Liquid–Liquid Diffusion-Assisted Crystallization: A Fast and Versatile Approach Toward High Quality Mixed Quantum Dot-Salt Crystals. Adv. Funct. Mater. 2015, 25, 2638–2645. [Google Scholar] [CrossRef] [Green Version]
- Kalytchuk, S.; Zhovtiuk, O.; Rogach, A.L. Sodium chloride protected CdTe quantum dot based solid-state luminophores with high color quality and fluorescence efficiency. Appl. Phys. Lett. 2013, 103, 103105. [Google Scholar] [CrossRef]
- Hsu, S.-C.; Ke, L.-A.; Lin, H.-C.; Chen, T.-M.; Lin, H.-Y.; Chen, Y.-Z.; Chueh, Y.-L.; Kuo, H.-C.; Lin, C.-C. Fabrication of a highly stable white light-emitting diode with multiple-layer colloidal quantum dots. IEEE J. Sel. Top. in Quantum Electron. 2017, 23, 1–9. [Google Scholar] [CrossRef]
- Otto, T.; Müller, M.; Mundra, P.; Lesnyak, V.; Demir, H.V.; Gaponik, N.; Eychmüller, A. Colloidal nanocrystals embedded in macrocrystals: Robustness, photostability, and color purity. Nano Lett. 2012, 12, 5348–5354. [Google Scholar] [CrossRef] [Green Version]
- Chang, Y.; Yao, X.; Mi, L.; Li, G.; Wang, S.; Wang, H.; Zhang, Z.; Jiang, Y. A water–ethanol phase assisted co-precipitation approach toward high quality quantum dot–inorganic salt composites and their application for WLEDs. Green Chem. 2015, 17, 4439–4445. [Google Scholar] [CrossRef]
- O’Donnell, K.; Chen, X. Temperature dependence of semiconductor band gaps. Appl. Phys. Lett. 1991, 58, 2924–2926. [Google Scholar] [CrossRef] [Green Version]
- Crooker, S.; Hollingsworth, J.; Tretiak, S.; Klimov, V.I. Spectrally resolved dynamics of energy transfer in quantum-dot assemblies: Towards engineered energy flows in artificial materials. Phys. Rev. Lett. 2002, 89, 186802. [Google Scholar] [CrossRef] [Green Version]
- Monshi, A.; Foroughi, M.R.; Monshi, M.R. Modified Scherrer equation to estimate more accurately nano-crystallite size using XRD. World J. Nano Sci. Eng. 2012, 2, 154–160. [Google Scholar] [CrossRef] [Green Version]


| Methods | 20mA (7.65 mW) | 200mA (69.6 mW) | 60 °C | 120 °C |
|---|---|---|---|---|
| Methanol | 14103 | 2489 | 3287 | 3.41 |
| Ethanol | 3 | 0.56 | 8 | 0.5 |
| Traditional | 23310 | 17328 | 1948 | 3 |
| Methods | Methanol | Ethanol | Traditional |
|---|---|---|---|
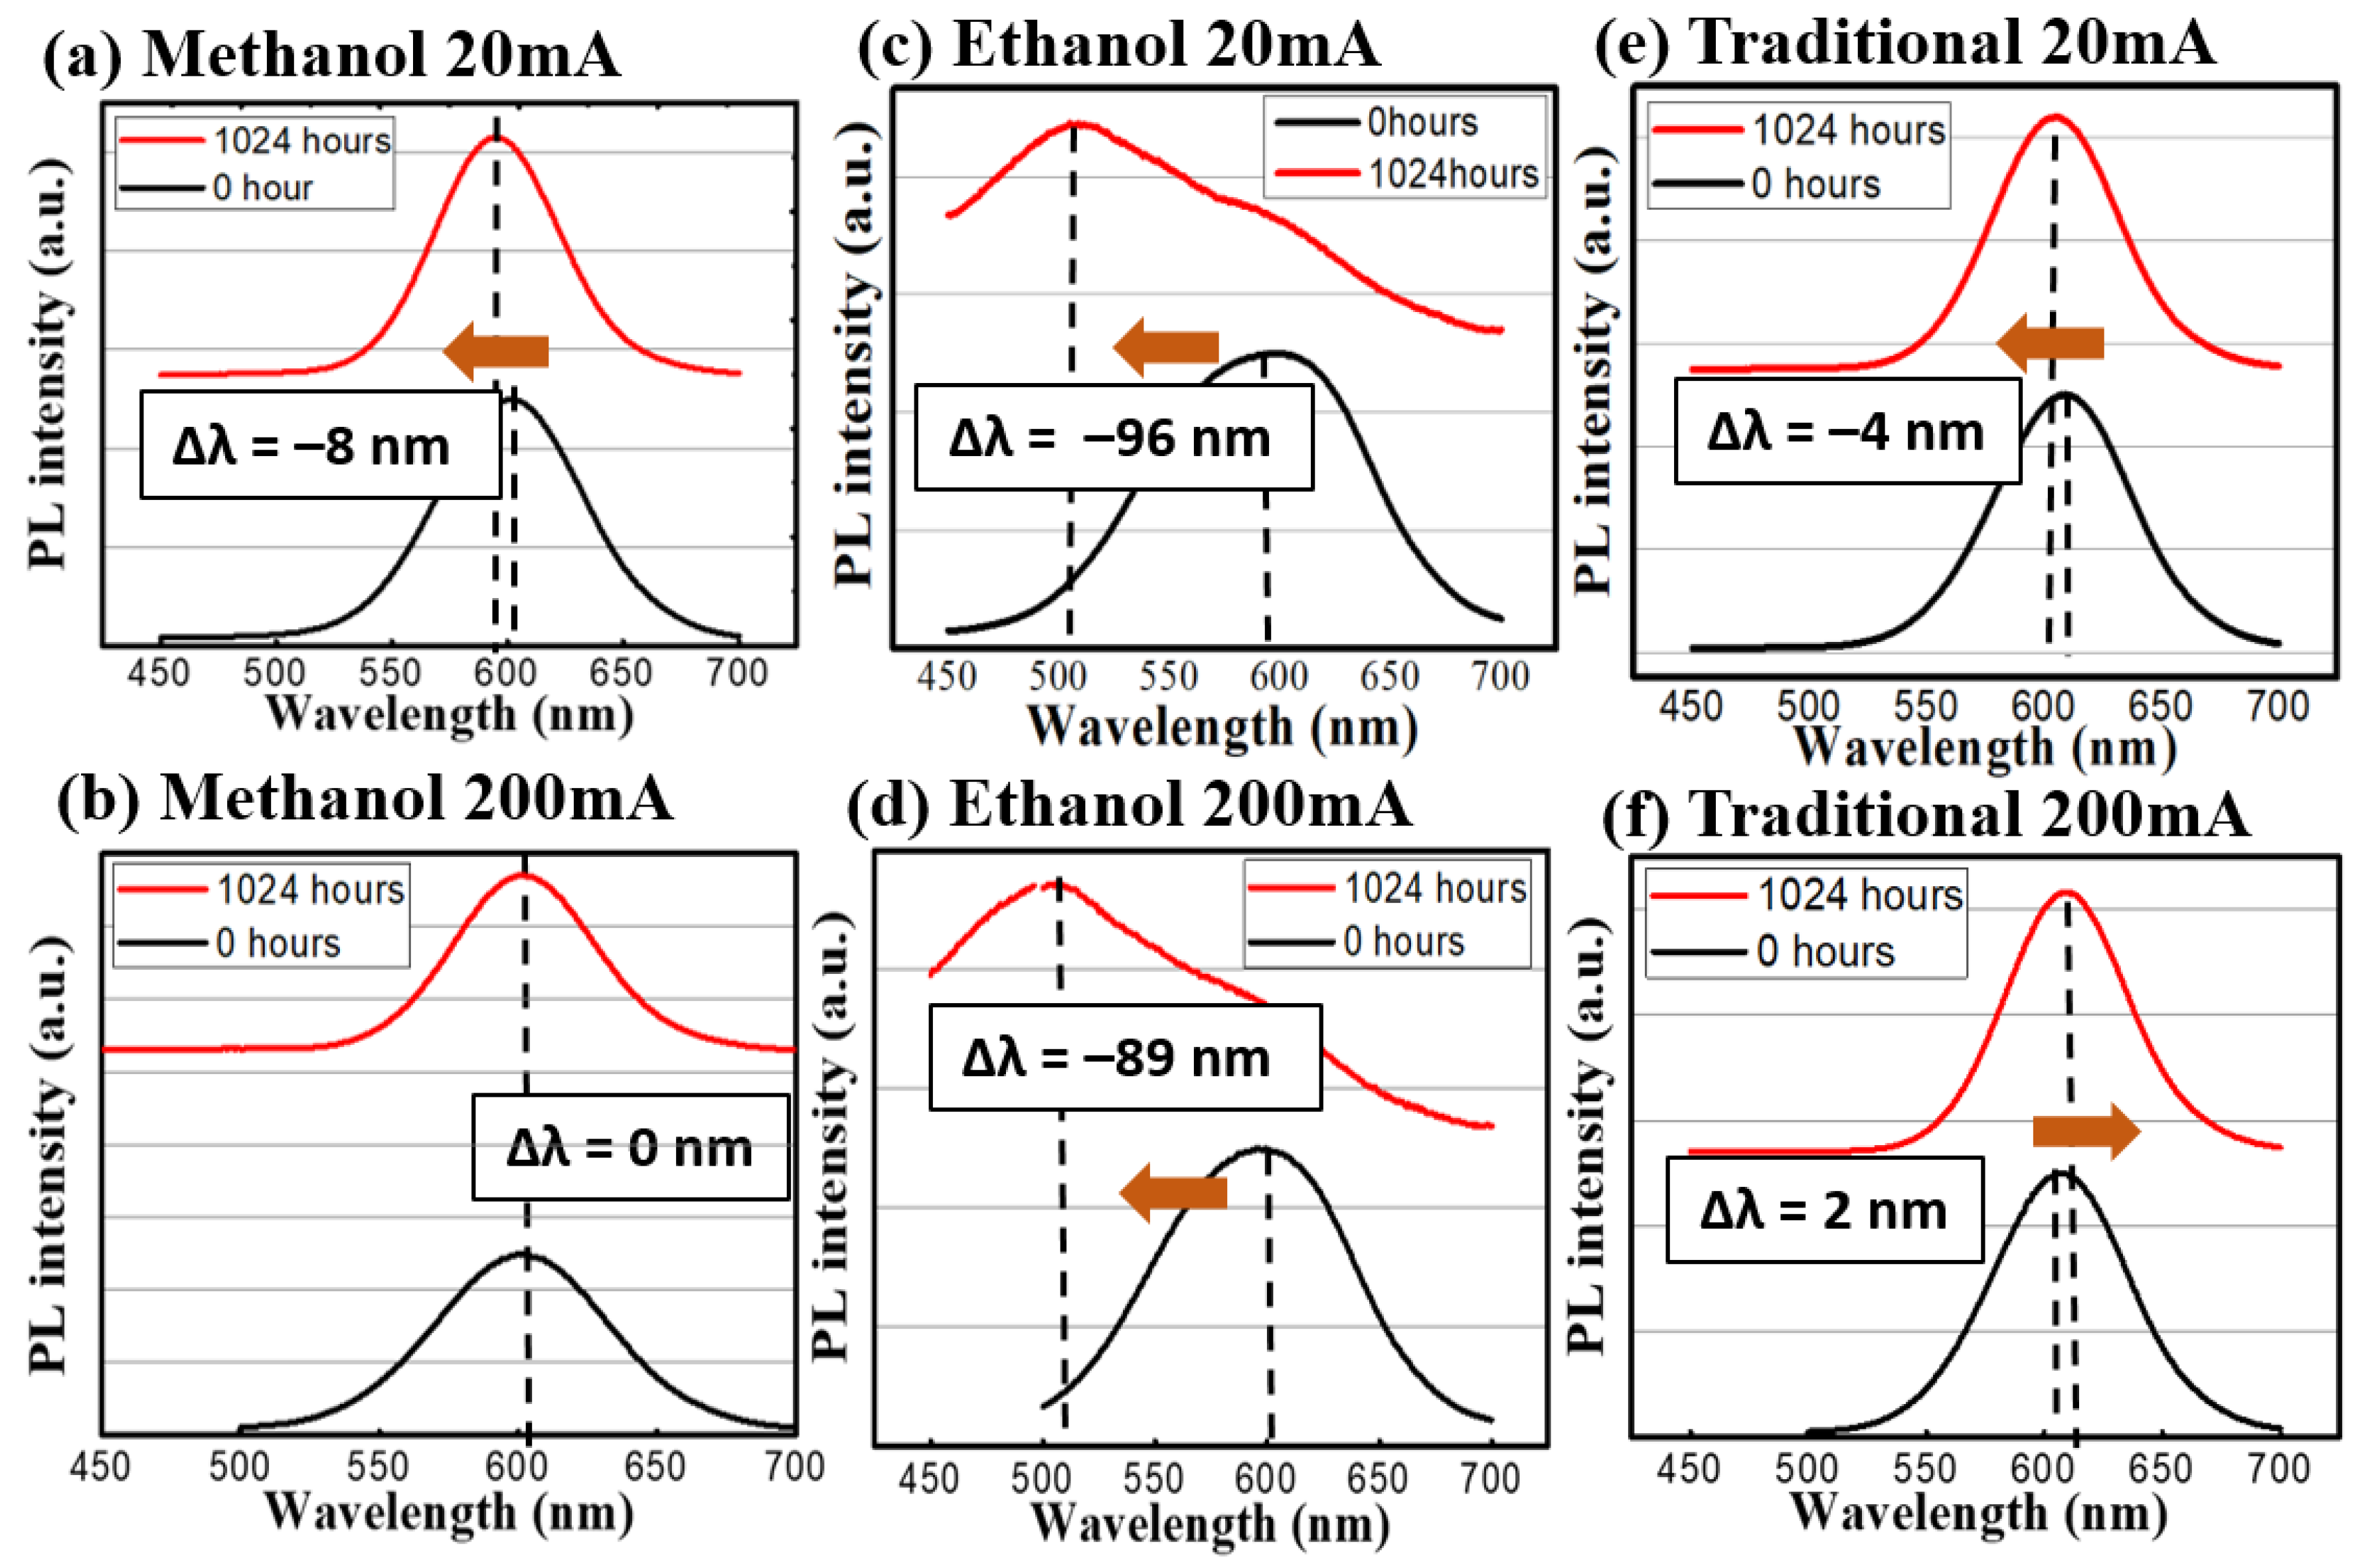
| Δλ 20 mA (7.65 mW) | −8 | −96 | −4 |
| Δλ 200 mA (69.6 mW) | 0 | −89 | 2 |
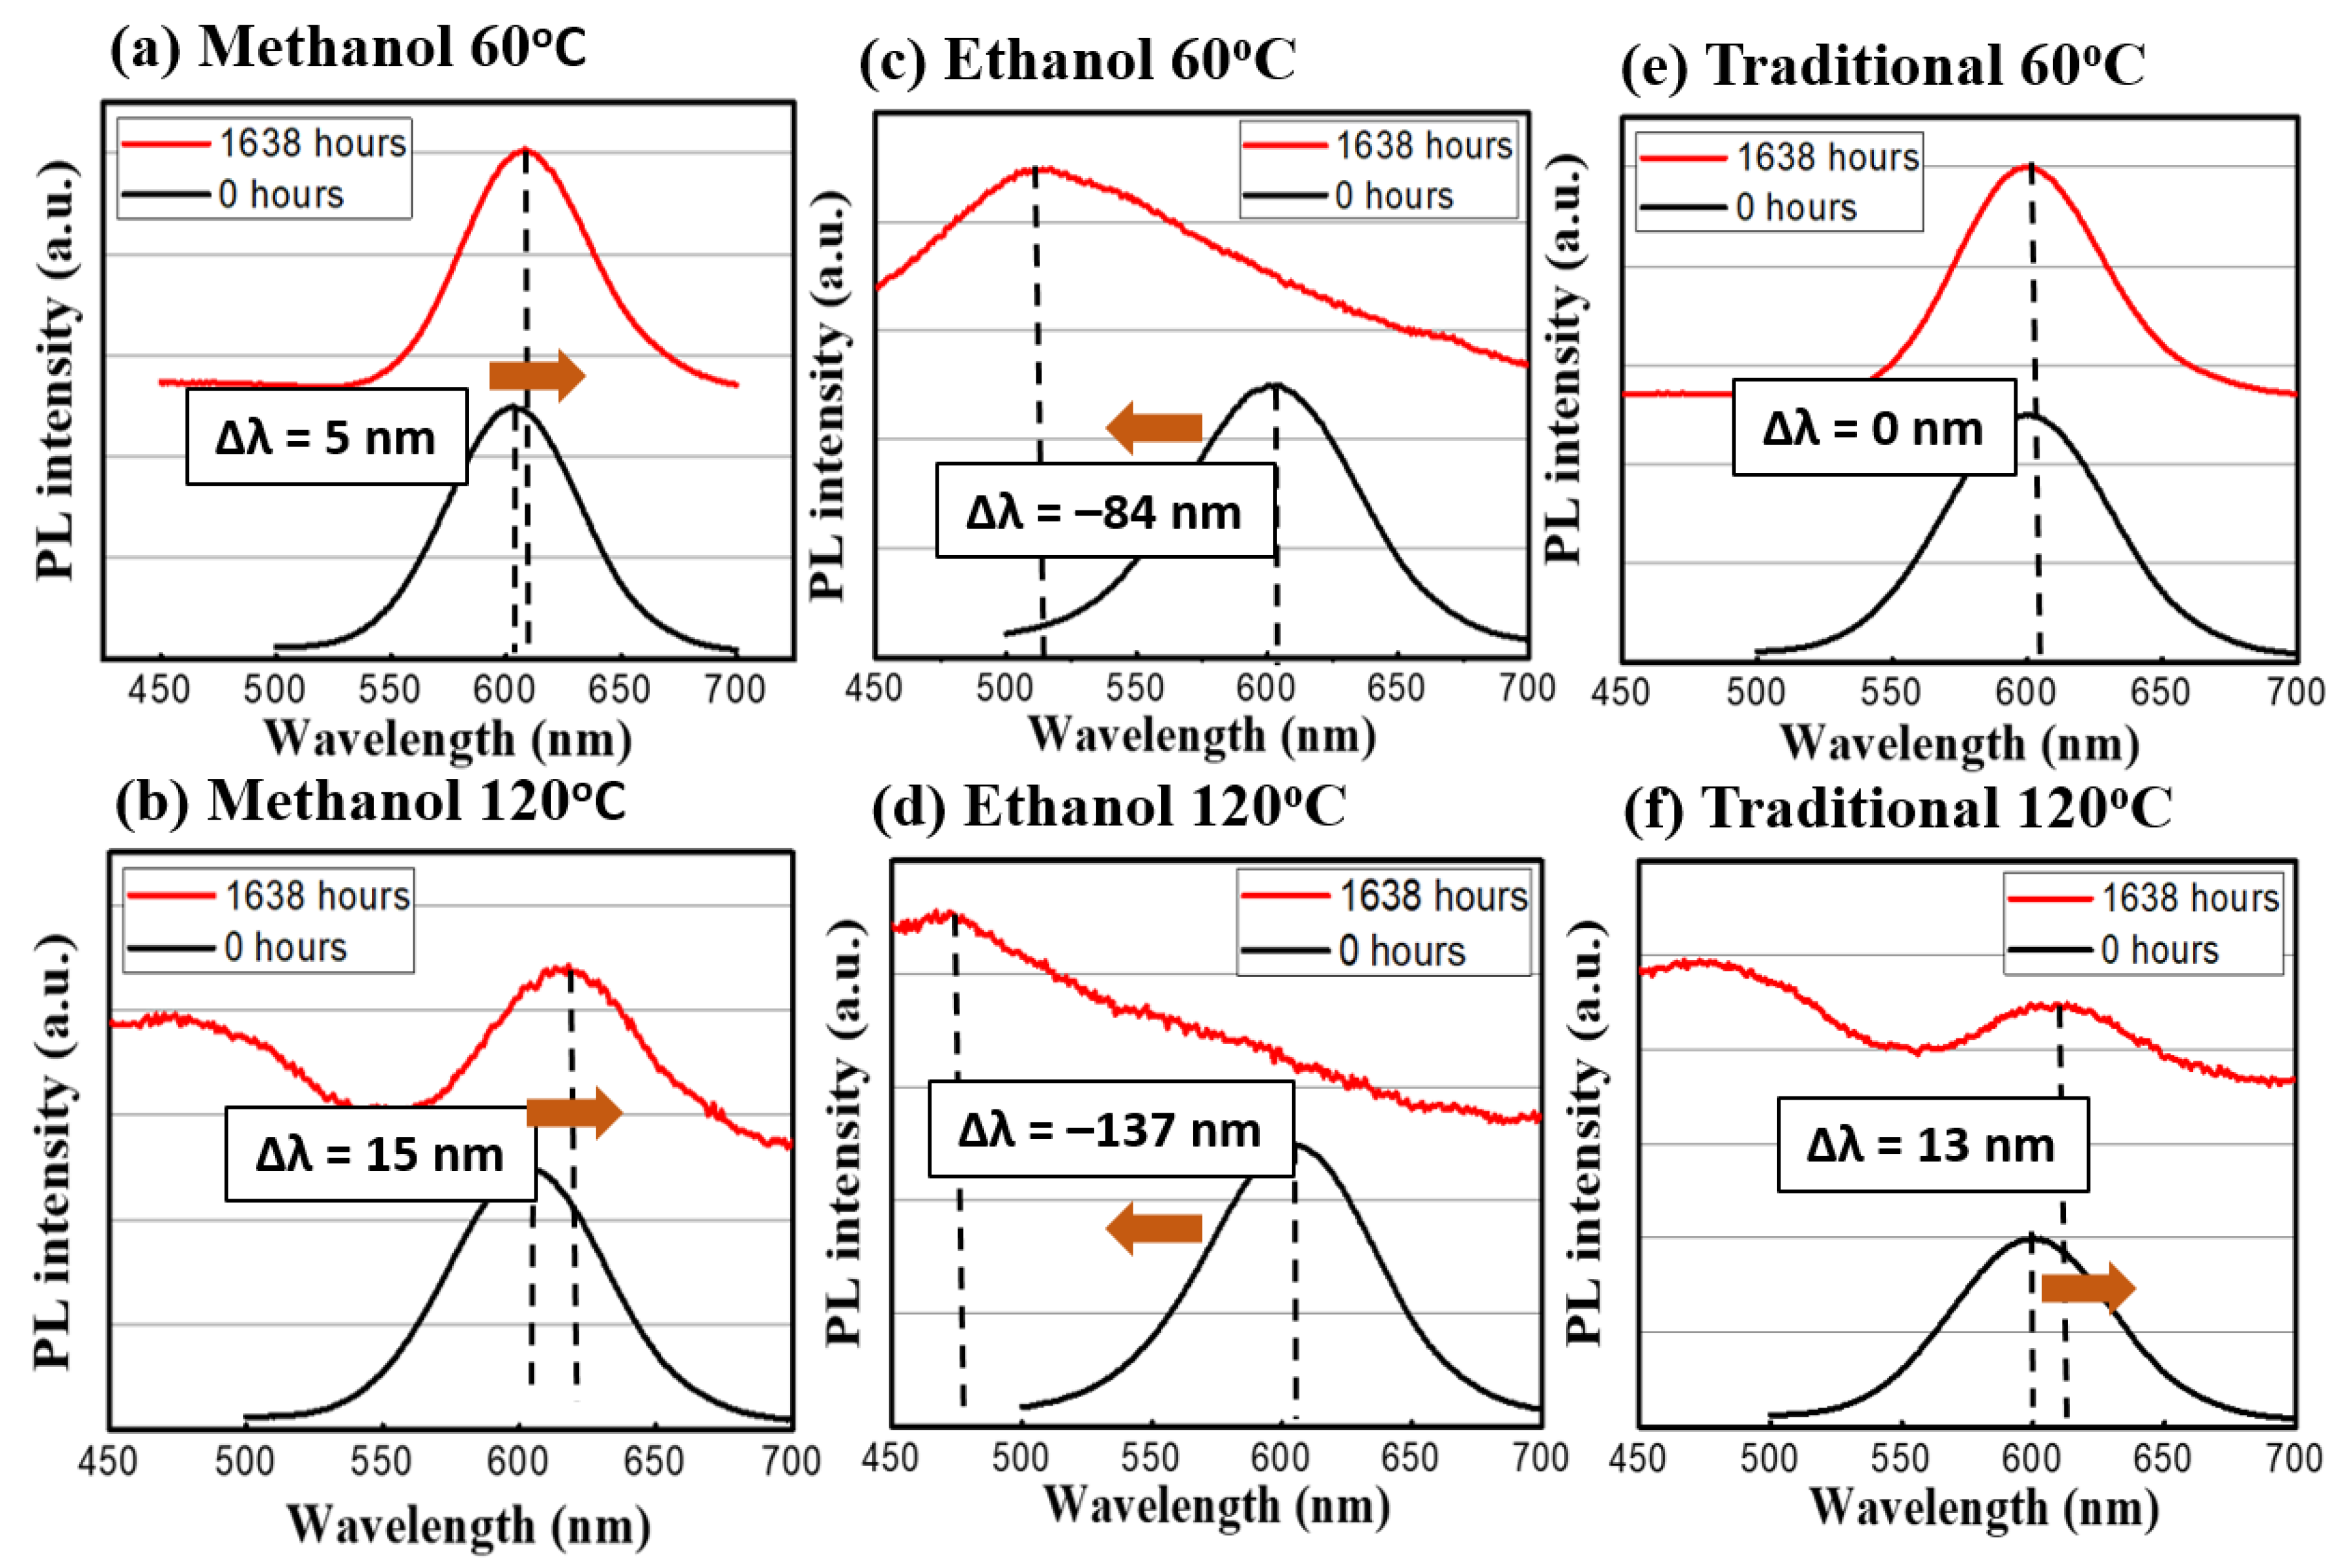
| Δλ 60 °C | 5 | −84 | 0 |
| Δλ 120 °C | 15 | −137 | 13 |
| FWHM 20 mA (7.65 mW) | −10 | 138 | −6 |
| FWHM 200 mA (69.6 mW) | −12 | 114 | −7 |
| FWHM 60 °C | −1 | 135 | −7 |
| FWHM 120 °C | 20 | 179 | 40 |
© 2019 by the authors. Licensee MDPI, Basel, Switzerland. This article is an open access article distributed under the terms and conditions of the Creative Commons Attribution (CC BY) license (http://creativecommons.org/licenses/by/4.0/).
Share and Cite
Huang, Y.-M.; Hsu, S.-C.; Li, N.; Yu, C.-P.; Ke, L.-A.; Huang, C.-P.; Chang, S.-H.; Chueh, Y.-L.; Kuo, H.-C.; Lin, C.-C. The Photothermal Stability Study of Quantum Dots Embedded in Sodium Chlorides. Crystals 2020, 10, 2. https://doi.org/10.3390/cryst10010002
Huang Y-M, Hsu S-C, Li N, Yu C-P, Ke L-A, Huang C-P, Chang S-H, Chueh Y-L, Kuo H-C, Lin C-C. The Photothermal Stability Study of Quantum Dots Embedded in Sodium Chlorides. Crystals. 2020; 10(1):2. https://doi.org/10.3390/cryst10010002
Chicago/Turabian StyleHuang, Yu-Ming, Shun-Chieh Hsu, Ning Li, Chung-Ping Yu, Li-Ann Ke, Chung-Ping Huang, Shu-Hsiu Chang, Yu-Lun Chueh, Hao-Chung Kuo, and Chien-Chung Lin. 2020. "The Photothermal Stability Study of Quantum Dots Embedded in Sodium Chlorides" Crystals 10, no. 1: 2. https://doi.org/10.3390/cryst10010002