Lithium Niobate Single Crystals and Powders Reviewed—Part II
by
 , , and
Oswaldo Sánchez-Dena
1,* ,
,
Sergio David Villalobos-Mendoza
1 ,
,
Rurik Farías
1 and
Cesar David Fierro-Ruiz
2,* 1
Instituto de Ingeniería y Tecnología, Universidad Autónoma de Ciudad Juárez, Av. Del Charro 450 Norte, Ciudad Juárez 32310, Chihuahua, Mexico
2
Departamento de Mecatrónica y Energías Renovables, Universidad Tecnológica de Ciudad Juárez, Avenida Universidad Tecnológica 3051, Colonia Lote Bravo II, Ciudad Juárez 32695, Chihuahua, Mexico
*
Authors to whom correspondence should be addressed.
Crystals 2020, 10(11), 990; https://doi.org/10.3390/cryst10110990
Submission received: 2 September 2020
/
Revised: 26 October 2020
/
Accepted: 27 October 2020
/
Published: 31 October 2020
(This article belongs to the Special Issue New Trends in Lithium Niobate: From Bulk to Nanocrystals)
Abstract
:A review on lithium niobate single crystals and polycrystals has been prepared. Both the classical and recent literature on this topic is revisited. It is composed of two parts with several sections. The current part discusses the available defect models (intrinsic), the trends found in ion-doped crystals and polycrystals (extrinsic defects), the fundamentals on dilute magnetic oxides, and their connection to ferromagnetic behavior in lithium niobate.
1. Introduction
The paramountcy of lithium niobate (LiNbO3, LN) to the applied sciences has already been outlined in the first part of this review. Its versatility in what respects technology has promoted it in science for almost 60 years. Perhaps an effective way to quantitatively assess the success of a researching field is to analyze the number of peer-reviewed publications in scientific journals in a period. This approach was taken by Volk and Wöhlecke (2008): the Web Of Science database was used to track the number of publications between 1965 and 2007 devoted to LN and BaTiO3 (BT) annually [1]. Their plot shows a shoulder-to-shoulder competition of our protagonist with BT, a material that has been the “heart and soul of several multibillion-dollar industries” and which importance in history can be advertised with nothing less than wartime secrecy and a lack of open publications right at its birth around 1945 [2,3]. Today, BT dominates the market of multilayered ceramic capacitors, nearly $6 billion [4]. The bibliographical survey done in 2008 has been retaken only for the case of LN. The actualized data are shown in Figure 1.
With the present contribution, we aim to complete a formal justification to the paradigm that defines the researching field of LN, explicitly stated in Part I. A central idea there is that of the inherence of this material in forming solid solutions (SSs) with a significant number of intrinsic defects which at the macroscale define the congruent (CG) composition. The perturbation from the stoichiometric (ST) composition under ordinary growth circumstances is substantiated by knowing the crystal structure (described in Part I). However, on a deeper level, it essentially relies on understanding the available defect models that provide a solution to the electrical charge neutrality in stable off-ST SSs. No consensus can be found today in this subject. So far, it appears that both experimental and simulation approaches provide conclusive evidence on the type of intrinsic defects being present within Li-deficient crystals, namely Li vacancies (VLi) and Nb antisites (NbLi), in turn favoring the lithium vacancy defect model. However, debate still prevails on their intrinsic distribution, that is, the available models on defect clusters. Less conclusive arguments can be given in this respect for doped LN. Only site occupancy trends have been established depending on the dopant characteristics and doping extent. One can often find discrepancies or irregularities on this point. However, recently, most dopant species seem to adjust to a rule or, better stated, a generalized trend [5]. We discuss the three most widely accepted defect models through LN research (Section 2). Then, the subject of extrinsic defects naturally follows. The role of the ubiquitous presence of hydrogen in the crystal structure and the recent developments on ion-doped LN single crystals are thus revisited (Section 3). Reviews on this subject and focused on other distinct aspects have been recently published [6,7,8]. Lastly, a connection is made between magnetism, ferromagnetism, and ion-doped LN powders through a formal discussion on diluted magnetic oxides (Section 4); this is a relatively new topic regarding LN, not discussed in detail before.
2. Intrinsic Defects
A compromise between the increasing (decreasing) concentration of Nb (Li) atoms exists for stable off-stoichiometric SSs of LN. Electrical charge compensation occurs through an adequate accommodation of both cation species and their respective vacancies (VNb and VLi). Since the latter are defects with a net electrical charge, other defects with countercharges are required to guarantee overall charge neutrality [9]. The occurrence of a stacking fault envisioned as the relatively excess Nb partially occupying the available VLis is proposed. It is denoted as an Nb antisite (NbLi) and is the carotid upon which rests the framework of defect models in LN (see the fourth figure in Part I for visualization aid) [10]. Several defect models have been constructed, and debate still prevails on which of these indeed represents a “solution of the off-ST LN crystal structure with a stable charge equilibrium” [7]. The discrepancies observed over time might be addressed to intrinsic factors persistent on the different crystal growth technologies or suppliers, as recently reported for isostructural lithium tantalate (LiTaO3, LT) [9], a situation that also leads to the irreproducibility of results in at least two cases of doped LN crystals [5,11]. The main characteristics of the three most popular models ever devised are now described in the lines that follow.
Oxygen vacancy model: proposed by Fay et al. (1968) [12], it can be illustrated by the following constitutional formula: [Li1−2xV2x]Nb[O3−xVx], x = 0.028. Supported by Prokhorov and Kuzminov (1990) [13], it assumes the formation of Li vacancies due to the lack of Li2O (used as a raw material in the initial melt, Czochralski method) at the CG point. Then, charge compensation comes from the formation of oxygen vacancies, which is characteristic of all oxides. Thus, at the earliest stages of the CG crystal structure discussion, it was reasonable to assume such vacancies as the most probable defect. However, nowadays, it is tacitly known that LN “is to some extent a unique oxide containing no oxygen vacancies” [10]; based on theoretical calculations, Donnerberg et al. (1989) ruled out the existence of VOs [14]. In addition, the model predicts the crystal density to decrease with greater Li2O deficiency (that is, increasing concentration of VLi), which is inconsistent with the observations obtained in the experimental studies by Lerner et al. (1968) [15]. The existence of NbLis copes with this situation, whereas the inexistence of VOs in LN single crystals has been demonstrated by detailed structure measurements and supported by electronic-structure calculations [16,17,18,19,20].
Niobium vacancy model: proposed by Peterson and Carnevale (1972) [21], it can be illustrated by the following constitutional formula: [Li1−5xNb5x][Nb1−4xV4x]O3, where x ≈ 0.012 and the Nb in the first bracket denotes the Nb antisite defect. It was once widely accepted based on detailed structural studies by Abrahams and Marsh (1986) [16]. It successfully describes the relationship between the density and the Li content in the crystal. Oxygen vacancies are neglected, and the Li sites are filled with an excess of Nb. Likewise, some Nb vacancies are generated at the former 5+ sites for charge compensation. However, according to this model in congruent LN (cLN), there are 5.9 mol% NbLi and 4.7 mol% VNb. Such charged Nb antisite concentration is believed to be structurally unstable. In principle, the existence of NbLi is in agreement with the Hume–Rothery rules for SSs, given that the measured ionic radii for Li+ and Nb5+ are 74 and 64 pm (6-fold coordination), respectively [22,23]. In the analysis of the atomic size effects and their influence within a structure, data are usually taken from the ‘effective’ ionic radii for this coordination number, as given by Shannon and Prewitt [23].
Lithium vacancy model: proposed by Lerner et al. (1968) [15] and extended by Kim et al. (2001) [24], it can be illustrated by the following constitutional formula: [Li1−5xV4xNbx]NbO3, x = 0.01. It also includes NbLi and neglects VO. The Li vacancy model differs from the Nb one in that no Nb vacancies are formed. Instead, four VLi stands for compensation of a single NbLi. The existence of a high concentration of Li vacancies in cLN was confirmed by the structure analysis reported in Refs. [18,19,25,26], as well as by Nuclear Magnetic Resonance (NMR) studies [27,28]. Nowadays, the Li vacancy model is commonly accepted as valid, and the considerations of all defect reconstructions in LN are based on this framework. Reports supporting this model based on computational simulations can be consulted [14,29,30,31]. Nonetheless, a new model has recently been proposed based on the coexistence of all three cation stacking faults NbLi, VNb,, and VLi [32,33]. According to this model, the Nb and Li vacancy models are simply the two opposite ultimate states. In 1998, Wilkinson et al. had already indicated this possibility [19]. In this respect, Schirmer et al. (1991) pointed out that the existence of ilmenite-type stacking faults in the regular LN crystal structure would support these two ultimate states [17]. On the other hand, refined studies of NMR spectra have concluded that a combination of the oxygen vacancy and lithium vacancy models in a ratio 1.1:1.0, respectively, also gives a satisfactory defect framework [34,35,36].
The formation of oxygen vacancies is the least probable event, whereas the combined formation of four Li vacancies for each Nb antisite is the most probable one in our defect scenario, which can be observed in Figure 2, and results from a first-principles study on the formation energies of intrinsic defects in off-ST LN [31]. It is crucial to notice that such a framework can only be considered realistic at moderate temperatures. For high Ts (starting from about 300 °C above room T), it cannot apply mainly to a tendency of a small fraction of Li cations to occupy the vacant octahedral sites, as discussed by Volk and Wöhlecke and references therein cited [10,37,38,39]. On the other hand, quoting Kong et al. (2020): “a variety of further defect configurations and defect clusters have been investigated based on the defect models above, especially the Li vacancy model” [6]. Here, a defect cluster means a specific configuration or distribution of closely spaced defects. The formation of defect clusters subdues energetic misfits and was proposed ever since the earlier defect investigations on LN [15,17,18,40].
Recently, Vyalikh et al. (2018) have performed a detailed study based on Density Functional Theory (DFT) electronic structure calculations and measurement of the spectral characteristics under three different techniques, and, among six proposed cluster models (often found in literature), they found out that two are the most probable to describe cLT [9]; these are therein labeled as models M1 and M3. The first—the least probable among the two according to this study, model M1, with calculated energy formation of 1.94 eV—was initially proposed by Kim et al. (2001), and it assumes that a NbLi antisite (or TaLi) is surrounded by three VLis in the nearest neighborhood and fourth VLi located along the polar c-axis [24], as shown on the left side of Figure 3. According to the same study, the most probable one—model M3, with calculated energy formation of 1.61 eV—locates all the Nb excess interstitially within the structural vacancy, provoking five VLis instead of four as shown in the right side of Figure 3. Accordingly, Zotov et al. (1994) became supporters of the Nb antisite scheme. They proposed the empty site scheme as a viable alternative to describe stoichiometry disturbance in LN, presenting similar goodness-of-fit factors [18].
Debate still prevails on Nb ions occupying interstitial structural sites [8,41,42]. Other alternatives of intrinsic defect clusters have been proposed, perhaps more intricated [43,44,45,46]; most have been proposed to describe the effect of the localized polarization caused by the defect clusters on the overall crystal polarization of the observed features of domain stabilization and reversal [6]. Given the bilateral acceptance in what respects the defect scenario of undoped or pure LN, it is reasonable to adopt the Li vacancy model and its associated defect cluster (left side of Figure 3) as a feasible physical instance describing both the type of intrinsic defects and their ordering in off-stoichiometric LN, respectively. As will be discussed in the next section, this framework is usually adopted to describe the substitution mechanisms in doped LN—concerning at least the type of intrinsic defects. However, the main result presented by Vyalikh et al. must not be overlooked [9], mostly because of the overall confidence recently put on the results obtained with ever more advanced simulations [6,8,47,48].
Indeed, computational power and numerical simulation techniques have made significant progress in the last two decades. Even to the extent that the analysis of extrinsic defects—so far limited to establish substitution mechanisms of dopants entering either a Li site or Nb one, by assumption a preconceived model of intrinsic defects—could soon enable the construction of more sophisticated models. For example, the specific configuration of extrinsic defect clusters. Apropos Kong et al. have made a relevant statement regarding the evolution of simulation methods over time [6]: compared to earlier works, today results can be obtained by the direct insertion of the stacking fault defects into a designed supercell standing for the actual crystal structure. Usually, the extended supercell size is 2 × 2 × 2 hexagonal unit cells comprising 240 atoms. This has been enough, for example, to obtain satisfactory results (2011) on the features shown by a more realistic LN single crystal in which hydrogen has inevitably entered the structure in a low ratio of 10–100 ppm [49,50]. More recently, the above-discussed results reported by Vyalikh et al. (2018) were obtained using 2 × 2 × 1 (120 atoms) and 2 × 2 × 2 supercells. In the same year, Li et al. simulated doping effects with various elements using a basal intrinsic defect supercell of 120 and 540 atoms [51]. Earlier works used to emulate the existence of intrinsic defects by changing the chemical potential reference state respect to that corresponding to the non-defective system (under Li-rich conditions). The enterprise of combined calculation and theoretical analysis is undoubtedly changing.
Lastly, regarding LT, it is also essential to notice that its properties are often discussed in terms of an identical defect scenario, that is, the existence of Ta antisites and the inexistence of oxygen vacancies. No evidence of the presence of such stacking faults in LT is available yet; thus, in principle, the “considerations based on this defect model are speculative in contrast to LN” [10]. However, Li vacancies are undoubtedly present in LT and based on its structural isomorphism. It is permissible to describe one in terms of the defect models proposed for the other. That a NbLi (TaLi) forms instead of a LiNb (LiTa) is related to the larger dimensions of the octahedrons occupied by Li cations compared to those occupied by Nb (Ta) cations, as discussed in Part I. In general, the incorporation of impurity atoms is predominant in Li sites.
3. Extrinsic Defects
Nowadays, it is common to regard this subject as a synonym of elemental doping. Historically, the doping of the (Li-deficient) LN matrix with several ions belonging to distinct families or classes has been highly motivated by either the suppression or enhancement of photorefraction (PR). Also termed ‘optical damage’ or ‘optical breakdown’, PR stands for the process whereby an inhomogeneity in the refractive index is optically induced. It is characteristic of most insulators and, regularly, the irreversible change is generated by applying intense laser-light [52]. The case of LN, however, is peculiar since low irradiance of the order of 20 Wcm−2 (λ = 532 nm) is enough for its manifestation in a congruent crystal [6]; even the use of incoherent visible/ultraviolet light suffices, as reported by Ashkin et al. (1966, considered the discovery of the effect) [53]. Wavefront distortion often follows PR, which is detrimental for applications involving high-intensity laser light and undisturbed beam propagation in media such as nonlinear-optical frequency conversion, Q-switching, optical waveguides, and electro-optical modulation [54,55,56,57,58,59]. Single-crystal LN outstands in such and, if not for its rather ubiquitous PR, it would satisfactorily serve for such technological approaches. Hence, a demand exists for suppressing optical breakdown in LN, or at least to lessen it.
The supply is nowadays found by elemental doping (above certain threshold concentrations) of off-ST single crystals with a particular group of impurities termed ‘optical-damage-resistant ions’ (ODRI): divalent (Mg, Zn), trivalent (In, Sc), and tetravalent metals (Hf, Zr, Sn) [5,6,8,10,60]. Increment of the crystal density and phase transition temperature, together with a blue shift of the fundamental absorption edge, are the main characteristic effects that all these dopants share when they occupy a given site in the defect structure [10]. The term family has recently been coined regarding ODRI, given the similarity of their properties when doped into LN, which have their origin from a shared structural factor despite their state of valence differences. These impurities are optically inactive; “doping with any member of this family induces no changes within the whole transparency range 0.35–4 µm except for a slight shift” of the UV fundamental absorption edge [10]. It is the main reason behind the outstanding interest for optical applications.
Photorefraction (PR) is enhanced by doping with another type of ions—mainly transition metals. In this case, the applications favored by charge transport and trapping phenomena are exploited, such as holography storage, beam coupling, information processing, and computation [61,62,63,64,65]. The bulk photovoltaic effect has been acknowledged as the primary source of optical damage. Ion Fe has been considered for a long time the strongest photovoltaic-active impurity due to the tendency of Li-deficient LN to host the two charged states Fe2+ and Fe3+ [66,67]; ions Cu, Mn, Ni, Co also belong to this group of multi-charge transition metals of valence below +5 used to enhance PR in LN. Thus, despite specific difficulties (low response speed and volatility), Fe-doped LN (LN:Fe) has been “the mainstay of holographic data storage” [61]. Double and triple co-doping (such as LN:Hf,Fe, and LN:Zr,Ru,Fe) and single-doping with ions of valence 5+, 6+, namely LN:V and LN:Mo, have been done to cope with the shortcomings present in LN:Fe and without compromising significantly one or the other, or either the strength of the PR effect [61,68,69,70,71,72].
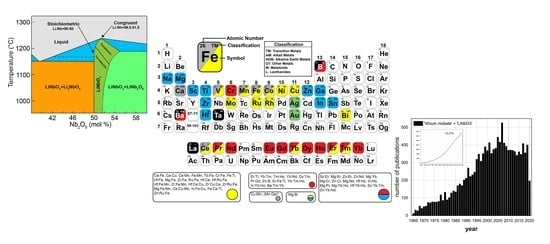
The use of dopants not only entails a modification of the intrinsic capabilities of the crystal, but also new ones that could arise, as stated by Kovács et al. [73]. Laser emission is the best example of such, accomplished when lanthanide trivalent rare-earth ions are the dopants: Pr, Tb, Er, Nd, Yb, Eu, Dy, Ho, Tm [73,74]. These may also be photorefractive ions; for example, the development of two-color holographic recording by doping with Pr3+ and Tb3+ has been highlighted [10,75,76]. This limits to some extent their usage in designing new sources of laser light, for which LN:Nd3+ is remarkable; even detection of the coupled self-doubled frequency in LN:Nd3+ based materials have been reported [77,78,79]. In this respect, transition metal Cr3+ has been extensively studied since, apart from not presenting PR properties, LN:Cr3+ also shows a “strong broad-band luminescence spanning the 770–1170 nm range” [80,81,82]: both features make LN:Cr3+ a suitable material for room temperature tunable solid-state lasing. The versatility of LN in connection to elemental doping and the correspondent derived capabilities is synthesized in Figure 4, according to the consulted literature; because research on elemental doping of LN is merely abundant, it may be incomplete. Still, the subject of extrinsic defects is not entirely covered by discussing elemental doping only.
Thermal treatment or annealing in air and at moderate temperatures (600–700 °C), combined with applying a small electric field on the surface of the crystal, precedes ODRI-doping in what respects the efforts to reduce the degree of index inhomogeneity. Such a strategy was implemented first by Levinstein et al. [83], as early as 1967 (just one year after the discovery of PR), and soon afterward by Smith et al. (1968) [84]. In contrast, the first report of a significant reduction of the optical damage in Mg-doped LN was published until 1980 [85]. In the annealing approach of 1968, Smith et al. addressed the partial PR suppression to the diffusion hydrogen in the crystal, a result that has been confirmed by more recent and detailed investigations [86,87,88].
Thus, hydrogen, or better said the hydrogen-based defect hydroxyl ion (OH−), represents the first-ever appointed extrinsic defect in LN. Today, it is almost 70 years ago since OH− molecular ion has been routinely found in a large variety of oxide compounds [89,90]. It occupies a regular oxygen site, and the promoted “positive charge with respect to the lattice compensates some other kinds of intrinsic or extrinsic defects, allowing one to probe the defect structure by studying the spectroscopic properties of the hydroxyl ions affected by their surroundings” [10]. The easiest way to trace it is by measuring the infrared (IR) absorption band associated with the stretching vibration, the frequency of which is much higher respect to the vibrational frequencies of the host, regularly falling in the 3200–3700 cm−1 range; after Smith et al. (1968), whose work is considered the first report of hydrogen incorporating in LN [84]. Hydroxyl ion concentrations in cLN have been determined by this approach (1018 to 1019 cm−3) [87]. The measurement of the diffraction efficiency of a photorefractive grating has also been used for this purpose [91].
The characteristic IR absorption spectra of a regular cLN crystal consist of a strong peak at 3482 cm−1 (2.87 µm) and a weaker one at 3467 cm−1 (2.88 µm), which together account for a full-width at half maximum of 32 cm−1 [8,10]; the IR band dramatically shifts and broadens to 3300 cm−1 (3.03 µm) and (about) 400 cm−1, respectively, for a congruent crystal saturated with hydrogen [92]. Nowadays, OH− Vibrational Spectroscopy is a popular term used in the context of LN to denote the use of IR absorption measurements to probe its defect structure, either it is undoped (intrinsic defects) or ion-doped [5,8,73,93,94]. The sensitivity of this positively charged extrinsic defect (the hydroxyl ion) to its surroundings may be easily understood by observation of Figure 5: for a Li-enriched crystal, the local environment tends to homogenize due to a proper cationic interchange with Nb antisites and Li vacancies, manifested in OH− vibrational spectra as a doubled-tendency to band narrowing and blue shifting of the peak position (also observed for isostructural LT [95]).
Hydrogen enters the crystal structure from the ambient atmosphere either during the growth process or after it. The standard Czochralski method of crystal growth is effectuated in an air atmosphere. The OH− centers form within the crystal since a certain degree of humidity is always present in the air [87,96]. The diffusion rate can be optimized by subsequent annealing treatment in a water-vapor-rich or hydrogen atmosphere at temperatures between 400 and 700 °C and pressures within the range 1–30 bar [87]. A reduction treatment is subsequent annealing under a hydrogen-enriched atmosphere: reduced LN crystals exhibit a loss of transparency by the formation of color centers that translate into absorption coefficients in the visible region of the order of 50–200 cm−1 (use of water vapor prevents this, which can also be reverted by subsequent annealing in a dry oxidizing atmosphere) [10,87]. The use of temperatures above 700 °C in the reduction treatment is contraindicated because it could distort the cation sublattice, and the formation of oxygen vacancies would also occur during this process [37,38,97]. Embedding the crystal in a Li salt reduces Li loss probability during the reduction treatment [10].
From the early 1970s to the late 1980s, reduction treatment played a decisive role in the final acceptance of the polaron model to describe charge transport and trapping phenomena in (undoped) LN, in terms of photoexcitation and diffusion of small polarons and bipolarons. There is a consensus nowadays about this model satisfactorily describing the origin of optical absorption bands observed in reduced and non-reduced LN crystals, and which together cover an energy range of 0.2–3.5 eV, in terms of the light-induced transfer of various polaron carriers (, and (NbNb–NbLi)2−) out of their potential well to one of the neighboring Nb ions. It also allows one to predict the existence/absence of Nb antisites based on the spectral characteristics of chemically reduced crystals: after reduction, the observation of an absorption band around 0.95 eV implies a lack, whereas a redshift in the absorption to 1.6 eV combined with a photoinduced Electron Paramagnetic Resonance (EPR) structure (observation of a characteristic 10-line EPR spectrum) stands for the evidence of their existence [10].
Rigorously, the type of point defects induced by chemical reduction, as well as the small polarons and bi-polarons themselves, are not extrinsic defects. They instead convey a redistribution (and formation of new complexes) of (with) the already existent intrinsic defects. Such concepts have been barely mentioned in this section due to their high relevance to LN subject in general, doped and undoped. Schirmer et al. (2009) and Imlau et al. (2015) have written comprehensive reviews on this topic [98,99]. A good introduction can be found in the comprehensive monograph written by Volk and Wöhlecke (2008), and it is also recommended to read the section devoted to it in work by Schirmer et al. (1991) [17]. On the other hand, we have noticed (according to the consulted bibliography) that, to follow a train of the earlier concepts, ideas, and facts that led to the development and acceptance of the polaron model concerning LN is not an easy task. While not being synthesized in a sole publication, some space and ink are next dedicated to it.
To the best of our knowledge, the first-ever mention of a small polaron related to reduced LN:Fe was made in 1973 by Clark et al. [100]. The report was written after a decade of theoretical developments to describe the electrical conductivity and to establish an absorption mechanism based on small polaron interactions in ionic crystals [101,102,103,104,105], extended for the case of small bipolarons in 1983 [106], and revisited in the early 1990s [107,108]. The polaron concept in connection with LN:Fe was refined in 1976 to describe thermally activated electron capture, where, for the first time, the localization of the small polaron in undoped LN was assigned to the Nb site [109]. In 1978, Schirmer and von der Linde observed a broad and complex absorption band extending from the near-infrared up to the absorption edge after irradiation of undoped and non-reduced crystals with X-rays or two-photon excitation at low temperature [110,111]. This work confirmed previous results obtained at room temperature by Karaseva et al. [112], and in conjunction with the report by Bernhardt (1976) [113], it also showed that the effect is more significant at lower temperatures. According to Schirmer et al. (1991) and references therein cited, by then, such broad absorptions in the given range of 1.5–3 eV were already correlated to O− trapped holes having the character of a bound small polaron [17,114]. Schirmer and von der Linde confirmed it, based on two different EPR spectra and assigned the localization of the trapped holes at the Li vacancies, whereas that of the trapped electrons to the Nb sites [110,111].
In 1984, Arizmendi et al. refined the study described above and added elemental doping and reduction treatment to it: from the comparison of the effects of low-T X-ray irradiation and reduction treatment on the absorption spectra of undoped LN crystals, they found that the broadband resolves into three prominent bands with peaks at 1.6, 2.5, and 3.2 eV [115]. They concluded, in terms of the previous assignment of polaron states, that a self-trapped electron by ion (the small polaron ) is responsible for the band at 1.6 eV, whereas holes trapped by Li vacancies or other lattice defects are responsible for the other two bands. According to the detailed analysis they made, by ‘other lattice defects,’ the formation of oxygen vacancies under the reduction treatment is implied, which acts as electron traps, in agreement with the conclusions obtained by similar studies a year earlier [116,117]. Under such an assumption, the band at 2.5 (3.2) eV is assigned to F (F+) centers. It also copes with the fact reduced LN crystals are essentially diamagnetic, that is, no EPR signal can be correlated to the absorption band at 2.5 eV, which is intensified after reduction: the existence of oxygen vacancies being able to capture two electrons would fulfill these criteria, noticing that the absorption band itself cannot be assigned to electron capture by the NbNb sites only, which would form a paramagnetic . Back then, there was no consensus regarding a model for intrinsic defects. The oxygen vacancy model was not overruled yet; recall that the Li vacancy model was proposed as early as 1968 by Lerner et al. [15], but it was not until the early 1990s that was widely accepted, mainly due to the works by Zotov [18], Iyi [25], and Blumel et al. [27].
Mainly based on the earlier report by Smyth (1983) [118], Jhans et al. (1986) gave solid arguments to disregard the neutral oxygen vacancy model and concluded that no single small polaron could be assigned to the 2.5 eV band [119]. In 1987, Schirmer and Koppitz (among others) proposed in two separate works that this band is ascribed to the dissociation of a bipolaron localized at a newly formed neighboring complexes NbNb–NbLi, whereas the band at 1.6 eV was ascribed to a small polaron localized at NbLi antisite instead of the regular NbNb site [120,121]. For such assignations, the existence of the NbLi intrinsic defect was taken into consideration, as well as the report by Chakraverty et al. (1978), in which it was demonstrated that in transition metal oxides, bipolaron formation is more energetically favorable if the electrons to be paired are localized on neighboring sites rather than on the same cation [122]. The previous success of the bipolaron scheme explaining the diamagnetism and optical properties of reduced WO3 also played a role in constructing this model [123]. It was soon supported by computer simulations and model calculations [20,29,124]. The dissociation of the bipolaron (NbNb–NbLi)2− can be induced by thermal or optical means (about 0.3 eV), and physically it stands for “the transfer of one of the paired electrons from the bipolaron and further capturing by an isolated NbLi” [10].
The other important topics mentioned in this section (hydroxyl ions, ODRI, elemental doping for PR-enhancement, and laser-emission) have also been discussed in detail by Volk and Wöhlecke (2008) [10]. These can be further consulted in References [86,87,94], [6,17,60], [17,61,125], and [73,74,126], respectively. In the lines that follow, we express our belief about the top 10 facts (or sets of facts) regarding extrinsic defects in LN. Excluding induced ferromagnetism by elemental doping (treated in the next section) and neither chronologically nor hierarchically:
- (1)
- Since 1973, a well-known spectral characteristic of the IR absorption of undoped LN is dichroism. In other words, optical absorption is prominently measured for a given linear polarization state of the incident light, which results in being perpendicular to the polar c-axis of the crystal [127]. It was concluded that the O–H dipole vibration essentially lies in the oxygen plane perpendicular to that axis. On a recent theoretical approach, it has been shown that, in ST crystals, the stretch mode is “tilted weakly out of the oxygen plane by about 4.3°” [50].
- Polarized Raman Spectroscopy of CG LN shows a very low local symmetry of OH− related defect, assigned to point group C1 [128].
- There is a tendency of increasing tilting angle (between the O–H stretch vibration and the oxygen plane) as the valence of the ODRI in doped crystals (above their respective threshold concentration) decreases [94]. As shown in Figure 6 (left side), for Mg2+, the effect is pronounced with an angle of roughly 15°.
- (2)
- For ODRI doping, the threshold concentration is the critical value in mol% describing the amount of incorporated ion into the crystal and “above which the optical damage drastically falls off by more than two orders of magnitude” [10]. It fundamentally depends on the stoichiometry of the crystal and in the valence state of the dopant: as a rule of thumb, less dopant is needed for the obtention of an optical-damage-resistant (ODR) crystal for higher valences (n+ < 5+). Independently of the dopant, it is less than 1 mol% for a near-ST composition. On the other hand, in a congruent crystal, it is roughly (5, 4, 2) mol% for a (di-, tri-, tetra-) valent ODRI [8].
- According to proposed models on the defect structure of LN:Mg, it is usually assumed that the Mg ions compete for Li sites with antisite NbLi ions up to the threshold concentration where all Nb antisites are eliminated [29,132,133]. Hence, regarding ODRI in general, the concentration threshold is also defined as the physical instance in which all NbLi antisites have been replaced by the doping ions, which above the threshold keep replacing regular Li sites and start to replace Nb sites.
- The threshold concentration for Mg can be calculated in mol% units, by use of Equation (1) [132]:x is the same parameter used to describe the chemical composition of undoped LN, the formula (Li2O)50−x(Nb2O5)50+x. Such extension of the x-values to define the [Li]/[Nb] ratio in LN:Mg comes from the lack of a direct method for this purpose, and it assumes that not only this ratio is equal in the melts but also the growing conditions of both crystals, undoped and Mg-doped [8,134]. Precautions must be taken on the ambiguity regarding reported concentration values and their dependence on properties due to the existence of two ways in specifying the impurity content (distinct chemical formulas), as noted by Donnerberg [135].
- LN:Mg has been extensively studied, and similar to undoped LN, there exist various alternatives to determine the dopant concentration (cMg mol%) using linear relationships with a corresponding measured parameter related to a specific experimental technique: IR absorption (OH− vibrational spectroscopy), UV absorption edge, or polarized Raman spectroscopy. The results obtained using these three techniques are consistent for a given crystal; the equations can be consulted in Refs. [8,134,136]. Qualitative results on the effect of cMg on the PR effect presented by the crystals also have been studied through the z-scan method, a standard method often used to assess (quantitatively) third-order optical nonlinearities [137,138].
- (3)
- Regarding other spectral characteristics of the IR absorption, the band components tend to narrow, and the amplitudes of those of higher frequency approach zero as the Li content increases in the crystal (see Figure 5). This tendency culminates at the stoichiometric (ST) point, characterized by a single-mode located at 3465 cm−1 with a Full Width at Half Maximum (FWHM) about equal to 3 cm−1 at room temperature (RT) [93]:
- In doped crystals with ODRI and below the threshold concentration, the IR absorption spectra are essentially the same as undoped crystals: the peak position appears near the 3465 cm−1, and no new OH− bands are detected. In the case of Mg, only the linewidth of the band is affected, decreasing while the doping concentration increases [139].
- Above the threshold, the dopant ions start to occupy regular Nb sites, “opening the way for the formation of –OH− type complexes resulting in new absorption bands in the infrared spectral range” [94]. These bands are well separated from that of the undoped ST crystal (3465 cm−1) and always are of higher frequency, as shown in the center and the right side of Figure 6. Their linewidths are narrower than the OH− of undoped and congruent LN (cLN), for all ODRI doping cases. These characteristics resemble undoped and stoichiometric LN (sLN) so that the existence of different classes of sLN crystals might be postulated. In this regime of concentrations, the intensity ratio between the new and the 3465 cm−1 band increases with the dopant amount [94,140].
- According to a recent investigation (2017), the IR absorption bands of the lanthanide trivalent rare earth Er3+, Nd3+, Yd3+ feature similar characteristics to those of the trivalent ODRI (Sc and In), including the tilting angle out of the oxygen plane, which is around 8° [73]. More recently (2019), similar conclusions have been obtained for transition metal ions Fe3+, Cr3+, and Ti4+ [5].
- Thus, based on these substantial and systematic studies by Kovács et al. [5,73,94], it appears to be that all type of ions follow a generalized trend regarding the substitution mechanisms in doped LN, where the dominant factor is the valence state of the dopant. Even a partial solution to the configuration or distribution of the extrinsic defects (a model of extrinsic defect clusters) is acknowledged locally in the surroundings of a hydroxyl ion. As stated by Kovács et al., “only a small proportion of the incorporated dopants are involved in the type defect complexes while the others are assumed to occupy either Li or Nb sites,” due to significant less concentration of OH− ions compared to that of the dopant [5].
- (4)
- Any given chemical composition, “the bandwidths, peak positions and intensities of different components are almost temperature-independent within the range of liquid-helium temperature to RT. Above RT, the maximum of some bands increase, and those of other bands decrease; the integrated intensity (i.e., the total amount of hydrogen) remains constant up to 200–250 °C” [87]. Conversely, they change slowly with time on a scale of 10 h; an equilibrium state of the OH− vibrational spectra is reached only after some years [141,142]:
- The time-varying characteristic of the spectra is accounted for by a non-equilibrium distribution of the ocuppancy of the hydroxyl ions over four nonequivalent positions [10,88,143]. Accordingly, the broad OH band should be resolved into at least four overlapping components corresponding to different O–H bonds. In near-ST crystals, up to five distinct Lorentzian components have been resolved (Figure 7): 3466, 3470, 3481, 3490, and 3499 cm−1 [143]. Significantly, with time, the intensities of those in italics increase at the expense of those in bold (slight differences in the numerical assignments scattered throughout the literature), the integrated intensity being essentially unchanged [10].
- The chemical composition of an undoped crystal can be assessed with an absolute accuracy of 0.01 mol%, using the estimation of the Li content cLi in terms of this ratio measured at RT and at a time t after its growth (in units of months) [8]:
- (5)
- Recent advances in OH− Vibrational Spectroscopy have led to a detailed RT study on the dynamics of strongly localized and ultrashort-living lattice distortions in the neighborhood of an O–H dipole. A novel achievement is the reconstruction of the electrostatic potential change in the oxygen plane of LN, based on the local polaronic distortion correlated to a pump-induced (scale of femtoseconds) –3 cm−1 shift of the frequency of the OH− stretch vibration [144].
- This result stands for the first visualization of the important observation made about 15 years earlier (2000–2006, mainly by two German groups) on the antisite being a shallow electron trap, based on transient absorption of LN:Fe crystals induced by ultrashort-pulsed green illumination [145,146,147,148]. By use of λ = 388 nm light with 240 fs pulse duration in undoped CG crystal, Beyer et al. estimated the formation of the small polarons or centers in less than 400 fs [148].
- (6)
- “The basic advantage of choosing higher valence ODR dopants comes from their lower damage threshold concentrations; lower built-in dopant content facilitates the growth of more homogeneous crystals resulting in the high-quality sample for device applications” [8]. Recently, research efforts on LN:Zr4+ have been intensified for various practical reasons, which make it an optimal choice for applications at RT:
- Low doping concentration and high optical-damage resistance: a concentration threshold of 2.0 mol% ZrO2 holds for cLN:Zr [6,149], whereas 0.1 mol% in near- sLN:Zr [140], compared to those of 5 mol% and 0.2 mol% for MgO, respectively [46]. A crystal doped with 2 mol% ZrO2 can withstand a light intensity (λ = 514.5 nm) about 40 times higher (around 20 MW cm−2) than a 6.5 mol% MgO doped crystal [6]. Apropos, only a near- sLN:Mg crystal (1 mol% Mg), competes with the former, withstanding close to 26 MW cm−2 at λ = 488 nm [150]; the obtention of this crystal involves an expensive yet unpractical vapor-transport-equilibria process at 1000 °C for about 120 h. It has recently been demonstrated that near-ST LN:Zr crystals can be illuminated with 80 GW cm−2 of pulsed 10 ns green light without optical breakdown [151].
- Segregation and distribution coefficient: The segregation between solvent and solute and the distribution of dopants between Li and Nb sites influence the incorporation of ODRI into flux-grown LN crystals, the quality (i.e., homogeneity) of the latter per se. Segregation is a severe problem even for the growth of pure or undoped LN crystals since the CG and ST compositions do not coincide. It remains in melt systems for the obtention of ODRI-based compositions, causing the scattering in values of the distribution coefficient (Keff) from unity, except perhaps for the case of Li2O–Nb2O5–ZrO2. Most ODRI are characterized by Keff falling in the range 1.2–1.3 for the low concentration regime [10]. At higher concentrations, they decrease close to 1 for MgO [133] and ZnO [152] in the range 5–6 mol%, and to about 0.9 for In2O3 in the range 1.5–2 mol% [153]. In contrast, Keff ≈ 1 for LN:Zr4+, independently of the concentration range of 1–5 mol% ZrO2 [149]. In addition, “it should be noted that in crystals prepared for device applications, ODR dopant concentrations slightly above the critical threshold are preferred to suppress the formation of unwanted microdomains” [8].
- (7)
- Recently, a Japanese group reported the novel result of overcoming segregation in the pseudo-ternary system Li2O–Nb2O5–MgO using in melt compositions 45.30:50.00:4.70, respectively [161,162]. As shown in Figure 9 (left side), the CG and ST compositions coincide with the obtained single crystal. For this reason, it has been labeled as ‘cs-MgO:LN’. Because of a higher compositional homogeneity, its optical properties are expected to be superior to those featured by CG, ST, and LN:Mg. Indeed, optical second harmonic generation (SHG) measurements show comparable conversion efficiencies and a more uniform in-plane distribution of the non-critical phase-matching wavelength (right side of Figure 9) [162]. Its ODR, however, has been elsewhere stated to be inferior to that of cLN:Mg—5 mol% [6].
- (8)
- Upon elemental doping with different ions, several defect-related structures and possible charge misfits are compensated by the formation of suitable intrinsic defect complexes. Given the similarity of the octahedral surroundings at the Li and Nb sites, one of the most challenging questions to answer since earlier studies in this field is the dopant-site occupancy, whether a given doped-ion substitutes Li or Nb or both. No consensus exists on these grounds. Depending on the classification of the dopants (ODRI, PR-active, or laser activation, i.e., lanthanides), among other factors, different trends on site occupancy and doping mechanisms (the dynamics) can be stated. As of today, and in general terms, that is in what respects for all kinds of impurity ions and independently of their charge state, a strong statement, say undisputable, is that dopants are “localized dominantly on the Li sites” [10]. It has been qualitatively explained according to the larger dimension of the Li octahedra respect to Nb one [163,164]. According to a recent review by Kang et al. (and references therein), the dopant concentration, ionic radii, and valence states are among the most influential factors [7]. In general:
- The valence state induces priority substitution: a +2 valence dopant substitutes Li+ ions, whereas one with a valence state greater or equal to +5 replaces Nb+5 ions. No explicit priority substitution can be noticed for dopants of valence +3 and +4 [165].
- Longer (smaller or equal) dopant–O bonds than the mean length of the Nb–O bond reflects occupancy at the Li (either Li or Nb) site; a small shift from the regular Li site takes place if the bond is also longer than the mean length of the Li–O bond [163].
- Low (high) doping concentrations occupy Li or (and) Nb sites.
- The doping process has also been shown to influence the site occupancy. Recently, it was found that the OH− vibration spectra are significantly different for two LN:Cr3+ crystals sharing the same dopant concentration (0.5 mol%) but obtained by two distinct growth techniques, thus implying different substitution mechanisms; the IR absorption spectral characteristics of one crystal shows the fingerprint of a heavily doped crystal while those of the other do not [5]. A similar observation has been made for Cu2+ doping [11], although it is not well supported by the bulk of the literature: copper is normally assumed to enter a Li site, irrespective of the charge state [8,115].
- (9)
- The central role of ODRI is to vary the amount of Nb antisites in the crystal. Extensive studies by several experimental methods and model calculations have been motivated by explaining the microscopic origin of the threshold concentrations in ODRI. In other words, the incorporation mechanisms of the dopants and their influence on the threshold values. Among others, a striking result from such is that Mg and Zn at relatively low concentration values may be regarded as controllers of the intrinsic defects NbLi and VLi contents, so their effect is qualitatively analogous a Li enrichment [10].
- Although still being debated, the current most accepted description on the microscopic origin threshold concentrations for ODRI is that its existence is associated with partial incorporation of the dopants onto regular NbNb sites. In contrast, below these critical values, the incorporation mechanism is described by applying a simultaneous substitution of NbLi antisites and regular LiLi sites by the dopants. This framework is constructed upon results reported for Mg2+ [17,132,135,166,167]. The same conclusions were obtained for later detailed structure studies with X-ray and neutron diffraction on LN:Zn [168,169,170]. Of course, this discussion holds for Li-deficient LN-doped crystals (congruent). As the crystal composition is closer to the ST one, less NbLi antisites will be available, so that the incorporation will be split mainly into regular Li and Nb sites. It explains that significantly less dopant content is needed to reach the threshold concentration in near-ST crystals.
- Impurity Zn possesses the largest threshold concentration among ODRI, above 7 mol% [171,172], which is particularly important regarding the reliability of the results obtained by detailed structural studies. The extension of this framework onto the rest of the ODRI seems quite natural; it is also supported by further evidence found for In3+ and Hf4+ [173,174,175]. Based on the study of the structural properties of doped crystals, the available information has been recently updated for In3+ and Zn2+ [60,176], and extended for Zr4+ [177].
- All lanthanide trivalent rare-earth ions were long thought to occupy Li sites only, independently of the [Li]/[Nb] ratio in the crystal [10]. However, based on detailed OH− Vibrational Spectroscopy studies in near-ST LN-doped crystals with Er, Nd, and Yd ions, Kovács et al. have inferred partial occupation at the Nb sites above a critical concentration value, denoted as ‘threshold’ given the similarity of the trends observed in connection to crystals doped with ODRI [94]. Quoting them: “for rare-earth ions, the term ‘threshold’ possibly does not mean a photorefractive damage threshold, but implies the concentration of the dopant above which the rare-earth ions can occupy Nb sites in the lattice” [94]. Still, most of the dopant ions are assumed to enter Li sites; the amount of those entering an Nb site has been estimated to be very small, of the order of the OH− content in the samples (10–100 ppm). The same conclusions were recently obtained for transition metal ions (Fe3+, Cr3+, Ti4+), as discussed in bulletpoint 3 within the present section.
- An intermediate stage of the substitution mechanism has also been suggested, where LiLi substitution alone lies in between the simultaneous occupation of LiLi sites and NbLi antisites, and the partial incorporation of the dopant into regular NbNb sites [178,179,180]. This has led elsewhere to construct the first threshold concept, a lower concentration threshold than the beforehand discussed [10]. Thus, under such a framework, the first threshold would stand for the complete removal of NbLi antisites, whereas the second threshold for the beginning of NbNb site occupancy.
- (10)
- Simultaneous enhancement for both photorefraction (PR) and optical damage (OD) resistance has been reported for MgO and Bi2O3 co-doped LN (LN:Mg, Bi) [181]. This observation conflicts with the mainstream opinion found in literature: for a long time, these terms have been used indistinctly to address the same process: the optically induced inhomogeneities in the refractive indexes. Hence, it had been tacitly conceived that by making a crystal more resistant to OD, it could also hardly be PR enhanced. They had been thought all this time to “be just opposite sides of the same medal” [6]. Inspired from a rather old result, Zhang et al. did experiments involving the coupling of two beams of equal intensity and came to conclude that OD is not the same as PR, but only a form of expression of it [181]:
- Just a year ago, the same group proved this material to efficiently display real-time dynamic holograms with a 30 Hz refresh time when concentrations of 6 mol% Mg and 1 mol% Bi are used [182]. A video of the display of a running leopard is available in the supplementary material of that contribution. Regarding the labeling of co-doped crystals, recall that, in the present contribution, we use the convention of writing first the dopant with higher concentration, after the colon, followed by a comma, and then the dopant of less concentration, so that LN:Mg, Bi, and LN:Bi, Mg stand for two distinct crystals (see Figure 4).
- Doping with more than one ion species, i.e., co-doping, clearly provides some advantages of technological relevance, particularly in the field of photorefraction. The substitution mechanisms in co-doped LN is out of the scope of the present contribution. Nonetheless, it is expected to behave similarly to single yet heavily doping [5]. Further details on this subject can be consulted in Reference [61].
4. Dilute Magnetic Oxides and Ferromagnetism in LiNbO3 Doped with Magnetic 3d Cations
Historically, the study of the magnetic properties of materials has been of great importance. Novel technological advances can be ascribed to this physical phenomenon, such as ultra-strong permanent magnets, information storage devices with high magnetic density, nano-biomagnetic sensors, and spintronics [183]. Over the years, ferromagnetism has been reported in metals such as Fe, Ni, and Co [184]; in insulators, where the EuO, YTiO3, SeCuO3, and BiMnO3 are some examples [185]; and in diluted magnetic semiconductors (DMSs) [185]. In the classification of DMSs, there are three subgroups: the II–VI, III–V, and the rare-earth-V groups, where the (Zn, Mn)Se, (Ga, Mn)As and ErAs are excellent representatives, respectively [185]. In the same framework, the diluted magnetic oxides (DMOs) is another critical group in the classification of ferromagnetic materials, with the general formula [186]:
A corresponds to a nonmagnetic cation, M is the magnetic cation, □ representing a donor defect, n = 1 or 2, and δ corresponds to the donor concentration. Systems as SnO2 (conductor), ZnO (semiconductor), and TiO2 (insulator) doped with magnetic 3d cations are some examples. In the search for new magnetic materials, some non-magnetic ABO3-type oxides doped with 3d magnetic cations have attracted much attention due to the possibility of inducing ferromagnetism in them, expanding this way the range of technological applications. Nowadays, there are reports already of systems such as LN:Mn, LN:Fe, LiTaO3(LT):Fe, BaTiO3:Fe, and SrTiO3:Co that exhibit ferromagnetism at room temperature (RT) [187,188,189,190,191,192].
As for DMOs, Coey defines these as nonmagnetic oxides doped with small percentages of magnetic 3d cations (generally under 10 at.%), which show signs of ferromagnetism at high temperatures (the general formula is shown in Equation (3)) [186,193,194]. These are often synthesized as thin films. Regarding the reported magnetic curves M–H, scattered throughout the literature, these are not temperature-dependent below RT and are practically anhysteretic [194]. The fact that the magnetic coercivities observed in these materials are not dependent on temperature implies that the magnetization process that favors the manifestation of ferromagnetism is not dominated by magneto-crystalline anisotropy, but instead by magnetic dipole interactions [194]. In DMOs, the magnetization curve is described by Equation (4) [194]:
where Ms is the saturation magnetization, H the applied magnetic field, and H0 is an effective magnetic field constant that prevents saturation. The observed ferromagnetism in DMOs can be explained from the bound magnetic polaron (BMP) model, proposed by Coey [186]. It is based on the formation of point defects and the association of an electron to each defect. In turn, each electron is confined in a 1s hydrogenic orbital of radius , is the high-frequency dielectric constant, m the mass of the electron, m* the effective mass of the donor electrons, and a0 the B–r radius (~53 pm). Hence, defects—often induced by heat treatments under certain atmospheres—play an essential role in the origin of magnetism. As the donor concentration increases, so does the number of 1s orbitals, which overlap and form the so-called impurity band. When the hydrogenic electrons interact with the magnetic cations M in the impurity band, magnetic polarons tend to form, coupling the 3d orbitals of the ions within their orbits [186]. A ferromagnetic coupling between the spin of the donors and the spin of the 3d orbitals exists if , where . This ferromagnetic interaction is defined by the exchange parameter Jsd in Equation (5) [186]:
S corresponds to the spin of the 3d cations with a volume , and s is the spin of the donor electron. Finally, long-range ferromagnetic order is favored in the DMOs if the amount of magnetic cations is large enough, and , . Parameters and are the percolation thresholds of the polaron and the cation, respectively; x is the doping and 4.3 [186]. The BMP model is summarized in Figure 10. The ferromagnetism observed in DMOs samples is reported as intrinsic. In the cases of thin films or nanocrystals, the formation of secondary magnetic phases must be ruled out by a convenient characterization. Regarding the magnetic hysteresis loops (measured at RT), these present very small coercivities on the order of 5–10 mT, and a remanence ratio (Mr/Ms, the numerator being the remanence magnetization) of 5 to 10% [193]; there are instances where the magnetic moment exceeds the spin-only moment of the doping cation for small concentrations of doping. Conversely, these kinds of oxides present some disadvantages, the most important being the fact that the magnetic moment is frequently unstable in time, and the reproducibility of the samples is poor [193]. The BMP model fits well with the experimental results reported over the years. Nevertheless, other models cannot be discarded, namely those based on whether the magnetic moment in the samples is localized or delocalized. The nature of the electrons involved in the magnetic interactions also plays a role. In this context, the diluted magnetic semiconductor, the split-spin impurity band, and the charge-transfer ferromagnetism models may be consulted [195,196,197]. With DMOs as a framework, the magnetic properties of LN doped with magnetic 3d cations will now be introduced. As mentioned above, the impurification of LN with transition metals (Fe, Cu, Mn, Ni) has been extensively explored in the study of the photorefractive effect; however, there is an important opportunity area in terms of magnetic properties.
In 2006, Song et al. prepared Co0.05(LiNb)0.95O3-δ by Co implantation [198]. Their analysis performed by energy dispersive spectroscopy reported that Co was uniformly distributed to a depth of 220 nm on LiNbO3 wafers. On the other hand, through ab initio calculations and X-ray absorption near-edge structure (XANES), it was demonstrated that the Co substitutes the Li in the LN crystal lattice. The Co0.05(LiNb)0.95O3−δ sample showed ferromagnetism at RT with an atomic magnetic moment (AMM) of 1.3 µB/Co and a high Curie temperature (Tc) of 710 K. In terms of the BMP model, also within the context of the discussion given by Song et al. [198], the implantation of ions is a nonequilibrium process that makes possible the formation of defects located at aleatory distances respect to Co sites in the Co0.05(LiNb)0.95O3−δ layer. In this sense, a donor spin of a particular defect interacts with Co ions within its orbit, forming a BMP. The orbits overlap and interact with adjacent BMPs, creating a magnetic order. Thus, Song et al. associated the ferromagnetism in Co-doped LiNbO3 with the formation of BMPs. However, other mechanisms have been found to cause ferromagnetism in LiNbO3 doped with magnetic 3d cations. For example, Chen et al. (2011) developed an interesting work where LN wafers implanted with a dose of Mn (1, 2, 3, 4, 5 at.%) were prepared, having a thickness of 200 nm [192]. The samples exhibited ferromagnetism, a maximum AMM of 5.83 µB/Mn was determined for the sample at 3 at.%. XANES ruled out the formation of secondary phases and oxygen vacancies, and it was concluded that the Mn ions substitute the Li ions in the crystal lattice. In addition, they found that, above this concentration, the crystal lattice began to present damages, translating into a significant decrease in the AMM. The origin of ferromagnetism (half-metallic ferromagnetism) was attributed to a strong d–d interaction between the dopant and its neighboring atoms Nb, inducing a long-range interaction through the whole crystal. The experimental results were supported by electronic structure calculations, where a magnetic moment of 5.93 µB per cell was calculated for an Mn concentration of 3.3 at.% [192]. Finally, their theoretical analysis led them to conclude that the distances between the Mn and two neighboring Nb atoms (Nb1 and Nb2) are in consideration of the Li–Mn cationic interchange dMn–Nb1 = 277 pm and dMn–Nb2 = 300 pm, whereas for the undoped crystals dLi–Nb = 312 pm.
In a similar study, Zeng et al. (2012) prepared LN:Fe by ion-beam implantation at different Fe concentrations (1, 2, and 3 at.%); the obtained implanted layers were about 200 nm thick and showed ferromagnetism at RT [190]. A maximum AMM of 3.33 µB/Fe was determined for the sample doped with 1 at.% [190]. It was concluded that Fe substitutes Li for a concentration of 1 at.%, the interaction between the Fe and its neighbor Nb enables strong spin coupling throughout the whole crystal, resulting in an effective enhancement of the ferromagnetic behavior. Here, it is important to note that the Fe cation environment into the LN structure has been extensively studied using X-ray absorption fine structure (EXAFS) and XANES, where the results indicate that Fe3+ ions unambiguously occupy Li sites [199,200,201]. Zeng et al. also found a significant decrease in the AMM measured values (0.87 and 0.30 µB/Fe for concentration 2 and 3 at.%, respectively), this being attributed to the possible formation of FeOx clusters not coupled in a long-range order [190]. The theoretically calculated distances between the dopant Fe and its two neighboring Nb atoms were dFe–Nb1 = 274 pm and dFe–Nb2 = 299 pm, in agreement with the results reported by Chen et al. (2011) [192].
Figure 11 shows the plots of magnetic moment per transition metal-cation of LN doped with Fe (1-LN:Fe), Mn (2-LN:Mn), V (7-LN:V), as well as four different systems of LN doped with Co (labeled as 3-LN:Co, 4-LN:Co, 5-LN:Co, and 6-LN:Co). All samples were prepared as layers by different methods [190,192,198,202,203,204,205]. As can be seen, for 2-LN:Mn and 7-LN:V, the AMM increases as the x increases until reaching a maximum; after that, the AMM begins to decrease as x increases. On the other hand, 1-LN:Fe presents a maximum AMM for small values of x. As previously explained, the AMM decrease is mainly associated with the formation of secondary phases or lattice damage due to excess dopant, which destroys the magnetic coupling. Finally, the LN:Co samples (4-LN:Co, 5-LN:Co and 6-LN:Co) exhibit a low AMM, except for 3-LN:Co, around 5.5 µB/Co.
There is a tendency in what respects doped-LN to study single-crystal and polycrystal thin films, in comparison to polycrystalline powders; further results on the Fe impurity and reports on the doping with Co, Cu, and V—based on similar studies to those above just described—can be consulted in the literature [198,202,203,204,205,206,207]. However, recently some efforts have been put on as-obtained coarse LN particles that show ferromagnetism at RT. On an investigation carried out in 2018 by our group, it was found that the generation of oxygen vacancies—by thermal treatment in reducing atmospheres: thermal treatment in a reducing atmosphere (TTRA)—at the surfaces of LN:Fe powders is a mechanism that favors RT ferromagnetism at low doping concentrations of 0.44%, 0.89%, 1.47%, and 2.20% by mass of Fe2O3 (labeled as nLN:Fe-0.44-R, nLN:Fe-0.89-R, nLN:Fe-1.47-R, nLN:Fe-2.20-R, respectively) [208]. A saturation magnetization of 0.96 Am2 kg−1 was determined for the sample of higher concentration. Structural analysis by X-ray diffraction and Raman spectra led to the conclusion that Fe enters Li sites, in agreement with the work of Zeng et al. (2012). However, in contrast, no decrease in the magnetization values as the concentration increases gradually was found this time. It suggests that the crystal structure was not strongly distorted and also that the formation of secondary magnetic phases in the form of clusters is unlikely, in the studied concentration range. Figure 12 shows the ferromagnetic curves for the chemically reduced samples with different Fe-doped concentrations. In this case, all the systems presented a constant coercive field (Hc) of 2 × 10⁴ Am−1. In addition, two samples, oxidized LN doped at 2.20% (labeled as nLN:Fe-2.20-O) and a chemically reduced sample of undoped LN (labeled as nLN-R), are shown. It can be seen that the saturation magnetization of the reduced samples (doped at different Fe concentrations) is about two orders of magnitude higher than the oxidized samples.
The connection between ferromagnetism and the generation of oxygen vacancies through TTRA was previously reported (2014), also by our group [209]. In that instance, the generation of the oxygen vacancies at the surfaces of the nanocrystals was confirmed by the measuring of oxygen depletion across the nanoparticles using transmission electron microscopy (TEM). Experimentally, a magnetic moment of 5.24 × 10⁻³ µB was determined. Although this value is minimal and did not agree with ab initio calculations, this contribution is relevant because it is one of the first reports on the magnetic properties of undoped LN: see also the reports in 2012–2013 by Díaz et al. [210], Ishii et al. [211], and Cao et al. [212], and in 2016 by Yan et al. [213].
In the work by Cao et al. (2013), based on ab initio calculations, it is stated that the formation of neutral VOs is favorable and that the formation of two intrinsic defects of this type (in specific coordinates) induces ferromagnetism by the spin polarization of the Nb s electron [212]. The work by Yan et al. (2016) is particularly important because it represents the first experimental study on undoped single-crystal LN (and LiTaO3) in connection to induced ferromagnetism by TTRA [213]. They measured a magnetization saturation, a magnetic remanence, and a coercive field in reduced CG LN of 7.0 × 10⁻³ emu g−1, 0.65 × 10⁻³ emu g−1, and 0.050 kOe, respectively. The induced ferromagnetism is therein associated with the formation Nb4+ (Ta4+) with non-zero net spin and oxygen vacancies on the surface due to the chemical reduction.Here, an important fact regarding the implications made in Reference [209] is discussed. According to the paramount observation in the peer reviewing process of this review, the depletion of oxygen does not neccesarily implies the formation of oxygen vacancies. The existence of oxygen vacancies in LN from TTRA is still on debate. The studies just discussed above attribute the manifestation of ferromagnetism to mechanisms where oxygen vacancies play an essential role, while others have entirely overruled their existence. Before entering the decade of the 1990s, Smyth (1983) and Donnerberg et al. (1989) separately proposed an acceptable model that explains the defect structure of CG crystals after chemical reduction (see discussion of the polaron model in the previous section) [14,118]:
where a loss of oxygen on the surface of a molecule promotes a rearrangement of the constitutional elements of LN, causing Nb5+ ions to move into empty Li sites, in turn leading to a rearrangement of Li vacancies and Nb antisites; the released electrons are captured by traps [10]. As already discussed, this model predicts the crystal density to decrease with greater Li2O deficiency. Thus, the TTRA could in principle be held for long times to the extent where the secondary Li-deficient phase, LiNb3O8, starts to form at the expense of the pure LN phase. Indeed, this is the case recently reported by Kocsor et al. [214]: pure LN nanocrystals were prepared by ball-milling the crucible residues of a Czochralski grown congruent crystal, however, LiNb3O8 crystallized after reduction and oxidation thermal treatments at 800 °C for 180 min. There, the oxidizing treatments induce the formation of the secondary phase more effectively as a consequence of Li2O evaporation. The formation of oxygen vacancies was also excluded from the mechanisms picture.
After Schirmer and Koppitz (1987), it is acknowledged that the trapped electrons create small polarons and bipolarons, localized at the NbLi antisites and newly formed neighboring complexes NbNb–NbLi, respectively [120,121]. Thus, TTRA plays a role in the generation, or at least the redistribution, of point defects in LN, which in turn induce changes in its physical properties. Because it has been elsewhere stated that “the oxygen leaves the crystal surface, so no oxygen vacancies appear at the end” [10], the implications made by our group in Reference [209] need to be revisited. A set of studies shall soon be done in our laboratories in order to study such implications more carefully and coherently. The permanent existence of vacancies in the surfaces of nanocrystals cannot be assured (or denied) with the current available literature. Nonetheless, at least it can be argued that during the TTRA, the in situ formation of Vo’s could be responsible for the construction of permanent electron trapps that eventually lead to strong (weak) magnetism in LN:Fe (undoped LN) powders.
Other significant conclusions can be obtained from the studies analyzed in this section:
- Based on XANES, EXAFS, and Raman Spectroscopy measurements and ab initio calculations, there is a trend of Fe, Mn, and Co cations to occupy Li sites at low doping concentrations.
- The substitution of Li with Fe and Mn cations modifies the interatomic distances between their closest neighbors, favoring the interaction between the 3d cations and their neighbors.
- When LN is doped with a small amount of 3d magnetic cations such as Fe, Mn, and Co, it manifests ferromagnetism at RT. However, in the high-doping concentration regime, the magnetization saturation tends to decrease, mostly due to the destruction of the magnetic coupling around the magnetic 3d cation and sometimes to the formation of secondary magnetic phases.
- The formation of point defects usually addressed as oxygen vacancies after TTRA in either doped or undoped LN serves as a mechanism for ferromagnetism enhancement.
5. Conclusions
Lithium niobate (LiNbO3, LN) is a promising material in fundamental and applied sciences. A decreasing tendency to respect fundamental research in this topic for about the last 10 years can be noticed in Figure 1. This fact might be interpreted as LN becoming indeed practical on a large scale, and perhaps its normal science activities have diminished in compensation for recent efforts in the realization of tractable technologies.
Research at the fundamental level still needs to be done to tie up loose ends. Remarkably, the study of the intimate relationship between the chemistry and crystal structure. The flexibility of the latter to support several chemistries has been summarized in Figure 4; potassium (K) is not highlighted, recalling that it is not considered a dopant according to the conceptual refinement given by Polgár et al. [93] and within the context of the high-temperature top-seeded solution (HTTSSG) growth technique. On the other hand, recently, Kang et al. have explicitly stated the powerful idea of obtaining stoichiometric LN crystals by the route of elemental doping, that is, by an effective elimination of intrinsic defects by filling of the sites [7]. This simple yet appealing concept rests upon trends observed in most doped LN systems, particularly those with divalent optical damage resistant ions (ODRI) Mg and Zn. For a given doping concentration below the threshold values, these have shown effects qualitatively analogous to a Li enrichment, and overall, doped LN crystals show improved physical properties compared to pure and congruent crystals [7]. However, it is crucial to notice that, by doping with any kind of element, the structure is distorted to some extent; for ODRI in general, the unit cell volume increases with doping concentration [60,133,176], whereas, in the case of pure LN, it decreases in the elimination process of Nb antisites and Li vacancies. Moreover, in pure LN, the blue shifting of the fundamental absorption edge in going from off-stoichiometric compositions to the stoichiometric one is a well-known fact. Congruent crystals doped with Mg have shown the same trend, as reported for concentrations below the threshold value; it reverses by doping further [139]. Change in the substitution mechanism in passing from Li site occupancy to Nb site occupancy influences the tendency reversal. However, it is important to recall that, under extreme Li enrichment conditions, the formation of the parasitical phase Li3NbO4 occurs instead of showing the characteristics of a partial Li-Nb exchange. Still, such a dissimilarity in the structure relaxation/hardening tendencies should be enough to state with confidence that no doping can be entirely analogous to the process of Li enrichment. Thus, in the pursuit of obtaining high-quality large single LN crystals, the chemical composition is to be adjusted, and the structural distortion or deformation should be minimized.
The best example of structural distortion affecting the properties is found by comparing LN and lithium tantalate (LiTaO3, LT). Recall that, in pure LN, the Curie temperature is higher for crystals of ever-increasing quality (less intrinsic defects). Although the unit cell volume of LT is smaller than that of LN by a factor of about 0.5% [215,216,217], a dramatic difference between their corresponding Curie points holds: in going from off-stoichiometric compositions to the stoichiometric one, these have been reported to vary linearly in the range 1037–1207 °C for LN, and in the range 507–692 °C for LT, respectively [217]. Nearly the double notwithstanding that both phases are isostructural and Ta possesses identical chemical/physical properties to Nb, such as the state of valence and ionic radii. Hence, this can be attributed to lattice deformation, shown to be pronounced in LN single crystals doped with Ta, by polarized Raman Spectroscopy [218]. In contrast, the fundamental absorption edge can also be tuned with chemical composition in LT, but these are blue-shifted ca. 40 nm with respect to those of LN [219,220]; for this reason, the extension of transparency to the UV region has been proposed by a partial Nb-Ta exchange [8].
According to a quick survey, few experimental works on LNT (LN doped with Ta) have been done [217,218,221,222,223]. The study of this system could clarify some aspects regarding the substitution mechanisms in doped LN, as well as to pave the way for a close and quantitative investigation of the structural distortion in equivalent stoichiometric LN materials, accounting for proper doping (choice of element and concentration) for the adjustment of the chemical composition. In this respect, the recent advances in state-of-the-art simulation approaches could be useful. However, some peculiarities are still left to be solved. For example, the electronic bandgap is reported to be significantly below or above compared to the bulk of reports based on experiments [6,224]. Another situation to be considered is that of the role of hydrogen within the structure. Recently, LN crystals with a hydroxyl ion have been simulated with DFT calculations and by the direct insertion of the stacking fault defect into a designed supercell standing for the actual crystal structure [49,50]. However, the extended supercell size is limited to computational power, where 2 × 2 × 2 hexagonal unit cells (240 atoms) are usually used in such approaches. The question then arises regarding whether such simulated crystals represent real LN crystals for which the concentration of hydrogen is very low, of the order of 10–100 ppm, or if crystals saturated with hydrogen are modeled in this way. A similar argument can be stated concerning the population of intrinsic and extrinsic defects (the chemical composition).
A final comment is given regarding the concept of substitution mechanisms. In writing this contribution, it has been noticed that, particularly in those publications related to the elemental doping in connection with ferromagnetism, Li substitution may have been used as a synonym of Li site occupancy. Rigorously, Li substitution disregards the filling of Li vacancies and dopant substitution for an Nb atom located at the Li site (antisite filling). Both processes have a higher probability of occurrence than Li substitution in off-stoichiometric crystals and under low doping concentrations, as is the case being described for diluted magnetic oxides.
Author Contributions
Conceptualization, O.S.-D. and S.D.V.-M.; validation, R.F. and C.D.F.-R.; investigation, O.S.-D., S.D.V.-M. and C.D.F.-R.; writing—original draft preparation, O.S.-D. and S.D.V.-M.; writing—review and editing, O.S.-D. and R.F.; visualization, S.D.V.-M.; supervision, R.F.; project administration, R.F.; funding acquisition, C.D.F.-R. All authors have read and agreed to the published version of the manuscript.
Funding
The publishing fee was covered by Universidad Tecnológica de Ciudad Juárez.
Acknowledgments
Special thanks to Omar Alejandro Velasco Cortez for his help with the bibliographical survey in the preparation of Figure 1. O.S.-D. is thankful for the post-doctoral grant PRODEP Oficio No. 511-6/2020-2054.
Conflicts of Interest
The authors declare no conflict of interest.
References
- Volk, T.; Wöhlecke, M. Introduction. In Springer Series in Materials Science 115. Lithium Niobate. Defects, Photorefraction and Ferroelectric Switching, 1st ed.; Hull, R., Osgood, R.M., Jr., Parisi, J., Warlimont, H., Eds.; Springer: Berlin/Heidelberg, Germany, 2009; Volume 115, pp. 1–8. [Google Scholar]
- Haertling, G.H. Ferroelectric Ceramics: History and Technology. J. Am. Ceram. Soc. 1999, 82, 797–818. [Google Scholar] [CrossRef]
- Bhalla, A.S.; Guo, R.; Roy, R. The perovskite structure—A review of its role in ceramic science and technology. Mat. Res. Innovat. 2000, 4, 3–26. [Google Scholar] [CrossRef]
- Troiler-McKinstry, S. Impact of ferroelectricity. Am. Cer. Soc. Bull. 2020, 99, 22–23. [Google Scholar]
- Kovács, L.; Kocsor, L.; Tichy-Rács, É.; Lengyel, K.; Béncs, L.; Corradi, G. Hydroxyl ion probing transition metal dopants occupying Nb sites in stoichiometric LiNbO3. Opt. Mater. Express 2019, 9, 4506–4516. [Google Scholar] [CrossRef]
- Kong, Y.; Bo, F.; Wang, W.; Zheng, D.; Liu, H.; Zhang, G.; Rupp, R.; Xu, J. Recent Progress in Lithium Niobate: Optical Damage, Defect Simulation, and On-Chip Devices. Adv. Mater. 2020, 32, 1806453. [Google Scholar] [CrossRef] [PubMed]
- Kang, X.; Liang, L.; Song, W.; Wang, F.; Sang, Y.; Liu, H. Formation mechanism and elimination methods for anti-site defects in LiNbO3/LiTaO3 crystals. CrystEngComm 2016, 18, 8136–8146. [Google Scholar] [CrossRef]
- Lengyel, K.; Péter, Á.; Kovács, L.; Corradi, G.; Pálfalvi, L.; Hebling, J.; Unferdorben, M.; Dravecz, G.; Hajdara, I.; Szaller, Z.; et al. Growth, defect structure, and THz application of stoichiometric lithium niobate. Appl. Phys. Rev. 2015, 2, 040601. [Google Scholar] [CrossRef] [Green Version]
- Vyalikh, A.; Zschornak, M.; Köhler, T.; Nentwich, M.; Weigel, T.; Hanzing, J.; Zaripov, R.; Vavilova, E.; Gemming, S.; Brendler, E.; et al. Analysis of the defect clusters in congruent lithium tantalite. Phys. Rev. Mater. 2018, 2, 013804. [Google Scholar] [CrossRef] [Green Version]
- Volk, T.; Wöhlecke, M. Point defects in LiNbO3. In Springer Series in Materials Science 115. Lithium Niobate. Defects, Photorefraction and Ferroelectric Switching, 1st ed.; Hull, R., Osgood, R.M., Jr., Parisi, J., Warlimont, H., Eds.; Springer: Berlin/Heidelberg, Germany, 2009; Volume 115, pp. 9–50. [Google Scholar]
- Pracka, I.; Bajor, A.L.; Kaczmarek, S.M.; Swirkowickz, M.; Kaczmarek, B.; Kieselewski, J.; Lukasiewicz, T. Growth and Characterization of LiNbO3 Single Crystals Doped with Cu and Fe Ions. Cryst. Res. Technol. 1994, 34, 627–634. [Google Scholar] [CrossRef]
- Fay, H.; Alford, W.J.; Dess, H.M. Dependence of second-harmonic phase-matching temperature in LiNBO3 crystals on melt composition. Appl. Phys. Lett. 1968, 12, 89–92. [Google Scholar] [CrossRef]
- Prokhorov, A.M.; Kuz’minov, Y.S. Physics and Chemistry of Crystalline Lithium Niobate, 1st ed.; Hilger: New York, NY, USA, 1990. [Google Scholar]
- Donnerberg, H.; Tomlinson, S.M.; Catlow, C.R.A.; Schirmer, O.F. Computer-simulation studies of intrinsic defects in LiNbO3 crystals. Phys. Rev. B 1989, 40, 11909–11916. [Google Scholar] [CrossRef] [PubMed]
- Lerner, P.; Legras, C.; Dumas, J.P. Stoechiometrie des monocristaux de metaniobate de lithium. J. Cryst. Growth 1968, 3, 231–235. [Google Scholar] [CrossRef]
- Abrahams, S.C.; Marsh, P. Defect Structure Dependence on Composition in Lithium Niobate. Acta Cryst. 1986, B42, 61–68. [Google Scholar] [CrossRef]
- Schirmer, O.F.; Thiemann, O.; Wöhlecke, M. Defects in LiNbO3—I Experimental aspects. J. Phys. Chem. Solids 1991, 52, 185–200. [Google Scholar] [CrossRef]
- Zotov, N.; Boysen, H.; Frey, F.; Metzger, T.; Born, E. Cation substitution models of congruent LiNbO3 investigated by X-ray and neutron powder diffraction. J. Phys. Chem. Solids 1994, 55, 145–152. [Google Scholar] [CrossRef]
- Wilkinson, A.P.; Cheetham, A.K.; Jarman, R.H. The defect structure of congruently melting lithium niobate. J. Appl. Phys. 1998, 74, 3080–3083. [Google Scholar] [CrossRef]
- DeLeo, G.G.; Dobson, J.L.; Masters, M.F.; Bonjack, L.H. Electronic structure of an oxygen vacancy in lithium niobate. Phys. Rev. B 1988, 37, 8394–8400. [Google Scholar] [CrossRef]
- Peterson, G.E.; Carnevale, A. 93Nb NMR Linewidths in Nonstoichiometric Lithium Niobate. J. Chem. Phys. 1972, 56, 4848–4851. [Google Scholar] [CrossRef]
- Ye, N.; Wang, J.-Y.; Boughton, R.I.; Hong, M.-C. Chapter 20. Functional Crystals. In Modern Inorganic Synthethic Chemistry, 2nd ed.; Xu, R., Xu, Y., Eds.; Elsevier, B. V.: Amsterdam, The Netherlands, 2017; pp. 575–611. [Google Scholar]
- Shannon, R.D.; Prewitt, C.T. Effective Ionic Radii in Oxides and Flourides. Acta Cryst. 1969, B25, 925–946. [Google Scholar] [CrossRef]
- Kim, S.; Gopalan, V.; Kitamura, K.; Furukawa, Y. Domain reversal and nonstoichiometry in lithium tantalate. J. Appl. Phys. 2001, 90, 2949–2963. [Google Scholar] [CrossRef]
- Iyi, N.; Kitamura, K.; Izumi, F.; Yamamoto, J.K.; Hayashi, T.; Asano, H.; Kimura, S. Comparative of defect structures in lithium niobate with different compositions. J. Soild State Chem. 1992, 101, 340–352. [Google Scholar] [CrossRef]
- Zotov, N.; Frey, F.; Boysen, H.; Lehnert, H.; Hornsteiner, A.; Strauss, B.; Sonntag, R.; Mayer, H.M.; Güthoff, F.; Hohlwein, D. X-ray and neutron diffuse scattering in LiNbO3 from 38 to 1200 K. Acta Crystallogr. B 1995, 51, 961–972. [Google Scholar] [CrossRef]
- Blumel, J.; Born, E.; Metzger, T. Solid State NMR study supporting the lithium vacancy defect model in congruent lithium niobate. J. Phys. Chem. Solids 1994, 55, 589–593. [Google Scholar] [CrossRef]
- Yatsenko, A.V.; Ivanova-Maksimova, H.M.; Sergeev, N.A. NMR study of intrinsic defects in congruent LiNbO3. 2. “Overlapping” defects. Phys. B Condens. Matter 1998, 254, 256–259. [Google Scholar] [CrossRef]
- Donnerberg, H.; Tomlinson, S.M.; Catlow, C.R.A. Defects in LiNbO3—II Computer simulation. J. Phys. Chem. Solids 1991, 52, 201–210. [Google Scholar] [CrossRef]
- Safaryan, F.P.; Feigelson, R.S.; Petrosyan, A.M. An approach to the defect structure analysis of lithium niobate single crystals. J. Appl. Phys. 1999, 85, 8079–8082. [Google Scholar] [CrossRef]
- Li, Q.; Wang, B.; Woo, C.H.; Wang, H.; Wang, R. First-principles study on the formation energies of intrinsic defects in LiNbO3. J. Phys. Chem. Solids 2007, 68, 1336–1340. [Google Scholar] [CrossRef]
- Abdi, F.; Fontana, M.D.; Aillerie, M.; Bourson, P. Coexistence of Li and Nb vacancies in the defect structure of pure LiNbO3 and its relationship to optical properties. Appl. Phys. A 2006, 83, 427–434. [Google Scholar] [CrossRef]
- Li, Y.; Sanna, S.; Schmidt, W.G. Modeling intrinsic defects in LiNbO3 within the Slater-Janak transition state model. J. Chem. Phys. 2014, 140, 234113. [Google Scholar] [CrossRef]
- Ivanova, E.M.; Sergeev, N.A.; Yatsenko, A.V. Analysis of Intrinsic Defects in the Lithium Niobate Structure by the NMR 7Li Method. Krist. Crystallogr. Rep. 1998, 43, 303–306. [Google Scholar]
- Yatsenko, A.V.; Ivanova, E.N.; Sergeev, N.A. NMR study of intrinsic defects in congruent LiNbO3. 1. “Unoverlapping” defects. Phys. B Condens. Matter 1997, 240, 254–262. [Google Scholar] [CrossRef]
- Gopalan, V.; Dierolf, V.; Scrymgeour, D.A. Defect-Domain Wall Interactions in Trigonal Ferroelectrics. Annu. Rev. Mater. Res. 2007, 37, 449–489. [Google Scholar] [CrossRef] [Green Version]
- Boysen, H.; Altorfer, F. A Neutron Powder Investigation of the High-Temperature Structure and Phase Transition in LiNbO3. Acta Cryst. 1994, B50, 405–414. [Google Scholar] [CrossRef]
- Lehnert, H.; Boysen, H.; Frey, F.; Hewat, A.; Radaelli, P. A neutron powder investigation of the high-temperature structure and phase transition in stoichiometric LiNbO3. Z. Krist. Cryst. Mater. 1997, 212, 712–719. [Google Scholar] [CrossRef] [Green Version]
- Etschmann, B.; Ishizawa, N.; Streltsov, V.; Oishi, S. A synchrotron X-ray diffraction analysis of near-stoichiometric LiNbO3. Z. Krist. Cryst. Mater. 2001, 216, 455–461. [Google Scholar] [CrossRef]
- Räuber, A. Chemistry and physics of lithium niobate. In Current Topics in Materials Science, 1st ed.; Kaldis, E., Ed.; North-Holland: Amsterdam, The Netherlands, 1978; Volume 1, pp. 481–601. [Google Scholar]
- Araujo, R.M.; Lengyel, K.; Jackson, R.A.; Valerio, M.E.G.; Kovács, L. Computer modelling of intrinsic and substitutional defects in LiNbO3. Phys. Status Solidi A 2007, 4, 1201–1204. [Google Scholar] [CrossRef]
- Araujo, R.M.; Lengyel, K.; Jackson, R.A.; Kovács, L.; Valerio, M.E.G. A computational study of intrinsic and extrinsic defects in LiNbO3. J. Phys. Condens. Matter 2007, 19, 046211. [Google Scholar] [CrossRef]
- Wang, W.; Zheng, D.; Hu, M.; Saeed, S.; Liu, H.; Kong, Y.; Zhang, L.; Xu, J. Effect of Defects on Spontaneous Polarization in Pure and Doped LiNbO3: First-Principles Calculations. Materials 2019, 12, 100. [Google Scholar] [CrossRef] [Green Version]
- Köhler, T.; Mehner, E.; Hanzig, J.; Gärtner, G.; Stöcker, H.; Leisegang, T.; Meyer, D.C. Real structure influencing the hydrogen defect chemistry in congruent LiNbO3 and LiTaO3. J. Solid State Chem. 2016, 244, 108–115. [Google Scholar] [CrossRef]
- Li, Y.; Schmidt, W.G.; Sanna, S. Defect complexes in congruent LiNbO3 and their optical signatures. Phys. Rev. B 2015, 91, 174106. [Google Scholar] [CrossRef] [Green Version]
- Xu, H.; Lee, D.; Sinnott, S.B.; Dierolf, V.; Gopalan, V.; Phillpot, S.R. Structure and diffusion of intrinsic defect complexes in LiNbO3 from density functional theory calculations. J. Phys. Condens. Matter 2010, 22, 135002. [Google Scholar] [CrossRef] [PubMed] [Green Version]
- Lejaeghere, K.; Bihlmayer, G.; Björkman, T.; Blaha, P.; Blügel, S.; Blum, V.; Caliste, D.; Castelli, I.E.; Clark, S.J.; Dal Corso, A.; et al. Reproducibility in density functional theory calculations. Science 2016, 351, aad3000. [Google Scholar] [CrossRef] [PubMed] [Green Version]
- Jones, R.O. Density functional theory: Its origins, rise to prominence and future. Rev. Mod. Phys. 2015, 87, 897–923. [Google Scholar] [CrossRef] [Green Version]
- Szalay, V.; Lengyel, K.; Kovács, L.; Timón, V.; Hernández-Laguna, A. Vibrations of H+ (D+) in stoichiometric LiNbO3 single crystal. J. Chem. Phys. 2011, 135, 124501. [Google Scholar] [CrossRef] [PubMed]
- Lengyel, K.; Timón, V.; Hernández-Laguna, A.; Szalay, V.; Kovács, L. Structure of OH− defects in LiNbO3. IOP Conf. Ser. Mater. Sci. Eng. 2010, 15, 012015. [Google Scholar] [CrossRef]
- Li, L.; Li, Y.; Zhao, X. Doping stability of nonphotorefractive ions in stoichiometric and congruent LiNbO3. Phys. Chem. Chem. Phys. 2018, 20, 17477–17486. [Google Scholar] [CrossRef]
- Volk, T.; Wöhlecke, M. General Introduction to Photorefraction in LiNbO3. In Springer Series in Materials Science 115. Lithium Niobate. Defects, Photorefraction and Ferroelectric Switching, 1st ed.; Hull, R., Osgood, R.M., Jr., Parisi, J., Warlimont, H., Eds.; Springer: Berlin/Heidelberg, Germany, 2009; Volume 115, pp. 51–74. [Google Scholar]
- Ashkin, A.; Boyd, G.D.; Dziedzic, J.M.; Smith, R.G.; Ballman, A.A.; Levinstein, J.J.; Nassau, K. Optically-induced refractive index inhomogeneities in LiNbO3 and LiTaO3. Appl. Phys. Lett. 1966, 9, 72–74. [Google Scholar] [CrossRef]
- Furukawa, Y.; Sato, M.; Nitanda, F.; Ito, K. Growth and characterization of MgO-Doped LiNbO3 for electro-optic devices. J. Cryst. Growth 1990, 99, 832–836. [Google Scholar] [CrossRef]
- Furukawa, Y.; Yokotani, A.; Sasaki, T.; Yoshida, H.; Yoshida, K.; Nitanda, F.; Sato, M. Investigation of bulk laser damage threshold of lithium niobate single crystals by Q-switched pulsed laser. J. Appl. Phys. 1991, 69, 3372–3374. [Google Scholar] [CrossRef]
- Dunn, M.H.; Ebrahimzadeh, M. Parametric Generation of Tunable Light from Continuous-Wave to Femtosecond Pulses. Science 1999, 286, 1513–1517. [Google Scholar] [CrossRef]
- Ilchenko, V.S.; Savchenkov, A.A.; Matsko, A.B.; Meleki, L. Nonlinear Optics and Crystalline Whispering Gallery Mode Cavities. Phys. Rev. Lett. 2004, 92, 043903. [Google Scholar] [CrossRef] [PubMed]
- Guarino, A.; Poberaj, G.; Rezzonico, D.; Degl’Innocenti, R.; Günter, P. Electro-optically tunable microring resonators in lithium niobate. Nat. Photon. 2007, 1, 407–410. [Google Scholar] [CrossRef]
- Canalias, C.; Pasiskevicius, V. Mirrorles optical parametric oscillator. Nat. Photon. 2007, 1, 459–462. [Google Scholar] [CrossRef]
- Sulyanov, S.; Volk, T. Lattice Parameter of Optical Damage Resistant In-Doped LiNbO3 Crystals. Crystals 2018, 8, 210. [Google Scholar] [CrossRef] [Green Version]
- Kong, Y.; Liu, S.; Xu, J. Recent Advances in the Photorefraction of Doped Lithium Niobate Crystals. Materials 2012, 5, 1954–1971. [Google Scholar] [CrossRef] [Green Version]
- Dhar, L.; Curtis, K.; Fäcke, T. Coming of age. Nat. Poton. 2008, 2, 403–405. [Google Scholar] [CrossRef]
- Haw, M. The light fantastic. Nature 2003, 422, 556–558. [Google Scholar] [CrossRef]
- Staebler, D.L.; Phillips, W. Fe-Doped for Read-Write Applications. Appl. Opt. 1974, 13, 788–794. [Google Scholar] [CrossRef]
- von der Linde, D.; Glass, A.M.; Rodgers, K.F. Multiphoton photorefractive processes for optical storage in LiNbO3. Appl. Phys. Lett. 1974, 25, 155–157. [Google Scholar] [CrossRef]
- Keune, W.; Date, S.K.; Dézsi, I.; Gonser, U. Mösbauser-effect study of Co57 and Fe57 impurities in ferroelectric LiNbO3. J. Appl. Phys. 1975, 46, 3914–3924. [Google Scholar] [CrossRef]
- Falk, M.; Buse, K. Thermoelectric-method for nearly complete oxidation of highly iron-doped lithium niobate crystals. Appl. Phys. B 2005, 81, 853–855. [Google Scholar] [CrossRef]
- Li, S.; Liu, S.; Kong, Y.; Xu, J.; Zhang, G. Enhanced photorefractive properties of LiNbO3:Fe crystals by HfO2 codoping. Appl. Phys. Lett. 2006, 89, 101126. [Google Scholar] [CrossRef]
- Xu, C.; Yang, C.; Zhu, C.; Sun, T.; Wang, R.; Xu, Y. Improved nonvolatile holographic storage properties in Zr:Ru:Fe:LiNbO3 crystal by blue light recording. Mater. Lett. 2012, 67, 320–322. [Google Scholar] [CrossRef]
- Dong, Y.; Liu, S.; Li, W.; Kong, Y.; Chen, S.; Xu, J. Improved ultraviolet photorefractive properties of vanadium-doped lithium niobate crystals. Opt. Lett. 2011, 36, 1779–1781. [Google Scholar] [CrossRef]
- Dong, Y.; Liu, S.; Kong, Y.; Chen, S.; Rupp, R.; Xu, J. Fast photorefractive response of vanadium-doped lithium niobate in the visible region. Opt. Lett. 2012, 37, 1841–1843. [Google Scholar] [CrossRef]
- Tian, T.; Kong, Y.; Liu, S.; Li, W.; Wu, L.; Chen, S.; Xu, J. Photorefraction of molybdenum-doped lithium niobate crystals. Opt. Lett. 2012, 37, 2679–2681. [Google Scholar] [CrossRef] [PubMed]
- Kovács, L.; Kocsor, L.; Szaller, Z.; Hajdara, I.; Dravecz, G.; Lengyel, K.; Corradi, G. Lattice Site of Rare-Earth Ions in Stoichiometric Lithium Niobate Probed by OH− Vibrational Spectroscopy. Crystals 2017, 7, 230. [Google Scholar] [CrossRef] [Green Version]
- García-Solé, J.; Bausá, L.E.; Jaque, D.; Montoya, E.; Murrieta, H.; Jaque, F. Rare earth and transition metal ion centers in LiNbO3. Spectrochim. Acta Part A 1998, 54, 1571–1581. [Google Scholar] [CrossRef]
- Lande, D.; Orlov, S.S.; Akella, A.; Hesselink, L.; Neurgaonkar, R.R. Digital holographic storage system incorporating optical fixing. Opt. Lett. 1997, 22, 1722–1724. [Google Scholar] [CrossRef]
- Lee, M.; Takekawa, S.; Furukawa, Y.; Kitamura, K.; Hatano, H.; Tanaka, S. Nonvolatile two-color holographic recording in Tb-doped LiNbO3. Appl. Phys. Lett. 2000, 76, 1653–1655. [Google Scholar] [CrossRef]
- Kaminow, I.P.; Stulz, L.W. Nd:LiNbO3 laser. IEEE J. Quantum Electron. 1975, 11, 306–308. [Google Scholar] [CrossRef]
- Fan, T.Y.; Cordova-Plaza, A.; Digonnet, M.J.F.; Byer, R.L.; Shaw, H.J. Nd:MgO:LiNbO3 spectroscopy and laser devices. J. Opt. Soc. Am. B 1986, 3, 140–148. [Google Scholar] [CrossRef]
- Yamamoto, J.K.; Sugimoto, A.; Yamagishi, K. Self-frequency doubling in Nd,Sc2O3:LiNbO3 at room temperature. Opt. Lett. 1994, 19, 1311–1313. [Google Scholar] [CrossRef] [PubMed]
- Lhomme, F.; Bourson, P.; Fontana, M.D.; Malovichko, G.; Aillerie, M.; Kokanyan, E. Luminescence of Cr3+ in lithium niobate: Influence of the chromium concentration and crystal composition. J. Phys. Condens. Matter 1998, 10, 1137–1146. [Google Scholar] [CrossRef]
- Qiu, Y. Assesment of tunable laser crystal LiNbO3:Cr3+. J. Phys. Condens. Matter 1993, 5, 2041–2044. [Google Scholar] [CrossRef]
- Babadjanyan, V.G.; Kokanyan, E.P.; Kostanyan, R.B.; Nikogosyan, V.R. Spectral and kinetic properties of LiNbO3:Cr3+ crystals. Opt. Commun. 1990, 78, 247–249. [Google Scholar] [CrossRef]
- Levinstein, H.J.; Ballman, A.A.; Denton, R.T.; Ashkin, A.; Dziedzic, J.M. Reduction of the Susceptibility to Optically Induced Index Inhomogeneities in LiTaO3 and LiNbO3. J. Appl. Phys. 1967, 38, 3101–3102. [Google Scholar] [CrossRef]
- Smith, R.G.; Fraser, D.B.; Denton, R.T.; Rich, T.C. Correlation of Reduction in Optically Induced Refractive-Index Inhomogeneity with OH Content in LiTaO3 and LiNbO3. J. Appl. Phys. 1968, 39, 4600–4602. [Google Scholar] [CrossRef]
- Zhong, G.G.; Jin, J.; Wu, Z.K. Measurements of Optically Induced Refractive-Index Damage of Lithium Niobate Doped with Different Concentrations of Mg. In Proceedings of the 11th International Quantum Electronics Conference, Boston, MA, USA, 23–26 June 1980; Volume 70, p. 631. [Google Scholar]
- Wöhlecke, M.; Kovács, L. OH− ions in Oxide Crystals. Crit. Rev. Solid State Mater. Sci. 2001, 26, 1–86. [Google Scholar] [CrossRef]
- Cabrera, J.M.; Olivares, J.; Carrascosa, M.; Rams, J.; Müller, R.; Diéguez, E. Hydrogen in lithium niobate. Adv. Phys. 1996, 45, 349–392. [Google Scholar] [CrossRef]
- Kovács, L.; Szalay, V.; Capelleti, R. Stoichiomnetry dependence of the OH− absorption band in LiNbO3 crystals. Solid State Commun. 1984, 52, 1029–1031. [Google Scholar] [CrossRef]
- Thomas, D.G.; Lander, J.J. Hydrogen as a Donor in Zinc Oxide. J. Chem. Phys. 1956, 25, 1136–1142. [Google Scholar] [CrossRef]
- Norby, T.; Wideroe, M.; Glöckner, R.; Larring, Y. Hydrogen in oxides. Dalton Trans. 2004, 3012–3018. [Google Scholar] [CrossRef]
- Müller, R.; Arizmendi, L.; Carrascosa, M.; Cabrera, J.M. Determination of H concentration in LiNbO3 by photorefractive fixing. Appl. Phys. Lett. 1992, 60, 3212–3214. [Google Scholar] [CrossRef]
- Rice, C.E. The Structure and Properties of Li1−xHxNbO3. J. Solid State Chem. 1986, 64, 188–199. [Google Scholar] [CrossRef]
- Polgár, K.; Péter, Á.; Kovács, L.; Corradi, G.; Szaller, Z. Growth of stoichiometric LiNbO3 single crystals by top seeded solution growth method. J. Cryst. Growth 1997, 177, 211–216. [Google Scholar] [CrossRef]
- Kovács, L.; Szaller, Z.; Lengyel, K.; Corradi, G. Hydroxyl ions in stoichiometric LiNbO3 crystals doped with optical damage resistant ions. Opt. Mater 2014, 37, 55–58. [Google Scholar] [CrossRef]
- Bäumer, C.; David, C.; Betzler, K.; Hesse, H.; Lengyel, K.; Kovács, L.; Wöhlecke, M. Composition dependence of the OH-stretch-mode spectrum in lithium tantalate. Phys. Stat. Solidi A 2004, 201, R13–R16. [Google Scholar] [CrossRef]
- Bollmann, W.; Gernand, M. On the disorder of LiNbO3 crystals. Phys. Stat. Solidi A 1972, 9, 301–308. [Google Scholar] [CrossRef]
- Bredikhin, S.; Scharner, S.; Klingler, M.; Kveder, V.; Red’kin, B.; Weppner, W. Nonstoichiometry and electrocoloration due to injection of Li+ and O2− ions into lithium niobate crystals. J. Appl. Phys. 2000, 88, 5687–5694. [Google Scholar] [CrossRef]
- Schirmer, O.F.; Imlau, M.; Merschjann, C.; Schoke, B. Electron small polarons and bipolarons in LiNbO3. J.Phys. Condens. Matter 2009, 21, 123201. [Google Scholar] [CrossRef] [PubMed]
- Imlau, M.; Badorreck, H.; Merschjann, C. Optical nonlinearities of small polarons in lithium niobate. Appl. Phys. Rev. 2015, 2, 040606. [Google Scholar] [CrossRef] [Green Version]
- Clark, M.G.; DiSalvo, F.J.; Glass, A.M.; Peterson, G.E. Electronic structure and optical index damage of iron-doped lithium niobate. J. Chem. Phys. 1973, 59, 6209–6219. [Google Scholar] [CrossRef]
- Eagles, D.M. Optical Absorption in Ionic Crystals Involving Small Polarons. Phys. Rev. 1963, 130, 1381–1400. [Google Scholar] [CrossRef]
- Klinger, M. Quantum theory of non-steady-state conductivity in low mobility solids. Phys. Lett. 1963, 7, 102–104. [Google Scholar] [CrossRef]
- Reik, H.G. Optical properties of small polarons in the infrared. Solid State Commun. 1963, 1, 67–71. [Google Scholar] [CrossRef]
- Reik, H.G.; Heese, D. Frequency dependence of the electrical conductivity of small polarons for high and low temperatures. J. Phys. Chem. Solids 1967, 28, 581–596. [Google Scholar] [CrossRef]
- Austin, I.G.; Mott, N.F. Polarons in crystalline and non-crystalline materials. Adv. Phys. 1969, 18, 41–102. [Google Scholar] [CrossRef]
- Bryksin, V.V.; Voloshin, V.S.; Raitsev, A.V. Sov. Phys. Solid State 1983, 25, 820.
- Emin, D. Optical properties of large and small polarons and bipolarons. Phys. Rev. B 1993, 48, 13691–13702. [Google Scholar] [CrossRef]
- Alexandrov, A.S.; Mott, N.F. Bipolarons. Rep. Prog. Phys. 1994, 57, 1197–1288. [Google Scholar] [CrossRef]
- Zylbersztejn, A. Thermally activated trapping in Fe-Doped LiNbO3. Appl. Phys. Lett. 1976, 29, 778–780. [Google Scholar] [CrossRef]
- Schirmer, O.F.; von der Linde, D. Two-photon- and x-ray-induced Nb4+ and O− small polarons in LiNbO3. Appl. Phys. Lett. 1978, 33, 35–38. [Google Scholar] [CrossRef]
- von der Linde, D.; Schirmer, O.F.; Kurz, H. Intrinsic Photorefractive Effect of LiNbO3. Appl. Phys. 1978, 15, 153–156. [Google Scholar] [CrossRef]
- Karaseva, L.G.; Bondarenko, G.P.; Gromov, V.V. Investigation of optical active centres of the irradiated lithium niobate. Radiat. Phys. Chem. 1977, 10, 241–245. [Google Scholar] [CrossRef]
- Bernhardt, H.J. Comparative studies of the LNT coloration of Y3Al5O12, YAlO3, and LiNbO3 crystals. Phys. Status Solidi A 1976, 33, 211–216. [Google Scholar] [CrossRef]
- Schirmer, O.F. Optical Absorption of Small Polarons Bound in Octahedral Symmetry: V− Type Centers in Alkaline Earth Oxides. Z. Physik B 1976, 24, 235–244. [Google Scholar] [CrossRef]
- Arizmendi, L.; Cabrera, J.M.; Agulló-López, F. Defects induced in pure and doped LiNbO3 by irradiation and thermal reduction. J. Phys. C Solid State Phys. 1984, 17, 515–529. [Google Scholar] [CrossRef]
- Ketchum, J.L.; Sweeney, K.L.; Halliburton, L.E. Vacuum Annealing Effects in Lithium Niobate. Phys. Lett. 1983, 94A, 450–453. [Google Scholar] [CrossRef]
- Sweeney, K.L.; Halliburton, L.E. Oxygen vacancies in lithium niobate. Appl. Phys. Lett. 1983, 43, 336–338. [Google Scholar] [CrossRef]
- Smyth, D.M. Defects and transport in LiNbO3. Ferroelectrics 1983, 50, 93–102. [Google Scholar] [CrossRef]
- Jhans, H.; Honig, J.M.; Rao, C.N.R. Optical properties of reduced LiNbO3. J. Phys. C Solid State Phys. 1986, 19, 3649–3658. [Google Scholar] [CrossRef]
- Schirmer, O.F.; Juppe, S.; Koppitz, J. Electron-spin-resonance, optical and photovoltaic studies of reduced undoped LiNbO3. Cryst. Latt. Def. Amorph. Mater. 1987, 16, 353–357. [Google Scholar]
- Koppitz, J.; Schirmer, O.F.; Kuznetsov, A.I. Thermal Dissociation of Bipolarons In Reduced Undoped LiNbO3. Europhys. Lett. 1987, 4, 1055–1059. [Google Scholar] [CrossRef]
- Chakraverty, B.K.; Sienko, M.J.; Bonnerot, J. Low-temperature specific heat and magnetic susceptibility of nonmetallic vanadium bronzes. Phys. Rev. B 1978, 17, 3781–3789. [Google Scholar] [CrossRef]
- Schirmer, O.F.; Salje, E. Conduction bipolarons in low-temperature crystalline WO3−x. J. Phys. C Solid State Phys. 1980, 13, L1067–L1072. [Google Scholar] [CrossRef]
- Dutt, D.A.; Feigl, F.J.; DeLeo, G.G. Optical absorption and electron paramagnetic resonance studies of chemically reduced congruent lithium niobate. J. Phys. Chem. Solids 1990, 51, 407–415. [Google Scholar] [CrossRef]
- Krätzig, E.; Schirmer, O.F. Photorefractive centers in electro-optic crystals. In Photorefractive Materials and Their Applications, I. Topics in Applied Physics; Günter, P., Huignard, J.P., Eds.; Springer: Berlin/Heidelberg, Germany, 1988; Volume 61, pp. 131–166. [Google Scholar]
- Tsonev, L. Luminiscent activation of planar optical waveguides in LiNbO3 with rare earth ions Ln3+—A review. Opt. Mater. 2008, 30, 892–899. [Google Scholar] [CrossRef]
- Herrington, J.R.; Dischler, B.; Räuber, A.; Schneider, J. An optical study of the stretching absorption band near 3 microns from OH− defects in LiNbO3. Solid State Commun. 1973, 12, 351–354. [Google Scholar] [CrossRef]
- Klauer, S.; Wöhlecke, M. Incorporation of hydrogen in cubic and uniaxial oxidic crystals deduced from polarized Raman scattering. Phys. Rev. B 1994, 49, 158–181. [Google Scholar] [CrossRef]
- Bryan, D.A.; Gerson, R.; Tomaschke, H.E. Increased optical damage resistance in lithium niobate. Appl. Phys. Lett. 1984, 44, 847–849. [Google Scholar] [CrossRef]
- Bryan, D.A.; Rice, R.R.; Gerson, R.; Tomaschke, H.E.; Sweeney, K.L.; Halliburton, L.E. Magnesium-Doped Lithium Niobate For Higher Optical Power Applications. Opt. Eng. 1985, 24, 241138. [Google Scholar] [CrossRef]
- Sweeney, K.L.; Halliburton, L.E.; Bryan, D.A.; Rice, R.R.; Gerson, R.; Tomaschke, H.E. Point defects in Mg-doped lithium niobate. J. Appl. Phys. 1985, 57, 1036–1044. [Google Scholar] [CrossRef]
- Liu, J.; Zhang, W.; Zhang, G. Defect Chemistry Analysis of the Defect Structure in Mg-Doped LiNbO3 Crystals. Phys. Status Solidi A 1996, 156, 285–291. [Google Scholar] [CrossRef]
- Grabmaier, B.C.; Otto, F. Growth and investigation of MgO-doped LiNbO3. J. Cryst. Growth 1986, 79, 682–688. [Google Scholar] [CrossRef]
- Lengyel, K.; Kovács, L.; Péter, Á.; Polgár, K.; Corradi, G. The effect of stoichiometry and Mg doping on the Raman spectra of LiNbO3:Mg crystals. Appl. Phys. B 2007, 87, 317–322. [Google Scholar] [CrossRef]
- Donnerberg, H. Comments on the Defect Chemistry of Magnesium-Doped Lithium Niobate (LiNbO3). J. Solid State Chem. 1996, 123, 208–214. [Google Scholar] [CrossRef]
- Lengyel, K.; Péter, Á.; Polgár, K.; Kovács, L.; Corradi, G. UV and IR absorption studies in LiNbO3:Mg crystals below and above the photorefractive threshold. Phys. Status Solidi C 2005, 2, 171–174. [Google Scholar] [CrossRef]
- Pálfalvi, L.; Hebling, J.; Almási, G.; Péter, A.; Polgár, K.; Lengyel, K.; Szipöcs, R. Nonlinear refraction and absorption of Mg doped stoichiometric and congruent LiNbO3. J. Appl. Phys. 2004, 95, 902–908. [Google Scholar] [CrossRef] [Green Version]
- Pálfalvi, L.; Almási, G.; Hebling, J.; Péter, Á.; Polgár, K. Measurement of laser-induced refractive index changes of Mg-doped congruent and stoichiometric LiNbO3. Appl. Phys. Lett. 2002, 80, 2245–2247. [Google Scholar] [CrossRef]
- Polgár, K.; Kovács, L.; Földvári, I.; Cravero, I. Spectroscopic and electrical conductivity investigation of Mg doped LiNbO3 single crystals. Solid State Commun. 1986, 59, 375–379. [Google Scholar] [CrossRef]
- Kovács, L.; Szaller, Z.; Lengyel, K.; Péter, Á.; Hajdara, I.; Mandula, G.; Pálfvalvi, L.; Hebling, J. Photorefractive damage resistance threshold in stoichiometric LiNbO3:Zr crystals. Opt. Lett. 2013, 38, 2861–2864. [Google Scholar] [CrossRef] [Green Version]
- Kovács, L.; Polgár, K.; Capelletti, R. IR absorption study of OH− in pure and Mg-doped LiNbO3 single crystals. Cryst. Latt. Def. Amorph. Mater. 1987, 15, 115–121. [Google Scholar]
- Dravecz, G.; Kovács, L. Determination of the crystal composition from OH− vibrational spectrum in lithium niobate. Appl. Phys. B 2007, 88, 305–307. [Google Scholar] [CrossRef]
- Kovács, L.; Wöhlecke, M.; Jovanovic, A.; Polgár, K.; Kapphan, S. Infrared absorption study of the OH vibrational band in LiNbO3 crystals. J. Phys. Chem. Solids 1991, 52, 797–803. [Google Scholar] [CrossRef]
- Freytag, F.; Corradi, G.; Imlau, M. Atomic insight to lattice distortions caused by carrier self-trapping in oxide materials. Sci. Rep. 2016, 6, 36929. [Google Scholar] [CrossRef] [PubMed] [Green Version]
- Berben, D.; Buse, K.; Wevering, S.; Herth, P.; Imlau, M.; Woike, T. Lifetime of small polarons in iron-doped lithium-niobate crystals. J. App. Phys. 2000, 87, 1034–1041. [Google Scholar] [CrossRef]
- Herth, P.; Schaniel, D.; Woike, T.; Graznow, T.; Imlau, M.; Krätzig, E. Polarons generated by laser pulses in doped LiNbO3. Phys. Rev. B 2005, 71, 125128. [Google Scholar] [CrossRef]
- Herth, P.; Graznow, T.; Schaniel, D.; Woike, T.; Imlau, M.; Krätzig, E. Evidence for Light-Induced Hole Polarons in LiNbO3. Phys. Rev. Lett. 2005, 95, 067404. [Google Scholar] [CrossRef]
- Beyer, O.; Maxein, D.; Woike, T.; Buse, K. Generation of small bound polarons in lithium niobate crystals on the subpicosecond time scale. Appl. Phys. B 2006, 83, 527–530. [Google Scholar] [CrossRef]
- Kong, Y.; Liu, S.; Zhao, Y.; Liu, H.; Chen, S.; Xu, J. High optical damage resistant crystal: Zirconium-oxide-doped lithium niobate. Appl. Phys. Lett. 2007, 91, 081908. [Google Scholar]
- Chen, S.; Liu, H.; Kong, Y.; Huang, Z.; Xu, J.; Zhang, G. The resistance against optical damage of near-stoichiometric LiNbO3:Mg crystals prepared by vapor transport equilibration. Opt. Mater. 2007, 29, 885–888. [Google Scholar]
- Liu, H.; Liang, Q.; Zhu, M.; Li, W.; Liu, S.; Zhang, L.; Chen, S.; Kong, Y.; Xu, J. An excellent crystal for high resistance against optical damage in visible-UV range: Near-stoichiometric zirconium-doped lithium niobate. Opt. Exp. 2011, 19, 1743–1748. [Google Scholar]
- Schlarb, U.; Wöhlecke, M.; Gather, B.; Reichert, A.; Betzler, K.; Volk, T.; Rubinina, N. Refractive indices of Zn-doped lithium niobate. Opt. Mater. 1995, 4, 791–795. [Google Scholar]
- Schlarb, U.; Matzas, B.; Reichert, A.; Betzler, K.; Wöhlecke, M.; Gather, B.; Volk, T. Refractive indices of Zn/In-co-doped lithium niobate. Ferroelectrics 1996, 185, 269–272. [Google Scholar]
- Liu, F.; Kong, Y.; Li, W.; Liu, H.; Liu, S.; Chen, S.; Zhang, X.; Rupp, R.; Xu, J. High resistance against ultraviolet photorefraction in zirconium-doped lithium niobate crystals. Opt. Lett. 2010, 35, 10–12. [Google Scholar] [PubMed]
- Xu, J.; Zhang, G.; Li, F.; Zhang, X.; Sun, Q.; Liu, S.; Song, F.; Kong, Y.; Chen, X.; Qiao, H.; et al. Enhancement of ultraviolet photorefraction in highly magnesium-doped lithium niobate crystals. Opt. Lett. 2000, 25, 129–131. [Google Scholar]
- Qiao, H.; Xu, J.; Zhang, G.; Zhang, X.; Sun, Q.; Zhang, G. Ultraviolet photorefractive features in doped lithium niobate crystals. Phys. Rev. B 2004, 70, 094101. [Google Scholar]
- Razzari, L.; Minzioni, P.; Cristiani, I.; Degiorgio, V.; Kokanyan, E.P. Photorefractivity of Hafnium-doped congruent lithium–niobate crystals. Appl. Phys. Lett. 2005, 86, 131914. [Google Scholar]
- Li, S.; Liu, S.; Kong, Y.; Deng, D.; Gao, G.; Li, Y.; Gao, H.; Zhang, L.; Hang, Z.; Chen, S.; et al. The optical damage resistance and absorption spectra of LiNbO3:Hf crystals. J. Phys. Condens. Matter 2006, 18, 3527–3534. [Google Scholar]
- Minzioni, P.; Cristiani, I.; Degiorgio, V.; Kokanyan, E.P. Strongly sublinear growth of the photorefractive effect for increasing pump intensities in doped lithium-niobate crystals. J. Appl. Phys. 2007, 101, 116105. [Google Scholar]
- Minzioni, P.; Cristiani, I.; Yu, J.; Parravicini, J.; Kokanyan, E.P.; Degiorgio, V. Linear and nonlinear optical properties of Hafnium-doped lithium-niobate crystals. Opt. Express 2007, 15, 14171–14176. [Google Scholar] [CrossRef]
- Kimura, H.; Uda, S. Conversion of non-stoichiometry of LiNbO3 to constitutional stoichiometry by impurity doping. J. Cryst. Growth 2009, 311, 4094–4101. [Google Scholar] [CrossRef]
- Kimura, H.; Taniuchi, T.; Iida, S.; Uda, S. Bulk crystal growth of congurent MgO-Doped LiNbO3 crystal with stoichiometric structure and its second-harmonic-generation properties. J. Cryst. Growth 2010, 312, 3425–3427. [Google Scholar]
- Rebouta, L.; Smulders, P.J.M.; Boerma, D.O.; Agúllo-López, F.; da Silva, M.F.; Soares, J.C. Ion-beam channeling yields of host and impurity atoms in LiNbO3: Computer simulations. Phys. Rev. B 1993, 48, 3600–3610. [Google Scholar]
- Kling, A.; Soares, J.C.; da Silva, M.F. Channeling Investigations of Oxide Materials for Optoelectronic Applications. In Insulating Materials for Optoelectronics: New Developments; Agúllo-López, F., Ed.; World Scientific: Singapore, 1995; pp. 175–200. [Google Scholar]
- Xue, D.; He, X. Dopant occupancy and structural stability of doped lithium niobate crystals. Phys. Rev B 2006, 73, 064113. [Google Scholar] [CrossRef]
- Donnerberg, H.; Tomlinson, S.M.; Catlow, C.R.A.; Schirmer, O.F. Computer-simulation studies of extrinsic defects in LiNbO3 crystals. Phys. Rev. B 1991, 44, 4877–4883. [Google Scholar]
- Feng, X.; Wang, D.; Zhang, J. NMR Spectra of Mg Nuclei in Mg-Doped LiNbO3 Crystals. Phys. Stat. Solidi B 1990, 157, K127–K130. [Google Scholar]
- Chernaya, T.S.; Maksimov, B.A.; Volk, T.R.; Rubinina, N.M.; Simonov, V.I. Zn atoms in lithium niobate and mechanism of their insertion into crystals. JETP Lett. 2000, 73, 103–106. [Google Scholar]
- Volk, T.; Maximov, B.; Chernaya, T.; Rubinina, N.; Wöhlecke, M.; Simonov, V. Photorefractive properties of LiNbO3:Zn crystals related to the defect structure. Appl. Phys. B 2001, 72, 647–652. [Google Scholar]
- Sulyanov, S.; Maximov, B.; Volk, T.; Boysen, H.; Schneider, J.; Rubininca, N.; Hansen, T. Neutron and X-ray study of stoichiometric and doped LiNbO3:Zn0.08. Appl. Phys. A 2001, 74, s1031–s1033. [Google Scholar]
- Volk, T.R.; Rubinina, N.M.; Pryalkin, V.I.; Krasnikov, V.V.; Volkov, V.V. Optical and non-linear optical investigations in LiNbO3:Mg and LiNbO3:Zn. Ferroelectrics 1990, 109, 345–350. [Google Scholar]
- Volk, T.R.; Pryalkin, V.I.; Rubinina, N.M. Optical-damage-resistant LiNbO3:Zn crystal. Opt. Lett. 1990, 15, 996–998. [Google Scholar] [PubMed]
- Volk, T.; Maximov, B.; Sulyanov, S.; Rubinina, N.; Wöhlecke, M. Relation of the photorefraction and optical-damage resistance to the intrinsic defect structure in LiNbO3 crystals. Opt. Mater. 2003, 23, 229–233. [Google Scholar] [CrossRef]
- Marques, J.G.; Kling, A.; Soares, J.C.; Rebouta, L.; da Silva, M.F.; Diéguez, E.; Agulló-López, F. Lattice site location of Hf in LiNbO3: Influence of dopant concentration and crystal stoichiometry. Nuclr. Instr. Meth. B 1998, 136–138, 431–435. [Google Scholar] [CrossRef]
- Marques, J.G.; Kling, A.; Rebouta, L.; da Silva, M.F.; Melo, A.A.; Soares, J.C.; Serrano, M.D.; Diéguez, E.; Agulló-López, F. Lattice Location of Hf in Near-Stoichiometric LiNbO3: RBS/Channeling and PAC Studies. Mater. Sci. Forum 1997, 248–249, 395–398. [Google Scholar]
- Chia, C.-T.; Lee, C.-C.; Chang, P.-J.; Hu, M.-L.; Hu, L.-J. Substitution mechanism of ZnO-doped lithium niobate crystal determined by powder x-ray diffraction and coercive field. Appl. Phys. Lett. 2005, 86, 182901. [Google Scholar] [CrossRef]
- Argiolas, N.; Bazzan, M.; Ciampolillo, M.V.; Pozzobon, P.; Sada, C.; Saoner, L.; Zaltron, A.M.; Bacci, L.; Minzioni, P.; Nava, G.; et al. Structural and optical properties of zirconium doped lithium niobate crystals. J. Appl. Phys. 2010, 108, 093508. [Google Scholar] [CrossRef]
- Iyi, N.; Kitamura, K.; Yajima, Y.; Kimura, S.; Furukawa, Y.; Sato, M. Defect Structure Modelo f MgO-Doped LiNbO3. J. Solid State Chem. 1995, 118, 148–152. [Google Scholar]
- Hammoum, R.; Fontana, M.D.; Gilliot, M.; Bourson, P.; Kokanyan, E.P. Site spectroscopy of Hf doping in Hf-doped LiNbO3 crystals. Solid State Comm. 2009, 149, 1967–1970. [Google Scholar]
- Kokanyan, N.; Chapron, D.; Kokanyan, E.; Fontana, M.D. Zr doping on lithium niobate crystals: Raman spectroscopy and chemometrics. J. Appl. Phys. 2017, 121, 095103. [Google Scholar] [CrossRef]
- Zheng, D.; Kong, Y.; Liu, S.; Chen, M.; Chen, S.; Zhang, L.; Rupp, R.; Xu, J. The simultaneous enhancement of photorefraction and optical damage resistance in MgO and Bi2O3 co-doped LiNbO3 crystals. Sci. Rep. 2016, 6, 20308. [Google Scholar] [CrossRef] [PubMed] [Green Version]
- Zheng, D.; Wang, W.; Wang, S.; Qu, D.; Liu, H.; Kong, Y.; Liu, S.; Chen, S.; Rupp, R.; Xu, J. Real-time dynamic holographic display realized by bismuth and magnesium co-doped lithium niobate. Appl. Phys. Lett. 2019, 114, 241903. [Google Scholar] [CrossRef]
- Bader, S.D. Colloquium: Opportunities in nanomagnetism. Rev. Mod. Phys. 2006, 78, 1–15. [Google Scholar] [CrossRef]
- Cullity, B.D.; Graham, C.D. Introduction to Magnetic Materials, 2nd ed.; IEEE/Wiley: Hoboken, NJ, USA, 2009. [Google Scholar]
- Spaldin, N.A. Magnetic Materials, 2nd ed.; Cambridge University Press: Cambridge, UK, 2010. [Google Scholar]
- Coey, J.M.D.; Venkatesan, M.; Fitzgerald, C.B. Donor impurity band exchange in dilute ferromagnetic oxides. Nat. Mater. 2005, 4, 173–179. [Google Scholar] [CrossRef]
- Villalobos-Mendoza, S.D.; Holguín-Momaca, J.T.; Elizalde-Galindo, J.T.; Carrillo-Flores, D.M.; Olive-Méndez, S.F.; Farías-Mancilla, J.R. Iron-Doped Lithium Tantalate Thin Films Deposited by Magnetron Sputtering: A Study of Iron Role in the Structure and the Derived Magnetic Properties. Crystals 2020, 10, 50. [Google Scholar] [CrossRef] [Green Version]
- Song, Y.-J.; Zhang, Q.-H.; Shen, X.; Ni, X.-D.; Yao, Y.; Yu, R.-C. Room-Temperature Magnetism Realized by Doping Fe into Ferroelectric LiTaO3. Chin. Phys. Lett. 2014, 31, 017501. [Google Scholar] [CrossRef]
- Verma, K.C.; Gupta, V.; Kaur, J.; Kotnala, R.K. Raman spectra, photoluminescence, magnetism and magnetoelectric coupling in pure and Fe doped BaTiO3 nanostructures. J. Alloy. Compnd. 2013, 578, 5–11. [Google Scholar] [CrossRef]
- Zeng, F.; Sheng, P.; Tang, G.S.; Pan, F.; Yan, W.S.; Hu, F.C.; Zou, Y.; Huang, Y.Y.; Jiang, Z.; Guo, D. Electronic structure and magnetism of Fe-doped LiNbO3. Mater. Chem. Phys. 2012, 136, 783–788. [Google Scholar] [CrossRef]
- Yao, D.; Zhou, X.; Ge, S. Raman scattering and room temperature ferromagnetism in Co-doped SrTiO3 particles. Appl. Surf. Sci. 2011, 257, 9233–9236. [Google Scholar] [CrossRef]
- Chen, C.; Zeng, F.; Li, J.H.; Sheng, P.; Luo, J.T.; Yang, Y.C.; Pan, F.; Zou, Y.; Huang, Y.Y.; Jiang, Z. Strong d–d electron interaction inducing ferromagnetism in Mn-doped LiNbO3. Thin Film Solids 2011, 520, 764–768. [Google Scholar] [CrossRef]
- Coey, J.M.D. Dilute Magnetic Oxides. Curr. Opin. Solid State Mater. Sci. 2006, 10, 83–92. [Google Scholar] [CrossRef]
- Coey, J.M.D.; Mlack, J.T.; Venkatesan, M.; Stamenov, P. Magnetization Process in Dilute Magnetic Oxides. IEEE Trans. Magn. 2010, 46, 2501–2503. [Google Scholar] [CrossRef]
- Dietl, T.; Ohno, H.; Matsukura, F.; Cibert, J.; Ferrand, D. Zener model description of ferromagnetism in zinc-blende magnetic semiconductors. Science 2000, 287, 1019–1022. [Google Scholar] [CrossRef] [PubMed] [Green Version]
- Edwards, D.M.; Katsnelson, M.I. High-temperature ferromagnetism of sp electrons in narrow impurity bands: Application to CaB6. J. Phys. Condens. Matter 2006, 18, 7209–7225. [Google Scholar] [CrossRef] [Green Version]
- Coey, J.M.D.; Wongsaprom, K.; Alaria, J.; Venkatesan, M. Charge-transfer ferromagnetism in oxide nanoparticles. J. Phys. D Appl. Phys. 2008, 41, 134012. [Google Scholar] [CrossRef]
- Song, C.; Zeng, F.; Shen, Y.X.; Geng, K.W.; Xie, Y.N.; Wu, Z.Y.; Pan, F. Local Co structure and ferromagnetism in ion-implanted Co-doped LiNbO3. Phys. Rev. B 2006, 73, 172412. [Google Scholar] [CrossRef]
- Vitova, T.; Hormes, J.; Falk, M.; Buse, K. Site-selective investigation of site symmetry and site occupation of iron in Fe-doped lithium niobate crystals. J. Appl. Phys. 2009, 105, 013524. [Google Scholar] [CrossRef] [Green Version]
- Olimov, K.; Falk, M.; Buse, K.; Woike, T.; Hormes, J.; Modrow, H. X-ray absorption near edge spectroscopy investigations of valency and lattice occupation site of Fe in highly iron-doped lithium niobate crystals. J. Phys. Condes. Matter 2006, 18, 5135–5146. [Google Scholar] [CrossRef]
- Bush, T.S.; Catlow, C.R.A.; Chadwick, A.V.; Cole, M.; Geatches, R.M.; Greaves, G.N.; Tomlinson, S.M. Studies of cation dopant sites in metal oxides by EXAFS and computer-simulation techniques. J. Mater. Chem. 1992, 2, 309–316. [Google Scholar] [CrossRef]
- Ye, J.; Sun, X.; Wu, Z.; Liu, J.; An, Y. Evidence of the oxygen vacancies-induced room temperature ferromagnetism in multiferroic Co-doped LiNbO3 films. J. Alloy. Compnd. 2018, 768, 750–755. [Google Scholar] [CrossRef]
- Sheng, P.; Zeng, F.; Tang, G.S.; Pan, F.; Yan, W.S.; Hu, F.C. Structure and ferromagnetism in vanadium-doped LiNbO3. J. Appl. Phys. 2012, 112, 033913. [Google Scholar] [CrossRef]
- Song, C.; Wang, C.; Liu, X.; Zeng, F.; Pan, F. Room Temperature Ferromagnetism in Cobalt-Doped LiNbO3 Single Crystalline Films. Cryst. Growth Des. 2009, 9, 1235–1239. [Google Scholar] [CrossRef]
- Song, C.; Wang, C.Z.; Yang, Y.C.; Liu, X.J.; Zeng, F.; Pan, F. Room temperature ferromagnetism and ferroelectricity in cobalt-doped LiNbO3 film. Appl. Phys. Lett. 2008, 92, 262901. [Google Scholar] [CrossRef]
- Yang, D.-S.; Sung, N.; Yeom, T.H. Local Structure of Fe-Doped LiNbO3 Crystal Measured by X-ray Absorption Fine Structure. J. Phys. Soc. Jpn. 2009, 78, 114605. [Google Scholar] [CrossRef]
- Bu, D.; Fu, Y.; Sun, N.; Li, C.; Li, Y.; An, Y.; Liu, J. Effect of Cu doping on room temperature ferromagnetic behavior of Mn doped LiNbO3 films. J. Cryst. Growth 2016, 453, 198–202. [Google Scholar] [CrossRef]
- Fierro-Ruíz, C.D.; Sánchez-Dena, O.; Cabral-Larquier, E.M.; Elizalde-Galindo, J.T.; Farías, R. Structural and Magnetic Behavior of Oxidized and Reduced Fe Doped LiNbO3 Powders. Crystals 2018, 8, 108. [Google Scholar] [CrossRef] [Green Version]
- Díaz-Moreno, C.A.; Farías-Mancilla, R.; Matutes-Aquino, J.A.; Elizalde-Galindo, J.; Espinosa-Magaña, F.; Hernández-González, J.; Hurtado-Macías, A. Magnetic behavior in LiNbO3 nanocrystallites caused by oxygen vacancies. J. Magn. Magn. Mater. 2014, 356, 82–86. [Google Scholar] [CrossRef]
- Díaz-Moreno, C.; Farias, R.; Hurtado-Macias, A.; Elizalde-Galindo, J.; Hernandez-Paz, J. Multiferroic response of nanocrystalline lithium niobate. J. Appl. Phys. 2012, 111, 07D907. [Google Scholar] [CrossRef]
- Ishii, M.; Ohta, D.; Uehara, M.; Kimishima, Y. Ferromagnetism of Nano-LiNbO3 with Vacancies. Trans. Mat. Res. Soc. Jpn. 2012, 37, 443–446. [Google Scholar] [CrossRef] [Green Version]
- Cao, E.; Zhang, Y.; Qin, H.; Zhang, L.; Hu, J. Vacancy-induced magnetism in ferroelectric LiNbO3 and LiTaO3. Phys. B Condens. Matter 2013, 410, 68–73. [Google Scholar] [CrossRef]
- Yan, T.; Ye, N.; Xu, L.; Sang, Y.; Chen, Y.; Song, W.; Long, X.; Wang, J.; Liu, H. Ferromagnetism in chemically reduced LiNbO3 and LiTaO3 crystals. J. Phys. D Appl. Phys. 2016, 49, 195005. [Google Scholar] [CrossRef]
- Kocsor, L.; Péter, L.; Corradi, G.; Kis, Z.; Gubicza, J.; Kovács, L. Mechanochemical Reactions of Lithium Niobate Induced by High-Energy Ball-Milling. Crystals 2019, 9, 334. [Google Scholar] [CrossRef] [Green Version]
- Abrahams, S.C.; Reddy, J.M.; Bernstein, J.L. Ferroelectric Lithium Niobate—3. Single crystal X-ray diffraction study at 24 °C. J. Phys. Chem. Solids 1966, 27, 971–1012. [Google Scholar]
- Abrahams, S.C.; Reddy, J.M.; Bernstein, J.L. Ferroelectric Lithium Tantalate—1. Single crystal X-ray diffraction study at 24 °C. J. Phys. Chem. Solids 1967, 28, 1685–1692. [Google Scholar] [CrossRef]
- Huband, S.; Keeble, D.S.; Zhang, N.; Glazer, A.M.; Bartasyte, A.; Thomas, P.A. Crystallographic and optical study of LiNb1−xTaxO3. Acta Cryst. 2017, B73, 498–506. [Google Scholar] [CrossRef] [PubMed] [Green Version]
- Sidorov, N.V.; Serebryakov, Y.A. Investigation of structural peculiarities of impure lithium niobate crystals by Raman spectroscopy. Vib. Spectrosc. 1994, 6, 215–223. [Google Scholar] [CrossRef]
- Bäumer, C.; David, C.; Tunyagi, A.; Betzler, K.; Hesse, H.; Krätzig, E.; Wöhlecke, M. Composition dependene of the ultraviolet absorption edge in lithium tantalite. J. Appl. Phys. 2003, 93, 3102–3104. [Google Scholar] [CrossRef]
- Kovács, L.; Ruschhaupt, G.; Polgár, K.; Corradi, G.; Wöhlecke, M. Composition dependence of the ultraviolet absorption edge in lithium niobate. Appl. Phys. Lett. 1997, 70, 2801–2803. [Google Scholar] [CrossRef]
- Young, S.-L.; Kao, M.-C.; Chen, H.-Z. The properties of tantalum modified lithium niobate thin films prepared by a diol-based sol-gel process. Eur. Phys. J. Appl. Phys. 2006, 36, 5–10. [Google Scholar] [CrossRef]
- Kao, M.C.; Chen, H.Z.; Yang, S.L.; Chen, Y.C.; Hsieh, P.T.; Yu, C.C. Pyroelectric Ta-modified LiNbO3 thin films and devices for thermal infrared detection. Thin Film Solids 2008, 516, 5518–5522. [Google Scholar] [CrossRef]
- Irzaman; Sitompul, H.; Masitoh; Misbakhusshudur, M.; Mursyidah. Optical and structural properties of lanthanum doped lithium niobate thin films. Ferroelectrics 2016, 502, 9–18. [Google Scholar] [CrossRef]
- Thierfelder, C.; Sanna, S.; Schindlmayr, A.; Schmidt, W.G. Do we know the band gap of lithium niobate? Phys. Status Solidi C 2010, 7, 362–365. [Google Scholar] [CrossRef]
Figure 1.
Statistics of peer-reviewed scientific reports on LiNbO3 from 1965 to mid-2020. According to the bibliographical survey done using The Web of Science database, data correspond to the sum of the in-title results obtained under typing ‘LiNbO3’ and ‘lithium niobate’ in the search engine. The insets show the cumulative distributions. Left: publications per year. Right: citations per year.
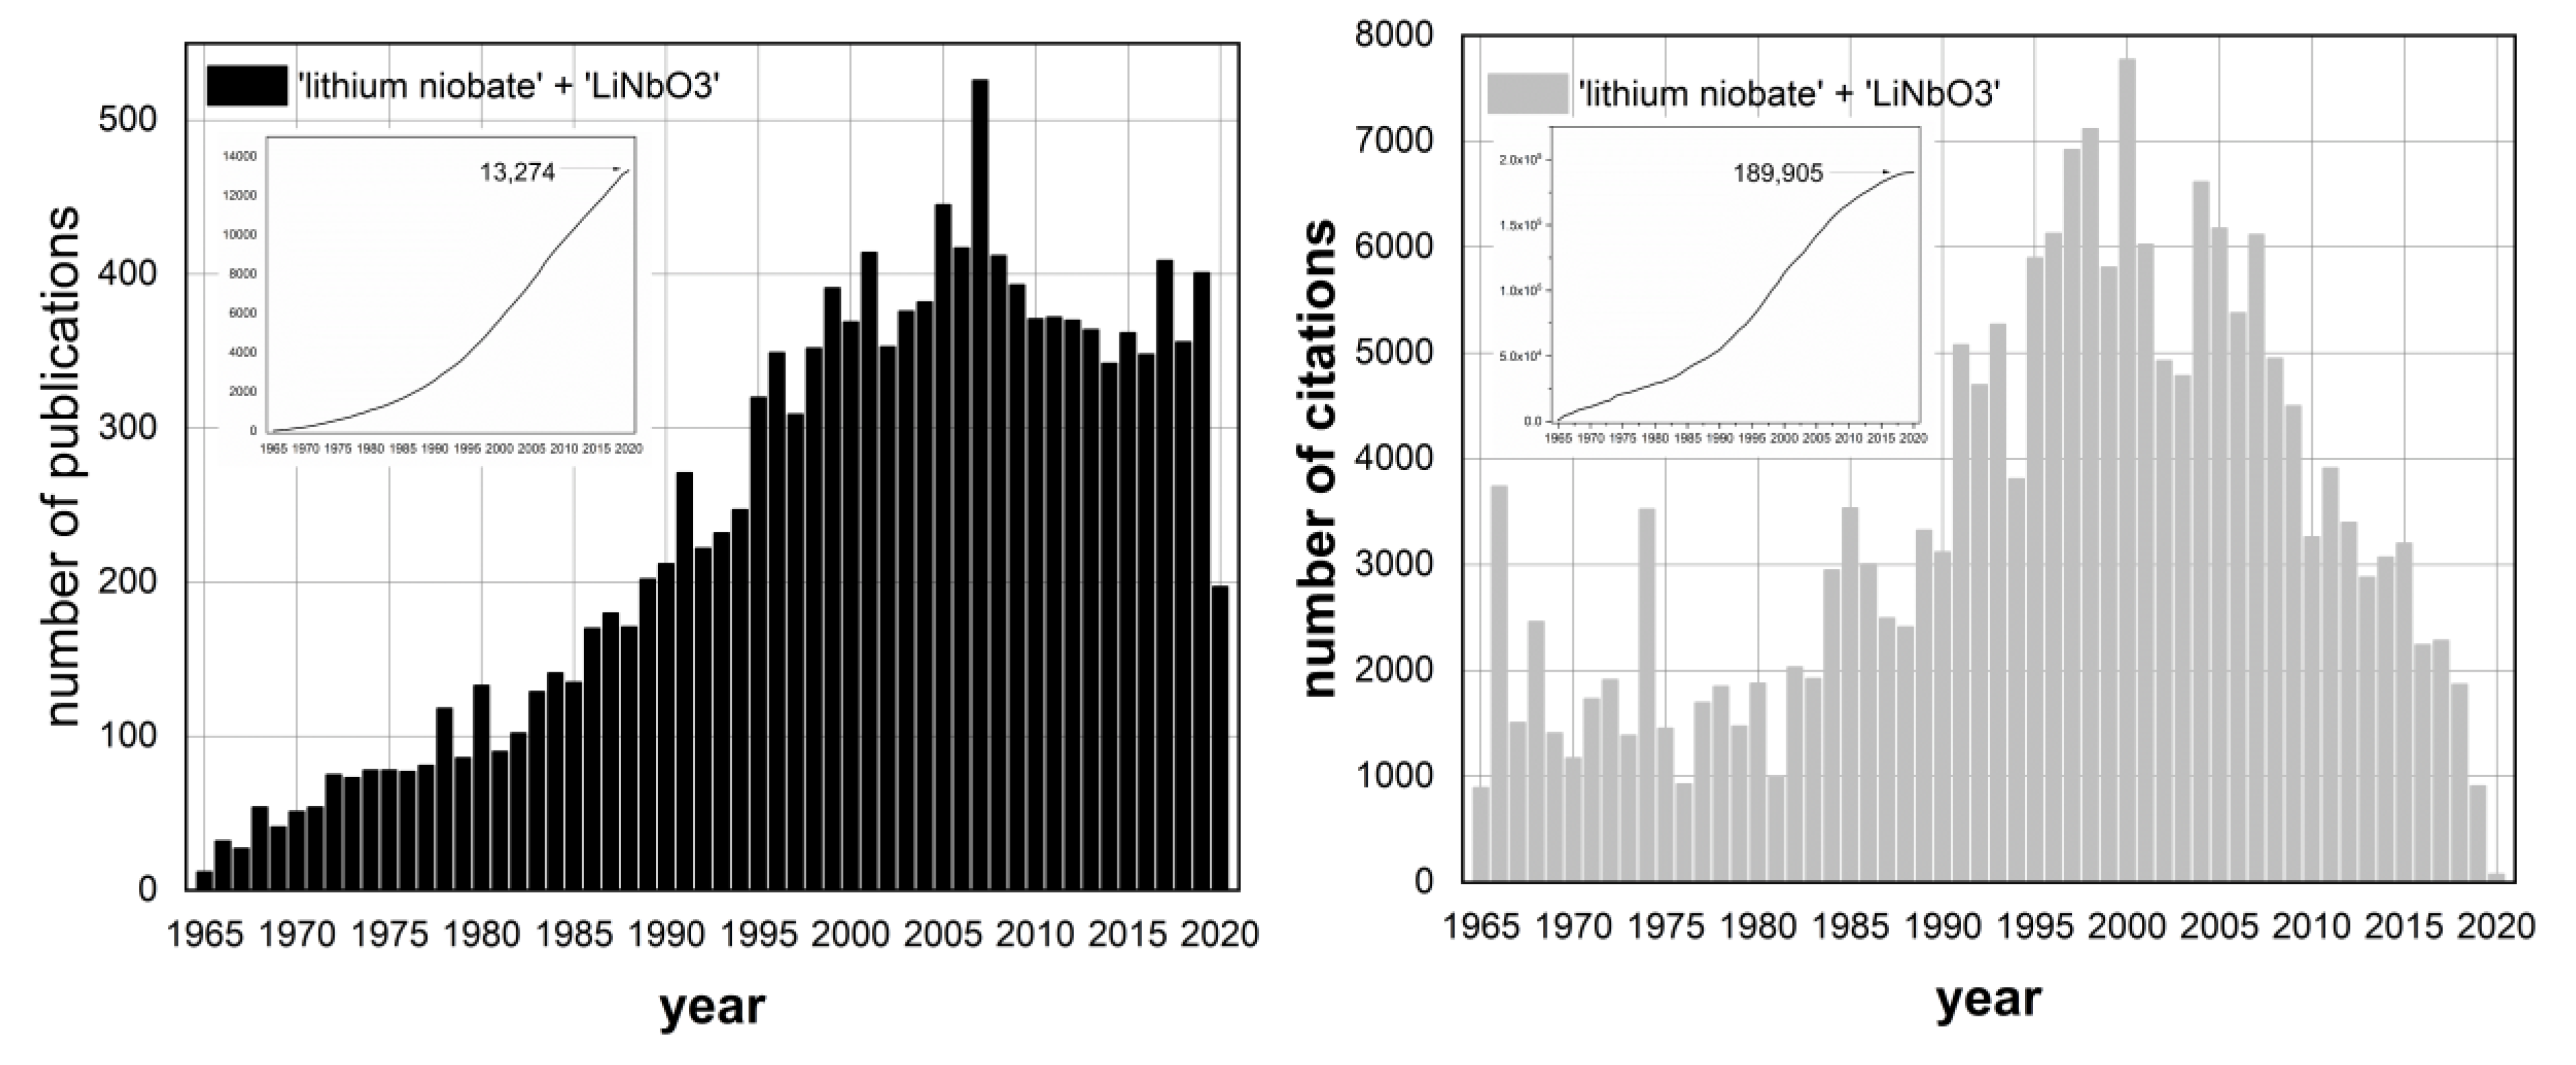
Figure 2.
Simulations are showing the viability of the lithium vacancy model based on first-principles calculations. Left: constructed phase diagram of the ternary system Li–Nb–O showing the points of interest A–F (different electronic environments). Right: formation energies for intrinsic defects in LiNbO3, as a function of the atomic chemical potential)—doi.org/10.1016/j.jpcs.2007.02.035 (Reproduced from Li, Q.; Wang, B.; Woo, C.H.; Wang, H.; Wang, R. First-principles study on the formation energies of intrinsic defects in LiNbO3. J. Phys. Chem. Solids 2007, 68, 1336–1340, with permission from Elsevier.)
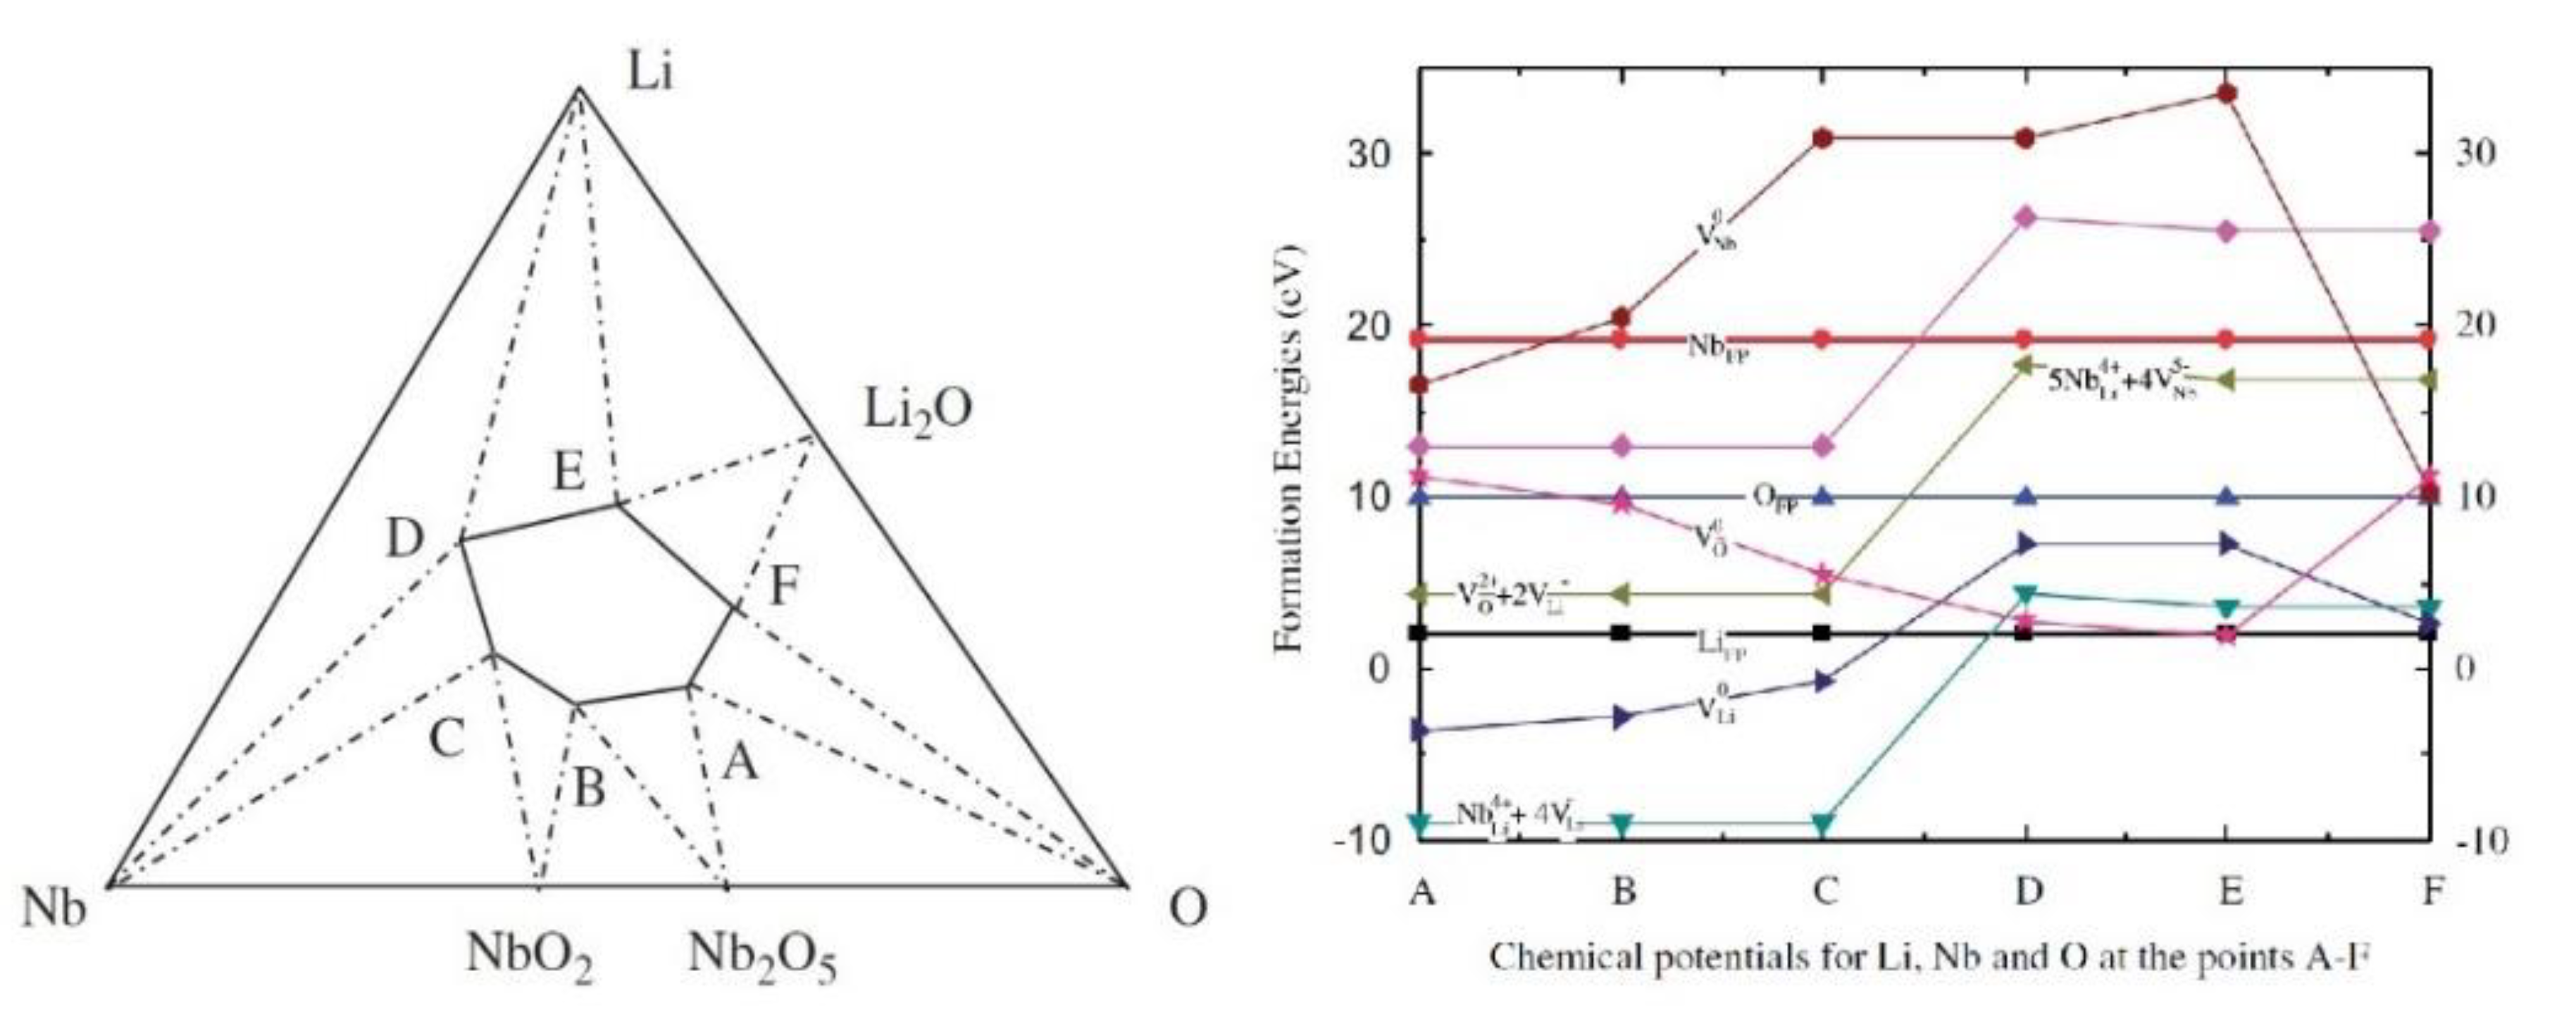
Figure 3.
Scheme of the LiNbO3 crystal structures according to the defect cluster models discussed above Left: Nb antisite surrounded by three first-neighbor Li vacancies and fourth one located at the c-polar axis, supporting the Li vacancy defect model. Right: interstitial Nb in the structural vacancies, compensated by five Li vacancies, supporting the empty site model—redrawn from the publication by Vyalikh et al. [9].

Figure 4.
The Periodic Table of Elements showing single elemental doping in LiNbO3, according to the consulted literature and classified in terms of the sought functionality: optical damage resistance (blue), photorefraction enhancement (yellow), laser activation (red), and ferromagnetism (gray). In black color Ta, La (new functionality), and the elements that have not been used alone but do have been used in double or triple co-doping (combined with the color of its corresponding functionality). Green color for interstitial impurities, usually created by ion-implantation techniques. Cases of double and triple co-doping are also shown below the table, using the same color code (the symbol * stands for simulation). By convention, from higher to lowest concentration within the crystal, the elements are written from left to right; some might be inaccurate.

Figure 5.
Infrared absorption bands from OH− ions in LiNbO3 with different crystal compositions measured at 300 K (room temperature): [Li]/[Nb] in (A, E, H) = (0.950, 0.988, 1.000)—doi.org/10.1016/S0022-0248(96)01098-6. (Reproduced from Polgár, K. Péter, Á.; Kovács, L.; Corradi, G.; Szaller, Zs. Growth of stoichiometric LiNbO3 single crystals by top seeded solution growth method. J. Cryst. Growth 1997, 177, 211–216, with permission from Elsevier.)
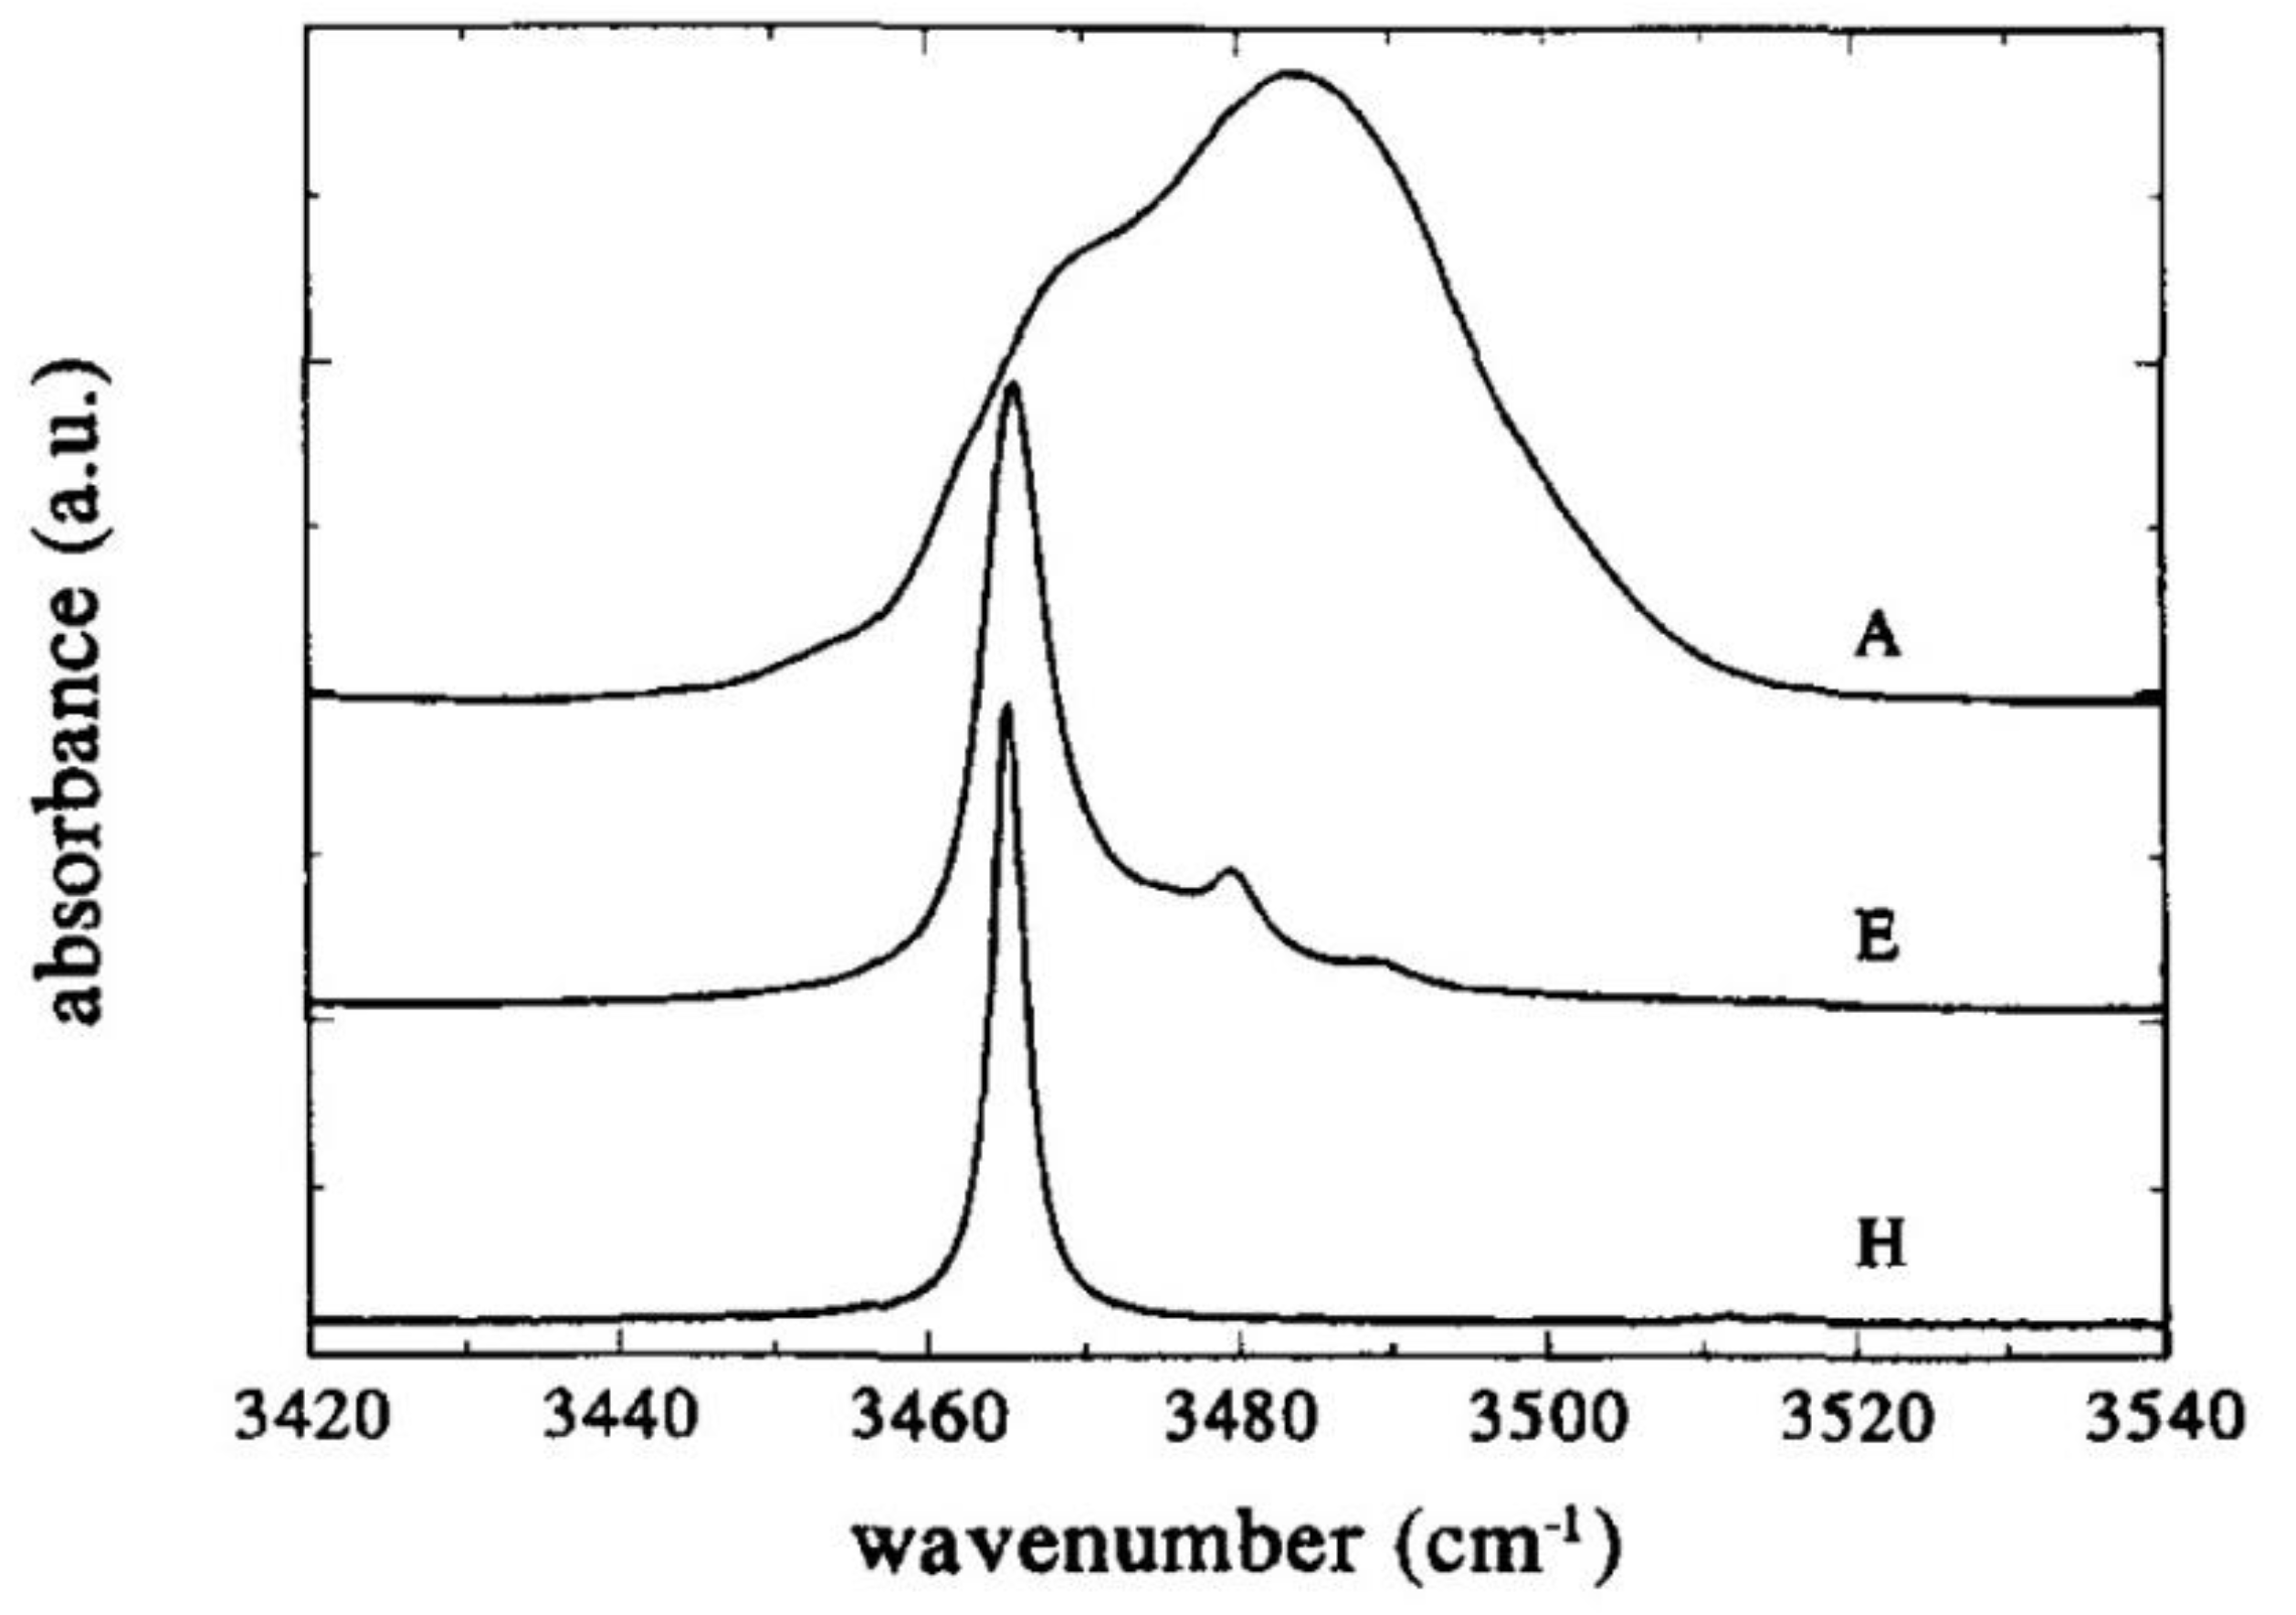
Figure 6.
Trends observed in the OH− absorption bands of ODRI doped-LiNbO3 (above the threshold) in terms of the valence state of the dopant. Left: angle θ between the polar c-axis of the crystal and the plane containing the stretch vibration of the O–H dipole. Center: IR absorption spectra for the seven known ODRI dopants, in the cases where multiple bands are observed, presumably the doping concentration is close to the threshold. Right: the vibrational frequency of the stretch vibration of the O–H dipole—doi.org/10.1016/j.optmat.2014.04.043 (Reproduced from Kovács, L.; Szaller, Zs.; Lengyel, K.; Corradi, G. Hydroxyl ions in stoichiometric LiNbO3 crystals doped with optical damage resistant ions. Opt. Mater 2014. 37, 55-58, with permission from Elsevier).

Figure 7.
Lorentzian-based resolution of the IR absorption band of a LiNbO3 crystal grown from a melt with [Li]/[Nb] = 1.2, using three (A), four (B), and five (C) components. The residue is enlarged by a factor of 10—doi.org/10.1016/022-3697(91)90078-E. (Reproduced from Kovács, L.; Wöhlecke, M.; Jovanovic, A.; Polgár, K.; Kapphan, S. Infrared absorption study of the OH vibrational band in LiNbO3 crystals. J. Phys. Chem. Solids 1991, 52, 797–803, with permission from Elsevier.)

Figure 8.
IR absorption spectra of near-stoichiometric LiNbO3 crystals, normalized to the band located at 3480 cm−1. Left: Li2O content of 49.72 (a), 49.80 (b), and 49.94 mol% (c). Right: intensity ratio of the two components at 3480 and 3465 cm−1 in terms of the crystal composition and measured at 0, 7.5, 16, and 18 months after crystal growth (squares, up-triangles, down-triangles, and circles, respectively)—doi.org/10.1007/s00340-007-2704-9. (Reproduced from Dravecz, G.; Kovács, L. Determination of the crystal composition from OH− vibrational spectrum in lithium niobate. Appl. Phys. B 2007, 88, 305–307, with permission of Springer Nature.)
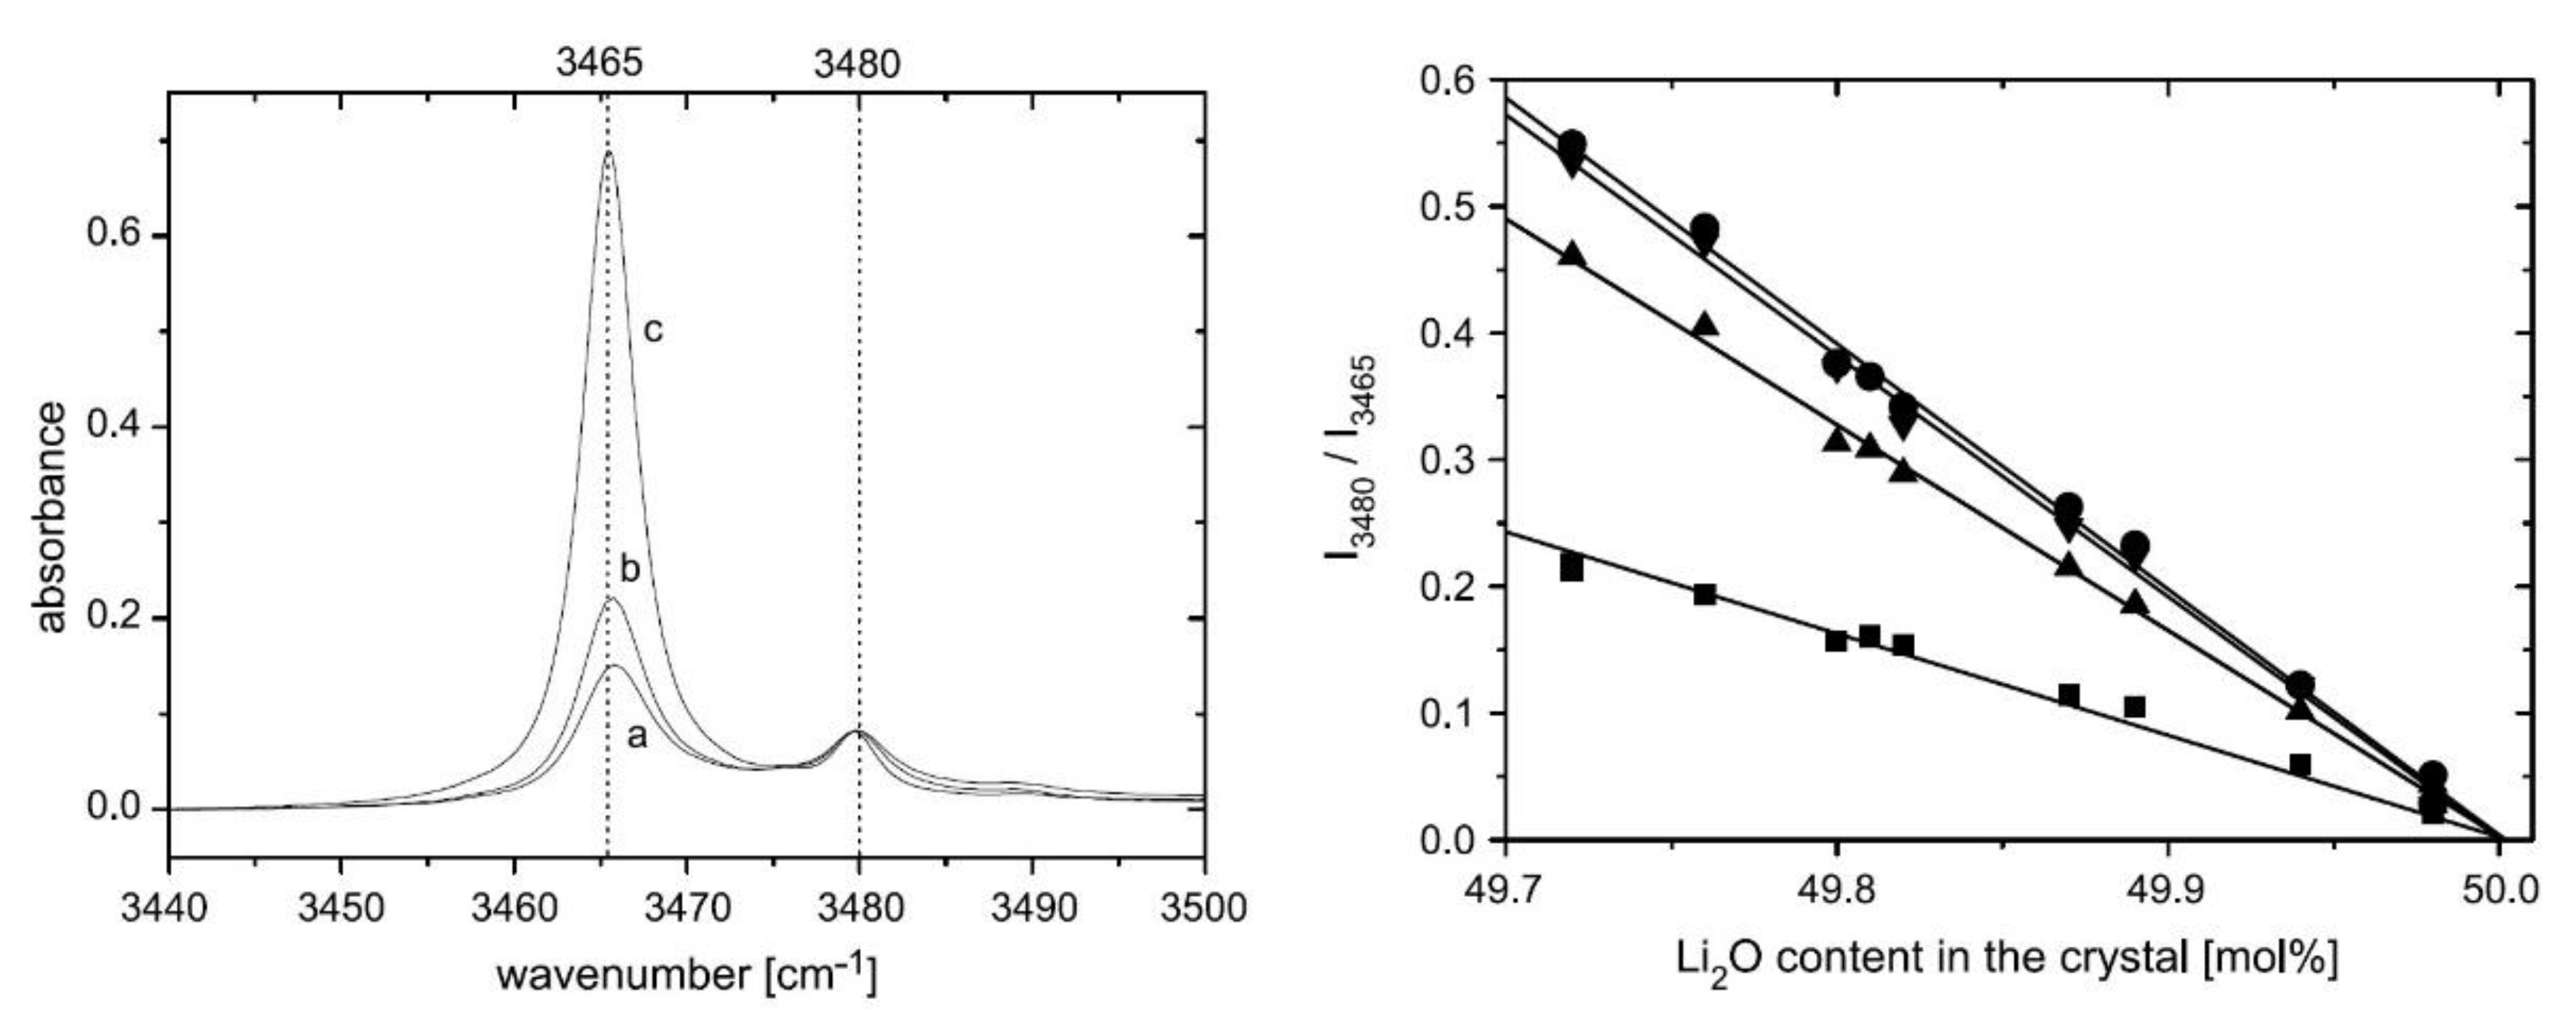
Figure 9.
cs-MgO:LN crystal. Left: equilibria phase diagram of the pseudo-ternary system Li2O–Nb2O5–MgO showing isothermal lines of the liquidus plane around the zone where the stoichiometric and congruent points coincide. Right: in-plane distribution of the non-critical phase-matching wavelength for cs-MgO:LN (a), cLN (b), LN:Mg—5mol% (c) and sLN (d)—doi.org/10.1016/j.jcrysgro.2010.08.056. (Reproduced from Kimura, H.; Taniuchi, T.; Iida, S.; Uda, S. Bulk crystal growth of congurent MgO-doped LiNbO3 crystal with stoichiometric structure and its second-harmonic-generation properties. J. Cryst. Growth 2010, 312, 3425–3427, with permission from Elsevier.)
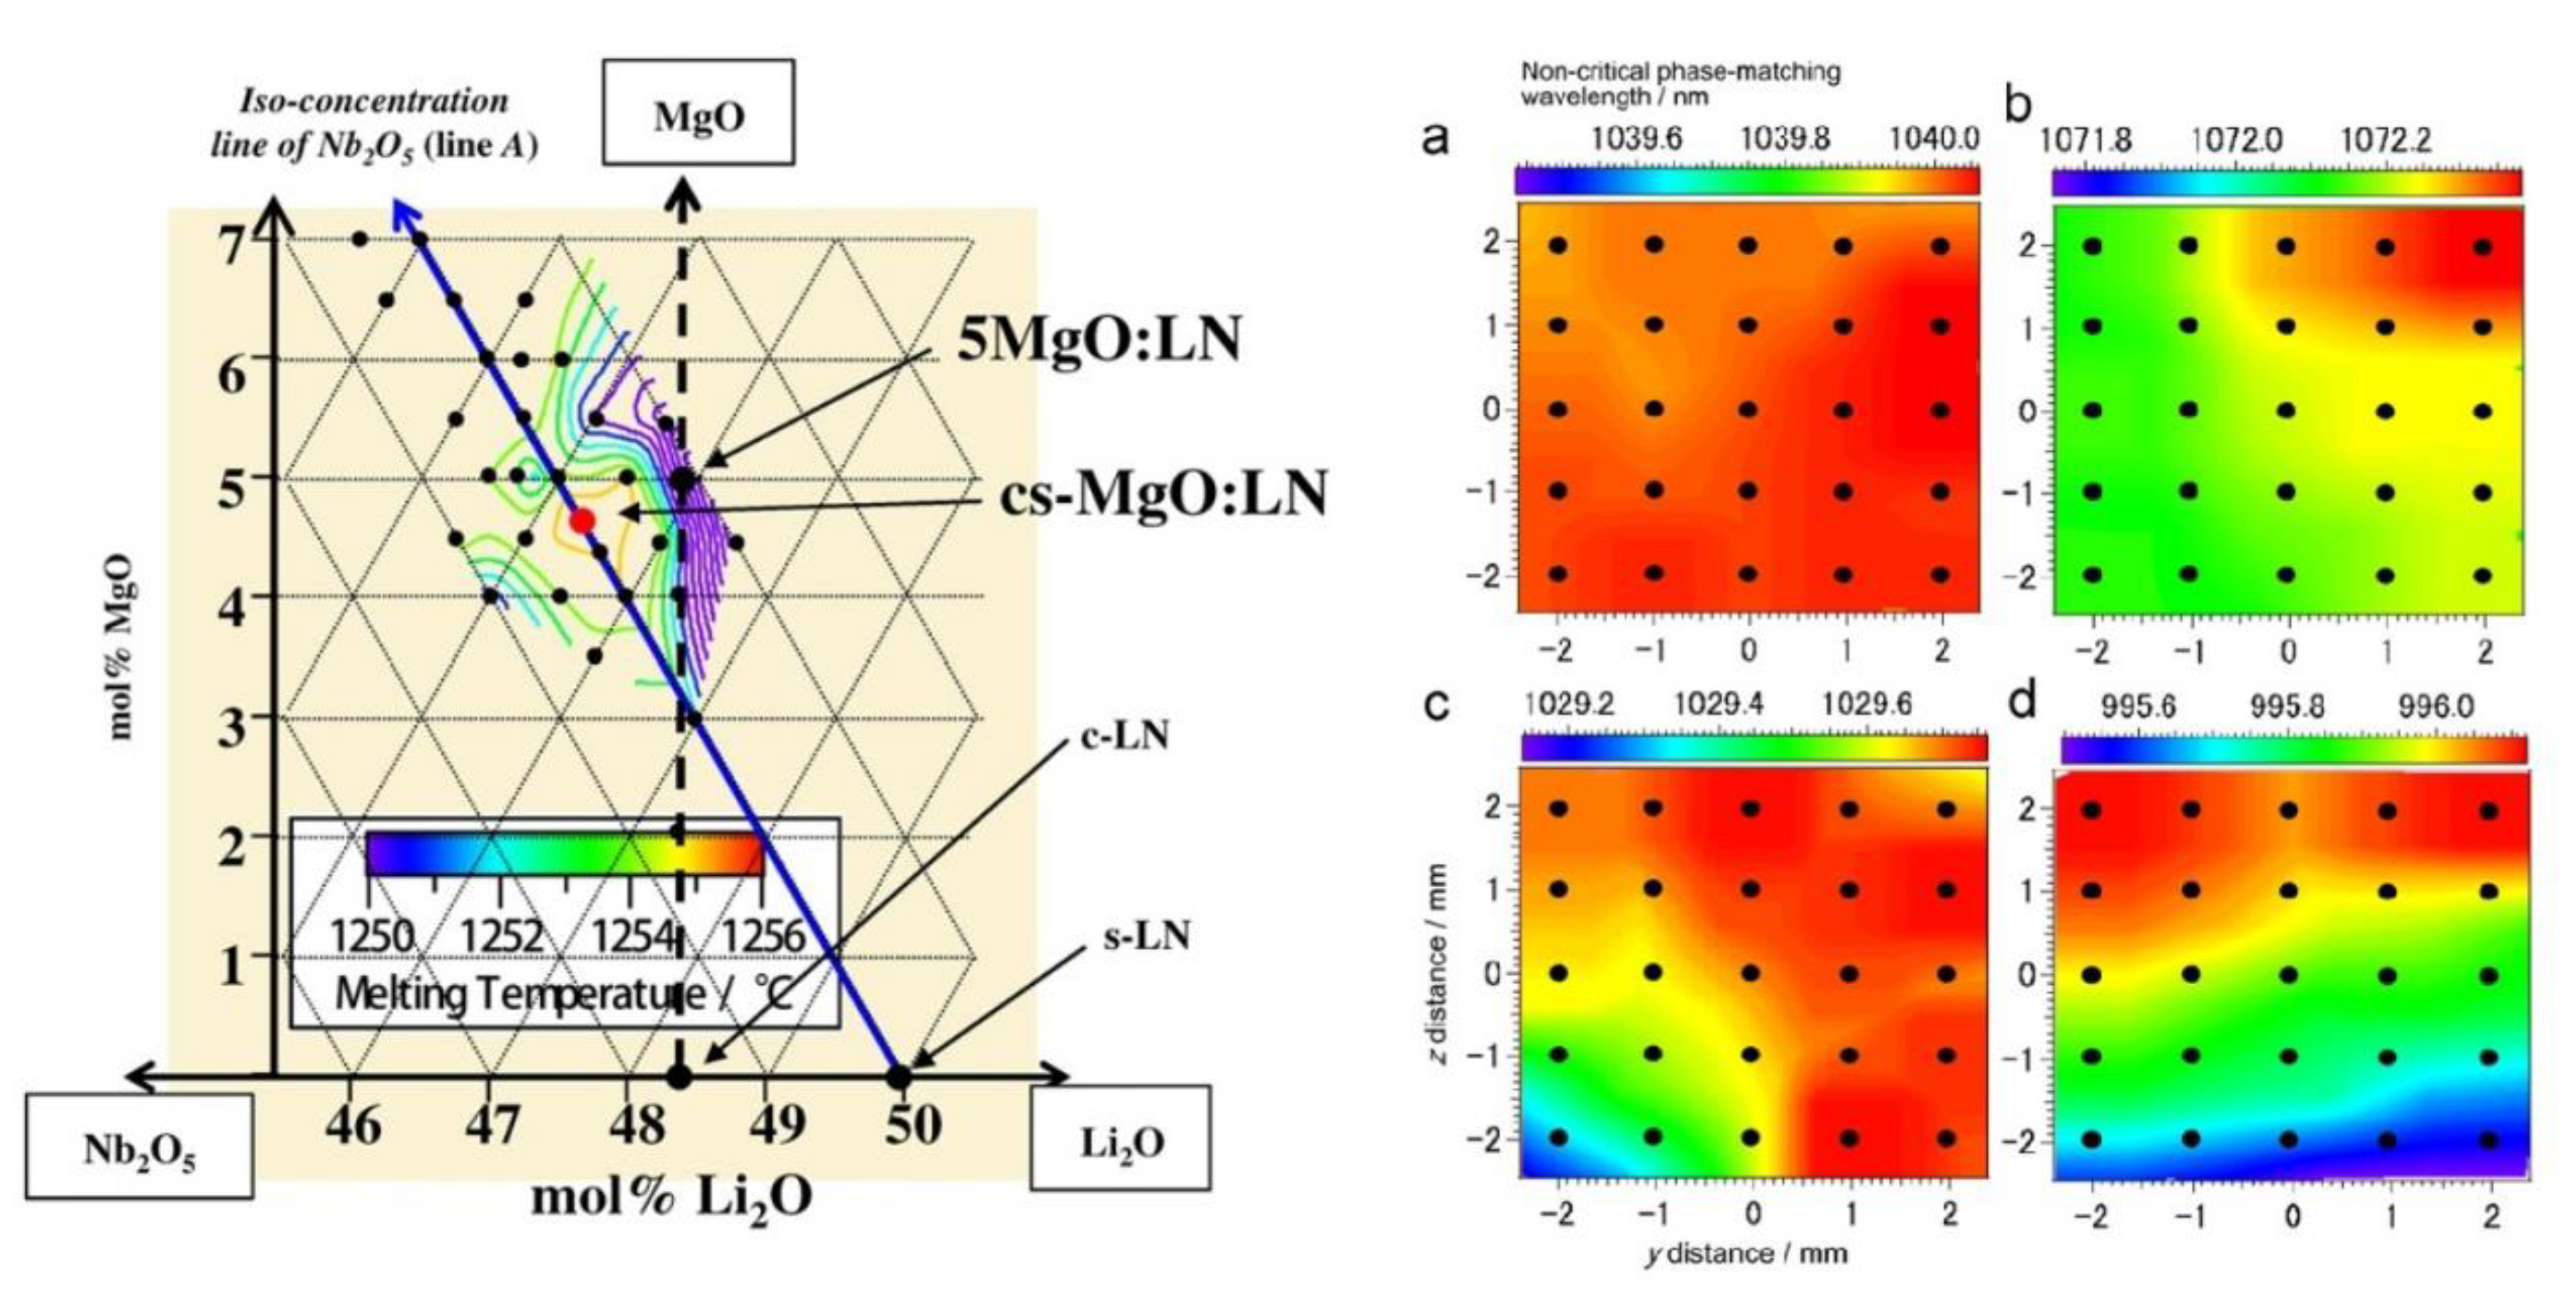
Figure 10.
Schematic representation of magnetic polarons: the spin of a donor electron in its hydrogenic orbit couples to antiparallel half-full (or more than half-full) 3d shells of the magnetic impurities. In this case, x = 0.1 and γ = 12. The small circles represent the cations and the squares the unoccupied oxygen sites (oxygen is not shown)—doi.org/10.1038/nmat1310. (Reproduced from Coey, J.M.D.; Venkatesan, M.; Fitzgerald, C.B. Donor impurity band exchange in dilute ferromagnetic oxides. Nature Mater. 2005, 4, 173–179, with permission from Springer Nature.)
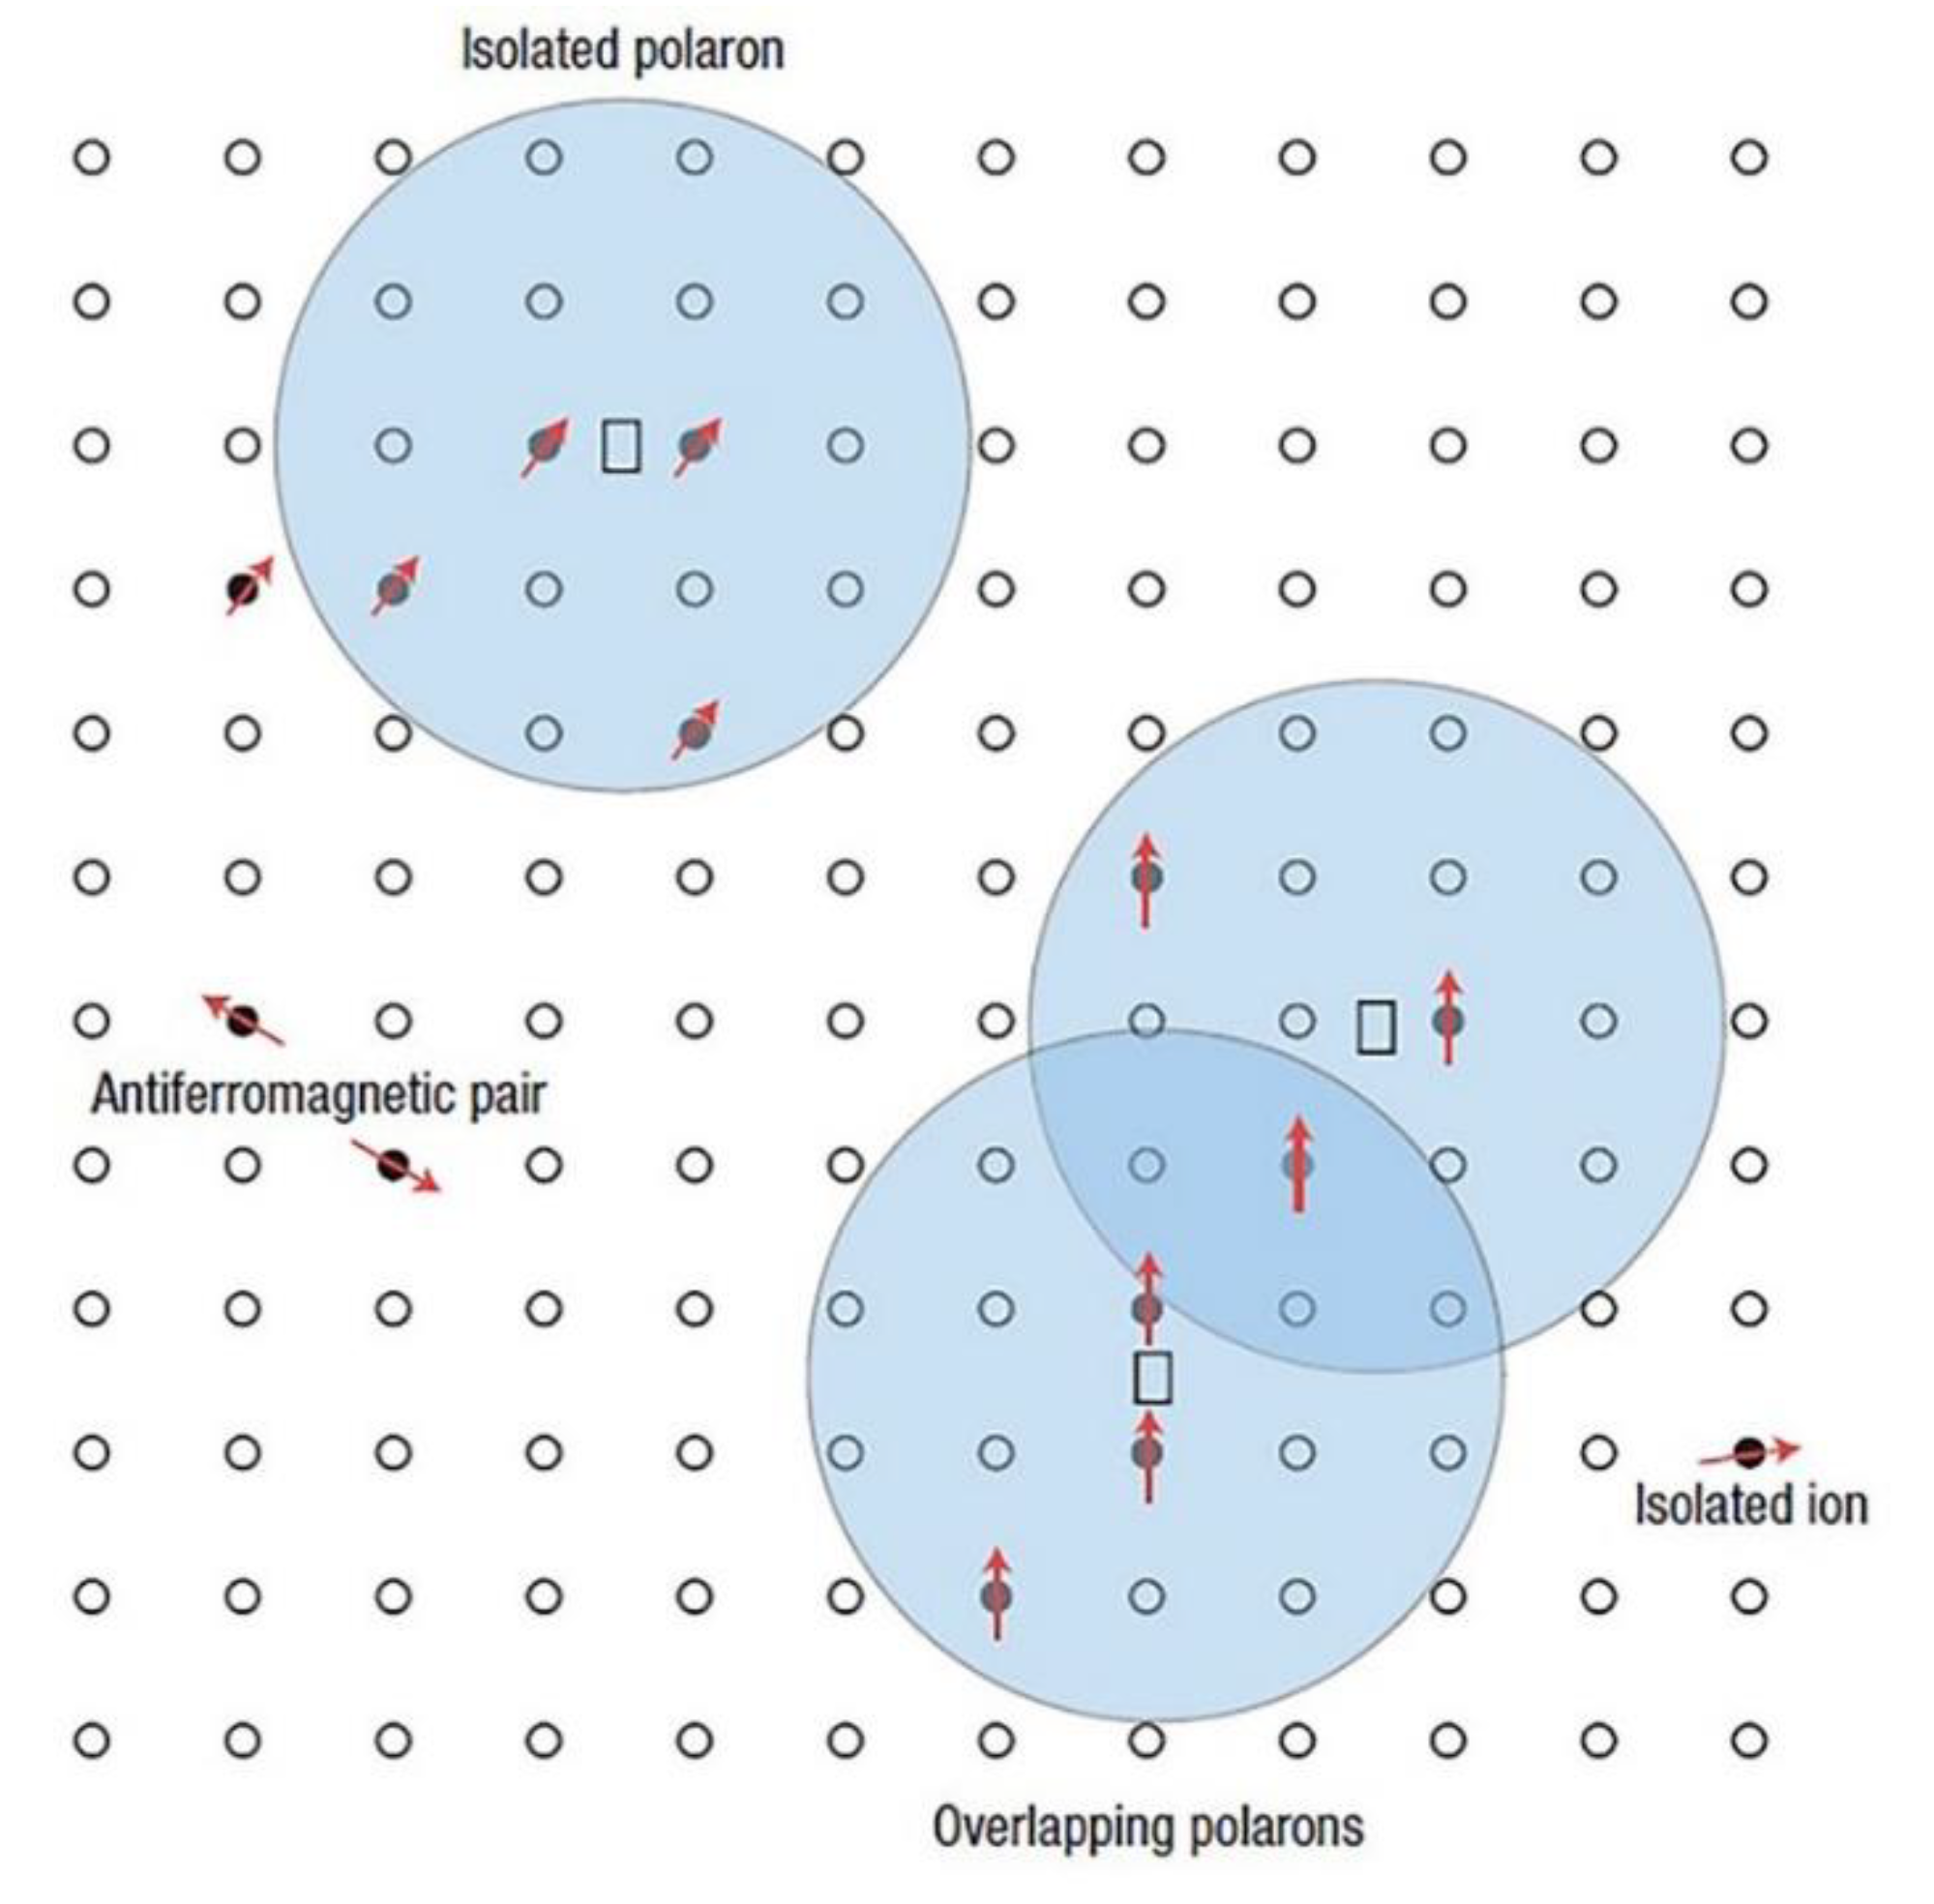
Figure 11.
Plots of magnetic moment per transition metal-cation in doped LN. The transition metal-cation substitutes Li in 1-LN:Fe, 2-LN:Mn, 3-LN:Co, and 4-LN:Co when x = 1 at.%, 3 at.%, 5 at.%, and 5 at.%, respectively. On the other hand, the transition metal-cation substitutes Nb in 5-LN:Co, 6-LN:Co, and 7-LN:V when x = 5 at.%, 5 at.%, and 2 at.%, respectively.
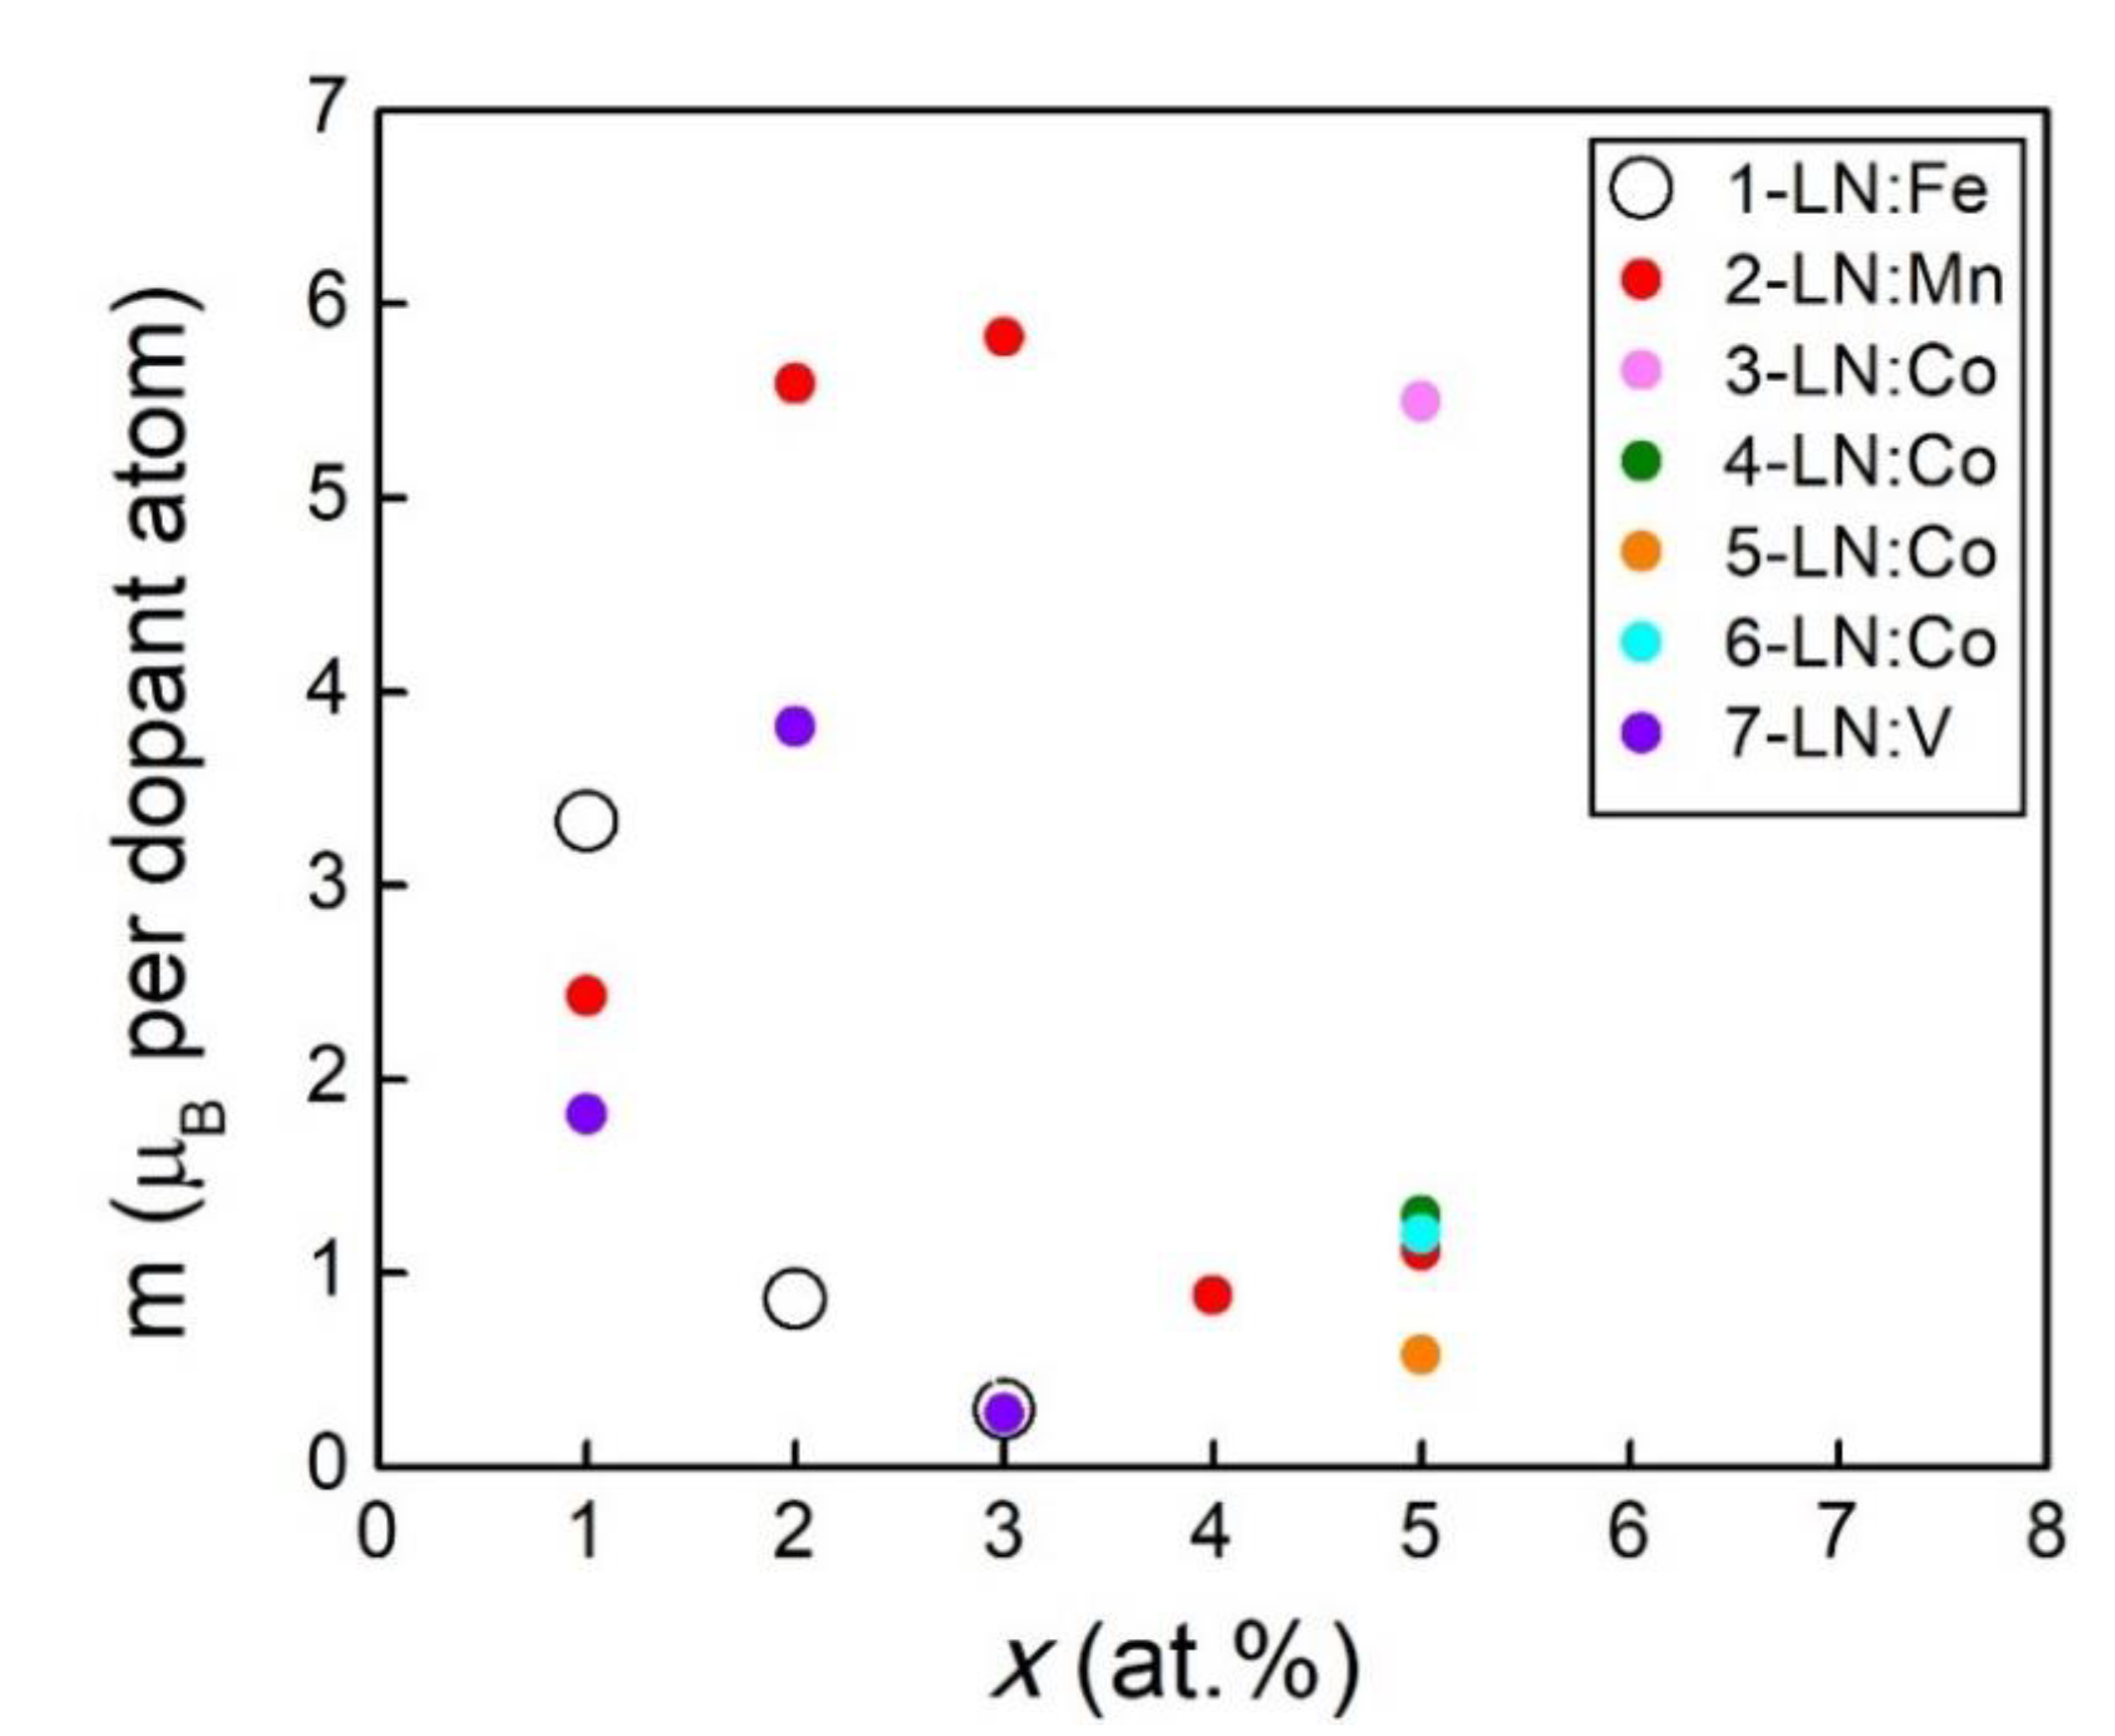
Figure 12.
Comparison between the M–H curves of the chemically reduced samples (doped at different Fe concentrations), nLN-R, and nLN:Fe-2.20-O—doi.org/10.3390/cryst8030108. (Reproduced from Fierro-Ruíz, C.D.; Sánchez-Dena, O.; Cabral-Larquier, E.M.; Elizalde-Galindo, J.T.; Farías, R. Structural and Magnetic Behavior of Oxidized and Reduced Fe Doped LiNbO3 Powders. Crystals, 2018, 8, 108, with permission from MDPI.)
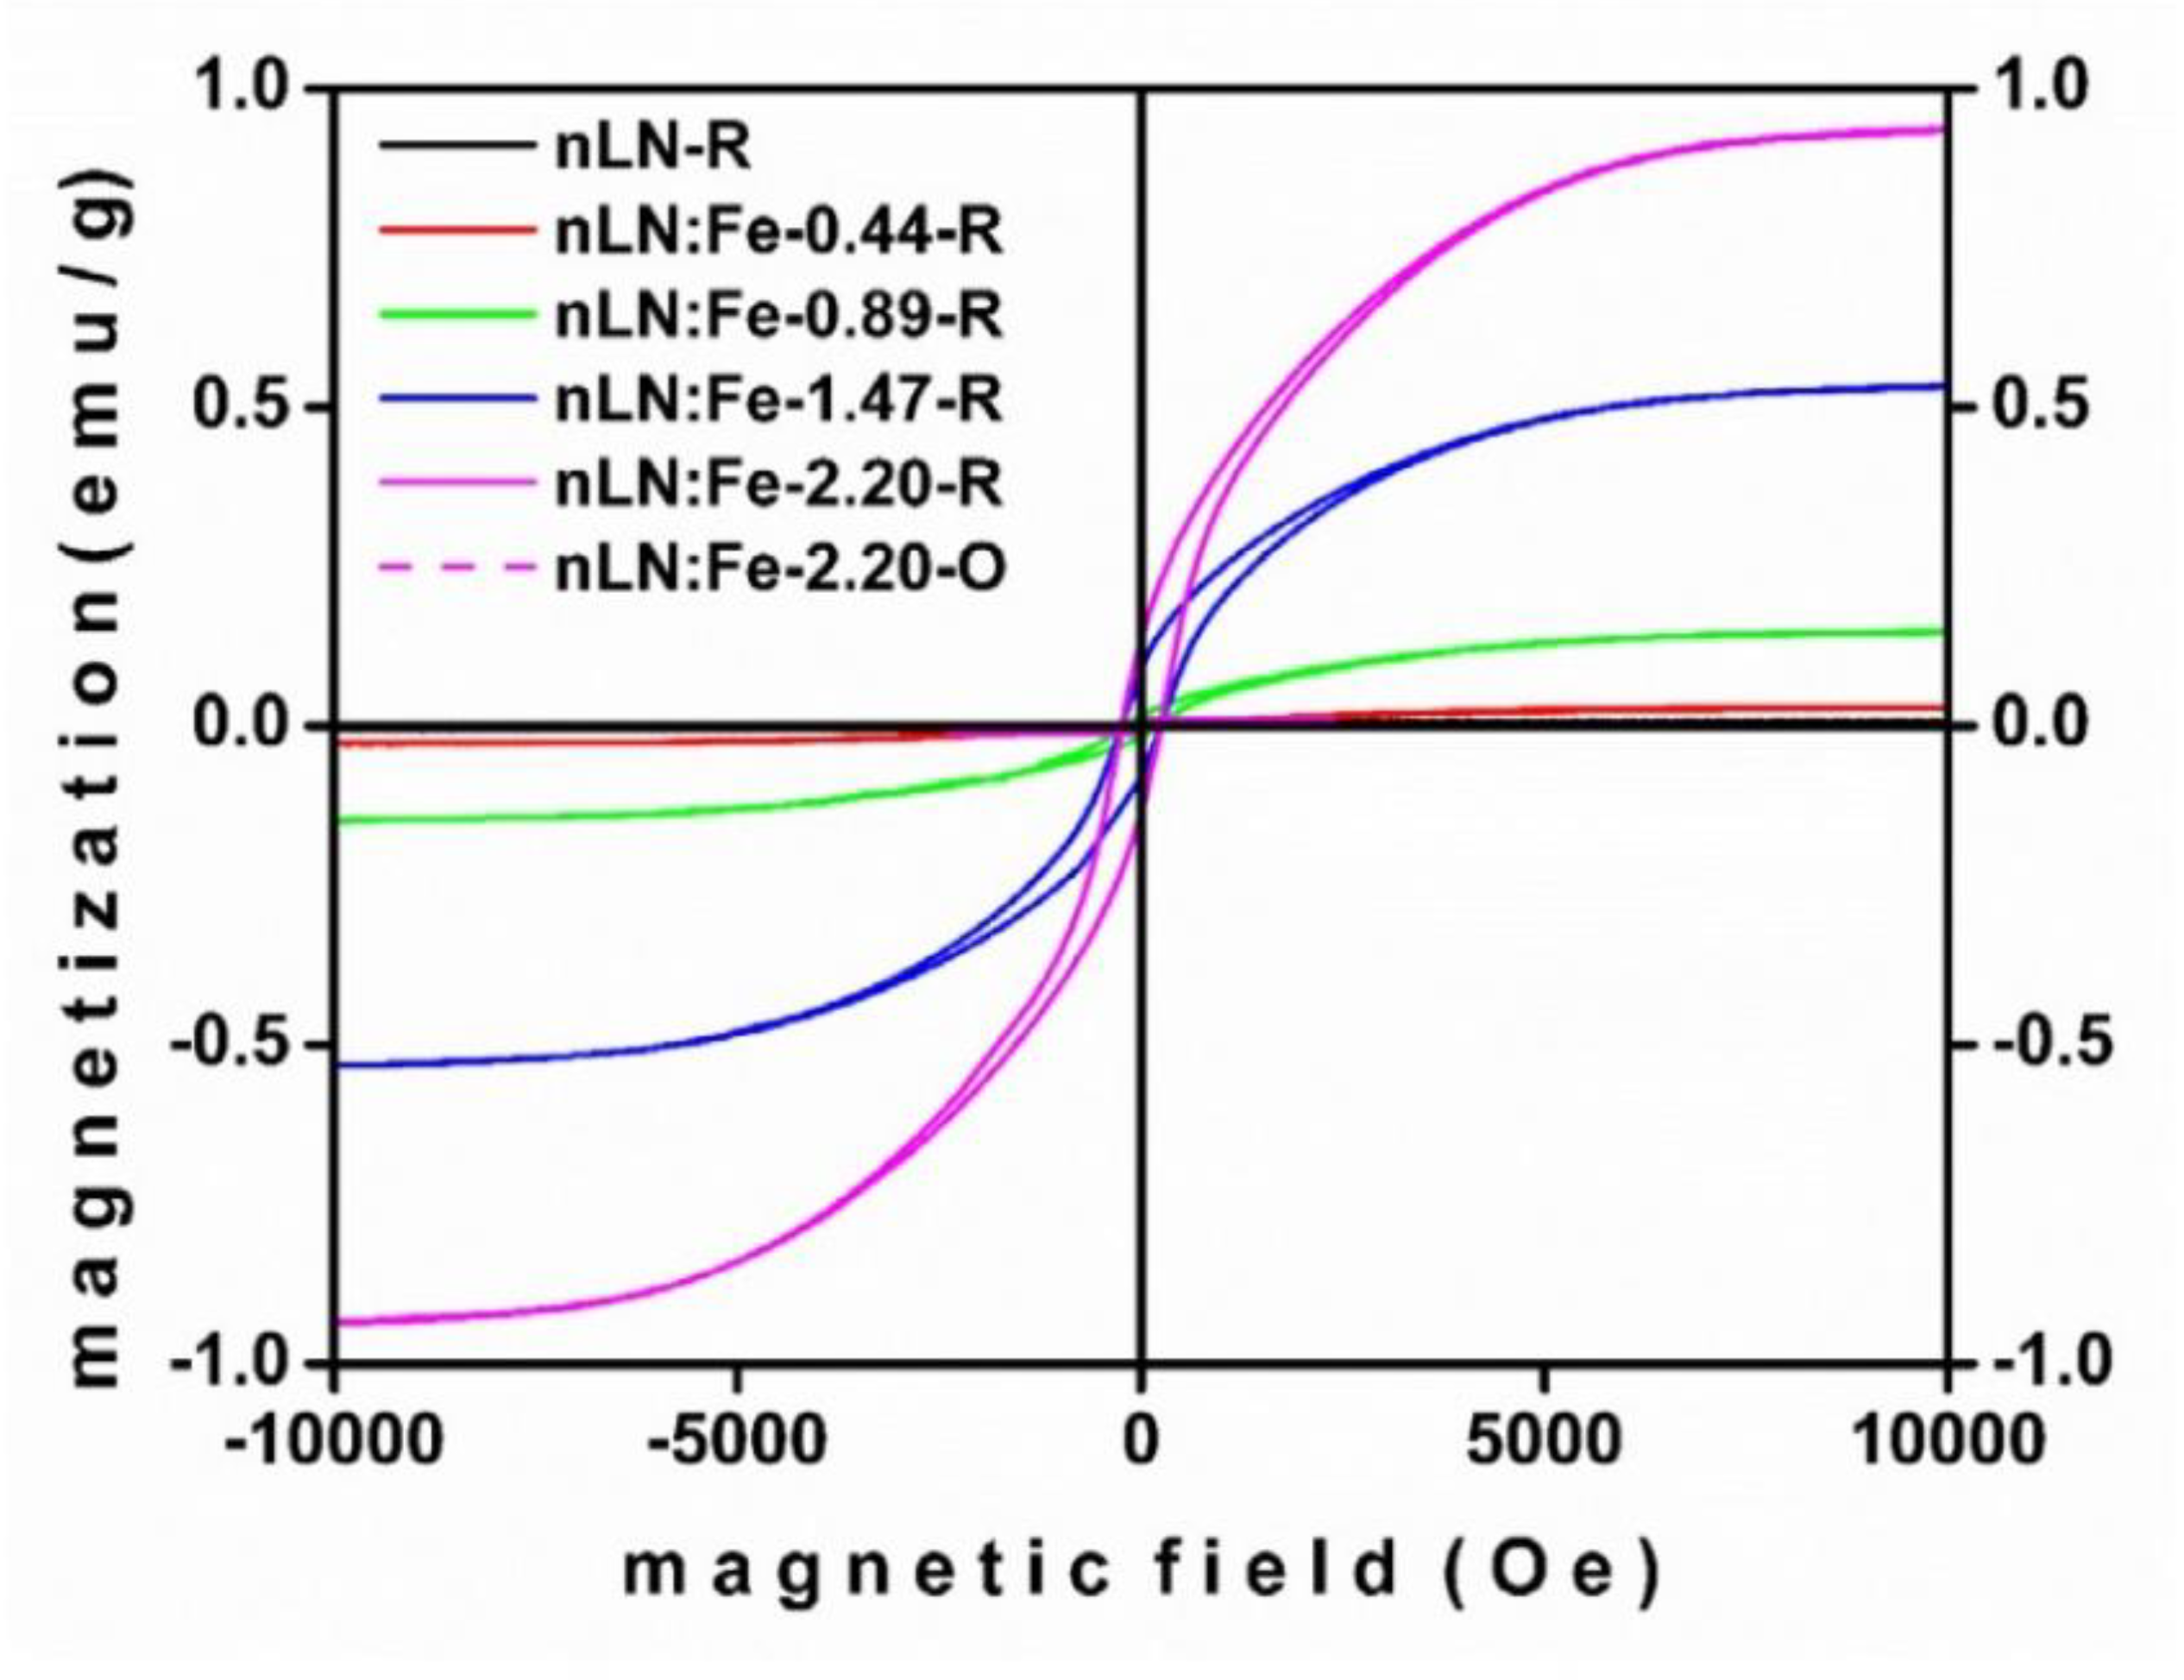
Publisher’s Note: MDPI stays neutral with regard to jurisdictional claims in published maps and institutional affiliations. |
© 2020 by the authors. Licensee MDPI, Basel, Switzerland. This article is an open access article distributed under the terms and conditions of the Creative Commons Attribution (CC BY) license (http://creativecommons.org/licenses/by/4.0/).
Share and Cite
MDPI and ACS Style
Sánchez-Dena, O.; Villalobos-Mendoza, S.D.; Farías, R.; Fierro-Ruiz, C.D. Lithium Niobate Single Crystals and Powders Reviewed—Part II. Crystals 2020, 10, 990. https://doi.org/10.3390/cryst10110990
AMA Style
Sánchez-Dena O, Villalobos-Mendoza SD, Farías R, Fierro-Ruiz CD. Lithium Niobate Single Crystals and Powders Reviewed—Part II. Crystals. 2020; 10(11):990. https://doi.org/10.3390/cryst10110990
Chicago/Turabian StyleSánchez-Dena, Oswaldo, Sergio David Villalobos-Mendoza, Rurik Farías, and Cesar David Fierro-Ruiz. 2020. "Lithium Niobate Single Crystals and Powders Reviewed—Part II" Crystals 10, no. 11: 990. https://doi.org/10.3390/cryst10110990
Note that from the first issue of 2016, this journal uses article numbers instead of page numbers. See further details here.