Article

Appearance and Disappearance of Quasi-Liquid Layers on Ice Crystals in the Presence of Nitric Acid Gas

1
Institute of Low Temperature Science, Hokkaido University, N19-W8, Kita-ku, Sapporo 060-0819, Japan
2
Département de Chimie, Université de Sherbrooke, 2500 Boulevard Université, Sherbrooke, QC J1K 2R1, Canada
*
Author to whom correspondence should be addressed.
Crystals 2020, 10(2), 72; https://doi.org/10.3390/cryst10020072
Submission received: 23 December 2019 / Revised: 17 January 2020 / Accepted: 27 January 2020 / Published: 29 January 2020
(This article belongs to the Special Issue Ice Crystals)

Abstract

:
The surfaces of ice crystals near the melting point are covered with thin liquid water layers, called quasi-liquid layers (QLLs), which play crucial roles in various chemical reactions in nature. So far, there have been many spectroscopic studies of such chemical reactions on ice surfaces, however, revealing the effects of atmospheric gases on ice surfaces remains an experimental challenge. In this study, we chose HNO3 as a model atmospheric gas, and directly observed the ice basal faces by advanced optical microscopy under partial pressure of HNO3 (~10−4 Pa), relevant to those found in the atmosphere. We found that droplets (HNO3-QLLs) appeared on ice surfaces at temperatures ranging from −0.9 to −0.2 °C with an increase in temperature, and that they disappeared at temperatures ranging from −0.6 to −1.3 °C with decreasing temperature. We also found that the size of the HNO3-QLLs decreased immediately after we started reducing the temperature. From the changes in size and the liquid–solid phase diagram of the HNO3-H2O binary system, we concluded that the HNO3-QLLs did not consist of pure water, but rather aqueous HNO3 solutions, and that the temperature and HNO3 concentration of the HNO3-QLLs also coincided with those along a liquidus line.

1. Introduction

Ice is one of the most abundant materials on Earth, hence, it has a profound and diverse influence on the global environment [1]. In particular, ice crystal surfaces act as “reaction fields” for heterogeneous chemical reactions that involve atmospheric acidic gases [2,3,4], thereby causing serious environmental issues such as the catalytic ozone depletion by hydrogen chloride gas [5] and the generation of nitrogen oxide gases (NOx) from the photolysis of nitric acid/nitrates [6]. These chemical reactions cannot be explained solely by homogeneous processes. Therefore, there have been many studies of such heterogeneous chemical reactions on ice surfaces, and of the uptake of acidic gases by ice, investigations that have resorted mainly to mass spectroscopy techniques [7]. However, the reported amounts of the uptake showed considerable variations, demonstrating that the mechanisms and rates of acidic gas uptake by ice are still unclear [7].
One of the plausible causes for the considerable variations of the uptake amounts is the presence/absence of thin liquid water layers, so called quasi-liquid layers (QLLs), on ice crystal surfaces at temperatures below the melting point [8,9,10,11]. In the case of nitric acid (HNO3) gas, heterogeneous chemical reactions have so far been studied on ice crystal surfaces in the presence/absence of QLLs. Many researchers have suggested that chemical reactions yielding to the formation of poisonous NOx gases occur in QLLs on snow as a result of nitrate photolysis [2,12]. In addition, Marcotte et al. pointed out that such chemical reactions can also occur at temperatures far below the melting point of ice (i.e., as low as 70 K), and demonstrated by infrared spectroscopy that heterogeneous photolysis of nitrates adsorbed on amorphous ice surfaces without QLLs can proceed much more effectively than those dissolved with the bulk [13]. To understand the roles of QLLs and of bare ice surfaces in promoting heterogeneous reactions, ice crystal surfaces need to be observed directly in the presence of acidic gases.
As a means in which to conduct direct observation, we, in collaboration with Olympus Engineering Co. Ltd., developed laser confocal microscopy combined with differential interference contrast microscopy (LCM-DIM), which gives interference contrast to objects with a sub-nanometer height on flat surfaces [14,15]. Hence, LCM-DIM enables the direct visualization of the 0.37-nm-thick elementary steps [16,17,18,19] and QLLs on ice crystal surfaces [20,21,22]. We also found that at temperatures higher than −2 °C, droplet-type and thin-layer-type QLLs, which are 20 and 200 times less fluidic than bulk water [23], respectively, emerged, in addition to QLLs, so called disordered layers, which appeared at temperatures higher than −90 °C [24]. In this study, we observed the basal faces of ice single crystals in the presence of HNO3 gas by LCM-DIM, and investigated the appearance/disappearance temperatures of droplet-type QLLs. We also studied the size changes of QLLs in response to temperature changes, and evaluated the chemical composition and nature of QLLs on ice crystal surfaces.

2. Materials and Methods

The observation chamber used for this work was similar to that used in our previous experiments [16]. A cross-sectional schematic illustration of the chamber is shown in Figure 1. The chamber had upper and lower Cu plates, whose temperatures (T and Tsource, respectively) were separately controlled using independent Peltier elements. On the upper Cu plate, a cleaved AgI crystal was attached as a substrate for the heterogeneous nucleation of sample ice crystals for the LCM-DIM observation.
After 100 μL ultrapure water (>18.2 MΩ) was placed on the lower Cu plate, the observation chamber was filled with nitrogen gas (without HNO3 gas), and then the Tsource was lowered to −13 °C to prepare ice crystals (source ice crystals) on the lower Cu plate. Since the volume of the source ice crystals was significantly larger than that of the sample ice crystals, the water vapor pressure (PH2O) in the chamber was dominated by the equilibrium water vapor pressure (Pe(H2O)) of the source ice crystals at Tsource. Basal faces of the sample ice Ih crystals used for the experiments were grown heteroepitaxially on the AgI crystal at T = −15 °C under supersaturated water vapor pressure conditions (PH2O = 200 Pa and Pe(H2O) = 170 Pa).
HNO3 vapors were prepared by bubbling nitrogen gases through aqueous HNO3 solutions of 0.1 and 6.8 mol/L at 25 °C. According to the phase diagram, when the bubbled nitrogen gases reached equilibrium with the aqueous HNO3 solutions of 0.1 and 6.8 mol/L, the partial pressure of HNO3 (PHNO3) in the bubbled nitrogen gases should be 6 × 10⁻⁴ and 5 Pa, respectively [25]. Here, note that the values of PHNO3 in the bubbled nitrogen gases were expected not to exceed the theoretical maximum values. Although PHNO3 in the troposphere shows considerable variations (e.g., ranging from ~10−6 Pa in clean air to ~10-2 Pa in polluted urban air [26,27]), the observations reported in this study were performed under pure nitrogen gas as well as low- and high-PHNO3 conditions, therefore covered the full range of PHNO3 reported in the troposphere. The experimental estimate of the actual PHNO3 supplied to the chamber will be discussed later in the manuscript.
After the sample ice crystals were grown until their lateral size and height reached several hundred μm, the bubbled nitrogen gas containing the HNO3 vapor was continuously injected into the observation chamber at 10 mL/min throughout the experiment. The bubbled nitrogen gas also included water vapor formed by the bubbling through the aqueous HNO3 solution of 0.1 and 6.8 mol/L: the maximum PH2O were estimated at 3000 and 400 Pa, respectively [25]. Although the former value was much higher than the Pe(H2O) at 0 °C (600 Pa), such water vapor did not affect PH2O in the observation chamber (i.e., PH2O was determined only by the water vapor supplied from the source ice crystals). To confirm this scenario, nitrogen gas bubbled through pure water was injected into the chamber at 10 mL/min, and no effect on the lateral growth speed of elementary steps (growing ends of ubiquitous molecular layers) on the ice basal faces was observed within the accuracy of our experiment. The water vapor formed by the bubbling was injected with enough of a low flow rate, hence such water vapor was condensed on the source ice near the inlet of the gas. In addition, the effects of the temperature (25 °C) during the bubbling could not be observed due to the sufficiently low flow rate and efficient temperature control by Peltier elements. Under the continuous supply of the HNO3/N2 gas at 10 mL/min, the basal faces of the sample ice crystals were observed by LCM-DIM at various T (from −10 to 0 °C). In addition, the three-dimensional shapes of QLLs that appeared on the basal faces were measured by two-beam interferometry. All experiments were performed under supersaturated water vapor pressure conditions with respect to both ice and liquid water. Therefore, the ice basal faces were always growing and the condensation of water vapor on the QLLs also occurred (no evaporation of the QLLs occurred) continuously during our observations.

3. Results and Discussion

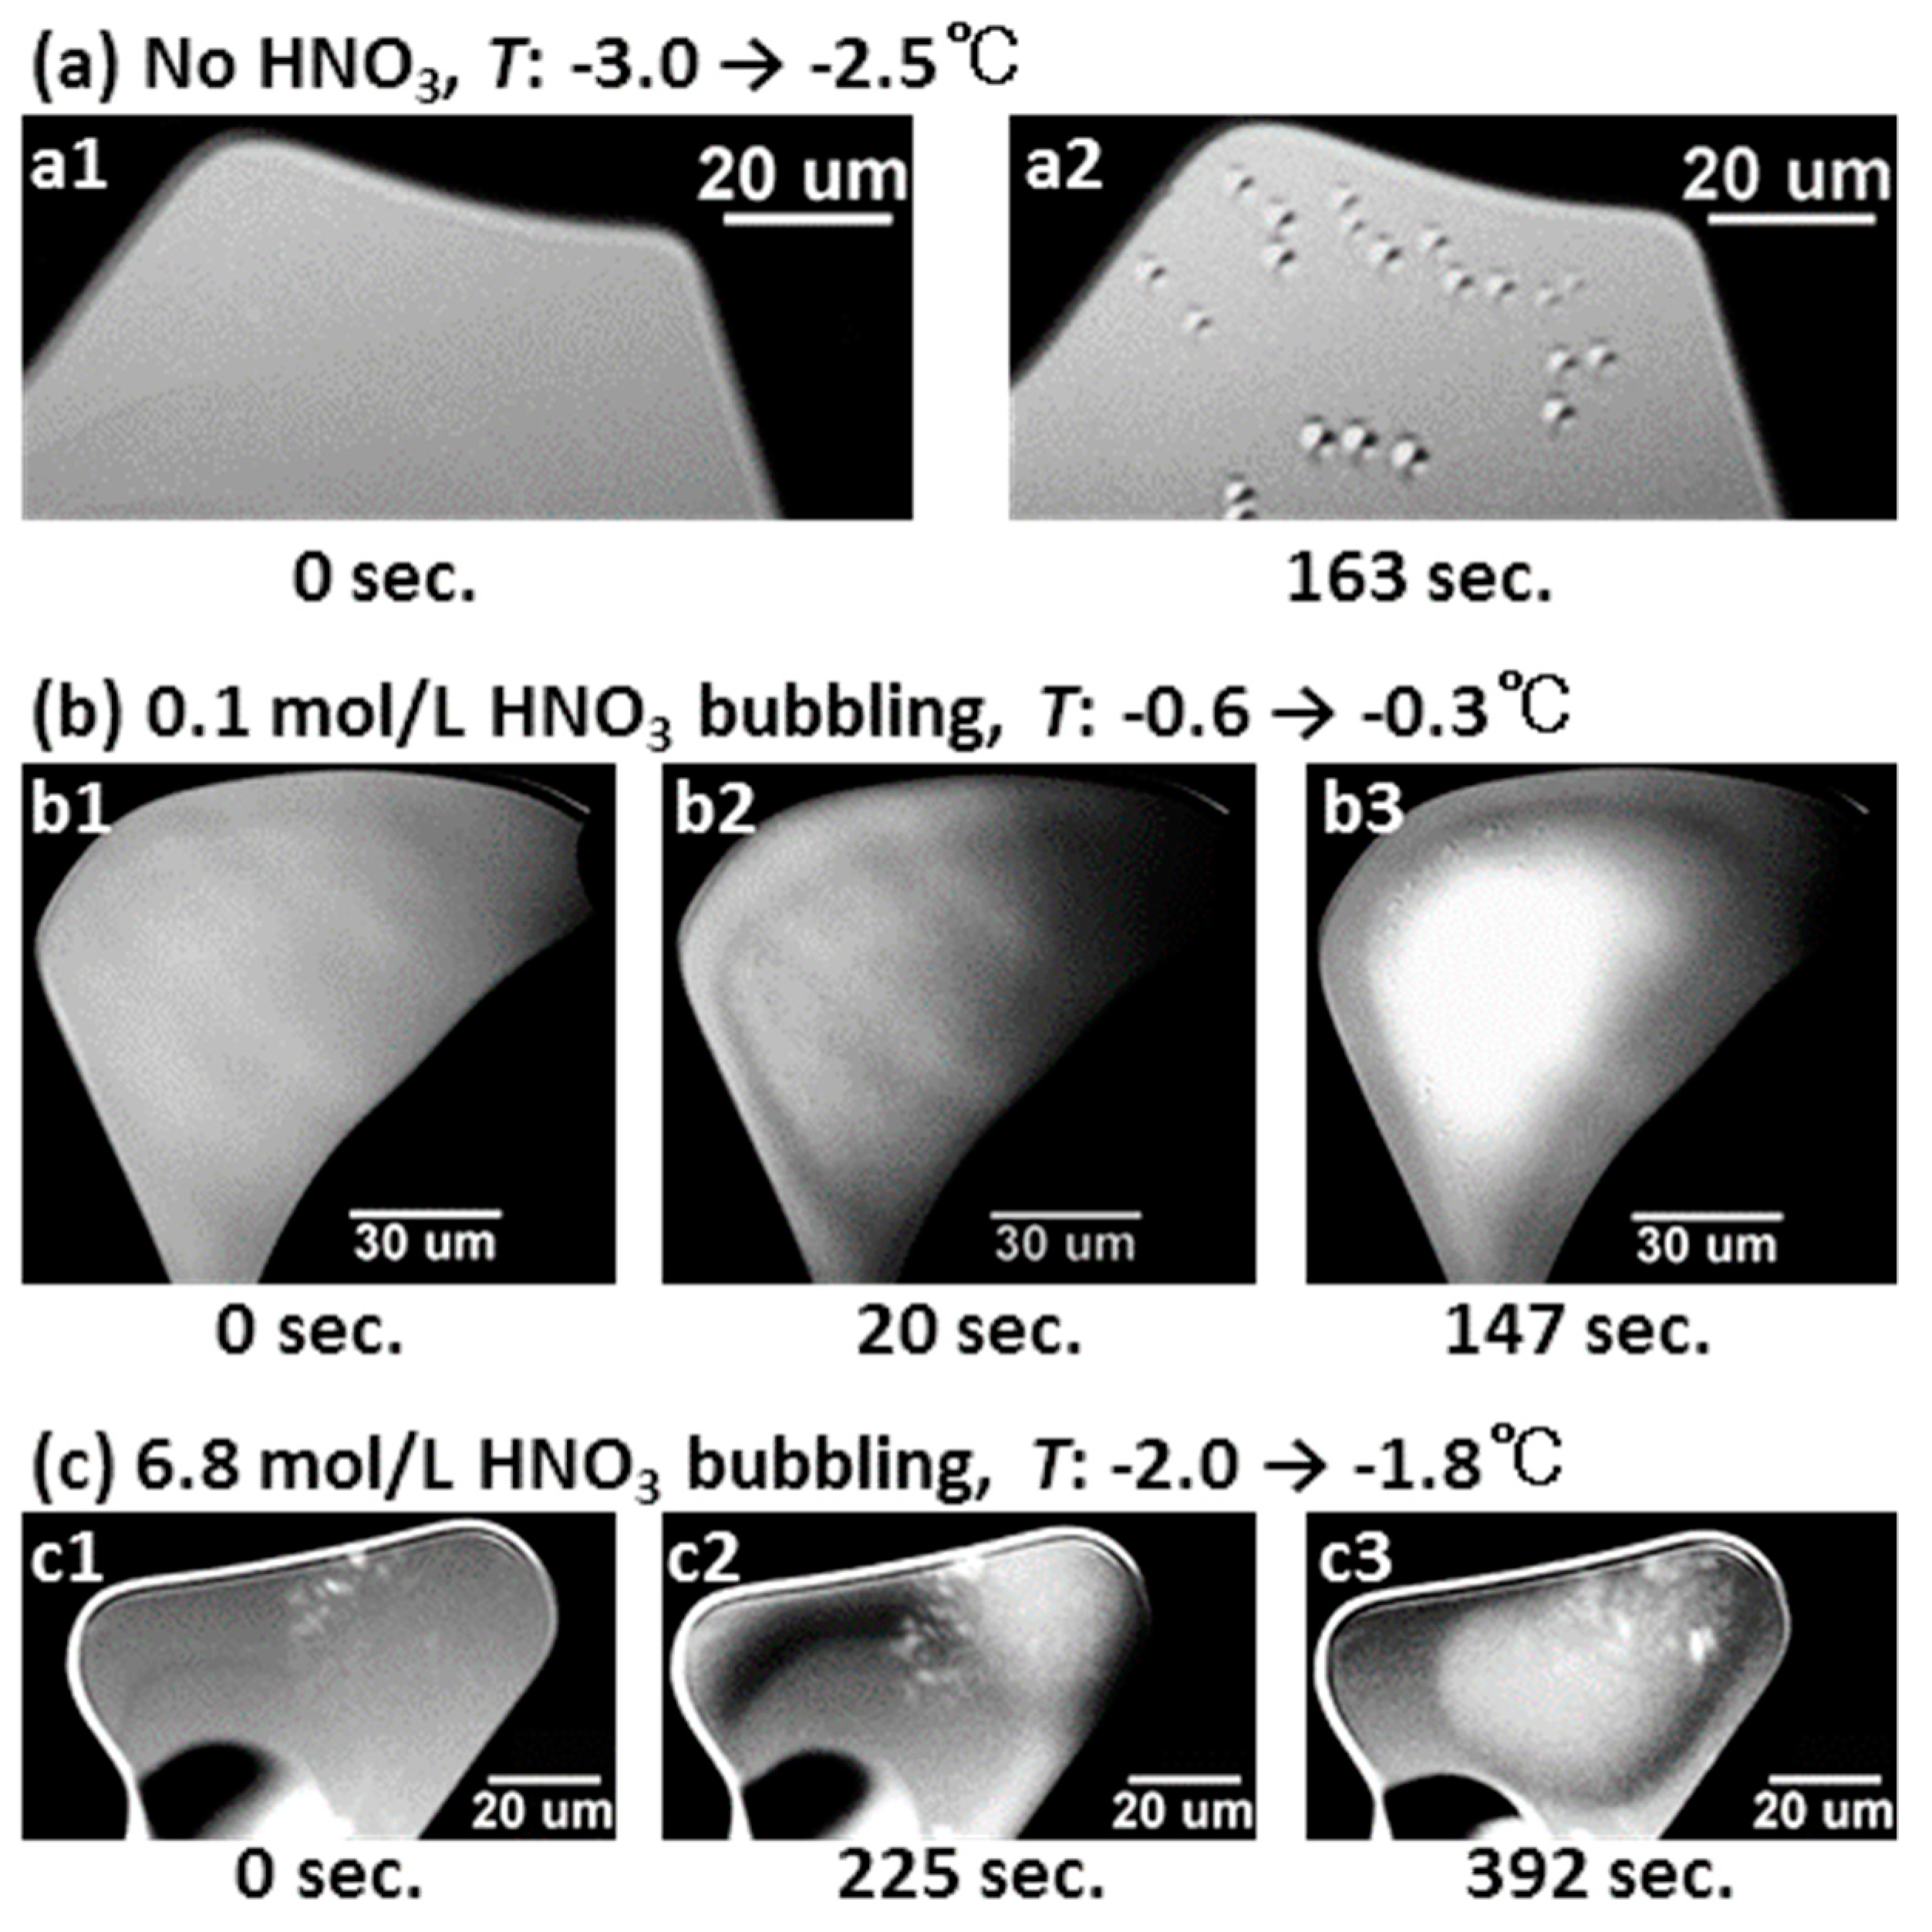
3.1. Appearance of Quasi-Liquid Layer on Ice in the Absence/Presence of HNO3 Gas

We first investigated the effects of exposure of the ice surfaces to HNO3 gas on the appearance of QLLs on ice basal faces by LCM-DIM (Figure 2). Irrespective of the presence/absence of HNO3 gas, QLLs appeared with increasing T. However, HNO3 gas significantly affected the behavior of QLLs.
In the absence of HNO3 gas, QLLs formed on the ice basal face (hereafter, we refer to them as pure-QLLs) showed the shape of a spherical dome (Figure 2a). In Figure 2, the differential interference contrast was adjusted as if the ice crystal surface was illuminated by a light beam slanted from the upper left to the lower-right direction. Hence, the upper-left and lower-right halves of the pure-QLLs appeared white and black, respectively. In addition, note that the pure-QLLs appeared spatially random on the basal face. With increasing T, the pure-QLLs appeared at T from −2.5 to −1.4 °C (Table 1), and a typical diameter of the pure-QLLs was ~10 μm. Video of the appearance process of the pure-QLLs is available in Video S1 in the Supplementary Materials. Other detailed information on the appearance of the pure-QLLs is presented in our previous works [20,21,22].
In contrast, in the presence of HNO3 gas, the QLLs appeared preferentially at the periphery of the ice crystal surface (Figure 2b2,c2). However, as shown in Figure 2b,c, these QLLs (hereafter, we refer to them as HNO3-QLLs) did not show a circular drop-like shape as observed in the case of the pure-QLLs (Figure 2a). From the peripheral region of the basal face, the HNO3-QLLs appeared homogeneously (Figure 2b2,c2). This result suggests that the nucleation of the HNO3-QLLs occurred everywhere in the peripheral region, and that the minute HNO3-QLLs may have been formed, they had already coalesced when they reached a size sufficient to be observed by LCM-DIM. The relation between the presence of HNO3 and a nucleation energy barrier for the formation of HNO3-QLLs is an important subject for future studies.
Then, the HNO3-QLLs gradually coalesced to become one big droplet, thereby reducing their surface areas. Since the big resulting HNO3-QLL droplet spontaneously sat at the center of the basal face (Figure 2b3,c3), its shape resembled the outer shape of the ice basal face. The HNO3-QLL exhibited a size that was significantly larger than that displayed by the pure-QLLs. Although we could observe such characteristic features during the appearance processes of HNO3-QLLs, irrespective of the concentration of HNO3 gas (Figure 2b,c), the appearance temperatures of the HNO3-QLLs strongly depended on the partial pressure of HNO3 gas. When the nitrogen gases bubbled through aqueous HNO3 solutions of 0.1 and 6.8 mol/L were injected into the chamber with increasing T, the HNO3-QLLs appeared at T ranging from −0.9 to −0.2 °C, and from −2.5 to −1.5 °C, respectively (Table 1). Videos of the appearance processes of the HNO3-QLLs are available in Videos S2 and S3 in the Supplementary Materials.
In the absence of HNO3 gas, we reported that, in addition to the droplet-type QLLs, thin-layer-type QLLs also emerged [20,21,22]: the thin-layer-type QLLs showed a plain plate shape with a homogeneous thickness of 9 nm [23]. However, in the presence of HNO3 gas, we did not find the thin-layer-type HNO3-QLLs. Therefore, although at present the reason is unclear, the difference between the behaviors of the emergence of QLLs with the presence and absence of HNO3 gas strongly suggests that the HNO3-QLLs are not composed of pure water, but rather of aqueous HNO3 solutions. This issue will be discussed in Section 3.4.

3.2. Disappearance of Quasi-Liquid Layers on Ice in the Absence/Presence of HNO3 Gas

The pure-QLLs and HNO3-QLLs on the ice basal faces disappeared with decreasing T (Figure 3). The disappearance temperature of the pure-QLLs ranged from −1.8 to −2.5 °C (Figure 3a and Table 1). By exposing the ice surface to nitrogen gases bubbled through nitric acid solutions of 0.1 and 6.8 mol/L and lowering the temperature, the HNO3-QLLs disappeared at T ranging from −0.6 to −1.3 °C (Figure 3b) and from −6.0 to −8.0 °C (Figure 3c), respectively (Table 1). Under high-PHNO3 conditions, we found that the disappearance temperature of the HNO3-QLLs was significantly lower, and that the thermal hysteresis between the appearance and disappearance temperatures was larger. However, the disappearance temperature of the pure-QLLs was somewhat lower than that of the HNO3-QLLs under low-PHNO3 conditions. These results suggest that the disappearance mechanisms of the pure-QLLs and HNO3-QLLs were different. The disappearance mechanisms of the HNO3-QLLs will be discussed in Section 3.5.

3.3. Measurement of Contact Angle for Quasi-Liquid Layer on Ice in the Presence of HNO3 Gas

To investigate the shape and contact angle of the HNO3-QLLs formed on the ice basal faces, we observed them by reflection-type interferometry of the Michelson type [28]. Figure 4a,b show LCM-DIM and interferometric images of the HNO3-QLL on the ice basal faces at T = −0.6 °C, respectively, under the condition of nitrogen gas bubbled through an aqueous HNO3 solution of 0.1 mol/L. Figure 4c presents an enlarged image of the area marked by the red dotted rectangle in Figure 4b; the image in Figure 4c is magnified by five times only in the horizontal direction.
On a flat surface, interference fringes show parallel and equally-spaced straight lines. Hence, the bending of the interference fringes in Figure 4c reveal the three-dimensional outer shape of the HNO3-QLL. The height Δh of the HNO3-QLL on the flat basal face can be obtained by
Δ h = λ 2 n · Δ l l 0 .
where Δl is the lateral shift of the interference fringe from a straight line (see Figure 4c); λ is the wavelength of the light source (680 nm); n is the refractive index of air (1.00); and l0 is the distance between the adjacent interference fringes on the flat surface (see Figure 4c).
Open circles in Figure 4d present the Δh of the HNO3-QLL along the line X–Y in Figure 4a,b. The solid curve shows a fit to a spherical dome height profile. The good agreement between the open circles and the solid curve indicates that the shape of the HNO3-QLL is indeed consistent with that of a spherical dome. From Figure 4d and other measurements, under nitrogen gas bubbled through an aqueous HNO3 solution of 0.1 mol/L, we found that the contact angle for the HNO3-QLL on the ice basal face was 0.4° at T ranging from −0.6 to −1.0 °C. The value of the contact angle for the HNO3-QLLs was similar to that of pure-QLLs (0.6–2.3°) [22].

3.4. Size Change of Quasi-Liquid Layer in Response to Temperature Change in the Presence of HNO3 Gas

The size of the HNO3-QLLs started evolving immediately after we suddenly changed T. Figure 5a shows the LCM-DIM images of a HNO3-QLL on an ice basal face exposed to nitrogen gas that was bubbled through an aqueous HNO3 solution of 0.1 mol/L, just before we reduced the setting of the temperature controller in a stepwise manner (along the temperature program displayed by the solid stepwise line in Figure 5b). We took the images in Figure 5a1–a4 at the moments indicated by arrows a1–a4 in Figure 5b. Black open circles in Figure 5b show the changes in the lateral size (along the line X–Y in Figure 5a1) of the HNO3-QLL as a function of time. As T decreased in a stepwise manner, the size of the HNO3-QLL also decreased in a stepwise manner with a delay time of 10–20 s, which corresponded to the delay time of T by the feedback control (Figure 1). In contrast, when we raised T in a similar way, the size of the HNO3-QLL increased reversibly (data not shown). Note that we could not observe such changes in the sizes of pure-QLL with T in the absence of the HNO3 gas. These results clearly demonstrate that the HNO3-QLLs were not pure water, but most probably aqueous HNO3 solutions.
How can we explain the changes in the size of the HNO3-QLL with T? The most plausible explanation is that the HNO3-QLL (aqueous HNO3 solution) and the ice crystals were in equilibrium: we will provide a stricter interpretation later. Hereafter, we try to prove the validity of this scenario. Since the temperature range in Figure 5 was higher than the disappearance temperature, we assumed that the mass of HNO3 in the HNO3-QLL (WHNO3 [g]) was constant during the relatively short observation time period of several minutes: this assumption will be also proven later. Figure 6a shows the phase diagram of a HNO3–H2O binary system, and Figure 6b presents the schematic diagram of Figure 6a in the range of higher temperature and lower HNO3 concentration (C [mol/L]). Note that crystals of nitric acid trihydrate, HNO3•3H2O, are not stable in the temperature range adopted in this study (T > −10 °C) (Figure 6a). As shown in Figure 6b, when the HNO3-QLL and the ice crystals were in equilibrium at T1 and C1 (at point X in Figure 6b), we reduced the T suddenly from T1 to T2, which meant that the systems fell out of equilibrium. Just after the rapid decrease in T (say down to point Y in Figure 6b), the HNO3-QLL became supercooled. Then, water froze out of the HNO3-QLL (thereby fueling the growth of the underlying ice crystal), resulting in an increase in C. The freezing of water out of the HNO3-QLL stopped when C reached C2, since the HNO3-QLL and the ice crystal were now back in equilibrium (at point Z in Figure 6b). In this case, the volume of the HNO3-QLL V μm3 at T1 and T2 (V1 and V2) can be obtained by
V 1 = W HNO 3 M HNO 3 · C 1 × 10 15 μ m 3 / L   and   V 2 = W HNO 3 M HNO 3 · C 2 × 10 15 μ m 3 / L .
where MHNO3 is the molar mass of HNO3 (i.e., 63.0 g/mol). Under conditions where WHNO3 is constant, V2 can be obtained by
V 2 = C 1 C 2 V 1 .
Therefore, when we reduce T in a stepwise manner, V also decreases in a stepwise manner according to Equation (3).
We verified the above scenario by calculating the changes in V as a function of T. The black solid circles in Figure 5c show V was determined experimentally from the LCM-DIM images in Figure 5a. We obtained WHNO3 = 9.26 × 10⁻¹³ g (displayed as a red solid line in Figure 5c) using the values of V (177.0 μm3) from Figure 5c and C (0.083 mol/L) from Figure 6a at T = −0.3 °C. We then calculated V at T other than −0.3 °C by using the value of WHNO3 and Equation (3). Figure 5c shows that the calculated V (shown by the red dotted line) was in good agreement with the V determined experimentally (the black solid circles) in the range of T = −0.4 to −0.6 °C (50–250 s). This result demonstrates that the HNO3-QLL was indeed not pure water, but rather an aqueous HNO3 solution, and also that the HNO3-QLL and the ice crystal were in equilibrium.
In addition, here we need to give a stricter interpretation. Since we performed all experiments under supersaturated water vapor pressure conditions, condensation of water vapor on the HNO3-QLL also occurred, potentially resulting in the decrease in C (hence causing the HNO3-QLL to become supercooled). However, the water froze out of the HNO3-QLL (thereby causing the underlying ice crystal to grow) much faster than the condensation of water vapor [30], since the growth process of ice in liquid water does not include any mass transfer process. Hence, the value of C could be kept constant at the equilibrium value. Therefore, strictly speaking, we should explain such situations as not “in equilibrium” but as “in a steady state under conditions along the liquidus line”.

3.5. Disappearance Mechanism of Quasi-Liquid Layer on Ice in the Presence of HNO3 Gas

Figure 5c also shows that the black solid circles exhibited a larger disagreement with the red dotted line as T further decreased (see T = −0.7 °C after 250 s in Figure 5c). This disagreement was probably due to the decrease in WHNO3 after T became smaller than the disappearance temperature of the HNO3-QLLs (T = −0.6 to −1.3 °C). One of the plausible causes for the decrease in WHNO3 could be the evaporation of HNO3 from the HNO3-QLLs. We checked this possibility as follows. In our system, with decreasing T, C increased according to the phase diagram (Figure 6b). Then, at a certain T, we first obtained the value of C from the phase diagram. Next, we calculated the equilibrium HNO3 partial vapor pressure, Pe(HNO3), of the HNO3-QLLs, using the value of C determined from Figure 6 and the vapor–liquid equilibrium curve [25], the results of which are summarized in Figure 7. Indeed, as T decreases, Pe(HNO3) increases. It is very reasonable to expect that when Pe(HNO3) exceeds PHNO3 in the observation chamber with decreasing T, HNO3 evaporates from the HNO3-QLLs, resulting in the decrease in V according to Equation (2) and also in the disappearance of the HNO3-QLLs. From Pe(HNO3) (the solid curve in Figure 7) and the disappearance temperatures of the HNO3-QLLs under the nitrogen gases bubbled through HNO3 solutions of 0.1 and 6.8 mol/L (Table 1), PHNO3 in the chamber was estimated to be ~10−4 and 10−3–10−2 Pa (red and blue dashed lines in Figure 7 and Table 1), respectively. The estimated PHNO3 values in the observation chamber were thus indeed smaller than the maximum PHNO3 estimated from the equilibrium vapor pressure over aqueous HNO3 solutions of 0.1 and 6.8 mol/L, that is 6 × 10⁻⁴ and 5 Pa, respectively. Hence, we expect that this scenario is plausible, although we have no direct evidence.
It is also important to evaluate how significant the uptake of HNO3 by the bulk of the ice crystal is under the conditions of our observations. However, since the solubility of nitrate ions in ice is estimated to be ~10−5 mol% in our experimental temperature range (from −10 to 0 °C) [31], we can safely neglect the contribution from the uptake of HNO3 by bulk ice in this study.
When we reduced T to a temperature much lower than the disappearance temperature, we observed the formation of macrosteps (steps with a height much larger than that of elementary steps). This observation supports the interpretation that partial freezing of the HNO3-QLLs can follow a decrease in T, eventually causing the complete disappearance of the HNO3-QLLs. Figure 8a shows a series of LCM-DIM images of an HNO3-QLL on an ice basal face when we reduced T from −0.5 to −4.7 °C under nitrogen gas bubbled through an aqueous HNO3 solution of 0.1 mol/L. A macrostep appeared along the periphery of the HNO3-QLL and kept growing laterally for a few tens of seconds (marked by red arrows in Figure 8a2–a4). At the same time, the size of the HNO3-QLL became rapidly smaller. Figure 8b shows a schematic illustration of the phenomena observed in Figure 8a. First, the HNO3-QLL is in equilibrium with the ice crystal (Figure 8b1). When we reduce T by a large amount (from X to Y in Figure 6b), part of the water in the HNO3-QLL must freeze to reestablish equilibrium with the ice crystal, resulting in the increase in C (from Y to Z in Figure 6b). Since the homogeneous nucleation of ice crystals in the HNO3-QLL is kinetically much more difficult than the growth, the growth of the underlying ice preferentially starts from the interface between the HNO3-QLL and the ice crystal. Then, the interface grows evenly in the vertical direction (Figure 8b2): such growth behavior is well known as the vapor−liquid−solid (VLS) growth mechanism [32], which usually causes the growth of whisker crystals. After the vertical growth, the lateral face of the ice step made by the vertical ice growth in the HNO3-QLL (black arrowheads in Figure 8b2) is exposed to supersaturated water vapor. Hence, the ice step further grows in the lateral direction fueled by water vapor (Figure 8b3): we observed the growth front of the ice step as the macrostep (Figure 8a2–4). Therefore, the formation of the macrosteps, induced by the significant decrease in T, demonstrates the freezing of water from the HNO3-QLLs (causing the underlying ice to grow evenly in the vertical direction) until equilibrium between the HNO3-QLLs and ice crystals is achieved. Video of the formation process of the macrostep from the HNO3-QLL are available in Video S4 in the Supplementary Materials.
As explained above, the disappearance mechanism of the HNO3-QLLs can be explained by the equilibrium of the HNO3 component between the HNO3-QLLs and the ambient gas. That is to say, the HNO3-QLLs are not quasi liquid (whose properties are significantly different from those of bulk water), but an aqueous HNO3 solution (which can exist as a thermodynamically stable bulk phase). In contrast, the appearance mechanism of the HNO3-QLLs cannot be explained by the same equilibrium of the HNO3 component since the appearance temperatures of the pure- and HNO3-QLLs were almost same (Table 1), although the appearance/disappearance temperatures of the HNO3-QLLs exhibited a large hysteresis. At present, we suppose that at first, the HNO3-QLLs appeared as a quasi-liquid, but immediately became a thermodynamically stable aqueous solution of HNO3.

3.6. Comparison between Quasi-Liquid Layer in Our Experiments and Quasi-Liquid Layer in Nature

In this study, from the disappearance temperature of the HNO3-QLL, we estimated PHNO3 under nitrogen gases bubbled through aqueous HNO3 solutions of 0.1 and 6.8 mol/L to be ~10−4 and 10−3–10−2 Pa, respectively. Hence, we expect that QLLs on ice under typical atmospheric conditions in the natural environment (PHNO3 = ~10−6 Pa [26,27]) would show a behavior intermediate between those observed under exposure either to pure nitrogen gas or to low-PHNO3 conditions: HNO3-QLLs could disappear below ~−1 °C (Figure 3 and Table 1). In polluted urban areas (PHNO3 = ~10−2 Pa [26,27]), the disappearance temperature of HNO3-QLLs could be reduced to ~−6 °C (Figure 3 and Table 1).
There also exist other factors that may need to be considered. In this study, we used the basal faces of ice single crystals. However, a large proportion of ice in nature is present as polycrystals, which have grain boundaries, defects, various high-index faces and impurities. Therefore, we will need to study the effects of these features on the behavior of HNO3-QLLs in the future.
In addition, various kinds of gases exist in the natural environment. Hence, many studies have been so far performed using various chemical analysis techniques [7]. However, there exist few studies that have taken advantage of direct observation. Recently, we studied the effects of hydrogen chloride gas on the behavior of QLLs (hereafter referred to as HCl-QLLs) on ice basal faces [33,34]. In this case, we found that the HCl-QLLs were aqueous hydrochloric acid solution, and that the temperature and HCl concentration of the HCl-QLLs were also very close to those of a liquidus line: these results were similar to those found in this study. However, we also found phenomena different from those displayed by the HNO3-QLLs. The HCl-QLLs did not disappear with decreasing T until −15 °C (the minimum temperature adopted in the study) [33]. In addition, the growth of ice started preferentially from droplet–ice–vapor contact lines, thereby causing the HCl-QLLs to become embedded within ice crystals without freezing [34]: no VLS growth occurred contrary to the case of the HNO3-QLLs (Figure 8b2). In the previous studies, we used a HCl partial pressure of 100 Pa, which was four orders of magnitude greater than the PHNO3 used in this study: the most stable phase at −15 °C was probably not a solid solution of HCl in ice, but rather aqueous a hydrochloric acid solution [7,33,34]. Hence, at present, it is unclear whether the different behaviors of the HCl- and HNO3-QLLs were due to differences in the physical/chemical properties of HCl and HNO3, or rather to the differences in the partial pressures used in the two studies.

4. Conclusions

We prepared low- and high-PHNO3 conditions by bubbling nitrogen gases through aqueous HNO3 solutions of 0.1 and 6.8 mol/L, estimated to yield a maximum PHNO3 of 6 × 10⁻⁴ and 5 Pa, respectively. Then, we visualized the HNO3-QLLs on the ice basal faces in the presence of HNO3 gas directly by LCM-DIM, and obtained the following key results:
  • Irrespective of the presence/absence of the HNO3 gas, the pure-QLLs and HNO3-QLLs appeared with increasing T and disappeared with decreasing T. The appearance temperatures of the HNO3-QLLs upon heating under the low- and high-PHNO3 conditions were not so different, however, the disappearance temperature of the HNO3-QLLs upon cooling under high-PHNO3 conditions was significantly lower than that observed under low-PHNO3 conditions.
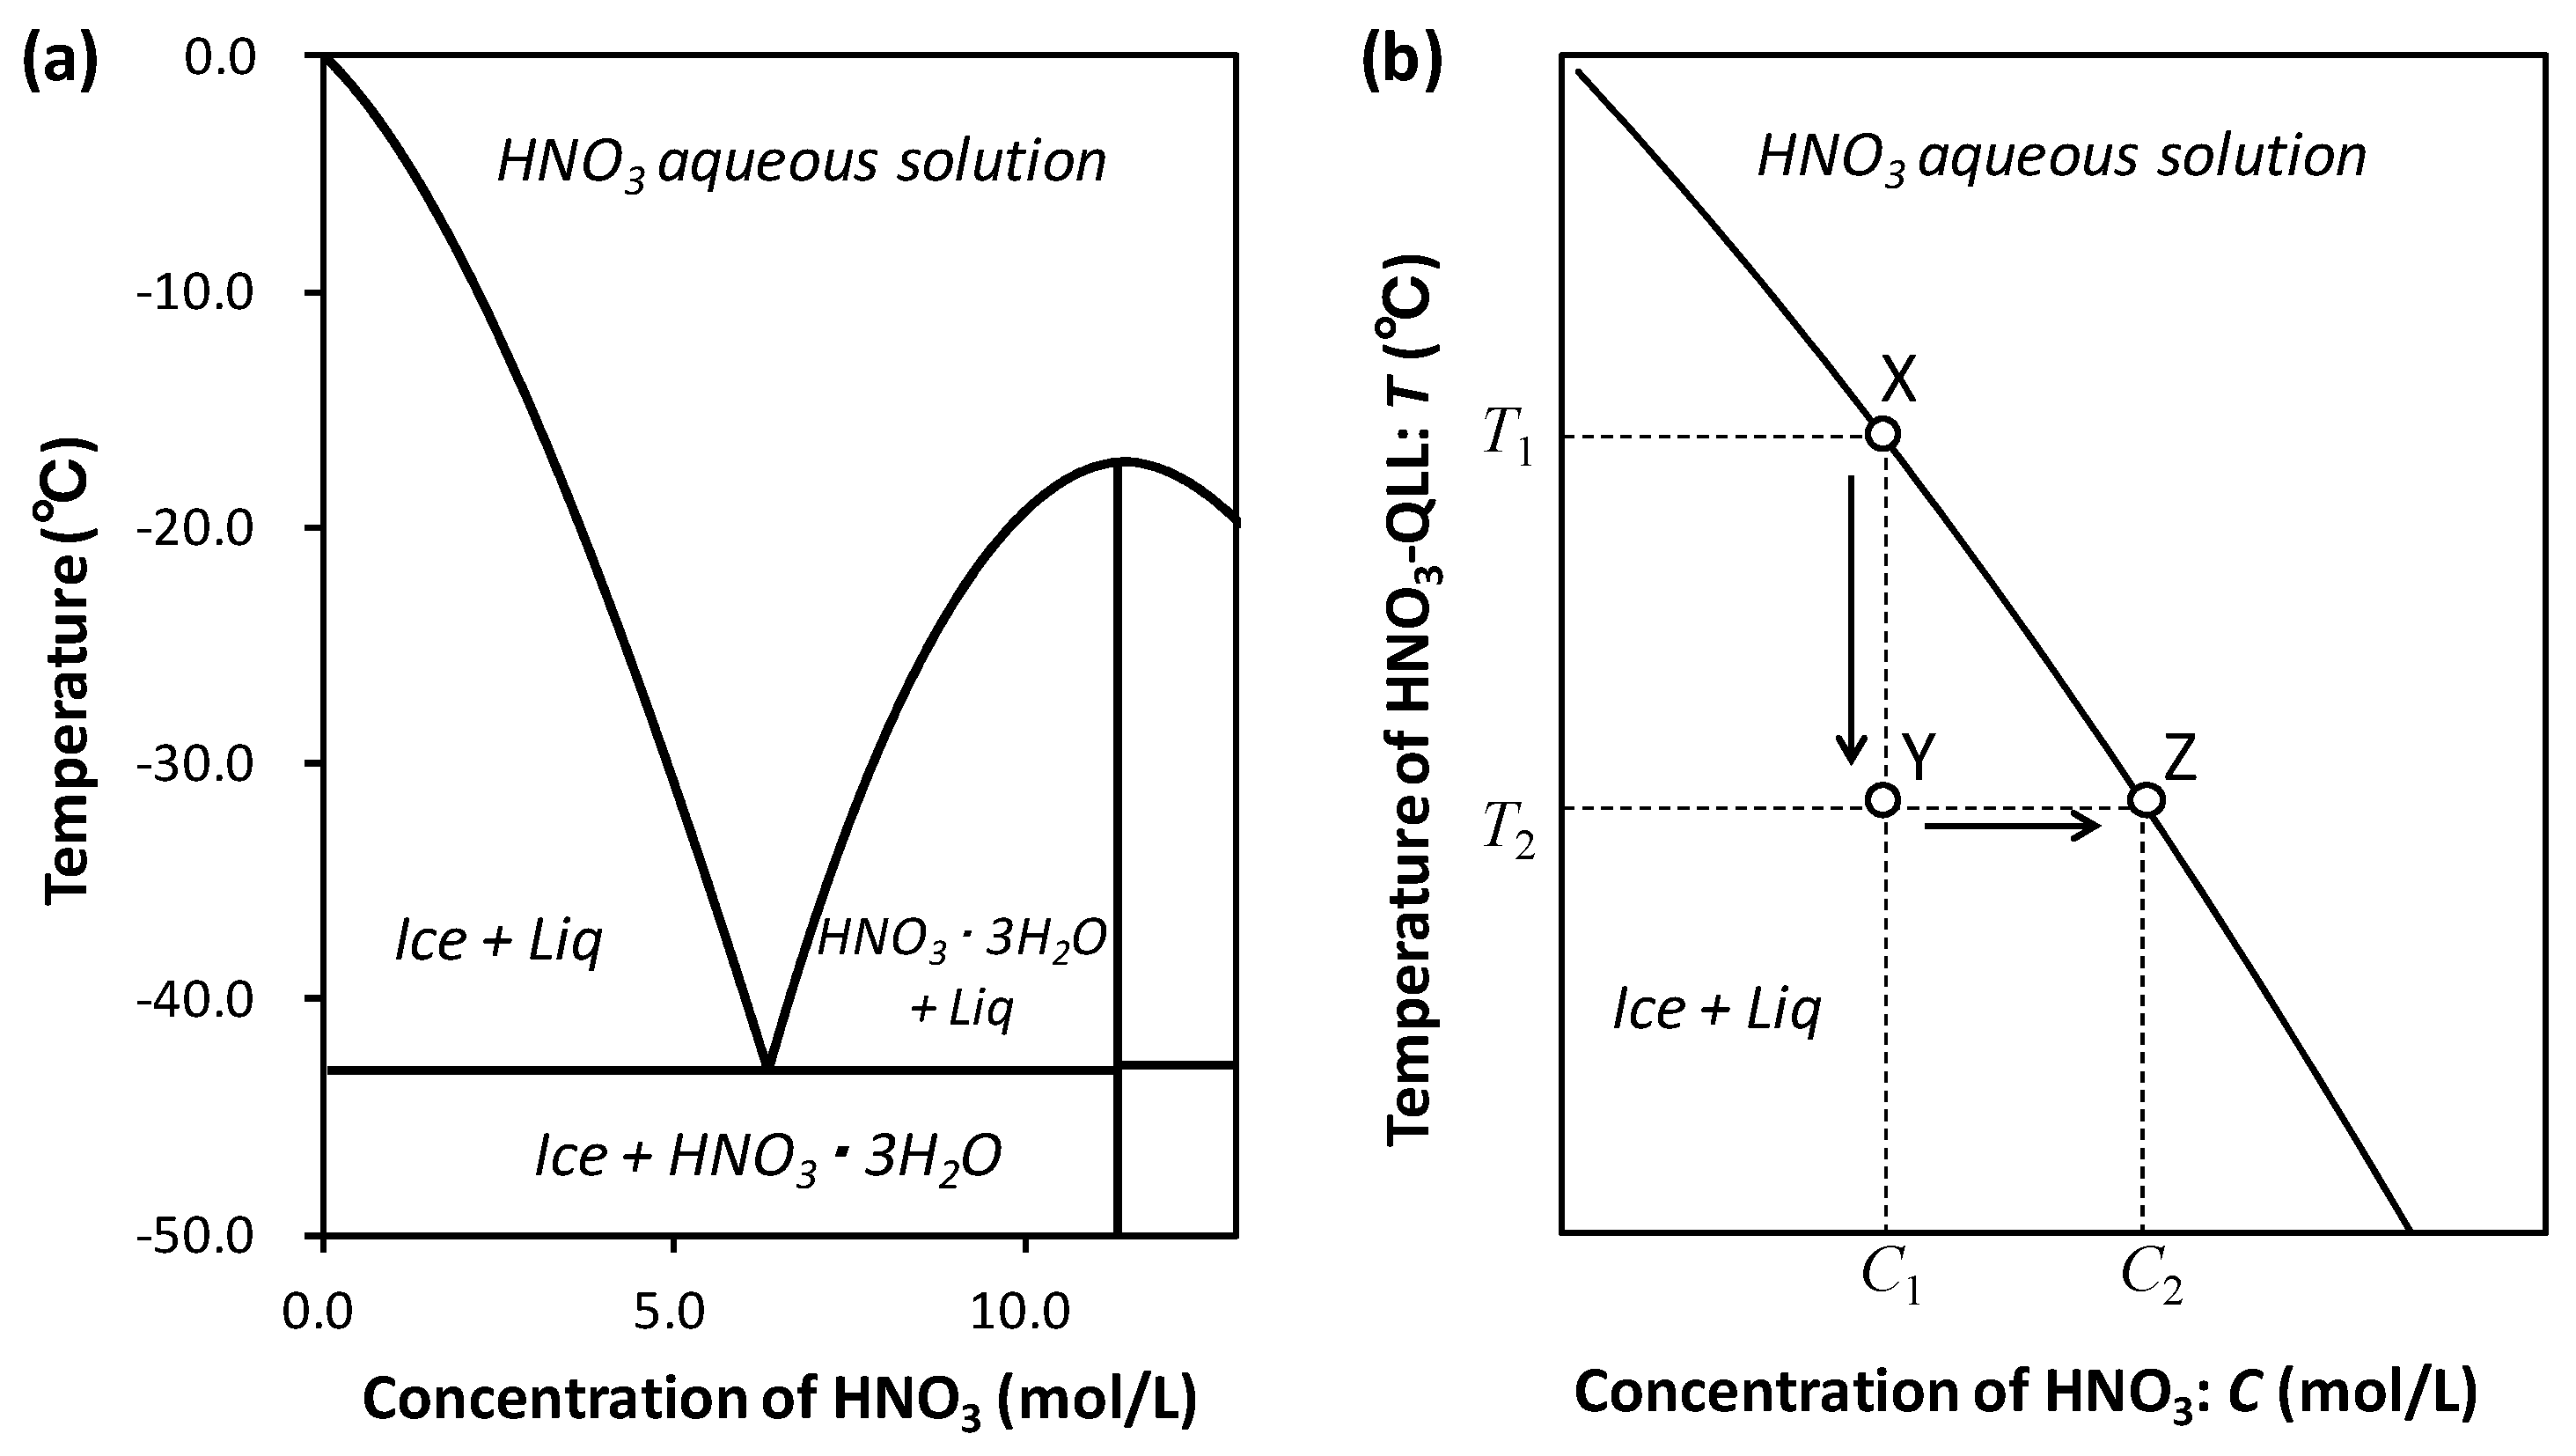
  • From the changes in the volume of the HNO3-QLLs following changes in temperature, and also from the liquid–solid phase diagram of the HNO3–H2O binary system, we found that, in the presence of HNO3 gas, the HNO3-QLLs on the ice basal faces were aqueous HNO3 solutions, whose temperature and HNO3 concentration coincided with those along the liquidus line.
  • From the disappearance temperatures of the HNO3-QLLs on the ice basal faces, we estimated PHNO3 under low- and high-PHNO3 conditions to be ~10−4 and 10−3–10−2 Pa, respectively. These two values were smaller than the maximum PHNO3 estimated from the equilibrium aqueous HNO3 solutions vapor pressures of 5 × 10⁻⁴ and 6 Pa, respectively.

Supplementary Materials

The following are available online at https://www.mdpi.com/2073-4352/10/2/72/s1, Video S1: Appearance process of pure-QLL on the ice basal face with increasing temperature from −3.0 to −2.5 °C in the absence of HNO3 gas (Figure 2a), Video S2: Appearance process of HNO3-QLL on the ice basal face with increasing temperature from −0.6 to −0.3 °C under low-PHNO3 condition (Figure 2b), Video S3: Appearance process of HNO3-QLL on the ice basal face with increasing temperature from −2.0 to −1.8 °C under high-PHNO3 condition (Figure 2c), Video S4: Formation of macrostep from HNO3-QLL on the ice basal face with decreasing temperature from −0.5 to −4.7 °C under low-PHNO3 condition (Figure 8a).

Author Contributions

Conceptualization, K.N., Y.F., P.A. and G.S.; Methodology and validation, K.N., K.M., and G.S.; Formal analysis, data curation, supervision, and project administration, K.N.; Investigation, K.N. and J.M.; Writing—original draft preparation, K.N. and G.S.; Writing—review and editing, K.N., J.M., P.A., and G.S. All authors have read and agreed to the published version of the manuscript.

Funding

This research was funded by JSPS KAKENHIs (grant numbers 17K05604 (K.N.) and 19H02611 (G.S.)), the Short-term JSPS Bridge fellowship (S16129 (P.A.)), and the JSPS Summer Program (SP18413 (J.M.)).

Acknowledgments

The authors thank Y. Saito, S. Kobayashi, K. Ishihara, and G. Ryu (Olympus Corporation) for their technical support of the laser confocal microscopy instrumentation; J. Chen (Hokkaido University) for providing the experimental data; and T. Hama (Hokkaido University) for their valuable discussion.

Conflicts of Interest

The authors declare no conflicts of interest.

References

  1. Bartels-Rausch, T. Chemistry: Ten things we need to know about ice and snow. Nature 2013, 494, 27–29. [Google Scholar] [CrossRef] [PubMed]
  2. Grannas, A.M.; Jones, A.E.; Dibb, J.; Ammann, M.; Anastasio, C.; Beine, H.J.; Bergin, M.; Bottenheim, J.; Boxe, C.S.; Carver, G.; et al. An overview of snow photochemistry: Evidence, mechanisms and impacts. Atmos. Chem. Phys. Discuss. 2007, 7, 4165–4283. [Google Scholar] [CrossRef] [Green Version]
  3. Domine, F.; Bock, J.; Voisin, D.; Donaldson, D.J. Can We Model Snow Photochemistry? Problems with the Current Approaches. J. Phys. Chem. A 2013, 117, 4733–4749. [Google Scholar] [CrossRef] [PubMed]
  4. Bartels-Rausch, T.; Jacobi, H.-W.; Kahan, T.F.; Thomas, J.L.; Thomson, E.S.; Abbatt, J.P.D.; Ammann, M.; Blackford, J.R.; Bluhm, H.; Boxe, C.; et al. A review of air–ice chemical and physical interactions (AICI): Liquids, quasi-liquids, and solids in snow. Atmos. Chem. Phys. 2014, 14, 1587–1633. [Google Scholar] [CrossRef] [Green Version]
  5. Solomon, S. Stratospheric ozone depletion: A review of concepts and history. Rev. Geophys. 1999, 37, 275–316. [Google Scholar] [CrossRef]
  6. Dominé, F.; Shepson, P.B. Air-snow interactions and atmospheric chemistry. Science 2002, 297, 1506–1510. [Google Scholar] [CrossRef] [Green Version]
  7. Huthwelker, T.; Ammann, M.; Peter, T. The uptake of acidic gases on ice. Chem. Rev. 2006, 106, 1375–1444. [Google Scholar] [CrossRef]
  8. Elbaum, M.; Lipson, S.G.; Dash, J.G. Optical study of surface melting on ice. J. Cryst. Growth 1993, 129, 491–505. [Google Scholar] [CrossRef]
  9. Petrenko, V.F.; Whitworth, R.W. Physics of Ice; Oxford University Press: Oxford, UK, 1999; ISBN 9780198518945. [Google Scholar]
  10. Li, Y.; Somorjai, G.A. Surface Premelting of Ice. J. Phys. Chem. C 2007, 111, 9631–9637. [Google Scholar] [CrossRef]
  11. Gelman Constantin, J.; Gianetti, M.M.; Longinotti, M.P.; Corti, H.R. The quasi-liquid layer of ice revisited: The role of temperature gradients and tip chemistry in AFM studies. Atmos. Chem. Phys. Discuss. 2018, 18, 14965–14978. [Google Scholar] [CrossRef] [Green Version]
  12. Boxe, C.S.; Saiz-Lopez, A. Multiphase modeling of nitrate photochemistry in the quasi-liquid layer (QLL): Implications for NOx release from the Arctic and coastal Antarctic snowpack. Atmos. Chem. Phys. 2008, 8, 4855–4864. [Google Scholar] [CrossRef] [Green Version]
  13. Marcotte, G.; Marchand, P.; Pronovost, S.; Ayotte, P.; Laffon, C.; Parent, P. Surface-Enhanced Nitrate Photolysis on Ice. J. Phys. Chem. A 2015, 119, 1996–2005. [Google Scholar] [CrossRef] [PubMed] [Green Version]
  14. Sazaki, G.; Matsui, T.; Tsukamoto, K.; Usami, N.; Ujihara, T.; Fujiwara, K.; Nakajima, K. In situ observation of elementary growth steps on the surface of protein crystals by laser confocal microscopy. J. Cryst. Growth 2004, 262, 536–542. [Google Scholar] [CrossRef]
  15. Komatsu, H.; Sazaki, G. Differential interference contrast microscopy/phase-contrast microscopy. In Compendium of Surface and Interface Analysis; The Surface Science Society of Japan, Ed.; Springer: Singapore, 2018; pp. 55–60. ISBN 978-981-10-6155-4. [Google Scholar]
  16. Sazaki, G.; Zepeda, S.; Nakatsubo, S.; Yokoyama, E.; Furukawa, Y. Elementary steps at the surface of ice crystals visualized by advanced optical microscopy. Proc. Natl. Acad. Sci. 2010, 107, 19702–19707. [Google Scholar] [CrossRef] [PubMed] [Green Version]
  17. Sazaki, G.; Asakawa, H.; Nagashima, K.; Nakatsubo, S.; Furukawa, Y. Double Spiral Steps on Ih Ice Crystal Surfaces Grown from Water Vapor Just below the Melting Point. Cryst. Growth Des. 2014, 14, 2133–2137. [Google Scholar] [CrossRef]
  18. Asakawa, H.; Sazaki, G.; Yokoyama, E.; Nagashima, K.; Nakatsubo, S.; Furukawa, Y. Roles of Surface/Volume Diffusion in the Growth Kinetics of Elementary Spiral Steps on Ice Basal Faces Grown from Water Vapor. Cryst. Growth Des. 2014, 14, 3210–3220. [Google Scholar] [CrossRef]
  19. Inomata, M.; Murata, K.; Asakawa, H.; Nagashima, K.; Nakatsubo, S.; Furukawa, Y.; Sazaki, G. Temperature Dependence of the Growth Kinetics of Elementary Spiral Steps on Ice Basal Faces Grown from Water Vapor. Cryst. Growth Des. 2018, 18, 786–793. [Google Scholar] [CrossRef]
  20. Sazaki, G.; Zepeda, S.; Nakatsubo, S.; Yokomine, M.; Furukawa, Y. Quasi-liquid layers on ice crystal surfaces are made up of two different phases. Proc. Natl. Acad. Sci. USA 2012, 109, 1052–1055. [Google Scholar] [CrossRef] [Green Version]
  21. Asakawa, H.; Sazaki, G.; Nagashima, K.; Nakatsubo, S.; Furukawa, Y. Two types of quasi-liquid layers on ice crystals are formed kinetically. Proc. Natl. Acad. Sci. 2016, 113, 1749–1753. [Google Scholar] [CrossRef] [Green Version]
  22. Murata, K.; Asakawa, H.; Nagashima, K.; Furukawa, Y.; Sazaki, G. Thermodynamic origin of surface melting on ice crystals. Proc. Natl. Acad. Sci. 2016, 113, E6741–E6748. [Google Scholar] [CrossRef] [Green Version]
  23. Murata, K.; Asakawa, H.; Nagashima, K.; Furukawa, Y.; Sazaki, G. In situ Determination of Surface Tension-to-Shear Viscosity Ratio for Quasiliquid Layers on Ice Crystal Surfaces. Phys. Rev. Lett. 2015, 115, 256103. [Google Scholar] [CrossRef] [PubMed] [Green Version]
  24. Nagata, Y.; Hama, T.; Backus, E.H.G.; Mezger, M.; Bonn, D.; Bonn, M.; Sazaki, G. The Surface of Ice under Equilibrium and Nonequilibrium Conditions. Acc. Chem. Res. 2019, 52, 1006–1015. [Google Scholar] [CrossRef] [PubMed] [Green Version]
  25. Jaecker-Voirol, A.; Ponche, J.L.; Mirabel, P. Vapor pressures in the ternary system water-nitric acid-sulfuric acid at low temperatures. J. Geophys. Res. 1990, 95, 11857. [Google Scholar] [CrossRef]
  26. Goldan, P.D.; Kuster, W.C.; Albritton, D.L.; Fehsenfeld, F.C.; Connell, P.S.; Norton, R.B.; Huebert, B.J. Calibration and tests of the filter-collection method for measuring clean-air, ambient levels of nitric acid. Atmos. Environ. 1983, 17, 1355–1364. [Google Scholar] [CrossRef]
  27. Hanke, M.; Umann, B.; Uecker, J.; Arnold, F.; Bunz, H. Atmospheric measurements of gas-phase HNO3 and SO2 using chemical ionization mass spectrometry during the MINATROC field campaign 2000 on Monte Cimone. Atmos. Chem. Phys. 2003, 3, 417–436. [Google Scholar] [CrossRef] [Green Version]
  28. Michelson, A.A.; Morley, E.W. On the relative motion of the Earth and the luminiferous ether. Am. J. Sci. 1887, s3–34, 333–345. [Google Scholar] [CrossRef]
  29. Beyer, K.D.; Hansen, A.R. Phase diagram of the nitric acid/water system: Implications for polar stratospheric clouds. J. Phys. Chem. A 2002, 106, 10275–10284. [Google Scholar] [CrossRef]
  30. Yokoyama, E.; Yoshizaki, I.; Shimaoka, T.; Sone, T.; Kiyota, T.; Furukawa, Y. Measurements of Growth Rates of an Ice Crystal from Supercooled Heavy Water under Microgravity Conditions: Basal Face Growth Rate and Tip Velocity of a Dendrite. J. Phys. Chem. B 2011, 115, 8739–8745. [Google Scholar] [CrossRef]
  31. Thibert, E.; Dominé, F. Thermodynamics and Kinetics of the Solid Solution of HNO3 in Ice. J. Phys. Chem. B 1998, 102, 4432–4439. [Google Scholar] [CrossRef]
  32. Wagner, R.S.; Ellis, W.C. Vapor-liquid-solid mechanism of single crystal growth. Appl. Phys. Lett. 1964, 4, 89–90. [Google Scholar] [CrossRef]
  33. Nagashima, K.; Sazaki, G.; Hama, T.; Asakawa, H.; Murata, K.; Furukawa, Y. Direct Visualization of Quasi-Liquid Layers on Ice Crystal Surfaces Induced by Hydrogen Chloride Gas. Cryst. Growth Des. 2016, 16, 2225–2230. [Google Scholar] [CrossRef]
  34. Nagashima, K.; Sazaki, G.; Hama, T.; Murata, K.; Furukawa, Y. Uptake Mechanism of Atmospheric Hydrogen Chloride Gas in Ice Crystals via Hydrochloric Acid Droplets. Cryst. Growth Des. 2018, 18, 4117–4122. [Google Scholar] [CrossRef]
Figure 1. A sectional schematic drawing of the observation chamber. Sample ice crystals prepared for the experiments were grown on a cleaved AgI crystal placed on the upper Cu plate. Source ice crystals were grown on the lower Cu plate and were used to supply water vapor to the sample ice crystals. Details of the observation chamber can be found in Sazaki et al. (2010) [16]. HNO3 gas was prepared by bubbling nitrogen gas through aqueous HNO3 solutions, and the gas mixture was continuously injected into the chamber at 10 mL/min.
Crystals 10 00072 g001
Figure 2. The appearances of QLLs on the ice basal faces in the absence/presence of HNO3 gas with increasing temperature: (a) under pure nitrogen gas, and (b,c) under nitrogen gases bubbled through aqueous HNO3 solutions of 0.1 (b) and 6.8 (c) mol/L. Videos of the appearance processes (a–c) are available in Videos S1–S3 in the Supplementary Materials, respectively.
Crystals 10 00072 g002
Figure 3. The disappearances of QLLs on ice basal faces in the absence/presence of HNO3 gas with decreasing temperature: (a) under pure nitrogen gas, and (b,c) under nitrogen gases bubbled through aqueous HNO3 solutions of 0.1 (b) and 6.8 (c) mol/L. QLLs indicated by red arrows in a1 and a2 disappeared in a2 and a3, respectively.
Crystals 10 00072 g003
Figure 4. The measurement of the contact angle for HNO3-QLL on the ice basal face at T = −0.6 °C under nitrogen gas bubbled through an aqueous HNO3 solution of 0.1 mol/L. (a) An LCM-DIM image, (b) an interferometric image, and (c) an enlarged image of the area marked by the red dotted rectangle in (b) (magnified only in the horizontal direction). (d) The height profile of the HNO3-QLL along the line X–Y in (a) and (b). Open circles show the heights of the HNO3-QLL calculated by Equation (1). The solid curve shows a fit of the open circles to a spherical dome height profile. The contact angle for HNO3-QLL on the ice basal face was estimated at 0.4°.
Crystals 10 00072 g004
Figure 5. The decrease in the size of a HNO3-QLL on an ice basal face with decreasing temperature under conditions where nitrogen gas is bubbled through an aqueous HNO3 solution of 0.1 mol/L. (a1–4) LCM-DIM images at T = −0.3, −0.4, −0.5 and −0.6 °C, respectively. (b) Changes in the temperature setting of the sample ice crystal (solid line) and in the lateral size of the HNO3-QLL along the line X–Y in a1 (black open circles) as a function of time. The images in a1–4 were taken at the moments indicated by arrows a1–4. (c) Changes in the volume of the HNO3-QLL (black solid circles) determined experimentally from the diameter and contact angle of the HNO3-QLL as a function of time. Red dotted line shows the volume change calculated from the volume at T = −0.3 °C (red solid line) using Equation (3).
Crystals 10 00072 g005
Figure 6. (a) Details of the phase diagram of the HNO3–H2O binary system after Beyer and Hansen [29]. (b) A schematic phase diagram (a liquidus line in the range of higher temperature and lower HNO3 concentrations) that illustrates the increase in C of the HNO3-QLL from C1 to C2 upon cooling from T1 to T2, following the observations reported in Figure 5.
Crystals 10 00072 g006
Figure 7. The changes in the equilibrium partial vapor pressure of HNO3, Pe(HNO3), of HNO3-QLLs (black solid curve) as a function of temperature. Red and blue lines show the partial pressures of HNO3 gas estimated from the disappearance temperatures (red and blue open circles) of the HNO3-QLLs under nitrogen gases bubbled through aqueous HNO3 solutions of 0.1 and 6.8 mol/L, respectively.
Crystals 10 00072 g007
Figure 8. The formation of a macrostep from a HNO3-QLL on an ice basal face following a large sudden decrease in temperature. (a) LCM-DIM images of the HNO3-QLL when we reduced T from −0.5 to −4.7 °C under nitrogen gas bubbled through an aqueous HNO3 solution of 0.1 mol/L. Red arrows show the edge of the macrostep. (b) Schematic illustrations of the formation of the macrostep from the HNO3-QLL. (b1,b2) When part of the HNO3-QLL freezes, the interface between the HNO3-QLL and the ice crystal grows evenly in the vertical direction, resulting in the formation of a thick ice step (black arrowheads). The lateral face of the ice step is therefore exposed to supersaturated water vapor. (b3) The ice macrostep then grows in the lateral direction utilizing water vapor molecules outside of the HNO3-QLL. Video of the formation process of the macrostep is available in Video S4 in the Supplementary Materials.
Crystals 10 00072 g008
Table 1. Partial pressure of HNO3 gas and the appearance and disappearance temperatures of quasi-liquid layers.
Experimental Conditions
PureLow PHNO3High PHNO3
HNO3 concentration in a bubbling solution-0.1 mol/L6.8 mol/L
Maximum PHNO306×10−4 Pa5 Pa
Estimated PHNO30~10−4 Pa10−3–10−2 Pa
Appearance temperature of QLLs
(mean ± standard deviation)
−2.5 to −1.4 °C
(−1.9 ± 0.4 °C)
−0.9 to −0.2 °C
(−0.5 ± 0.3 °C)
−2.5 to −1.5 °C
(−1.8 ± 0.4 °C)
Disappearance temperature of QLLs
(mean ± standard deviation)
−2.5 to −1.8 °C
(−2.2 ± 0.2 °C)
−1.3 to −0.6 °C
(−0.9 ± 0.3 °C)
−8.0 to −6.0 °C
(−6.4 ± 0.8 °C)

