Article

Advantages of Liquid Nitrogen Quick Freezing Combine Gradient Slow Thawing for Quality Preserving of Blueberry

1
Sericulture & Agri-Food Research Institute, Guangdong Academy of Agricultural Sciences, Key Laboratory of Functional Foods, Ministry of Agriculture and Rural Affairs, Guangdong Key Laboratory of Agricultural Products Processing, Guangzhou 510610, China
2
College of Food Science, South China Agriculture University, Guangzhou 510642, China
3
College of Food Science and Technology, Zhongkai University of Agriculture Engineering, Guangzhou 510225, China
*
Authors to whom correspondence should be addressed.
Crystals 2020, 10(5), 368; https://doi.org/10.3390/cryst10050368
Submission received: 12 March 2020 / Revised: 27 April 2020 / Accepted: 29 April 2020 / Published: 4 May 2020
(This article belongs to the Special Issue Ice Crystals)

Abstract

:
Berries are perishable fruits with high nutritional value. Freezing is an effective way for food preservation. Freezing and thawing methods play key roles in preserving edible values and commodity values of food. This study investigated the effects of spray liquid nitrogen quick freezing (NF−20~−100 °C) and gradient thawing on the physical and functional characteristics of blueberries by using immersion and refrigerator freezing and microwave, ultrasonic, room- and low-temperature, and static-water thawing as comparisons. The results show that NF−80 °C freezing combined with −20~−5~4 °C. gradient thawing can retain more than 95% of polyphenols and other nutritional compounds (including pectin, soluble sugar, and vitamin C) in thawed blueberries compared with fresh blueberries. Besides, this method shows the best results in preserving the hardness, cell structure, and water distribution of blueberries. It is also revealed that the ultralow temperature (−100 °C) freezing does not bring a significant advantage in preserving blueberries. Rapid thawing methods such as microwave and ultrasound thawing are not suitable for blueberries, which might be due to their small size and thin skin. The results suggested that the combination of NF−80 °C freezing and −20~−5~4 °C gradient thawing is the optimal process for blueberry preservation. The outcomes of this study will serve as theoretical guidance for improving the industrial process for freezing and thawing blueberries.

Graphical Abstract

1. Introduction

Blueberry, one of the fruits highest in bioactive ingredient contents, such as polyphenol, polysaccharides, and Vitamin C, has a lot of health benefits for human beings including being anti-cancer, improving memory, and protecting the cardiovascular system. Blueberries are sold in various forms, of which fresh blueberries remain dominant. However, fresh blueberries have a short self-life, which limits their commercial and edible value [1]. At present, blueberries can be preserved with a maximum shelf-life of 2–4 weeks, which relies heavily on cold chain and high humidity storage conditions [2].
Freezing is the foundation and core technology of food preservation. Liquid nitrogen spray freezing (NF) takes advantage of the enormous amount of heat that is absorbed during the gasification process. With rapid heat transfer or fast freezing rate, the time of a food product within the maximal crystal forming temperature range during NF process is short, resulting in small and uniformly distributed ice crystals [3,4,5]. As such, the original color, fragrance, and taste of the food product are preserved to the largest extent after thawing. Sanchez-Alonso and coworkers [6] observed that NF showed better results in cod quick freezing (quick freezing time, T21 moisture retention) compared with blast freezing and contact small space freezing. Lopkulkiaert and coworkers [7] demonstrated that NF is significantly superior to air-cooling and shelf-contact freezing in terms of freezing rate and moisture retention in a quick-freezing study of Penaeus vannamei.
Thawing is an essential presence accompanied by the freezing process. The quality assurance of frozen food includes two stages: freezing and thawing [8,9]. Different foods have different suitable thawing methods. Commonly used thawing methods are natural thawing, flowing water thawing, low-temperature thawing, immersion thawing, and microwave thawing. Gradient thawing (GT) refers to the thawing method in which the frozen product undergoes thawing treatments at different temperatures to achieve the lowest drip loss and the best preservation quality [10,11].
However, limited information is available for preserving blueberry using NF freezing combined with GT thawing. There are several published studies on freezing blueberry using liquid nitrogen, such as liquid nitrogen immerging freezing at −196 °C for short time, 10 s [12] and 8 s [13], as the pretreatment of osmotic dehydration, and which also include the study by Cao et al. [14], who put blueberry in liquid nitrogen 30 s until the core temperature of sample reached −18 °C, and indicated this method was not suitable for freezing blueberry. There is no investigation of freezing properties of blueberry frozen by liquid nitrogen spray freezing to various temperatures or of thawing characteristics of blueberry thawed under different thawing methods, especially gradient thawing.
Hence, in this study, the effects of different freezing temperatures of NF and the impacts of gradient thawing on the quality of blueberries were investigated to obtain the optimal freezing temperature and thawing method. The freezing result of NF was also compared with that of conventional immersion freezing (IF) and refrigerator freezing (RF). The result of slow thawing methods was also compared with that of fast thawing methods, including fast thawing methods (microwave thawing and ultrasound thawing) and other conventional thawing methods (such as static-water thawing and room temperature thawing). Finally, the best combination of freezing and thawing methods employed to obtain the best preservation result was found. It is believed the results obtained in this study will be useful to the industry for better preserving and thawing blueberries.

2. Materials and Methods

2.1. Reagents

Folin-ciocalteu, phenol, water-soluble vitamin E (Trolox), Fluoroscein,2, 2-azo (2-methylpropylamine) dihydrochloride (AAPH) were purchased from Fuchen chemical co., Ltd. (Tianjin, China) and are all analysis grade.

2.2. Blueberry

Fresh blueberries (Chinensi Sonn. Lanfeng) were purchased from local market (Guangzhou, China) and were harvested from an orchard in Dandong, China. Fruits with uniform size (average diameter: 1.5 cm) and no physical damage were selected and packaged with a vacuum bag (13 × 18 cm) and stored in a refrigerator at 4 °C for 12 h before further experiments.
Note: The samples for freezing experiments and thawing experiments were from different batches, because the samples used in the thawing experiments were prepared with the optimal freezing method determined in the freezing tests.

2.3. Treatments

2.3.1. Freezing Experiments

Samples frozen by liquid nitrogen spraying at −20 ± 1, −40 ± 2, −60 ± 2, −80 ± 2, and −100 ± 2 °C in a liquid nitrogen freezer (QF60-, Dejieli Refrigeration Technology Ltd., Shenzhen, China) are denoted as NF−20 °C, NF−40 °C, NF−60 °C, NF−80 °C, NF−100 °C groups, respectively. As control groups, samples frozen by a refrigerator at −20 ± 1 °C and liquid immersion freezing at −20 ± 1 °C are designated as RF−20 °C and IF−20 °C. 50% ethanol-water (w:w = 1:1) is used as the freezing media during the IF process. The target sample core temperature, which was monitored by a thermocouple (T type, Omega Engineering Inc., Connecticut, CT, USA), was −20 °C. Data were collected by a datalogger (TC-08, Omega Engineering Inc., Connecticut, CT, USA) with an interval of 1 s.
In order to obtain the optimum freezing method and temperature, the frozen blueberries were all thawed at 4 °C for physical and chemical index analysis.

2.3.2. Thawing Experiments

The packaged and precooled blueberries were frozen by NF−80 °C, which was determined by the freezing research as presented in the result section. The frozen blueberry was thawed by the methods listed in Table 1. Each experiment was terminated when the core temperature of blueberry reached 4 °C. The physical and chemical properties of thawed blueberries were also evaluated by the methods as the freezing experiments section.

2.4. Physical and Chemical Analysis

2.4.1. Weight Loss (WL)

The weight loss caused by freezing and thawing was measured by weighing each sample before being frozen (W0) and after being thawed (W1). WL was calculated based on the following equation:
WL = W 0 W 1 W 0 × 100 %

2.4.2. Hardness

After being thawed, hardness properties were determined by using a texture analyzer (TA XTPlus, Stable Micro System, Ltd., Surrey, UK) in compression mode with a 50 mm diameter cylindrical probe. One single blueberry was placed under the probe, and the testing parameters were pretest speed (1.6 mm/s), test speed (0.8 mm/s), posttest speed (2.0 mm/s), compression strain (30%), and compression interval (10 s). The result was the average of 12 tests. Prior to the hardness measure, samples were kept for 2 h at room temperature (25 °C) to rule out the influence of temperature fluctuations on the hardness [15].

2.4.3. Distribution of Water States

Low field nuclear magnetic resonance (LF-NMR) is often used to measure water states and their variation and distribution in plant food from a microscopic perspective. The distribution of water states in blueberry was determined according to the method described by Zhu et al. [3] with slight modifications using an LF-NMR (NMI-20, Shanghai Niumag Electronic Technology Co., LTD., Shanghai, China) Samples were placed at the bottom of the sample tube of the LF-NMR. Transverse relaxation (T2) was measured using the CPMG sequence with an echo time of 0.16 ms, a number of echoes of 160,000, sample frequency of 200 KHz, and number of scans of 16 times. The test temperature is 32 °C. Three relaxation times (T2b, T21, and T22) and their corresponding water percentage were recorded. The result was the average of 6 tests.

2.4.4. Soluble Sugar and Pectin Content

Changes in soluble sugar content were tested with the method demonstrated by Yang et al. [16] with slight modifications. A mixture of 10 g homogenized blueberry slurry and 90 mL deionized water was incubated in a water bath at 90 °C. The extract was then filtered and centrifuged (8000× g and 15 min). The supernatant was used to measure soluble sugar content in terms of glucose equivalent. Phenol (5%, w/v) and concentrated sulfuric acid were added directly into each test tubes with supernatant samples, and the absorbance was measured at a wavelength of 490 nm using an ultraviolet spectrophotometer (UV 1800, Shimadzu, Kyoto, Japan). The pectin content of blueberry was determined with an ultraviolet spectrophotometer at a wavelength of 530 nm, according to the method described by Chen et al. [17]. The result was the average of 5 tests.

2.4.5. Vitamin C (Vc) Ccontent

Blueberry slurry (5 g) was homogenized in 15 mL 1% (w/v) oxalic acid, and the mixture was then centrifuged. The supernatant was collected and kept at room temperature for 40 min without light. Activated carbon was used for decolorization before analysis. Fluorescence method was used, and the conditions of the fluorescence spectrophotometer (Cary Eclipse, Varian Inc., Palo Alto, CA, USA) were as follows: excitation wavelength 355 nm, emission wavelength 425 nm, emission and excitation slit width 5 nm.

2.4.6. Polyphenol Content, Anthocyanin Content, Antioxidant Activity, Polyphenol Oxidase (PPO) Activity, and Peroxidase (POD) Activity

The method of polyphenol extraction from blueberry followed the published protocol [18] with a slight modification. Briefly, the extraction of blueberry pulp (2 g) was combined with 10 mL acidified 80% methanol with 0.1% HCl (v/v) and kept in the dark for 1.5 h. The supernatant was collected, and the residue was re-extracted with the same process. The collected supernatant was subjected to the determination of total phenolic content and anthocyanin content. Total polyphenol content was tested at a wavelength of 760 nm by a colorimetric Folin-Ciocalteu method demonstrated by Wang et al. [19], and the results were expressed as milligram gallic acid equivalents per 100 g in fresh weight (mg GAE/100 g FW). The antioxidant activities of total polyphenol were determined by oxygen radical absorbance capacity (ORAC), which was also demonstrated by Wang et al. [19]. An automatic microplate reader (Infinite M200PRO, TECAN, Männedorf, Switzerland) was used to measure ORAC, and the analysis was carried out with an excitation wavelength of 485 nm and an emission wavelength of 520 nm. Anthocyanin content analysis was carried out with a pH differential spectrophotometric method [20] at wavelengths of 510 and 700 nm, and the obtained anthocyanin contents were represented as cyanidin-3-O-glucoside equivalent.
Polyphenol oxidase (PPO) and peroxidase (POD) activities of fresh and thawed blueberry were determined at wavelengths of 410 and 470 nm, respectively, according to the method reported by Martynenko and Chen [20]. All the results were the averages of 6 parallel measurements taken at the same condition.

2.4.7. Microscopic Observations

The microstructures of blueberries were evaluated by the same protocol as the previous study [21] with a slight modification. The detailed procedure is described as follows: (1) The blueberry was peeled and cut in half to reveal the cross-section; (2) The diced samples (1 × 1 cm) were immersed in a fixative containing glutaraldehyde (2.5%, w/w) for 24 h at 4 °C; (3) The fixed samples were rinsed by phosphate buffer (pH 7.2, 0.1 M) twice; (4) Then, the samples were dehydrated with gradient ethanol solutions (50%, 60%, 70%, 80%, 90%, and 100%) for 30 min, respectively; (5) The dehydrated samples were further dried by freezing drying; (6) Finally, the dried samples were mounted onto aluminum stubs using silver cement and coated with a thin layer of gold in a gold sputter (Hitachi, Chiyoda, Tokyo, Japan). The electrically conductive samples were used to observe the microstructure of blueberry. The micrographs of blueberry were acquired using a SU8020 scanning electron microscope (Hitachi), and the accelerating voltage was 15 kV.

2.4.8. Statistical Analysis

The obtained data were subjected to analysis of one-way variance (ANOVA) by using SPSS (Version 19.0, SPSS Inc., Chicago, Illinois, IL, USA), and the results were plotted by Origin 2018. The statistical significance of each experiment was p < 0.05.

3. Results and Discussion

3.1. Effects of Different Freezing Processes on the Quality Changes of Blueberry

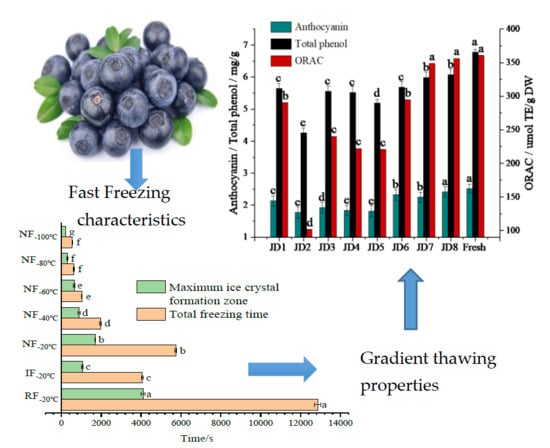
3.1.1. Freezing Characteristics

As shown in Figure 1a, the freezing process of blueberries consists of a pre-cooling stage (rapid cooling, 4~−1 °C), a phase transition stage (passing through the maximal crystal formation zone), and a quenching stage (−5~−20 °C). Generally, when the center temperature of a sample reaches −5 °C, 60% of the freezable water has undergone the phase change. The freezing curve of blueberry is similar to the previous study conducted by Cao et al. [14]. However, the total freezing time of −80 °C group (ca. 10.5 min, sample temperature from 4 to −20 °C) is significantly shorter than that of Cao’ study (ca. 16 min, sample temperature from 4 to −18 °C, freezing in a refrigerator). This is because the transfer heat speed of liquid nitrogen spray freezing is faster than that of low-temperature refrigerator freezing, which is a type of contact heat transfer. The nucleation temperature of blueberry under NF at different freezing temperature, immersion freezing, and refrigerator freezing is about −1.5~−3 °C. Hence, in this study, −1~−5 °C is used as the maximal crystal forming temperature range. As shown in Figure 1b, the total freezing time and phase transition time of different freezing treatments show the following trend: RF−20 °C >> NF−20 °C > IF−20 °C > NF−40 °C > NF−60 °C > NF−80 °C ≥ NF−100 °C. The total freezing time of NF−40 °C is 51.5% and 65.8% shorter than IF−20 °C and NF−20 °C, respectively, and the time of the sample within the maximal crystal forming temperature range is reduced by 16% and 48%, respectively. This result indicates that the main differences between NF−40 °C and IF−20 °C lie in the pre-cooling stage and the quenching stage. Besides, the difference in the freezing damage mainly occurs in the quenching stage, due to the differences in cooling rates and the formation of ice crystals. The difference between NF−40 °C and NF−20 °C mainly occurs in the phase transition stage, which is caused by the difference in freezing rate. The time span difference between other experimental groups passing through the maximal crystal forming temperature range is significant, indicating that the difference in freezing rate, temperature gradient, and mechanical pressure of ice crystals all have influences on the quality of frozen blueberries [3]. In general, for frozen foods, a fast-freezing rate (small and uniform ice crystals) can result in the highest quality retention [15,16]. The total freezing time of NF−60 °C is about half of that of NF−40 °C, and the phase change time of NF−80 °C is only about 1/2 of that of NF−60 °C, indicating −60 °C NF is the optimized method to shorten the total freezing time of blueberries, and NF−80 °C is the optimized method to protect the quality of blueberries.

3.1.2. Physical Properties

Changes in hardness and drip loss of blueberries after being treated with NF, IF, and RF at different temperatures are shown in Figure 2a. Hardness is often used as one of the main evaluation criteria for the quality of fresh blueberries. After freezing, the hardness of blueberries decreases significantly compared with fresh ones, which is similar to the study reported by Kim et al. [22]. This is mainly due to the changes in the packing density and strength of the cytoskeleton, degradation of pectin in the cell wall, or the reduced strength effect of calcium in the cell wall due to freezing and thawing of ice crystals, resulting in softening of blueberries [23]. This result agrees with the study conducted by Cao et al. [14]. Based on the changes of drip loss, the results can be roughly divided into two groups: the low-temperature group (−20~−40 °C) and the ultra-low-temperature group (−60~−100 °C). At a processing temperature of −20 °C, the hardness and the juice retention of the NF and IF treated groups are higher than the RF treated group. This is mainly due to the faster freezing rate of the NF and IF treated groups. With a shorter time in the maximal crystal forming zone, the degree of damage to the cell structure by ice crystals is reduced. When the processing temperature is reduced to −60 °C, the drip loss is dramatically decreased. The drip loss of the NF−60 °C treated group is significantly reduced by 0.3% compared with that of the NF−40 °C treated group. The drip loss of the NF−80 °C treated group is 0.12% lower compared with that of the NF−60 °C treated group. The NF−100 °C treated group and the NF−80 °C treated group have no significant difference in drip loss as the drip loss of the NF−100 °C treated group is only 0.07 % lower than that of the NF−80 °C treated group. Therefore, with comprehensive consideration, NF and immersion freezing are better than refrigerator freezing; −60 °C is the turning temperature of the physical properties of NF frozen blueberries. As the temperature is further reduced, the drip loss keeps decreasing but with a smaller change rate. Hence, −80 °C is a relatively suitable temperature for preserving the nutrients of blueberry.
According to the water self-diffusion coefficients (Dw), water in plant food products mainly consists of three types [24]: vacuole water, intercellular space and cytoplasm water, and cell wall water. The vacuole water has the highest Dw followed by intercellular space and cytoplasm water, and the cell wall water has the lowest Dw. The water in various parts of blueberries can migrate to different degrees during freezing. In general, T2 transverse relaxation time represents the mobility of water. The shorter the T2 is, the less mobility of water is, or vice versa [25]. Figure 2b shows the changes of the water in various parts of blueberries after being subjected to different freezing treatments, including T21 (ms), T22 (ms), and T23 (ms). T21 represents the bound water in the cell wall; T22 represents the immobilized water in the intercellular space and cytoplasm; and T23 is the free water in the vacuole, which has the highest mobility among these three types of water [26]. After freezing treatment, the overall free water ratio of blueberries decreases significantly (0.88%~3.95%), and the bound water and the immobilized water are significantly increased by about 1.08%~3.46% and 0.28%~0.87%, respectively. The more the free water is lost, the greater the damage to the vacuoles during freezing. The lost free water mainly migrates to the intercellular space and cytoplasm, and rarely flows to the cell wall. The slight increase in the immobilized water ratio is largely due to the decrease in total water content and the decrease in the ratio of free water. The overall trend is similar to that found in the freeze treatments of berries such as blueberry [14] and wolfberry [3]. The differences in the free water and bound water between treatment groups are similar and agree with the trend of drip loss. The freezing method resulting in the formation of the smallest ice crystals, which mainly distributed inside the cell, leads to the best water retention after being thawed. This is due to low mechanical pressure and temperature gradient during the freezing process. In this regard, NF−80 °C is the optimal treatment method for blueberry freezing.

3.1.3. Functional Components

Soluble sugar and Vc are important functional nutritional components of blueberries. As both are water-soluble, the loss of soluble sugar and Vc are closely related to drip loss after being thawed. After NF, IF, and RF at different temperatures, the contents of soluble sugar and Vc decrease, as shown in Figure 3a. The changes in the soluble sugar content and Vc content in different treatment groups are generally consistent. Based on the retention percentages of functional components, the following trend can be obtained: NF−100 °C ≥ NF−80 °C ≥ NF−60 °C ≥ NF−40 °C > IF−20 °C > NF −20 °C > RF−20 °C, which is similar to the trend of drip loss. Generally, NF and immersion freezing are better than refrigerator freezing. It is worth noticing that −40 °C is the first key temperature of NF to improve the retentions of soluble sugar and Vc. As there is a significant difference between NF−80 °C and NF−40 °C, −80 °C is the second key temperature of NF. The soluble sugar contents of blueberries in the NF40 °C and NF−60 °C treated groups are comparable, which is consistent with texture changes. This is mainly because soluble sugars, such as pectin, are mainly present in the sap and the cell wall. The soluble sugar retention rate of the NF−80 °C treated group is significantly higher than that of the NF−60 °C treated group and has no significant difference with that of the NF−100 °C treated group. Hence, −80 °C and liquid nitrogen quick freezing are the optimal temperature and method for blueberry freezing.
Polyphenols are functional nutrients that are beneficial to our health. Blueberries are rich in polyphenols. For this reason, they have become one of the most popular fruits. Oxygen radical absorbance capacity (ORAC) is often used to characterize anti-oxidant activity owning to its sensitivity, accuracy, and effectiveness [19,27]. After NF, IF, and RF treatments, the content of polyphenols and antioxidant activity of blueberries are all reduced. As shown in Figure 3b, the freezing methods show the following trend based on the polyphenol content and the antioxidant activity after being thawed: NF−100 °C ≥ NF−80 °C ≥ NF−60 °C ≥ NF−40 °C > IF−20 °C > NF−20 °C > RF−20 °C, which is similar to the trend of the contents of soluble sugar and Vc after being thawed. After being treated with NF−80 °C, the content of polyphenols and antioxidant activity are 94% and 65% of fresh samples, respectively, which have no significant difference compared with those of the NF−100 °C treated group. Besides, the content of polyphenols and antioxidant activity of the NF−80 °C treated group are 6% and 25% higher than those of the NF−60 °C treated group, respectively, and are 18% and 35% higher than those of the RF−20 °C treated group. Taking energy consumption and material cost into consideration, NF−80 °C is the optimal method for preserving the polyphenol content of frozen blueberries. This is mainly because NF−80 °C has a relatively fast freezing rate, low drip loss, low cell damage, and less nutrient loss. The retention percentage of polyphenol content after NF treatment is much higher than that of antioxidant activity. This may be because of the influence of the freeze-thaw treatment on the cytoskeleton, which improves the extraction rate of polyphenols [28] and reduces the ORAC activity.

3.1.4. Microstructure Changes

During the freezing process, due to phase transition and water migration, the mechanical pressure induced by the formation of ice crystals often causes changes in cell morphology, including extrusion, puncture, loose arrangement, and skeleton collapse [29,30]. As shown in Figure 4, the internal tissue of a fresh blueberry is uniform, densely packed, and flat without voids, deformation, or fracture. Compared with fresh blueberries, the samples treated with different freezing methods show black voids with different sizes caused by the growth and melting of ice crystals. The NF−100 °C treated group has the best freezing result. In this group, the internal tissue of thawed blueberries is tight, flat, and uniform with a few slight fractured cells and relatively small voids. The cell morphologies of the blueberries in the NF−80 °C treated group and the NF−100 °C treated group are similar. With the increase of freezing temperature, the size of voids gradually increases, and the network structure becomes loose and deformed. Besides, the morphology of blueberry tissue gradually loses its original hardness and flatness with the rise of freezing temperature. The RF−20 °C treated group has the worst result: The cell walls are damaged and have lots of large voids. In addition, the texture of internal tissue is uneven and loose, and in some areas, the internal tissues are collapsed. This is similar to the study reported by Fava et al. [31], which found folding and compression of the epicarp of blueberry by freezing in a freezer at −20 °C combined with thawing at 22–24 °C. The trend of the damages and packing tightness in the morphology of cells in each treatment group are in line with the general trend of the texture and moisture content. Based on these trends, the treatment methods can be divided into three categories: fast freezing rate (NF−100 °C and NF−80 °C), medium freezing rate (NF−60 °C and NF−40 °C), and slow freezing rate (IF−20 °C, NF−20 °C, and RF−20 °C). This observation agrees with the trend observed by Charoenrein et al. [32] in the study of the effects of different freezing rates on the microstructure and texture of mango. The structural integrity and tightness of blueberry cell structure have strong coloration with the texture and drip loss of blueberries. Zhu et al. [3] reported a similar phenomenon in the study of liquid nitrogen quick freezing of wolfberries at different temperatures, where NF−80 °C > NF−60 °C > RF−40 °C. However, the damage to the cells caused by NF−100 °C is more serious than that caused by NF NF−80 °C. This may be because the size of wolfberries is smaller than that of blueberries. At −100 °C, the gradient temperature and mechanical pressure caused by the low temperature do more damage to wolfberries than blueberries, whereas this temperature may still have certain freeze protection effects on blueberries. Hence, based on the physical and chemical quality changes, −80 °C is the optimal freezing temperature for blueberry liquid nitrogen quick freezing. In China, as of 2020, liquid nitrogen is around 700 RMB/t, which is the lowest price ever reached, and there are various types of liquid nitrogen freezing equipment, such as tunnel, cabinet, screw, etc. Therefore, the application of liquid nitrogen freezing is getting wider. The result of this paper can provide valuable technical guidance for industry.

3.2. Impacts of Different Thawing Method on the Quality Characteristics of Blueberry

3.2.1. Physical Properties

The thawing times and WL values of treatment groups are shown in Figure 5a. The different thawing methods have significantly different effects on the thawing time and drip loss of blueberry. The thawing times of the thawing methods show the following trend: JD5 ˂ JD4 ≤ JD3 ˂ JD2 ˂ JD6 ˂ JD7 ˂ JD8. The microwave thawing (JD1) time is the shortest (only 72 s) among these thawing methods, and the thawing times of other thawing methods are 12 to 1039 times that of the microwave thawing time. The JD8 requires the longest thawing time, 74,830 s. Besides, different thawing methods also have different drip losses. Based on the WL values, the microwave thawing shows the lowest drip loss, 6.02%, followed by the gradient thawing method. The drip losses of other groups are 37.66%~85.76% higher than that of JD1. The WL value of the ultrasonic thawing group, JD5, is 11.18%, which is the highest among these thawing methods. There is no significant difference between the thawing time of the low-temperature thawing, the room-temperature thawing, and the static-water thawing. The drip losses of gradient thawing groups are lower than that of the microwave thawing group but higher than that of the ultrasonic thawing group. For example, the drip loss of the −5~4 °C gradient thawing, JD8, is only 2.3% lower than that of JD1.
The microwave thawing method employs the strong penetrating capability of microwave to quickly and uniformly heat frozen products. When thawing, the areas in blueberry cells with lower freezing point melt first, and the rapid thawing of ice crystals allows the tissue to absorb water, which helps to achieve the shortest thawing time and the lowest drip loss. Besides, the fruit skin also contributes to the reduction of the thawing time and drip loss. Ultrasonic thawing enables energy transfer to promote heat transfer through physical effects such as cavitation. Increasing the ultrasonic power can accelerate thawing. However, at the same time, greater mechanical vibrations will cause certain damages to cell tissues, resulting in an increased drip loss. The static-water thawing, normal-temperature thawing, and low-temperature thawing are all convection heat exchange through the interactions between the outside of the blueberry and the median, such as water and air, and the solidification of external water vapor. The thawing time increases with decreasing temperature. The slow gradient thawing, however, causes little damages to the cells and the skin of blueberries, resulting in a lower drip loss. The thermal conductivity of water is higher than that of air, which can greatly promote the heat transfer rate. However, at the same time, it causes overheating of the skin leading to an increased drip loss.
Hardness is one of the quality indicators that measure the acceptability of blueberries. The effects of different thawing methods on the hardness and the pectin content of quick-frozen blueberries are shown in Figure 5b. The results show significant differences (p ˂ 0.05) between different treatment groups. After being frozen-thawed, the hardness and the pectin content of blueberries are significantly reduced. The hardness of blueberries in different treatment groups after being thawed has the following trend: JD1 ˃ JD8 ˃ JD7 ˃ JD6 ˃ JD2 ˃ JD4 ˃ JD5 ˃ JD3, which is consistent with the result of pectin content. In addition, this trend is similar to the trend of drip loss, except for the last three thawing methods (JD5 ˂ JD4 ≤ JD3). This may be due to the higher temperature of the skin caused by the room-temperature thawing and the ultrasonic thawing [33] and the cell membrane modification induced by the mechanical vibration of the ultrasound affecting the permeability of the cell wall [34] and then resulting in a higher drip loss than pectin content reduction. Moreover, sonication has a degradation effect on pectin [33]. Nowak et al. [20] determined that both ultrasound treatment and freeze-thaw treatment can soften blueberries. The microwave thawing is the best thawing method for frozen blueberries, followed by gradient thawing. The microwave thawed blueberries show the highest hardness and pectin content, which are 60.82% and 97.79% of the fresh blueberries, respectively. The static-watering thawed blueberries have the lowest hardness and pectin content, which are 65.45% and 52.60% lower than those of fresh blueberries, respectively.
Hardness is closely related to the changes in pectin content [35] and moisture content. After being frozen-thawed, the formation of ice crystals during the freezing period has destroyed the cell wall of the blueberry. The structural change in the cell wall can be reflected in the disintegration of the middle lamella, and the most obvious component change in the cell wall is the loss of pectin, which results in the reduction of the hardness of the fruits. Besides, due to the drip loss after being thawed, the turgor pressure decreases contributing to the reduction of hardness. The damages in the tightness and integrity of the cytoskeleton caused by the freezing and thawing process also contribute to the softening of the sample [30]. Due to the fast thawing speed of microwave thawing, the low temperature in the gradient thawing process, and the mild processing conditions, the cell damages after thawing are minimized. With a reduced decomposition of pectin and low moisture loss, the texture of the thawed sample can be well preserved.

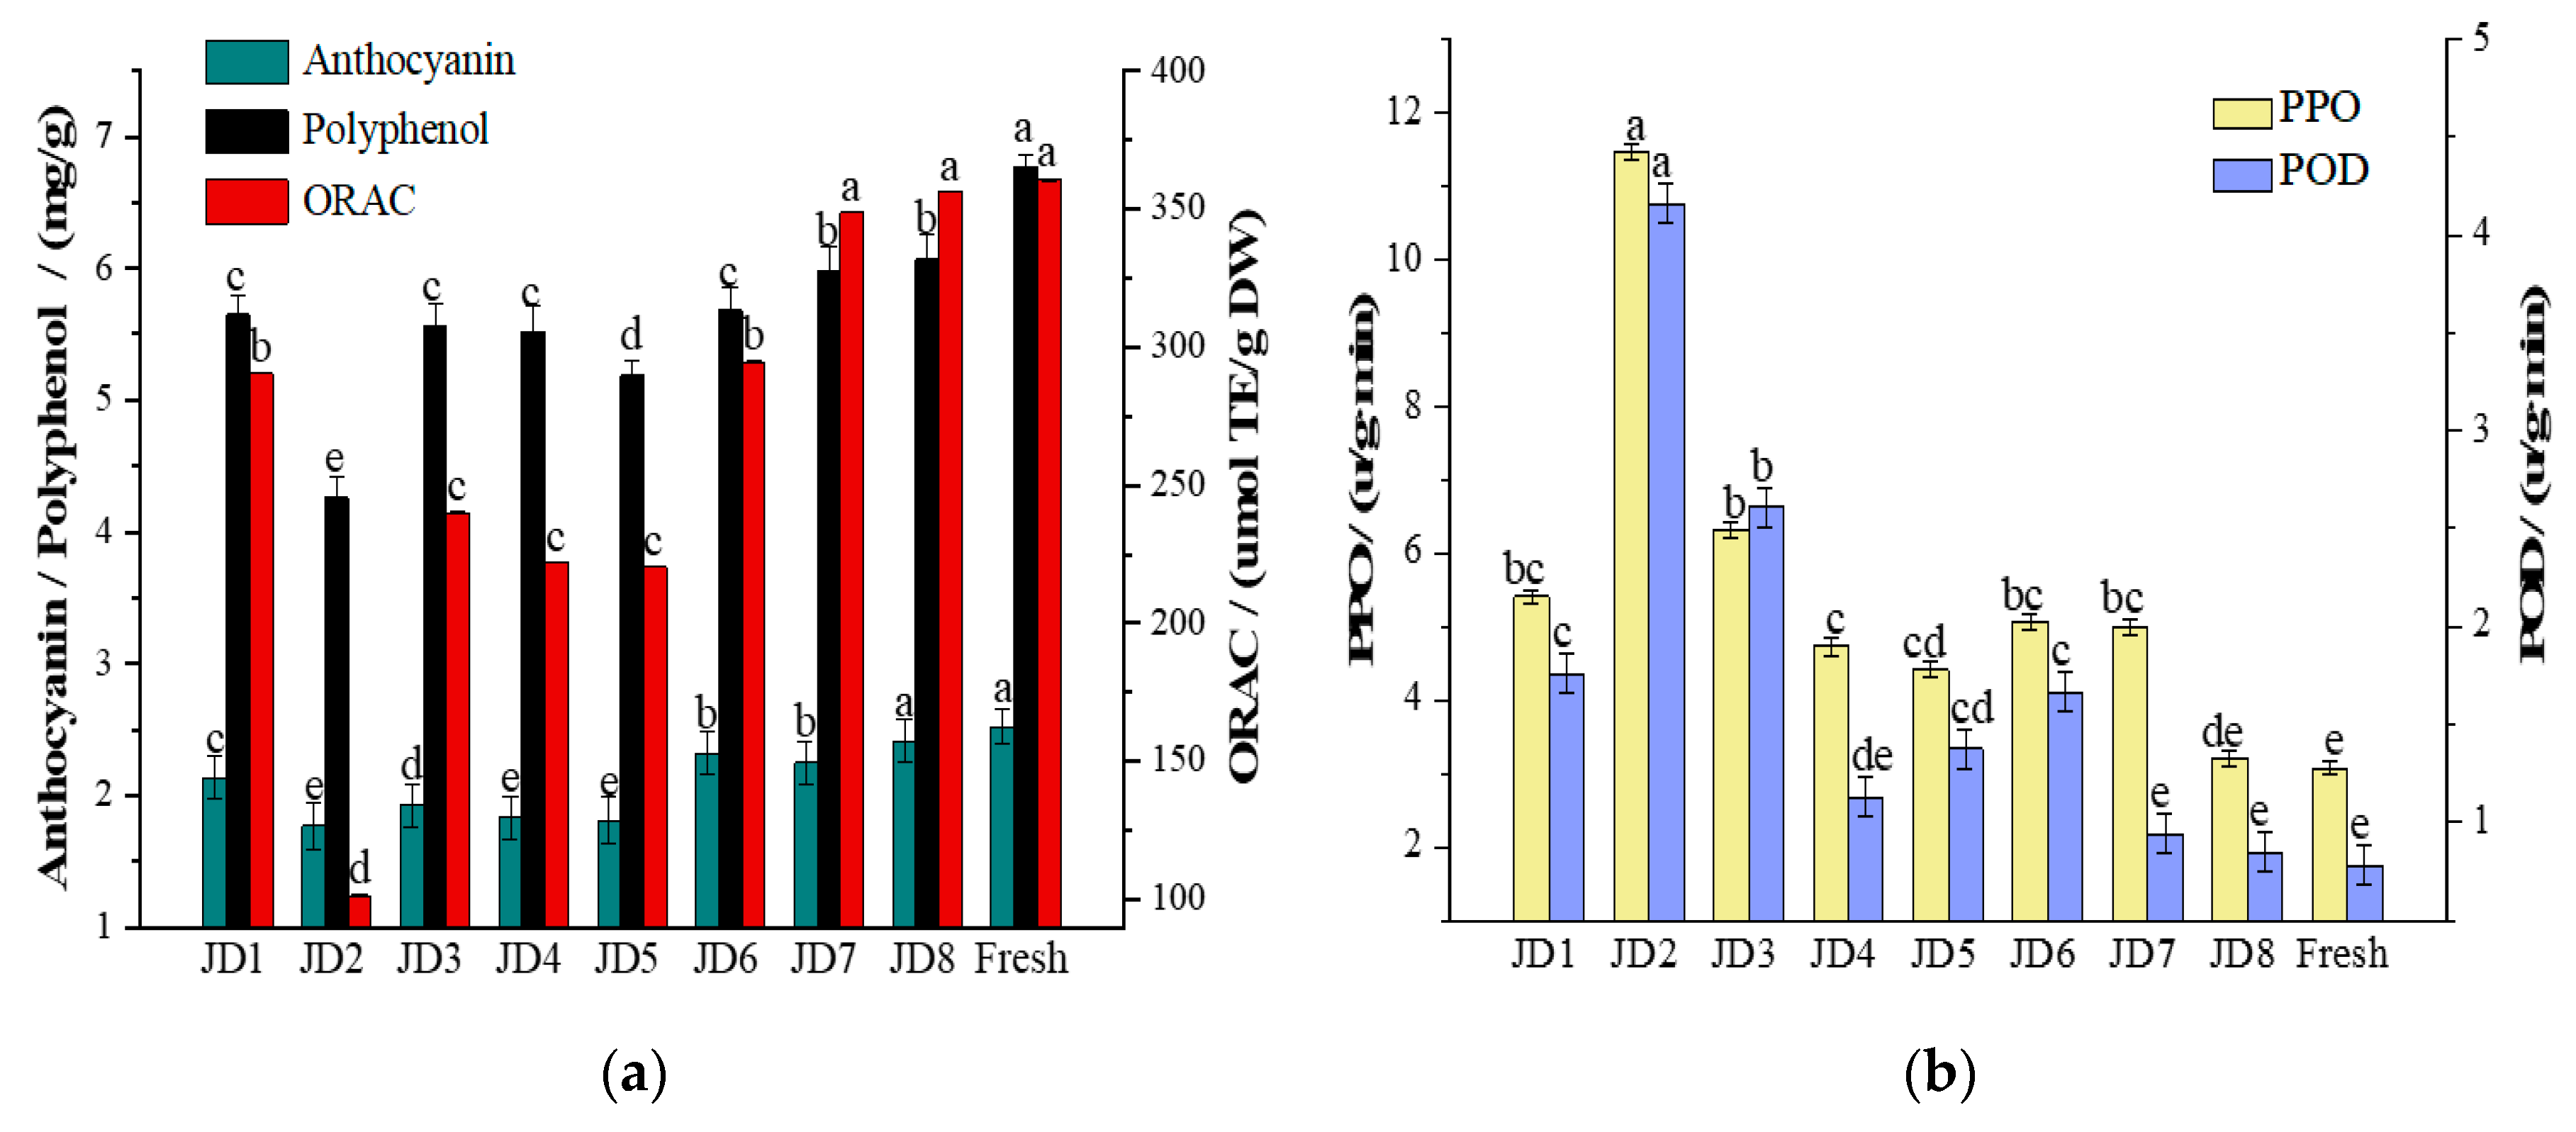
3.2.2. Functional Components

Blueberries are rich in anthocyanins and other polyphenols, which have high antioxidant activities. Oxygen radical absorbance capacity (ORAC) is often used to evaluate antioxidant activity. As shown in Figure 4, the effects of different thawing methods on the phenolics (anthocyanins, total polyphenol, ORAC) of quick-frozen blueberries are significantly different. After being frozen-thawed, the phenol content in blueberries is significantly reduced. The effects of different thawing methods on anthocyanin content, total polyphenol content, and total ORAC show the same trend, which is JD8 ˃ JD7 ˃ JD6 ˃ JD1 ˃ JD3 ˃ JD4 ˃ JD5 ˃ JD2 (Figure 6a). Among these thawing methods, the gradient thawing (JD7 and JD8) has the lowest impact on the phenol content. For the JD8 thawed group, the anthocyanin content, the total polyphenol content, and the total ORAC were found to be 89.19 %, 98 %, and 96.68 %, respectively, and are 11.39%, 6.95%, and 18.42% higher than the microwave thawed group, respectively.
PPO and POD are oxidoreductases that are widely found in fruits and vegetables. The changes in their activities are closely related to the formation of unpleasant flavors and biochemical metabolic reactions, affecting the appearance and quality of fruits and vegetables [36,37]. The thawed PPO and POD still have enzyme activity to promote the oxidation of phenols. After being frozen-thawed, the PPO and POD activities of blueberries show a significant upward trend (Figure 6b). In plants, these two enzymes generally have two forms, combined state and dissociative state. In plant cells, they are tightly bound to organelles with low enzyme activity. During the freeze-thaw process, the enzyme activity changes with external stimulus conditions: the cell structure is destroyed to varying degrees resulting in the activation of enzymes. Cano et al. [38] found that the PPO activity of a papain extract is significantly increased, 4 times, after being frozen at −18 °C for 7 days. As shown in Figure 6, there are significant differences in the effects of different thawing methods on the activities of PPO and POD of the quick-frozen blueberries. The enzyme activities of the room-temperature thawed group are the highest among the treatment groups, followed by the static-water thawed group and the microwave thawed group. The PPO and POD activities of the room-temperature thawed group were found to be 11.45 u/g·min and 2.61 u/g·min, respectively, which are more than two times of those of fresh blueberries. The gradient thawing, JD8, shows the best thawing result with the lowest total enzyme activity among these experiment groups, followed by the low-temperature thawed group (JD8) and the microwave thawed group. The enzyme activity of the gradient thawed blueberries is only 4%–8% higher than that of the fresh sample.
The ultrasound thawing and static-water thawing have short thawing time but lead to high drip losses. Besides, like room-temperature thawing, in thawing time and temperature, these two methods cause serious damages to cell structure. For these three above-mentioned methods, the heat is transmitted from the surface to the inside. When the fruit is thawed, the surface temperature is too high, which causes irreversible damage to the cells, resulting in high drip loss and a significant reduction in phenol content. At the same time, the high temperature induces the expressions of enzymes: part of the enzymes changes from the combined state to the dissociative state resulting in enhanced activities of PPO and POD. The gradient thawing and the low-temperature thawing have mild process conditions and show low damage to the cells. In other words, the effects of the gradient thawing and the low-temperature thawing on the polyphenol content, polyphenol activity, and PPO and POD are relatively small. Microwaves, a type of high-frequency electromagnetic wave, can quickly penetrate thought the fruit, which not only shortens the thawing time but also reduces the drip loss. Hence, it has a relatively small impact on phenol content. However, due to the heating effect of the microwave, the enzyme is activated to a certain degree. Li et al. [10] found that gradient low-temperature thawing is a more suitable method for beef thawing compared with a room-temperature thawing and a low-temperature thawing at 4 °C. The gradient low-temperature thawing significantly reduces the quality deterioration and the degree of damage to the microstructure. In summary, the gradient thawing, a method with low thawing temperature and mild thawing condition, is a suitable technique for frozen blueberries, as the resulted blueberries show higher quality and active nutrient content, including color, soluble sugar content, and Vc content (see the Supplementary Materials).

4. Conclusions

The present study evaluated the effect of liquid nitrogen quick freezing combined with gradient thawing on the freezing-thawing characteristics and quality change of blueberries. In the range of −80 °C to −20 °C, the lower the temperature is, the better the freezing characteristics of blueberry will be. The first key transition temperature for the quality of blueberries frozen by liquid nitrogen quick freezing is −60 °C, as the NF−60 °C treated group is significantly better than NF−40 °C group in preserving blueberry. Besides, there is no significant difference in T22, T23, ORAC, soluble sugar, and Vc between NF−40 °C and IF−20 °C. NF−80 °C is the optimal method for blueberry freezing. It shows the same advantages as NF−100 °C in hardness, drip loss, water distribution, soluble sugar content, polyphenol content, Vc content, and microstructure preservation. Additionally, NF−80 °C treatment process consumes less liquid nitrogen than NF−100 °C treatment. The −20~−5~4 °C gradient thawing shows the best result in preserving physical properties and functional nutrition of blueberries frozen by NF−80 °C and is better than microwave thawing and ultrasonic rapid thawing. Hence, it can be concluded that the gradient thawing method is a suitable method for thawing berries with small size and soft peel. In short, the outcomes of this study suggest that NF−80 °C combined with gradient thawing is an optimal freezing-thawing process for blueberry preservation, which serves as valuable guide for the development of the fruit preservation industry.

Supplementary Materials

The following are available online at https://www.mdpi.com/2073-4352/10/5/368/s1, Figure S1: Effects of various thawing ways on the soluble sugar and Vc changes of frozen blueberries. Table S1. Effects of different thawing methods on the color changes of frozen blueberries.

Author Contributions

Conceptualization, design, methodology, analysis: L.C., Y.X., and G.X.; investigation, writing: L.C., W.W., and H.L.; review: K.A., Y.Y., J.W., G.X., and J.Z.; project administration: J.W. (Jijun Wu) and Y.Z.; funding acquisition: Y.Y. and J.W. (Jing Wen). All authors have read and agreed to the published version of the manuscript.

Funding

This work is supported by grants from Research and development program in key areas of Guangdong province (2020B020225003); Guangdong academy of agricultural sciences president foundation (201806B); Guangzhou science and technology program (201903010045, 201909020001); Guangdong provincial special fund for modern agriculture industry technology innovation teams (2019KJ117; 2019KJ116); Guangdong academy of agricultural sciences fruit and vegetable processing research team project (201604TD).

Conflicts of Interest

The authors declare no conflict of interest.

References

  1. Zielinska, M.; Sadowski, P.; Błaszczak, W. Freezing/thawing and microwave-assisted drying of blueberries (Vaccinium corymbosum L.). Lwt-Food Sci. Technol. 2015, 62, 555–563. [Google Scholar] [CrossRef]
  2. Huynh, N.K.; Wilson, M.D.; Eyles, A.; Stanley, R.A. Recent advances in postharvest technologies to extend the shelf life of blueberries (Vaccinium sp.), raspberries (Rubus idaeus L.) and blackberries (Rubus sp.). J. Berry Res. 2019, 9, 687–707. [Google Scholar] [CrossRef]
  3. Zhu, Z.; Luo, W.; Sun, D.-W. Effects of liquid nitrogen quick freezing on polyphenol oxidase and peroxide activities, cell water states and epidermal microstructure of wolfberry. LWT 2020, 120, 108923. [Google Scholar] [CrossRef]
  4. Zhu, Z.; Zhou, Q.; Sun, D.-W. Measuring and controlling ice crystallization in frozen foods: A review of recent developments. Trends Food Sci. Technol. 2019, 90, 13–25. [Google Scholar] [CrossRef]
  5. Yang, F.; Jing, D.; Yu, D.; Xia, W.; Jiang, Q.; Xu, Y.; Yu, P. Differential roles of ice crystal, endogenous proteolytic activities and oxidation in softening of obscure pufferfish (Takifugu obscurus) fillets during frozen storage. Food Chem. 2019, 278, 452–459. [Google Scholar] [CrossRef]
  6. Sanchez-Alonso, I.; Moreno, P.; Careche, M. Low field nuclear magnetic resonance (LF-NMR) relaxometry in hake (Merluccius merluccius, L.) muscle after different freezing and storage conditions. Food Chem. 2014, 153, 250–257. [Google Scholar] [CrossRef]
  7. Lopkulkiaert, W.; Prapatsornwattana, K.; Rungsardthong, V. Effects of sodium bicarbonate containing traces of citric acid in combination with sodium chloride on yield and some properties of white shrimp (Penaeus vannamei) frozen by shelf freezing, air-blast and cryogenic freezing. Lwt-Food Sci. Technol. 2009, 42, 768–776. [Google Scholar] [CrossRef]
  8. James, C.; Purnell, G.; James, S.J. A Review of Novel and Innovative Food Freezing Technologies. Food Bioprocess Technol. 2015, 8, 1616–1634. [Google Scholar] [CrossRef]
  9. James, S.J.; James, C. Food Technologies: Freezing. Encycl. Food Saf. 2014, 3, 187–195. [Google Scholar] [CrossRef]
  10. Li, Y.; Jia, W.; Zhang, C.H.; Li, X.; Wang, J.Z.; Mu, G.F. Fluctuated low temperature combined with high-humidity thawing to reduce physicochemical quality deterioration of beef. Food Bioprocess Technol. 2014, 7, 3370–3380. [Google Scholar] [CrossRef]
  11. Roiha, I.S.; Tveit, G.M.; Backi, C.J.; Jónsson, Á.; Karlsdóttir, M.; Lunestad, B.T. Effects of controlled thawing media temperatures on quality and safety of pre-rigor frozen Atlantic cod (Gadus morhua). Lwt 2018, 90, 138–144. [Google Scholar] [CrossRef]
  12. Alfaro, L.; Siramard, S.; Chouljenko, A.; Sathivel, S. Effects of liquid nitrogen pretreatment on the osmotic dehydration and quality of cryogenically frozen blueberries ( Vaccinium angustifolium Ait.). Food Biosci. 2018, 22, 165–169. [Google Scholar] [CrossRef]
  13. Ketata, M.; Desjardins, Y.; Ratti, C. Effect of liquid nitrogen pretreatments on osmotic dehydration of blueberries. J. Food Eng. 2013, 116, 202–212. [Google Scholar] [CrossRef]
  14. Cao, X.; Zhang, F.; Zhao, D.; Zhu, D.; Li, J. Effects of freezing conditions on quality changes in blueberries. J. Sci. Food Agric. 2018, 98, 4673–4679. [Google Scholar] [CrossRef]
  15. Zhou, Q.; Ma, C.; Cheng, S.; Wei, B.; Liu, X.; Ji, S. Changes in antioxidative metabolism accompanying pitting development in stored blueberry fruit. Postharvest Biol. Technol. 2014, 88, 88–95. [Google Scholar] [CrossRef]
  16. Yang, B.; Prasad, K.N.; Jiang, Y. Structure identification of a polysaccharide purified from litchi (Litchi chinensis Sonn.) pulp. Carbohydr. Polym. 2016, 137, 570–575. [Google Scholar] [CrossRef]
  17. Chen, H.; Cao, S.; Fang, X.; Mu, H.; Yang, H.; Wang, X.; Xu, Q.; Gao, H. Changes in fruit firmness, cell wall composition and cell wall degrading enzymes in postharvest blueberries during storage. Sci. Hortic. 2015, 188, 44–48. [Google Scholar] [CrossRef]
  18. Zielinska, M.; Michalska, A. Microwave-assisted drying of blueberry (Vaccinium corymbosum L.) fruits: Drying kinetics, polyphenols, anthocyanins, antioxidant capacity, colour and texture. Food Chem. 2016, 212, 671–680. [Google Scholar] [CrossRef]
  19. Wang, H.; Guo, X.; Hu, X.; Li, T.; Fu, X.; Liu, R.H. Comparison of phytochemical profiles, antioxidant and cellular antioxidant activities of different varieties of blueberry ( Vaccinium spp.). Food Chem. 2017, 217, 773–781. [Google Scholar] [CrossRef]
  20. Martynenko, A.; Chen, Y. Degradation kinetics of total anthocyanins and formation of polymeric color in blueberry hydrothermodynamic (HTD) processing. J. Food Eng. 2016, 171, 44–51. [Google Scholar] [CrossRef]
  21. Allan-Wojtas, P.M.; Forney, C.F.; Carbyn, S.E.; Nicholas, K.U.K.G. Microstructural Indicators of Quality-related Characteristics of Blueberries—An Integrated Approach. Lwt-Food Sci. Technol. 2001, 34, 23–32. [Google Scholar] [CrossRef]
  22. Jo, H.-J.; Kim, J.-E.; Yu, M.-J.; Lee, W.-H.; Song, K.B.; Kim, H.-Y.; Hwang, I.G.; Yoo, S.M.; Han, G.J.; Park, J.-T. Effect of Freezing Temperature on Blueberry Quality. J. Korean Soc. Food Sci. Nutr. 2014, 43, 1906–1912. [Google Scholar] [CrossRef]
  23. Bonat Celli, G.; Ghanem, A.; Su-Ling Brooks, M. Influence of freezing process and frozen storage on the quality of fruits and fruit products. Food Rev. Int. 2016, 32, 280–304. [Google Scholar] [CrossRef]
  24. Santagapita, P.; Laghi, L.; Panarese, V.; Tylewicz, U.; Rocculi, P.; Rosa, M.D. Modification of Transverse NMR Relaxation Times and Water Diffusion Coefficients of Kiwifruit Pericarp Tissue Subjected to Osmotic Dehydration. Food Bioprocess Technol. 2012, 6, 1434–1443. [Google Scholar] [CrossRef]
  25. Li, J.; Kang, J.; Wang, L.; Li, Z.; Wang, R.; Chen, Z.X.; Hou, G.G. Effect of Water Migration between Arabinoxylans and Gluten on Baking Quality of Whole Wheat Bread Detected by Magnetic Resonance Imaging (MRI). J. Agric. Food Chem. 2012, 60, 6507–6514. [Google Scholar] [CrossRef]
  26. Qiao, S.; Tian, Y.; Song, P.; He, K.; Song, S. Analysis and detection of decayed blueberry by low field nuclear magnetic resonance and imaging. Postharvest Biol. Technol. 2019, 156, 110951. [Google Scholar] [CrossRef]
  27. Wang, Y.; Zhu, J.; Meng, X.; Liu, S.; Mu, J.; Ning, C. Comparison of polyphenol, anthocyanin and antioxidant capacity in four varieties of Lonicera caerulea berry extracts. Food Chem. 2016, 197, 522–529. [Google Scholar] [CrossRef]
  28. Tomaz, I.; Šeparović, M.; Štambuk, P.; Preiner, D.; Maletić, E.; Karoglan Kontić, J. Effect of freezing and different thawing methods on the content of polyphenolic compounds of red grape skins. J. Food Process. Preserv. 2018, 42, e13550. [Google Scholar] [CrossRef]
  29. Jha, P.K.; Xanthakis, E.; Chevallier, S.; Jury, V.; Le-Bail, A. Assessment of freeze damage in fruits and vegetables. Food Res. Int. 2019, 121, 479–496. [Google Scholar] [CrossRef]
  30. Li, D.; Zhu, Z.; Sun, D.-W. Effects of freezing on cell structure of fresh cellular food materials: A review. Trends Food Sci. Technol. 2018, 75, 46–55. [Google Scholar] [CrossRef]
  31. Fava, J.; Alzamora, S.M.; Castro, M.A. Structure and Nanostructure of the Outer Tangential Epidermal Cell Wall in Vaccinium corymbosum L. (Blueberry) Fruits by Blanching, Freezing-Thawing and Ultrasound. Food Sci. Technol. Int. 2016, 12, 241–251. [Google Scholar] [CrossRef]
  32. Charoenrein, S.; Owcharoen, K. Effect of freezing rates and freeze-thaw cycles on the texture, microstructure and pectic substances of mango. Int. Food Res. J. 2016, 23, 613. [Google Scholar]
  33. Xu, Y.T.; Zhang, L.; Bailina, Y.; Ge, Z.; Ding, T.; Ye, X.; Liu, D. Effects of ultrasound and/or heating on the extraction of pectin from grapefruit peel. J. Food Eng. 2014, 126, 72–81. [Google Scholar] [CrossRef]
  34. Miano, A.C.; Rojas, M.L.; Augusto, P.E.D. Structural changes caused by ultrasound pretreatment: Direct and indirect demonstration in potato cylinders. Ultrason. Sonochem. 2019, 52, 176–183. [Google Scholar] [CrossRef]
  35. Deng, L.-Z.; Mujumdar, A.S.; Yang, X.-H.; Wang, J.; Zhang, Q.; Zheng, Z.-A.; Gao, Z.-J.; Xiao, H.-W. High humidity hot air impingement blanching (HHAIB) enhances drying rate and softens texture of apricot via cell wall pectin polysaccharides degradation and ultrastructure modification. Food Chem. 2018, 261, 292–300. [Google Scholar] [CrossRef]
  36. Hadidi, M.; Ibarz, A.; Conde, J.; Pagan, J. Optimisation of steam blanching on enzymatic activity, color and protein degradation of alfalfa (Medicago sativa) to improve some quality characteristics of its edible protein. Food Chem. 2019, 276, 591–598. [Google Scholar] [CrossRef]
  37. Zhang, Z.; Niu, L.; Li, D.; Liu, C.; Ma, R.; Song, J.; Zhao, J. Low intensity ultrasound as a pretreatment to drying of daylilies: Impact on enzyme inactivation, color changes and nutrition quality parameters. Ultrason. Sonochem. 2017, 36, 50–58. [Google Scholar] [CrossRef]
  38. Cano, M.P.; de Ancos, B.A.; Lobo, G. Peroxidase and Polyphenoloxidase Activities in Papaya During Postharvest Ripening and After Freezing/Thawing. J. Food Sci. 1995, 60, 815–817. [Google Scholar] [CrossRef]
Figure 1. Comparison of freezing times of blueberry under different freezing processes: (a) freezing curve (b) freezing time. Note: In this paper, the different letters above the histogram represent the significant difference of each group of one style treatment (p < 0.05).
Crystals 10 00368 g001
Figure 2. Comparisons of hardness and weight loss of blueberry under different freezing processes: (a) hardness and weight loss and (b) distribution of water states.
Crystals 10 00368 g002
Figure 3. Effects of different freezing process on the contents of the bioactive compounds of blueberry: (a) soluble sugar and Vc; (b) polyphenol and ORAC.
Crystals 10 00368 g003
Figure 4. Microstructure changes of thawed blueberries treated by different freezing methods.
Crystals 10 00368 g004
Figure 5. Effects of various thawing methods on the physical property changes of frozen blueberries: (a) thawing time and weight loss and (b) hardness and pectin.
Crystals 10 00368 g005
Figure 6. Effects of various thawing methods on the functional components changes of frozen blueberries: (a) polyphenol, anthocyanin and ORAC value; (b) PPO and POD activities.
Crystals 10 00368 g006
Table 1. Different thawing processes.
GroupProcessEquipment Model
JD1Microwave at 500 wNN-GF362M, Shanghai matsushita microwave oven co., LTD., Shanghai, China
JD2Room temperature at 25 °C
JD3Static-water thawing at 25 °C
JD4Ultrasound thawing at 28 kHZDl-800b, Shanghai zhixin instrument co., Ltd., Shanghai, China
JD5Ultrasound thawing at 47 kHZ
JD6Low temperature thawing at 4 °CIn a refrigerator (BCD-239WTGM, Hefei midea refrigerator co., LTD., Hefei, China
JD7Gradient thawing (−20 °C→0 °C4 °C)
JD8Gradient thawing(−20 °C−5 °C4 °C)

