The Phase Transition and Dehydration in Epsomite under High Temperature and High Pressure


1
Key Laboratory of High-Temperature and High-Pressure Study of the Earth’s Interior, Institute of Geochemistry, Chinese Academy of Sciences, Guizhou 550081, Guiyang, China
2
University of Chinese Academy of Sciences, Beijing 100049, China
*
Author to whom correspondence should be addressed.
Crystals 2020, 10(2), 75; https://doi.org/10.3390/cryst10020075
Submission received: 15 January 2020
/
Revised: 27 January 2020
/
Accepted: 28 January 2020
/
Published: 30 January 2020
(This article belongs to the Special Issue Pressure-Induced Phase Transformations)
Abstract
:The phase stability of epsomite under a high temperature and high pressure were explored through Raman spectroscopy and electrical conductivity measurements in a diamond anvil cell up to ~623 K and ~12.8 GPa. Our results verified that the epsomite underwent a pressure-induced phase transition at ~5.1 GPa and room temperature, which was well characterized by the change in the pressure dependence of Raman vibrational modes and electrical conductivity. The dehydration process of the epsomite under high pressure was monitored by the variation in the sulfate tetrahedra and hydroxyl modes. At a representative pressure point of ~1.3 GPa, it was found the epsomite (MgSO4·7H2O) started to dehydrate at ~343 K, by forming hexahydrite (MgSO4·6H2O), and then further transformed into magnesium sulfate trihydrate (MgSO4·3H2O) and anhydrous magnesium sulfate (MgSO4) at higher temperatures of 373 and 473 K, respectively. Furthermore, the established P-T phase diagram revealed a positive relationship between the dehydration temperature and the pressure for epsomite.
1. Introduction
In recent decades, hydrated sulfates have attracted a large amount of interest due to their great importance in exploring the interior structure of icy satellites, such as Europa, Ganymede and Callisto. It was widely reported that hydrated sulfates might be dominant minerals in the interior of these icy satellites, which was proved by the infrared spectral result collected from the Galileo spacecraft [1,2]. In addition, the discovery that anhydrous sulfates occur in carbonaceous chondritic meteorites also provides evidence for the existence of hydrated sulfates in the icy mantle of satellites, and these hydrated sulfates can be formed during the accretion of icy satellites [3]. In consideration of the high-pressure and high-temperature environment in the interior of these icy satellites, it is possible that these hydrated sulfates undergo a series of pressure-induced phase transitions and dehydration reactions. More importantly, as illustrated by Fortes and Choukroun [4], these transformations would have great impacts on the internal structure and heat transport in the icy mantle. As a representative magnesium (Mg)-bearing hydrated sulfate for epsomite (MgSO4·7H2O), the investigation into its optical and electrical properties under a high pressure and temperature could help us to deeply understand the interior structure, composition and physical property the icy satellites.
Many previous works have been devoted to studying the phase stability of epsomite under a high pressure and room temperature, but their results showed great inconsistencies. Livshits et al. investigated the high-pressure behavior of epsomite and found four phase transitions, occurring at ~0.4, ~1.2, ~1.6 and ~2.5 GPa, respectively [5]. Gromnitskaya et al. employed ultrasonic and neutron scattering measurements on epsomite to reveal its elastic property under a high pressure of up to ~3.0 GPa, and three phase transitions were identified at pressures of ~1.4, ~1.6 and ~2.5 GPa, respectively [6]. Grasset et al. established the phase relation of MgSO4–H2O under a pressure of up to ~2.0 GPa in a diamond anvil cell (DAC), but they only determined one phase transition for epsomite at ~0.6 GPa [7]. The results from Nakamura et al. indicated that there were no any phase transitions in epsomite up to ~4.5 GPa [8]. Therefore, it is still unclear how epsomite behaves under a high pressure and room temperature, which requires more detailed experimental investigations. Raman spectroscopy and electrical conductivity measurements have been demonstrated to be efficient methods to characterize the pressure-induced structural variations in various hydrated sulfates. In view of this, systematic investigations on the optical and electrical properties of epsomite under a high pressure and room temperature will provide a good deal of insight into its high-pressure behaviors.
It is a common phenomenon for hydrated sulfates to undergo dehydration reactions to form lower hydrates under a high temperature and pressure. A great number of previous high-pressure studies were undertaken, mainly concerned with the dehydration process of gypsum, chalcanthite and blödite, and all of them were found to have a positive relationship between the dehydration temperature and pressure [9,10,11,12,13]. For example, Yang et al. found that the dehydration temperature of gypsum gradually increased with the rise in pressure, and the dehydration boundary between gypsum and bassanite was determined to be P (GPa) = –23.708 + 0.050T (K) [13]. As a similar hydrated sulfate, it is possible that the dehydration temperature of epsomite would also be significantly affected by pressure. However, to the best of our knowledge, there are no relative experimental reports on the issue of epsomite dehydration under a high pressure and temperature.
The present study clarified the phase transition and dehydration reaction for epsomite under a high pressure and temperature, using Raman scattering and electrical conductivity measurements in a diamond anvil cell (DAC). Furthermore, we determined a P-T phase diagram for epsomite, which is crucial to understanding the pressure effect on the dehydration reaction of hydrated sulfates, and also has great implications for modeling the internal structure of icy satellites.
2. Materials and Methods
Natural epsomite was used as the starting sample for all of the high-pressure experiments, which was obtained from a phosphorus-bearing rock series in Songlin town, Zunyi county, Guizhou province. The high pressure and room temperature experiments were implemented in a symmetric diamond anvil cell (DAC) with a 300 μm anvil culet. In the high-temperature and high-pressure experiments, we placed an external resistive heater around the diamond to achieve the high temperature conditions. A K-type thermocouple wire was directly pasted onto the diamond surface in order to measure the temperature in the pressure chamber. A classic ruby pressure calibration formula from Mao et al. was adopted to accurately calculate the pressure in the sample chamber, based on the shifts of R1 fluorescence lines [14]. Taking into account the inevitable influence of the high temperature on the pressure conditions in the sample chamber, the high temperature-corrected equation of pressure calibration was selected in the process of the high-temperature and high-pressure measurements [15]. The Raman spectra were collected by a micro-confocal Raman spectrometer combined with a 514.5 nm argon-ion laser as the excitation source. Helium was selected as the pressure medium to provide the hydrostatic environment in the sample chamber. The resolution of the Raman spectrometer and the repetition rate were 1 and 0.2 cm−1, respectively. Each Raman spectra was obtained in the wave number range of 900–1200 cm−1 for the internal vibration modes of the sulfate and 3000–3800 cm−1 for the water molecular stretching modes. The acquisition time for each Raman spectra was set to 120 s. As for electrical conductivity experiments, a Solartron-1260 impedance/gain phase analyzer was used in this study to acquire the AC impedance spectrum. No pressure medium was used in order to avoid the introduction of impurity substances. The laser drilling technique was used to drill a 200 μm hole in the pre-indented T-301 stainless steel gasket, with a thickness of 50 μm. A mixture of boron nitride (BN) and epoxy was then compressed into the hole as the insulator, and another hole of 100 μm was drilled to provide an insulating sample chamber. More specific descriptions of the measurement procedure have been reported in previous works [16,17,18].
3. Results and Discussion
Under ambient conditions, three Raman peaks are observed to be located at positions of 983.3, 3322.6 and 3458.4 cm−1, respectively. The sharp peak at 983.3 cm−1 is assigned to the ν1 symmetric stretching mode of the sulfate tetrahedra, and the other two bands at 3322.6 and 3458.4 cm−1 are ascribed to the ν1 and ν3 vibrational modes of water molecules, respectively. All of these acquired Raman modes for the epsomite are generally consistent with the previous data by Wang et al. [19].
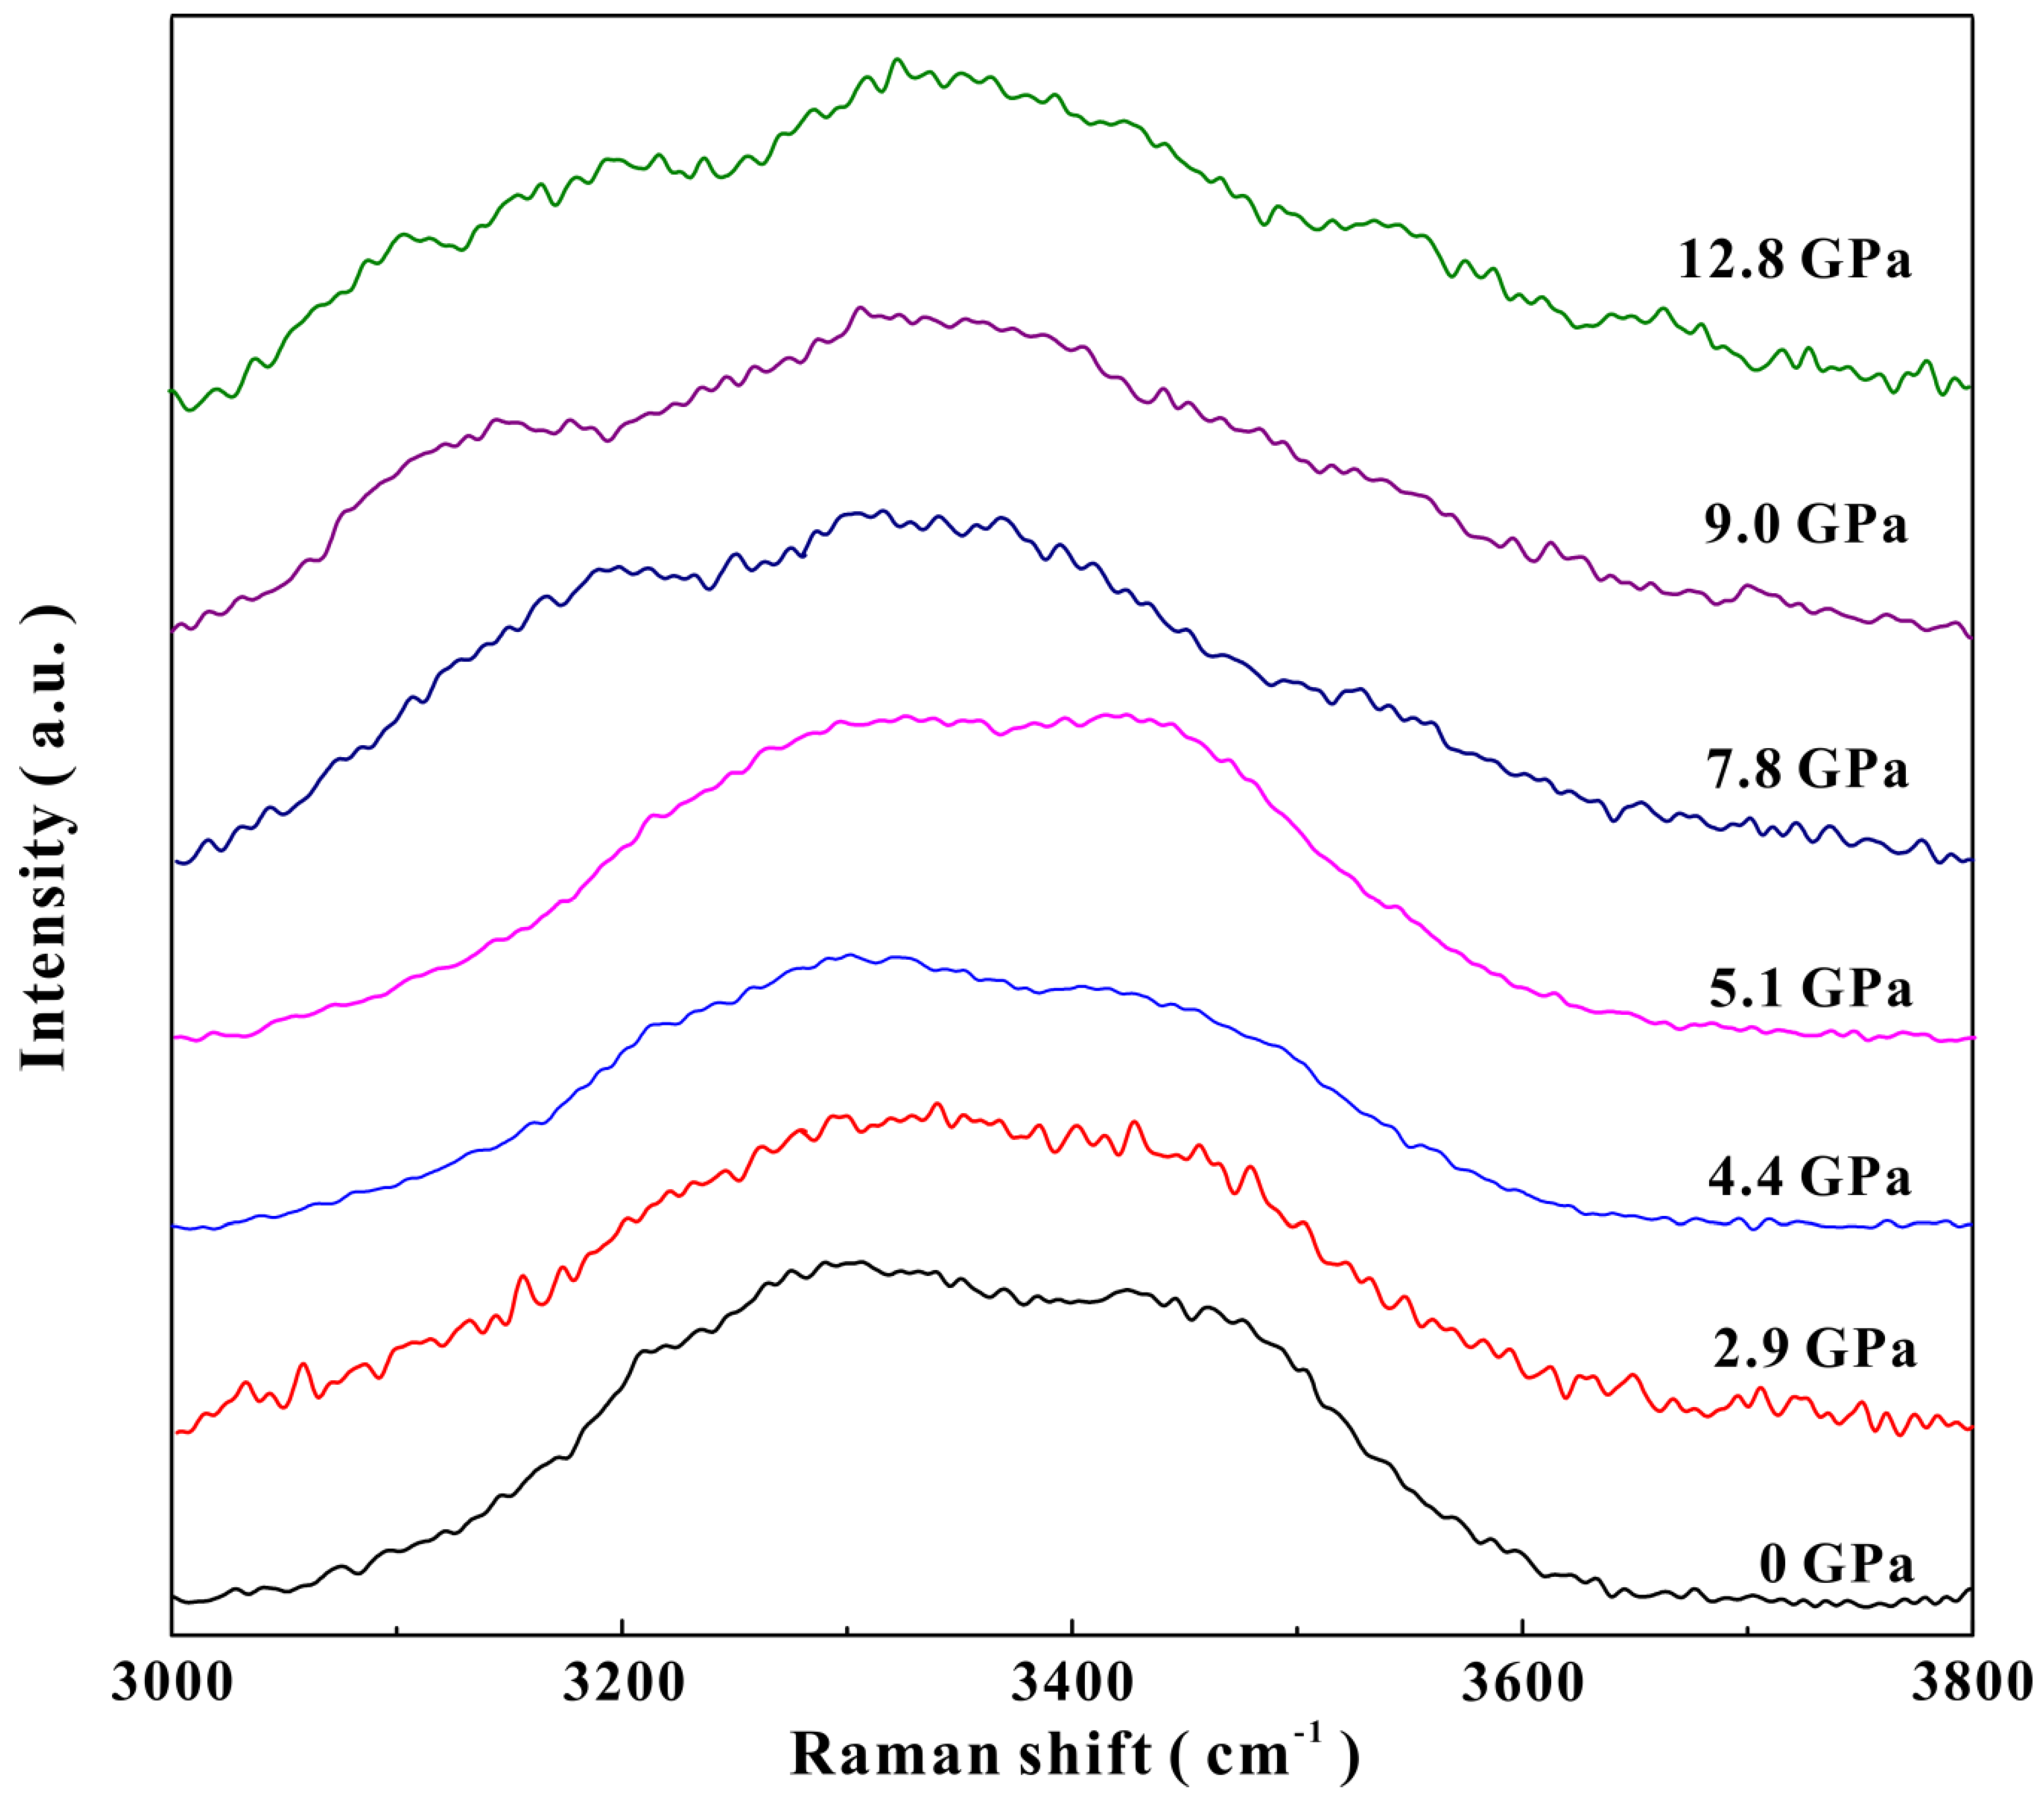
Figure 1a displays the high-pressure Raman spectra of the epsomite in the SO4 vibrational mode range at pressures of 0–12.8 GPa and room temperature. The corresponding pressure shifts for the ν1 (SO4) mode are plotted in Figure 1b, from which one obvious inflection point can be obtained, at a pressure of ~5.1 GPa. From ~0 to ~5.1 GPa, the vibrational mode of ν1 (SO4) slightly shifts towards the higher wave numbers, with a slope of 0.16 cm−1 GPa−1. However, upon further compression from ~5.1 to ~12.8 GPa, the ν1 (SO4) mode exhibits a strong pressure dependence with a relatively high slope value of 4.46 cm−1 GPa−1. In the meantime, it can be seen that the full width at half maximum (FWHM) of the ν1 (SO4) peak also shows a discontinuous change at the same pressure point of ~5.1 GPa. As shown in Figure 1c, the FWHM of the ν1 (SO4) band remains at an almost constant value of about 8.3 cm−1 below ~5.1 GPa, but it gruadally increases with pressure above ~5.1 GPa. Figure 2 shows the Raman spectra of the epsomite in the OH-stretching mode range under a high pressure and room temperature. Obviously, both of the two OH-stretching peaks at 3322.6 and 3458.4 cm−1 suddenly shift to lower frequencies above ~5.1 GPa. Upon decompression, the Raman spectra for the recovered epsomite exhibit a similar characterization to those of the starting sample.
In this study, we determined a pressure-induced structural phase transition in epsomite at ~5.1 GPa and at room temperature, based on the variation in Raman modes of SO4 tetrahedra and water molecules. The recovery of the Raman spectra after decompression reflects that this pressure-induced phase transformation is reversible. As for the nature of this structural phase transition, no evidence shows that it is associated with the dehydration process of epsomite, because the Raman spectra obtained in the whole pressure range are not in agreement with the dehydration product of the epsomite. We think that this is possibly related to the distortion of the sulfate tetrahedra and the strengthening of the hydrogen bonding. A recent work by Gonzalez–Platas et al. revealed that the chalcomenite underwent an isostructural phase transition at around ~4.0 GPa, which is very close to the transition point of epsomite that was revealed in this study (~5.1 GPa) [20]. The similarities between the transition pressures are closely associated with their crystal structure, because both of them have an orthorhombic structure with the same space group of P212121. In addition, other hydrated sulfates have also been revealed to undergo phase transitions under a high pressure and room temperature, such as gypsum, chalcanthite and mirabilite [12,21,22,23]. This implies that the pressure can play a very important role in tuning the structural and vibrational properties of most hydrated sulfates.
In order to further check the structural phase transition in epsomite, high-pressure electrical conductivity experiments were carried out in the pressure range of 0.5–12.4 GPa and under room temperature. Figure 3a presents the collected impedance spectra of epsomite in the frequency range from 10−1 to 107 Hz and at a series of pressure points, and the horizontal and vertical axes represent the real and imaginary parts of the complex impedance, respectively. Each spectra datum is composed of two semicircular arcs, which stand for grain interior and boundary contributions, respectively. All of these displayed impedance spectra were fitted using the equivalent circuit method in the Z-View software to obtain the grain interior resistance of the sample. The equivalent circuit was composed of a resistor (R) and a constant phase element (CPE) in parallel. The electrical conductivity for the grain interior contribution of sample was then calculated by the formula as follows:
where σ stands for the electrical conductivity, L is the distance between two electrodes, S represents the electrode and the R denotes the fitting resistance. As shown in Figure 3b, according to the obvious change in the slope of electrical conductivity, this diagram can be divided into two distinct regions: (i) in the pressure range of 0.5–4.6 GPa, the electrical conductivity of the epsomite monotonously increases with pressure, and the corresponding pressure coefficient is determined to be 0.06 S cm−1 GPa−1; (ii) from ~4.6 to ~12.4 GPa, its electrical conductivity still shows an increasing tendency but with a smaller slope value of ~0.04 S cm−1 GPa−1. The abrupt change in resistivity indicates the occurrence of a phase transition [24]. This transition point at ~4.6 GPa obtained from electrical conductivity measurements is slightly lower than the data from our high-pressure Raman spectroscopic experiments, which is possibly caused by the different pressure environment in the sample chamber. In comparison with the hydrostatic environment for the Raman measurements, it is non-hydrostatic for electrical conductivity experiments. There exists relatively high deviatoric stress in the non-hydrostatic compression, which has been reported to significantly influence the high-pressure behavior of materials [25]. Our electrical conductivity results provide another critical clue to support the occurrence of a pressure-induced phase transition in epsomite.
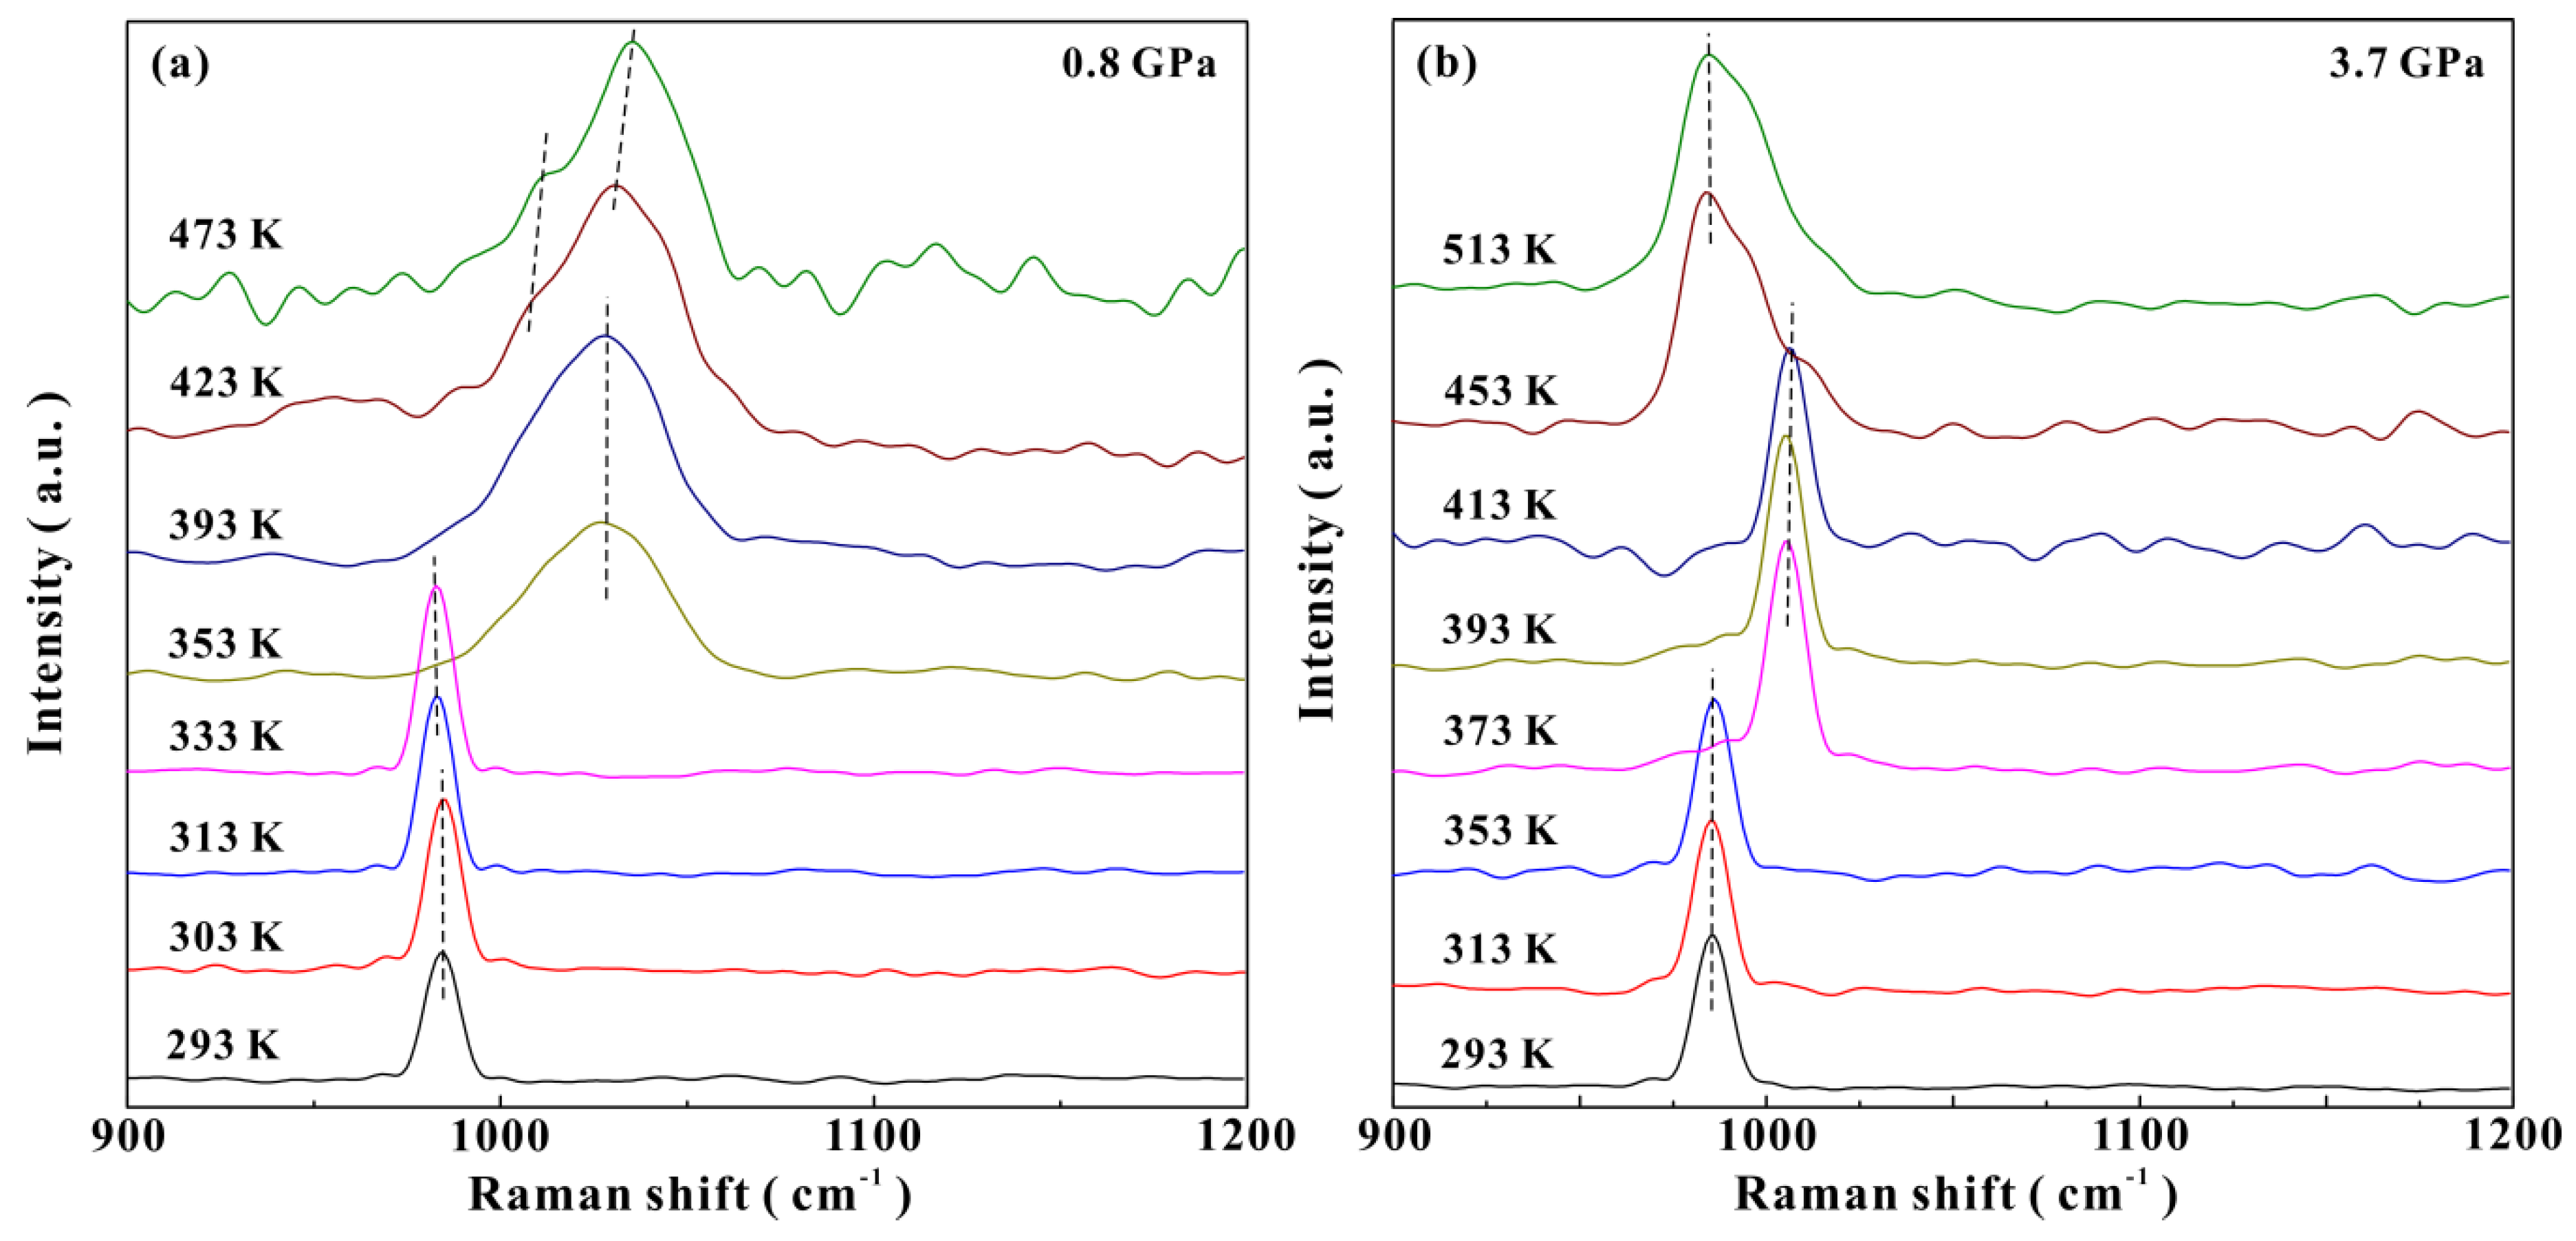
To reveal the effect of the high pressure on the dehydration process of epsomite, we in situ measured a series of Raman spectra of the epsomite under high temperatures of up to ~623 K and at constant pressure points of ~0.8, ~1.3, ~3.7 and ~6.4 GPa. Figure 4 presents the Raman spectra for the epsomite in the temperature range of 293–573 K and at a pressure of ~1.3 GPa. Characterized by the variation in the temperature dependence of the sulfate group and hydroxyl modes, three important temperature points were well-determined at ~343, ~373 and ~473 K, respectively. At ~343 K, it can be clearly observed from Figure 4a that the ν1 (SO4) peak at 983.3 cm-1 abruptly shifted to a lower frequency of 982.4 cm−1. Moreover, we also detected some obvious variations in the two OH-stretching modes, which were changed into one mode at a position of ~3441.5 cm−1 (Figure 4b). These observed new peaks at ~982.4 and ~3441.5 cm−1 agreed well with the position of the characteristic Raman vibrational mode of hexahydrite (MgSO4·6H2O) and, hence, we think that the epsomite initially dehydrated to a new hydrous phase hexahydrite at ~343 K. At a higher temperature of ~373 K, the ν1 (SO4) peaks suddenly broadened and moved to a higher wave number of 1023.2 cm−1, meanwhile, two new OH-stretching modes also started to appear at positions of 3153.03 and 3341.8 cm−1, respectively. The Raman spectra obtained at ~373 K exhibited similar peak characteristics to those of magnesium sulfate trihydrate (MgSO4·3H2O) [19]. Therefore, this provided robust evidence for the occurrence of another dehydration reaction, from hexahydrite to a new trihydrate phase. When the temperature was further enhanced, up to ~473 K, the complete dehydration of epsomite to form anhydrous magnesium sulfate (MgSO4) was finally observed by the appearance of a new peak at 1022.9 cm−1 and the vanishment of OH-stretching bands [19].
Figure 5 shows the temperature-dependent Raman spectra of epsomite collected at conditions of 293–623 K and at a higher pressure of ~6.3 GPa. At temperatures below ~553 K, the mode of ν1 (SO4) remained at an almost constant wave number, with an increasing temperature (Figure 5a). However, when the temperature was above ~553 K, this mode suddenly split into two new Raman peaks at 997.4 and 1020.0 cm−1. In addition, the Raman spectra for the OH-stretching modes were also greatly changed after ~553 K, as shown in Figure 5b. These discontinuous variations in the Raman modes of the sulfate tetrahedra and water molecules are associated with the dehydration reaction from the epsomite to magnesium sulfate trihydrate (MgSO4·3H2O). The high-temperature Raman spectra of the epsomite at another two pressure points of ~0.8 and ~3.7 GPa are displayed in Figure 6. At ~0.8 GPa, the epsomite was found to undergo thermal dehydration reactions at temperatures of ~313, ~353 and ~423 K, respectively. For the dehydration process at ~3.7 GPa, the epsomite initially dehydrated to hexahydrite at ~373 K, and then transformed to magnesium sulfate trihydrate at ~453 K.
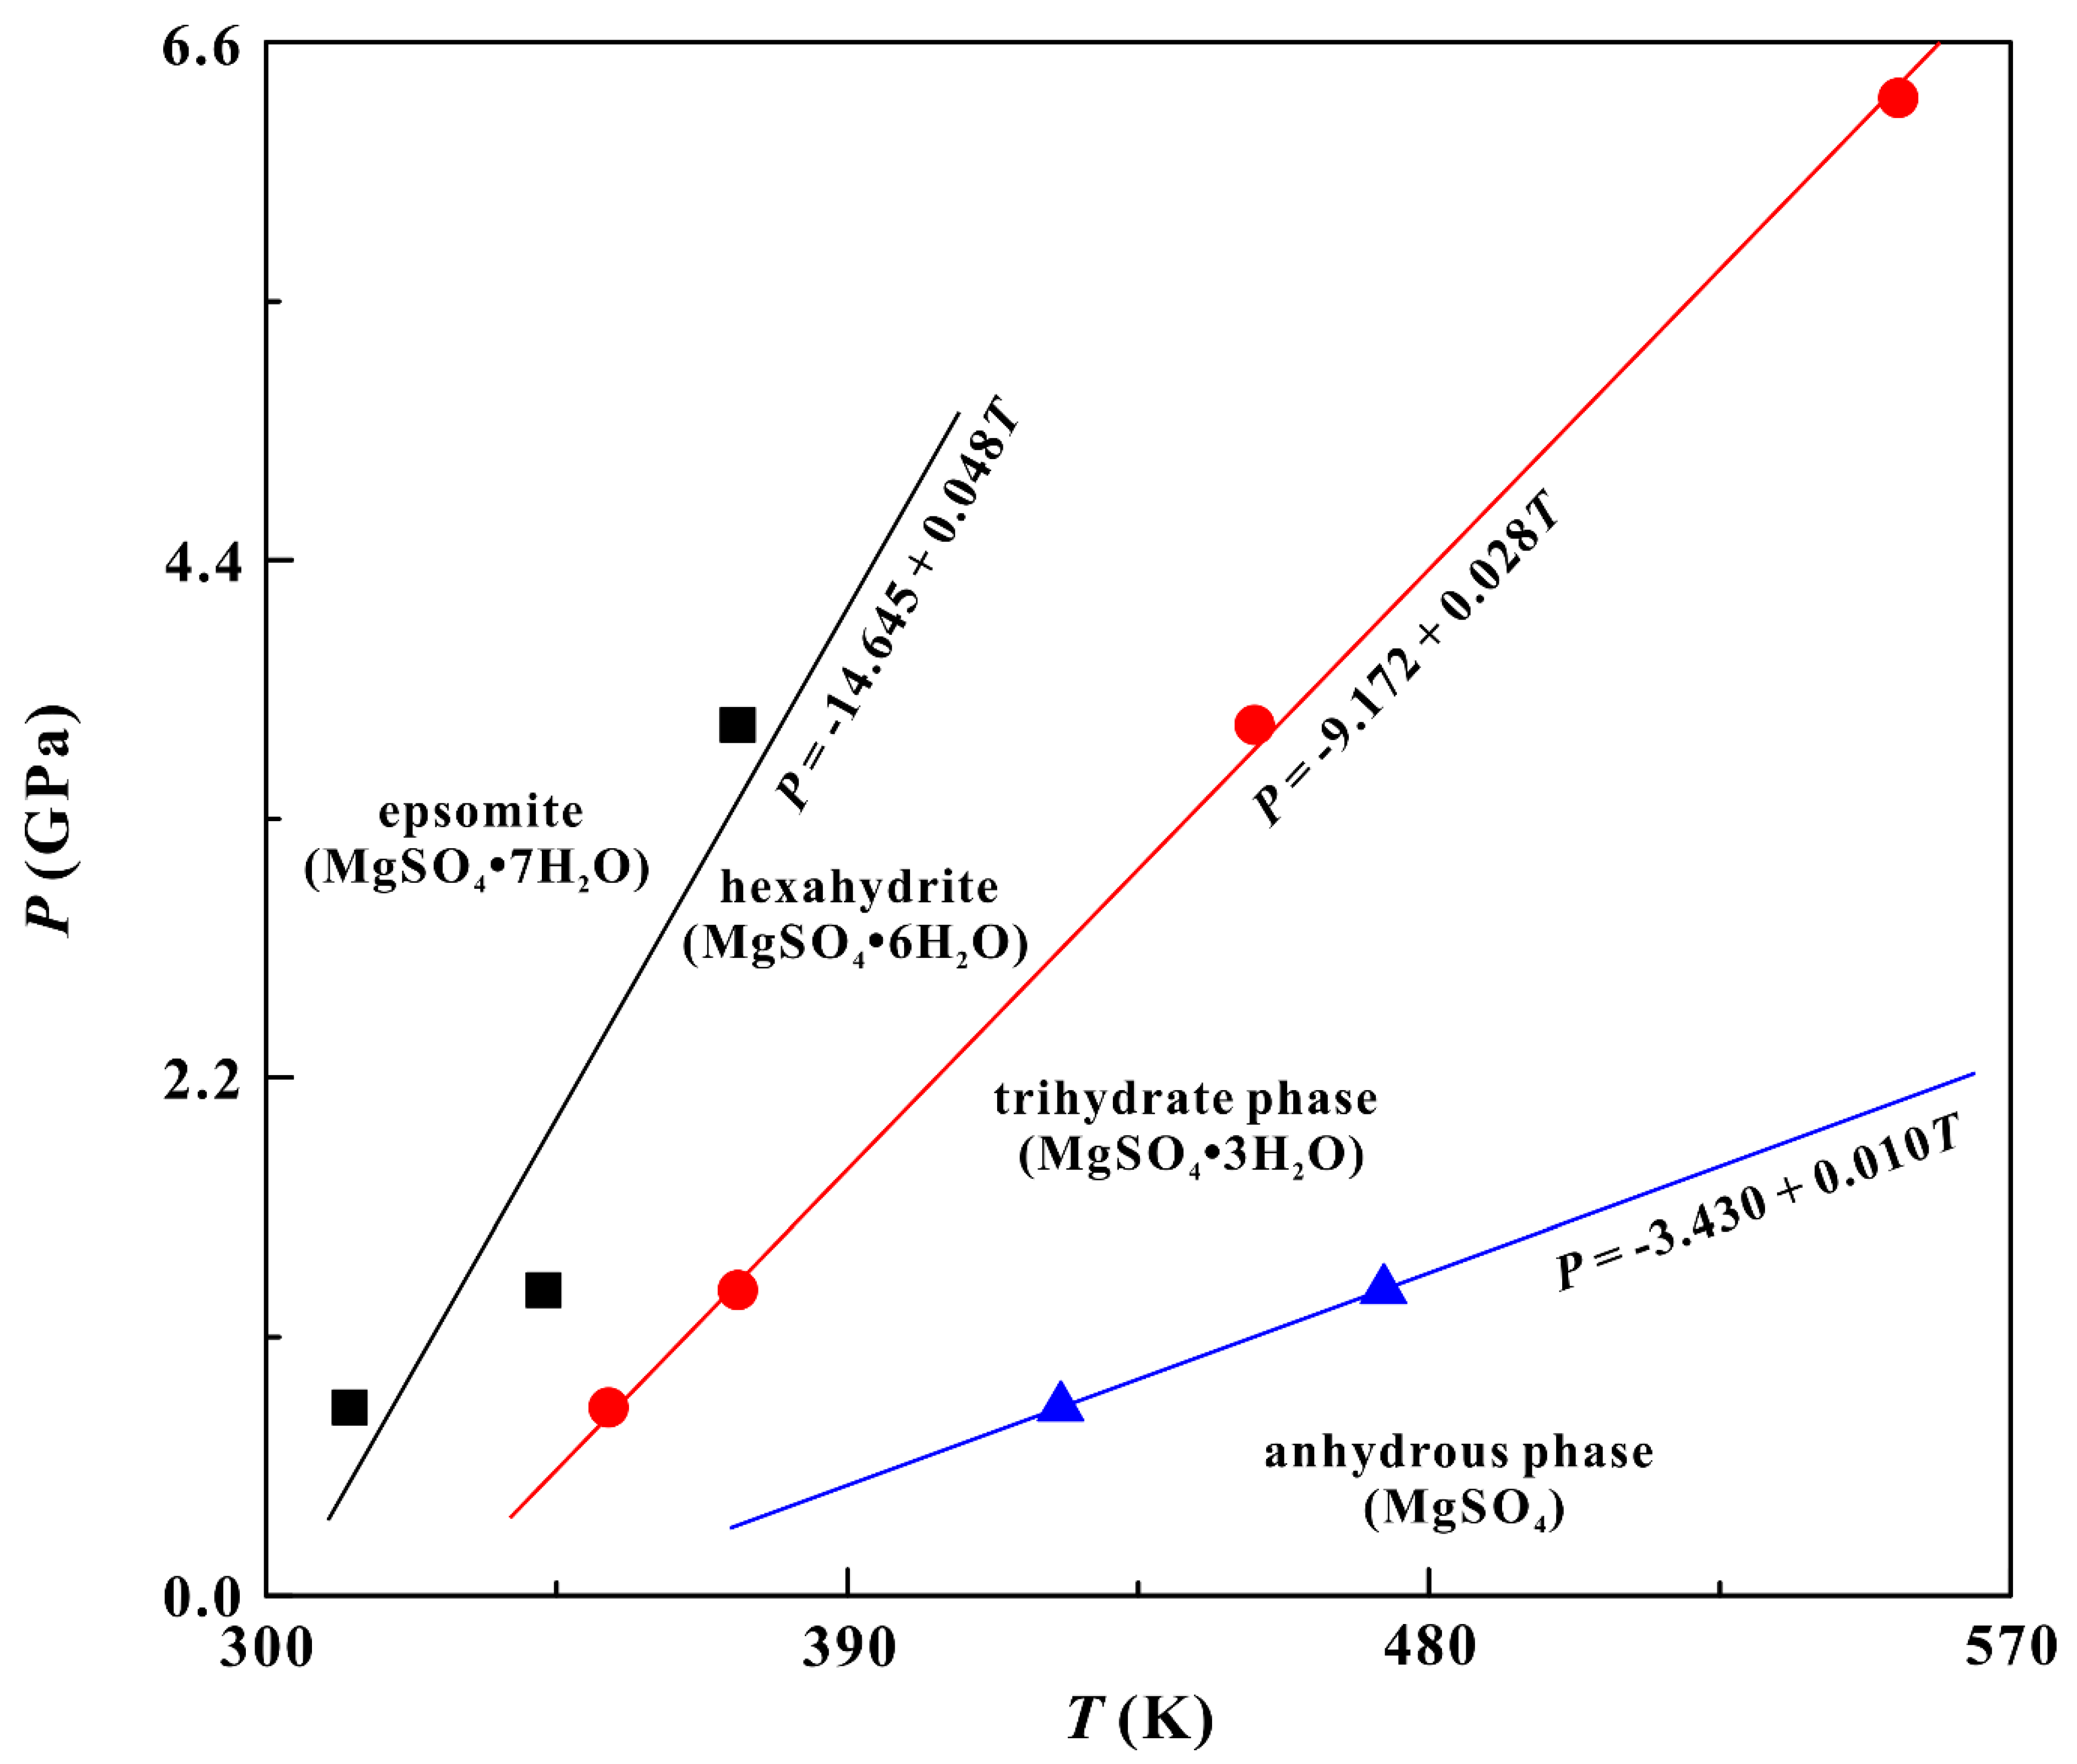
On the basis of the data of dehydration temperatures obtained from the high-temperature and high-pressure Raman scattering experiments, a P-T phase diagram for epsomite was well established at a wide temperature range of 293–623 K and at pressures of 0.8–6.3 GPa. As shown in Figure 7, it is verified that the dehydration temperature of epsomite gradually increased with the rise in pressure. This positive relation between dehydration temperature and pressure was coincident with the result of other similar hydrated sulfates (gypsum, chalcanthite and blödite) [11,12,13]. In addition, we also found that the epsomite undergoes three-step dehydration reactions in the heating process: from epsomite (MgSO4·7H2O) to hexahydrite (MgSO4·6H2O) to magnesium sulfate trihydrate (MgSO4·3H2O) to anhydrous magnesium sulfate (MgSO4). The anhydrous MgSO4 has been studied and it is stable up to 17.5 GPa [26]. The dehydration sequence of the epsomite revealed in this study is different from the result reported by Brotton et al. [27]. They observed the direct formation of magnesium sulfate trihydrate without the occurrence of hexahydrite in the heated epsomite at room pressure. This discrepancy was possibly caused by some crucial factors, such as the heating rate, relative humidity and pressure condition, all of which have been demonstrated to significantly influence the dehydration process of hydrous minerals [9,28,29,30]. Furthermore, three dehydration boundaries were determined by the linear fitting of these data. The epsomite-hexahydrite dehydration boundary was determined to be P (GPa) = –14.645 + 0.048 T (K), and the dehydration boundary for the transformation from hexahydrite to magnesium sulfate trihydrate corresponded to P (GPa) = –9.172 + 0.028 T (K). As for the last dehydration reaction, from magnesium sulfate trihydrate to anhydrous magnesium sulfate, the corresponding boundary can be described by a linear equation: P (GPa) = –3.430 + 0.010 T (K).
4. Conclusions
In summary, we performed in situ Raman spectroscopic and electrical conductivity measurements on epsomite to investigate its phase transition and dehydration process under high pressure. The results from room-temperature and high-pressure experiments demonstrated a structural phase transition for the epsomite, occurring at ~5.1 GPa, and the hydrogen bonding in the structure of the epsomite is strengthened after this transformation. The high-temperature and high-pressure Raman measurements were conducted at four pressure points (~0.8, ~1.3, ~3.7 and ~6.4 GPa) for the purpose of revealing the influence of pressure on the dehydration process of the epsomite. In the heating process of the epsomite at ~1.3 GPa, we successively observed the appearance of hexahydrite, magnesium sulfate trihydrate and anhydrous magnesium sulfate at ~343, ~373 and ~473 K. At ~6.4 GPa, the epsomite dehydrated to magnesium sulfate trihydrate at ~553 K. Therefore, it can be concluded that the epsomite undergoes a three-step dehydration reaction under a high pressure, and its dehydration temperature gradually increases with the pressure.
Author Contributions
Conceptualization, L.D. and L.Y.; methodology, L.D., Y.H. and H.L.; software, L.D.; validation, L.Y., M.H. and X.Z.; formal analysis, L.Y. and L.D.; investigation, L.D.; data curation, L.Y.; writing—original draft preparation, L.Y. and L.D.; writing—review and editing, L.D.; visualization, L.Y.; supervision, L.D., Y.H. and H.L.; project administration, L.D.; funding acquisition, L.D. Methodology, supervison, H.H. All authors have read and agreed to the published version of the manuscript.
Funding
This research was funded by the strategic priority Research Program (B) of the Chinese Academy of Sciences (18010401), Key Research Program of Frontier Sciences of CAS (QYZDB-SSW-DQC009), Hundred Talents Program of CAS, NSF of China (41774099 and 41772042), Youth Innovation Promotion Association of CAS (2019390), Special Fund of the West Light Foundation of CAS, and Postdoctoral Science Foundation of China (2018M643532).
Conflicts of Interest
The authors declare no conflict of interest.
References
- McCord, T.B.; Hansen, G.B.; Matson, D.L.; Johnson, T.V.; Crowley, J.K.; Fanale, F.P.; Carlson, R.W.; Smythe, W.D.; Martin, P.D.; Hibbitts, C.A.; et al. Hydrated salt minerals on Europa’s surface from the Galileo near-infrared mapping spectrometer (NIMS) investigation. J. Geophys. Res.: Planet 1999, 104, 11827–11851. [Google Scholar] [CrossRef]
- McCord, T.B.; Hansen, G.B.; Hibbitts, C.A. Hydrated salt minerals on Ganymede’s surface: Evidence of an ocean below. Nature 2001, 5521, 1523–1525. [Google Scholar] [CrossRef] [PubMed]
- Fredriksson, K.; Kerridge, J.F. Carbonates and sulfates in CI chondrites: Formation by aqueous activity on the parent body. Meteoritics 1988, 23, 35–44. [Google Scholar] [CrossRef] [PubMed]
- Fortes, A.D.; Choukroun, M. Phase behaviour of ices and hydrates. Space Sci. Rew. 2010, 153, 185–218. [Google Scholar] [CrossRef]
- Livshits, L.D.; Genshaft, Y.S.; Ryabin, Y.N. Equilibrium diagram of the crystal hydrates of MgSO4 at high pressure. Russ. J. Inorg. Chem. 1963, 8, 676–678. [Google Scholar]
- Gromnitskaya, E.L.; Yagafarov, O.F.; Lyapin, A.G.; Brazhkin, V.V.; Wood, I.G.; Tucker, M.G.; Fortes, A.D. The high-pressure phase diagram of synthetic epsomite (MgSO4·7H2O and MgSO4·7D2O) from ultrasonic and neutron powder diffraction measurements. Phys. Chem. Miner. 2013, 40, 271–285. [Google Scholar] [CrossRef]
- Grasset, O.; Sotin, C.; Mousis, O.; Mevel, L. High pressure experiments in the system MgSO4–H2O: Implications for Europa. Lunar Planet Sci. Conf. 2000, 31, 1386. [Google Scholar]
- Nakamura, R.; Ohtani, E. The high-pressure phase relation of the MgSO4–H2O system and its implication for the internal structure of Ganymede. Icarus 2011, 211, 648–654. [Google Scholar] [CrossRef]
- Mirwald, P.W. Experimental study of the dehydration reactions gypsum-bassanite and bassanite-anhydrite at high pressure: Indication of anomalous behavior of H2O at high pressure in the temperature range of 50–300 °C. J. Chem. Phys. 2008, 128, 074502. [Google Scholar] [CrossRef]
- Comodi, P.; Kurnosov, A.; Nazzareni, S.; Dubrovinsky, L. The dehydration process of gypsum under high pressure. Phys. Chem. Miner. 2012, 39, 65–71. [Google Scholar] [CrossRef]
- Comodi, P.; Stagno, V.; Zucchini, A.; Fei, Y.; Prakapenka, V. The compression behavior of blödite at low and high temperature up to ∼10 GPa: Implications for the stability of hydrous sulfates on icy planetary bodies. Icarus 2017, 285, 137–144. [Google Scholar] [CrossRef] [Green Version]
- Pu, C.; Dai, L.; Li, H.; Hu, H.; Zhuang, Y.; Liu, K.; Yang, L.; Hong, M. High–pressure electrical conductivity and Raman spectroscopy of chalcanthite. Spectrosc. Lett. 2018, 51, 531–539. [Google Scholar] [CrossRef]
- Yang, L.; Dai, L.; Li, H.; Hu, H.; Zhuang, Y.; Liu, K.; Pu, C.; Hong, M. Pressure-induced structural phase transition and dehydration for gypsum investigated by Raman spectroscopy and electrical conductivity. Chem. Phys. Lett. 2018, 706, 151–157. [Google Scholar] [CrossRef]
- Mao, H.K.; Xu, J.; Bell, P.M. Calibration of the ruby pressure gauge to 800 kbar under quasi-hydrostatic conditions. J. Geophys. Res. 1986, 91, 4673. [Google Scholar] [CrossRef]
- Rekhi, S.; Dubrovinsky, L.S.; Saxena, S.K. Temperature-induced ruby fluorescence shifts up to a pressure of 15 GPa in an externally heated diamond anvil cell. High Temp.-High Press. 1999, 31, 299–305. [Google Scholar] [CrossRef]
- Dai, L.; Zhuang, Y.; Li, H.; Wu, L.; Hu, H.; Liu, K.; Yang, L.; Pu, C. Pressure-induced irreversible amorphization and metallization with a structural phase transition in arsenic telluride. J. Matter. Chem. C 2017, 5, 12157–12162. [Google Scholar] [CrossRef]
- Dai, L.; Liu, K.; Li, H.; Wu, L.; Hu, H.; Zhuang, Y.; Yang, L.; Pu, C.; Liu, P. Pressure-induced irreversible metallization accompanying the phase transitions in Sb2S3. Phys. Rev. B 2018, 97, 024103. [Google Scholar] [CrossRef]
- Dai, L.; Pu, C.; Li, H.; Hu, H.; Liu, K.; Yang, L.; Hong, M. Characterization of metallization and amorphization for GaP under different hydrostatic environments in diamond anvil cell up to 40.0 GPa. Rev. Sci. Instrum. 2019, 90, 066103. [Google Scholar] [CrossRef]
- Wang, A.; Freeman, J.J.; Jolliff, B.L.; Chou, I.M. Sulfates on Mars: A systematic Raman spectroscopic study of hydration states of magnesium sulfates. Geochim. Cosmochim. Ac. 2006, 70, 6118–6135. [Google Scholar] [CrossRef]
- Gonzalez-Platas, J.; Rodriguez-Hernandez, P.; Muñoz, A.; Rodríguez-Mendoza, U.R.; Nénert, G.; Errandonea, D. A high-pressure investigation of the synthetic analogue of chalcomenite, CuSeO3·2H2O. Crystals 2019, 9, 643. [Google Scholar] [CrossRef] [Green Version]
- Huang, E.; Xu, J.A.; Lin, J.F.; Hu, J.Z. Pressure-induced phase transitions in gypsum. High Pressure Res. 2000, 17, 57–75. [Google Scholar] [CrossRef]
- Knittle, E.; Phillips, W.; Williams, Q. An infrared and Raman spectroscopic study of gypsum at high pressures. Phys. Chem. Miner. 2001, 28, 630–640. [Google Scholar] [CrossRef]
- Brand, H.E.A.; Fortes, A.D.; Wood, I.G.; Vočadlo, L. Equation of state and pressure-induced structural changes in mirabilite (Na2SO4·10H2O) determined from ab initio density functional theory calculations. Phys. Chem. Miner. 2009, 37, 265–282. [Google Scholar] [CrossRef]
- Errandonea, D.; Segura, A.; Martínez-García, D.; Muñoz-San Jose, V. Hall-effect and resistivity measurements in CdTe and ZnTe at high pressure: Electronic structure of impurities in the zinc-blende phase and the semimetallic or metallic character of the high-pressure phases. Phys. Rev. B 2009, 79, 125203. [Google Scholar] [CrossRef] [Green Version]
- Errandonea, D.; Muñoz, A.; Gonzalez-Platas, J. Comment on “High-pressure x-ray diffraction study of YBO3/Eu3+, GdBO3, and EuBO3: Pressure-induced amorphization in GdBO3” [J. Appl. Phys. 115, 043507 (2014)]. J. Appl. Phys. 2014, 115, 216101. [Google Scholar] [CrossRef]
- Benmakhlouf, A.; Errandonea, D.; Bouchenafa, M.; Maabed, S.; Bouhemadou, A.; Bentabet, A. New pressure-induced polymorphic transitions of anhydrous magnesium sulfate. Dalton Trans. 2017, 46, 5058–5068. [Google Scholar] [CrossRef] [Green Version]
- Brotton, S.J.; Kaiser, R.I. In situ Raman spectroscopic study of gypsum (CaSO4·2H2O) and epsomite (MgSO4·7H2O) dehydration utilizing an ultrasonic levitator. J. Phys. Chem. Lett. 2013, 4, 669–673. [Google Scholar] [CrossRef]
- Cardell, C.; Sánchez-Navas, A.; Olmo-Reyes, F.J.; Martín-Ramos, J.D. Powder X-ray thermodiffraction study of mirabilite and epsomite dehydration. Effects of direct IR-irradiation on samples. Anan. Chem. 2007, 79, 4455–4462. [Google Scholar] [CrossRef]
- Donkers, P.A.J.; Linnow, K.; Pel, L.; Steiger, M.; Adan, O.C.G. NaSO4·10H2O dehydration in view of thermal storage. Chem. Eng. Sci. 2015, 134, 360–366. [Google Scholar] [CrossRef]
- Nagase, K.; Yokobayashi, H.; Kikuchi, M.; Sone, K. Effects of heating rate (1–300°h-1) on the non-isothermal thermogravimetry of CuSO4·5H2O. Thermochim. Acta 1980, 35, 99–104. [Google Scholar] [CrossRef]
Figure 1.
(a) The Raman spectra of the epsomite under a high pressure, up to ~12.8 GPa, and at room temperature, collected in the frequency range of 900–1200 cm−1; (b) the pressure dependence of the Raman shift for the ν1 (SO4) mode; (c) the full width at half maximum (FWHM) of the ν1 (SO4) peak as a function of the pressure.

Figure 2.
The high-pressure Raman spectra of the epsomite at room temperature in the range of 3000–3800 cm−1.
Figure 2.
The high-pressure Raman spectra of the epsomite at room temperature in the range of 3000–3800 cm−1.

Figure 3.
(a) The typical impedance spectra for the epsomite, measured at 0.5–12.4 GPa and room temperature; (b) the calculated electrical conductivity of the epsomite with increasing pressure.
Figure 3.
(a) The typical impedance spectra for the epsomite, measured at 0.5–12.4 GPa and room temperature; (b) the calculated electrical conductivity of the epsomite with increasing pressure.

Figure 4.
(a) The temperature-dependent Raman spectra of the epsomite at ~1.3 GPa for the sulfate internal vibration; (b) the high-temperature Raman spectra of the epsomite at ~1.3 GPa for the hydroxyl-stretching vibration.
Figure 4.
(a) The temperature-dependent Raman spectra of the epsomite at ~1.3 GPa for the sulfate internal vibration; (b) the high-temperature Raman spectra of the epsomite at ~1.3 GPa for the hydroxyl-stretching vibration.

Figure 5.
(a) The Raman spectra of the epsomite at 293–623 K and ~6.4 GPa in the sulfate vibrational range; (b) the collected high-temperature Raman spectra of the epsomite at ~6.4 GPa in the hydroxyl-stretching vibrational range.
Figure 5.
(a) The Raman spectra of the epsomite at 293–623 K and ~6.4 GPa in the sulfate vibrational range; (b) the collected high-temperature Raman spectra of the epsomite at ~6.4 GPa in the hydroxyl-stretching vibrational range.

Figure 6.
(a) The high-temperature Raman spectra of the epsomite at a pressure of ~0.8 GPa; (b) the Raman spectra of the epsomite with an increasing temperature at ~3.7 GPa.
Figure 6.
(a) The high-temperature Raman spectra of the epsomite at a pressure of ~0.8 GPa; (b) the Raman spectra of the epsomite with an increasing temperature at ~3.7 GPa.

Figure 7.
The established P-T phase diagram for the epsomite in temperature ranges of 293-623 K and pressure ranges of 0.8-6.4 GPa.
Figure 7.
The established P-T phase diagram for the epsomite in temperature ranges of 293-623 K and pressure ranges of 0.8-6.4 GPa.

© 2020 by the authors. Licensee MDPI, Basel, Switzerland. This article is an open access article distributed under the terms and conditions of the Creative Commons Attribution (CC BY) license (http://creativecommons.org/licenses/by/4.0/).
Share and Cite
MDPI and ACS Style
Yang, L.; Dai, L.; Li, H.; Hu, H.; Hong, M.; Zhang, X. The Phase Transition and Dehydration in Epsomite under High Temperature and High Pressure. Crystals 2020, 10, 75. https://doi.org/10.3390/cryst10020075
AMA Style
Yang L, Dai L, Li H, Hu H, Hong M, Zhang X. The Phase Transition and Dehydration in Epsomite under High Temperature and High Pressure. Crystals. 2020; 10(2):75. https://doi.org/10.3390/cryst10020075
Chicago/Turabian StyleYang, Linfei, Lidong Dai, Heping Li, Haiying Hu, Meiling Hong, and Xinyu Zhang. 2020. "The Phase Transition and Dehydration in Epsomite under High Temperature and High Pressure" Crystals 10, no. 2: 75. https://doi.org/10.3390/cryst10020075
Note that from the first issue of 2016, this journal uses article numbers instead of page numbers. See further details here.