Abstract
In this paper, we present a summary on how to obtain protein crystals from which better diffraction images can be produced. In particular, we describe, in detail, quality evaluation of the protein sample, the crystallization conditions and methods, flash-cooling protection of the crystal, and crystallization under a microgravity environment. Our approach to protein crystallization relies on a theoretical understanding of the mechanisms of crystal growth. They are useful not only for space experiments, but also for crystallization in the laboratory.
1. Introduction
We have been providing protein crystallographic services, especially those for the Japan Aerospace Exploration Agency’s High-Quality Protein Crystal Growth Experiment (JAXA PCG), for many years. Crystallization with a sample from a user often encounters the following issues and challenges: (1) Crystals cannot be obtained with a good reproducibility; (2) crystals showing sufficient diffraction are not reproducible; (3) crystals are obtained, but do not give any sufficient diffractions; (4) users request larger crystals; and (5) users expect a better crystal quality from space experiments. We have overcome many of these issues and accumulated experience based on over 500 samples from various users. Many methods have been reported for obtaining protein crystals from which good diffraction images can be produced. However, the process, from sample preparation to obtaining diffraction images, is a comprehensive one. This paper explains our experience, which is useful not only for space experiments, but also for crystallization in the laboratory.
Our approach to protein crystallization relies on a theoretical understanding of the mechanisms of crystal growth described previously [1,2,3,4].
It is believed that protein crystals are obtained by reducing the solubility of an aqueous solution of proteins by adding a crystallization agent, which is called a “precipitant”. However, the protein molecules in crystals are arranged in a specific order and are in contact with a solvent through solvent channels, which is not the case in precipitates. In addition, it seems that the concentration of the precipitant inside the crystal is significantly lower than outside, which balances the chemical potential [1].
Between the protein molecules aligned in the crystal, various forces exist, such as hydrogen bonds, electrostatic forces, and van der Waals interactions. Some of these forces are attractive, while others are repulsive [5]. In addition, a macroscopic force called interfacial tension also functions at the crystal interface (Figure 1).
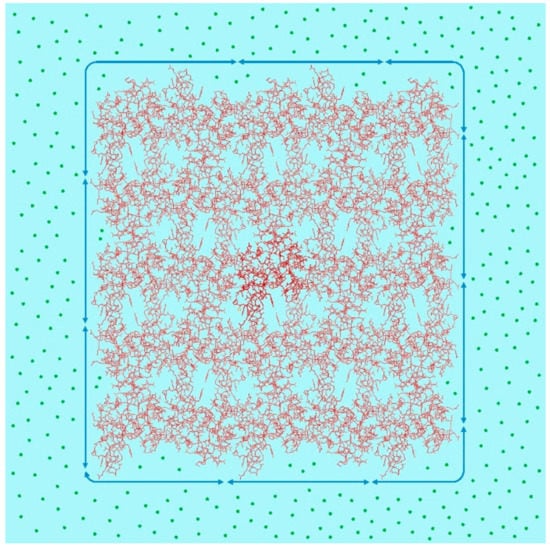
Figure 1.
Protein molecular alignment in a crystal (Protein Data Bank (PDB) ID: 1lz1 (human lysozyme)). Arrows around the crystal: interfacial tension; green circle: precipitant molecule. In the crystal, there is close contact between adjacent molecules. Molecules that are homogeneous with one another can be arranged regularly. The incorporation of non-uniform molecules affects the alignment of molecules around them, making it difficult to obtain a good X-ray diffraction image. Outside the crystal, there are a lot of precipitant molecules which impose interfacial tension on the crystal.
In a high-quality crystal, it is important to have well-aligned molecules, but for this to be the case, the growth units need to be identical and the forces between the units need to be directional. Defects in the crystal will cause stress and strain, resulting in disordered packing. Because the plasticity of crystals is not large, once a defect occurs, a mosaic occurs in the crystals [1]. One of the causes of misorientation is homologous impurity, which behaves like a target protein to attach to the surface of the crystal [6,7]. Impurities also greatly reduce the growth rate of crystals [8]. For this reason, it is important that the protein sample used for crystallization is uniform. Therefore, sample preparation is essential to obtaining high-quality crystals from the outset.
The second important factor is related to the crystallization conditions. It is important to control the forces between the protein molecules to achieve better alignment by controlling the optimal balance of intermolecular attraction and repulsion, as well as macro interfacial tension. To optimize the crystallization condition, not only crystallization reagents, but also crystallization methods, should be considered. Crystallization in a microgravity environment is also effective.
The third factor is related to the harvesting and cryo-protecting of crystals to avoid unexpected deterioration of the crystal. For successful space experiments, these three factors are indispensable.
2. Sample Quality
A uniform protein sample is usually the primary requirement for obtaining high-quality crystals that are acceptable for X-ray or neutron diffraction experiments with certain reproducibility. For this purpose, it is preferable to prepare a sample that is sufficiently stable for a long time. It is also important that samples of an equivalent quality are repeatedly obtained. The sample preparation and crystallization artifacts [9] are not covered in this paper. In this paper, the evaluation method of the prepared protein sample and the countermeasures based on the evaluation results are explained.
It is important to perform accurate evaluations of protein samples with a relatively easy method. We applied sodium dodecyl sulfate polyacrylamide gel electrophoresis (SDS-PAGE), Native-PAGE, two-dimensional electrophoresis, high-resolution ionic exchange, high-resolution gel chromatography, and Dynamic Light Scattering (DLS), and comprehensively evaluated the results. From our experience, a sample with a high uniformity and consistency with the calculated value of the electric charge density [10] empirically has a high possibility of growing crystals of a high quality. If the molecules in the crystals are different in terms of their molecular weights, or if the electric charge is non-uniform, even though the molecules are equal in their molecular weights, a disturbance of the arrangement of molecules in the crystal will be directly produced because molecules close to each other interact due to an electrostatic dipole moment in the crystals. As a result, this phenomenon has serious effects on the crystal formation process and its quality.
2.1. Evaluation Methods
Evaluation methods for the protein samples are summarized in the following.
- Physicochemical calculation
The molecular weight and electrical charge density at a certain pH can be estimated from the amino acid composition [10,11] (C-Profile, Confocal Science Inc.) (Figure 2). This will be referred to in the following analysis.
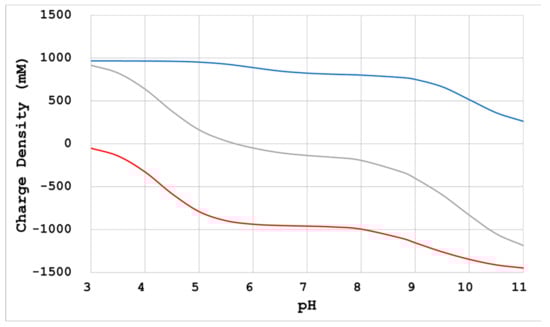
Figure 2.
Charge density calculated from the amino acid composition (human serum albumin). Red line: positive charge density; gray line: negative charge density; blue line: total charge density. Based on the amino acid composition of the protein sample, not only the molecular weight, but also the electric charge number at a specific pH, can be calculated [11]. Additionally, the electric charge density can be calculated by dividing this electric charge number by the estimated lattice volume [10].
- SDS-PAGE
The proteins can be analyzed by their molecular weight (Figure 3a,b) [12,13]. SDS-PAGE is the method most commonly employed for checking the purity of protein samples. It is important to check whether the band clearly migrates to a position corresponding to the molecular weight calculated from the target protein sequence. When some minor bands emerge or when the main band seems doubled, a heterogeneous component of the molecular weight exists in the prepared sample. In this case, some of the expressed protein molecules have likely been modified during the expression/purification process.
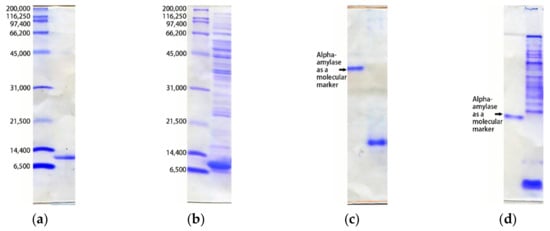
Figure 3.
SDS-PAGE ((a) and (b)) and Native-PAGE ((c) and (d)) analysis of typical protein samples. In all gels, the left lanes are for molecular markers. (a) The homogenous sample of an artificial peptide with 130 amino acid residues (pI=5.1)) migrates as a single band in SDS-PAGE; (b) the sample containing contaminated protein gives many bands other than the target protein in SDS-PAGE; (c) the electrically homogeneous sample migrates with speed proportional to its charge as a single band in Native-PAGE (left lane: a highly-purified alpha-amylase as a marker protein); (d) the sample with electrically heterogeneous contaminants migrates as a smear and ladder in Native-PAGE (left lane: highly-purified alpha-amylase as a marker protein). In SDS-PAGE, the band in the gel migrates to the position corresponding to the molecular weight of the protein. SDS binds to amino acids of the protein molecule, denatures and coats the protein, and produces negative charges. Then, the protein molecules with SDS migrate in the gel by imposing an electric field. Beta-mercaptoethanol is also applied to reduce disulfide bonds. In Native-PAGE, the band in the gel migrates to the position corresponding to the polarity and amount of electric charge, which is also affected by the molecular size and shape.
- Native-PAGE
Proteins can be analyzed by their electric charge and molecular weight (Figure 3c,d) [12]. Native-PAGE is a PAGE without SDS. It is often observed that even a sample showing a very clear single band in SDS-PAGE gives multiple bands in Native-PAGE. Furthermore, it is often observed that the band migrates as a smear or ladder shape or does not enter the gel. Sometimes, electric charges estimated from the above calculations do not match the mobility of the band. This is perhaps caused by some unexpected aggregation of protein molecules in the solution. Empirically, this phenomenon affects the possibility of crystal formation and crystal quality.
- Two-dimensional electrophoresis
Proteins are analyzed by isoelectric focusing (IEF) and molecular weight two-dimensionally (Figure 4) [14]. In this method, the homogeneity of the protein molecule can be shown more clearly. Sometimes, samples with the same molecular weight have slightly different spots (as much as half the pH unit of IEF). These samples often have problems in crystallization.
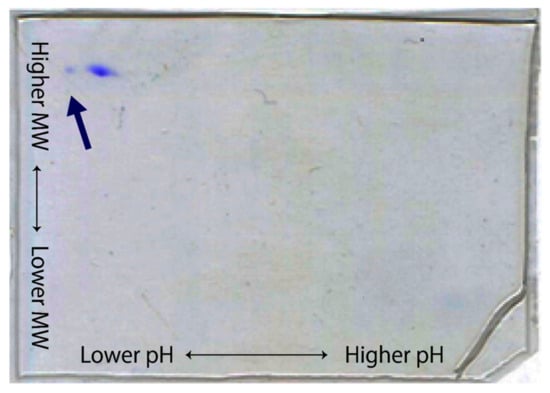
Figure 4.
A two-dimensional electrophoresis analysis of an alpha-amylase. The protein sample is first separated by isoelectric focusing (IEF) and then separated by SDS-PAGE on a gel plate. Horizontal and vertical axes correspond to the pH and molecular weight, respectively. Auto 2D Plus, SHARP LIFE SCIENCE CO is used. With this sample, a crystal with a cluster-like morphology is frequently obtained with about a 1.4 Å resolution. After applying ionic exchange chromatography, a minor component (indicated by the blue arrow) was removed, and a single crystal with a 1.2 Å resolution was obtained.
- High-resolution ion exchange chromatography
Proteins are analyzed by the affinity to ion exchange resin column [15,16]. High-resolution ion exchange chromatography separates proteins with differences in their surface charges. Samples that can give a sharp and clear peak and elute at an expected concentration of sodium chloride (Figure 5a) often give high-quality crystals. On the other hand, proteins that elute as multiple peaks (Figure 5b) contain unexpected problems, and crystallization tends to be difficult. When the heterogeneity of a sample is shown in Native-PAGE and two-dimensional electrophoresis, these samples rarely give one sharp peak on a chromatogram. However, a sharp peak is sometimes observed in chromatography, even when non-uniformity of the electric charge is observed in the results of the Native-PAGE and two-dimensional electrophoresis. It is conceivable that the forming aggregate might not be dissociated during chromatographic separation. This will result in a significant difference between the sodium chloride concentration (where the peak is eluted) and the calculated charge density of the target protein.
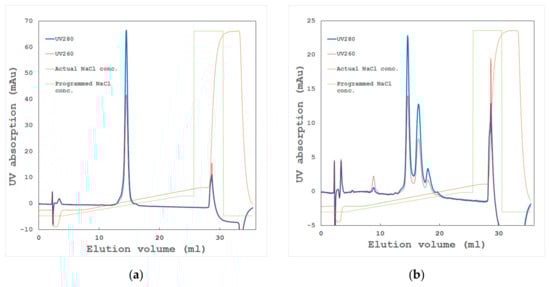
Figure 5.
Typical chromatograms of ion-exchange chromatography. Blue and red lines show UV absorption at 280 and 260 nm, respectively. Brown and green lines show the actual and programmed sodium chloride concentration, respectively. The gradient of sodium chloride is commonly used for elution from the column [15]. There are various kinds of ion exchange resins with different chromatographic particles (e.g., a quaternary ammonium group and a carboxymethyl group) [16]. (a) A homogeneous sample of a haematopoietic prostaglandin-D synthase that gives a high-resolution single crystal beyond 1.1 Å; (b) a heterogeneous sample of the same protein that gives mostly a clustered crystal with a 1.5 Å resolution.
- High-resolution gel filtration chromatography
Proteins are analyzed by their molecular-weight differences (Figure 6). Protein molecules often form a dimer, tetramer, or n-mer in a solution and can be detected by high-resolution gel filtration chromatography. Even with a relatively low-molecular-weight protein, some molecules may associate nonspecifically in a solution to form a high-molecular-weight aggregate. The presence of such an aggregate often hinders crystallization. Gel filtration chromatography can effectively remove such aggregates, and high-quality crystals can be obtained.
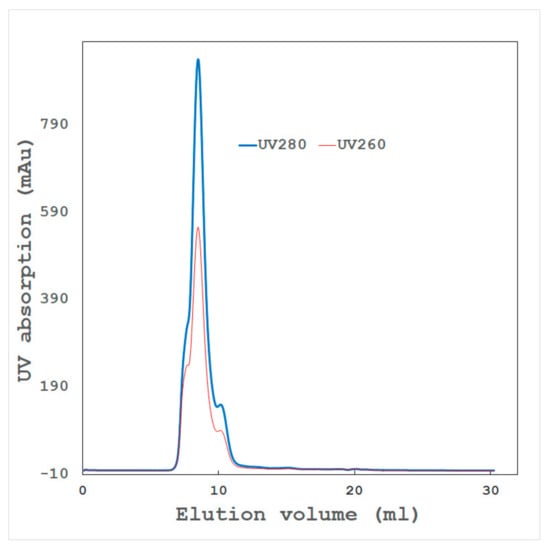
Figure 6.
Typical chromatogram of gel filtration chromatography. A supramolecule protein with a molecular weight of 750,000 (pI = 5.8) was applied. Blue and red lines show the UV absorption of 280 and 260 nm, respectively. Proteins are separated with differences in their molecular weights. Various size beads have been developed for each molecular weight. The leading and trailing shoulders of the main peak suggest the existence of different molecular weight components. After removing these components, the crystal quality was improved.
- Dynamic light scattering
A protein sample can be analyzed by its molecular size distribution with DLS measurement (Figure 7) [17]. The particle size of protein can be estimated by this method. In many cases, samples with a narrower distribution width of their molecular radii will give high-quality crystals. The size of a protein molecule of about 50 kDa (450 aa) is 4 to 5 nm. If a particle larger than 50 nm emerges from DLS, the protein molecule may form irregular aggregates. From our experience, it is difficult to obtain crystals from such a sample. It should be noted that the particle size becomes larger to give a nucleation precursor when a precipitant which is preferable for crystallization is applied to the sample [18].
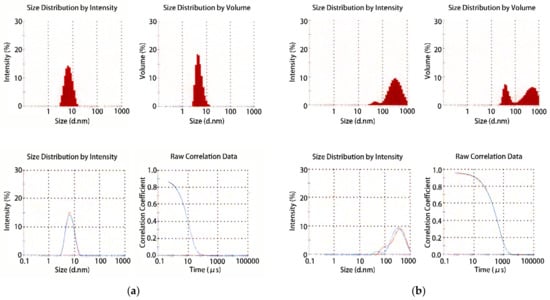
Figure 7.
Typical results of dynamic light scattering (DLS) calculated by an autocorrelation function. (a) An appropriate sample of a soluble protein with a molecular weight of 25,000 (pI = 5.8) shows a narrow and mono-modal distribution; (b) a heterogeneous sample of the same protein shows a broad and poly-modal distribution. Using DLS, it is possible to determine what the molecular size distribution is like in the solution. The points to be confirmed from the obtained results are whether the estimated molecular weight is equal to the integral multiple of its own molecular weight with a narrow distribution of size and whether there are no large-sized particles (mono-modal distribution) [17].
2.2. Measures to Improve Protein Samples
2.2.1. Uniformity Improvement
When multiple bands or spots are found on Native-PAGE, two-dimensional electrophoresis, and high-resolution chromatography, it is often possible to separate them with high-resolution chromatography. When peak shoulders or asymmetrical peaks become visible, such as leading or tailing peaks, those peaks may be separated by reconsidering the elution condition (chromatography particles, resins, buffers, and gradient programs) to provide high-resolution separation.
In this case, the components to be separated are as follows:
- Other proteins, lipids, etc., which have not been removed by other purification steps;
- Proteins whose N or C terminal ends have not been processed correctly;
- Proteins including irregularly modified residues.
Sometimes, when these contaminants are removed, the total amount of target protein is reduced, so it is necessary to carefully design an expression host and expression plasmid to avoid unexpected processing or modification.
2.2.2. Aggregate Removal
It is difficult to overcome irregular aggregates in the sample, and it is necessary to determine what caused such irregular aggregates through the purification process. From our knowledge, the probable causes are as follows:
- Denatured proteins caused by the concentration process in crude state or ammonium sulfate precipitation. Avoiding these processes might improve the sample, and
- Aggregated proteins associated with contaminants or isozymes with different isoelectric points (pIs) through hydrophobic or hydrophilic interactions. Dialysis, gel filtration, or high-resolution chromatography sometimes remove such aggregates, which might dramatically improve the sample quality.
2.2.3. Prevent Deterioration over Time
It is often observed that samples for crystallization undergo degradation. Quality changes, associated with time (sample degradation and an increase of aggregates), can be evaluated by the methods mentioned above. From our experience, effective countermeasures are as follows:
- For unstable proteins, the construction of mutants is advised to improve their stability [19];
- In the case of protease degradation, adding protease inhibitors, followed by removing proteases in the subsequent chromatography step, is usually effective;
- In the case of damage caused by oxidation, purifying, storing, and crystallizing the samples under a deoxygenated state is advised.
3. Crystallization
3.1. Crystallization Reagent
It is well-known that proteins can be crystallized by mixing protein samples and crystallization reagents. Generally, the protein solubility is decreased by this operation [1,2,4]. A component in the crystallization reagent that dramatically reduces the solubility of the protein is called a precipitant. However, a “precipitant” is not expected to produce a true protein precipitate, but to separate protein molecules in a specifically ordered phase inside a crystal, the outside of which is in a freely dispersed phase. Typically used precipitants are as follows [20]:
- Salts—a combination of mono- or multi-valent anions and cations, for example, ammonium sulfate, sodium malonate, etc. The tendency for lowering solubility is listed in the Hofmeister Series. In general, the protein solubility increases with the addition of salt, until a certain point (salting-in), after which it decreases (salting-out). Anions and cations have various tendencies for salting-in and -out effects [21]. Therefore, determining a proper salt and its concentration for crystallization is accompanied by some difficulties;
- Polymers—high-molecular-weight polymers, for example, polyethylene glycol (PEG). The mechanism for reducing solubility is explained as an excluding-volume effect [1]. In general, the preferable molecular weight of PEG is related to the target protein [22], although a molecular weight of 400 to 20,000 is frequently used. Lower-molecular-weight PEG, such as PEG 400, has the ability to denature proteins, which is similar to the effects of an alcohol. However, higher-molecular-weight PEG does not have significant side-effects other than reducing solubility. Therefore, high-molecular-weight PEG is easier for controlling the crystallization process and is frequently used in crystallization;
- Organic solvents and alcohols—for example, 2-methyl-2,4-pentanediol (MPD), isopropanol, etc. This mechanism is explained as reducing the dielectric constant of the solution [1]. Some hydrophobic proteins sometimes prefer organic solvents.
In general, these precipitants are used in a significantly higher concentration, such as several tens of weight per volume percentage.
In addition to these main precipitants, additives are frequently used. These additives are summarized in Table 1. In the case of a crystallization solution consisting of a large number of components, it is quite difficult to accurately estimate each component’s effects on crystallization, even though there may be synergetic effects [20]. However, by understanding the protein concentration and phase diagrams of these components as coordinate axes, it is possible to grasp their effects on crystallization, which is useful for a more rational optimization of crystallization conditions. In the batch method, the fixed crystallization condition is one point on the phase diagram and is not changed, which is suitable for this investigation. In other methods, the condition varies with time in the phase diagram, which induces complicated phenomena. Therefore, it is necessary to understand the differences between each method.

Table 1.
Typically used additives in crystallization solutions.
A few heuristics are as follows:
- In the case of PEG, as the concentration increases, the number of grown crystals increases until a certain point, after which it decreases as the concentration of PEG further increases. It is thought that the nucleus formation probability decreases as the viscosity increases [25,26,27] (see 3.3.2). Furthermore, in a state where the nucleation formation probability is lowered, the degree of supersaturation is high, so secondary nucleation on the crystal surface is likely to occur and cluster crystals are likely to be formed;
- When there is no reagent that enhances intermolecular interactions, a reduction of electrostatic repulsion is necessary for crystallization. Neutralization by Na+ and Cl− as counterions of divergent groups (-COO−, -NH3+) of proteins is a method that can be used for such a purpose. In this case, adding sodium chloride at a concentration in relation to the electric charge density is advised [10,21];
- Ions such as Na+ and Cl- not only interact with dissociation groups on the protein surface, but also interact with other acids and bases and affect their effects. Therefore, when these ions coexist with a reagent that enhances intermolecular interactions, conversely, the effect is diminished.
3.2. Crystallization Method
Methods of protein crystallization have been developed to allow a large number of conditions to be studied with a small number of samples. Typical crystallization methods are as follows.
3.2.1. Batch Method
In the batch method, a protein sample and a crystallization reagent solution (reservoir solution) are mixed at an appropriate ratio and left to stand [28]. As long as crystallization does not start, the concentration of components in the solution does not change. Therefore, this is a good method for studying crystallization after fixing the concentration of each reagent in the solution precisely that allows for accurate control of the concentration (Figure 8a).
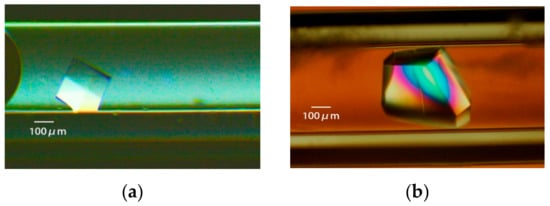
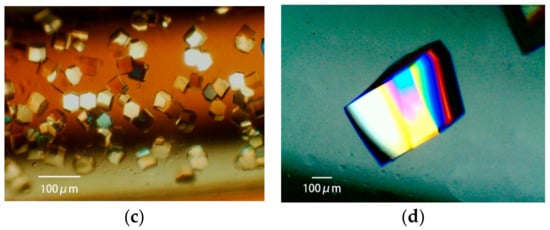
Figure 8.
The lysozyme is crystallized with four crystallization methods [31]. (a): Batch method. A solution of 18 mg/mL protein, 15% polyethylene glycol (PEG) 4000, 400 mM sodium chloride, and 50 mM sodium acetate buffer pH 4.5 is loaded in a 0.5 mm bore capillary. (b): Vapor diffusion method. 20 mg/mL protein in 50 mM sodium acetate buffer pH 4.5 is mixed with an equal volume of reservoir solution containing 10% PEG 4000, 600 mM sodium chloride, and 50 mM sodium acetate buffer pH 4.5. The mixture is loaded in a 0.5 mm bore capillary, and interacts with the reservoir solution, as shown in [31]. (c): Counter diffusion method. A solution of 25 mg/mL protein, 20% PEG 4000, and 50 mM sodium acetate buffer pH 4.5 is loaded in a 1 mm bore capillary. After the Gel-Tube is plugged [31], the capillary is placed in a reservoir solution containing 20% PEG 4000, 1000 mM sodium chloride, and 50 mM sodium acetate buffer pH 3.5. (d): Dialysis method. A solution of 25 mg/mL protein, 5% PEG 4000, and 50 mM sodium acetate buffer pH 4.5 is loaded in a 2 mm bore capillary with a dialysis membrane [31]. The capillary is placed in a reservoir solution containing 10% PEG 4000, 700 mM sodium chloride, and 50 mM sodium acetate buffer pH 4.5.
3.2.2. Vapor-Diffusion Method
In the vapor-diffusion (VD) method [29,30], a solution prepared by mixing a protein sample and a crystallization reagent solution (reservoir solution) in a typical ratio of 1:1 interacts with a reservoir solution via an air layer. There are two types of VD method: sitting-drop and hanging-drop [2]. Beside these two types, the VD method can also be provided by a narrow bore capillary [31] (Figure 8b).
By 1:1 mixing, the concentration of other components coexisting with the protein sample, the concentration of protein sample, and the crystallization reagent derived from the reservoir, and the coexisting components, initially become halved, but water migrates due to its interactions with the reservoir and concentrates [29,30]. As a result, all the concentrations increase toward the original level, and crystallization occurs when the concentrations allow crystals to be formed in the process. In many cases, it is more likely that crystals are grown if all the concentrations, including those of proteins, increase at the same time. However, it is not possible to control these concentrations individually. For this reason, there are cases where crystals cannot be obtained—for example, when other components coexisting in the protein sample are not favorable for crystallization.
3.2.3. Counter-Diffusion Method
The counter-diffusion (CD) method [32,33] generally fills a capillary with a protein sample and diffuses the crystallization reagent components from the capillary end. At the same time, the protein sample in the capillary and other coexisting components diffuse outside the capillary. Therefore, the coexisting components in the capillary are replaced by the components in the reservoir solution. As a result of this bidirectional diffusion, a combination of the wide-concentration regions of the crystallization reagent and the protein sample is scanned.
The Granada Crystallization Box (GCB) places an agarose gel layer between a protein solution and a crystallization reagent to achieve relatively mild solution diffusion [34]. We modified this method and used a gel-tube instead of the agarose gel layer to simplify this method [35].
The time course of bidirectional diffusion is not easy to measure. Therefore, we prepared a one-dimensional (1-D) diffusion simulation program so that various concentration components in the capillary could be estimated [35]. It is necessary to consider the correlation between this diffusion time course and the crystallization start time in the phase diagram when studying crystallization conditions.
The component with the lower molecular weight diffuses quickly, and the component with the higher molecular weight, such as the protein, diffuses slowly. Therefore, among the other components coexisting with the protein molecules inside the capillary, a component with a low molecular weight diffuses faster and leaks out of the capillary. On the other hand, the main crystallization reagent component of the reservoir and the coexisting components diffuse into the capillary.
In the CD method, the volume of the reservoir is usually much larger than the capillary content, so components other than the protein molecules in the capillary are replaced with reservoir components. Therefore, the concentrations of reagent components related to the crystallization conditions can be individually controlled, and more advanced crystallization conditions can be set. For example, in cases where the crystals are not obtained by the VD method, such as when some of the components coexisting in a protein sample are not favorable for crystallization, high-quality crystals have often been obtained by the CD method.
The diffusion of protein molecules is greatly reduced in PEG, whereas the diffusion of low-molecular-weight compounds does not slow-down in PEG [36]. Therefore, when a PEG-type crystallization reagent is applied to the CD method, the diffusion leakage of proteins from the capillary can be suppressed, which is preferable. There are not many studies that have used the CD method. However, having a good understanding of the mechanism as described above when setting crystallization conditions is a good way to obtain crystals with more optimal crystallization conditions than those produced by other methods (Figure 8c).
3.2.4. Dialysis Method
In the dialysis (DL) method, the precipitant molecules in the reservoir solution gradually permeate to the protein solution through a dialysis membrane, resulting in an increasing supersaturation level of the protein to grow crystals. This method also replaces the coexistence of components with the protein sample in the reservoir solution while suppressing diffusion leakage of the protein molecules via the membrane [37,38]. Therefore, the concentration of the reagent components, related to the crystallization conditions, can be individually controlled, like the CD method. In the general DL method, the microdialysis button is used [2,37]. In this method, since the reservoir solution diffuses into the container immediately, problems like the generation of bubbles accompanying a sudden change in osmotic pressure are likely to occur. Recently, we developed a dialysis method with a diffusion path with a dialysis membrane attached to the opening end of the CD method capillary, thereby achieving dialysis under mild conditions [31]. A crystal obtained by the DL method in a capillary is shown in Figure 8d. Few studies use the DL method. However, having a better understanding of the mechanism above when setting conditions, as in the CD method, is a good way of setting more optimal crystallization conditions.
3.3. Measures for the Improvement of Crystallization
3.3.1. Reproducibility of Crystallization
When a good-quality protein sample does not reliably reproduce crystals, special care should be taken to maintain the same salts, buffer, and pH as the procedure originally used to crystallize the sample. In general, it is thought that crystallization occurs due to a main crystallization reagent, but other coexisting components greatly influence it. In particular, in the VD method, it should be noted that the components contained in the protein sample are concentrated, like the reservoir components, during crystallization.
3.3.2. Nucleation Rate
To control the size and number of crystals, it is preferable to understand the theory behind the nucleation process. Generally, the three-dimensional nucleation rate in crystallization is expressed by the following equation [25,26]:
where η is the viscosity, C is the solution concentration, γ is the surface tension, and Δμ is the chemical potential difference between the crystal and the solution of a unit volume.
As can be seen from this equation, the rate of three-dimensional nucleation becomes higher as the protein concentration (C) becomes higher, lower when the viscosity (η) is higher, and lower when the interfacial tension (γ) is higher. When the solubility is low, Δμ becomes high, and the nucleation probability increases. As the concentration of the main crystallization reagent increases, Δμ becomes larger as the solubility decreases, and the number of crystals increases. However, as the interfacial tension (γ) increases further, the number of crystals tends to decrease. With a highly viscous crystallization reagent like PEG, when the viscosity (η) further increases, the crystal number significantly decreases. For crystallization methods in which the concentrations of protein and crystallization reagents change over the time, it is better to be conscious of how the three-dimensional nucleation rate is changed. Sometimes the rate change is complicated. Not only the main crystallization reagent, but also the counterion, multivalent cation, and polyvalent anion, may possibly lower the solubility. One must choose the reagents to be added by considering how much of a positive or negative electric charge the protein has at the pH needed for crystallization.
3.3.3. Obtaining Appropriately Shaped Crystals
When a crystal can be obtained, but that crystal becomes needle-shaped or thin plate-shaped and is not suitable for X-ray diffraction experiments, there are usually some problems with the homogeneity of the protein sample. In many cases, it is better to improve the sample quality to overcome these problems. However, there are cases where protein samples are not problematic, yet an appropriate shape is not obtained. In such cases, adding reagents that affect the anisotropic forces between molecules is effective (that is, electrostatic interactions, hydrophobic interactions, and specific intermolecular interactions, as shown in Table 1). It is also possible to change the crystal’s shape by changing the pH to the side opposite to the pI and changing the polarity of the electrostatic repulsion.
3.3.4. Avoiding Crystal Clustering
In a cluster crystal, very fine crystals are gathered, or a single crystal of a certain size seems to grow from the surface of another single crystal. In the former case, there are usually problems with the protein samples, and the first thing to do is improve the sample quality. In the latter case, although the degree of supersaturation is high, the probability of three-dimensional nucleation is low, such that two-dimensional nuclear growth occurs from the crystal’s surface (as the nucleus). In this case, the problem may also be caused by heterogeneous components contaminating the protein sample and can be solved by improving the homogeneity of the sample. However, this may happen even if the sample has a high uniformity, in which case reducing the supersaturation degree by lowering the protein concentration or lowering the interfacial tension or viscosity by decreasing the concentration of the main crystallization reagent is effective.
3.3.5. Resolution and Molecular Packing
Although crystals are obtained, the resolution of the X-ray diffraction may not be high enough to obtain the expected accuracy during structural analysis. If the uniformity of the protein sample is insufficient, an improvement of the sample quality is necessary. When the sample is homogeneous, packing problems may be solved by a number of different means, including changing the force between the molecules to change the packing. Some of the means that have achieved success are as follows:
- Increasing the concentration of the main crystallization reagent: The interfacial tension increases, and a bulk force from the crystal’s surface is applied between the protein molecules isotropically, bringing them closer together. As a result, the interaction between the neighboring protein molecules increases, the disorder is reduced, and the resolution increases;
- Reducing the counter ions: The electrostatic repulsion force increases, which is the micro anisotropic force between the molecules. As a result, a protein’s molecular alignment is more sensitive to its surface charge distribution, and the molecules are aligned in a more uniform direction;
- Adding metal ions, organic acids, and organic bases: Some of these have an attractive function between protein molecules to align the molecules with the micro anisotropic forces between them;
- Changing the pH of the crystallization condition to the opposite side of the protein’s pI: This changes the polarity of the electrostatic repulsive force acting between the protein molecules and changes the micro anisotropic force acting between them, so the packing may change greatly.
3.4. Growing Large Crystals
Today, a crystal of 1 mm3 or more is necessary for neutron diffraction experiments [39]. Compared to crystals for general X-ray diffraction experiments (i.e., ~5 μm, taken on microfocus X-ray beamlines), this value is 100 times or larger, which represents a bottleneck for neutron diffraction experiments.
In order to obtain large crystals, it is necessary to find a condition under which the number of crystals produced per unit volume is approximately one and to grow the crystal while controlling the appropriate crystallization conditions. These include experimental strategies utilizing solubility diagrams, ripening effects, classical crystallization techniques, microgravity, and theoretical considerations [39].
Nakamura et al. have succeeded in obtaining large crystals by determining such crystallization conditions using phase diagrams and shifting to appropriate crystallization conditions [40]. Niimura and colleagues have devised a device capable of reversibly dissolving crystals once produced and have successfully obtained large crystals by reducing the number of crystals [41].
The authors succeeded in producing lysozyme crystals with a long side of about 1 mm using the DL method in a capillary, in which a dialysis membrane was attached to a gel tube [42]. The crystallization conditions were optimized by using a three-dimensional phase diagram, in which the main crystallization reagent (PEG) concentration and the counter ion (sodium chloride) concentration were changed [27].
4. Harvesting Crystals and Cryo-protection
When removing crystals from the crystallization vessel, we often experience crystal damage. For X-ray diffraction experiments with synchrotron radiation, it is necessary to cryoprotect crystals so that there is no damage to the crystal when flash-cooled.
4.1. Harvest Solution
In the batch method, since there is no concentration change of the solution component with time, it is often preferable to harvest crystals in the same solution as the batch solution. Using the VD method and the DL (with Button) method, the time to reach equilibrium is short, and its composition approaches that of the reservoir solution, so the reservoir solution can be used for the harvest solution. On the other hand, in the CD method and DL method with a diffusion path, it takes time to diffuse the crystallization reagent inside the capillary. This tendency is particularly remarkable when a high-molecular-weight PEG is used as a reagent. Even after two to three months have elapsed since filling in the capillary, the concentration of the crystallization reagent inside the capillary is not in equilibrium, and its concentration varies, depending on the location in the capillary. Due to the difference in the reagent concentration at the location where the crystals were grown, if the wrong harvest solution is used, the crystals are destroyed or damaged due to osmotic shock, and the quality of the crystals is markedly degraded.
In order to avoid this phenomenon, the time change of the reagent concentration at each point inside the capillary should be estimated before harvesting crystals to prepare proper harvesting solution. However, finding the concentration experimentally is not easy. Therefore, it is preferable to calculate it in advance with a 1-D simulation program for the diffusion [35]. Based on the place where the crystal was actually obtained and the elapsed time after the setup, the crystallization reagent concentration can be estimated. Practically, it is preferable to prepare two solutions, that is, a reservoir solution [R] and reservoir solution without a main precipitant [B], and to mix [R] and [B] with an appropriate ratio to make a solution of the same concentration as the crystallization reagent.
4.2. Manipulation of Crystals Grown in a Capillary
In the batch method, the VD method, and the DL (with Button) method, crystals can be taken out directly from a crystallization drop with a cryo-loop. On the other hand, when crystals are generated in a capillary, such as in the CD method and DL (with a diffusion path) method, it is necessary to carry out considerably detailed work using a stereoscopic microscope in order to remove intact crystals. It is necessary to observe, in detail, the capillary where the crystals are formed and decide which crystal is best for extraction. The capillary is cut with a range of about 5 mm in front of and in the back of the crystal. The cut capillary segment that contains the targeted crystal is held by tweezers, and the harvest solution is poured into one side of the capillary with a micropipette. If all goes well, the crystals will remove themselves from the capillary wall and become pushed out to be gathered with a cryo-loop.
If crystals continue to adhere to the inner wall of the capillary and do not come out even after applying the harvest solution, a thin wire is used to grind the crystal and remove it from the capillary wall.
4.3. Cryo-Protection
During a diffraction experiment using synchrotron radiation, crystals should usually be flash-cooled for protection from radiation damage. When flash-cooling crystals, it is necessary that the solution around the crystal be solidified into a glassy state [43]. For this reason, crystals are passed through a cryoprotectant solution prepared by adding cryoprotectant to the harvest solution, and the solution around the crystal is replaced. Empirically,
- Typical cryoprotectants are glycerol and PEG;
- It should be ensured that the drops of cryoprotectant solution can be flash-cooled into a glassy form in advance;
- In the case of a PEG type of a lower concentration in the harvest solution, it is preferable that PEG or glycerol is added to a total concentration of about 35% or more;
- In the case of salt as the main precipitant, it is preferable to add glycerol to about 35%;
- However, as the amount of glycerol to be added increases, the osmotic pressure difference becomes large, so one must be careful with this process. Gradually increasing the glycerol concentration may be advisable;
- In the case of salt in the harvest solution, when glycerol cannot be added, sucrose or trehalose is the next choice.
5. Microgravity Environment
5.1. Introduction
In the crystallization of proteins in space experiments, problems of crystallization may be sometimes alleviated by the effects of microgravity [1,44,45,46,47]. Crystal clustering and disordering are suppressed, and the resolution of X-ray diffraction is improved [48]. Some examples of space and ground-grown crystals are shown in Figure 9. Moreover, although the reason is unknown, nucleation formation is suppressed, crystals are increased in size, and, in some cases, crystals with different space groups are grown.
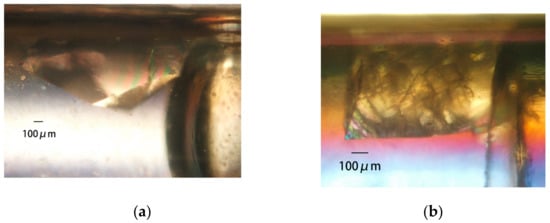
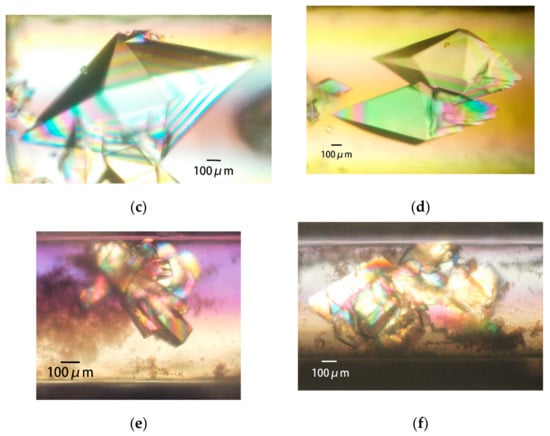
Figure 9.
Space- and ground-grown crystals. PcCel6A crystals grown in space (a) and terrestrially (b) by the counter-diffusion (CD) method; 39.3 mg/mL PcCel6A, 90 mM sodium chloride, and 10 mM cellotriose in 5 mM Tris-HCl pH 7.5 are loaded in a 2 mm bore capillary. After the Gel-Tube is plugged [31], the capillary is placed in a reservoir solution containing 46.4% PEG 4000, 5 mM cellotriose, and 50 mM sodium acetate pH 4.5. Thaumatin crystals grown in space (c) and terrestrially (d) by the dialysis (DL) method; 33.7 mg/mL thaumatin in 50 mM HEPES pH 7.0 is loaded in a 2 mm bore capillary with a dialysis membrane [31]. The capillary is placed in a reservoir solution containing 25% PEG 4000, 100 mM sodium chloride, 75 mM sodium tartrate, and 50 mM HEPES pH 7.0. H-Protein crystals grown in space (e) and terrestrially (f) by the CD method; 38.2 mg/mL H-protein, 25 mM sodium chloride, 500 mM ammonium sulfite, 20 mM sodium citrate pH 3.0, 0.4 mM DTT, and 4% glycerol are loaded in a 0.7 mm bore capillary. After the Gel-Tube is plugged [31], the capillary is placed in a reservoir solution containing 2.5 M ammonium sulfate, 25 mM sodium chloride, and 100 mM sodium citrate pH 3.0.
In the solution around the growing crystal, protein molecules are incorporated into the crystal surface, and the density of the solution is lowered [1,49,50]. In the terrestrial environment, a density-driven flow occurs. As a result, protein molecules are continuously transported by this flow from a place far away from the crystal into the solution. Impurities and minute crystals in the solution are also carried and taken into the surface of the crystal. On the other hand, in a microgravity environment, protein molecules, impurities, and minute crystals approach the crystal’s surface only by thermal motion. As a result, their concentration on the crystal’s surface decreases compared to that in a terrestrial environment.
Indeed, Otálora et al. [49] confirmed, by optical interferometry, that a protein depletion zone (PDZ) was formed in the vicinity of growing lysozyme crystals in space experiments (STS-95) during the 1998 Space Shuttle mission. It is believed that if the protein concentration on the growing crystal’s surface decreases due to the formation of PDZ, the supersaturation degree decreases, the growth rate decreases, and the disorder of the protein molecule taken into the crystal decreases. Thomas et al. [50] also revealed that impurity uptake is greatly suppressed in lysozyme crystals grown in a microgravity environment in the space experiment (STS-95). It is thought that this is due to the formation of an impurity depletion zone (IDZ) around the crystal caused by the absorption of the impurity on the crystal surface, which decreases impurity incorporation in the outer portion of the crystal. For the same reason, if the adhesion of minute crystals decreases, not only disordered reduction, but also the suppression of clusters, may be expected. On the other hand, according to Vekilov et al. [51], fluctuation occurs in the crystal growth rate due to the interaction between density-driven convection and the process of molecular uptake into the crystal, and, as a result, this fluctuation conceivably causes disorder by bunching the growth steps on the surface of the crystal. Therefore, the suppression of density-driven convection also solves this problem. Incidentally, a method and apparatus for growing crystals with less disorder (even in a terrestrial laboratory) has been devised by suppressing the degree of supersaturation or, conversely, actively imparting flow to the crystal’s surface, which may suppress step bunching [52].
5.2. Numerical Model
For the diffusion field formed around the growing crystal, a numerical analysis can be performed with a simplified model system, assuming that the crystal is a sphere and ignoring the dissociation of protein molecules and impurity molecules from the crystal. The effect of the formation of PDZ is defined as the Driving Force Ratio (DFR), and the effect of suppressing the impurity uptake via the formation of IDZ is the IR Impurity Ratio (IR) [53,54,55]:
where DF0G and DF1G are the microgravity and terrestrial driving forces, respectively; IUR0G and IUR1G are the impurity uptake ratio for those forces, respectively; C(∞), C(R), and Ce are protein concentrations away from the crystal, at the crystal surface, and the saturated solution, respectively; Ci(∞) and Ci(R) are the impurity concentration away from the crystal and the impurity concentration on the crystal’s surface, respectively. β and βi are, respectively, the kinetic constants for the crystal growth of protein molecules and impurity molecules; D and Di are, respectively, the diffusion constants of protein molecules and impurity molecules; and R is the crystal radius.
It can be seen that when equations (2) and (3) are plotted on the abscissa with an Rβ/D value, the effect of the formation of the concentration depletion zone increases as the Rβ/D value increases. For details, see Ref. 54. A positive effect can be expected as R increases, as β increases, or as D decreases. Therefore, when diffusion is slow in the solution, while the crystal growth is fast, and the crystal grows large, greater effects can be expected for the space experiment.
The authors devised an approximate expression [36], which roughly estimates D, as well as an experimental method that roughly estimates β [55,56]. That is, by observing the crystal growth time course in the batch method, we can estimate D and β. In evaluating the results of the space experiments of JAXA using this index, when D/β was 3 mm or less, there were effects of microgravity in about 70% of the crystals, such as the improvement of clustering and improvement of the X-ray diffraction resolution [57].
Based on the average value of the sizes of the generated crystals and the values of D and β, the Rβ/D can be calculated to be 0.035 or more. From this, the effect of IDZ (suppression of impurity uptake) is considered to be dominant in crystals with sizes used for X-ray diffraction experiments. On the other hand, when R is large (about 1 mm or more), like in the crystals used for the neutron diffraction experiments, both PDZ and IDZ effects can be expected.
5.3. Enhancing the Effects of Microgravity
From this estimation of the concentration depletion zone around the crystal, in order to positively enhance the effect of the space experiment, D should be decreased and β should be increased. Since D depends on the viscosity of the solution, it is possible to use a highly viscous reagent, such as PEG. Optimizing the salt concentration in the solution is very important when crystallization conditions, including PEG, are applied to various kinds of protein samples [10]. On the other hand, β is increased by refining the protein sample and increasing the uniformity. For example, if the lysozyme is purified by ion exchange chromatography to increase its homogeneity, β becomes several times larger [56]. From these results, it is possible to determine in advance whether or not the effects of the space experiment can be expected by determining the values of D and β beforehand. It is also possible to improve the usefulness of the space experiments by improving the samples and crystallization conditions that are inappropriate for space experiments with these promotional measures [58,59].
5.4. Transient Growth Process
The protein concentration around the crystal in actual protein crystallization is a transient process. It decreases as the crystal grows and the growth speed slows down; that is, when nuclei are formed and crystal growth starts, the degree of surface supersaturation is high, but at the end of crystal growth, the protein concentration in the solution drops to the concentration of solubility. As a result, crystals will grow from the center to the surface under different supersaturation degrees. In addition, the amount of impurities taken in varies depending on the location in the crystal.
The authors devised a numerical calculation model to determine the crystal growth process closer to actual crystallization [60]. For the sake of simplicity, partial differential equations describing both the diffusion process in the virtual sphere and the crystal growth process in the center of the sphere are described.
By applying various constants of the crystallization process of lysozyme to this model, the impurity concentration is low in the portion close to the center in the crystals grown in microgravity, while in the peripheral portion, the impurity concentration is higher than that of the crystals grown on the ground [60,61]. In this simulation, β is set to a constant value, but, in reality, β increases as the impurity concentration decreases, as described above. Based on the results of the in-situ observation of the NanoStep project by Tsukamoto et al. [62], in a microgravity environment where IDZ is formed, as the impurity concentration decreases, the crystal growth rate becomes faster than that in the terrestrial environment, and β becomes large. Therefore, the effect of PDZ and IDZ seems to be further enhanced in microgravity. From this result, it is suggested that differences exist in the quality of the X-ray diffraction patterns of crystals due to differences in the positions of the crystals. Therefore, the authors investigated the local diffraction of crystals by growing crystals from a lysozyme sample containing some impurities and performing X-ray diffraction experiments on the crystals with a grid scan [61]. Although a preliminary experimental result, it was observed from the crystals obtained in the terrestrial experiment that the a and b axes of the crystal lattice become slightly larger when moving outward from the center of the crystal. On the other hand, this phenomenon was not observed in the crystals obtained from the space experiment. Crystals grown on the ground seem to have a large amount of impurities taken up around the center of the crystal, and these impurities have a larger influence on the lattice of the crystal toward the outside of the crystal.
5.5. Other Phenomena
Ng et al. reported on crystallization in a microgravity environment for 6 months using the CD method, where 2 mm square crystals were grown in a capillary with an inner diameter of 2 mm [39]. In this experiment, Ostwald ripening (i.e., the larger the crystal, the lower the solubility) resulted in crystals becoming dissolved and absorbed into large crystals. Therefore, it is necessary to investigate the extent to which this phenomenon can be applied to the formation of large crystals for structural analysis, as well as the optimum conditions.
6. Conclusions
This paper summarizes the evaluation of the quality of protein samples and crystallization conditions and the handling of the obtained crystals based on decades of experience, especially for proteins acquired from the JAXA PCG space experiments. These technologies still have room for improvement, and progress is being made daily. We hope that these technologies will lead to the realization of practical and useful crystallization experiments.
Author Contributions
Funding
This research received no external funding, but was performed with internally-generated funds.
Acknowledgments
We thank all the academic and research institutional users of JAXA PCG experiments for contributing protein samples to the microgravity experiments. In particular, we thank Atsushi Nakagawa of Osaka University for the H-protein sample, Kiyohiko Igarashi of the University of Tokyo for the PcCel6A sample, Tetsuya Masuda of Kyoto University for the thaumatin sample, and Kosuke Aritake of Daiichi University for the haematopoietic prostaglandin-D synthase sample. We are grateful to the Federal Space Agency and RSC Energia for the use of the Russian Service Module and the Russian spacecrafts Progress and Soyuz for space transportation, to the European Space Agency (ESA) and to Garcia-Ruiz of CSIC-University of Granada for counter-diffusion techniques and space crystallization technology, and to JAXA for the use of the Japanese Experimental Module (Kibo). Finally, we are grateful to the members of the JAXA PCG team.
Conflicts of Interest
The authors declare no conflict of interest.
References
- Chernov, A.A. Protein crystals and their growth. J. Struct. Biol. 2003, 142, 3–21. [Google Scholar] [CrossRef]
- McPherson, A.; Gavira, J.A. Introduction to protein crystallization. Acta Cryst. 2014, F70, 2–20. [Google Scholar] [CrossRef] [PubMed]
- Giege, R. A historical perspective on protein crystallization from 1840 to the present day. FEBS J. 2013, 280, 6456–6497. [Google Scholar] [CrossRef] [PubMed]
- Candoni, N.; Grossier, R.; Hammadi, Z.; Morin, R.; Veesler, S. Practical Physics Behind Growing Crystals of Biological Macromolecules. Protein Peptide Lett. 2012, 19, 714–724. [Google Scholar]
- Matsuura, Y.; Chernov, A.A. Morphology and the strength of intermolecular contacts in protein crystals. Acta Cryst. 2003, D59, 1347–1356. [Google Scholar] [CrossRef]
- Thomas, B.R.; Carter, D.; Rosenberger, F. Effect of microheterogeneity on horse spleen apoferritin crystallization. J. Cryst. Growth 1998, 187, 499–510. [Google Scholar] [CrossRef]
- Thomas, B.R.; Chernov, A.A. Acetylated lysozyme as impurity in lysozyme crystals: constant distribution coefficient. J. Cryst. Growth 2001, 232, 237–243. [Google Scholar] [CrossRef]
- Vekilov, P.G. Elementary processes of protein crystal growth. Prog. Crystal Growth Charact. 1993, 26, 25–49. [Google Scholar] [CrossRef]
- Niedzialkowska, E.; Gasiorowska, O.; Handing, K.B.; Majorek, K.A.; Porebski, P.J.; Shabalin, I.G.; Zasadzinska, E.; Cymborowski, M.; Minor, W. Protein purification and crystallization artifacts: The tale usually not told. Protein Sci. 2016, 25, 720–733. [Google Scholar] [CrossRef]
- Yamanaka, M.; Inaka, K.; Furubayashi, N.; Matsushima, M.; Takahashi, S.; Tanaka, H.; Sano, S.; Sato, M.; Kobayashi, T.; Tanaka, T. Optimization of salt concentration in PEG-based crystallization solutions. J. Synchrotron Rad. 2010, 18, 84–87. [Google Scholar] [CrossRef]
- ExPASy Bioinformatics Resource Portal. Available online: https://www.expasy.org/ (accessed on 30 January 2020).
- Garfin, D.E. One-dimensional gel electrophoresis. Methods Enzymol. 2009, 463, 497–513. [Google Scholar] [PubMed]
- Van Der Laan, J.M.; Swarte, M.B.A.; Groendijk, H.; Hol, W.G.J.; Drenth, J. The influence of purification and protein heterogeneity on the crystallization of p-hydroxybenzoate hydroxylase. Eur. J. Biochem. 1989, 179, 715–724. [Google Scholar] [CrossRef] [PubMed]
- O’Farrell, P. High resolution two-dimensional electrophoresis of proteins. J. Biol. Chem. 1975, 250, 4007–4021. [Google Scholar] [PubMed]
- Jungbauer, A.; Hahn, R. Ion-exchange chromatography. Methods Enzymol. 2009, 463, 349–371. [Google Scholar]
- Cummins, P.M.; Rochfort, K.D.; O’Connor, B.F. Ion-exchange chromatography: Basic principles and application. In Protein Chromatography. Methods in Molecular Biology; Walls, D., Loughran, S., Eds.; Human Press: New York, NY, USA, 2017; p. 1485. [Google Scholar]
- Proteau, A.; Shi, R.; Cygler, M. Application of dynamic light scattering in protein crystallization. Curr. Protoc. Protein Sci. 2010, 61, 17.10.1–17.10.9. [Google Scholar] [CrossRef]
- Vorontsova, M.A.; Maes, M.; Vekilov, P.G. Recent advances in the understanding of two-step nucleation of protein crystals. Faraday Discuss. 2015, 179, 27–40. [Google Scholar] [CrossRef]
- Tyler-Cross, R.; Schirch, V. Effects of amino acid sequence, buffers, and ionic strength on the rate and mechanism of deamidation of asparagine residues in small peptides. J. Biol. Chem. 1991, 266, 22549–22556. [Google Scholar]
- Majeed, S.; Ofek, G.; Belachew, A.; Huang, C.; Zhou, T.; Kwong, P.D. Enhancing protein crystallization through precipitant synergy. Structure 2003, 11, 1061–1070. [Google Scholar] [CrossRef]
- Collins, K.D. Ions from the Hofmeister series and osmolytes: effects on proteins in solution and in the crystallization process. Methods 2004, 34, 300–311. [Google Scholar] [CrossRef]
- Tanaka, S.; Ataka, M. Protein crystallization induced by polyethylene glycol: A model study using apoferritin. J. Chem. Phys. 2002, 117, 3504–3510. [Google Scholar] [CrossRef]
- Newstead, S.; Ferrandon, S.; Iwata, S. Rationalizing alpha-helical membrane protein crystallization. Protein Sci. 2008, 17, 466–472. [Google Scholar] [CrossRef] [PubMed]
- Stetsenko, A.; Guskov, A. An Overview of the Top Ten Detergents Used for Membrane Protein Crystallization. Crystals 2017, 7, 197. [Google Scholar] [CrossRef]
- García-Ruiz, J.M. Nucleation of protein crystals. J. Struct. Biol. 2003, 142, 22–31. [Google Scholar] [CrossRef]
- Yoshizaki, I.; Nakamura, H.; Fukuyama, S.; Komatsu, H.; Yoda, S. Estimation of crystallization boundary of a model protein as a function of solute concentration and experiment time. Int. J. Microgravity Sci. Appl. 2002, 19, 30–33. [Google Scholar]
- Takahashi, S.; Yan, B.; Furubayashi, N.; Inaka, K.; Tanaka, H. Effects of polyethylene glycol 4000 and Sodium chloride: 3-dimensional phase diagram for a protein crystallization. Mater. Struct. 2016, 23, 154. [Google Scholar]
- Jakoby, W.B. A technique for the crystallization of proteins. Anal. Biochem. 1968, 26, 295–298. [Google Scholar] [CrossRef]
- Nakamura, H.; Fukuyama, S.; Yoshizaki, I.; Yoda, S.-I. Theory of vapor diffusion in the high-density protein crystal growth device and its application to the measurement of the vapor pressures of aqueous solutions. J. Cryst. Growth 2003, 259, 149–159. [Google Scholar] [CrossRef]
- Benvenuti, M.; Mangani, S. Crystallization of soluble proteins in vapor diffusion for x-ray crystallography. Nat. Protoc. 2007, 2, 1633–1651. [Google Scholar] [CrossRef]
- Takahashi, S.; Koga, M.; Yan, B.; Furubayashi, N.; Kamo, M.; Inaka, K.; Tanaka, H. JCB-SGT crystallization devices applicable to PCG experiments and their crystallization conditions. Int. J. Microgravity Sci. Appl. 2019, 36, 360107. [Google Scholar]
- García-Ruiz, J.M.; González-Ramírez, L.A.; Gavira, J.A.; Otálora, F. Granada Crystallization Box: a new device for protein crystallization by counter-diffusion techniques. Acta Cryst. 2002, D58, 1638–1642. [Google Scholar]
- Otálora, F.; Gavira, J.A.; Ng, J.D.; García-Ruiz, J.M. Counterdiffusion methods applied to protein crystallization. Prog. Biophys. Mol. Biol. 2009, 101, 26–37. [Google Scholar] [CrossRef] [PubMed]
- García-Ruiz, J.M. Counterdiffusion method for macromolecular crystallization. Methods Enzymol. 2003, 368, 130–154. [Google Scholar] [PubMed]
- Tanaka, H.; Inaka, K.; Sugiyama, S.; Takahashi, S.; Sano, S.; Sato, M.; Yoshitomi, S. A simplified counter diffusion method combined with a 1D simulation program for optimizing crystallization conditions. J. Synchrotron Rad. 2004, 11, 45–48. [Google Scholar] [CrossRef] [PubMed]
- Tanaka, H.; Yoshizaki, I.; Takahashi, S.; Yamanaka, M.; Fukuyama, S.; Sato, M.; Sano, S.; Motohara, M.; Kobayashi, T.; Yoshitomi, S.; et al. Diffusion coefficient of the protein in various crystallization solutions: The Key to growing high-quality crystals in space. Microgravity Sci. Technol. 2006, XVIII-3/4, 91–94. [Google Scholar] [CrossRef]
- McPherson, A. Practical procedures for macromolecular crystallization. In Crystallization of Biological Macromolecules; Bianco, C., Ed.; Cold Spring Harbor: New York, NY, USA, 1999. [Google Scholar]
- Maeda, M.; Chatake, T.; Tanaka, I.; Ostermann, A.; Niimura, N. Crystallization of a large single crystal of cubic insulin for neutron protein crystallography. J. Synchrotron Rad. 2004, 11, 41–44. [Google Scholar] [CrossRef] [PubMed]
- Ng, J.D.; Baird, J.K.; Coates, L.; García-Ruiz, J.M.; Hodge, T.A.; Huang, S. Large-volume protein crystal growth for neutron macromolecular crystallography. Acta Cryst. 2015, F71, 358–370. [Google Scholar] [CrossRef] [PubMed]
- Nakamura, A.; Ishida, T.; Fushinobu, S.; Kusaka, K.; Tanaka, I.; Inaka, K.; Higuchi, Y.; Masaki, M.; Ohta, K.; Kaneko, S.; et al. Phase-diagram-guided method for growth of a large crystal of glycoside hydrolase family 45 inverting cellulose suitable for neutron structural analysis. J. Synchrotron Rad. 2013, 20, 859–863. [Google Scholar] [CrossRef]
- Crystal growth apparatus for biological macromolecules. Japan Patent JP4161101B.
- Takahashi, S.; Tanaka, H. Background of protein crystallization technologies in space. Int. J. Microgravity Sci. Appl. 2017, 34, 340103. [Google Scholar]
- Garman, E.F.; Schneider, T.R. Macromolecular Cryocrystallography. J. Appl. Cryst. 1997, 30, 211–237. [Google Scholar] [CrossRef]
- Day, J.; McPherson, A. Macromolecular crystal growth experiments on International Microgravity Laboratory-1. Protein Sci. 1992, 1, 1254–1268. [Google Scholar] [CrossRef]
- Ng, J.D.; Sauter, C.; Lorber, B.; Kirkland, N.; Arnez, J.; Giege, R. Comparative analysis of space-grown and earth-grown crystals of an aminoacyl-tRNA synthetase: space-grown crystals are more useful for structural determination. Acta Cryst. 2002, D58, 645–652. [Google Scholar] [CrossRef] [PubMed]
- McPherson, A.; DeLucas, L.J. Microgravity protein crystallization. npj Microgravity 2015, 1, 15010. [Google Scholar] [CrossRef] [PubMed]
- Snell, E.H.; Helliwell, J.R. Macromolecular crystallization in microgravity. Rep. Prog. Phys. 2005, 68, 799–853. [Google Scholar] [CrossRef]
- Mares, D.; Evrard, C.; Gavira, J.A.; Sleutel, M.; Van de Weerdt, C.; Otalora, F.; Garcia-Ruiz, J.M.; Nicolis, G.; Martial, J.; Decanniere, K. Toward a Definition of X-ray Crystal Quality. Cryst. Growth Des. 2008, 8, 4284–4290. [Google Scholar] [CrossRef]
- Otálora, F.; Novella, M.L.; Gavira, J.A.; Thomas, B.R.; García-Ruiz, J.M. Experimental evidence for the stability of the depletion zone around a growing protein crystal under microgravity. Acta Cryst. 2001, D57, 412–417. [Google Scholar] [CrossRef]
- Thomas, B.R.; Chernov, A.A.; Vekilov, P.G.; Carter, D.C. Distribution coefficients of protein impurities in ferritin and lysozyme crystals Self-Purification in microgravity. J. Cryst. Growth 2000, 211, 149–156. [Google Scholar] [CrossRef]
- Vekilov, P.G.; Thomas, B.R.; Rosenberger, F. Effects of convective solute and impurity transport in protein crystal growth. J. Phys. Chem. B 1998, 102, 5208–5216. [Google Scholar] [CrossRef]
- Adachi, H.; Takano, K.; Matsumura, H.; Inoue, T.; Mori, Y.; Sasaki, T. Protein crystal growth with a two-liquid system and stirring solution. J. Synchrotron Rad. 2004, 11, 121–124. [Google Scholar] [CrossRef]
- Chernov, A.A. Crystal growth and crystallography. Acta Cryst. 1998, A54, 859–872. [Google Scholar] [CrossRef]
- Inaka, K.; Tanaka, H.; Takahashi, S.; Sano, S.; Sato, M.; Shirakawa, M.; Yoshimura, Y. Numerical Analysis of the diffusive field around a growing protein crystal in microgravity. Defect and Diffusion Forum 2012, 323–325, 565–569. [Google Scholar] [CrossRef]
- Tanaka, H.; Inaka, K.; Sugiyama, S.; Takahashi, S.; Sano, S.; Sato, M.; Yoshitomi, S. Numerical Analysis of the depletion zone formation around a growing protein crystal. Ann. N.Y. Acad. Sci. 2004, 1027, 10–19. [Google Scholar] [CrossRef] [PubMed]
- Tanaka, H.; Inaka, K.; Furubayashi, N.; Yamanaka, M.; Takahashi, S.; Sano, S.; Sato, M.; Shirakawa, M.; Yoshimura, Y. Controlling the diffusive field to grown a higher quality protein crystal in microgravity. Defect Diffus. Forum 2012, 323–325, 549–554. [Google Scholar] [CrossRef]
- Takahashi, S.; Ohta, K.; Furubayashi, N.; Yan, B.; Koga, M.; Wada, Y.; Yamada, M.; Inaka, K.; Tanaka, H.; Miyoshi, H.; et al. JAXA protein crystallization in space: ongoing improvements for growing high-quality crystals. J. Synchrotron Rad. 2013, 20, 968–973. [Google Scholar] [CrossRef] [PubMed]
- Tanaka, H.; Tsurumura, T.; Aritake, K.; Furubayashi, N.; Takahashi, S.; Yamanaka, M.; Hirota, E.; Sano, S.; Sato, M.; Kobayashi, T.; et al. Improvement in the quality of hematopoietic prostaglandin D synthase crystals in a microgravity environment. J. Synchrotron Rad. 2011, 18, 88–91. [Google Scholar] [CrossRef]
- Inaka, K.; Takahashi, S.; Aritake, K.; Tsurumura, T.; Furubayashi, N.; Yan, B.; Hirota, E.; Sano, S.; Sato, M.; Kobayashi, T.; et al. High-quality protein crystal growth of mouse lipocalin-type prostaglandin D Synthase in microgravity. Cryst. Growth Des. 2011, 11, 2107–2111. [Google Scholar] [CrossRef]
- Tanaka, H.; Sasaki, S.; Takahashi, S.; Inaka, K.; Wada, Y.; Yamada, M.; Ohta, K.; Miyoshi, H.; Kobayashi, T.; Kamigaichi, S. Numerical model of protein crystal growth in a diffusive field such as the microgravity environment. J. Synchrotron Rad. 2013, 20, 1003–1009. [Google Scholar] [CrossRef]
- Takahashi, S.; Nakagawa, A.; Furubayashi, N.; Inaka, K.; Ohta, K.; Tanaka, H. Non-uniform diffractive quality of the crystals grown in microgravity and in terrestrial gravity. J. Jpn. Association Crystal Growth 2016, 43, 110–116. [Google Scholar]
- Tsukamoto, K. Growth rate of protein crystals under microgravity. J. Jpn. Soc. Microgravity Appl. 2012, 29, 106–110. [Google Scholar]
© 2020 by the authors. Licensee MDPI, Basel, Switzerland. This article is an open access article distributed under the terms and conditions of the Creative Commons Attribution (CC BY) license (http://creativecommons.org/licenses/by/4.0/).