
Performance Characteristics of Custom Thermocouples for Specialized Applications


1
Department of Materials Science and Engineering, Montana Technological University, 1300 W Park St., Butte, MT 59701, USA
2
Department of Electrical Engineering, Montana Technological University, 1300 W Park St., Butte, MT 59701, USA
3
School of Materials Engineering, Purdue University, West Lafayette, IN 47907, USA
*
Author to whom correspondence should be addressed.
Crystals 2021, 11(4), 377; https://doi.org/10.3390/cryst11040377
Submission received: 4 March 2021
/
Revised: 26 March 2021
/
Accepted: 1 April 2021
/
Published: 5 April 2021
(This article belongs to the Special Issue The Fabrication and Characterization of Thermoelectric and Thermomagnetic Materials)
Abstract
:This work reports the performance characteristics of custom thermocouples developed for use in elevated temperatures such as metal casting operations. The scope of this research is limited to thermocouples designed using pyrolytic graphite (PG) as the primary thermoelement in connection with aluminum, copper, steel, and tungsten. The Seebeck coefficients of the sensors were determined from experimental data after heating to ~500 °C. Cooling from ~500 °C to room temperature enabled us to compare the characteristic behaviors of the sensors from the obtained near-linear responses in the voltage-temperature plots. Tungsten being a refractory metal produced the highest sensitivity of the sensors. The sensitivity of the PG-tungsten thermocouple upon heating measured up to 26 μV/°C and a slightly lower value of 24.2 μV/°C was obtained upon cooling. Conversely, the PG-steel thermocouple rather produced the lowest Seebeck coefficients of 13.8 μV/°C during heating and 14.0 μV/°C for the cooling experiments though steel has a high melting temperature than most of the other thermoelements.
1. Introduction
Thermocouples (TCs) are devices designed for the principal application of temperature measurement. This was originated following the work of Seebeck in 1822 [1,2,3], who found that when two different conductors are connected, minute electric currents are detected at their joint when there exists a temperature difference across the joint. In essence, a thermocouple consists of a pair of unlike conductors also known as the thermoelements, of which a thermoelectric circuit is composed. Thermocouples have found usefulness in research and industrial applications because of their fast thermal responses, higher precision, ruggedness, and high efficiency in extreme conditions [4,5,6,7].
Over the years as interest in TCs grew, variations in the voltage response of thermoelements due to differences in temperature, orchestrated the exploration and development of many different thermocouples with TC sensitivity and stability at elevated temperatures of the thermoelements being the factors of concern. A wide range of thermocouples made from selected materials ranging from base and noble metals, through refractory metals to thin films are known [7,8,9,10,11,12,13]. But only a few of them have found usefulness as temperature sensors with longer lifespans in extreme operating environments [13]. For instance, the base metal TCs are known to be affected by drifts in Seebeck coefficients even at low temperatures due to short-range ordering and spin clusters [7]. The noble metal thermocouples have been demonstrated to be irresolute in functions involving multiple atmospheres and extreme environments [11]. Refractory metal TCs however, have been useful in extreme temperature environments such as in slagging gasifiers, where the reaction chambers typically operate at temperatures between 1250–1550 °C, and at pressures of up to 1000 psi [14]. In such environments, refractory TCs with thicker protective casings are used. This design, therefore, decreases the sensitivity and response time of the TC. Thin-film TCs on the other hand, promises a fast response rate and high accuracies as a consequence of the absence of airgaps in the thermocouple materials, but they are very challenging to fabricate [15,16]. With all these challenges, further research is needed to develop special TCs of improved performances and longevity to meet the ever-growing demands of industries.
This paper, therefore, compares the thermopower performances of four custom-made thermocouples designed for elevated temperatures such as metal casting operations. The model thermoelements are commercial alloys of aluminum (Al), copper (Cu), stainless steel, and tungsten (W), with pyrolytic graphite (PG) being the primary thermoelement.
2. Theoretical Background
The operation of thermocouples constitutes a means for converting thermal energy to electrical energy. TCs are active sensors and therefore are capable of producing their own thermoelectric power [12]. The thermoelectric effect involves transforming temperature differences in material to voltage. The reverse also holds true for this phenomenon. This encompasses the Thomson, Seebeck, and Peltier effects. The operation of TCs follows the Seebeck principle [17]. A TC has the ability to produce an electromotive force (emf) by converting thermal to electrical energies. The emf measured as an electric potential (voltage) produced by the temperature difference is called the Seebeck effect. The constant of proportionality is therefore the Seebeck coefficient (S) or the thermopower, Equation (1). The Seebeck coefficient represents how sensitive a thermocouple is [18].
where and are the voltage and temperature differences respectively. The temperature at the junctions is a function of the voltage produced in the thermocouple [19,20]. Thus, thermal diffusion has the ability to cause electrons to drift in either direction at the TC junctions. Therefore, the Seebeck coefficient can be positive or negative based on the type of materials in fabricating the TC as shown in Equation (1) [20]. Typically, semiconductor materials have high S values than metals. Metals however have high electrical conductivities. Such differences can be a result of a number of factors such as the crystallinity, types of defect, phonons, presence of impurities, the carrier type, and concentration [4]. Higher carrier concentrations and mobility will not directly translate into a large Seebeck effect in a material. For instance, low thermal conductivity will generate a sharp temperature difference that reduces the flow rate of the charge carriers. The emf generated from the flow of charge carriers at the junction of the two dissimilar thermoelements can be estimated following the theory of thermoelectricity given by Equation (2) [21].
3. Experimental
3.1. Materials
The selected materials for constructing the thermocouples were pyrolytic graphite (PG) and commercially pure alloys of Al, Cu, W, and steel. The selection of these thermoelements was based on a number of key physical and mechanical material properties. Due to the extreme environments in which TCs operate, properties such as melting point, thermal conductivity, heat capacity, and coefficient of thermal expansion were paramount for selecting the materials. Other equally important properties were electrical conductivity, corrosion resistance, and density for weight regulation.
PG, which was used as the primary thermoelement in the TC construction, is an allotrope of carbon that has high stability, excellent thermoelectric properties and it’s also known to have high compliance and resistance to elevated temperatures [22,23,24]. PG has a melting point of ∼3550 °C [23]. This material also has a large specific surface area and a low coefficient of thermal expansion (CTE) as its properties and hence, only exhibits little to no changes across the area, volume, or shape after a thermal gradient is applied [25]. The mode of heat transfer in PG is attributed to phonon transport [23]. Sheets of PG are made by compressing a group of graphite flakes without a binder. This makes the sheets very flexible and brittle after production [24,26]. Large surface areas are observed because the PG sheets are usually exfoliated. To add to the foregoing, pyrolytic graphite does not undergo distortion at elevated temperatures as observed by the authors [27,28]. The PG sheet used was bought from www.graphenesupermarket.com, it was 25 microns thick and had a density of 2 g/cm3.
The aluminum-based TC was constructed by utilizing a commercially pure sample of the aluminum combined together with PG. The commercially pure aluminum alloys belong to the 1xxx series classification with a minimum Al purity of 99 wt% [28]. The main property controlling impurities are Fe and Si and hence are limited to a maximum of 1 wt% in the 1xxx series alloys [29]. Alloys of aluminum and their pure forms are highly corrosion-resistant because of the formation of an oxide layer that protects them and are therefore used for high strength and critical applications [30]. Pure alloys in the annealed (O-temper) conditions typically have low tensile strengths (45–90 MPa) but can be strengthened through strain hardening; a preferred method of strengthening due to the low effect of plastic deformation on the electrical conductivity of the alloys [29]. Aluminum, when used as a thermocouple has added properties of a high thermal and electrical conductivity, and a thermal diffusivity that is multiple times that of other thermocouples [13]. It is highly recyclable in all its forms. It has the best strength-to-weight ratio compared to other metals, and a fairly high melting temperature of ∼660 °C [28].
The PG-Cu thermocouple was made from commercially pure wires of Cu with purity >99%. In commercial processes, Cu is the standard for electrical conductivity measurements as designated in the standard unit (%IACS) for highly conductive metals [31]. IACS stands for International Annealed Copper Standards [32]. Cu has excellent electrical conductivity, and this is stemming from the low compressibility of the material due to its filled d states in the electronic structure. Since electrical resistivity is dominated by electron scattering through thermal vibrations, the low amplitude of these vibrations resulting from the low compressibility gives rise to the high electrical conductivity [33]. Cu is also known to have high thermal conductivity (>390 W/m·K) and is an excellent thermoelectric material [28].
The steel TC was made using steel wool and PG. Steel, which is an alloy of iron and carbon, has a high tensile strength and melting temperature (~1370 °C) [34]. In contrast with Al and Cu, this material has very low electrical conductivity and thermal conductivity (21 W/m·K) [34]. The sharp contrast in the material property relative to Al and Cu is partly influenced by a choice to assess the TC performances across a variety of material properties. The choice was also partly due to the low cost and ready availability of the material.
Tungsten is a refractory metal and has the highest melting point (>3000 °C) among all the variable thermoelements with excellent thermoelectric potential and power [10,35]. Alloys of W also have high chemical stability in vacuum, inert, or reducing atmospheres of up to 2200 °C [36,37]. The inexpensive cost and availability of the material made tungsten a desirable candidate for its use as a thermoelement for our W-PG thermocouple.
3.2. Materials Characterization
SEM imaging of the samples was conducted using a LEO 1430VP ™ Scanning Electron Microscope (Zeiss, NY, USA). A beam current of 100 μA was attained from an extra high tension accelerating voltage of 25 kV. Such high voltages are typical for metal specimens. Sample preparation prior to SEM imaging is a critical step to obtain quality images. Thus, the samples were polished with various grit sizes of SiC paper. To prevent sample charging from the incoming electron beam and to make it conductive, a thin film of gold was used to sputter coat the PG using Denton Vacuum Desk I. Figure 1a shows the SEM micrograph of PG.
The chemical constituents of the thermoelements were examined using Energy Dispersive X-ray Spectroscopy (EDAX). EDAX is used to identify the elemental composition of materials. The intensity distribution of the X-ray signals generated from a focused electron beam provides the elemental mapping within the sample. Analysis of the data generated by EDAX shows spectra corresponding to the elements that constitute the composition of the sample being analyzed [30,31,34]. The spectrometer used for the analysis of the samples was an AMETEK® EDX ZEISS 1430 spectrometer (Zeiss, NY, USA).
Figure 1b is the spectrograph of the PG sample. A single peak of carbon corresponding to a weight fraction of 100% is obtained for the PG sample. The elemental composition of Al, Cu, steel, and W are summarized in Table 1. All the samples demonstrate high purity (~90 wt% or higher purity of the main element) which is critical to the thermoelectric properties of the constructed TCs.
3.3. Design of Custom Thermocouples
A flexible PG sheet (183 mm x 15 mm × 0.025 mm) forms the base of the thermocouples. The other thermoelement was strategically placed at each end of the PG sheet. This formed the hot and cold junctions of our TC. For the Al-PG TC, A 30 mm × 15 mm × 0.60 mm aluminum plate was used. For the PG-steel TC, a 26 × 15 × 2.72 mm steel wool was used as the second thermoelement, while flat Cu wires of dimensions 26 × 15 × 0.35 mm were used for the PG-Cu TC. A 0.25 mm-thick W wire was also used for the PG-W TC.
Flexible wires of similar material compositions as our second thermoelements lead to the data logger. Copper wire, dead soft aluminum wire, steel thread, and tungsten wire were used. High-temperature rod sleeves are used to insulate these wires. Two k-type thermocouples were attached at the hot and cold junctions as a reference. Ceramic tile is used as a thermal insulator for sandwiching the whole setup. All other crevices are then sealed with potter’s clay. Shown in Figure 2 is the sectional drawing of our thermocouple.
Using the flexible wires, each custom TC is then connected to the data logger which has a MAX31855 K (Maxim Integrated, San Jose, CA, USA) thermocouple-to-digital converter to compensate and digitize the thermocouple signals [38]. The temperature compensation minimizes the errors associated with the temperature changes during data logging. The data logger connects to a computer for real-time data logging as the experiment proceeds. All the experiments were conducted with a Thermo Scientific Lindberg Blue M TM furnace (ThermoFisher Scientific, Waltham, CA, USA).
4. Results and Discussion
The Seebeck coefficient/thermopower measures the sensitivity of a thermocouple. Separate heating and cooling experiments were conducted to determine the Seebeck coefficients of the 4 custom-made thermocouples. For the heating experiments, the furnace was heated gradually to 500 °C in a span of two hours and allowed to dwell for 15 min at this temperature. The change in voltage as temperature changes is shown in Figure 3 for all the TCs. Similarly, the change in voltage with temperature upon cooling is also shown in Figure 4. The thermopower or Seebeck coefficients determined from the slope of the voltage-temperature plots are shown in Table 2.
The TCs were then allowed to gradually cool from 500 °C to room temperature. Figure 5 depicts the cycling plots for the PG-Al TC. Upon cooling, minor variations were recorded in the Seebeck coefficients compared to the heating cycle (Table 2). These differences in the thermopower are primarily due to reversible changes in the TC which can subsequently lead to drifts caused by the reordering of crystals at the subatomic level, and on electron spin clustering [9,17].
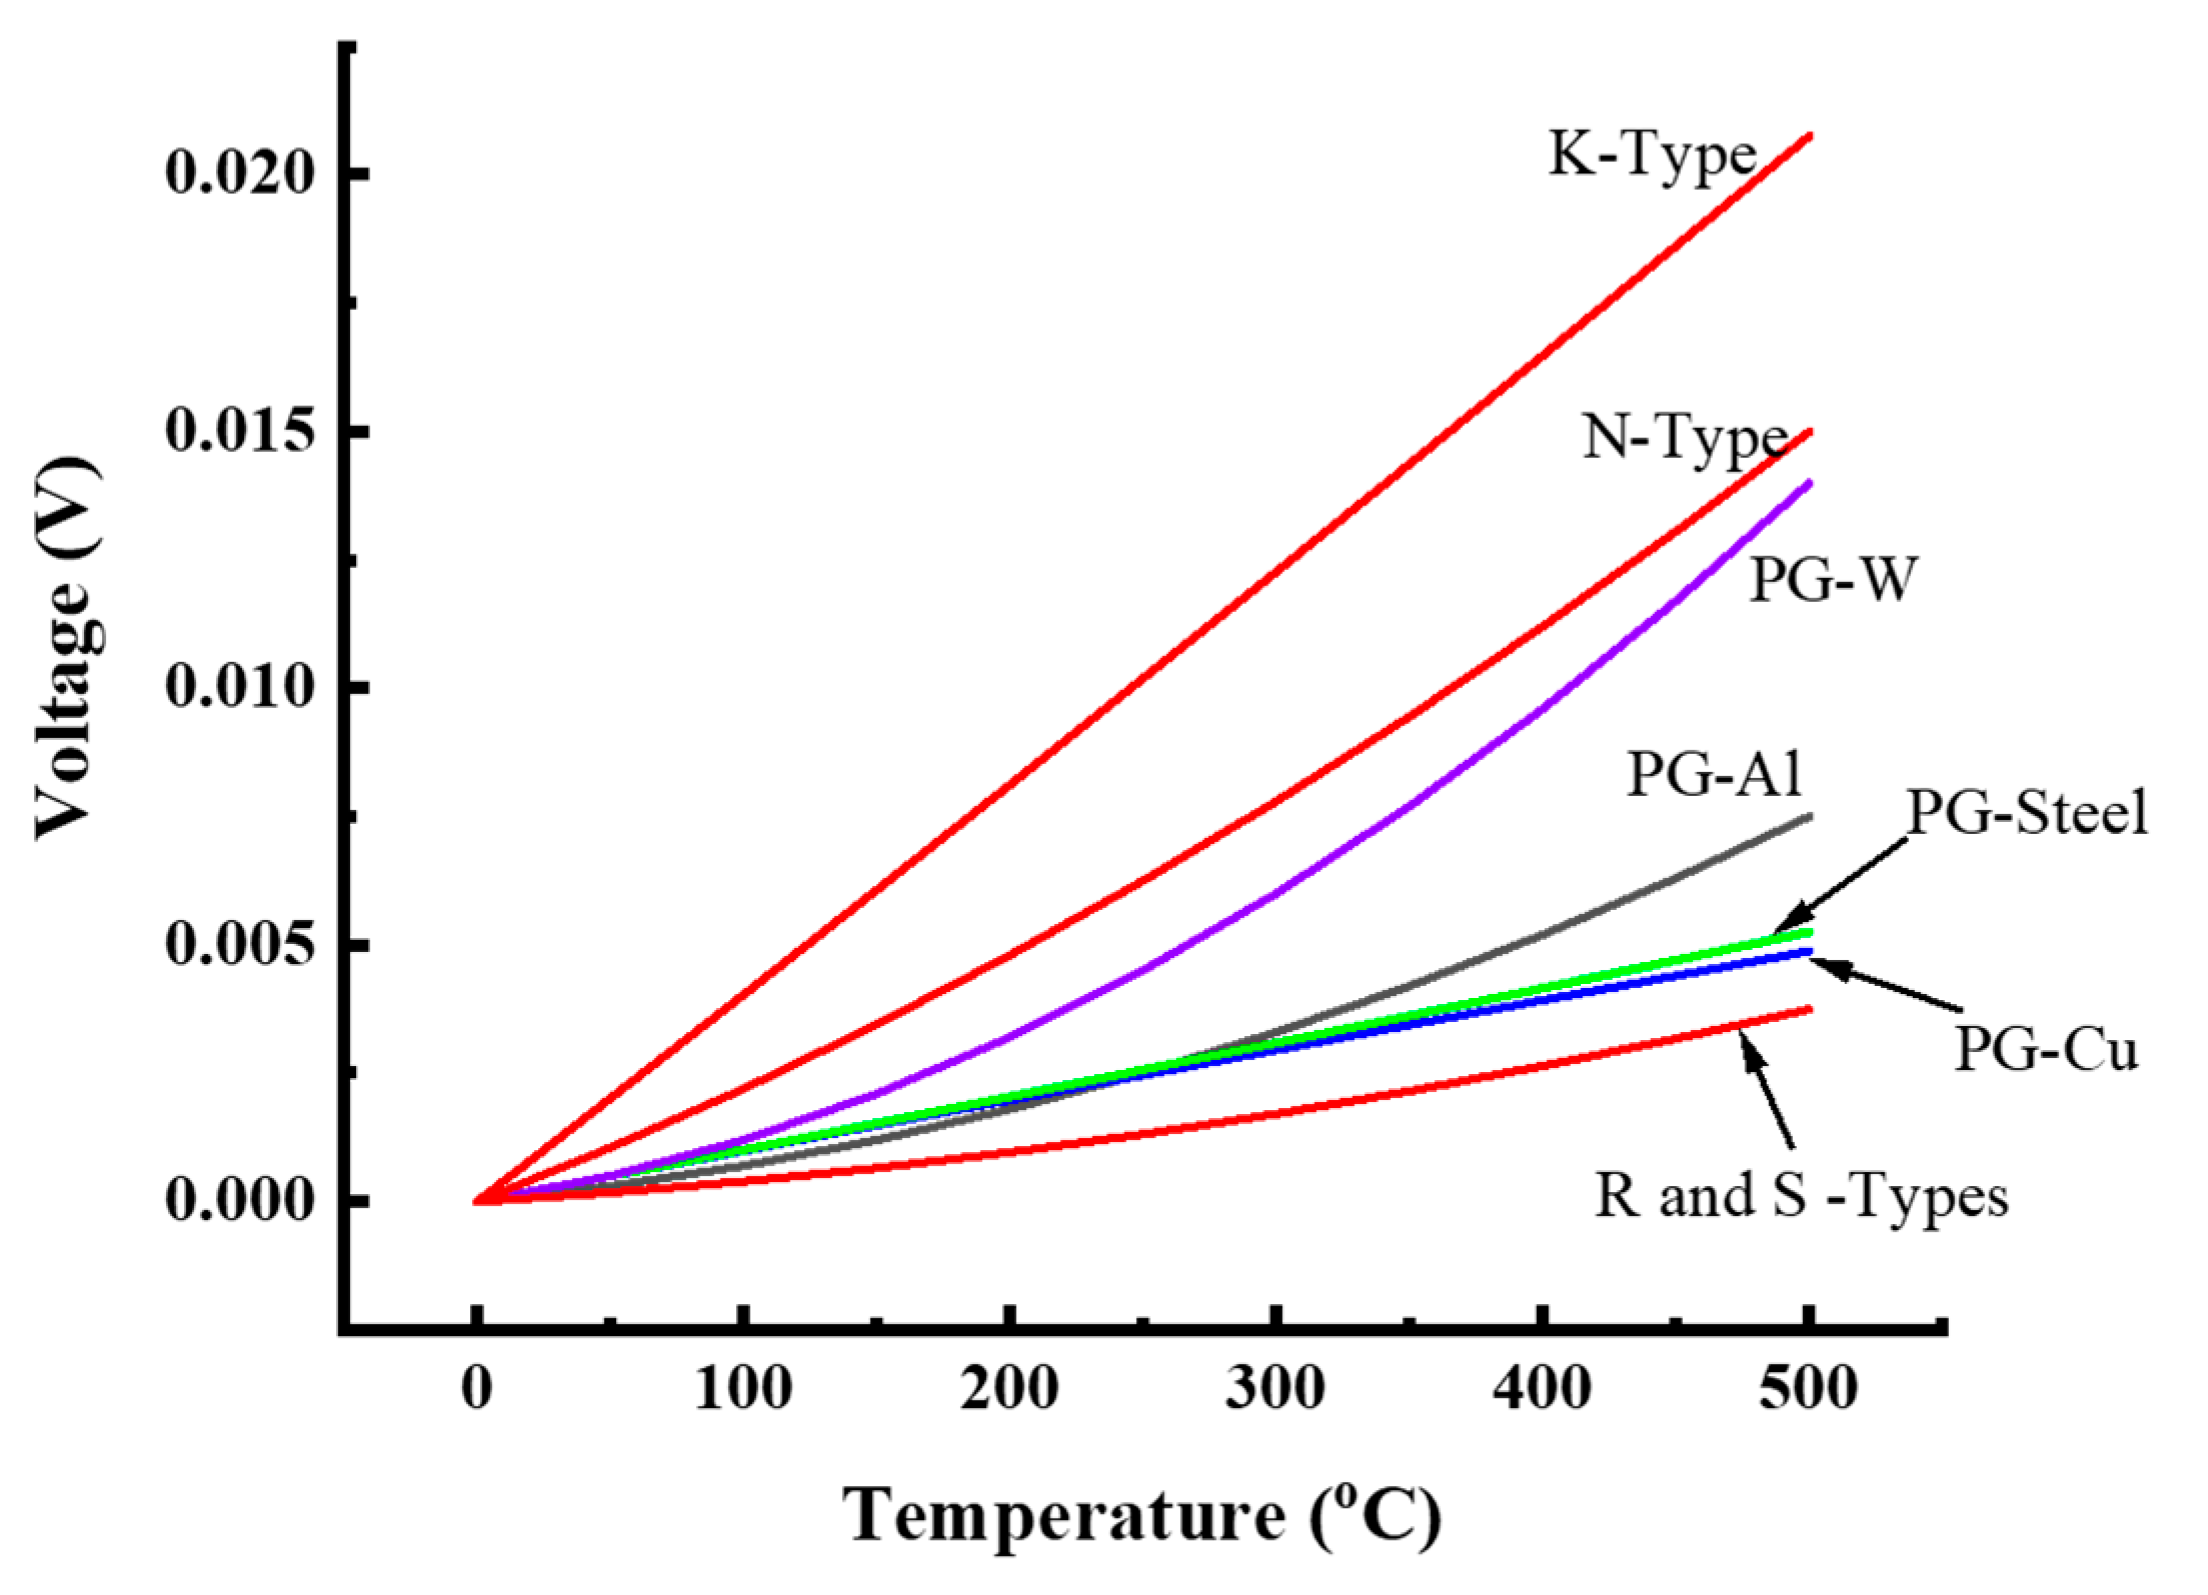
Overall, the thermopower of all four thermocouples compares favorably with some of the commercially available thermocouples (Figure 6). With the exception of the K-type which has Seebeck coefficient > 40 µV/°C [39], the N-type compares favorably with the PG-W which is the best performing TC among the custom TCs. The R and S thermocouples have Seebeck coefficients ranging between 5 and 10 µV/°C. These performances are in fact lower than the performances of the custom TCs whose Seebeck coefficients range between 14 and 26 µV/°C (see Table 2).
The custom thermocouples will favor casting industries because with the use of a graphite casting mold, the temperature differential can be estimated when molten metal of either aluminum, copper, steel, or tungsten is filling up the molds. This study will form the prequel to the next project of predicting the solidification patterns in casting molds to avoid defects.
There are also notable differences between the TCs that are worth mentioning. Between Cu, Al and Steel, the thermopower is observed to decrease with increasing thermal conductivity and electrical conductivity (=1/Resistivity) (see Table 2). W on the other hand creates an exception in the thermopower. Although low in thermal and electrical conductivity compared to Al and Cu, W registers the highest Seebeck coefficient which suggests good performance compared to its counterparts. The results show that the steel thermocouple is the low-performing TC among the thermocouples possibly because of having low thermal and electrical conductivities.
5. Summary
Designed for use in high-temperature applications, four custom thermocouples were constructed using pyrolytic graphic as base thermoelement with commercial alloys of Al, Cu, steel, and tungsten. The thermopower as measured by the Seebeck coefficient was determined in both heating and cooling experiment. The heating and cooling cycles produced similar Seebeck coefficients with only minute differences due to short-range ordering.
There were notable differences in the Seebeck coefficients of the different thermocouples due to the differences in thermal and electrical conductivities of the thermoelements. There is an observed decreasing trend in Seebeck coefficient with decreasing electrical and thermal conductivities among Cu, Al, and Steel thermocouples. An exception in the performance is seen in the PG-W TC, which records the highest thermopower with lower electrical and thermal conductivities relative to Al and Cu. The results also show that the PG-Steel thermocouple is the low-performing TC among the thermocouples with an S < 14. This possibly is due to its low thermal and electrical conductivities.
Author Contributions
A.-S.H.: Conducted the experiments and implemented the computer codes, collected and analyzed the obtained data, wrote and edited the original manuscript. B.E.H.: Facilitated the success of this project by providing all the needed resources, supervised and reviewed the manuscript. M.N.I.: Contributed substantially on the material properties, co-wrote some sections, and reviewed the draft manuscript. All authors have read and agreed to the published version of the manuscript.
Funding
This research was funded by the US Army Research Laboratory, ARL, under grant number W911NF2020163.
Institutional Review Board Statement
Not applicable.
Informed Consent Statement
Not applicable.
Data Availability Statement
Not applicable.
Acknowledgments
The authors would like to thank all the facilitators at the Montana Tech Center for Advanced Mineral, Metallurgical and Materials Processing, CAMP for the use of their facilities and analytical instruments for this project.
Conflicts of Interest
The authors declare no conflict of interest in this work. The authors also declare that some sections of this work include a comparative analysis of previously published work by same authors. The funders had no role in the design of the study; in the collection, analyses, or interpretation of data; in the writing of the manuscript, or in the decision to publish the results.
References
- Kasap, S.O. Principles of Electronic Materials and Devices; McGraw-Hill: Saskatoon, SK, Canada, 2006. [Google Scholar]
- Schön, G. Thermoelectric Effects in Superconductors; Department of Electronic Engineering University of Saskatchewan: Saskatoon, SK, Canada, 2007; pp. 342–362. [Google Scholar]
- Martin, J.; Tritt, T.; Uher, C. High Temperature Seebeck Coefficient Metrology. J. Appl. Phys. 2010, 108, 1–12. [Google Scholar] [CrossRef]
- Yilmaz, N.; Gill, W.; Donaldson, A.B.; Lucero, R.E. Problems Encountered in Fluctuating Flame Temperature Measurements by Thermocouple. Sensors 2008, 8, 7882–7893. [Google Scholar] [CrossRef] [PubMed] [Green Version]
- Abouellail, A.A.; Kostina, M.A.; Bortalevich, S.I.; Loginov, E.L.; Shinyakov, Y.A.; Sukhorukov, M.P. Mathematical Simulation of Thermocouple Characteristics. IOP Conf. Ser. Mater. Sci. Eng. 2018, 327, 022002. [Google Scholar] [CrossRef]
- Shannon, K.S.; Butler, B.W. A Review of Error Associated with Thermocouple Temperature Measurement in Fire Environments. In Proceedings of the 2nd International Wildland Fire Ecology and Fire Management Congress, Orlando, FL, USA, 16–20 November 2003; pp. 7–9. [Google Scholar]
- Webster, E.S.; White, D.R.; Edgar, H. Measurement of Inhomogeneities in MIMS Thermocouples Using a Linear-Gradient Furnace and Dual Heat-Pipe Scanner. Int. J. Thermophys. 2015, 36, 444–466. [Google Scholar] [CrossRef]
- Bhatt, H.D.; Vedula, R.; Desu, S.B.; Fralick, G.C. Thin Film TiC/TaC Thermocouples. Thin Solid Film. 1999, 342, 214–220. [Google Scholar] [CrossRef]
- Sims, C.T.; Gaines, G.B.; Jaffee, R.I. Refractory-Metal Thermocouples Containing Rhenium. Rev. Sci. Instrum. 1959, 30, 112–115. [Google Scholar] [CrossRef]
- Asamoto, R.R.; Novak, P.E. Tungsten-Rhenium Thermocouples for Use at High Temperatures. Rev. Sci. Instrum. 1967, 38, 1047–1052. [Google Scholar] [CrossRef] [Green Version]
- Walker, B.E.; Ewing, C.T.; Miller, R.R. Study of the Instability of Noble Metal Thermocouples in Vacuum. Rev. Sci. Instrum. 1965, 36, 601–606. [Google Scholar] [CrossRef]
- Pavlasek, P.; Elliott, C.J.; Pearce, J.V.; Duris, S.; Palencar, R.; Koval, M.; Machin, G. Hysteresis Effects and Strain-Induced Homogeneity Effects in Base Metal Thermocouples. Int. J. Thermophys. 2015, 36, 467–481. [Google Scholar] [CrossRef]
- Hadi, A.S.; Hill, B.E. Thermopower Determination Using Pyrolytic Graphite and Aluminum Thermocouple. Sens. Actuators A Phys. 2020, 303, 111814. [Google Scholar] [CrossRef]
- Bennett, J.; Kwong, K.S.; Powell, C.; Thomas, H.; Krabbe, R. Improving Thermocouple Service Life in Slagging Gasifiers. In Proceedings of the 22nd Annual International Pittsburgh Coal Conference 2005 (PCC 2005), Pittsburgh, PA, USA, 15–18 September 2005; Volume 3, pp. 2077–2088. [Google Scholar]
- Choi, H.; Datta, A.; Cheng, X.; Li, X. Microfabrication and Characterization of Metal-Embedded Thin-Film Thermomechanical Microsensors for Applications in Hostile Manufacturing Environments. J. Microelectromech. Syst. 2006, 15, 322–329. [Google Scholar] [CrossRef]
- Hadi, A.S.; Hill, B.E. Custom Pyrolytic Graphite–Steel Thermocouple for High-Temperature Measurements. In TMS 2019 148th Annual Meeting & Exhibition Supplemental Proceedings; Springer International Publishing: New York City, NY, USA, 2019; pp. 413–420. [Google Scholar]
- Pollock, D.D. Thermocouples: Theory and Properties; CRC Press: Boca Raton, FL, USA, 1991. [Google Scholar]
- Hadi, A.S.; Lann, J.; Fricks, T.; Hill, B.E. Pyrolytic Graphite-Copper Thermocouple for Non-Invasive Direct Temperature Measurement. Adv. Ceram. Environ. Funct. Struct. Energy Appl. II 2019, 266, 39–48. [Google Scholar]
- Tougas, I.M.; Gregory, O.J. Thin Film Platinum-Palladium Thermocouples for Gas Turbine Engine Applications. Thin Solid Film. 2013, 539, 345–349. [Google Scholar] [CrossRef]
- Webster, J. Electrocaloric Effect: Theory, Measurements, and Applications; Wiley Encyclopedia of Electrical and Electronics Engineering: Hoboken, NJ, USA, 2015. [Google Scholar]
- Drebushchak, V.A. Universality of the Emf of Thermocouples. Thermochim. Acta 2009, 496, 50–53. [Google Scholar] [CrossRef]
- Slack, G.A. Anisotropic Thermal Conductivity of Pyrolytic Graphite. Phys. Rev. 1962, 127, 694–701. [Google Scholar] [CrossRef]
- Taylor, R. The Thermal Conductivity of Pyrolytic Graphite. Philos. Mag. 1966, 13, 157–166. [Google Scholar] [CrossRef]
- Hoi, Y.M.; Chung, D.D. Flexible Graphite as a Compliant Thermoelectric Material. Carbon 2002, 40, 1134–1136. [Google Scholar] [CrossRef]
- Savvatimskiy, A. Carbon at High Temperatures; Springer: Berlin/Heidelberg, Germany, 2015. [Google Scholar]
- Luo, X.; Chugh, R.; Biller, B.C.; Hoi, Y.M.; Chung, D.D. Electronic Applications of Flexible Graphite. J. Electron. Mater. 2002, 31, 535–544. [Google Scholar] [CrossRef]
- Chung, D.D. Flexible Graphite for Gasketing, Adsorption, Electromagnetic Interference Shielding, Vibration Damping, Electrochemical Applications, and Stress Sensing. J. Mater. Eng. Perform. 2000, 9, 161–163. [Google Scholar] [CrossRef]
- Prabhu, K.N.; Suresha, K.M. Effect of Superheat, Mold, and Casting Materials on the Metal/Mold Interfacial Heat Transfer during Solidification in Graphite-Lined Permanent Molds. J. Mater. Eng. Perform. 2004, 13, 619–626. [Google Scholar] [CrossRef]
- ASM International. Properties and Selection: Nonferrous Alloys and Special-Purpose Materials. In ASM International Handbook; Version 2; ASM International: Phoenix, AZ, USA, 1990; Volume 2, p. 1300. [Google Scholar]
- Issahaq, M.N.; Chandrasekar, S.; Trumble, K.P. Single-Step Shear-Based Deformation Processing of Electrical Conductor Wires. J. Manuf. Sci. Eng. 2021, 143, 1–9. [Google Scholar] [CrossRef]
- Reed-Hill R, A.R. Physical Metallurgy. Phys. Metall. Princ. 1991, 3, 2215–2290. [Google Scholar]
- Davis, J.R. Copper and Copper Alloys. In ASM Specialty Handbook-Copper and Copper Alloys; ASM International: Phoenix, AZ, USA, 2001; pp. 457–494. [Google Scholar]
- Asting, A.V. Copper Wire Tables, Google-Digitized; US Government Printing Office: Washington, DC, USA, 1956. [Google Scholar]
- Snyder, G.J.; Snyder, A.H. Figure of Merit ZT of a Thermoelectric Device Defined from Materials Properties. Energy Environ. Sci. 2017, 10, 2280–2283. [Google Scholar] [CrossRef]
- Washko, R.S.; Aggen, G. Steels. In Properties and Selection: Irons, Steels, and High-Performance Alloys; ASM International: Phoenix, AZ, USA, 2018; Volume 1, pp. 841–907. [Google Scholar]
- Ciulik, J.R.; Shields, J.A.; Kumar, P.; Todd Leonhardt, J.L. Properties and Selection of Powder Metallurgy Refractory Metals. Powder Metall. 2018, 7, 593–598. [Google Scholar]
- Schmidt, F.F. The Engineering Properties of Tungsten and Tungsten Alloys; Defense Documentation Center: Alexandria, VA, USA, 1963. [Google Scholar]
- Thomas, D.B. Studies on the Tungsten-Rhenium Thermocouple to 2000 °C. Eng. Instrum. 1963, 67, 337. [Google Scholar] [CrossRef]
- Maxim Integrated. MAX31855 Cold-Junction Compensated Thermocouple-to-Digital Converter; Datasheet; Maxim Integrated: San Jose, CA, USA, 2015. [Google Scholar]
- Duff, M.; Towey, J. Two Ways to Measure Temperature Using Thermocouples Feature Simplicity, Accuracy, and Flexibility. Analog Dialogue 2010, 44, 1–6. [Google Scholar]
- ASM International. Properties and Selection: Irons, Steels, and High-Performance Alloys. In ASM International Handbook; Version 1; ASM International: Phoenix, AZ, USA, 2018. [Google Scholar]
Figure 1.
Images showing (a) the SEM micrograph of PG and (b) the EDAX spectrum of single peak carbon. The inset in (b) is the weight and atomic fractions of carbon in graphite.
Figure 1.
Images showing (a) the SEM micrograph of PG and (b) the EDAX spectrum of single peak carbon. The inset in (b) is the weight and atomic fractions of carbon in graphite.

Figure 2.
Sectional drawing of the thermocouple type used.

Figure 3.
Voltage-temperature plots for (a) PG-Al, (b) PG-Cu, (c) PG-Steel, and (d) PG-W TCs obtained from experimental data upon heating to 500 °C.
Figure 3.
Voltage-temperature plots for (a) PG-Al, (b) PG-Cu, (c) PG-Steel, and (d) PG-W TCs obtained from experimental data upon heating to 500 °C.

Figure 4.
Voltage-temperature plots for (a) PG-Al, (b) PG-Cu, (c) PG-Steel, and (d) PG-W TCs obtained from experimental data upon cooling from 500 °C to room temperature.
Figure 4.
Voltage-temperature plots for (a) PG-Al, (b) PG-Cu, (c) PG-Steel, and (d) PG-W TCs obtained from experimental data upon cooling from 500 °C to room temperature.

Figure 5.
Cycling plots for (a) voltage differentials and (b) the temperature differentials for PG-Al TC.
Figure 5.
Cycling plots for (a) voltage differentials and (b) the temperature differentials for PG-Al TC.
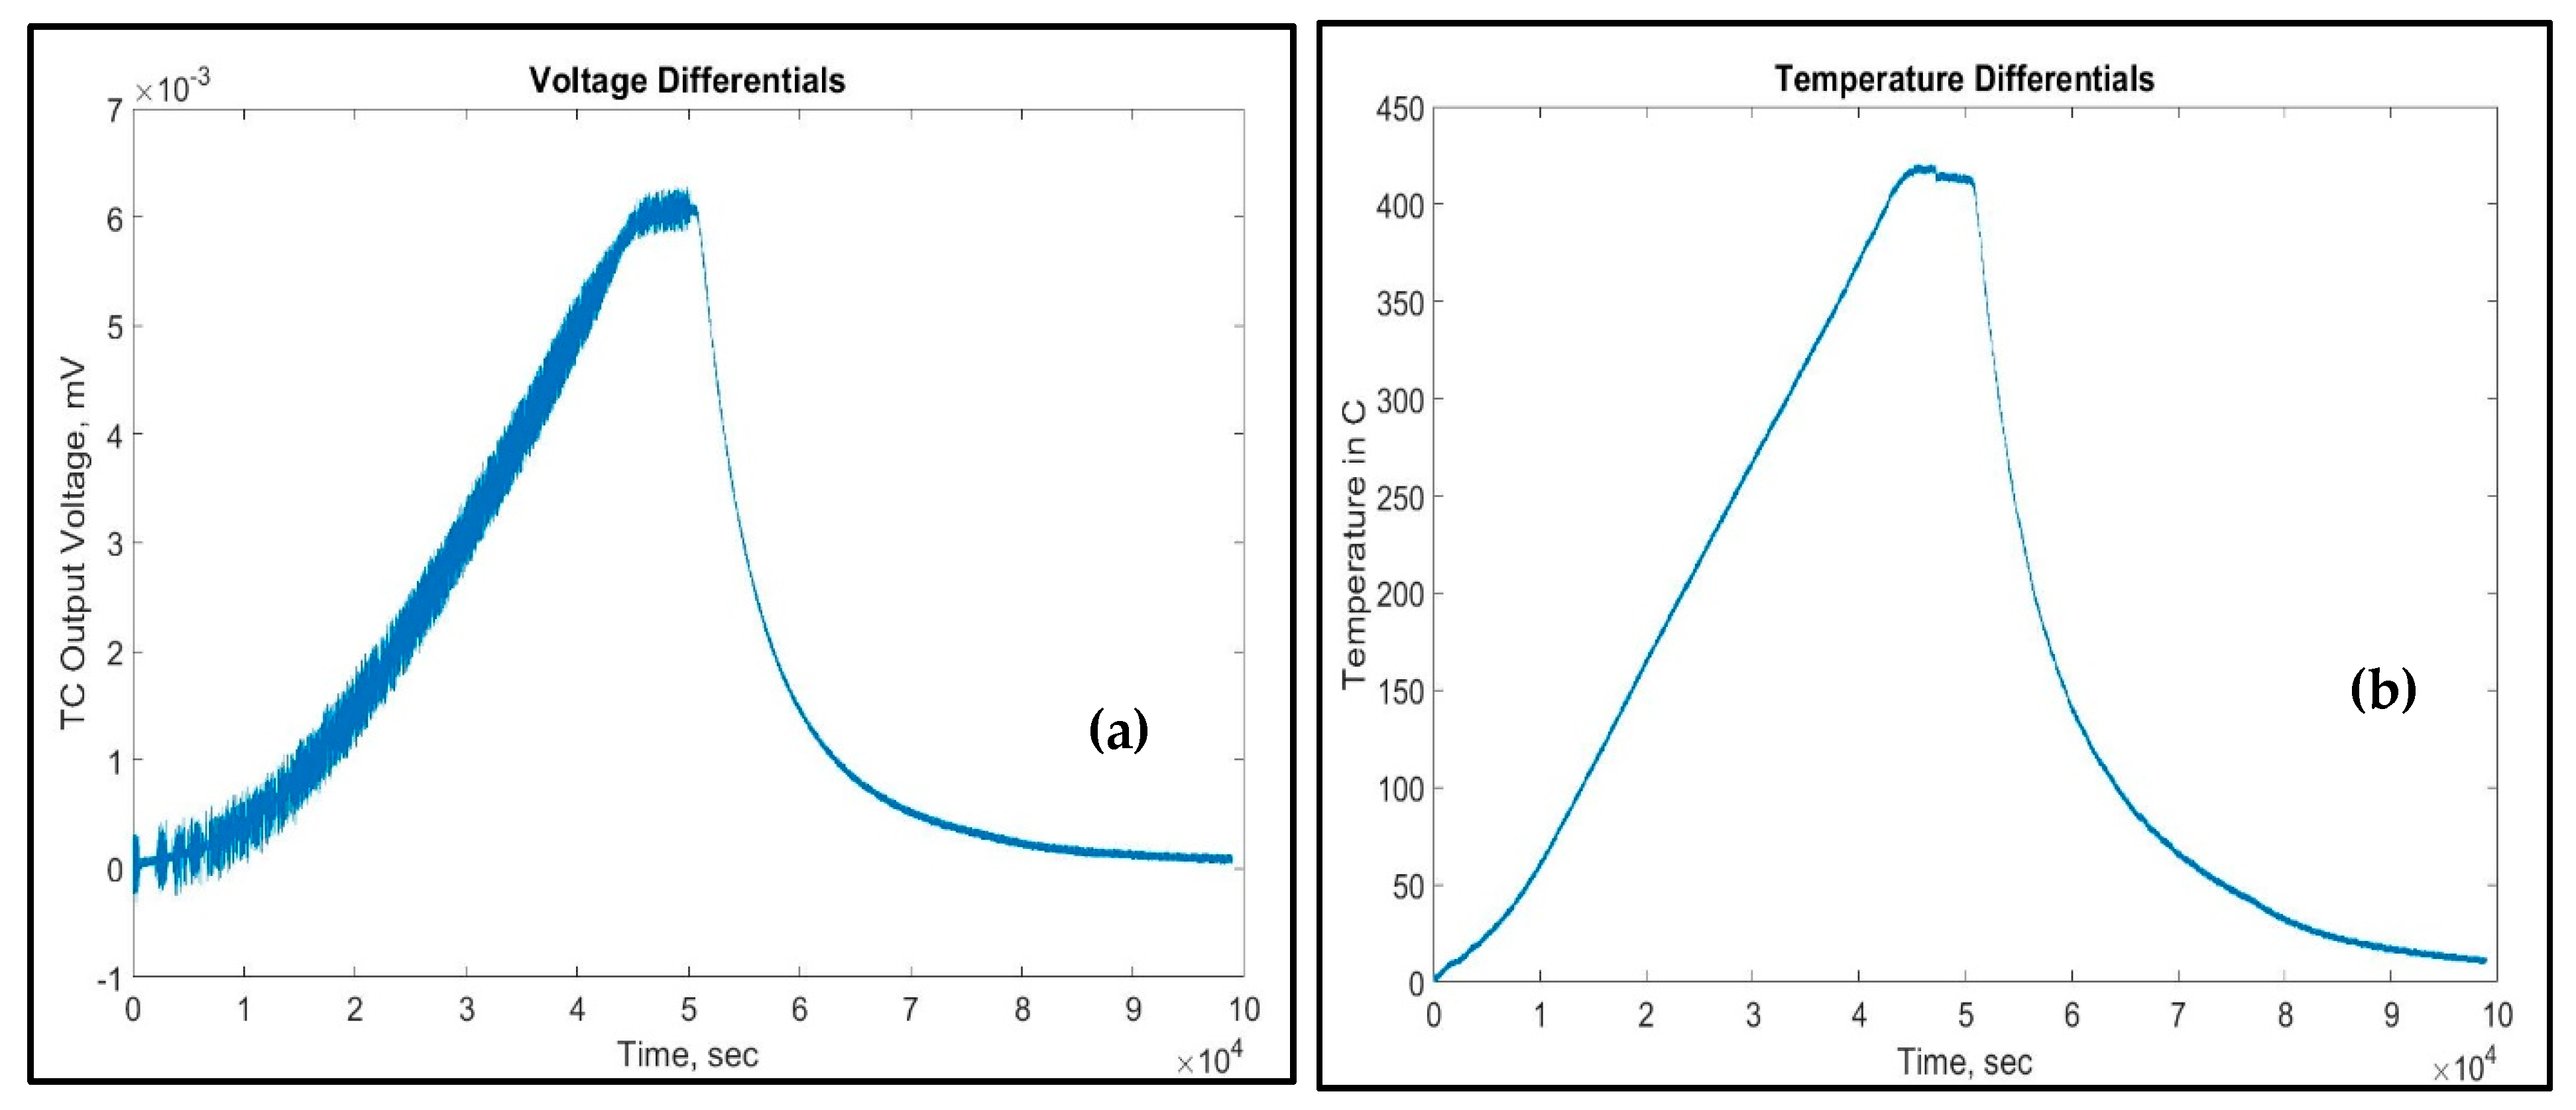
Figure 6.
Voltage-temperature plots comparing the custom-designed thermocouples to the commercial K, N, R, and S-types. The commercial TCs are colored “red” for distinction. With the exception of the K-type, the N-type compares favorably with the PG-W which is the best performing TC among the custom TCs. Data for the commercial TCs are from [40].

Table 1.
Chemical composition of the thermoelements determined from EDAX analysis.
| Composition | Al | Cu | Steel | W | |
|---|---|---|---|---|---|
| Fe | C | ||||
| Main element (wt%) | 97.89 | 100 | 95.47 | 3.34 | 89.31 |
| Other (wt%) | 2.11 | 0 | 1.19 | 10.63 | |
Table 2.
Summary of Seebeck coefficients under heating and cooling cycles in relation to the thermal and electrical properties of the thermoelements [28,34,41].
| Material | Tm (°C) | Thermal Conductivity (W/m·K) | Electrical Resistivity (Ω·m) | Seebeck Coefficient, µV/°C | R2 Value | |
|---|---|---|---|---|---|---|
| Heating | Cooling | |||||
| Al | 660 | 243 | 2.67 × 10⁻⁸ | 15.8 | 14 | 0.96 |
| Cu | 1083 | 391 | 1.71 × 10⁻⁸ | 18.8 | 17.7 | 0.91 |
| Steel | 1400 | 21.5 | 7.40 × 10⁻⁷ | 13.8 | 14 | 0.89 |
| W | 3180 | 155 | 5.30 × 10⁻⁸ | 26 | 24.2 | 0.98 |
Publisher’s Note: MDPI stays neutral with regard to jurisdictional claims in published maps and institutional affiliations. |
© 2021 by the authors. Licensee MDPI, Basel, Switzerland. This article is an open access article distributed under the terms and conditions of the Creative Commons Attribution (CC BY) license (https://creativecommons.org/licenses/by/4.0/).
Share and Cite
MDPI and ACS Style
Hadi, A.-S.; Hill, B.E.; Issahaq, M.N. Performance Characteristics of Custom Thermocouples for Specialized Applications. Crystals 2021, 11, 377. https://doi.org/10.3390/cryst11040377
AMA Style
Hadi A-S, Hill BE, Issahaq MN. Performance Characteristics of Custom Thermocouples for Specialized Applications. Crystals. 2021; 11(4):377. https://doi.org/10.3390/cryst11040377
Chicago/Turabian StyleHadi, Abdul-Sommed, Bryce E. Hill, and Mohammed Naziru Issahaq. 2021. "Performance Characteristics of Custom Thermocouples for Specialized Applications" Crystals 11, no. 4: 377. https://doi.org/10.3390/cryst11040377
Note that from the first issue of 2016, this journal uses article numbers instead of page numbers. See further details here.