
Temperature Effect on the Deformation Behavior in Nanocrystalline Magnesium under Compression: An Atomistic Study
School of Material Science and Engineering, Shanghai Institute of Technology, Haiquan Road 100, Shanghai 201418, China
*
Authors to whom correspondence should be addressed.
Crystals 2023, 13(10), 1479; https://doi.org/10.3390/cryst13101479
Submission received: 15 September 2023
/
Revised: 7 October 2023
/
Accepted: 9 October 2023
/
Published: 11 October 2023
(This article belongs to the Special Issue Corrosion and Mechanical Performance of Magnesium Alloys)
Abstract
:The classic molecular dynamics (MD) simulation approach has been used to investigate the microstructure change in polycrystalline magnesium (Mg) during compressive deformation at various temperatures. At low temperatures, there exists a competition between the sliding of Shockley partial dislocation (SPD) and perfect <a> dislocation. Abundant dislocation behaviors such as dislocation bundle and double cross slipping are observed. With a temperature increase, the dislocation sliding is hindered by the newly formed grain boundaries (GBs). The grain reorientation should be the compensatory mechanism for plastic deformation at high temperatures. Furthermore, dynamic recrystallization (DRX) is found at the highest temperature investigated. For all the temperature cases studied, twinning is unsensitive against applied compressive stress. The results of this work may help to understand the temperature effect on the mechanism in polycrystalline Mg under compressive deformation.
1. Introduction
A lot of experimental and simulation studies have investigated single-crystalline Mg to understand its fundamental deformation mechanism [1,2,3,4,5,6,7,8]. Depending on the deformation mode, temperature and orientation, it is widely accepted that the main deformation mechanisms of Mg are dislocation sliding and twinning. The typical slidings are on the basal {0002} [1], the prismatic {100} [2] as well as the pyramidal {112}, {011} and {102} planes [2,3,4]. Twinning generally is of tensile or compressive nature, i.e., whether the loading leads to elongation or reduction in the c-axis length, namely, the tension twins on the {102} [6,7], {111} [6,7,8] and the compression twins on the {101} [1] and {112} [8] planes. Changes in crystal orientation and nucleation of defects including twin boundary (TB) and dislocation during deformation have been extensively researched using sophisticated experimental apparatus and methods such as the electron back-scattering diffraction (EBSD) analyzing technique or transmission electron microscopy (TEM) observation with atomistic resolution [9,10,11,12,13]. Moreover, it could be that not only one mechanism dominates during the deformation process, for instance, Kim et al. [9] carried out uniaxial micro-compression experiments on single crystalline Mg along the [110] direction and observed various deformation mechanisms including twinning, crystal reorientation and dislocation sliding. Furthermore, many researchers also focus on the dislocation–dislocation [9,14], dislocation–twin [15,16] and twin–twin [17,18] interactions.
However, polycrystal Mg and its alloys are more widely applied than single-crystal Mg in practice. Their advantages in mechanical properties, such as low density and remarkable specific strength and stiffness, make them promising alternatives to steel and other heavy metals [19,20], for instance, notably, in structural components used in the automotive industry [21,22]. Due to the existence of GBs, the deformation mechanism in the polycrystal nature of Mg is more complicated. Recently, more attention has been paid to nanocrystalline Mg and its alloys because of their obviously improved mechanical properties including higher yield stress and ductility, depending on various fabrication processes [23,24,25]. Among them, many studies focus on the effect of grain size, for instance, Cepeda-Jiménez et al. [26] suggested that intergranular compatibility becomes increasingly difficult with decreasing grain size, which leads to a reduction in work hardening and ductility. Valle et al. [27] showed that the grain size refinement can cause a strong decrease in the hardening rate of AM60 Mg alloy processed with equal channel angular pressing. Furthermore, it is well known that temperature has a significant influence on the deformation mechanism. A lot of experimental studies have been conducted to determine the temperature effect in polycrystalline Mg and its alloys. Ichiro [28] studied temperature dependence on the plastic deformation and fracture behavior of AZ31 Mg alloy under uniaxial and biaxial compressions. Chapuis and Liu [29] investigated temperature dependence on the deformation mechanism in a rolled Mg-3Al-1Zn alloy under compression and reported that above 150 °C, the critical resolved shear stress (CRSS) for {102} tension twinning, basal, prismatic and pyramidal <c+a> slip and GB sliding have strong dependency on the temperature and rolling direction. Recently, Mohapatra et al. [30] reported the grain growth behavior of extruded pure Mg from 300 °C to 450 °C; they observed a normal grain growth behavior at both high and low temperatures but abnormal grain growth at intermediate annealing temperatures. However, there still exists a debate over which mechanism will be activated at different temperatures.
In the area of MD simulation, only a few studies investigated polycrystalline Mg and its alloys rather than single-crystal Mg. At the early stage, the simulations of polycrystalline Mg were often performed in bicrystallite [31] or 2D polycrystalline Mg [32]. Moitra et al. [33] investigated five different 3D nanocrystalline Mg samples with different grain size under tensile loading. The authors suggested grain size softening to grain size hardening with grain size decreasing. Recently, Hasan et al. [34] studied the grain size effect on the mechanical behavior of 3D nanocrystalline Mg and reported a gradual transition from a dislocation-based to a GB-based deformation mechanism with grain size decreases. Furthermore, the authors also suggested that 10 nm should be the critical grain size for the inverse Hall–Petch relationship. Regarding the literature review, we may conclude that most MD studies focused on nanocrystalline Mg since they exhibit better mechanic properties than coarse-grained ones, which could be attributed to the higher fraction of grain boundary atoms. However, the temperature effect on the mechanical behavior of nanocrystalline Mg, which might be also critical to its deformation mechanism, was rarely investigated, at least in the atomistic simulation area.
In the present work, we study the microstructure change in a polycrystalline Mg sample containing four crystallites under compression at various temperatures. The dislocation behavior will be analyzed and discussed regarding dependency on stacking fault energy (SFE). We also attempt to check whether twinning is sensitive to compressive deformation. Finally, the grain reorientation and DRX at high temperatures will be analyzed and discussed. The results of this work may help to understand the temperature effect on the mechanism in polycrystalline Mg under compressive deformation.
2. Simulation Method
A 3D nanocrystalline Mg sample containing four randomly orientated grains was prepared using the Voronoi mosaic method implemented in the software ATOMSK (version: Beta-0.11.2, P. Hirel, Lille, France) [35]. The dimension of the sample was approximately 30 nm× 30 nm × 60 nm, containing around 2.3 million atoms. Due to the characteristic of this method, the GBs were straight after direct construction, as shown in Figure 1a,b. Periodic boundary conditions (PBCs) were set in all three directions to realize the bulk character. The Mg atoms interact with each other with the embedded atom method (EAM) potential developed by Liu [36], which is in accordance with the density function theory and experimental results in lattice constants, cohesive energy, elastic constants and SFEs [37].
The equilibrium was performed in isothermal–isobaric (NPT) ensembles at desired temperatures of 300, 400, 500 and 600 K, respectively. The pressures in all three directions were controlled to zero. During the equilibrium, the straight GBs become curved and “rough” similar to GB morphology in reality, c.f., Figure 1b,c [38,39]. It is assumed that the GB atoms often diffuse through the interfaces, which leads to reorientation to satisfy the energetically favored status (minimized energy) [40,41]. Regarding the grain shape as cubic, for the 300 K case, the four-grain sizes are, respectively, 25.8, 23.7, 23.6 and 22.0 nm, corresponding to a mean grain size of 23.8 nm. For the other temperatures, the grain sizes are similar with a tiny increase due to thermal expansion. In Figure 1d, the atoms are removed and only the so-called “defect mesh” and a large number of residual dislocations associated with the GBs [34] are shown. Using the dislocation extraction algorithm (DXA) [42], the input crystal is divided into “good” and “bad” regions. The “good” crystal region evolves a perfect lattice, stacking faults (SFs), twin boundaries (TBs) and coherent GBs. In contrast, where the atomic arrangement does not resemble a perfect crystal, for instance, the dislocation cores, outer surface, voids within the crystal and incoherent GBs, etc., will be detected as “bad” regions. Thus, the red defect meshes in Figure 1d,e correspond to incoherent GBs and the “holes” in the defect meshes are coherent parts of the GBs. It is important to note that the residual dislocations are not the consequence of plastic deformation. Within the crystallites, it is defect-free. For the temperatures given from 300 to 600 K with 100 K increment, the initial dislocation densities ρdis = Ldis/V, where Ldis is the total dislocation length and V is the volume, showing a strong decrease with a temperature increase. It could be summarized that with a temperature increase, the dislocation density associated with the GB decreases. It might be that higher thermal energy provides the necessary interface energy to form the incoherent GBs, which are detected as “defect mesh” with the DXA [42]. Roger et al. [43] studied the semi-coherent Cu-Ag phase boundary using Monte Carlo simulation and reported a transition from a semicoherent to an incoherent interface with a temperature increase. The authors attribute the loss of the misfit dislocations to thermal disordering, which is in good agreement with our observation.
After the relaxation, the samples were compressed in NPT ensembles at the desired temperatures along their z-axes with a strain rate of 1 × 10⁹ s−1, which means that the simulation box length in the z-direction shrank by 0.1% every picosecond. The compressions were performed until a strain of 40% was reached.
The modeling and simulation were performed using the open-source MD code LAMMPS [44]. Visualization software OVITO (version: 3.7.11, A. Stukowski, Darmstadt, Germany) [45], in which adaptive common neighbor analysis (a-CNA) [46], DXA [42], polyhedral template matching (PTM) [47] and grain segmentation (GS) are implanted, was used to analyze the local crystalline structure, dislocation and grains with different orientations.
3. Results and Discussion
3.1. Stress–Strain Curves
Figure 2 shows the stress–strain curves of the samples compressed at different temperatures. With temperature increasing, the elastic modulus and the flow stress decrease. Qi et al. [48] studied the mechanical behavior of single-crystal Mg under c-axis tension and reported the same tendency. The authors attributed this to the alternation of {100} and {102} TBs at low temperatures and the non-basal plane slip at high temperatures. Liu et al. [49] tested the stress–strain curves of AZ31 Mg alloy, and a similar tendency was reported. Here, the flow stress at 300 K could be compared with the results of the polycrystal Mg with an average grain size of 25 nm (in our case 23.8 nm) from the simulation work by Hasan et al. [34] using the Wilson–Mendeleev potential [50]. Our value of 1.30 GPa is lower than the around 2.1 GPa reported. On one side, it may be ascribed to the different potentials used, and on the other side, the applied strain rate plays a critical role. It is well known that the flow stress drops with a deformation rate increase, not only in the Mg system [51,52] but also in other metallic systems such as copper (Cu) [53]. Note that our compression rate (1 × 10⁹ s−1) is ten times lower than that in the work of Hasan et al. Once the flow stress is reached, the stresses are rapidly relaxed and fluctuate, indicating microstructure changes in the plastic region.
3.2. Dislocation and Twin Behavior
Figure 3 shows the change in the <a> dislocation (Burgers vector 1/3<110>) density and the atomic fraction of the fcc atoms during the compression process. The <c+a> dislocations are rarely found in the whole sample. This is logical since at room temperature, the <c+a> dislocations are strongly inhibited due to insufficient thermal activation. The <a> dislocation density decreases firstly at low strains. Hasan et al. [34] also found such a decrease in total dislocation density at the beginning of deformation and attributed this to dislocation annihilation within the elastic region. At a strain of around 3%, the <a> dislocation starts to increase. The <a> dislocations nucleate at the GBs and further grow across the whole crystallite. Figure 4a shows the first nucleation of an <a> dislocation at a strain of 3.6% detected with the DXA and a-CAN at a temperature of 300 K. We may suggest that the <a> dislocations glide on the {0001} basal plane, since this is the most common mechanism during deformation in hexagonal closest packed (hcp) metals [1,34,54]. Simultaneously, Shockley partial dislocations (SPDs) with a Burgers vector of 1/3<100> nucleate at the GBs and glide, carrying the SF (identified as fcc structure), as shown as the part in the green circle in Figure 4b. It is worth mentioning that the difference between the fcc and hcp structure is only the stacking sequence, so the SF and TB in the hcp structure will be identified as two- and one-atom layer(s), and vice versa [55]. With the movement of the SPDs, they will disappear at the adjacent GBs. The detailed process will be discussed later. Furthermore, in addition to direct nucleation, the 1/3<100> SPDs can be also generated by splitting of a full <a> dislocation, which is connected by the intrinsic SF zone, as shown in the zoomed area in Figure 4b. The relationship among the Burgers vectors can be written as:
Such decomposition of the <a> dislocations is also found at other higher temperatures.
The behavior of SPDs should be analyzed in detail. Here, we stay at the temperature of 300 K because at higher temperatures, the thermal vibration and the dynamically recrystallized crystallites may disturb the dislocation analysis. In Figure 5a–e, we traced an SPD with a Burgers vector of 1/3<100>. The SPD denoted as SPD1 nucleates at a GB, or more exactly, at the juncture between the twin part and incoherent part on the GB, as shown in Figure 5a. This nucleation position is not unexpected since the junctural position provides the necessary structure and energy fluctuation for the new defect. This has been reported in many studies [33,56,57] but differs from the results of ref. [34] with a crystallite interior nucleation. With a strain increase, the SPD1 begins to glide on one {0001} plane carrying SF behind it, as shown in Figure 5b. Due to the PBC, the SF is split into two images in positive and negative y directions, i.e., the black lines in Figure 5c,d indicate the same position. It can be clearly observed in Figure 5d that the SPD1 reached the other side of the crystallite and annihilated. In Figure 5c, it can be also seen that another SPD, denoted as SPD2, also nucleates and glides along the same path as the SPD1 with the elimination of the SF left by the gliding of the SPD1. Once the SPD2 also arrives at the other side of the crystallite, as shown in Figure 5e, both the SPD2 and the SF will disappear. Processes similar to this take place in many positions of the whole sample, which causes the fluctuation in the fcc phase fraction curve in Figure 2. Since there is still a large amount of 1/3<100> SPDs in the form of residual dislocation associated with the GBs, and it is hard to distinguish them from the ones that slide, it is wise to count the fraction of the fcc atoms (SFs) to identify the SPD gliding rather than the dislocation density. Furthermore, the <c+a> dislocations are rarely found during the whole compression process. They are mostly residual dislocations associated with the GBs and do not move. Jóni et al. [58] carried out tension experiments at room temperature, 473 K and 673 K on AZ31-type-extruded Mg alloy samples. In their work, the dominated dislocations found were the <a> type, only with a smaller fraction of <c+a> type dislocations, which is in accord with our simulation results.
Interestingly, the peaks in the <a> dislocation density curve always correspond to the bottom of the fcc atom fraction curve in Figure 3. Here, we may suggest that there should be a competitive process between the full <a> dislocation and the SPD sliding. Once the <a> sliding is hindered, it can decompose to two 1/3<100> SPDs for further sliding (energetically 30% favor than pure <a> sliding). The two 1/3<100> SPDs can also combine to a full <a> dislocation, c.f., Figure 4b. Thus, we conclude that the nucleation-sliding (with SF)-annihilation of the 1/3<100> SPD should be the main competitive process against <a> dislocation sliding. In Figure 5f, we analyzed the structure of the SF. In the upper subfigure, it can be clearly observed the sliding of the SPD on the basal plane changes the stacking sequence from …ABABAB… to ABABCACA…, namely, the basal I2 intrinsic SF, which is typical for SPD sliding on the basal plane [1,59]. He et al. [60] performed cold rolling of a Mg-Bi alloy and also found that a perfect <a> dislocation decomposes two SPDs (corresponding to our Equation (1)) bounding an I2 SF. Furthermore, it is well known that twinning is also an important mechanism underlying Mg deformation at room temperature. Previous studies [61,62] related to Mg suggested that {102} twins are formed under tensile stress along the c-axis, while {101} twins accommodate c-axis compression strain. Since the crystallites in our sample are randomly oriented and compressed, there must exist compressive components along the c-axis. Indeed, {101} TBs are observed in our sample. In the lower subfigure in Figure 5f, the distances between two atoms and the angle among atoms A, B and C (theoretically 60°) are measured to identify the crystal direction. However, this kind of TB is only found at some unique positions during the whole deformation process, as well as for the samples at other temperatures. Thus, we may conclude that in our case, twinning is only a minor deformation mechanism compared with dislocation movement.
Increasing the strain over 5%, abundant dislocation behaviors could be observed in the sample at the temperature of 300 K. For instance, the dislocation bundles in Figure 6a–d display this process. When a segment or more segments of the precursory SPD1 is/are locally hindered, the width between two SPDs will be smaller, i.e., under external shear force, the SPD2 overtakes this(these) segment(s) of SPD1 and forms the dislocation bundle(s), as shown in Figure 6a–c. In our case, the dislocation bundle even concentrates to an <a> full dislocation, as shown in Figure 6d. Here, we should mention that the formation of the dislocation bundle depends strongly on the stacking fault energy (SFE). The SFE (I2 type with ABABCACAC structure, c.f. Figure 5f) given by the potential used is 54 mJ/m−2 [36], which is very close to the experimental result [36].
Interestingly, we also found that based on the SPD reaction, the dislocation multiplication can also take place by a double-cross mechanism. This might be another variation of the classical “jog pair” cross-slip mechanism [63,64]. This mechanism describes such a process: if two SPDs, denoted as 1 and 2 in Figure 6e, slipping on the closest-packed plane (the plane I in Figure 6e) leave their slip plane, they must combine to a full screw dislocation <a> and change the slip plane by cross slip. Here, it should be mentioned that with the “jog pair” mechanism, the new slip plane is parallel to the original one. On the new slip plane, the full dislocation <a> combined splits again into two SPDs and causes further slipping. In our case, the full dislocation <a>, combined by SPD 1 and 2, splits into four SPDs (denoted as 3, 4, 5 and 6 in Figure 6e,f) rather than two and slips on two parallel closest-packed basal planes (denoted as plane II and III in Figure 6e–g). The cross slip of SPD is much more difficult than that of the full dislocation and depends on the SFE. With the SFE decrease, the distance between two SPDs becomes larger, and the dislocation bundle formation is more difficult as well as the cross slip. Thus, we may suggest again that the SFE of 54 mJ/m−2 [36], given by the potential used, is a reasonable value. Furthermore, Wang et al. [65] compressed an Mg-Ca-Zn alloy and found a cross slip between the basal and prismatic planes, which differs from the classical “jog pair” mechanism and our observation that the two SPDs cross slip on two basal planes. However, it should be pointed out that compared with the “jog-pair” mechanism, the <a> type dislocations from the basal plane on the hard plasmatic plane require normally large stresses or high temperatures [66]. This might be the reason why this “basal-prismatic” cross slip was not observed in our simulation.
After increasing the temperature, no obvious <c+a> dislocations were found in the sample during the whole compression. Since it is well-known that the <c+a> pyramidal dislocation should be activated at high temperatures [67], this result is unexcepted. Kim et al. [56] studied GB-induced nucleation and afterward motion of 1/3{100}<23> and 1/3{22}<23> pyramidal <c+a> dislocations. However, the authors created a “quasi” 3-D model, i.e., the dimension of one direction was extremely small, although PBC was used in that direction. The textures in the direction with extremely small dimensions of all the crystallites were exactly the same, which might “force” the formation of <c+a> dislocation during deformation. Tang et al. [37] investigated the formation of <c+a> dislocation under tension in a single-crystalline Mg sample. The authors kept the temperature at 1 K during equilibrium and used the NVE ensemble during tension, i.e., the temperature was not controlled during deformation. But most of all, a non-periodic boundary condition was used in the tensile direction. In the literature mentioned above, all the SPDs, which are essential for the formation of <c+a> dislocation, were nucleated either from the direction with extremely small dimensions [56] or at the free surface [37]. Thus, here, we may conclude that the free surface or extremely small dimension in one direction might be the key issue for the formation of <c+a> dislocation, at least in the MD simulation work.
Due to the fact that our initial crystallites are randomly oriented, it is hard to analyze whether an <a> dislocation glides on non-basal planes. However, we may compare the total and <a> dislocation densities during the compression at various temperatures, as shown in Figure 7. At the zero-strain condition, there are varying amounts of residual dislocations concentrated at the GBs at different temperatures. The amount of the residual dislocation decreases with the temperature increase. This is mainly attributed to the annihilation of residual dislocations, namely, the recovery during the relaxation process, c.f., Figure 1d,e. The total dislocation density curves show a decrease–increase tendency with the strain increase. In the elastic region, dislocation annihilation takes place without new dislocation creation [34]. Up to the yield point, the total dislocation densities increase again via new dislocation nucleation, perfect dislocation splitting and double cross slip, as mentioned above. However, the contribution of dislocation movement to plastic deformation should be concerned by the density of the <a> dislocation, as shown in Figure 7b. This is because, firstly, this type is the most common dislocation type in Mg with an hcp structure and, secondly, the initial residual dislocations at the GBs with Burgers vectors of <100> or “other”, which do not contribute to plastic deformation, are much more than the <a> dislocation. These residual dislocations are also involved in the total dislocations and should not be taken into account. Lastly, the <a> dislocation attends almost all the dislocation motion during the compression process, such as the dislocation bundle and double cross slip described above. It can be clearly seen that with a temperature increase, the density of <a> dislocation decreases. Here, we should mention again that twinning is rarely observed in the present work or at higher temperatures. Using MD simulation, Hasan et al. [34] performed a tensile experiment on nine polycrystalline Mg samples with a mean grain size from 6.4 nm to 45 nm, and twinning was only found in the samples with average grain sizes of 40 nm and 45 nm. Since twinning could not be the dominant mechanism for plastic deformation. Thus, GB migration might be another mechanism that is a supplement to dislocation motion.
3.3. Grain Boundary Behavior
Figure 8 shows the grain number and distribution changes during compression. We chose here a criterium of 500 atoms, corresponding to a grain size of around 2 nm, i.e., only the number of the atoms with equivalent or slightly different orientations in an atomic cluster is larger than 500, and this atom cluster will be identified as a crystallite. For all temperatures studied, the grain numbers remain at four as set before the beginning of plastic deformation. Afterward, the grain numbers increase. However, the curves for 300 K, 400 K and 500 K do not show obvious differences, while the grain number of the 600 K case increases dramatically at high strain, as shown in Figure 8a. It is well known that the GB serves as a hindrance to dislocation movement, and the (partial) dislocation may annihilate the GBs. This explains why the <a> dislocation density at high temperature is lower than that at low temperature, c.f., Figure 7. Thus, we may compare the grain size distribution at various strains for the 300 K and 600 K cases. For the 300 K case, the number fraction of the grains less than 5 nm amounts to over 70% at a strain of 5%, while there is no grain in the size range between 5 nm to 20 nm. Increasing the strain to 10%, the number fraction in this size area is only around 15%, as shown in Figure 8b. In contrast, for the 600 K case, there already exist grains in the size range of 5 nm–20 nm at a strain of 5%, and the fraction in this size range increases obviously at a strain of 10%, which indicates that more grains are formed at the high temperature. Here, we may note that grains with the size of 2 nm disappear at this strain, which might be the result of grain growth at a higher temperature.
Thanks to the Python script modifier implanted in OVITO [45], we are able to complete color mapping to visualize local lattice orientation based on the PTM analysis [47]. Figure 9 displays the orientation change during compression for the 300 K case. At the strain zero state, there are only two dominant orientations in this plane, which are denoted as “pink” and “gray green” orientations. Here, we may mention that the color mapping function provided by OVITO does not correspond to the coloration system in the normal EBSD, so it is hard to determine the exact orientation. Increasing the strain to 5%, the initial relative straight GB at the left side of the pink orientation becomes curved. This should be related to the reduction in the GB energy. At the same time, a new orientation appears inside the pink orientation, denoted by the white arrow in Figure 9b. The nucleation position of the new orientation is directly near the triple point of two crystallites. This is not unexpected since this position provides the essential structural and energetic fluctuation for the new crystallite nucleation. According to the a-CNA analysis, this new orientation has a body-centered cubic (bcc) structure. This bcc crystallite grows throughout the pink orientation and transforms back to the hcp structure, as shown in the green orientation in Figure 9c. Hasan et al. [34] also found this bcc structure at the GBs in polycrystal magnesium upon tension. The authors described this bcc structure as “temporary” and attributed its formation to the change in the in-plane misorientation and the relative rotation between the grains. This is in accordance with our results. The green grain grows into the pink grain. Here, it is worth mentioning that the growth in the grains with the same crystalline structure but different orientations could be treated as the partial reorientation of the initial grain., as shown in Figure 9c–e. Due to this fact, we may suggest that this green orientation is upon compression “favored” compared with the pink one. Extending the compression to 20%, as shown in Figure 9f, the initial pink orientation disappears totally. Thus, we conclude that in addition to dislocation movement, GB migration and rotation should also be an important mechanism for plastic deformation. However, we do not treat this reorientation of the grains as dynamic recrystallization since a large amount of twinning, which is necessary for dynamic recrystallization (DRX) at low temperatures [68,69], is absent during our simulation. In addition, we do not observe dislocation sliding at the temperatures studied, although it is a very common process when metals are deformed. Since our crystallites are randomly modeled, most GBs are incoherent rather than semi- or coherent, as shown in Figure 1. It is well known that the GB energy of the incoherent GB is much higher than that of the semi or coherent one (10 times). The reorientation should be the main mechanism to reach the “favored” status rather than GB sliding. On the other hand, GB sliding occurs when the strain rate is slow. In the MD simulation, the strain rate applied is much higher than that in reality, which inhibits GB sliding. Thus, the sliding of incoherent GBs is very hard, even when the temperature increases or external stress is added to the system.
At 600 K, the a-CNA analysis loses its efficiency dramatically. Even more than 40% of the atoms are identified as “unknown” type. This is because this method analyzes the crystalline structure according to the atom position and the bond arrangement among the atoms. At high temperatures, strong thermal vibrations change dramatically the relative positions of the atoms as well as the arrangement of the bonds, so it is not efficient to use this method to analyze the local structure. Nevertheless, the color mapping of the local crystalline orientation could be analyzed, as shown in Figure 10. At the first stage, the compression-favored grains invade into the pink orientation, i.e., this process is nothing else than a reorientation of the pink grain, and grows, as shown in Figure 10a–c. In comparison with the 300 K case, the nucleation of the new grains takes place at more positions at the GB, c.f., Figure 9b and Figure 10b. This is expected since the higher temperature supplies more thermal energy for the new grain nucleation. With a strain increase, more nano-grains (NGs) with various orientations nucleate in the compression-favored grain with afterward growth, as shown in Figure 10d–f. Here, we found that around the gray-green grain, necklace-like small grain groups are formed, which is typical for DRX at temperatures around 600 K. Such small necklace grains were often found in experimental works during hot deformation. For instance, Galiyev et al. [70] compressed ZK60 Mg at a temperature of 523 K and found that new small grains formed a “necklace structure” of recrystallized grains along the original boundaries. A similar structure induced by DRX was also found by Zhang et al. [71] for Mg AZ31 alloy during hot-rolling at a temperature of around 650 K. For our 600 K case, we also extended the compression to a strain of 20%. At this strain, even more orientations can be observed in the sample, which is strong evidence for DRX. Up to here, we may conclude that the weakened dislocation activity, c.f., Figure 7, should be compensated by DRX against compression.
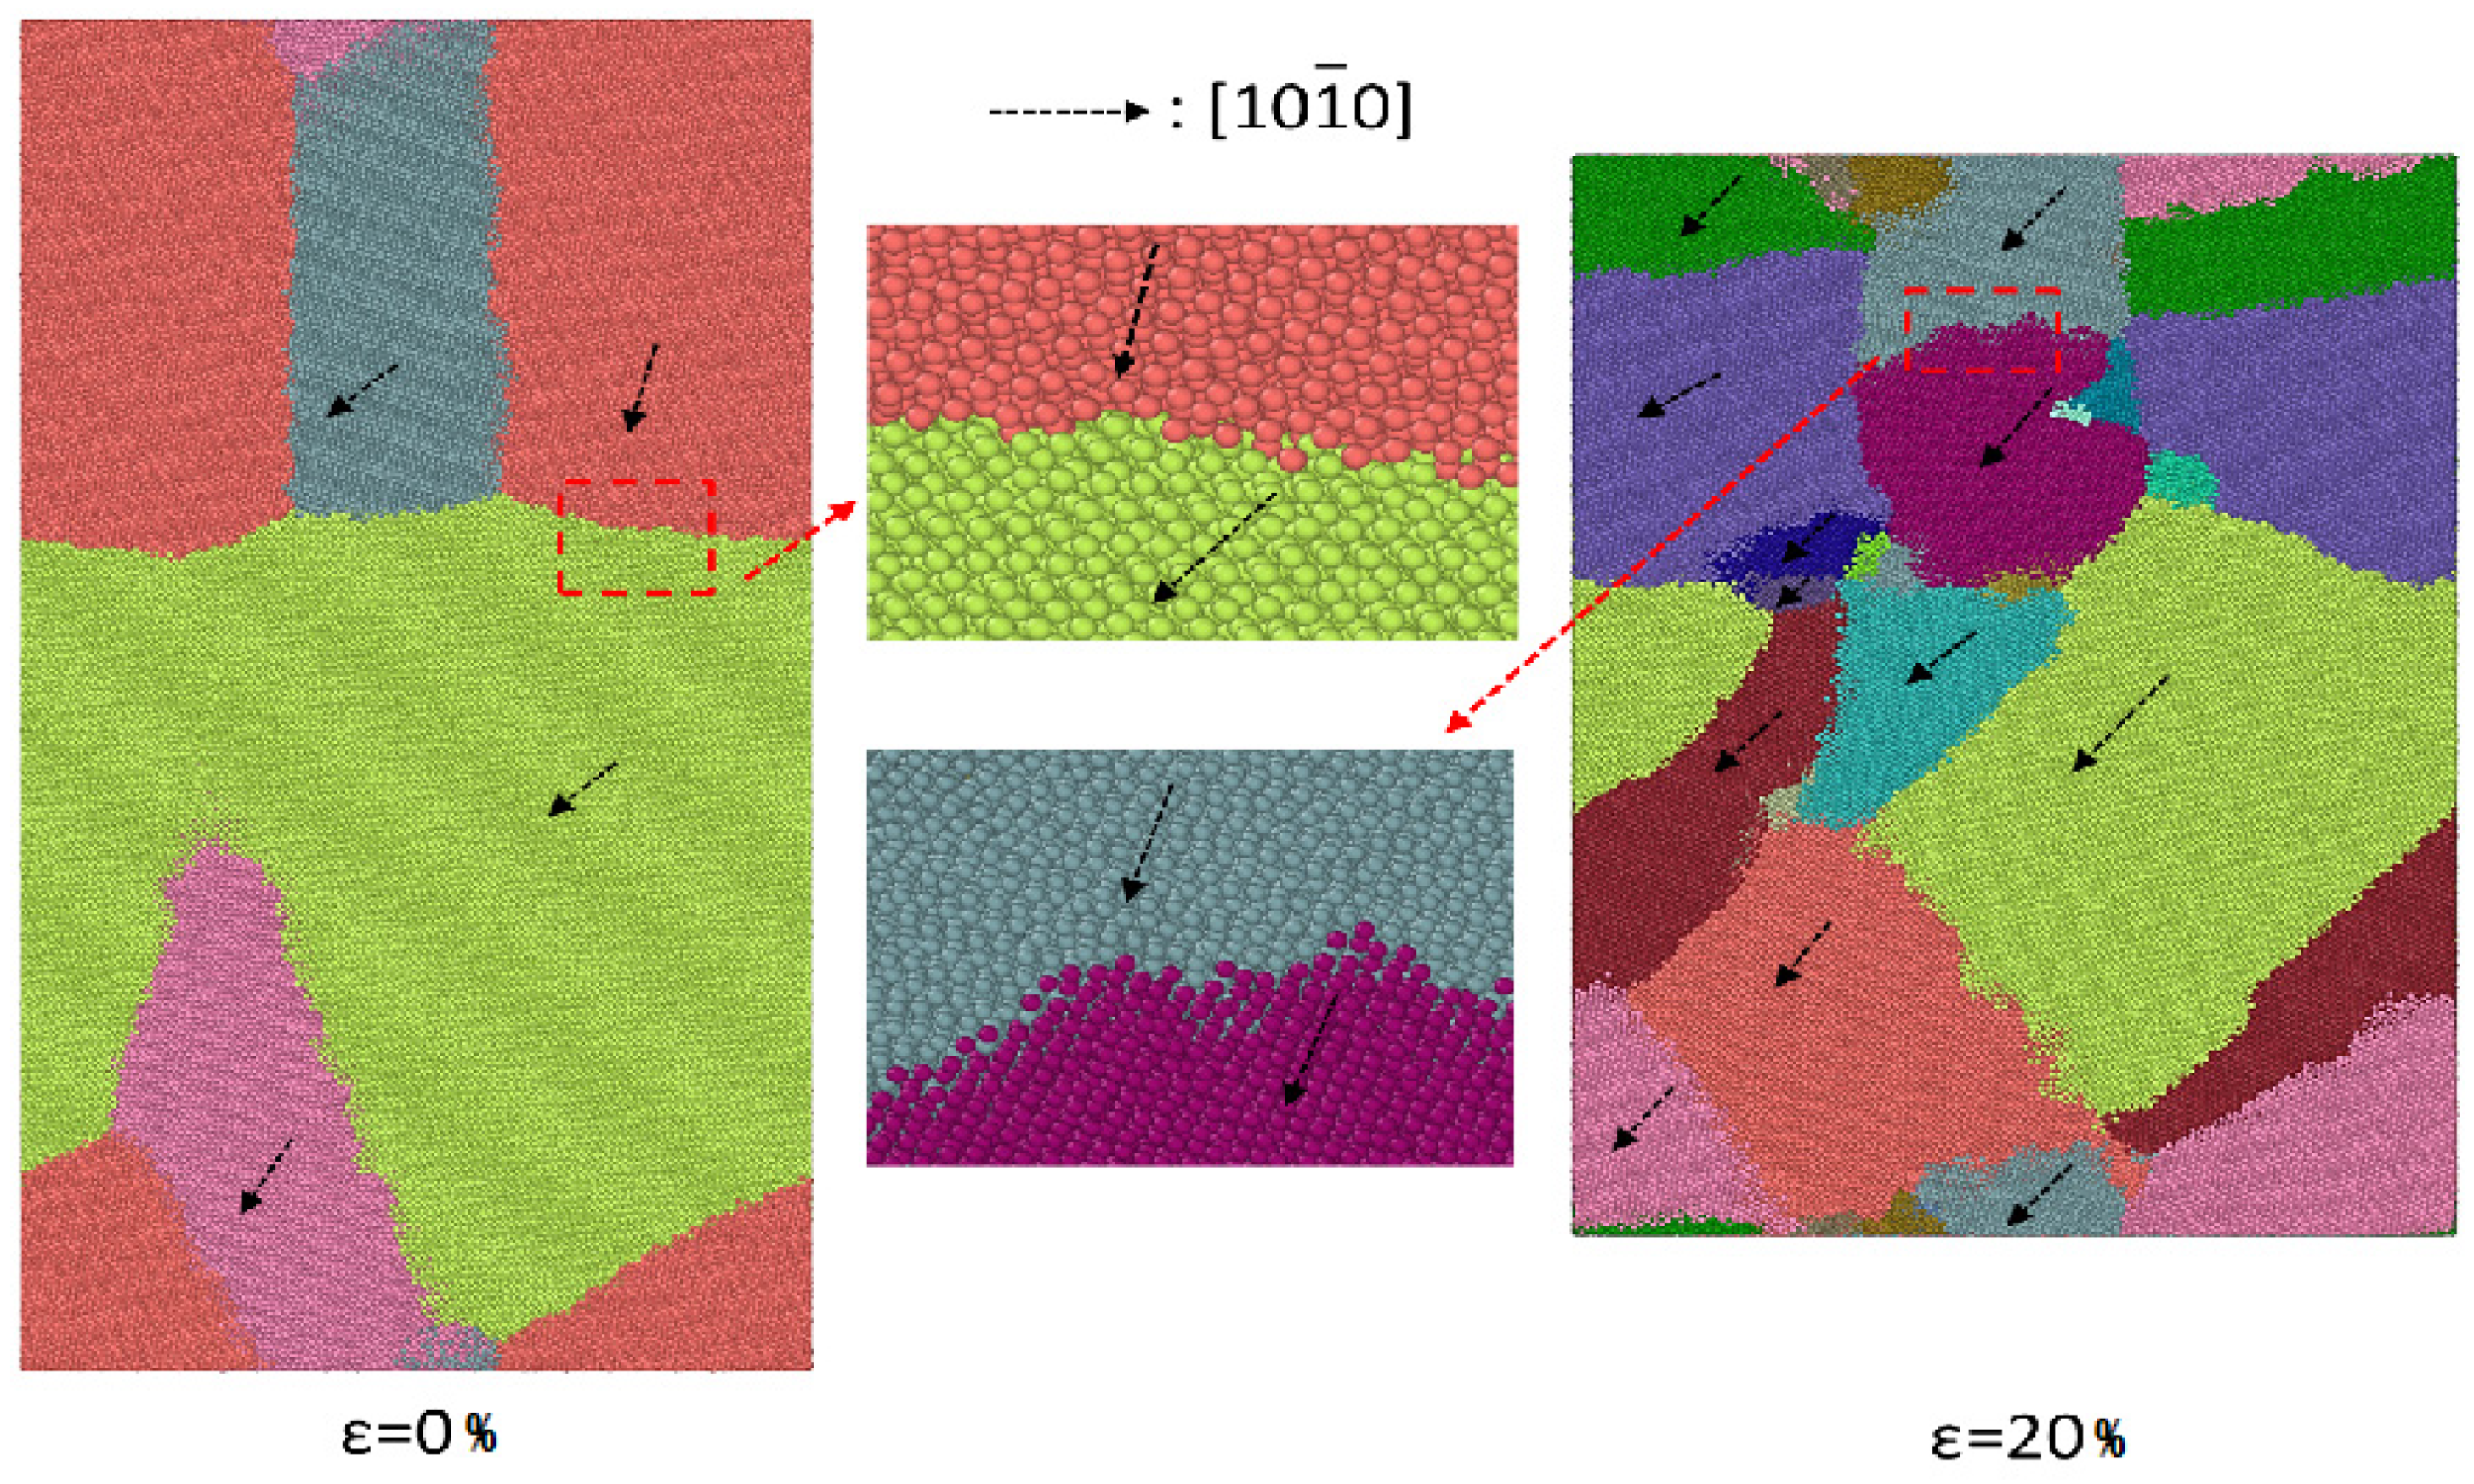
We may discuss the texture and the impurities of the samples studied. It is known [27,56,58,62] that Mg is a metal prone to developing texture and anisotropy. As mentioned above, we denote here again that the coloration system to distinguish the orientation difference offered by OVITO software differs from that of the color mapping of normal EBSD. However, we still chose the sample compressed at 300 K to explain partly the texture evolution. Figure 11 displaces the change of the [100] direction before and after the compression. The subfigures on the left and right are exactly the same plane, and each color represents one orientation. We traced the [100] direction and observed its change. At the strain of 0%, the black dashed line, which indicates the [100] direction, is unparallel to each other. At a strain of 20%, it could be clearly observed that the [100] directions are almost parallel. They point to the almost same direction with only a tiny orientation difference, i.e., a certain texture is formed. However, due to the limitation of the analysis method, we are not able to determine which kind of texture is formed. At the other temperatures studied, such texture formations, including dynamically recrystallized crystallites, are also found. At least, we have proved for Mg, even in simulation work, the texture will be formed.
Finally, we discuss the effect of point defects in the crystalline lattice, such as impurity atoms, on the deformation behavior of Mg. Although this paper is related to pure Mg, the effect on impurity atoms should not be neglected. For example, iron (Fe) has been proven as a harmful impurity corrosion resistance of AZ61 Mg [72]. In addition to the common elements, rare earth elements (REs) attract much attention due to their ability to affect the microstructure, texture, DRX, mechanical properties, etc., of Mg. Barezban et al. [73] studied the effect of gadolinium (Gd) on the DRX behavior of Mg during hot compression and reported a grain refinement. Many other REs are beneficial to the desired texture and DXR behavior, and so the mechanical properties have been magnificently improved [74,75]. Regarding these literature reviews, the effect of the impurities in the crystalline lattice should be an important issue in our further study.
4. Conclusions
In the present work, we performed an MD simulation to study the microstructure change in polycrystal Mg at various temperatures. The main results can be concluded as follows:
(1) For all the temperatures studied, the plastic deformation is mainly controlled by dislocation activity such as basal slip, dislocation bundle or double cross slip. A competitive relationship between the slips of the full <a> dislocation and SPD was observed. Although twinning is found in some positions, it is not the main deformation mechanism of compressive deformation. The grain reorientation should be a supplied mechanism for the plastic deformation.
(2) Dislocation activity is hindered by the newly formed GBs with a temperature increase. Similar to the low-temperature cases, twinning is also not sensitive against compressive deformation. In addition to dislocation activity, grain reorientation and DRX are the strong supplemental mechanisms for compressive plastic deformation.
Author Contributions
All authors designed the simulations. C.Z. performed the simulation. C.Z. and B.W. analyzed the results. C.Z. wrote the first version of this manuscript. B.W., Y.L. and Y.G. completed the review and editing work. C.X. supervised the whole work. All authors have read and agreed to the published version of the manuscript.
Funding
This work was funded by the National Natural Science Foundation of China (No. 52001213). Also, this work was sponsored by the Shanghai Sailing Program (20YF1447200) and the Natural Science Foundation of Shanghai (20ZR1455300).
Data Availability Statement
The original data will be made available on request. Please contact the corresponding author.
Conflicts of Interest
The authors declare no conflict of interest.
References
- Matsunaka, D.; Ohnishi, Y.; Shibutani, Y. Effects of Stacking Fault Energy on Fundamental Deformation Modes in Single Crystalline Magnesium by Molecular Dynamics Simulations. Mater. Trans. 2013, 54, 2093–2097. [Google Scholar] [CrossRef]
- Fan, H.; Tang, J.; Tian, X.; Wang, Q.; Tian, X.; El-Awady, J.A. Core Structures and Mobility of ⟨c⟩ Dislocations in Magnesium. Scr. Mater. 2017, 135, 37–40. [Google Scholar] [CrossRef]
- Tang, X.Z.; Guo, Y.F.; Xu, S.; Wang, Y.S. Atomistic Study of Pyramidal Slips in Pure Magnesium Single Crystal under Nano-Compression. Philos. Mag. 2015, 95, 2013–2025. [Google Scholar] [CrossRef]
- Byer, C.M.; Ramesh, K.T. Effects of the Initial Dislocation Density on Size Effects in Single-crystal Magnesium. Acta Mater. 2013, 61, 3808–3818. [Google Scholar] [CrossRef]
- Fan, H.; Wang, Q.; Tian, X.; El-Awady, J.A. Temperature Effects on the Mobility of Pyramidal <c+a> Dislocations in Magnesium. Scr. Mater. 2017, 127, 68–71. [Google Scholar]
- Aghababaei, R.; Joshi, S.P. Micromechanics of Tensile Twinning in Magnesium Gleaned from Molecular Dynamics Simulations. Acta Mater. 2014, 69, 326–342. [Google Scholar] [CrossRef]
- Shin, J.H.; Kim, S.H.; Ha, T.K.; Oh, K.H.; Choi, I.S.; Han, H.N. Nanoindentation Study for Deformation Twinning of Magnesium Single Crystal. Scr. Mater. 2013, 68, 483–486. [Google Scholar] [CrossRef]
- Yoo, M.H.; Lee, J.K. Deformation Twinning in hcp Metals and Alloys. Philos. Mag. A 1991, 63, 987–1000. [Google Scholar] [CrossRef]
- Kim, G.S.; Yi, S.; Huang, Y.; Lilleodden, E. Twining and Slip Activity in Magnesium Single Crystal. MRS Online Proc. Libr. 2009, 1224, 1224-FF05-03. [Google Scholar] [CrossRef]
- Beyerlein, I.J.; Capolungo, L.; Marshall, P.E.; McCabe, R.J.; Tomé, C.N. Statistical Analyses of Deformation Twinning in Magnesium. Philos. Mag. 2010, 90, 2161–2190. [Google Scholar] [CrossRef]
- Yu, Q.; Qi, L.; Chen, K.; Mishra, R.K.; Li, J.; Minor, A.M. The Nanostructured Origin of Deformation Twinning. Nano Lett. 2012, 12, 887–892. [Google Scholar] [CrossRef] [PubMed]
- Sánchez-Martín, R.; Pérez-Prado, M.T.; Segurado, J.; Bohlen, J.; Gutiérrez Urrutia, I.; Llorca, J.; Molina Aldareguia, J.M. Measuring the Critical Resolved Shear Stresses in Mg Alloys by Instrumented Nanoindentation. Acta Mater. 2014, 71, 283–292. [Google Scholar] [CrossRef]
- Sánchez-Martín, R.; Pérez-Prado, M.; Segurado, J.; Molina Aldareguia, J. Effect of Indentation Size on the Nucleation and Propagation of Tensile Twinning in Pure Magnesium. Acta Mater. 2015, 93, 114–128. [Google Scholar] [CrossRef]
- Lavrentev, F.F.; Pokhil, Y.u.A.; Zolotukhina, I.N. Analysis of Pairwise Dislocation Interaction and Its Contribution to Flow Stress during Magnesium Crystal Basal Slip. Mater. Sci. Eng. 1978, 32, 113–119. [Google Scholar] [CrossRef]
- Fan, H.; Aubry, S.; Arsenlis, A.; El-Awady, J.A. Discrete Dislocation Dynamics Simulations of Twin Size-Effects in Magnesium. MRS Online Proc. Libr. 2015, 1741, 27–32. [Google Scholar] [CrossRef]
- Ocegueda, E.; Bhattacharya, K. Interaction between Deformation Twinning and Dislocation Slip in Polycrystalline Solids. arXiv 2022, arXiv:2202.02908. [Google Scholar] [CrossRef]
- Gong, M.; Xu, S.; Jiang, Y.; Liu, Y.; Wang, J. Structural Characteristics of {012} Non-Cozone Twin-Twin Interactions in Magnesium. Acta Mater. 2018, 159, 65–76. [Google Scholar] [CrossRef]
- Yu, Q.; Jiang, Y.; Wang, J. Cyclic Deformation and Fatigue Damage in Single-Crystal Magnesium under Fully Reversed Strain-Controlled Tension–Compression in the [100] Direction. Scr. Mater. 2015, 96, 41–44. [Google Scholar] [CrossRef]
- Mordike, B.L.; Ebert, T. Magnesium: Properties-Applications-Potential. Mater. Sci. Eng. A 2001, 302, 37–45. [Google Scholar] [CrossRef]
- Horstemeyer, M.F.; Wang, P. Cradle-to-Grave Simulation-Based Design Incorporating Multiscale Microstructure-Property Modeling: Reinvigorating Design with Science. J. Comput.-Aided Mater. Des. 2003, 10, 13–34. [Google Scholar] [CrossRef]
- Aghion, E.; Bronfin, B.; Eliezer, D. The Role of the Magnesium Industry in Protecting the Environment. J. Mater. Process. Technol. 2001, 117, 381–385. [Google Scholar] [CrossRef]
- Groh, S.; Marin, E.B.; Horstemeyer, M.F.; Bammann, D.J. Dislocation Motion in Magnesium: A Study by Molecular Statics and Molecular Dynamics. Modell. Simul. Mater. Sci. Eng. 2009, 17, 075009. [Google Scholar] [CrossRef]
- Zhu, S.Q.; Yan, H.G.; Chen, J.H.; Wu, Y.Z.; Du, Y.G.; Liao, X.Z. Fabrication of Mg-Al-Zn-Mn Alloy Sheets with Homogeneous Fine-Grained Structures Using High Strain-Rate Rolling in a Wide Temperature Range. Mater. Sci. Eng. A 2013, 559, 765–772. [Google Scholar] [CrossRef]
- Wu, Y.Z.; Yan, H.G.; Chen, J.H.; Zhu, S.Q.; Su, B.; Zeng, P.L. Hot Deformation Behavior and Microstructure Evolution of ZK21 Magnesium Alloy. Mater. Sci. Eng. A 2010, 527, 3670–3675. [Google Scholar] [CrossRef]
- Zhu, S.Q.; Yan, H.G.; Chen, J.H.; Wu, Y.Z.; Su, B.; Du, Y.G.; Liao, X.Z. Feasibility of High Strain-Rate Rolling of a Magnesium Alloy across a Wide Temperature Range. Scr. Mater. 2012, 67, 404–407. [Google Scholar] [CrossRef]
- Cepeda-Jiménez, C.M.; Molina-Aldareguia, J.M.; Pérez-Prado, M.T. Effect of Grain Size on Slip Activity in Pure Magnesium Polycrystals. Acta Mater. 2015, 84, 443–456. [Google Scholar] [CrossRef]
- del Valle, J.A.; Carreño, F.; Ruano, O.A. Influence of Texture and Grain Size on Work Hardening and Ductility in Magnesium-Based Alloys Processed by ECAP and Rolling. Acta Mater. 2006, 54, 4247–4259. [Google Scholar] [CrossRef]
- Shimizu, I. Temperature Dependent Plastic Deformation Behavior of AZ31 Magnesium Alloy in Uniaxial and Biaxial Compressions. Key Eng. Mater. 2016, 725, 421–426. [Google Scholar] [CrossRef]
- Chapuis, A.; Liu, Q. Investigating the Temperature Dependency of Plastic Deformation in a Mg-3Al-1Zn Alloy. Mater. Sci. Eng. A. 2018, 725, 108–118. [Google Scholar] [CrossRef]
- Mohapatra, S.; Prasad, R.; Jain, J. Temperature Dependence of Abnormal Grain Growth in Pure Magnesium. Mater. Lett. 2021, 283, 128851. [Google Scholar] [CrossRef]
- Zhang, H. Atomistic Simulation of Sliding of [100] Tilt Grain Boundaries in Mg. J. Mater. Res. 2009, 24, 3446–3453. [Google Scholar] [CrossRef]
- Song, H.Y.; Li, Y.L. Atomic Simulations of Effect of Grain Size on Deformation Behavior of Nano-Polycrystal Magnesium. J. Appl. Phys. 2012, 111, 044322. [Google Scholar] [CrossRef]
- Moitra, A. Grain Size Effect on Microstructural Properties of 3D Nanocrystalline Magnesium under Tensile Deformation. Comput. Mater. Sci. 2013, 79, 247–251. [Google Scholar] [CrossRef]
- Hasan, M.S.; Lee, R.; Xu, W. Deformation Nanomechanics and Dislocation Quantification at the Atomic Scale in Nanocrystalline Magnesium. J. Magnes. Alloys 2020, 8, 1296–1303. [Google Scholar] [CrossRef]
- Hirel, P. Atomsk: A Tool for Manipulating and Converting Atomic Data Files. Comput. Phys. Commun. 2015, 197, 212–219. [Google Scholar] [CrossRef]
- Liu, X.Y.; James, B.A.; Furio, E.; John, A.M. EAM Potential for Magnesium from Quantum Mechanical Forces. Modell. Simul. Mater. Sci. Eng. 1996, 4, 293–303. [Google Scholar] [CrossRef]
- Tang, Y.; El-Awady, J.A. Formation and Slip of Pyramidal Dislocations in Hexagonal Close-Packed Magnesium Single Crystals. Acta Mater. 2014, 71, 319–332. [Google Scholar] [CrossRef]
- Somekawa, H.; Singh, A.; Inoue, T.; Mukai, T. Enhancing Fracture Toughness of Magnesium Alloy by Formation of Low Angle Grain Boundary Structure. Adv. Eng. Mater. 2010, 12, 837–842. [Google Scholar] [CrossRef]
- Panicker, R.; Chokshi, A.H.; Mishra, R.K.; Verma, R.; Krajewski, P.E. Microstructural Evolution and Grain Boundary Sliding in a Superplastic Magnesium AZ31 Alloy. Acta Mater. 2009, 57, 3683–3693. [Google Scholar] [CrossRef]
- Yamakov, V.; Wolf, D.; Phillpot, S.R.; Mukherjee, A.; Gleiter, H. Dislocation–Dislocation and Dislocation–Twin Reactions in Nanocrystalline Al by Molecular Dynamics Simulation. Acta Mater. 2003, 51, 4135–4147. [Google Scholar] [CrossRef]
- Sinmonnin, P.; Schrieber, D.K.; Uberuaga, B.P.; Rosso, K.M. Atomic Diffusion, Segregation, and Grain Boundary Migration in Nickel-based Alloys from Molecular Dynamicks Simulations. Mater. Today Commu. 2023, 35, 105768. [Google Scholar] [CrossRef]
- Stukowski, A.; Bulatov, V.V.; Arsenlis, A. Automated Identification and Indexing of Dislocations in Crystal Interfaces. Modelling Simul. Mater. Sci. Eng. 2012, 20, 085007. [Google Scholar]
- Rogers, J.P.; Wynblatt, P.; Foiles, S.M.; Baskes, M.I. Monte Carlo Simulation of the Cu Ag (001) Semicoherent Interphase Boundary. Acta Metall. Mater. 1990, 38, 177–184. [Google Scholar] [CrossRef]
- Available online: https://www.lammps.org (accessed on 1 May 2023).
- Stukowski, A. Visualization and Analysis of Atomistic Simulation Data with OVITO–the Open Visualization Tool. Modell. Simul. Mater. Sci. Eng. 2010, 18, 015012. [Google Scholar] [CrossRef]
- Stukowski, A. Structure Identification Methods for Atomistic Simulations of Crystalline Materials. Modell. Simul. Mater. Sci. Eng. 2012, 20, 045021. [Google Scholar] [CrossRef]
- Larsen, P.M.; Schmidt, S.; Schiøtz, J. Robust structural identification via polyhedral template matching. Modell. Simul. Mater. Sci. Eng. 2016, 24, 055007. [Google Scholar] [CrossRef]
- Qi, H.; Guo, Y.F.; Tang, X.Z.; Xu, S. Atomistic Simulation of the Structural Evolution in Magnesium Single Crystal under c-axis Tension. Acta Metall. Sin. 2011, 24, 487–494. [Google Scholar]
- Liu, J.; Cui, Z.; Li, C. Modelling of Flow Stress Characterizing Dynamic Recrystallization for Magnesium Alloy AZ31B. Comput. Mater. Sci. 2008, 41, 375–382. [Google Scholar] [CrossRef]
- Wilson, S.R.; Mendelev, M.I. A Unified Relation for the Solid-Liquid Interface Free Energy of Pure FCC, BCC, and HCP Metals. J. Chem. Phys. 2016, 144, 144704. [Google Scholar] [CrossRef]
- Li, W.J.; Zhao, G.Q.; Ma, X.W.; Gao, J. Flow Stress Characteristics of AZ31B Magnesium Alloy Sheet at Elevated Temperatures. Int. J. Appl. Phys. Math. 2012, 2, 83–88. [Google Scholar] [CrossRef]
- Feng, X.; Sun, Y.; Lu, Y.; He, J.; Liu, X.; Wan, S. Effect of the Strain Rate on the Damping and Mechanical Properties of a ZK60 Magnesium Alloy. Materials 2020, 13, 2969. [Google Scholar] [CrossRef] [PubMed]
- Rida, A.; Micoulaut, M.; Rouhaud, E.; Makke, A. Understanding the Strain Rate Sensitivity of Nanocrystalline Copper Using Molecular Dynamics Simulations. Comput. Mater. Sci. 2020, 172, 109294. [Google Scholar] [CrossRef]
- Fukuda, K.; Koyanagi, Y.; Tsushida, M.; Kitahara, H.; Mayama, T.; Ando, S. Activation Stress for Slip Systems of Pure Magnesium Single Crystals in Pure Shear Test. Mater. Trans. 2017, 58, 587–591. [Google Scholar] [CrossRef]
- Karewar, S.; Sietsma, J.; Santofimia, M.J. Effect of Pre-Existing Defects in the Parent Fcc Phase on Atomistic Mechanisms during the Martensitic Transformation in Pure Fe: A Molecular Dynamics Study. Acta Mater. 2017, 142, 71–81. [Google Scholar] [CrossRef]
- Kim, D.H.; Ebrahimi, F.; Manuel, M.V.; Tulenko, J.S.; Phillpot, S.R. Grain-boundary activated pyramidal dislocations in nano-textured Mg by molecular dynamics simulation. Mater. Sci. Eng. A 2011, 528, 5411–5420. [Google Scholar] [CrossRef]
- Liu, J.; Fan, X.; Zheng, W.; Singh, D.J.; Shi, Y. Nanocrystalline Gold with Small Size: Inverse Hall–Petch between Mixed Regime and Super-Soft Regime. Philos. Mag. 2020, 100, 2335–2351. [Google Scholar] [CrossRef]
- Joni, B.; Al-Samman, T.; Chowdhury, S.G.; Csiszar, G.; Ungar, T. Dislocation densities and prevailing slip-system types determined by X-ray line profile analysis in a textured AZ31 magnesium alloy deformed at different temperatures. J. Appl. Crystallogr. 2013, 46, 55–62. [Google Scholar] [CrossRef]
- Wu, Z.; Curtin, W.A. The Origins of High Hardening and Low Ductility in Magnesium. Nature 2015, 526, 62–67. [Google Scholar] [CrossRef]
- He, C.; Zhang, Y.; Liu, C.Q.; Yue, Y.; Chen, H.W.; Nie, J.F. Unexpected partial dislocations within stacking faults in a cold deformed MgBi alloy. Acta Mater. 2020, 188, 328–343. [Google Scholar] [CrossRef]
- Jiang, S.; Liu, T.; Chen, C.; Jiang, X. Law of Atomic Motion during {101} Twinning in Magnesium Alloys. Mater. Trans. 2011, 52, 1585–1588. [Google Scholar] [CrossRef]
- Jiang, L.; Jonas, J.J.; Mishra, R.K.; Luo, A.A.; Sachdev, A.K.; Godet, S. Twinning and Texture Development in Two Mg Alloys Subjected to Loading along Three Different Strain Paths. Acta Mater. 2007, 55, 3899–3910. [Google Scholar] [CrossRef]
- Yoshinaga, H.; Horiuchi, R. Deformation Mechanisms in Magnesium Single Crystals Compressed in the Direction Parallel to Hexagonal Axis. Trans. Jpn. Inst. Met. 1963, 4, 1–8. [Google Scholar] [CrossRef]
- Pueschl, W. Models for Dislocation Cross-Slip in Close-Packed Crystal Structures: A Critical Review. Prog. Mater. Sci. 2002, 47, 415–461. [Google Scholar] [CrossRef]
- Wang, J.; Chen, Y.; Chen, Z.; Llorca, J.; Zeng, X. Deformation mechanisms of Mg-Ca-Zn alloys studied by means of micropillar compression tests. Acta Mater. 2021, 217, 117151. [Google Scholar] [CrossRef]
- Yasi, J.A.; Hector, L.G.; Trinkle, D.R. Prediction of thermal cross-slip stress in magnesium alloys from direct first-principles data. Acta Mater. 2011, 59, 5652–5660. [Google Scholar] [CrossRef]
- Máthis, K.; Nyilas, K.; Axt, A.; Dragomir Cernatescu, I.; Ungár, T.; Lukáč, P. The Evolution of Non-Basal Dislocations as a Function of Deformation Temperature in Pure Magnesium Determined by X-Ray Diffraction. Acta Mater. 2004, 52, 2889–2894. [Google Scholar] [CrossRef]
- Kaibyshev, R.; Sitdikov, O. Dynamic Recrystallization of Magnesium at Ambient Temperature. Int. J. Mater. Res. 1994, 85, 738–743. [Google Scholar] [CrossRef]
- Kaibyshev, R.; Sitdikov, O. On the Role of Twinning in Dynamic Recrystallization. Int. J. Mater. Res. 2000, 89, 384–390. [Google Scholar]
- Galiyev, A.; Kaibyshev, R.; Gottstein, G. Correlation of Plastic Deformation and Dynamic Recrystallization in Magnesium alloy ZK60. Acta Mater. 2001, 49, 1199–1207. [Google Scholar] [CrossRef]
- Zhang, Z.; Wang, M.P.; Zhu, S.; Jiang, N. Preferential dynamic recrystallization at original grain boundaries in the hot-rolling process of AZ31 alloy. J. Alloys Compd. 2012, 544, 159–165. [Google Scholar] [CrossRef]
- Dai, Y.; Chen, X.H.; Yan, T.; Tang, A.T.; Zhao, D.; Luo, Z.; Liu, C.Q.; Cheng, R.J.; Pan, F.S. Improved Corrosion Resistance in AZ61 Magnesium Alloys Induced by Impurity Reduction. Acta Metall. Sin. 2020, 33, 225–232. [Google Scholar] [CrossRef]
- Barezban, M.H.; Roumina, R.; Mirzadeh, H.; Mahmudi, R. Effect of Gd on Dynamic Recrystallization Behavior of Magnesium During Hot Compression. Met. Mater. Int. 2021, 27, 843–850. [Google Scholar] [CrossRef]
- Mishra, R.K.; Gupta, A.K.; Rao, P.R.; Sachdev, A.K.; Kumar, A.M.; Luo, A.A. Influence of cerium on the texture and ductility of magnesium extrusions. Scr. Mater. 2008, 60, 562–565. [Google Scholar] [CrossRef]
- Liu, P.; Jiang, H.; Cai, Z.; Kang, Q.; Zhang, Y. The effect of Y, Ce and Gd on texture, recrystallization and mechanical property of Mg–Zn alloys. J. Magnes. Alloys 2016, 4, 188–196. [Google Scholar] [CrossRef]
Figure 1.
Simulation setup of the initial Mg polycrystal with 4 grains (a,b). In (a), the atoms are colored by their grain number, while in (b), the colors represent the crystal structure with light blue for hcp and red for “undetected” atoms. Subfigures (c,d) represent the status after relaxation at a temperature of 300 K. The color in (c) denotes the local crystalline structure as in (b). In (d), the atoms are removed and only “defect meshes” (red planes) and residual dislocations (lines) are shown. The status after relaxation at 600 K is shown in (e) with “defect meshes” and dislocations.
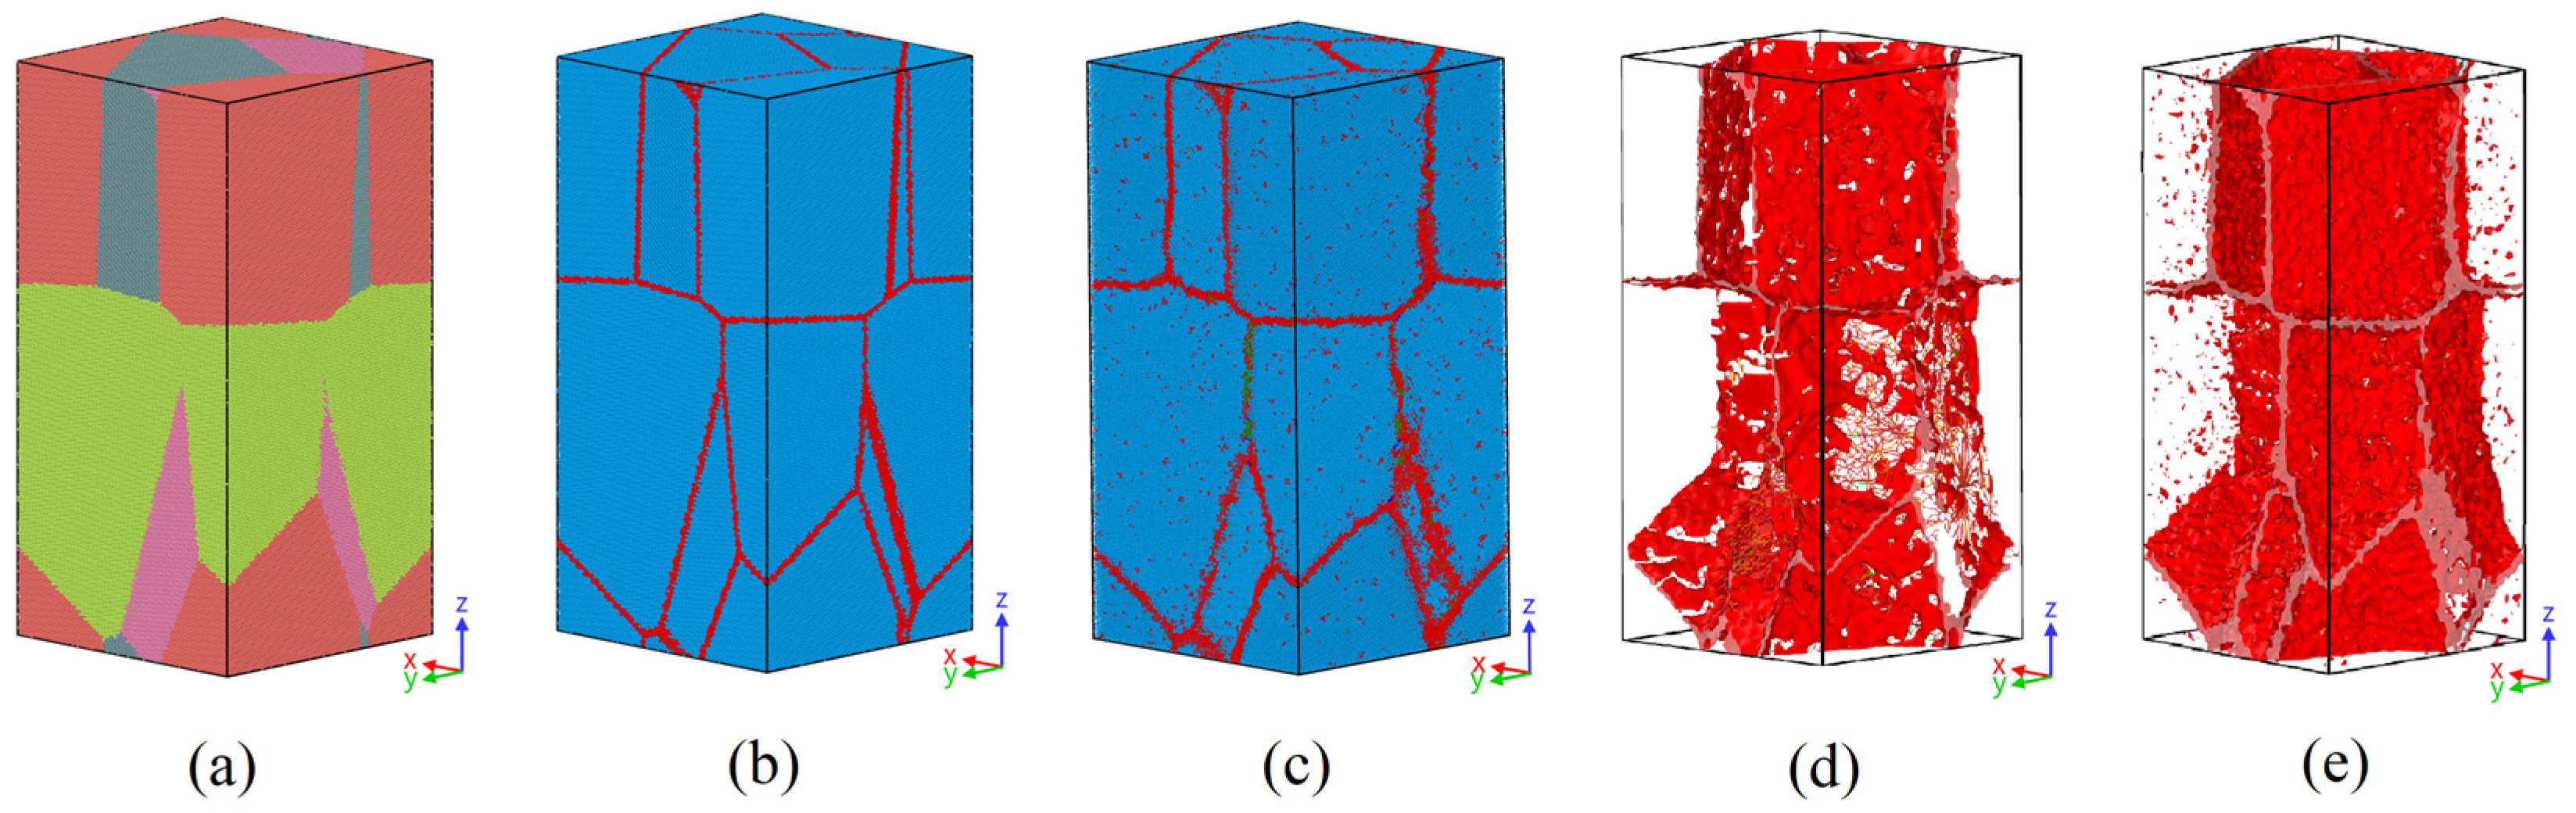
Figure 2.
Stress–strain curves of the samples compressed at 300, 400, 500 and 600 K.
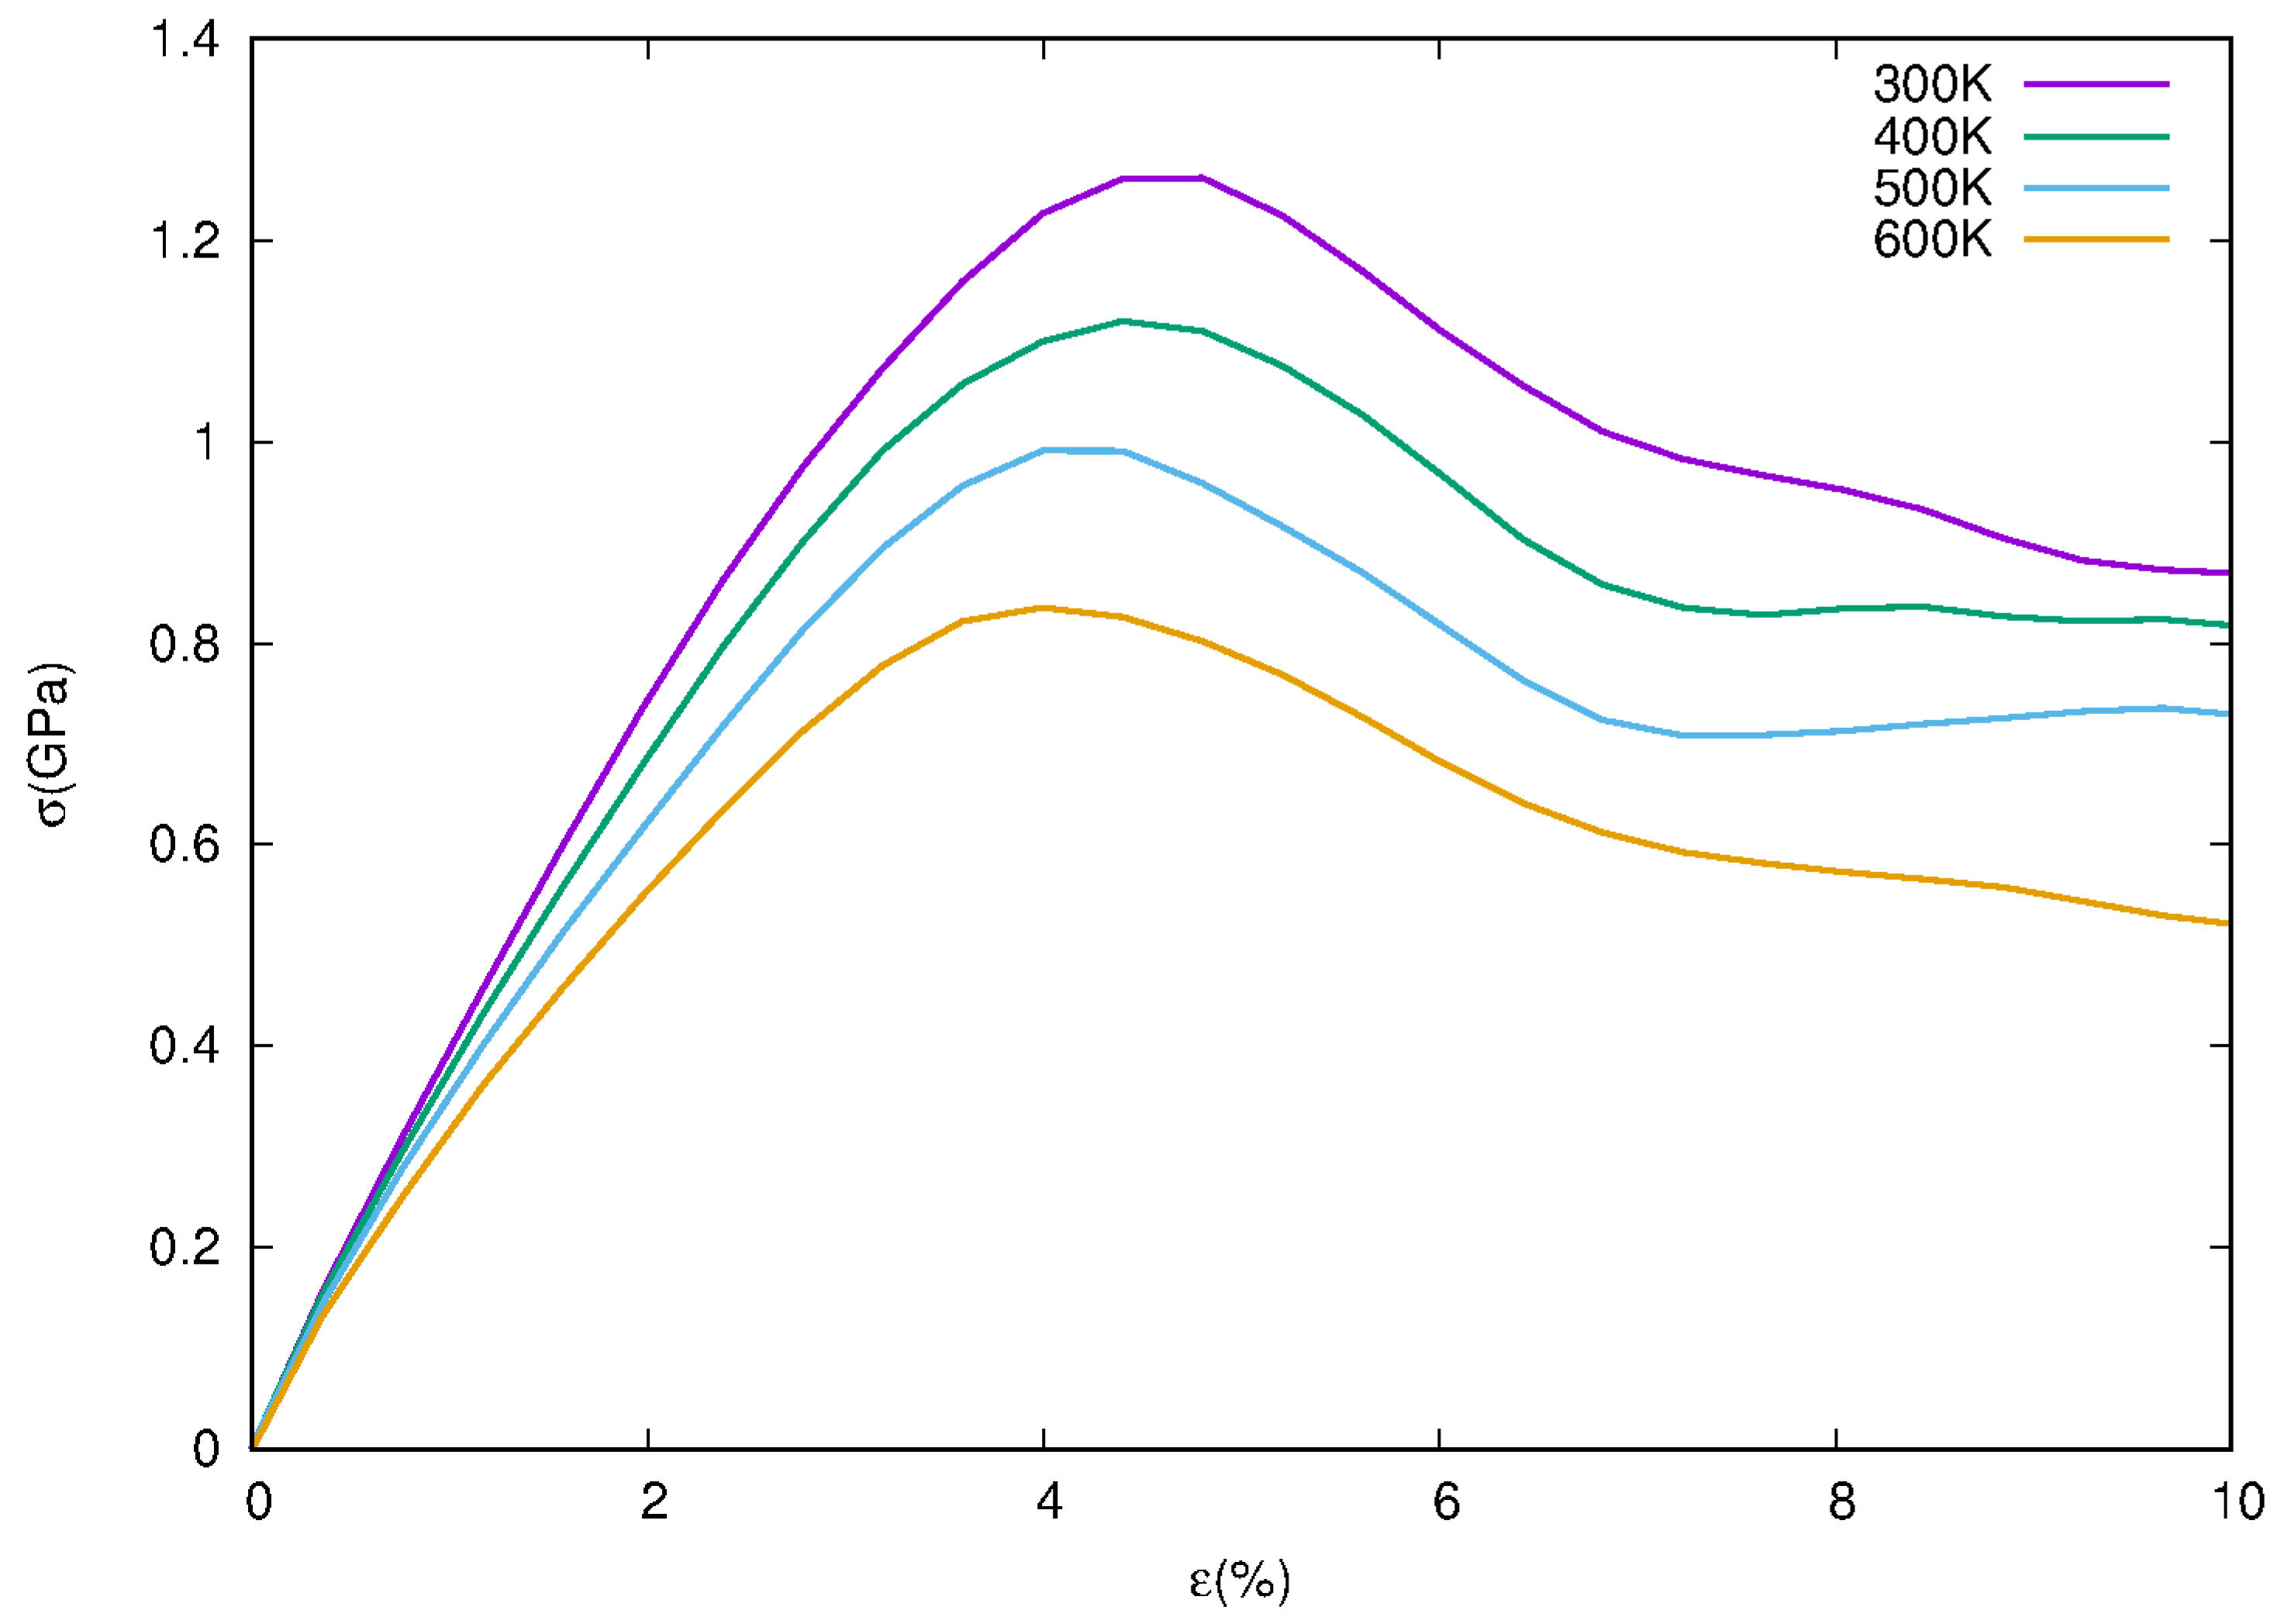
Figure 3.
Density of <a> dislocations and fcc fraction change during the compression at 300 K.
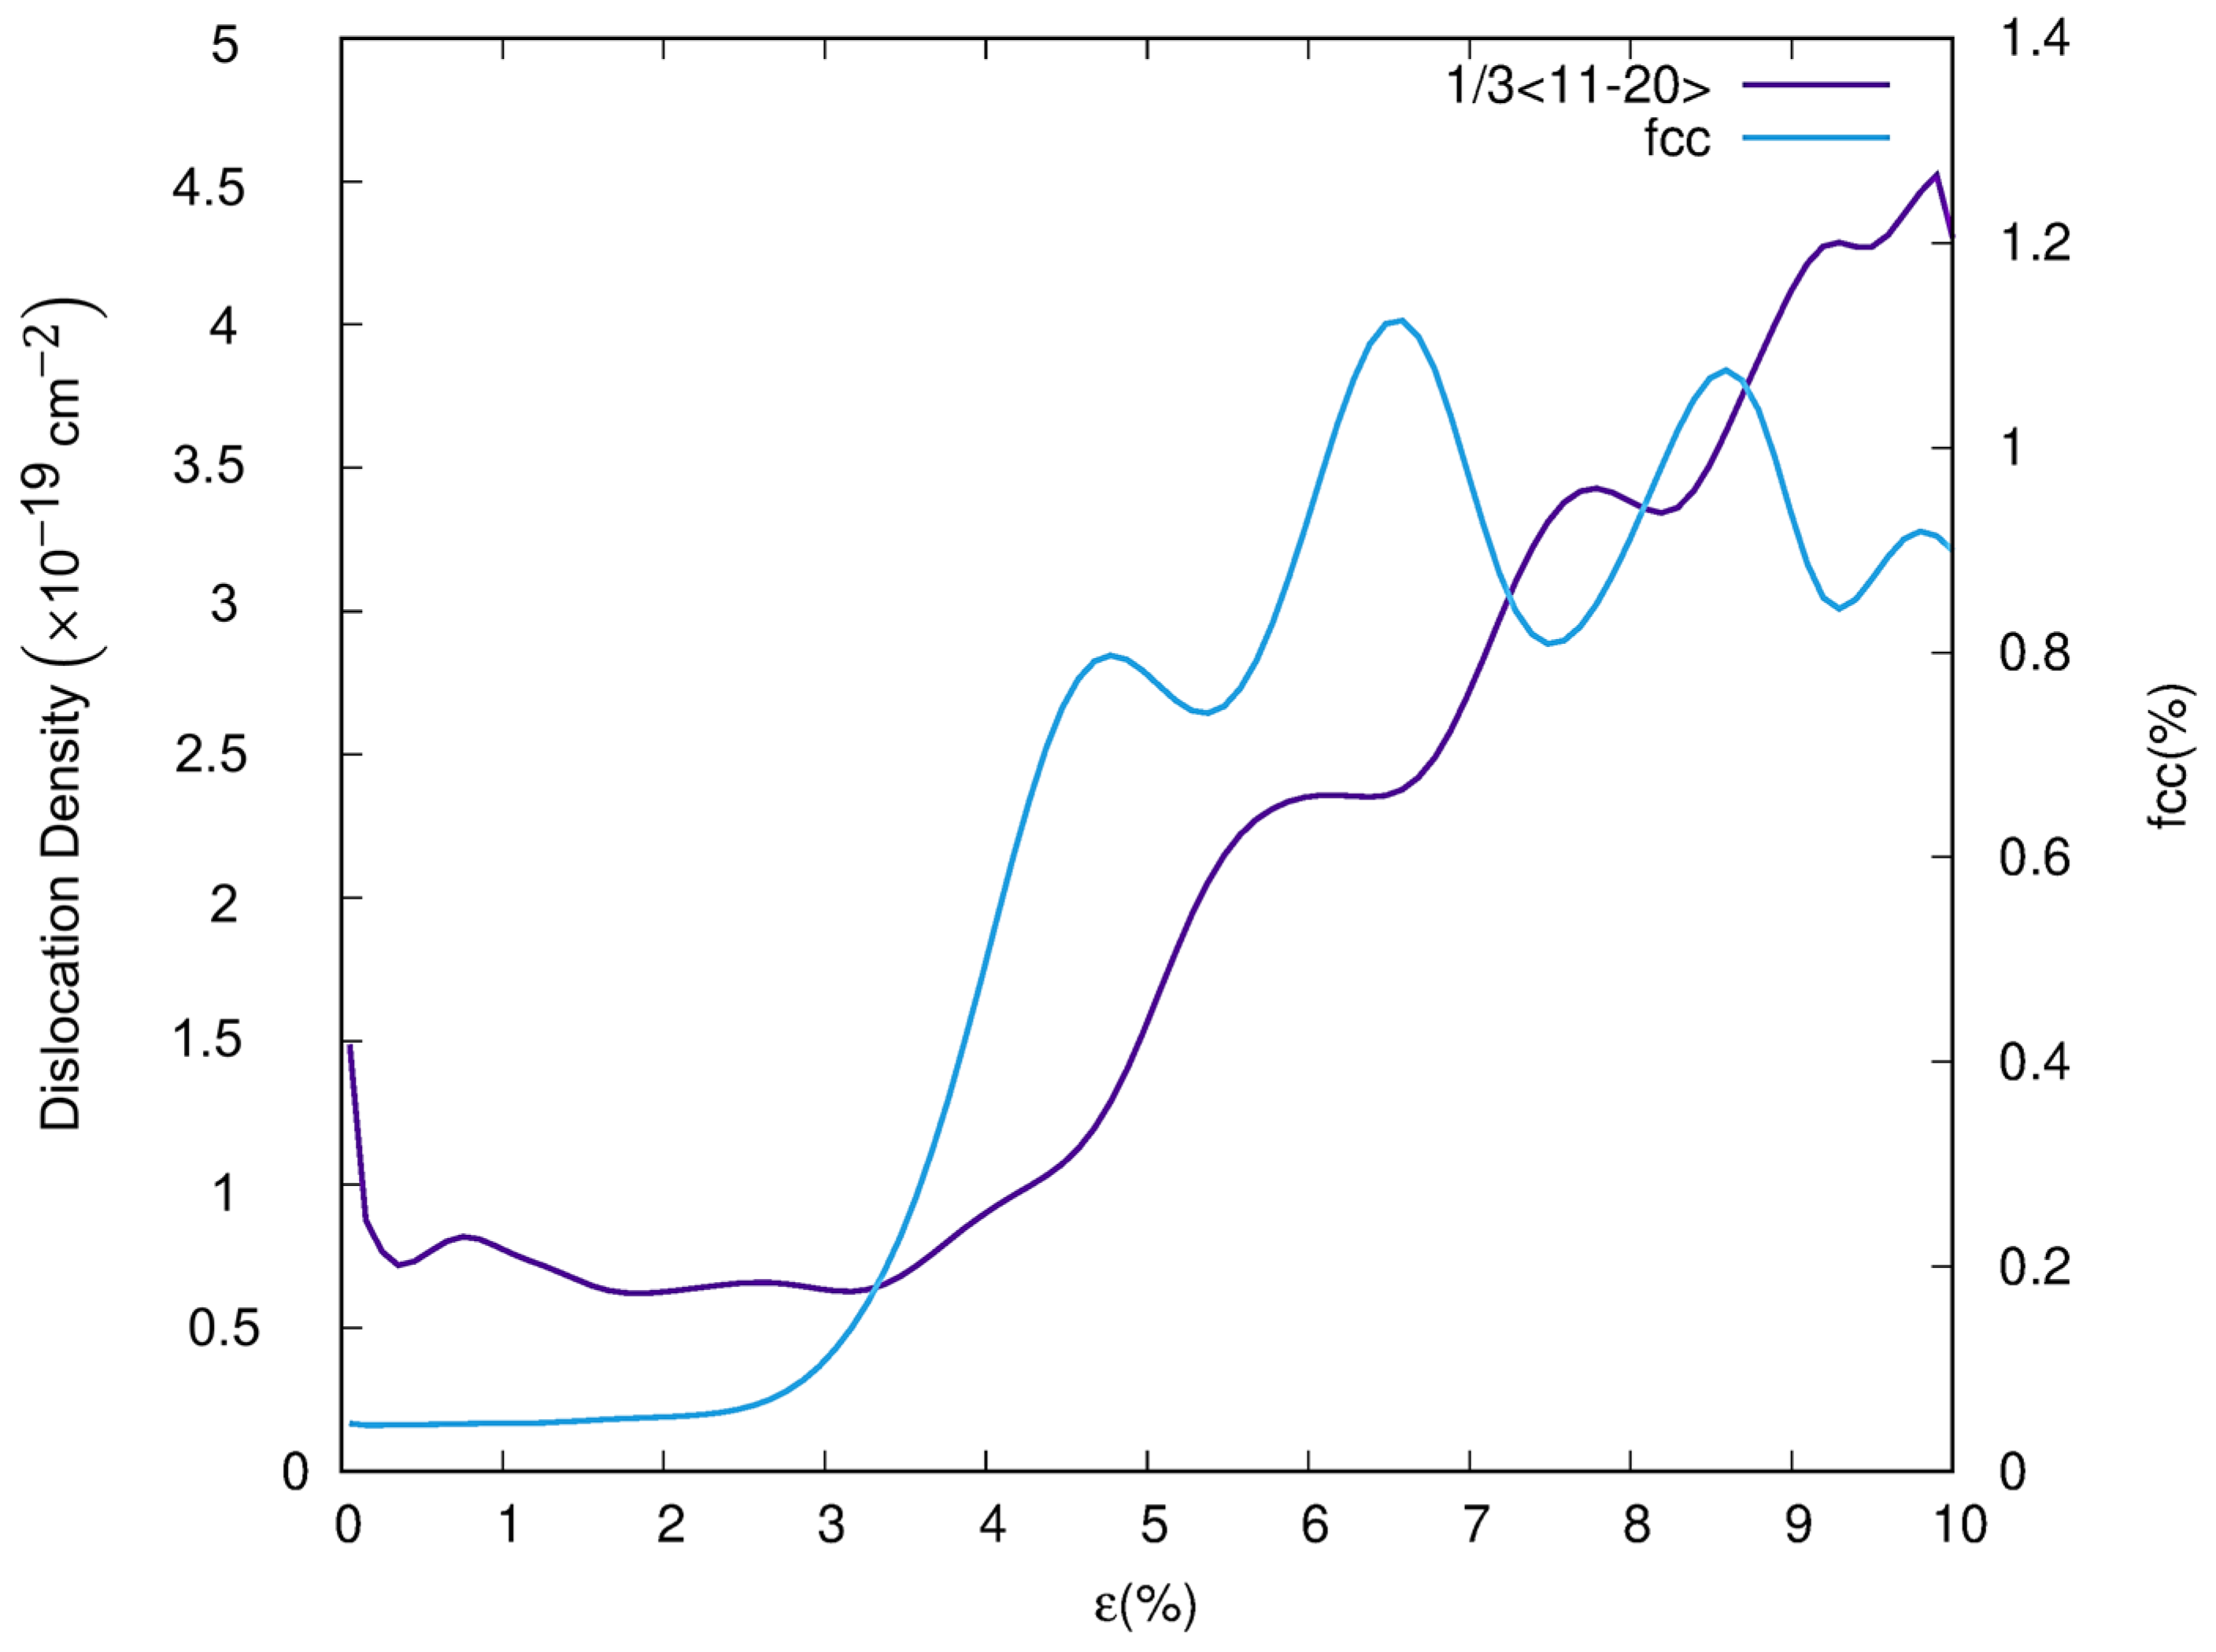
Figure 4.
Snapshot of the sample local at a strain of 3.6% at a temperature of 300 K (a) the first <a> full dislocation detected with the DXA and a-CNA. All the atoms in the upper figure are removed. The green line indicates the <a> dislocation line with a Burgers vector of 1/3<110>. The white arrow in the lower subfigure denotes the same <a> dislocation in atomic image. The colors in the lower figure denote the local crystalline structures with light blue: hcp, dark blue: hcp, red: unknown atoms (GB or defects) (b) The snapshot of the whole sample with only fcc atoms. The brown lines indicate the dislocation lines with burger vectors of 1/3<100>.
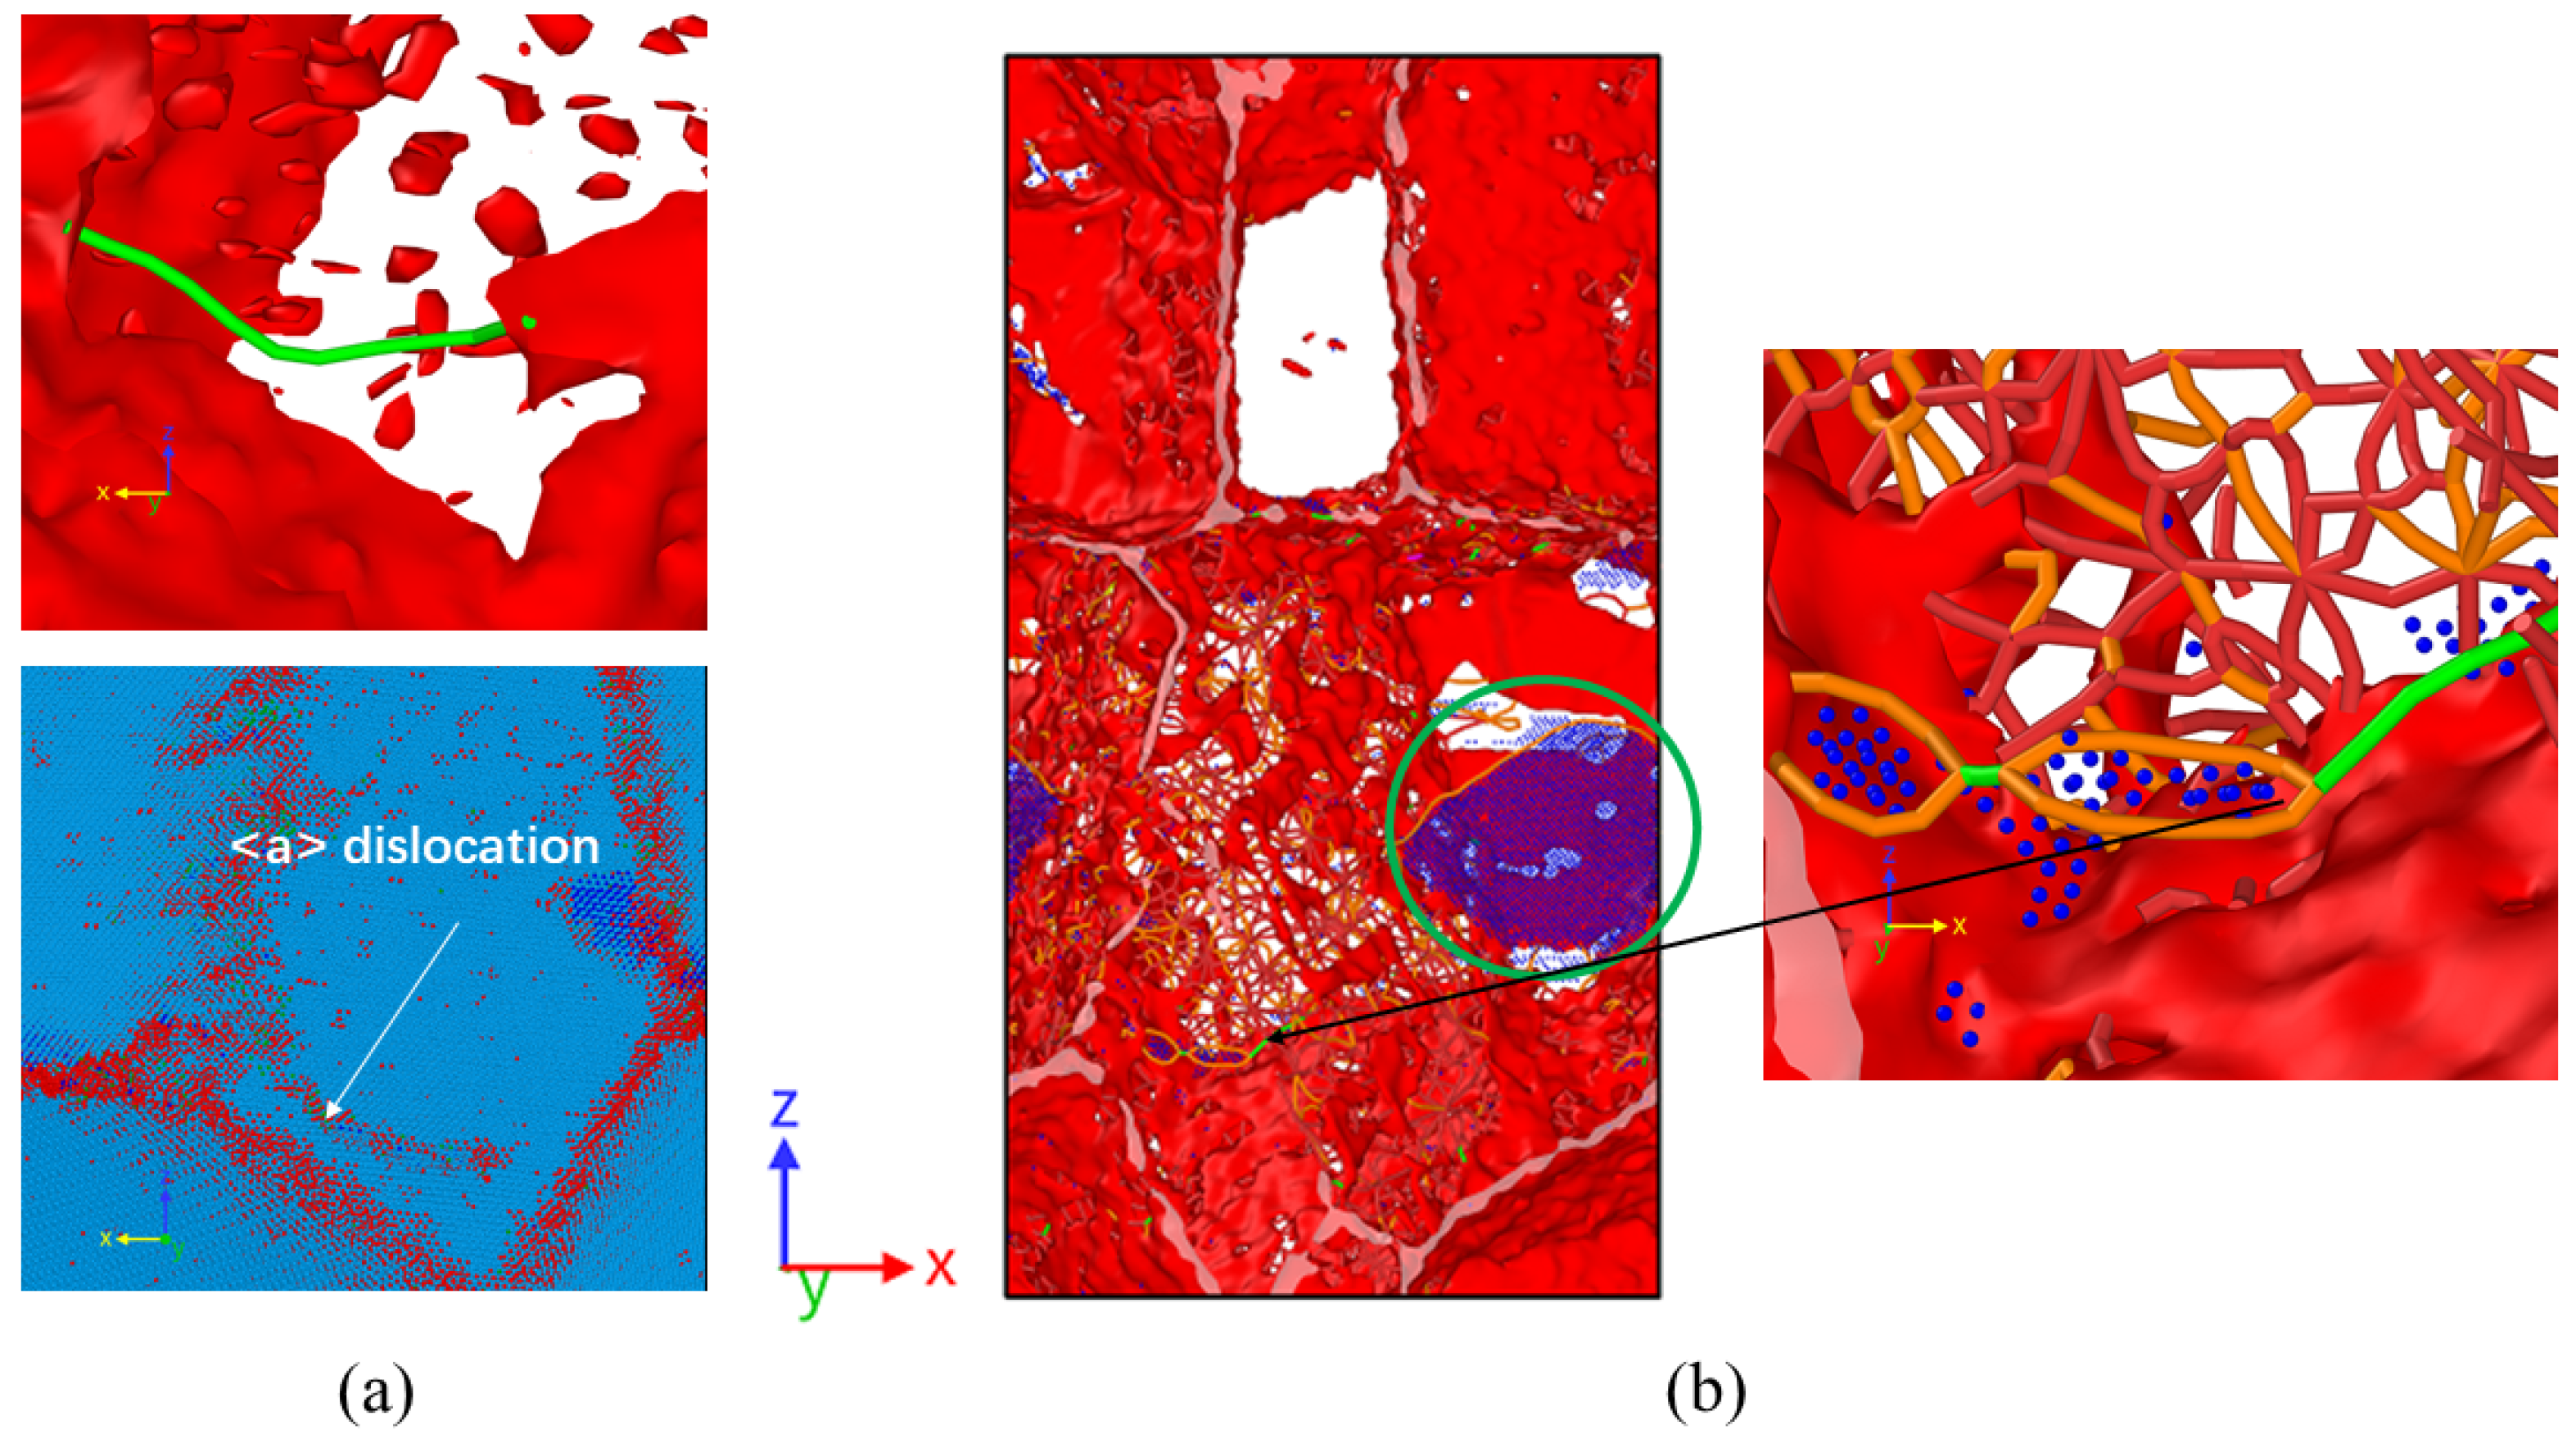
Figure 5.
Local snapshots of the SPD gliding at strains of (a) 2.75%, (b) 3.3%, (c) and (d) 4.5 and (e) 5% at a temperature of 300 K. In these subfigures, only fcc atoms are shown. The colors and lines have the same meaning as in Figure 2 and Figure 4. (c,d) Views from the positive and negative y-directions. For a clear visualization of the traced SPDs, in (d,e), the front and hind parts are removed. In (e), the green arrows show the glide direction of SPD2. (f) A local atomic snapshot of the sample at a strain of 3.6%.
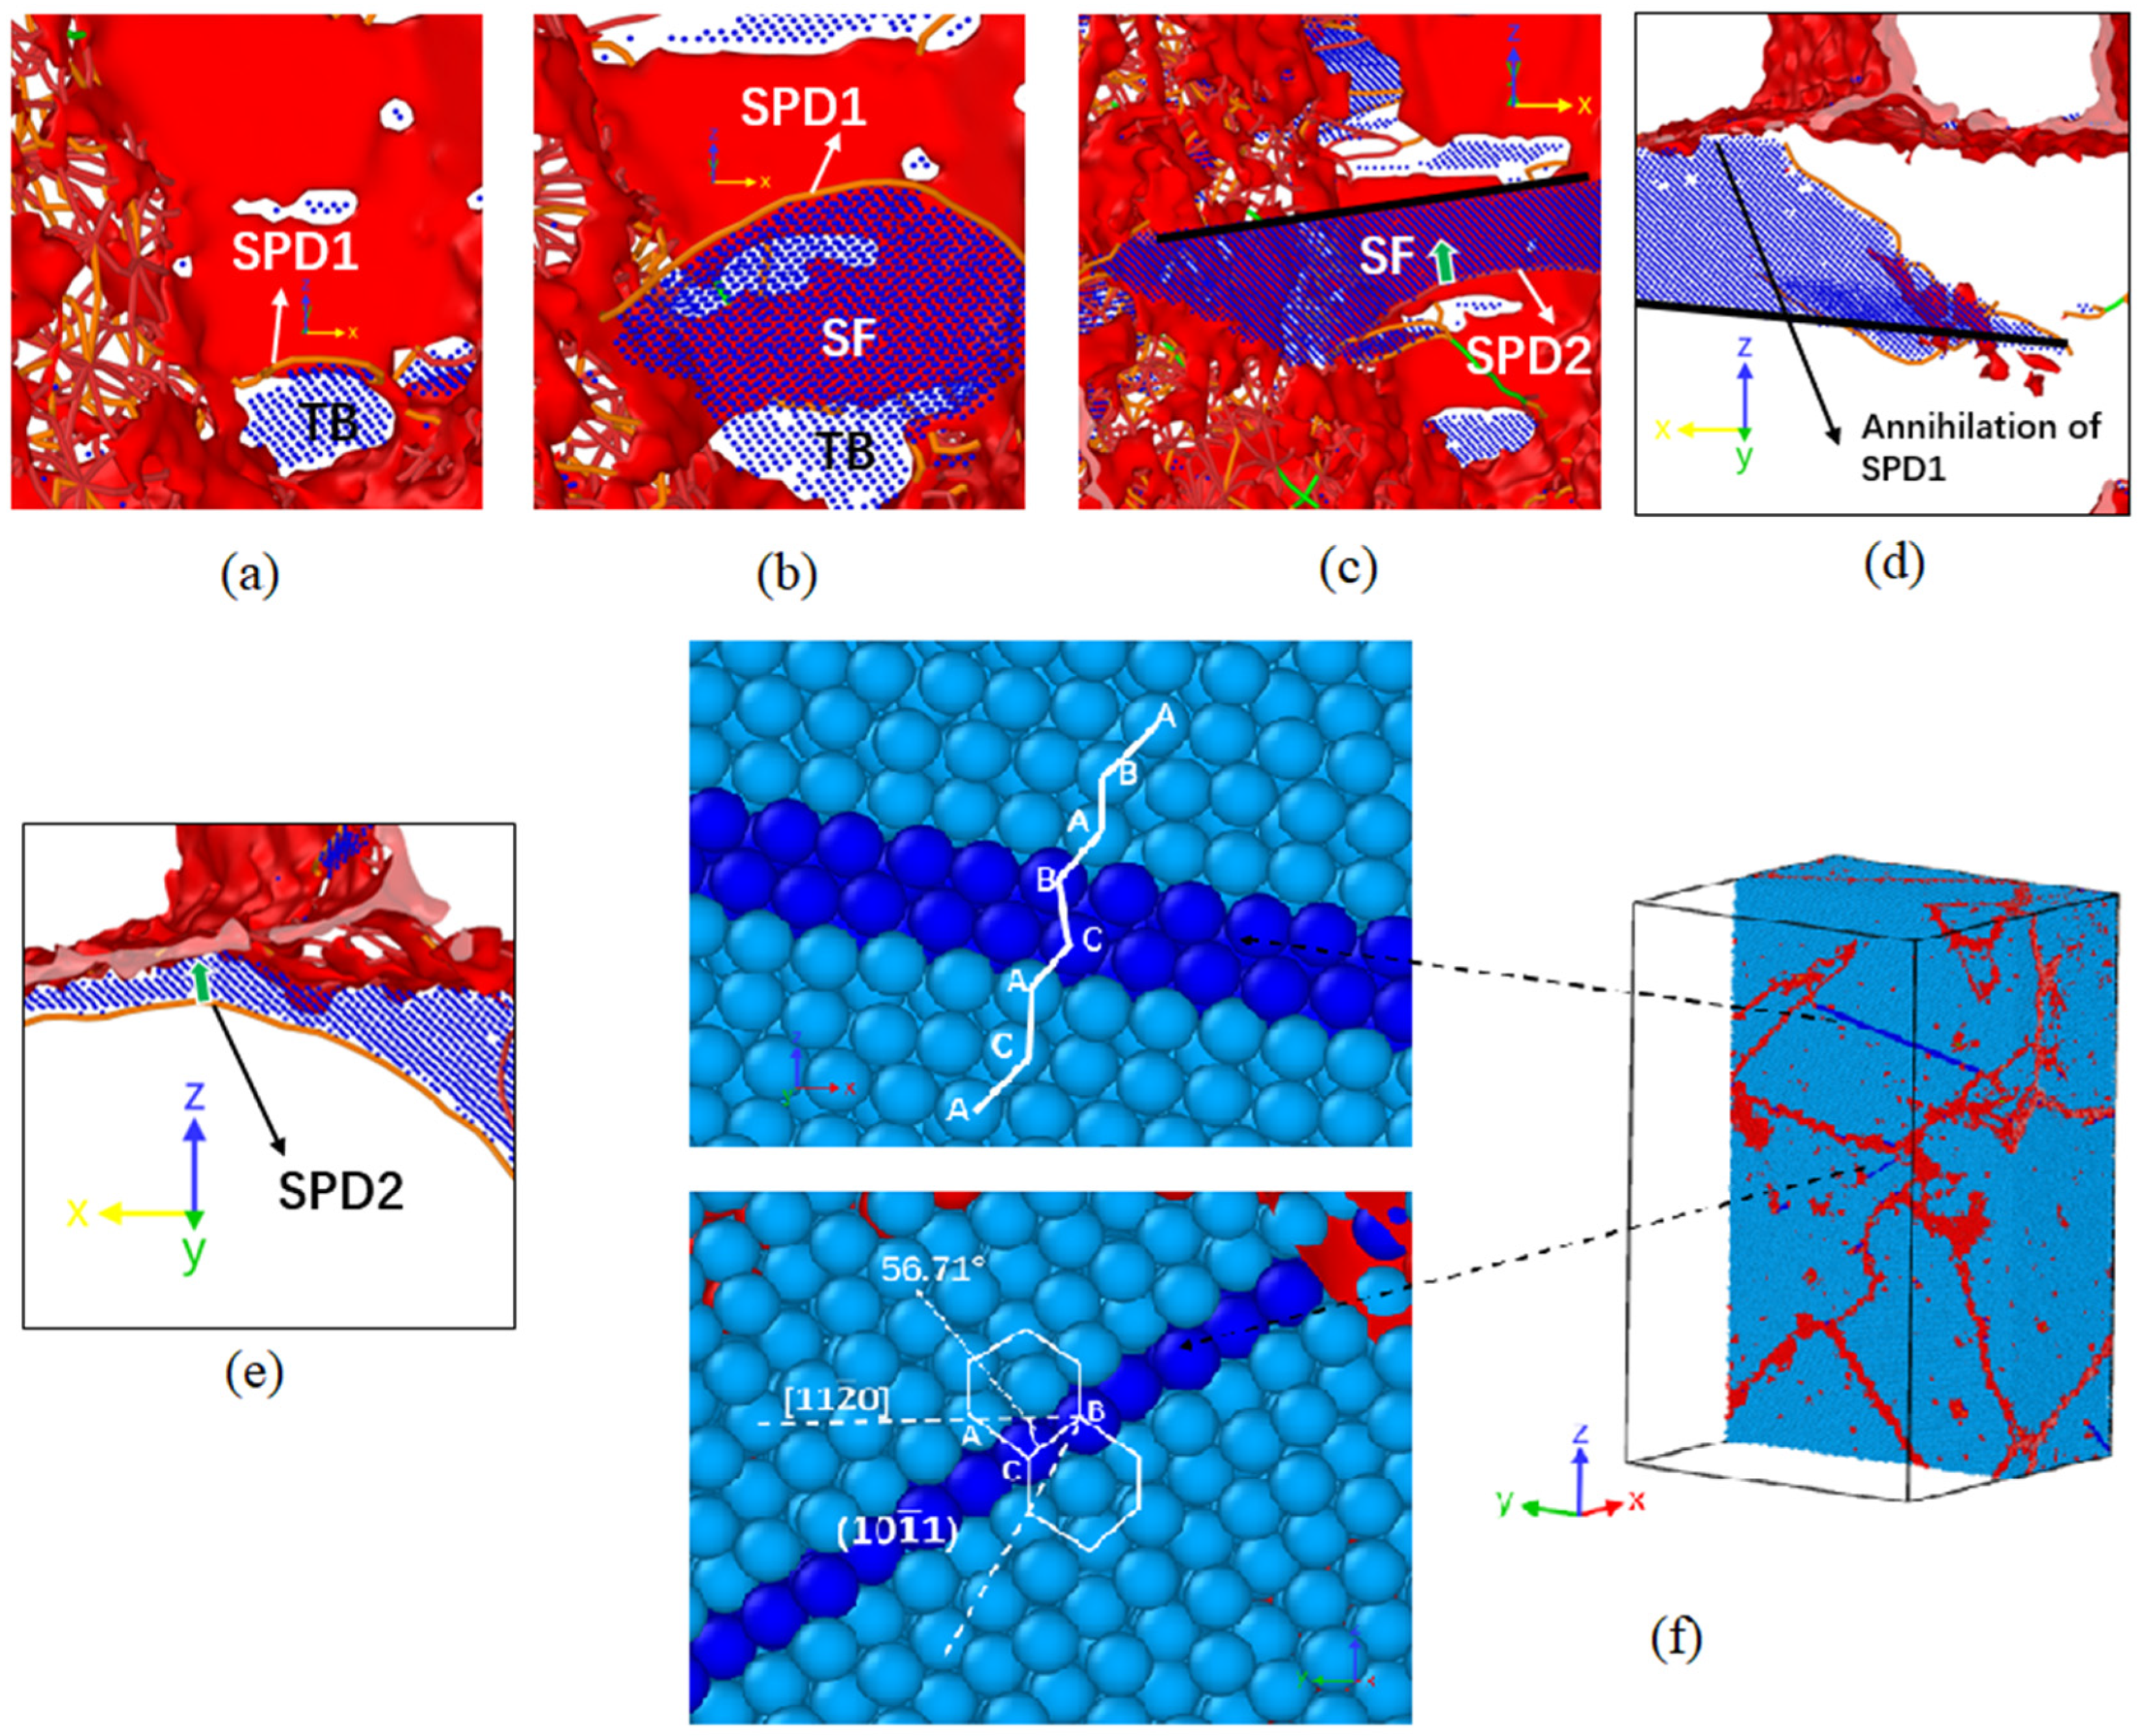
Figure 6.
Dislocation bundles and cross slip at a local position at the compressive strains of (a) 5.05%, (b) 5.15%, (c) 5.3%, (d) 5.75% and (e–g) 8.8% at a temperature of 300 K. The white arrows only indicate the dislocations and do not show the moving direction. In subfigure (f), the white hexagon displays one unit cell to confirm the basal plane. In subfigure (g), the parallel geometric relationship among slip plane I (SPD1 and 2), plane II (SPD5 and 6) and plane III (SPD 3 and 4) are displayed in another angle of view. All colors have equivalent meanings to those in the previous figures.
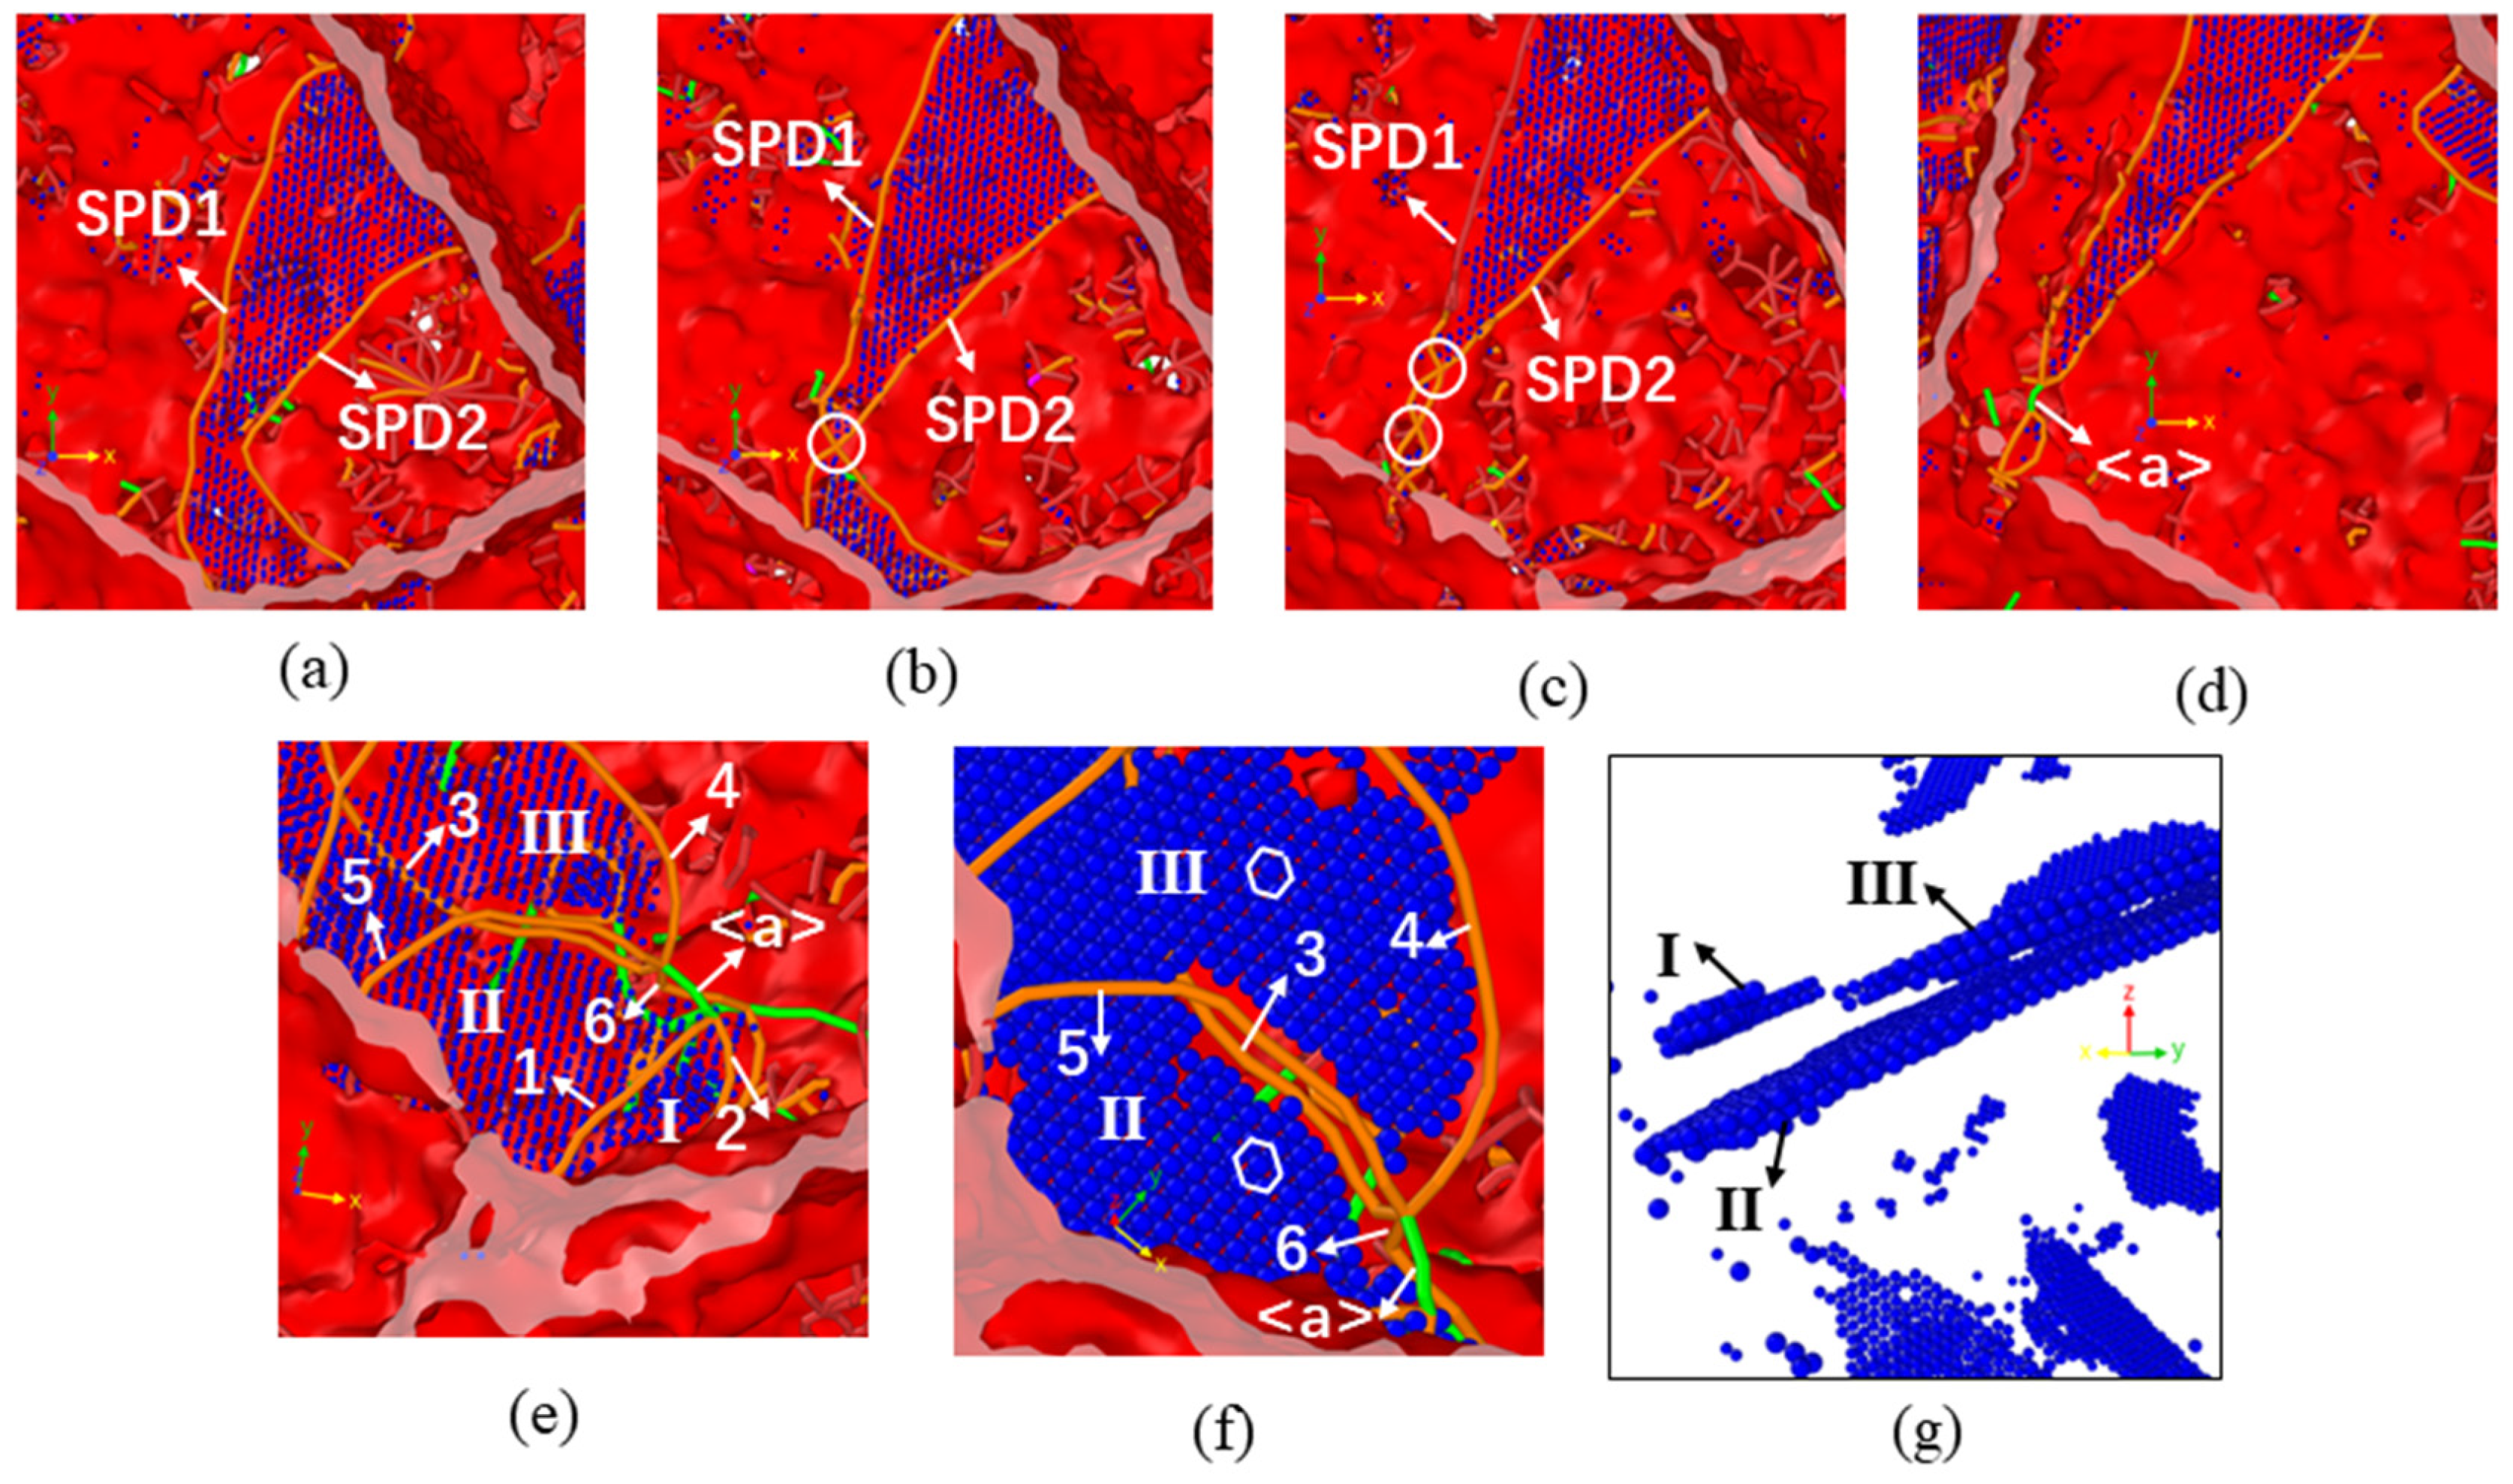
Figure 7.
Change in total dislocation density (a) and <a> dislocation density (b) during the compression process.
Figure 7.
Change in total dislocation density (a) and <a> dislocation density (b) during the compression process.
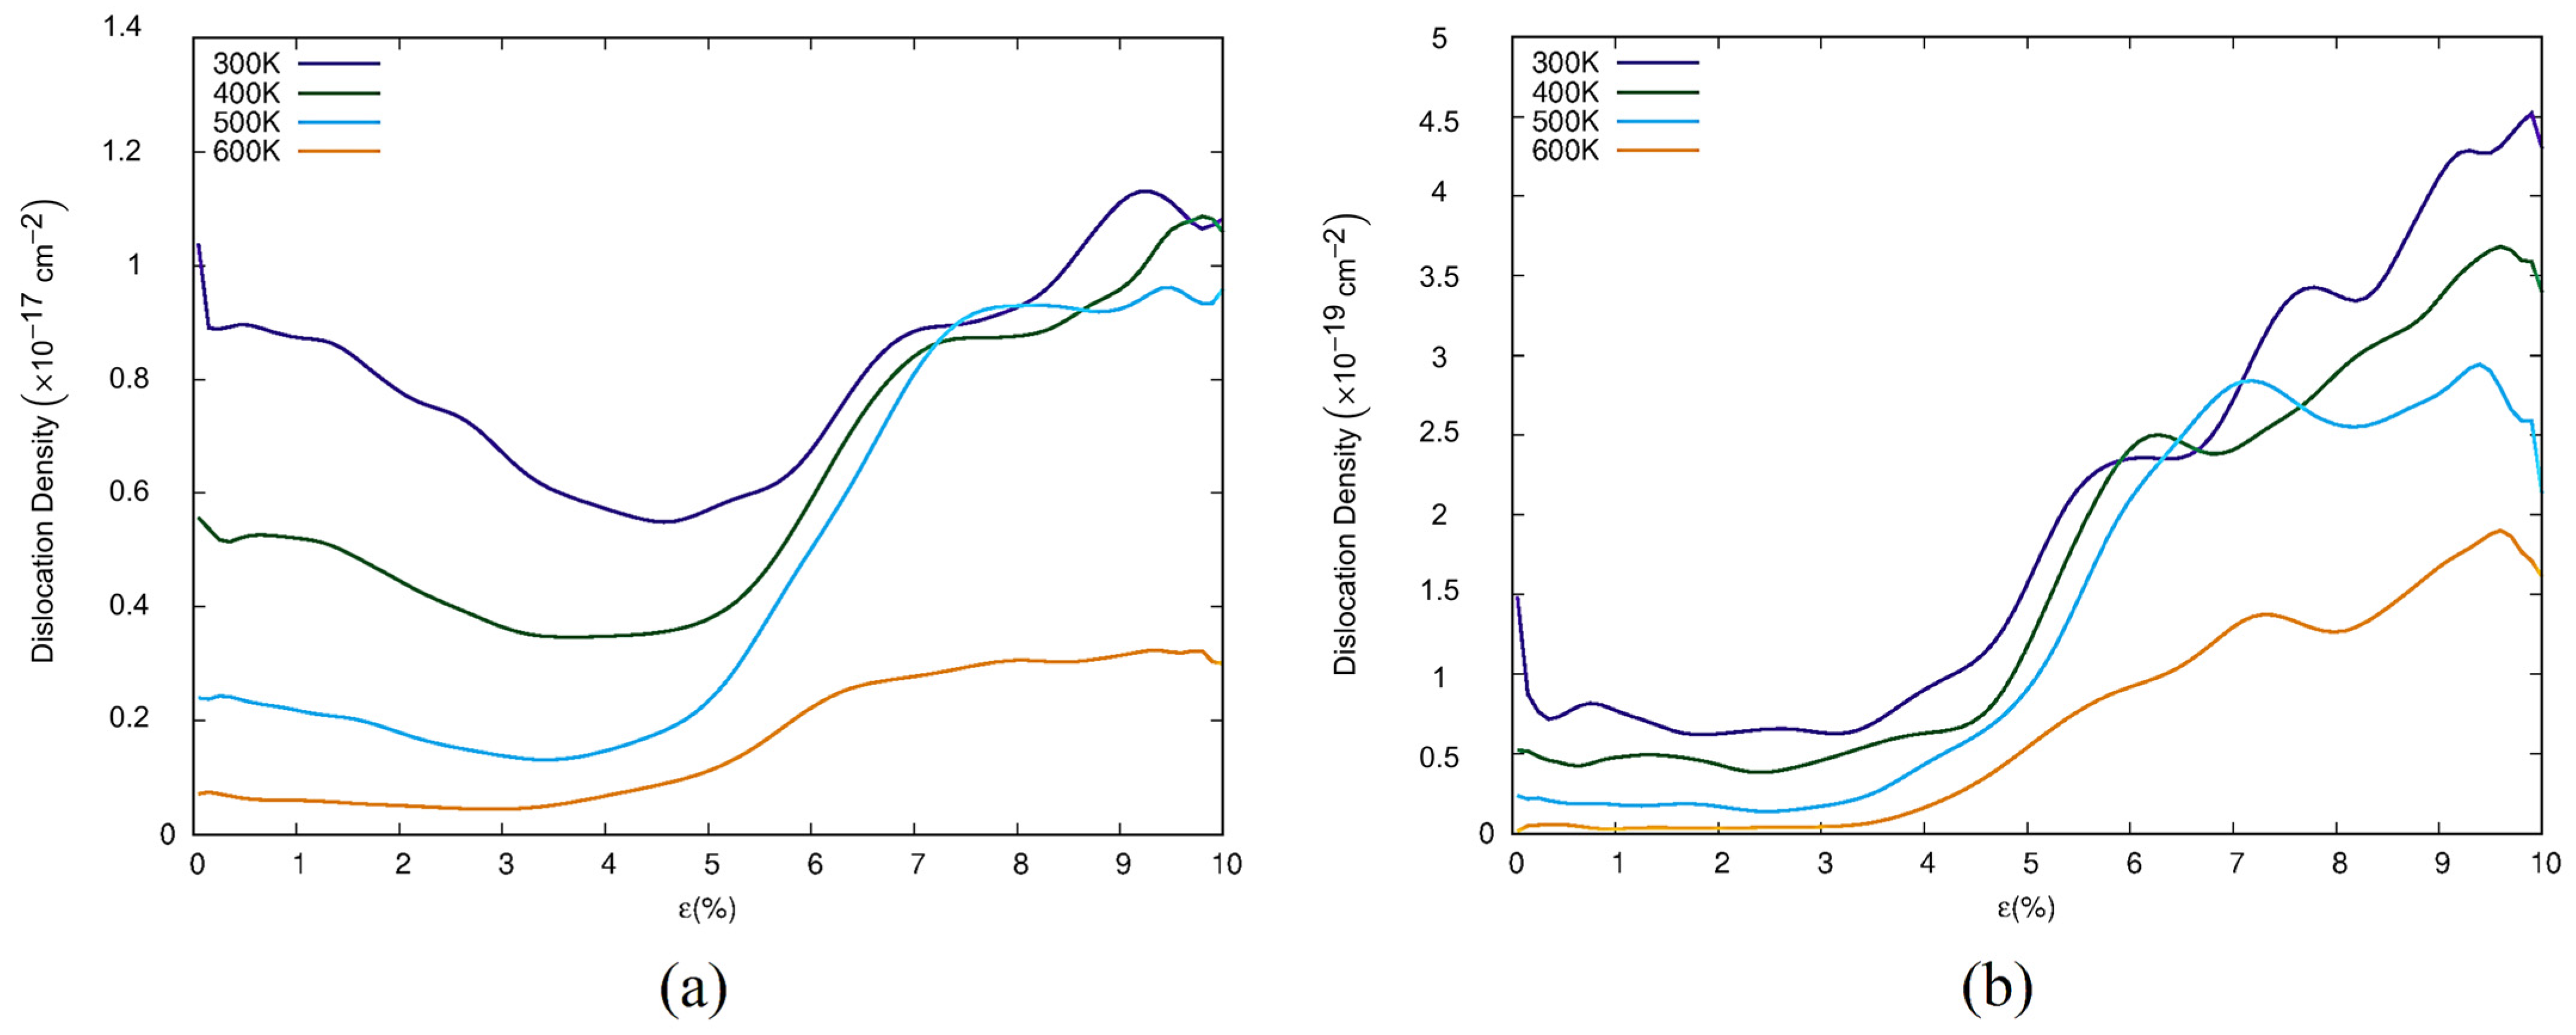
Figure 8.
Grain number change during compression at various temperatures (a) and fraction number against grain size at various strains for 300 K (b) and 600 K (c).
Figure 8.
Grain number change during compression at various temperatures (a) and fraction number against grain size at various strains for 300 K (b) and 600 K (c).
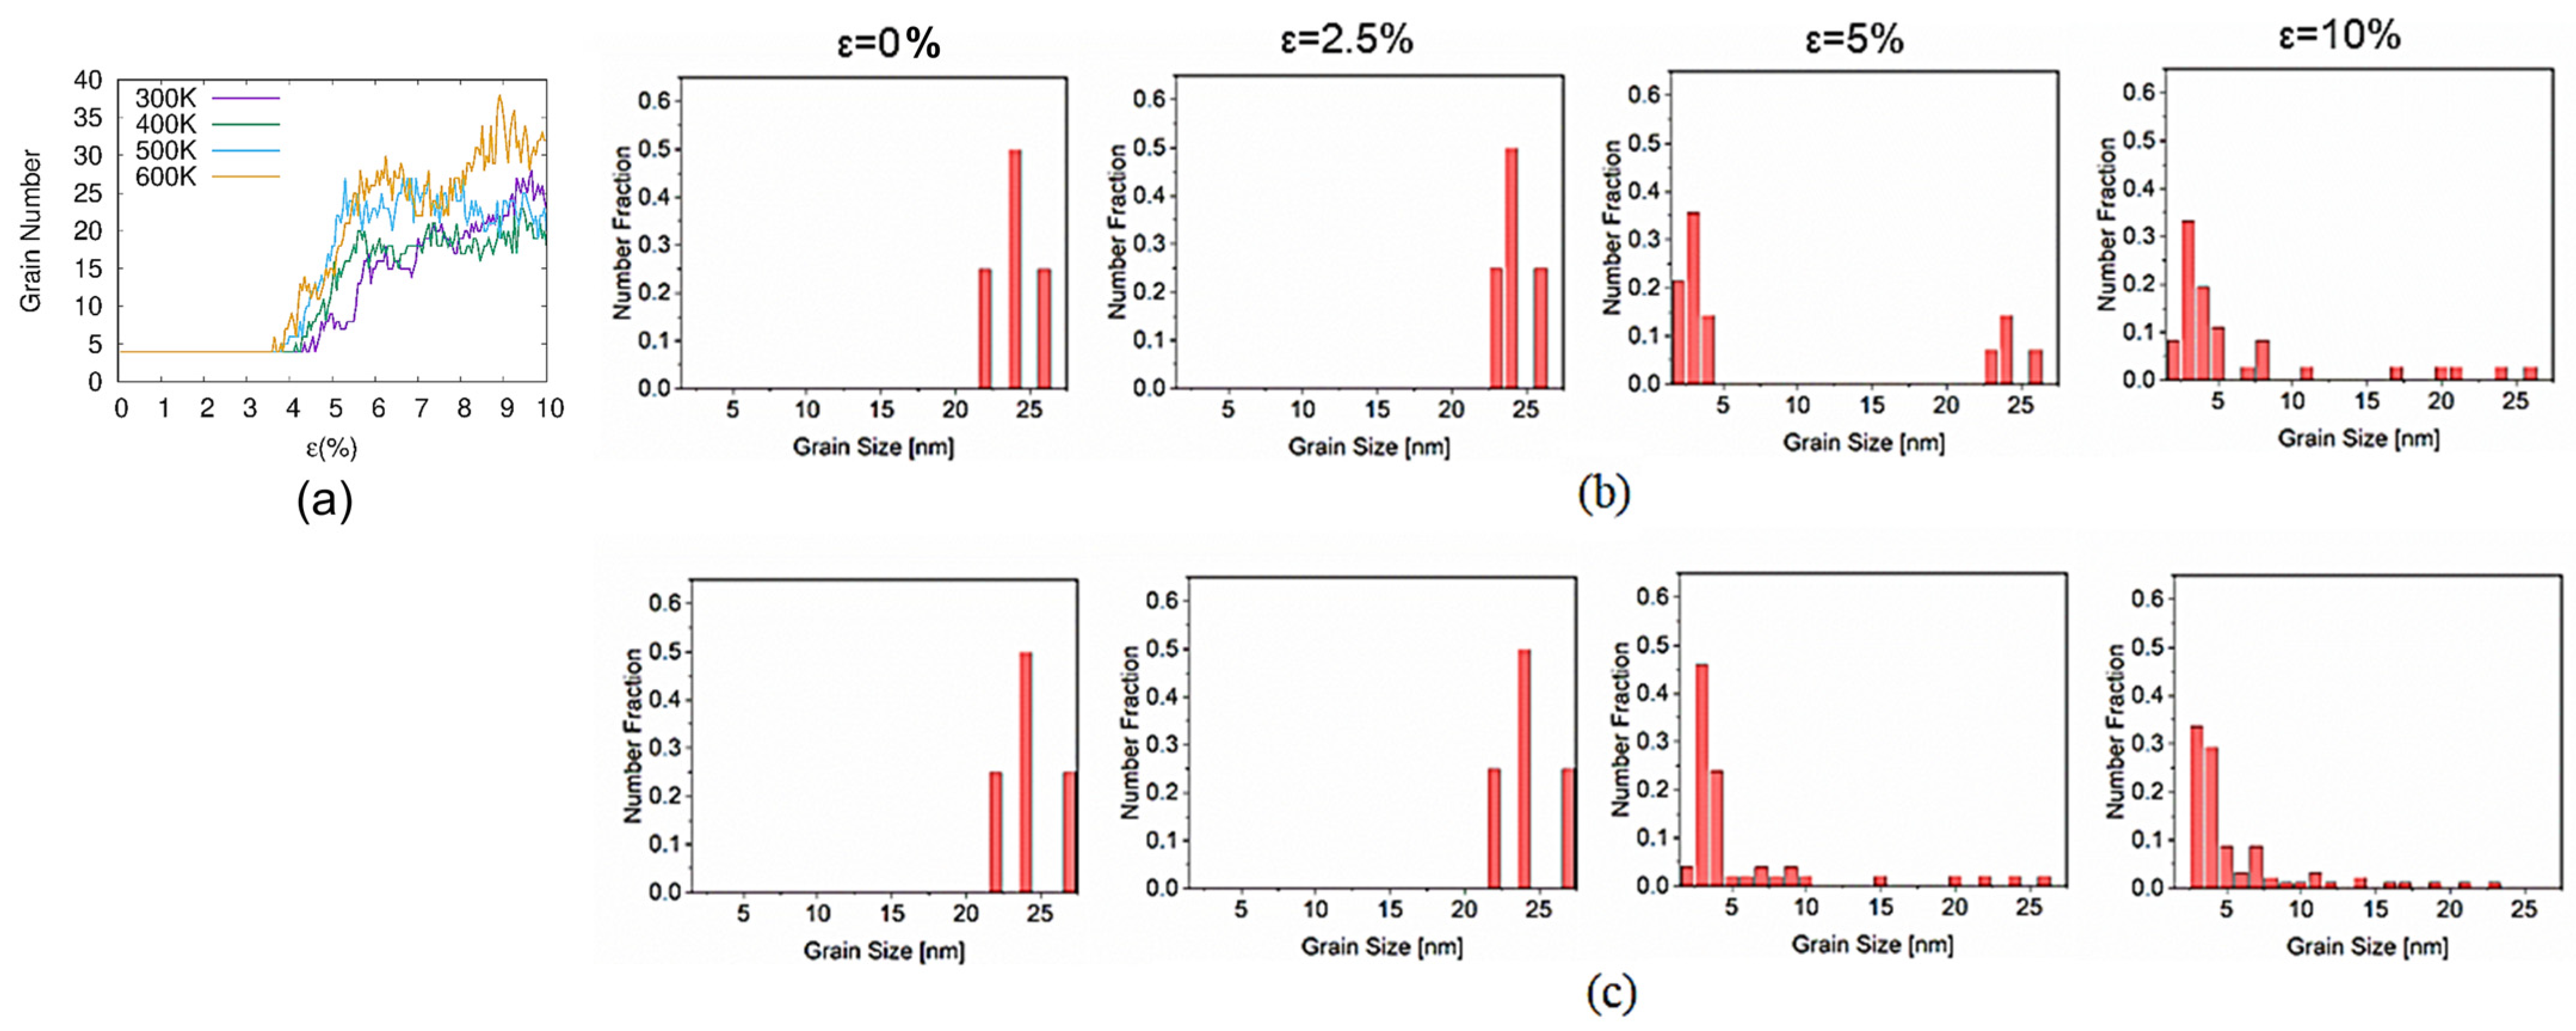
Figure 9.
Color mapping of the local lattice orientation during the compression process for the 300 K case. The planes shown are perpendicular to the z-axis and sliced in the middle. The upper atoms are removed. The upper subfigures display the orientation of the crystallites based on the PTM analysis. Each color represents a certain orientation. The lower subfigures show the corresponding results from a-CNA analysis. Subfigure (a) displaces a local part of the original sample at zero strain. In (b–e), only the parts in the white circle are shown as enlarged. The colors of the a-CNA maps indicate the local crystalline structure. light blue: hcp; dark blue: fcc; green: bcc; red: unknown. Subfigure (f) denotes the final state at a strain of 20%.

Figure 10.
Color mapping of the local lattice orientation during the compression process at 600 K at some different strains from 0% to 20% (a–g). The sample is sliced in the middle in the z-direction and the upper atoms are removed, as Figure 9.
Figure 10.
Color mapping of the local lattice orientation during the compression process at 600 K at some different strains from 0% to 20% (a–g). The sample is sliced in the middle in the z-direction and the upper atoms are removed, as Figure 9.
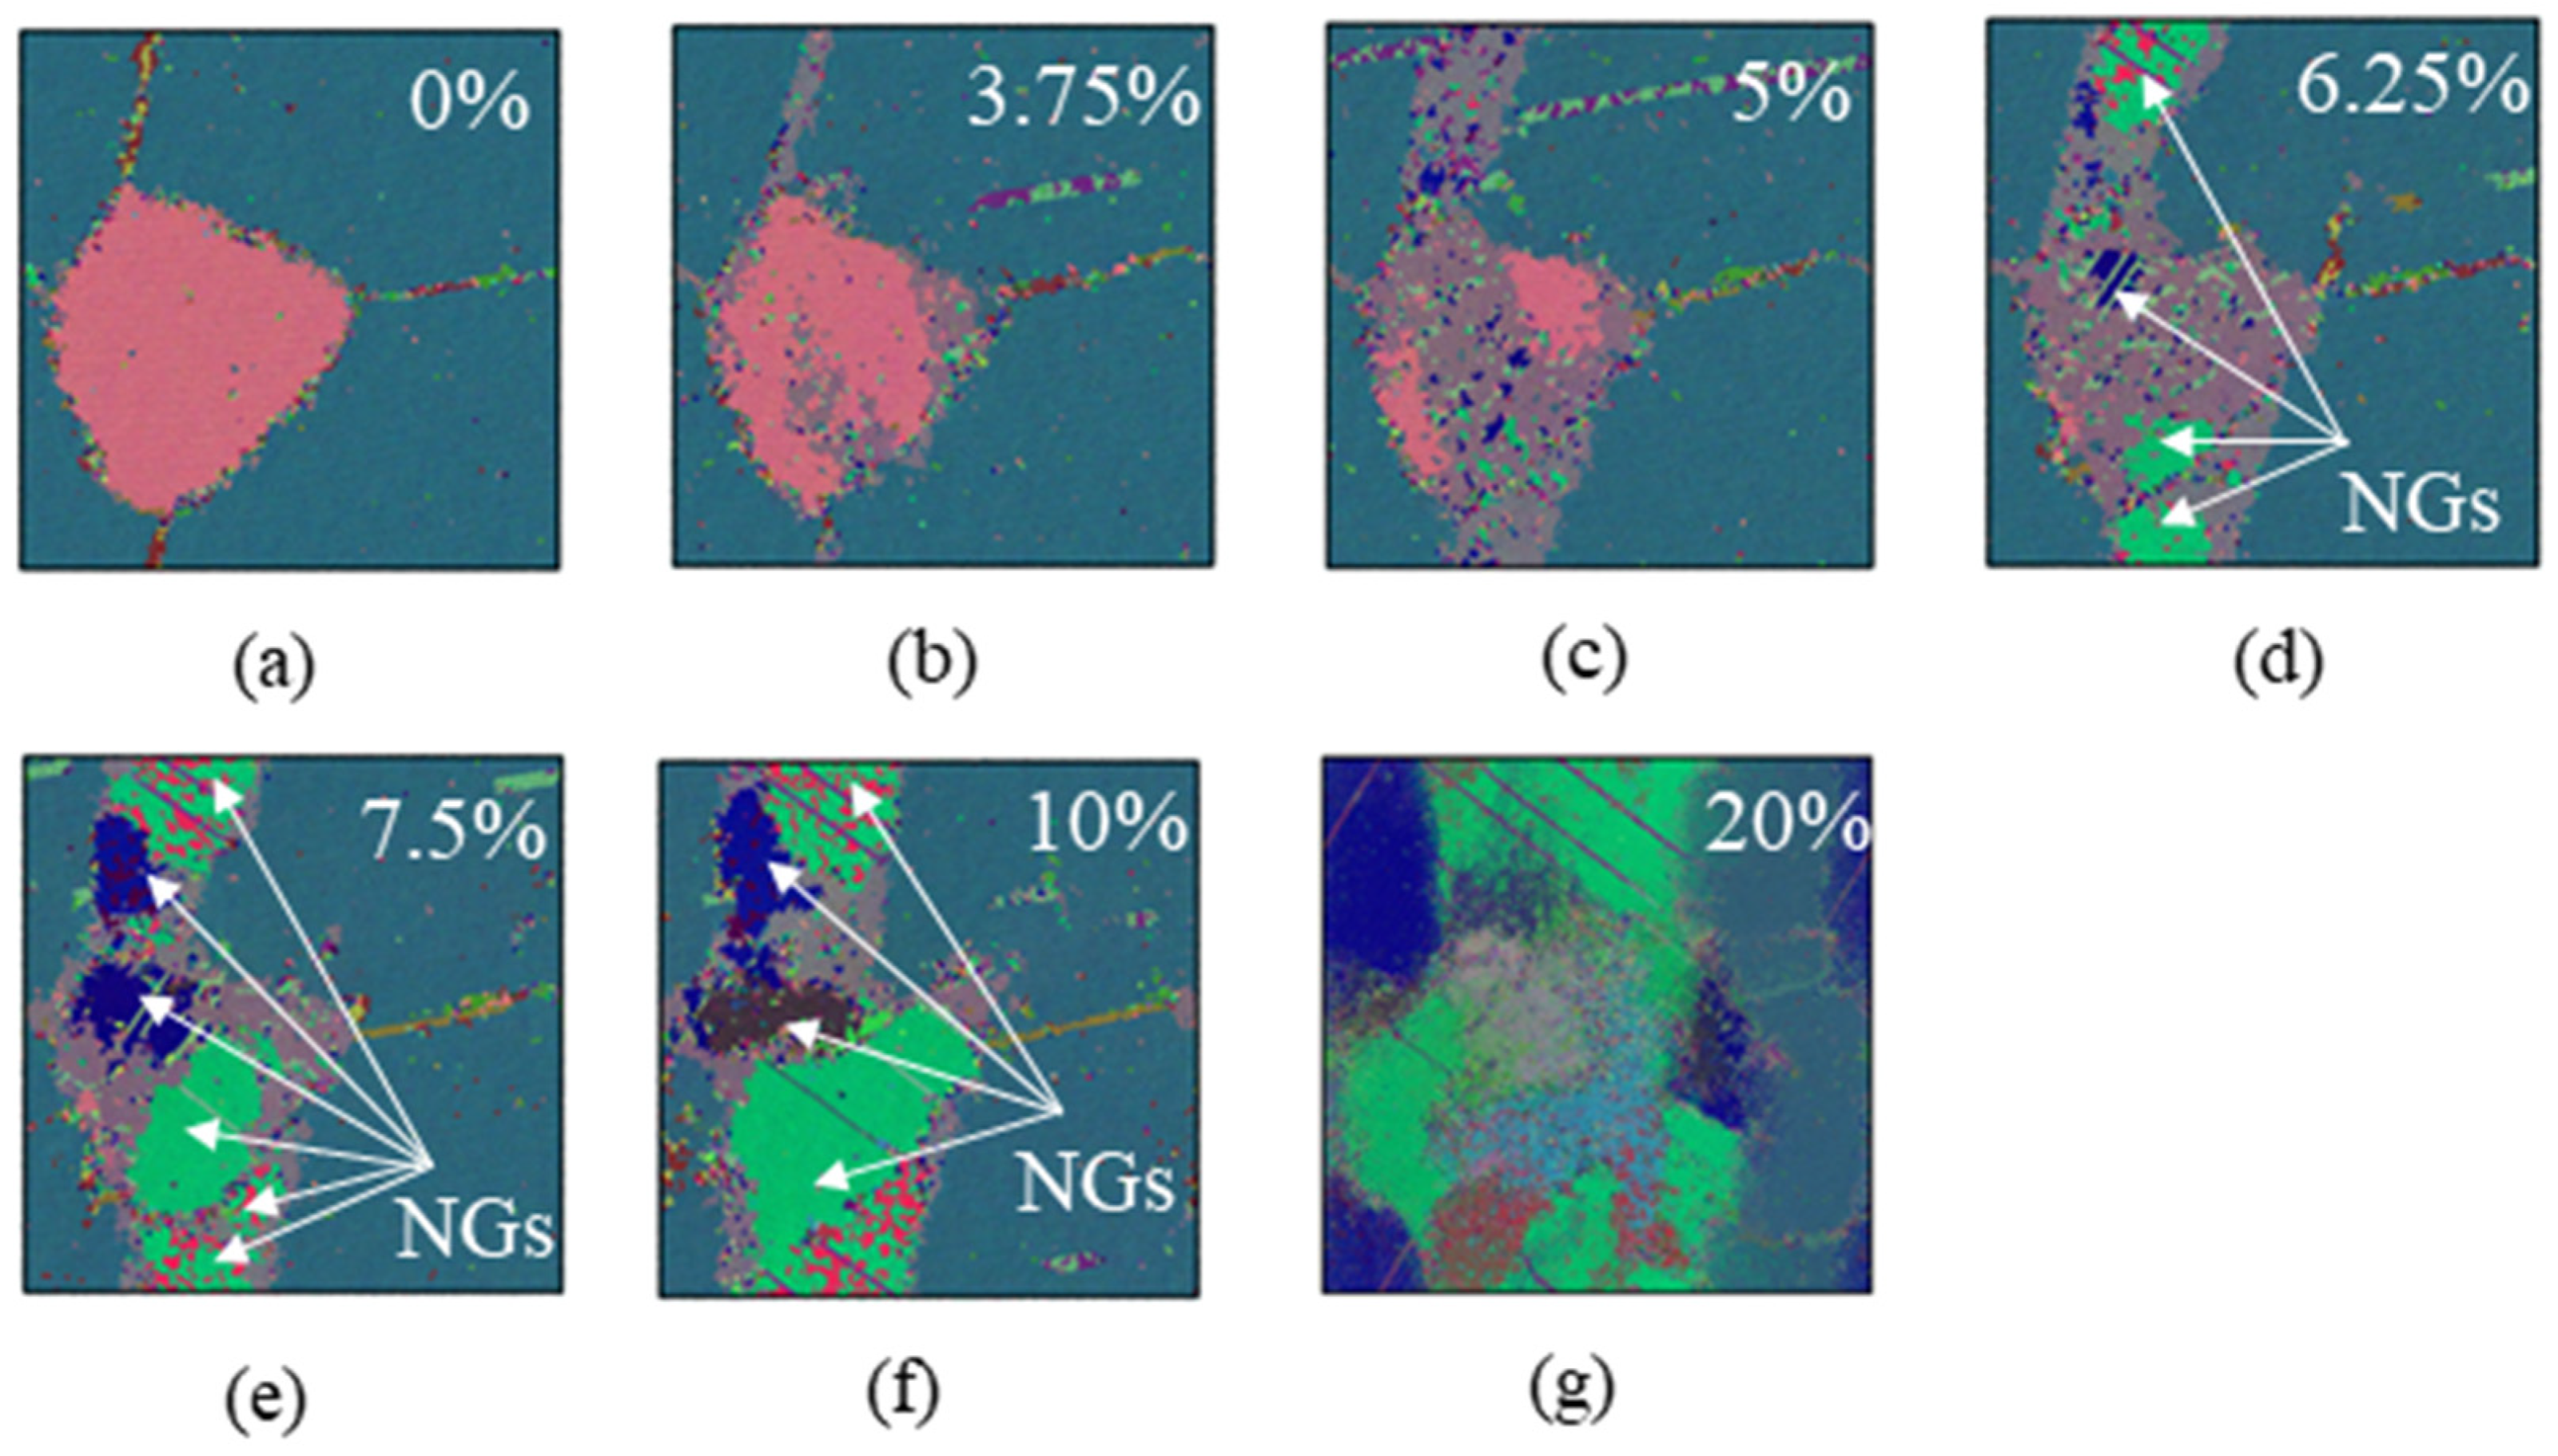
Figure 11.
The change of the [100] direction that indicated by the black dashed arrows at the strains of 0% and 20%.
Figure 11.
The change of the [100] direction that indicated by the black dashed arrows at the strains of 0% and 20%.
Disclaimer/Publisher’s Note: The statements, opinions and data contained in all publications are solely those of the individual author(s) and contributor(s) and not of MDPI and/or the editor(s). MDPI and/or the editor(s) disclaim responsibility for any injury to people or property resulting from any ideas, methods, instructions or products referred to in the content. |
© 2023 by the authors. Licensee MDPI, Basel, Switzerland. This article is an open access article distributed under the terms and conditions of the Creative Commons Attribution (CC BY) license (https://creativecommons.org/licenses/by/4.0/).
Share and Cite
MDPI and ACS Style
Zhang, C.; Xu, C.; Li, Y.; Wang, B.; Guo, Y. Temperature Effect on the Deformation Behavior in Nanocrystalline Magnesium under Compression: An Atomistic Study. Crystals 2023, 13, 1479. https://doi.org/10.3390/cryst13101479
AMA Style
Zhang C, Xu C, Li Y, Wang B, Guo Y. Temperature Effect on the Deformation Behavior in Nanocrystalline Magnesium under Compression: An Atomistic Study. Crystals. 2023; 13(10):1479. https://doi.org/10.3390/cryst13101479
Chicago/Turabian StyleZhang, Cheng, Chun Xu, Yu Li, Binjun Wang, and Yanhui Guo. 2023. "Temperature Effect on the Deformation Behavior in Nanocrystalline Magnesium under Compression: An Atomistic Study" Crystals 13, no. 10: 1479. https://doi.org/10.3390/cryst13101479
Note that from the first issue of 2016, this journal uses article numbers instead of page numbers. See further details here.