Article

Spectroscopic and Crystallographic Characterization of Two Hydrochloride Cathinones: 1-(4-fluoro-3-methylphenyl)-2-(pyrrolidin-1-yl)pentan-1-one (4-F-3-Me-α-PVP) and N-ethyl-2-amino-1-phenylheptan-1-one (N-ethylheptedrone)

1
Institute of Chemistry, University of Silesia, 9 Szkolna Street, 40-006 Katowice, Poland
2
Analytical-Criminalistic Laboratory FedaLab, 18/1A Fredry Street, 40-662 Katowice, Poland
3
A. Chełkowski Institute of Physics, University of Silesia, 1, 75 Pułku Piechoty Street, 41-500 Chorzów, Poland
4
Institute of Organic Chemistry, Polish Academy of Sciences, 44/52 Kasprzaka Street, 01-224 Warsaw, Poland
*
Author to whom correspondence should be addressed.
Crystals 2023, 13(6), 934; https://doi.org/10.3390/cryst13060934
Submission received: 23 May 2023 / Revised: 5 June 2023 / Accepted: 6 June 2023 / Published: 10 June 2023

Abstract

:
In this paper, two cathinone derivatives, 4F-3Me-α-PVP and N-ethylheptedrone, seized on the illegal drug market in Poland, were described and characterized by various instrumental analytical methods. The compounds were characterized by electrospray ionization mass spectrometry, high-resolution mass spectrometry, gas chromatography–mass spectrometry, infrared spectroscopy, X-ray crystallography, thermogravimetric analysis, differential scanning calorimetry and nuclear magnetic resonance spectroscopy. The two tested compounds were confirmed as 1-(4-fluoro-3-methylphenyl)-2-(pyrrolidin-1-yl)pentan-1-one and N-ethyl-2-amino-1-phenylheptan-1-one hydrochlorides; both are cathinone derivatives available on the market for new psychoactive substances (NPS). The obtained analytical data should be useful for forensic and toxicological purposes in the rapid and reliable identification of compounds.

1. Introduction

The popularity of new psychoactive substances (NPS) has increased significantly in recent years; many new compounds appear on the market every year. Among the drugs with a stimulating effect, the most popular group are cathinone derivatives. These substances are becoming more and more popular, especially among young people who treat them as an alternative to illegal substances and use them recreationally. This leads to a number of health risks for users of these substances.
The market for new psychoactive substances includes many groups of chemical compounds. In the last decade, more than 50 new substances from this group have been identified every year. According to the European Early Warning System, around 880 new psychoactive substances were monitored at the end of 2021, and more than 400 previously reported substances are detected in Europe every year. In 2021 alone, 52 new psychoactive substances were reported for the first time. It should also be noted that in the last few years there has been a marked decrease in the number of new compounds entering the market, as compared to 2014–2015, when more than 100 new substances were reported annually.
This may be related to the tightening of the law on the possession and marketing of new psychoactive substances in many countries [1].
Only in recent years have governments in many countries begun to introduce legislation to ban NPS drugs. Previously, these substances were treated by recipients as “legal” alternatives to “classic” drugs. In Poland, regulations prohibiting most substances from this group were introduced in August 2018 and since then new substances have been added to the list of controlled substances every year. Compounds that are among the most popular on the current NPS market are synthetic cathinones; their mode of action involves amphetamine-like or cocaine-like stimulation. The literature on the subject contains numerous reports on the effects of cathinone derivatives and reports of overdose cases [2,3,4,5,6,7].
Synthetic cathinones comprise a widespread group of compounds that have been present on the legal highs market for years, but subsequent chemical modifications make them an analytical challenge for toxicologists, doctors and law enforcement officers. Synthetic cathinones are similar to amphetamines; the only difference between synthetic cathinone and the corresponding amphetamine is the presence (in the cathinone) of a carbonyl group at the β position with respect to the amino group. For this reason, synthetic cathinones are called β–keto-amphetamines. Since cathinone is a β–ketone derivative of amphetamine, it has a stimulating and sympathomimetic effect on the central nervous system.
Synthetic cathinone analogs include several groups of different derivatives, including pyrrolidine and unsubstituted cyclic derivatives, which are the subject of this work.
Due to the constantly growing number of new psychoactive substances appearing on the market and the known production of psychoactive substances with a modified structure, it seems necessary to provide new analytical data allowing for their unambiguous identification in the NPS products available on the market.
This paper presents the physical and chemical characteristics of 1-(4-fluoro-3-methylphenyl)-2-(pyrrolidin-1-yl)pentan-1-one (4F-3Me-α-PVP, MFPVP) hydrochloride (compound 1) and N-ethyl-2-amino-1-phenylheptan-1-one (N-ethylheptedrone) hydrochloride (compound 2), the structures of which are shown in Figure 1. Both tested compounds are modifications of the well-known and popular α-PVP (1-phenyl-2-(1-pyrrolidinyl)pentan-1-one) and NEH (N-ethyl-2-amino-1-phenylhexan-1-one).
Data for the characterization of compounds 1 and 2 were obtained by gas chromatography–mass spectrometry (GC-MS), direct infusion electrospray ionization mass spectrometry (ESI-MS), high-resolution mass spectrometry (HR-MS), infrared (IR), X-ray crystallography, thermogravimetric analysis (TGA), differential scanning calorimetry (DSC) and nuclear magnetic resonance (NMR) spectroscopy. Since the captured materials that have appeared on the NPS market very often contain crystal particles, the obtained crystallographic data can be used for their quick, non-invasive and unambiguous identification, which does not require preliminary sample preparation for testing. Part of the analytical data of the tested compounds has already been published as analytical reports without further discussion [8,9].
To our knowledge, this is the first report that identifies and characterizes compounds 1 and 2 in the seized material in detail.

2. Materials and Methods

2.1. Chemicals

In our study, the methanol (Sigma-Aldrich, Poznań, Poland) used for the analysis was of HPLC grade. Deuterated dimethyl sulfoxide (DMSO-d6) for NMR analysis was purchased from Sigma-Aldrich.

2.2. Sample Preparation

The samples were provided by a law enforcement agency as materials seized from the illicit drug market, and both were in pure powdered form. For gas chromatography and electrospray ionization mass spectrometry, 10 mg of each sample was dissolved in 1 mL of methanol without the need for sonication. A 10 µL aliquot was taken from the solution, diluted 100-fold with methanol and analyzed by GC-MS and ESI-MS. For NMR spectroscopic analysis, 10 mg of each sample was dissolved in 0.6 mL of deuterated dimethyl sulfoxide (DMSO-d6). IR analyses were performed without further processing of the sample.

2.3. Gas Chromatography–Mass Spectrometry (GC-MS) Analysis

A Thermo Trace Ultra chromatograph coupled to a Thermo DSQ mass spectrometer (Thermo Scientific, Waltham, MA, USA) was used for GC-MS analysis. Analyses were performed using an Rxi®-5Sil MS column (Restek, Bellefonte, PA, USA). The following operating parameters were used: injector temperature 260 °C; oven temperature, 100 °C for 2 min, temperature rise 20 °C/min to 260 °C; carrier gas (helium) flow rate, 1.2 mL/min; MS transmission line temperature, 250 °C; source temperature MS, 250°C; injection volume, 1 μL splitless mode.

2.4. Direct Infusion Electrospray Ionization Mass Spectrometry (ESI-MS)

A Thermo TSQ Vantage mass spectrometer with electrospray ionization source (Thermo Scientific, Waltham, MA, USA) was used. The following working parameters for the direct infusion ESI-MS experiment were employed: sheath gas pressure, 5 psi; H-ESI vaporizer temperature, 50 °C; spray voltage, 3500 V; ion transfer tube temperature, 50 °C; direct infusion syringe flow rate, 5 μL/min. The obtained data were processed using Xcalibur and TSQTune software (Thermo Scientific, Waltham, MA, USA). The analytes were electrosprayed in the positive mode (ESI(+)-MS). Fragmentation in the ESI-MS2 mode was carried out in the scanning range of m/z 50–262 and m/z 50–250 for compounds 1 and 2, respectively. The ESI-carrier and collision gases were nitrogen and argon, respectively.

2.5. High-Resolution Mass Spectrometry (HR-MS)

Mass spectrometry analyses were performed using Ultra-Performance Liquid Chromatograph ACQUITY UPLC I-Class (Waters Milford, MA, USA) coupled with Synapt G2-S mass spectrometer (Waters Milford, MA, USA) equipped with the electrospray ion source and quadrupole-time-of-flight mass analyzer. The resolving power of the TOF analyzer was set to 20,000 FWHM. The instrument was controlled and recorded data were processed using the MassLynx V4.1 software package (Waters, Milford, MA, USA). The mass spectrometry measurements were performed in the positive mode. The measurements in positive mode were performed with a capillary voltage set to 3.00 kV. The desolvation gas flow was 700 L/h and the temperature was set to 300 °C. The sampling cone voltage and source offset were set to 20 V and the source temperature was 120 °C. The sample was dissolved in methanol and injected directly into the electrospray ion source. The instrument worked with external calibration on sodium formate in the mass range of m/z = 50–1200. The leucine-enkephalin solution was used as the lock-spray reference material. The lock-spray spectrum of the leucine-enkephalin was generated by the lock spray source and correction was performed for every spectrum. The exact mass measurements for all peaks were performed within a 3 mDa mass error.

2.6. NMR Spectroscopy

The NMR spectra of the samples were recorded using an UltraShield 400 MHz instrument (Bruker, Bremen, Germany) and deuterated dimethyl sulfoxide (DMSO-d6) was used as the solvent. Data were collected with a chemical shift relative to the residual solvent signal.

2.7. Fourier Transform Infrared (FTIR) Spectroscopy

The infrared (IR) spectrum of the powder evidence was obtained with a Nicolet iS50 FT-IR Spectrometer (Thermo Scientific, Waltham, MA, USA)) using the ATR technique and the spectrum was collected in the 3500–400 cm−1 wavenumber range.

2.8. Thermogravimetric Analysis (TGA) and Differential Scanning Calorimetry (DSC)

Thermogravimetric analysis (TGA) was performed using a TGA/DSC1 thermal analyzer (Mettler-Toledo, Greifensee, Switzerland) with a heating rate of 10 °C/min in a stream of nitrogen (60 mL/min). Differential scanning calorimetry (DSC) was performed with the TA-DSC 2010 apparatus (TA Instruments, New Castle, DE, USA) under nitrogen atmosphere using aluminum sample pans. DSC experiments were carried out in a nitrogen atmosphere in the temperature range from 30 °C to 220 °C.

2.9. X-ray Single Crystal Diffraction Studies

The single-crystal X-ray experiments were performed at room temperature for compound 1 and at 100 K for compound 2. The data for compound 1 were collected using an Xcalibur four-circle kappa diffractometer with Sapphire 3 CCD detector (formerly Oxford Diffraction, currently Rigaku Oxford Diffraction, Rigaku Corporation, Tokyo, Japan). For the integration of the collected data, CrysAlisPro software [10] was used. In the case of compound 2, the SuperNova kappa diffractometer with Atlas CCD detector (formerly Agilent Technologies, currently Rigaku Oxford Diffraction, Rigaku Corporation, Tokyo, Japan) was used. For the integration of the collected data, CrysAlisPro software (Rigaku Corporation, Tokyo, Japan) [11] was used. The structures were solved using direct methods with SHELXS-2013 software (SBGrid Consortium, Boston, MA, USA ) and the solutions were refined using the SHELXL-2018/3 program [12]. CCDC 22 V
49500 and CCDC 2249501 contain supplementary crystallographic data for this paper. These data can be obtained free of charge from The Cambridge Crystallographic Data Centre via www.ccdc.cam.ac.uk/data_request/cif.

3. Results and Discussion

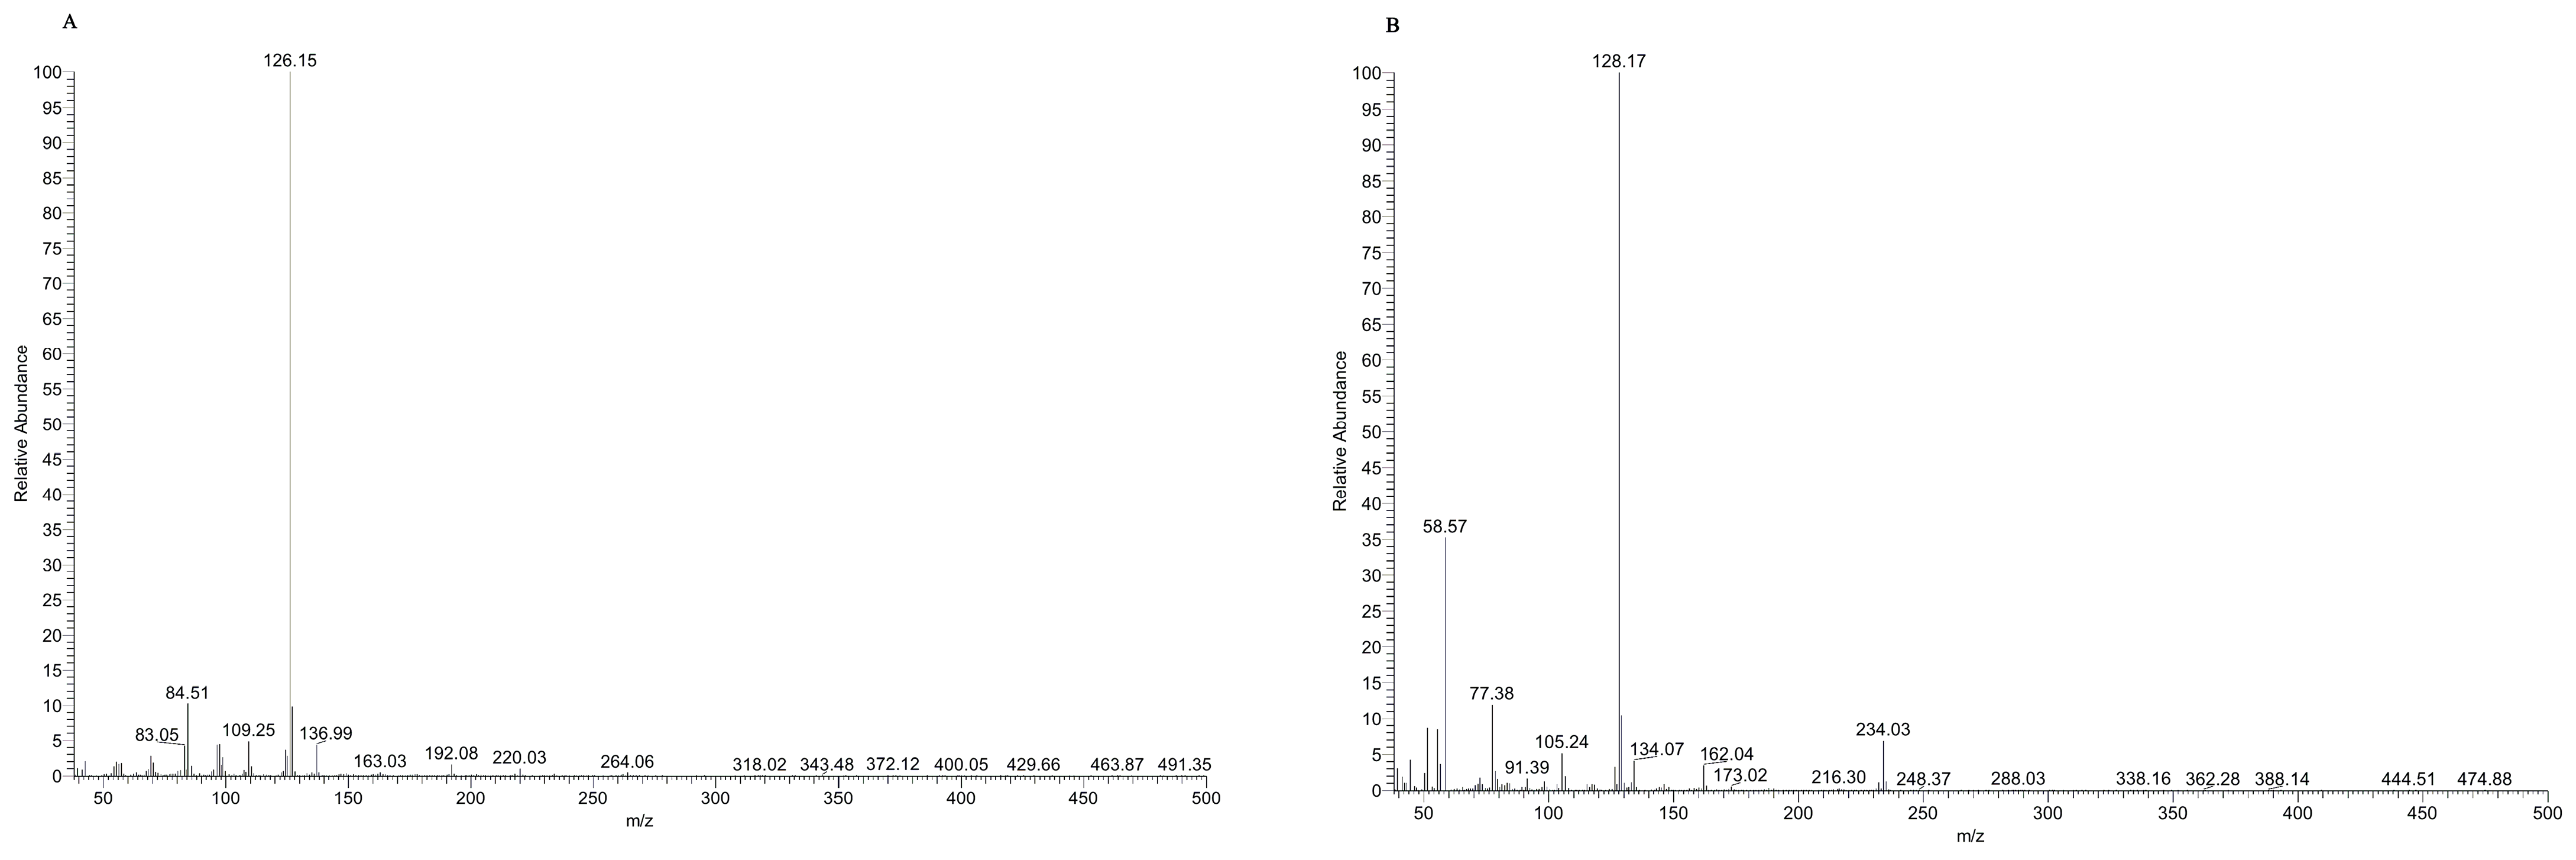
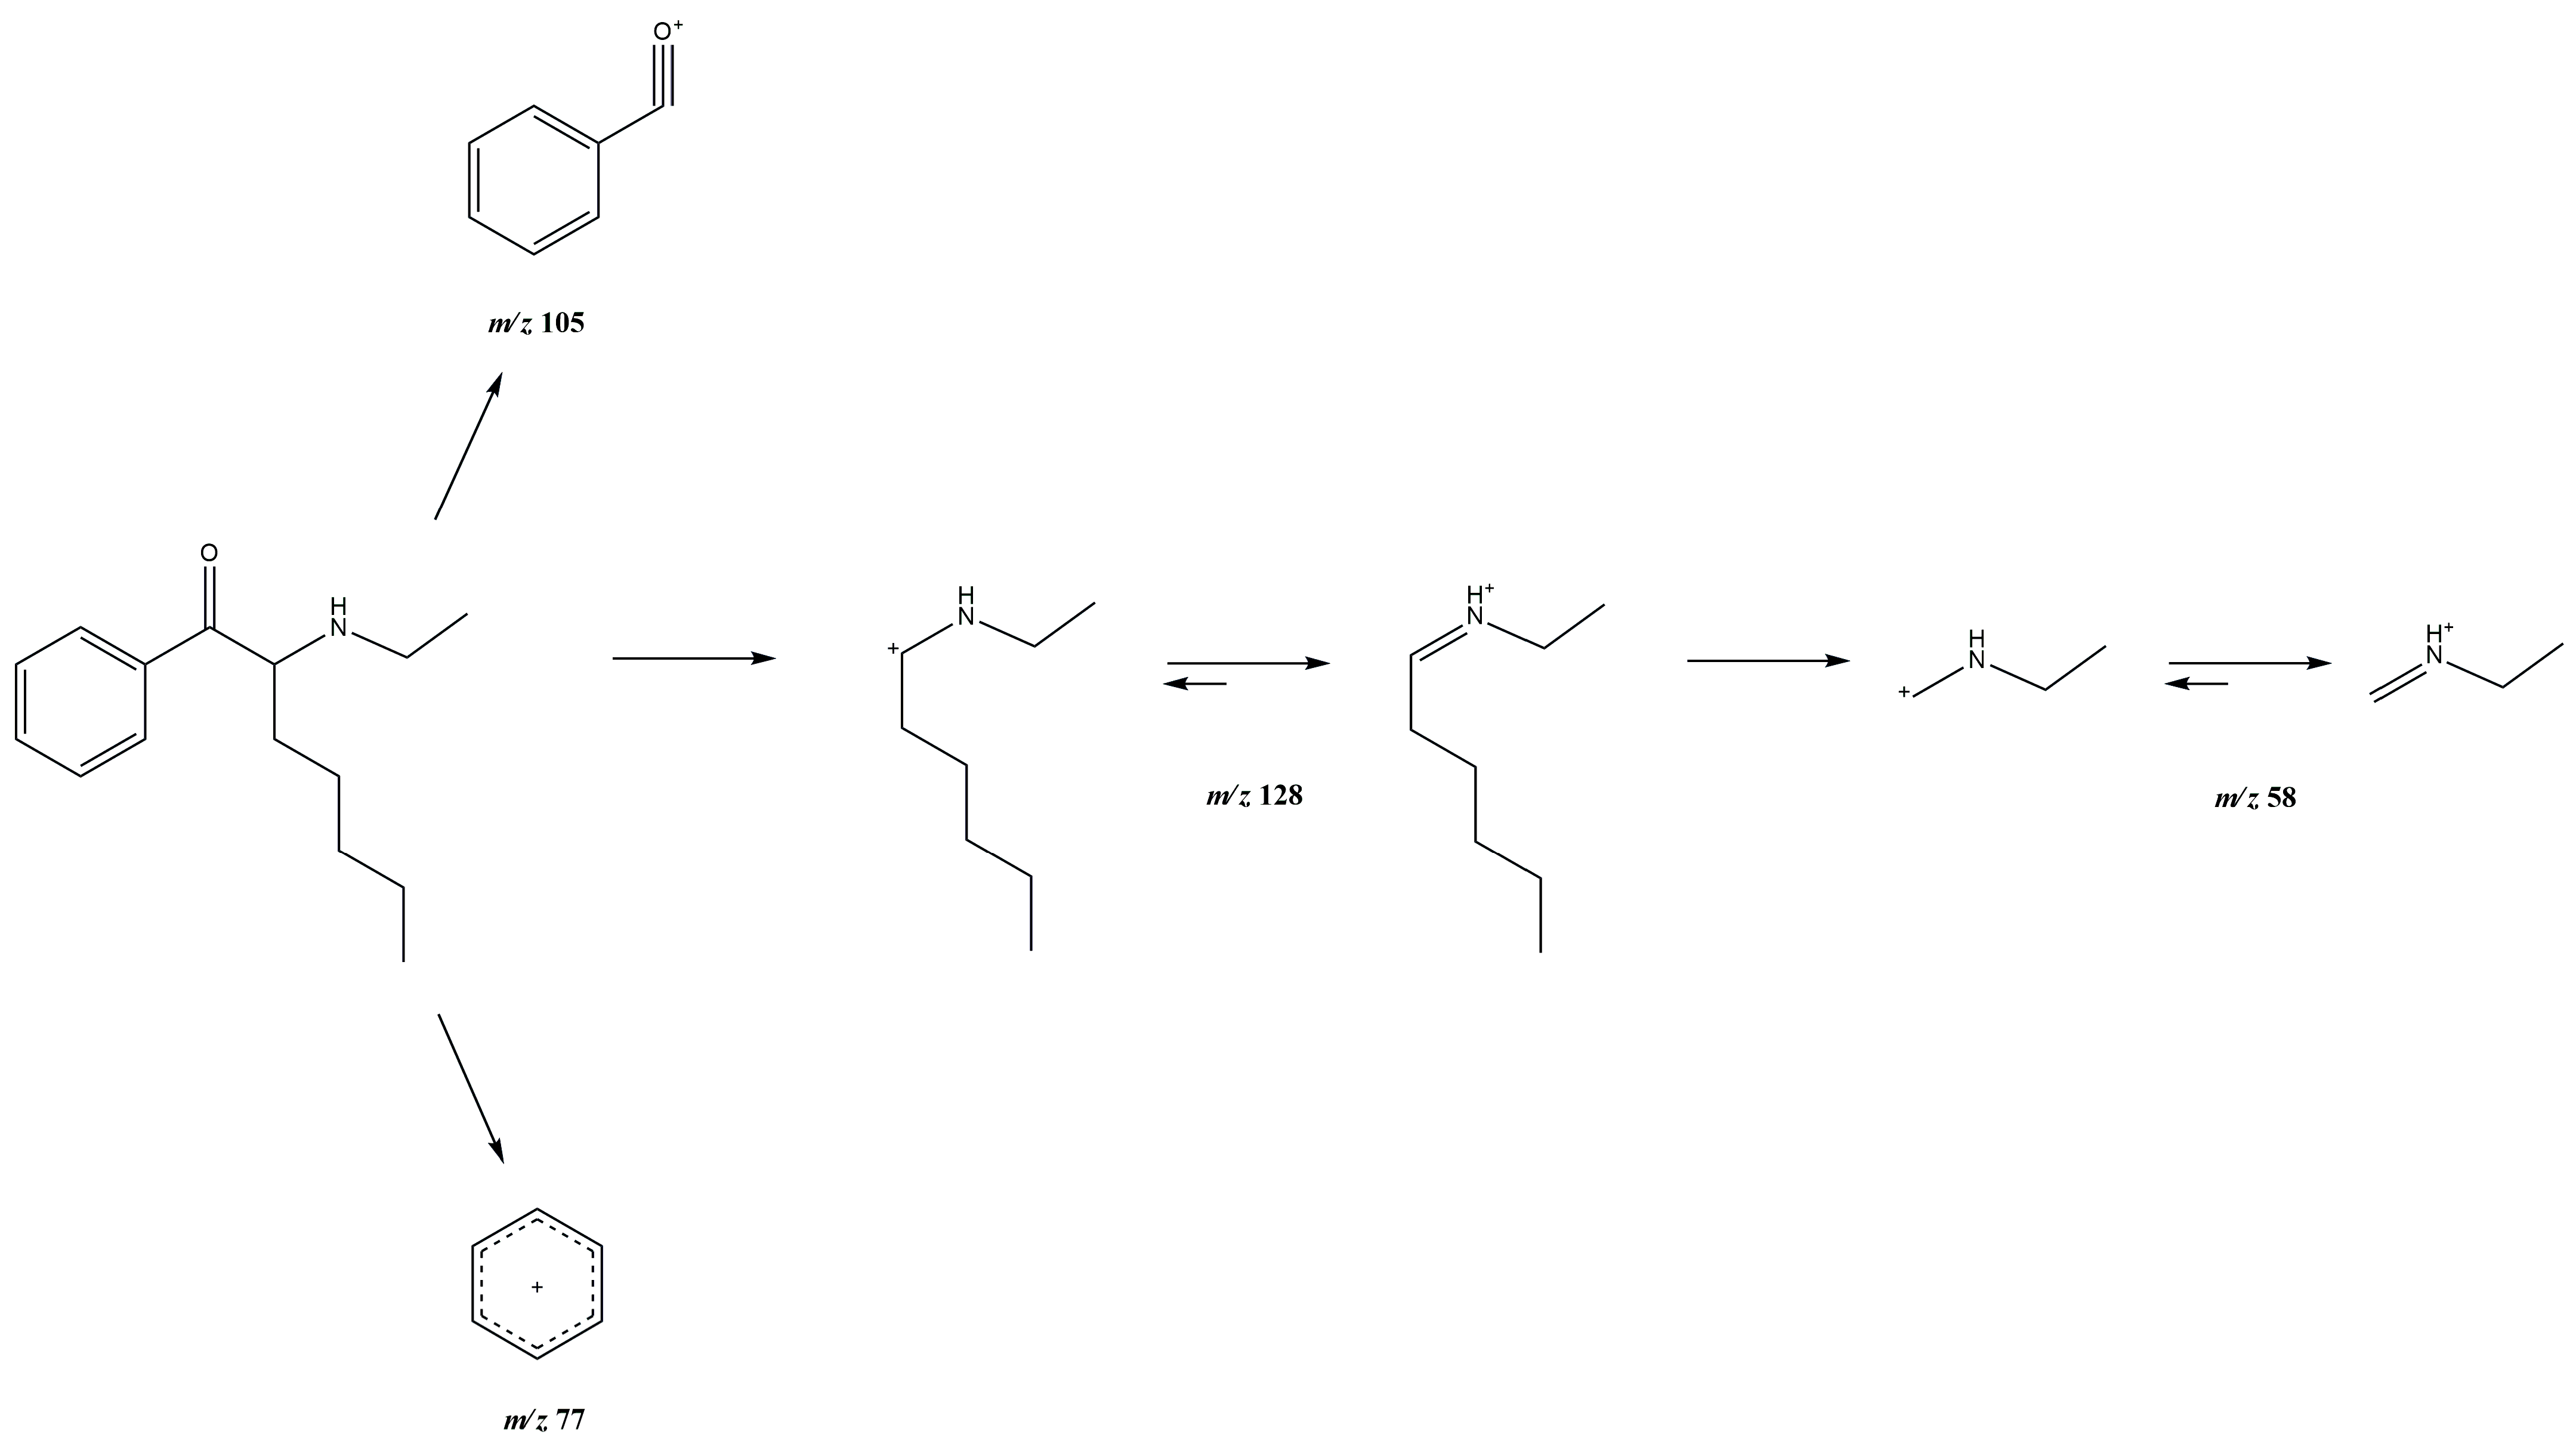
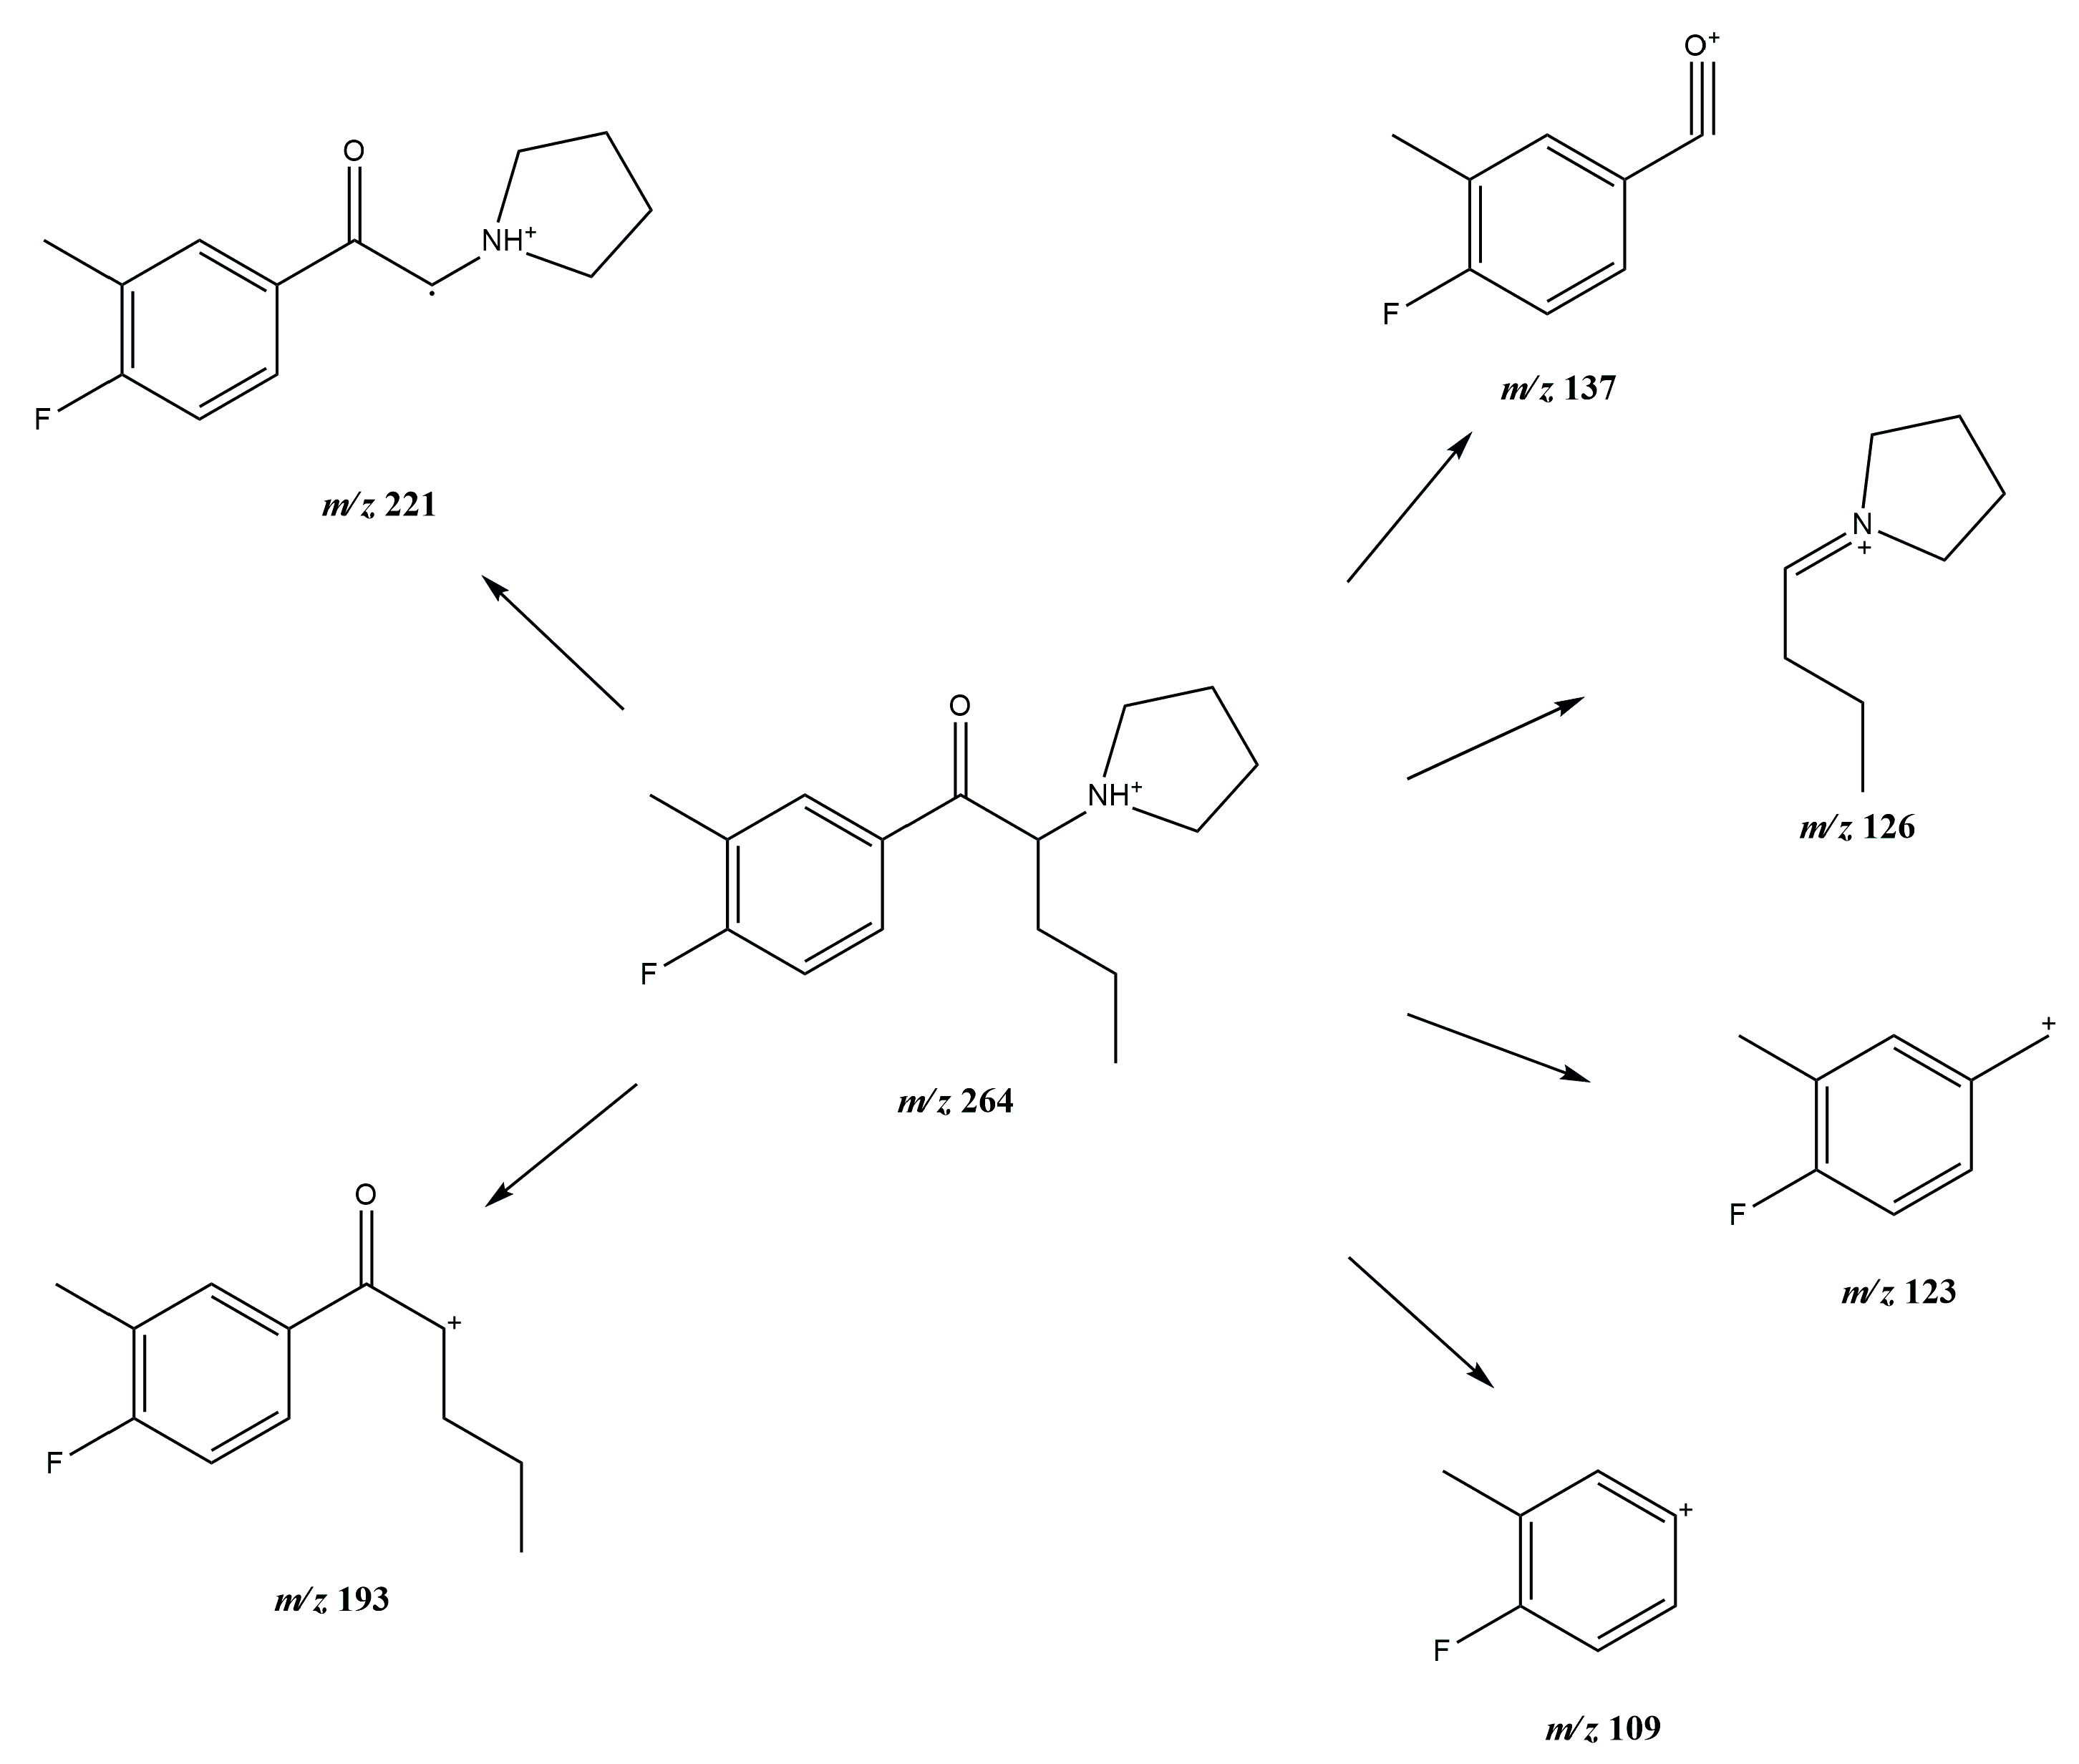
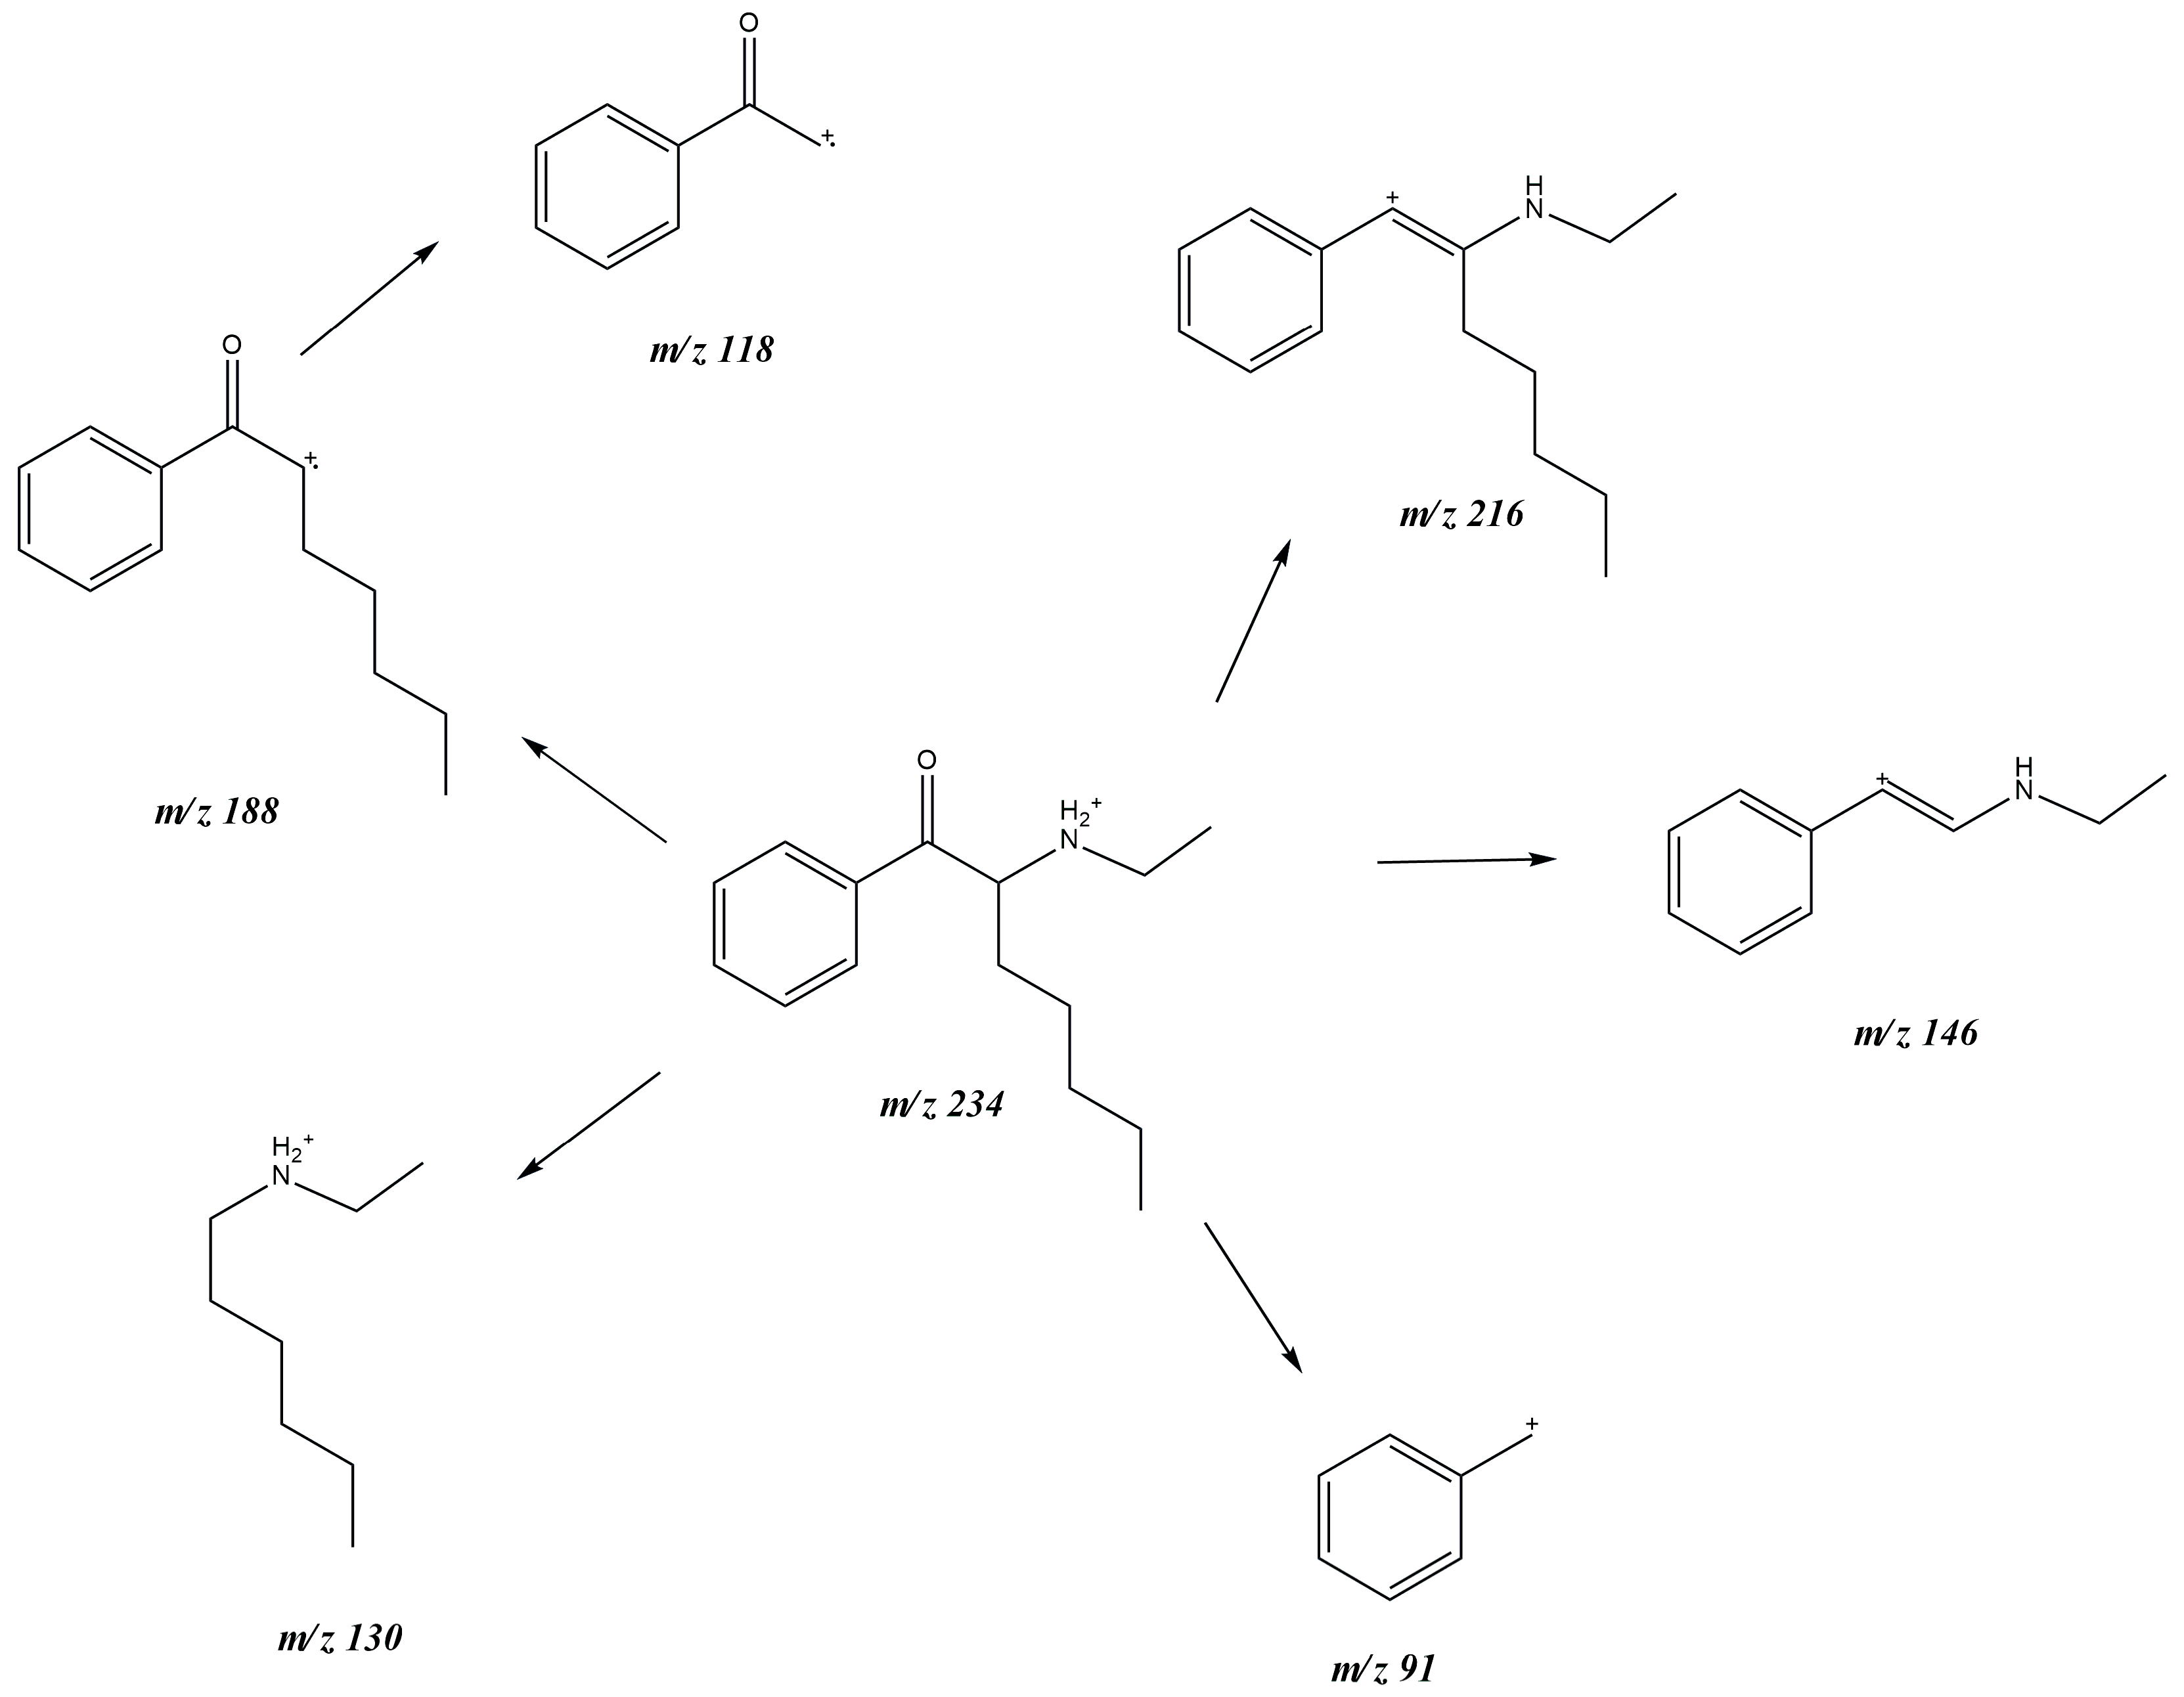
3.1. GC-MS and ESI-MS

The samples were analyzed by gas chromatography with mass spectrometric detection (GC-MS), and the resulting mass spectra of the compounds 1 and 2 are shown in Figure 2.
In the electron impact ionization (EI-MS) mass spectrum, one major fragment ion was detected at m/z 126 and 128 for compounds 1 and 2, respectively. Other less intense fragments present in the spectra had m/z 84, 109 and 137 for of compound 1 and m/z 58, 77 and 105 for compound 2. Possible structures of fragmentation products derived from the parent structure of the analyzed compounds 1 and 2 are shown in Figure 3 and Figure 4, respectively. It should be noted that in the EI-MS mode, the molecular ion peak of cathinone derivatives is usually not observed, or its intensity is weak (see Figure 2).
The fragmentation of compounds 1 and 2 is consistent with the fragmentation pathways proposed in the literature [13]. The most intense fragmentation ions in GC-MS are those detected at m/z 126 for compound 1 and m/z 128 for compound 2, suggesting that bond cleavage occurred between C7 and C8 carbon atoms (numbering of carbon atoms shown in Figure 1) for both tested compounds. By comparing with the fragmentation of other cathinone derivatives, it can be seen that the observed α cleavage is the most common bond cleavage for cathinones in the EI mode.
In the ESI-MS spectrum, the protonated [M+H+] molecule was seen at m/z 264 and 234 for compounds 1 and 2, respectively. Samples were applied directly to the ion source and also analyzed in MS/MS mode. In the MS/MS mode, the elimination of the water molecule [M+H+-H2O] at m/z 216 for compound 2 was observed, which is characteristic of some cathinone derivatives [14,15]. The elimination of water can also be observed in compound 1, but the peak intensity is much lower compared to cathinone derivatives, e.g., di-substituted nitrogen. Probable fragmentation paths for compounds 1 and 2 are shown in Figure 5 and Figure 6, respectively. ESI-MS/MS spectra of the tested compounds are available in the electronic Supplementary Material [Figures S1 and S2].
Test compounds were also analyzed by high-resolution mass spectrometry (HR-MS) by direct infusion, resulting in a protonated molecule at m/z 264.1766 (C16H23NOF, calculated m/z 264.1764, mass accuracy 0.8 ppm) for compound 1 and at m/z 234.1860 (C15H24NO, calculated m/z 234.1858, mass accuracy 0.9 ppm) for compound 2.

3.2. 1H and 13C Nuclear Magnetic Resonance Spectroscopy

Nuclear magnetic resonance (NMR) spectroscopy was used to confirm the structure of the tested compounds. The 1H and 13C nuclear magnetic resonance spectra for both compounds are available in the electronic Supplementary Material [Figures S3–S6].
More complicated spectra are those of compound 1. This is due to the presence of a fluorine atom in the aromatic fragment. The presence of this atom causes the appearance of the signal of the C6 proton (numbering of carbon atoms shown in Figure 1) in the form of a doublet at δ = 8.13 ppm, the signal of the C3 proton in the form of a multiplet at δ = 8.03 ppm and the signal of the C2 proton in the form of a triplet at δ = 7.40 ppm. The signal of the C16 methyl group here is in the form of a singlet at δ = 2.32 ppm. The wide signal of the ammonium hydrogen atom at δ = 10.81 ppm indicates the presence of only one such atom in the molecule. The protons of the first methylene group attached to the methine carbon atom (C8, δ = 5.64 ppm) are a multiplet at δ = 1.92 ppm (2H), while the protons of the second methyl group are two multiplets (δ = 1.26 and 1, 07 ppm), which was confirmed by the COSY spectrum (Figure S7) and on the basis of the crystal structure of this compound (Figure 7). The methyl group of this fragment has a triplet signal at δ = 0.78 ppm. The proton signals of the pyrrolidine ring are four broad singlets at δ = 3.07, 3.25, 3.47 and 3.63 ppm (C12H2 and C15H2) and a multiplet at δ = 1.92 ppm (C13H2 and C14H2). Due to the interaction of protons with fluorine in the molecule of compound 1, instead of the classic set of signals in the 1H NMR spectrum in the aromatic region, several multiplets were observed for each group of equivalent protons. Carbon coupling with the fluorine atom could also be observed in the 13C NMR spectrum, which explains the splitting of the carbon signals. The 13C NMR spectrum of compound 1 consists of the characteristic carbon signal of the CO group at δ = 195.9 ppm, twelve (split) signals of the six aromatic carbons: δ = 166.3 and 163.8 (C4), 133.4, 133.4, 131.6, 131.6, 130.0, 129.9, 126.3, 126.1, 116.5, 116.3 ppm and nine signals of aliphatic fragments at δ = 67.6 ppm (C8), 53.9 and 52.4 ppm (C12 and C15), 32.2, 23.4, 17.9, 14.5, 14.5 and 14.2 ppm (C9–C11, C13–C14).
The NMR spectra of compound 2 are simple spectra characteristic of many similar cathinone derivatives. In the region of the aromatic ring, the 1H NMR spectra contain three signals: a doublet of a proton at carbon atoms C2 and C6—δ = 8.09 ppm (2H, J = 8 Hz) and two triplets: a proton at carbon atom C4—δ = 7.76 (1H, J = 8 Hz) and two protons on C3 and C5 carbon atoms—δ = 7.62 (2H, J = 8 Hz). The characteristic proton singlet of expanded methane occurs at δ = 5.29 ppm. The inhibited rotation of the ammonium fragment results in the characteristic two proton singlets at δ = 9.10 and 9.63 ppm. The location of these signals varies significantly when using other solvents for acquiring spectra of these types of compounds. Similarly, the two protons of the methylene group of the ethyl substituent are in the form of two broad singlets with δ = 2.91 and 3.02 ppm.
The protons of the methyl group of the ethyl fragment are in the form of a triplet at δ = 1.28 ppm. In the pentyl fragment of this compound, only the proton of the methyl group occurs in the form of a triplet at δ = 0.75 ppm, while the signals of the other protons are multiplets: H13 and H14 at δ = 1.13 ppm, H11A at δ = 3.02 ppm, H11B at 8 = 1.04 ppm, H12B at 8 = 2.91 ppm and H12A at 8 = 1.30 ppm. This type of assignment of signals of hydrogen atoms occurring at C11 and C12 carbon atoms results from the analysis of the COSY spectrum (Figure S8) and from the crystal structure of this compound (Figure 8).
The 13C NMR spectrum of compound 2 consists of the characteristic carbon signal of the CO group at δ = 196.8 ppm, four signals of aromatic carbons: δ = 135.2, 134.5, 129.7, 129.2 ppm and eight signals of aliphatic fragments at δ = 61.0 ppm (C8), 41.7 ppm (C9), 31.2, 30.0, 23.6, 22.0 ppm (C11–C14) and 14.1, 11.6 ppm (C10 and C15).

3.3. IR Spectra, TGA and DSC
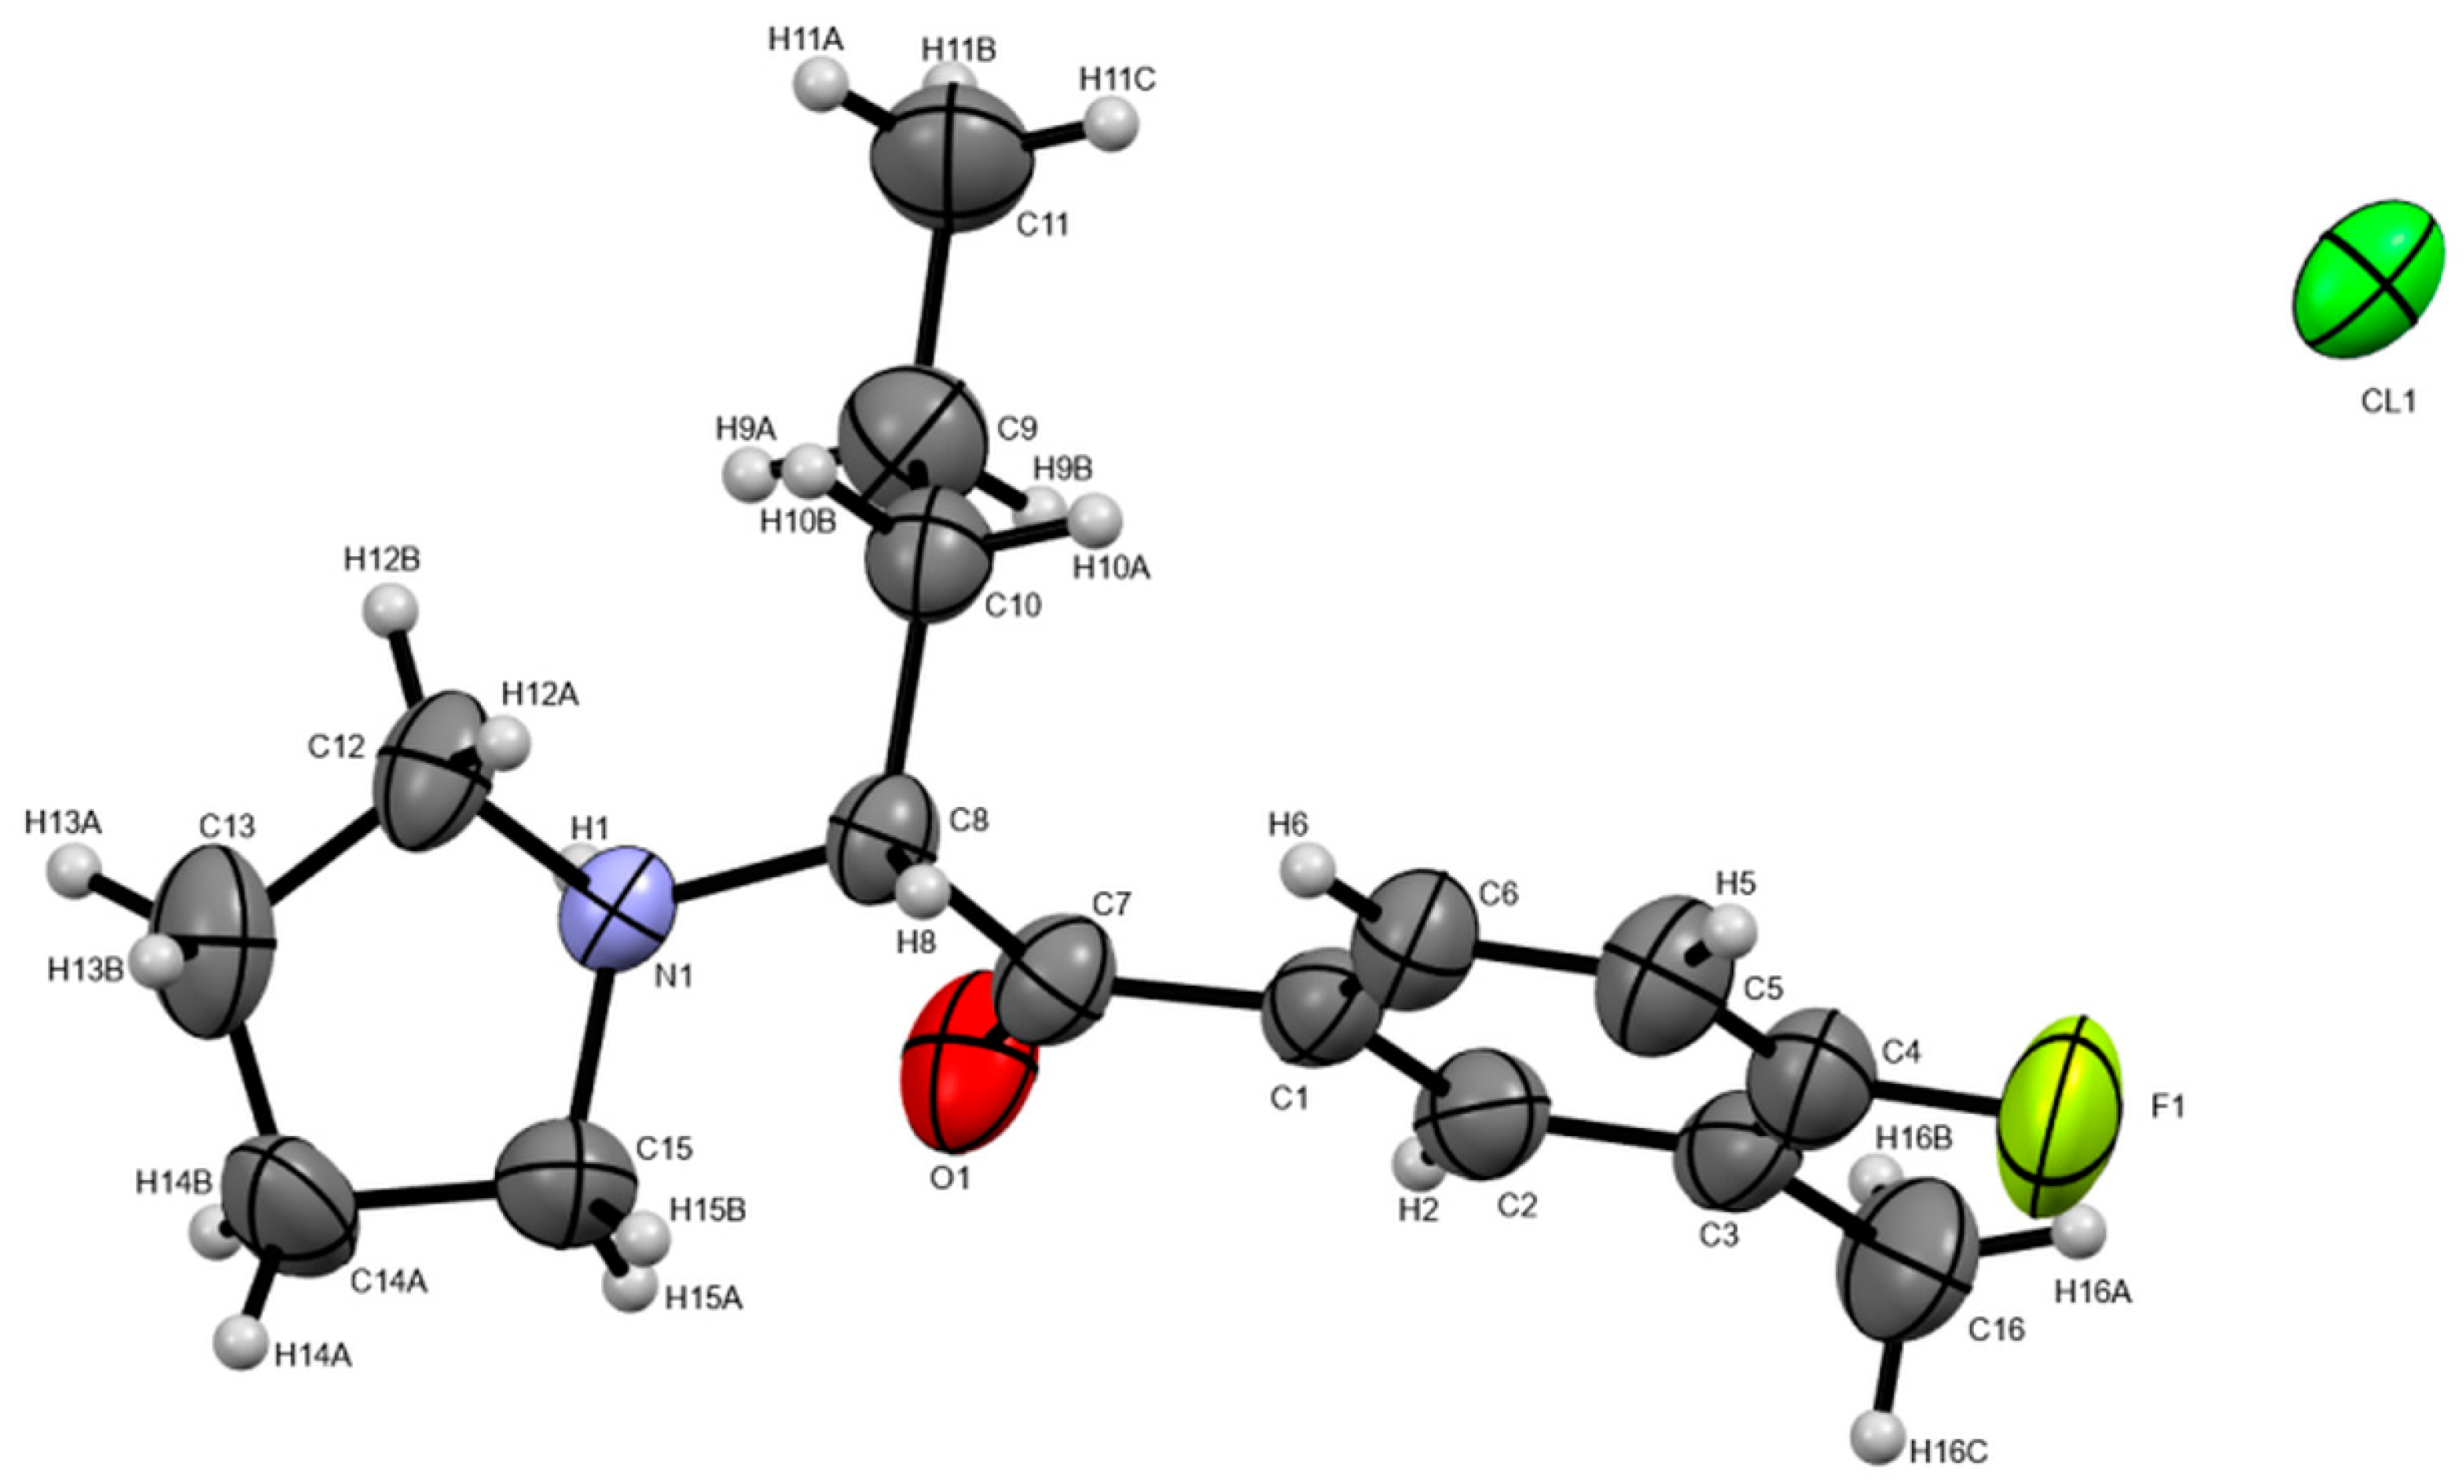
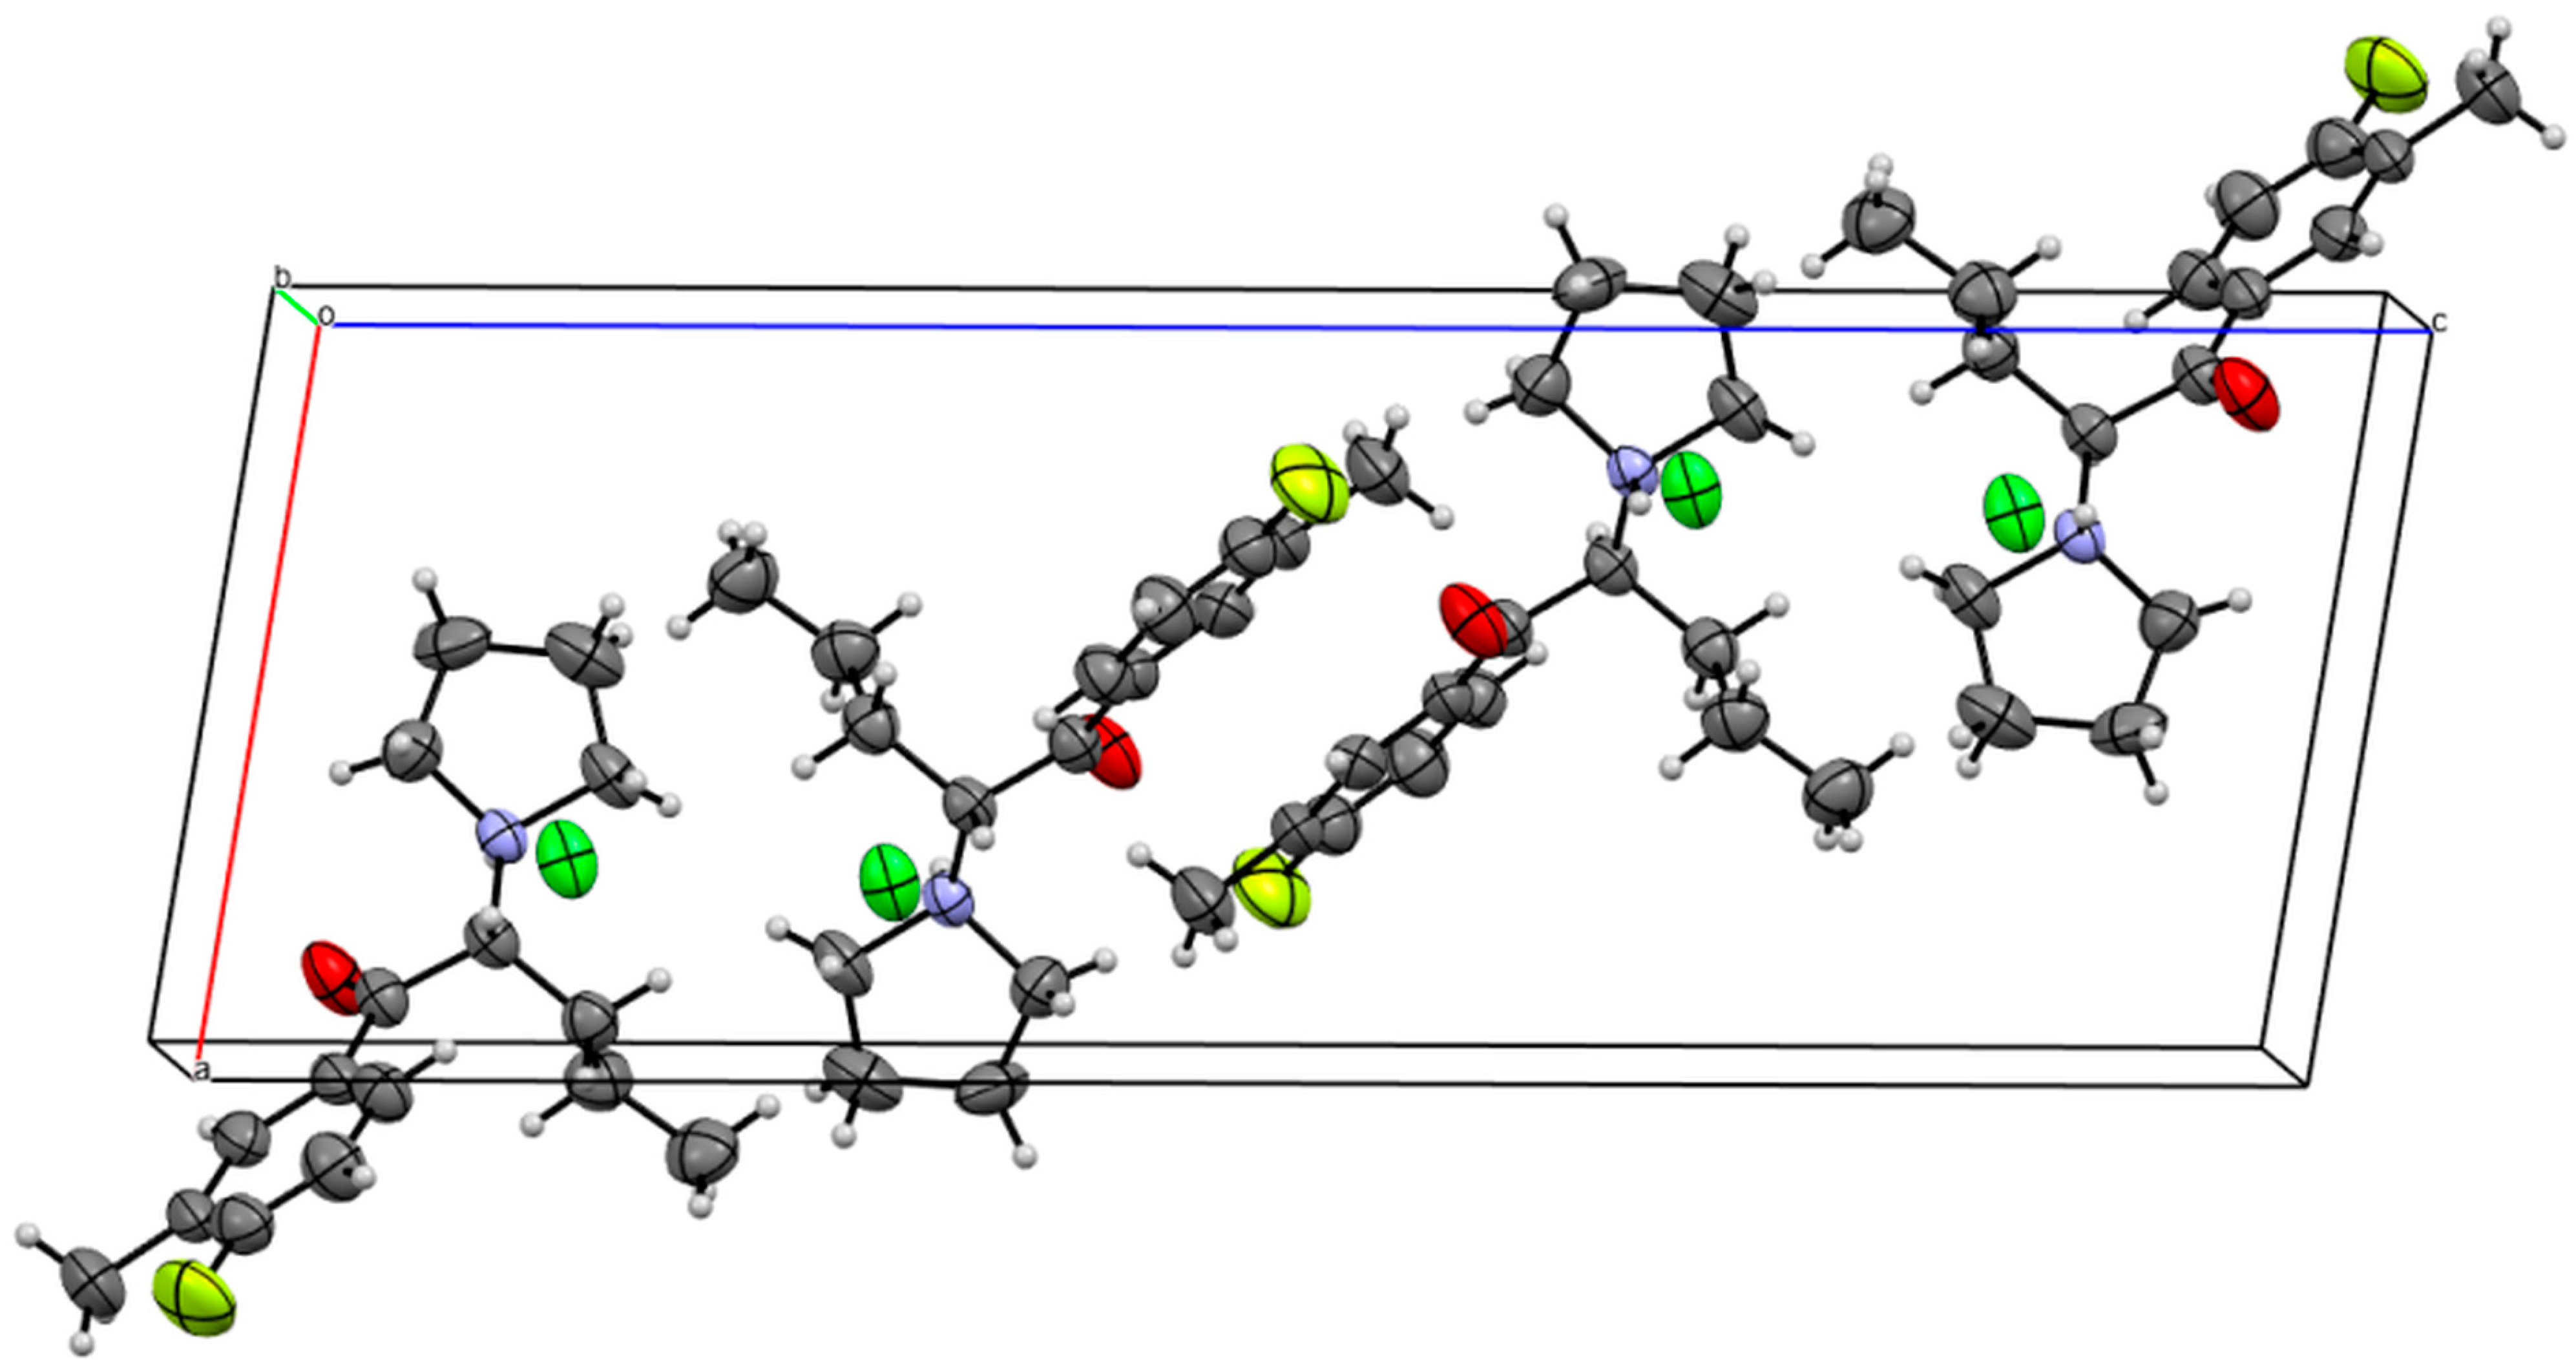
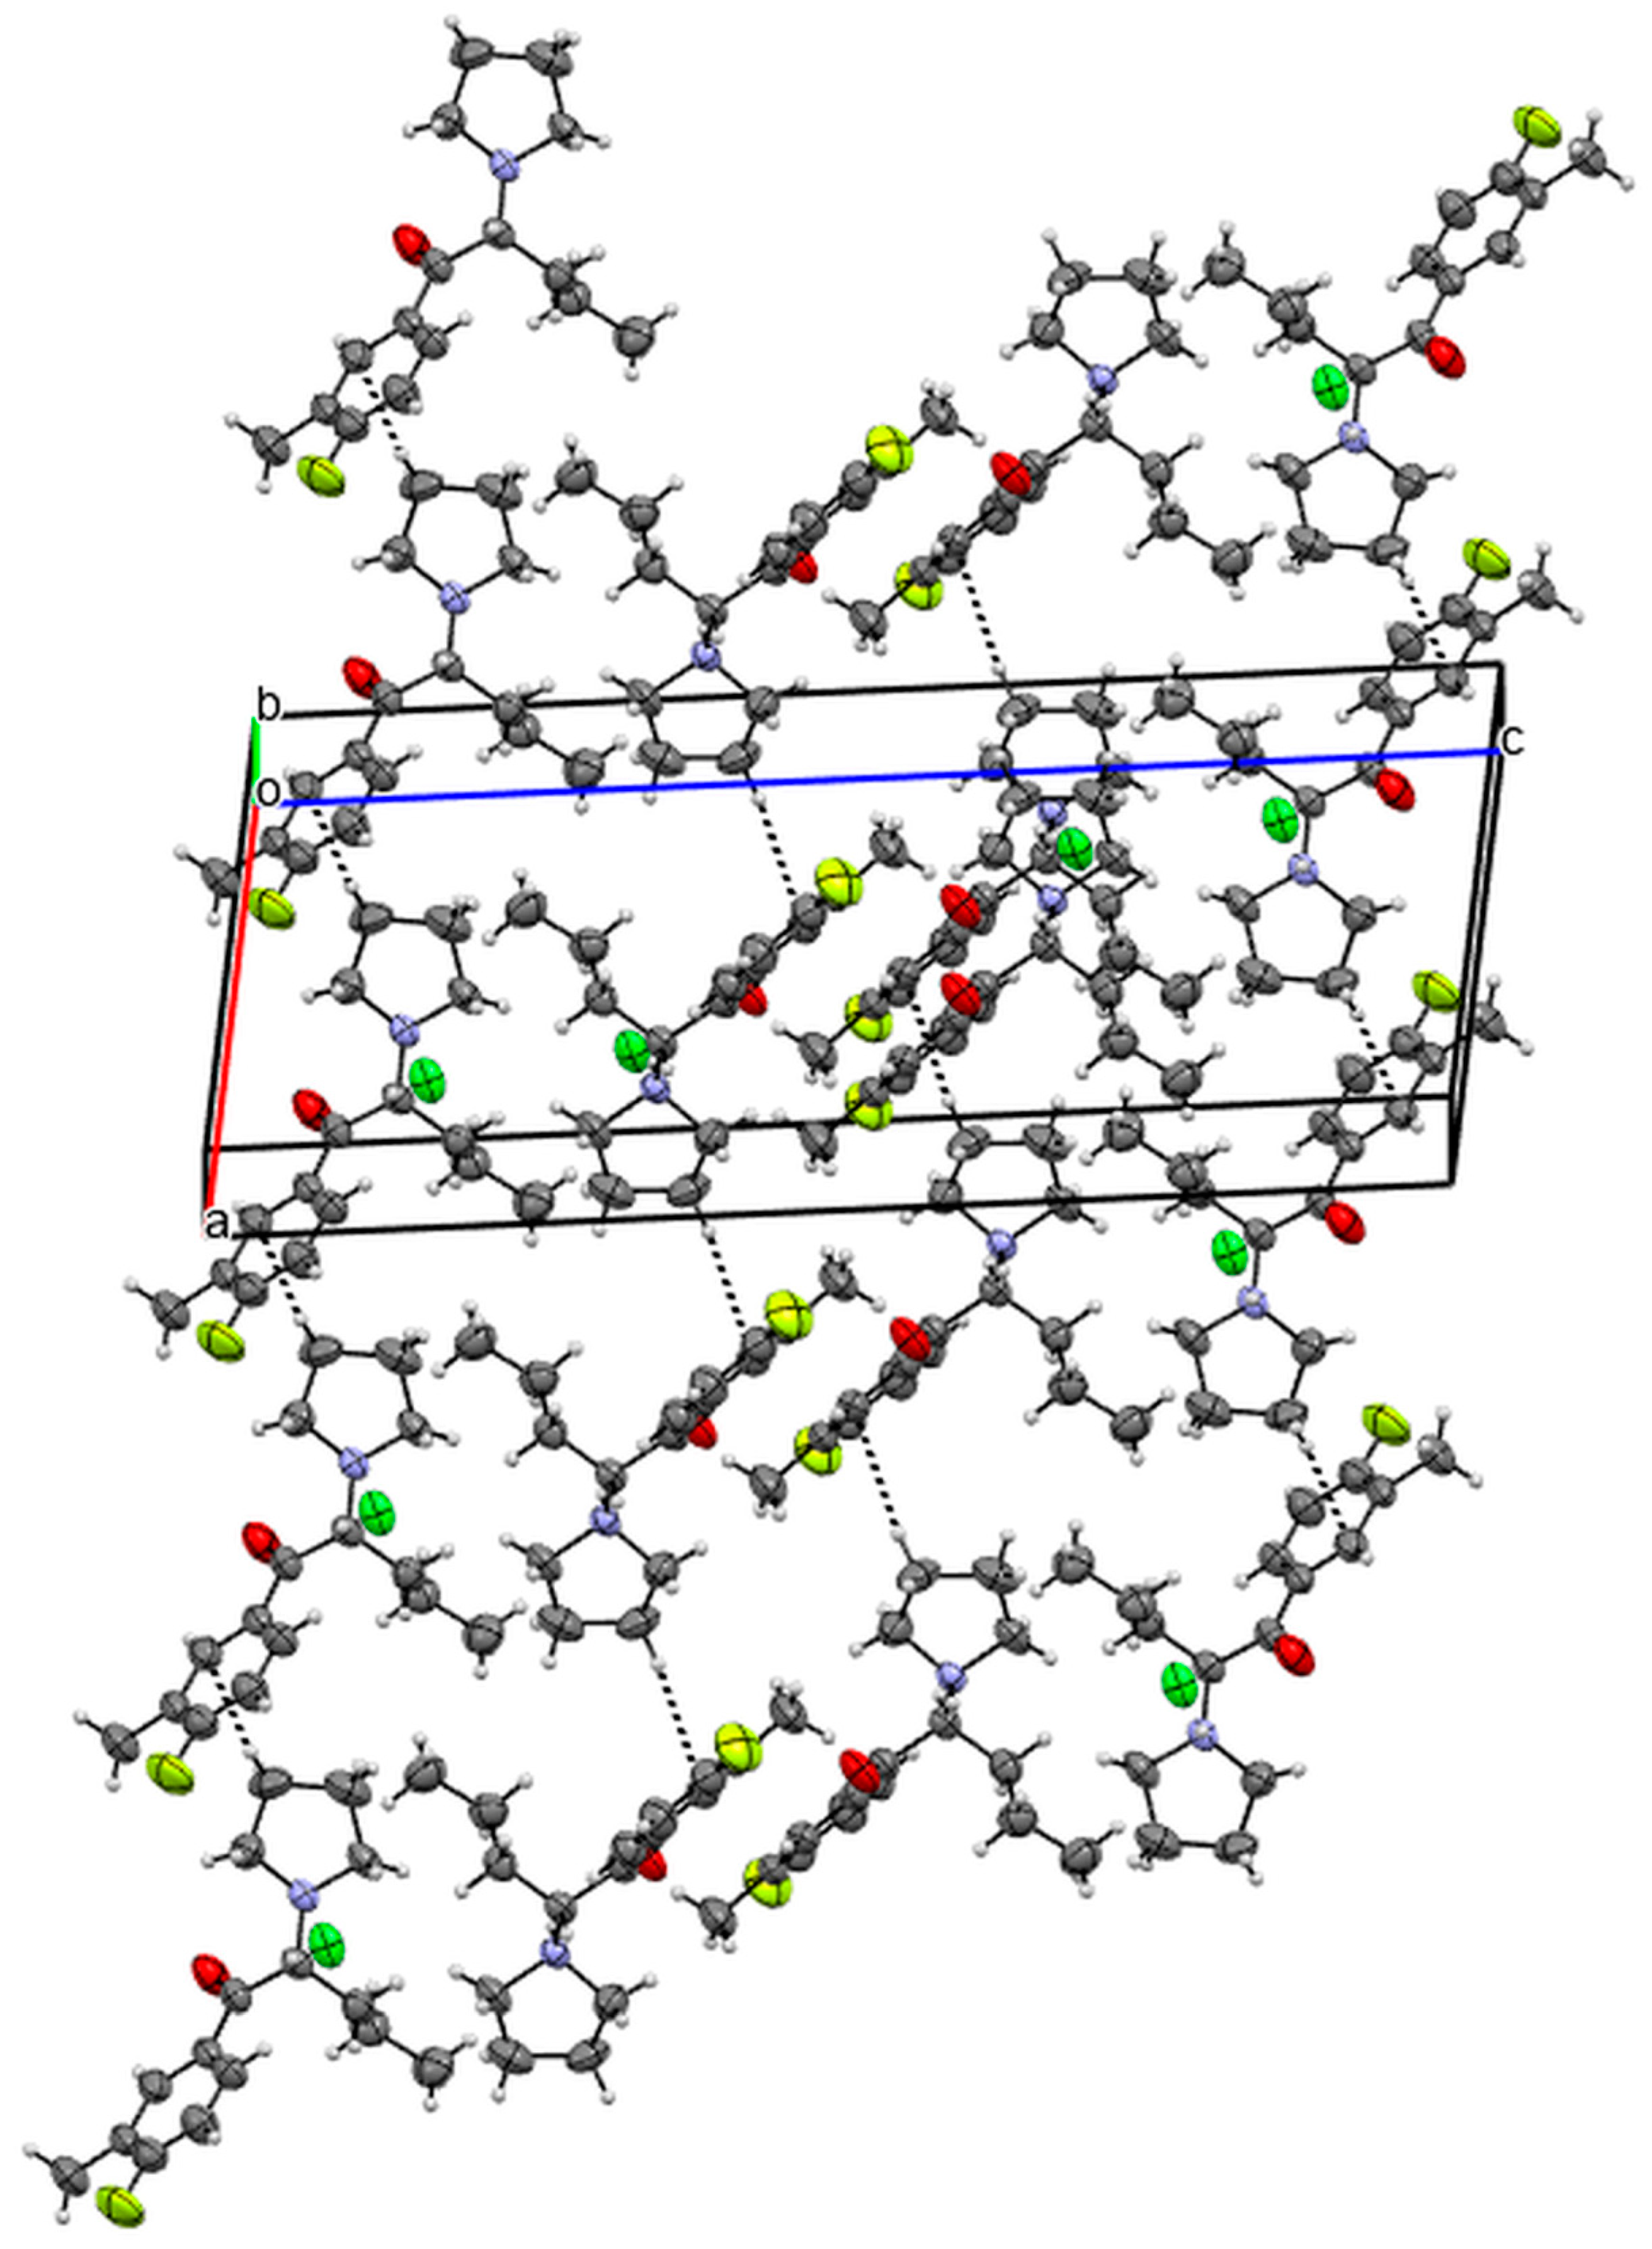
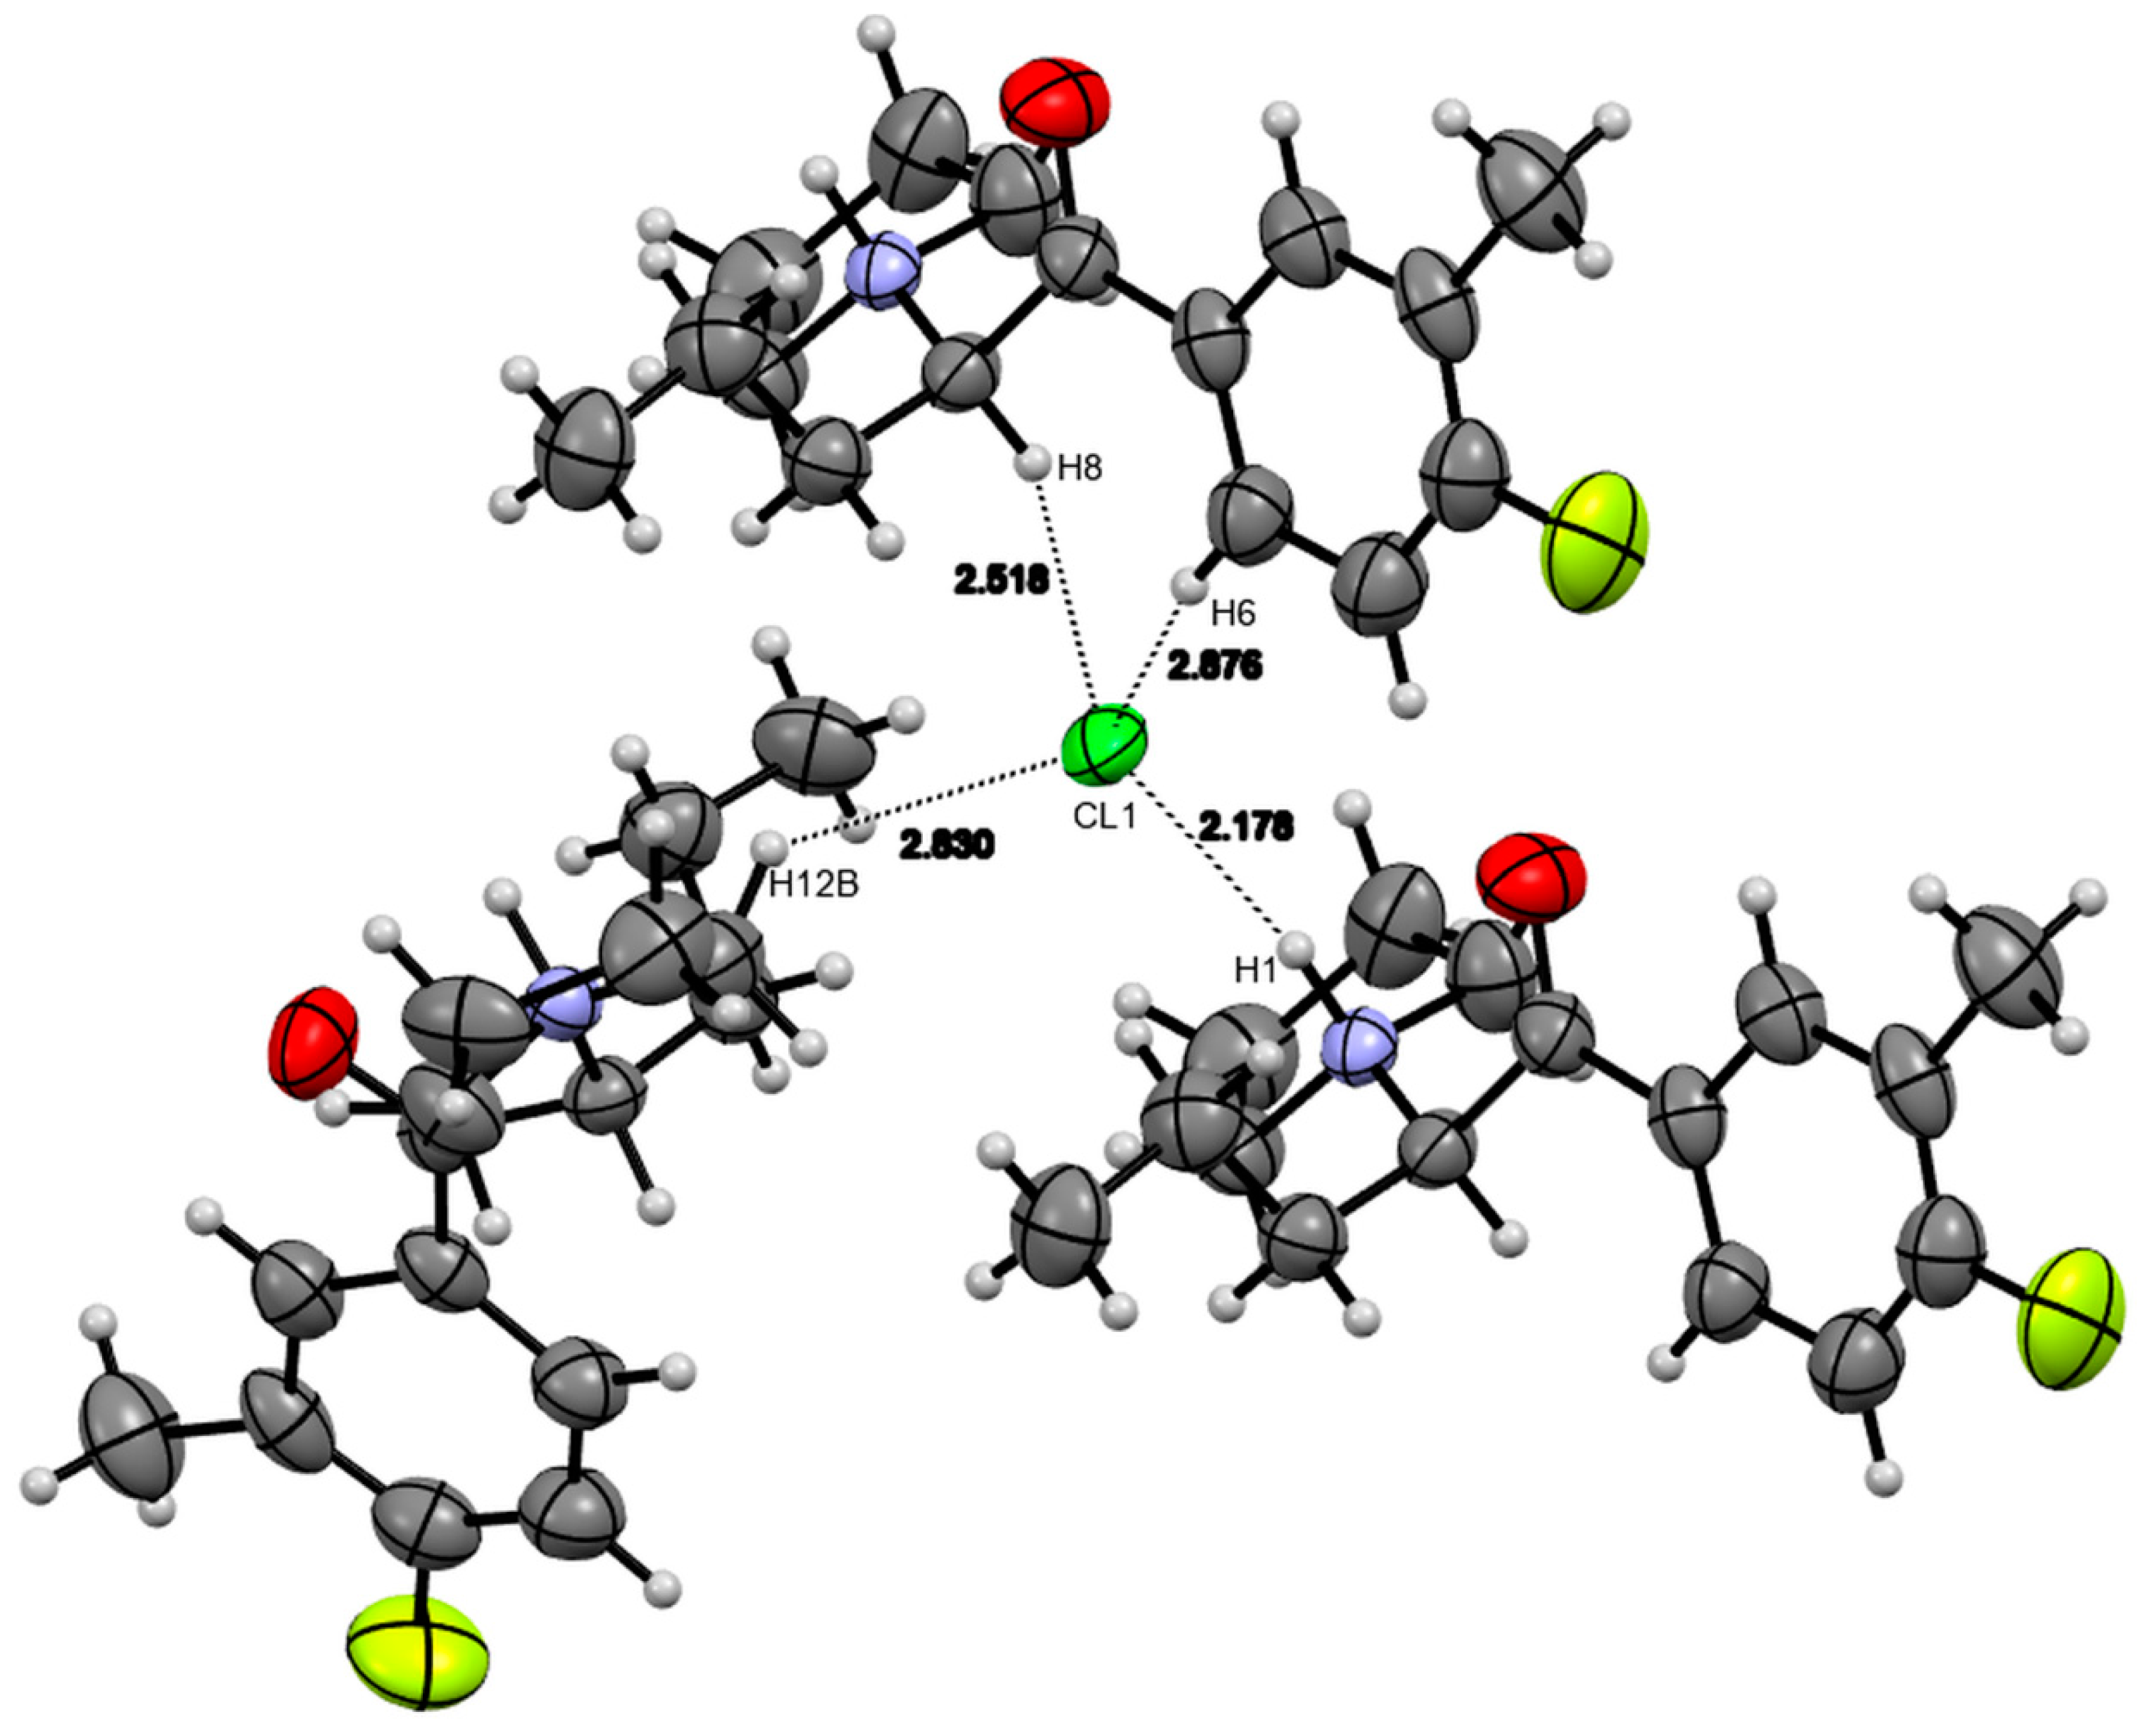
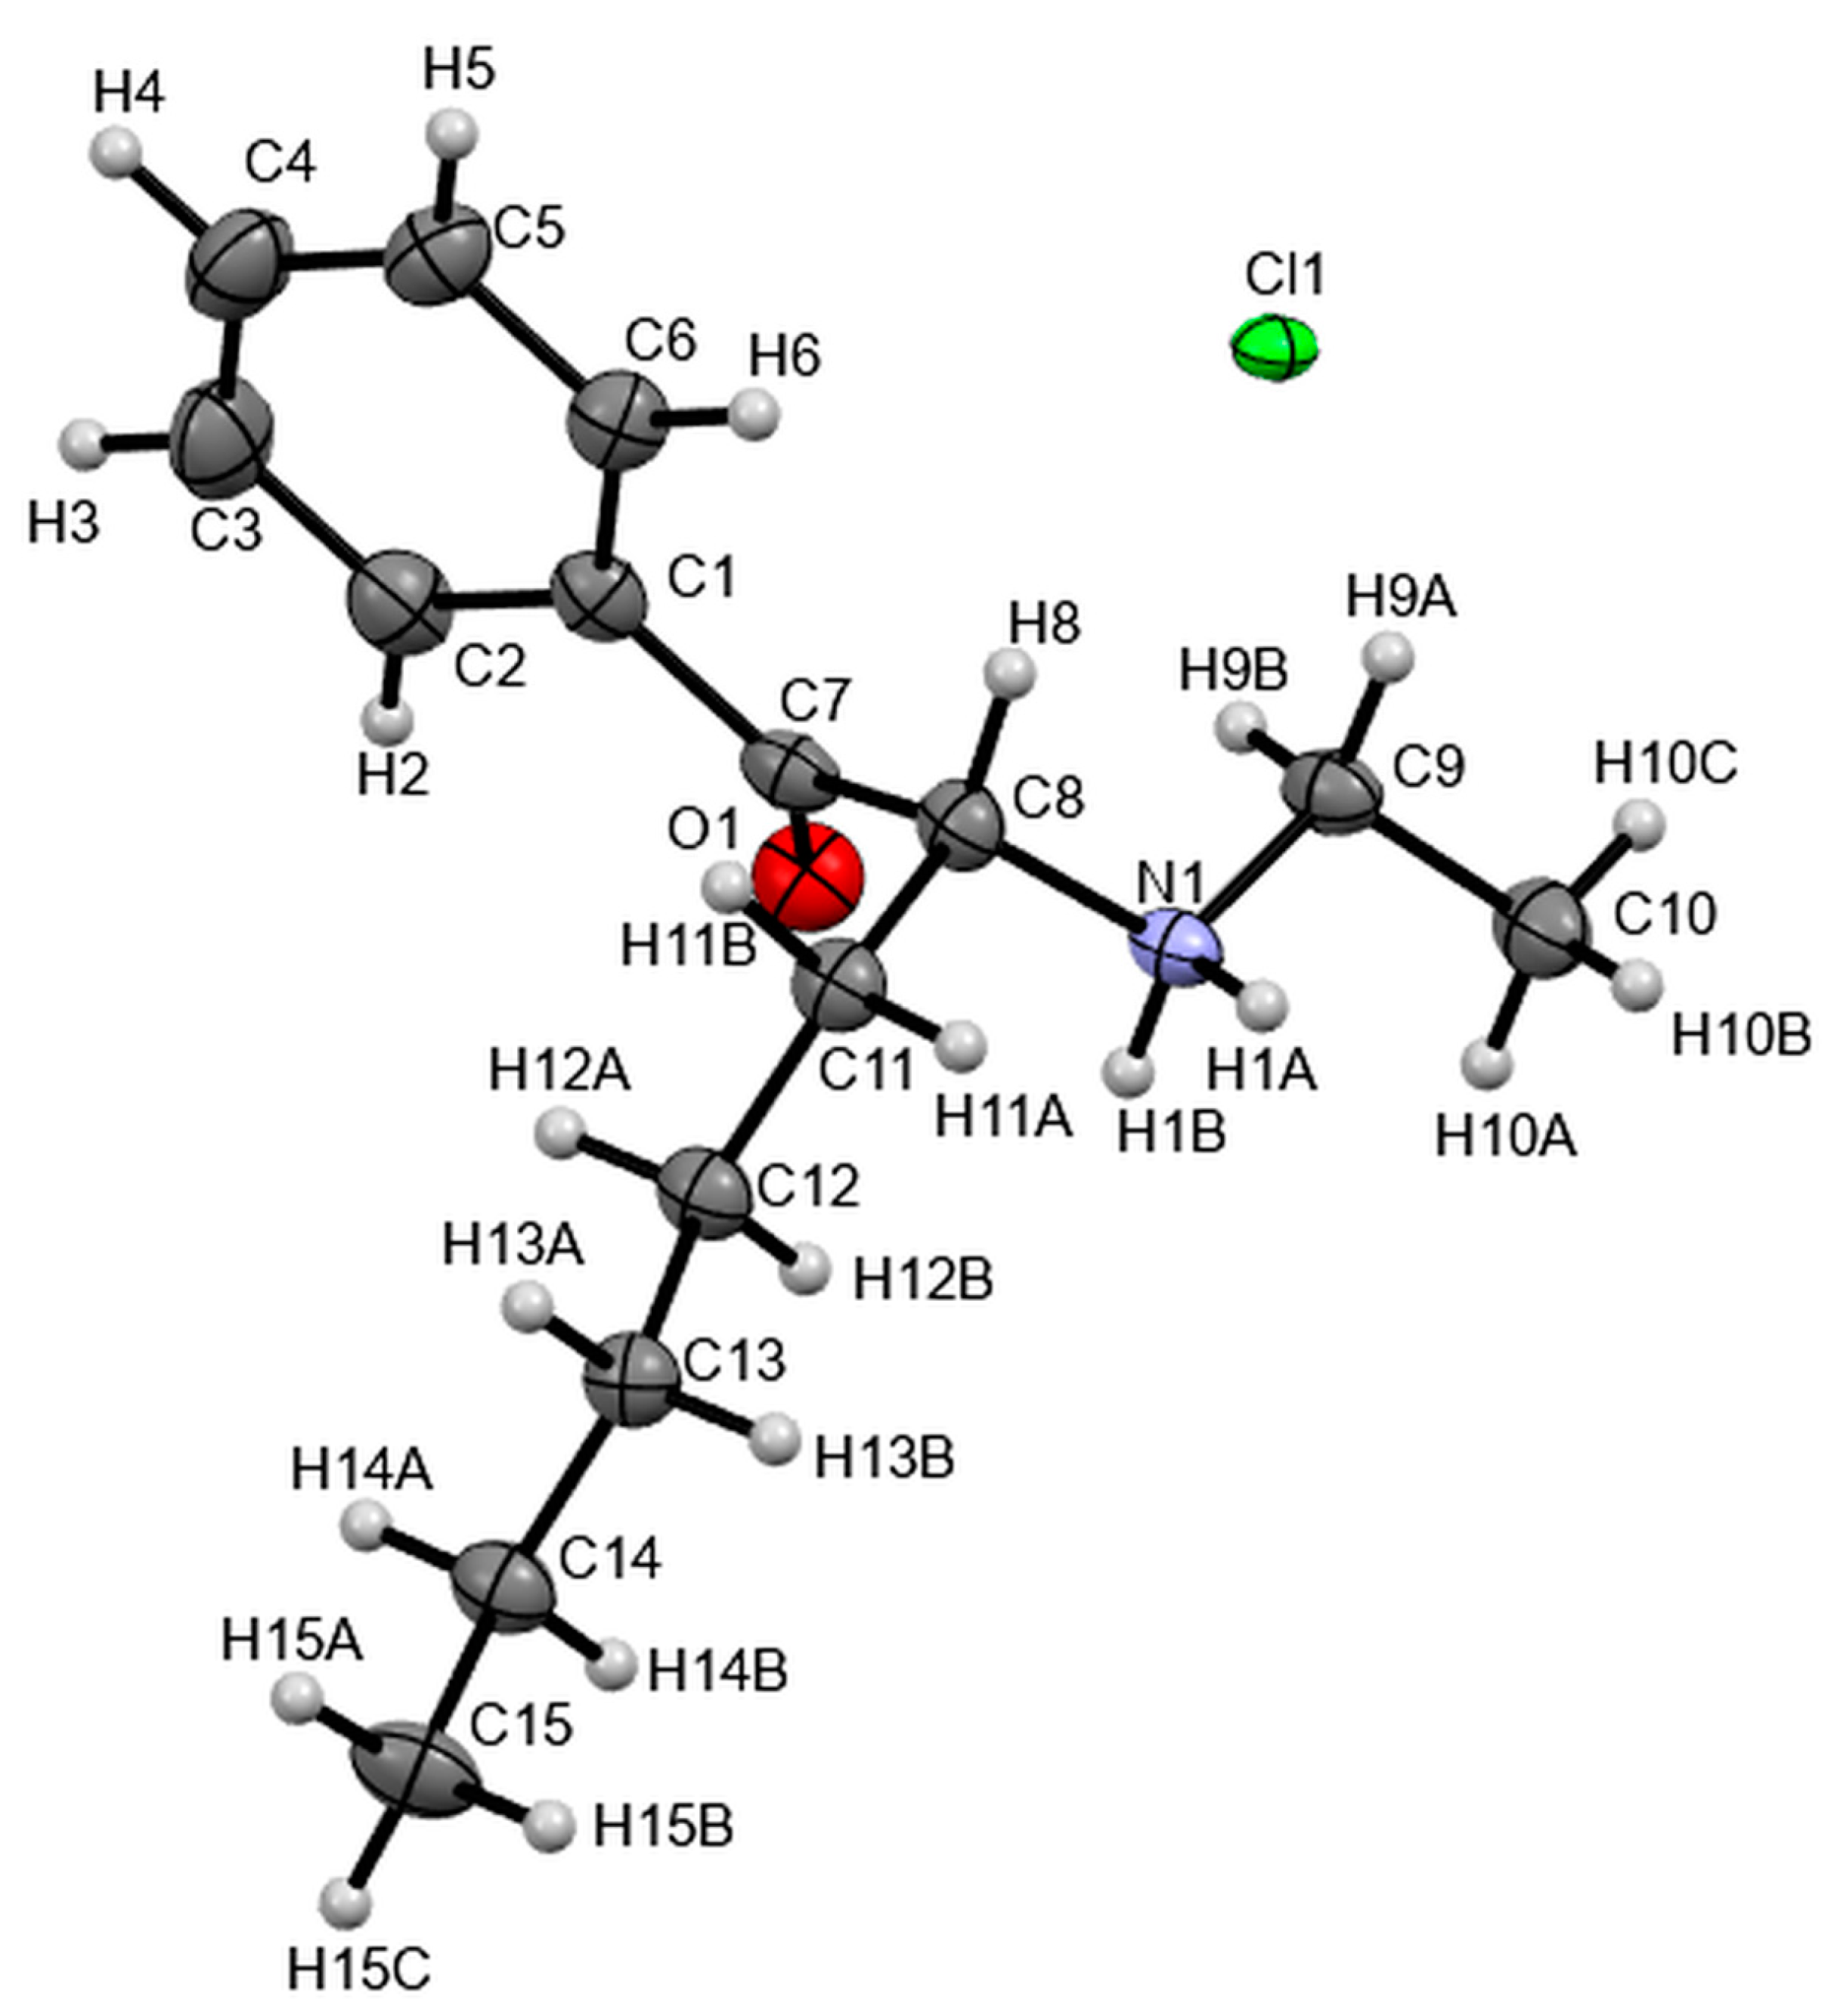
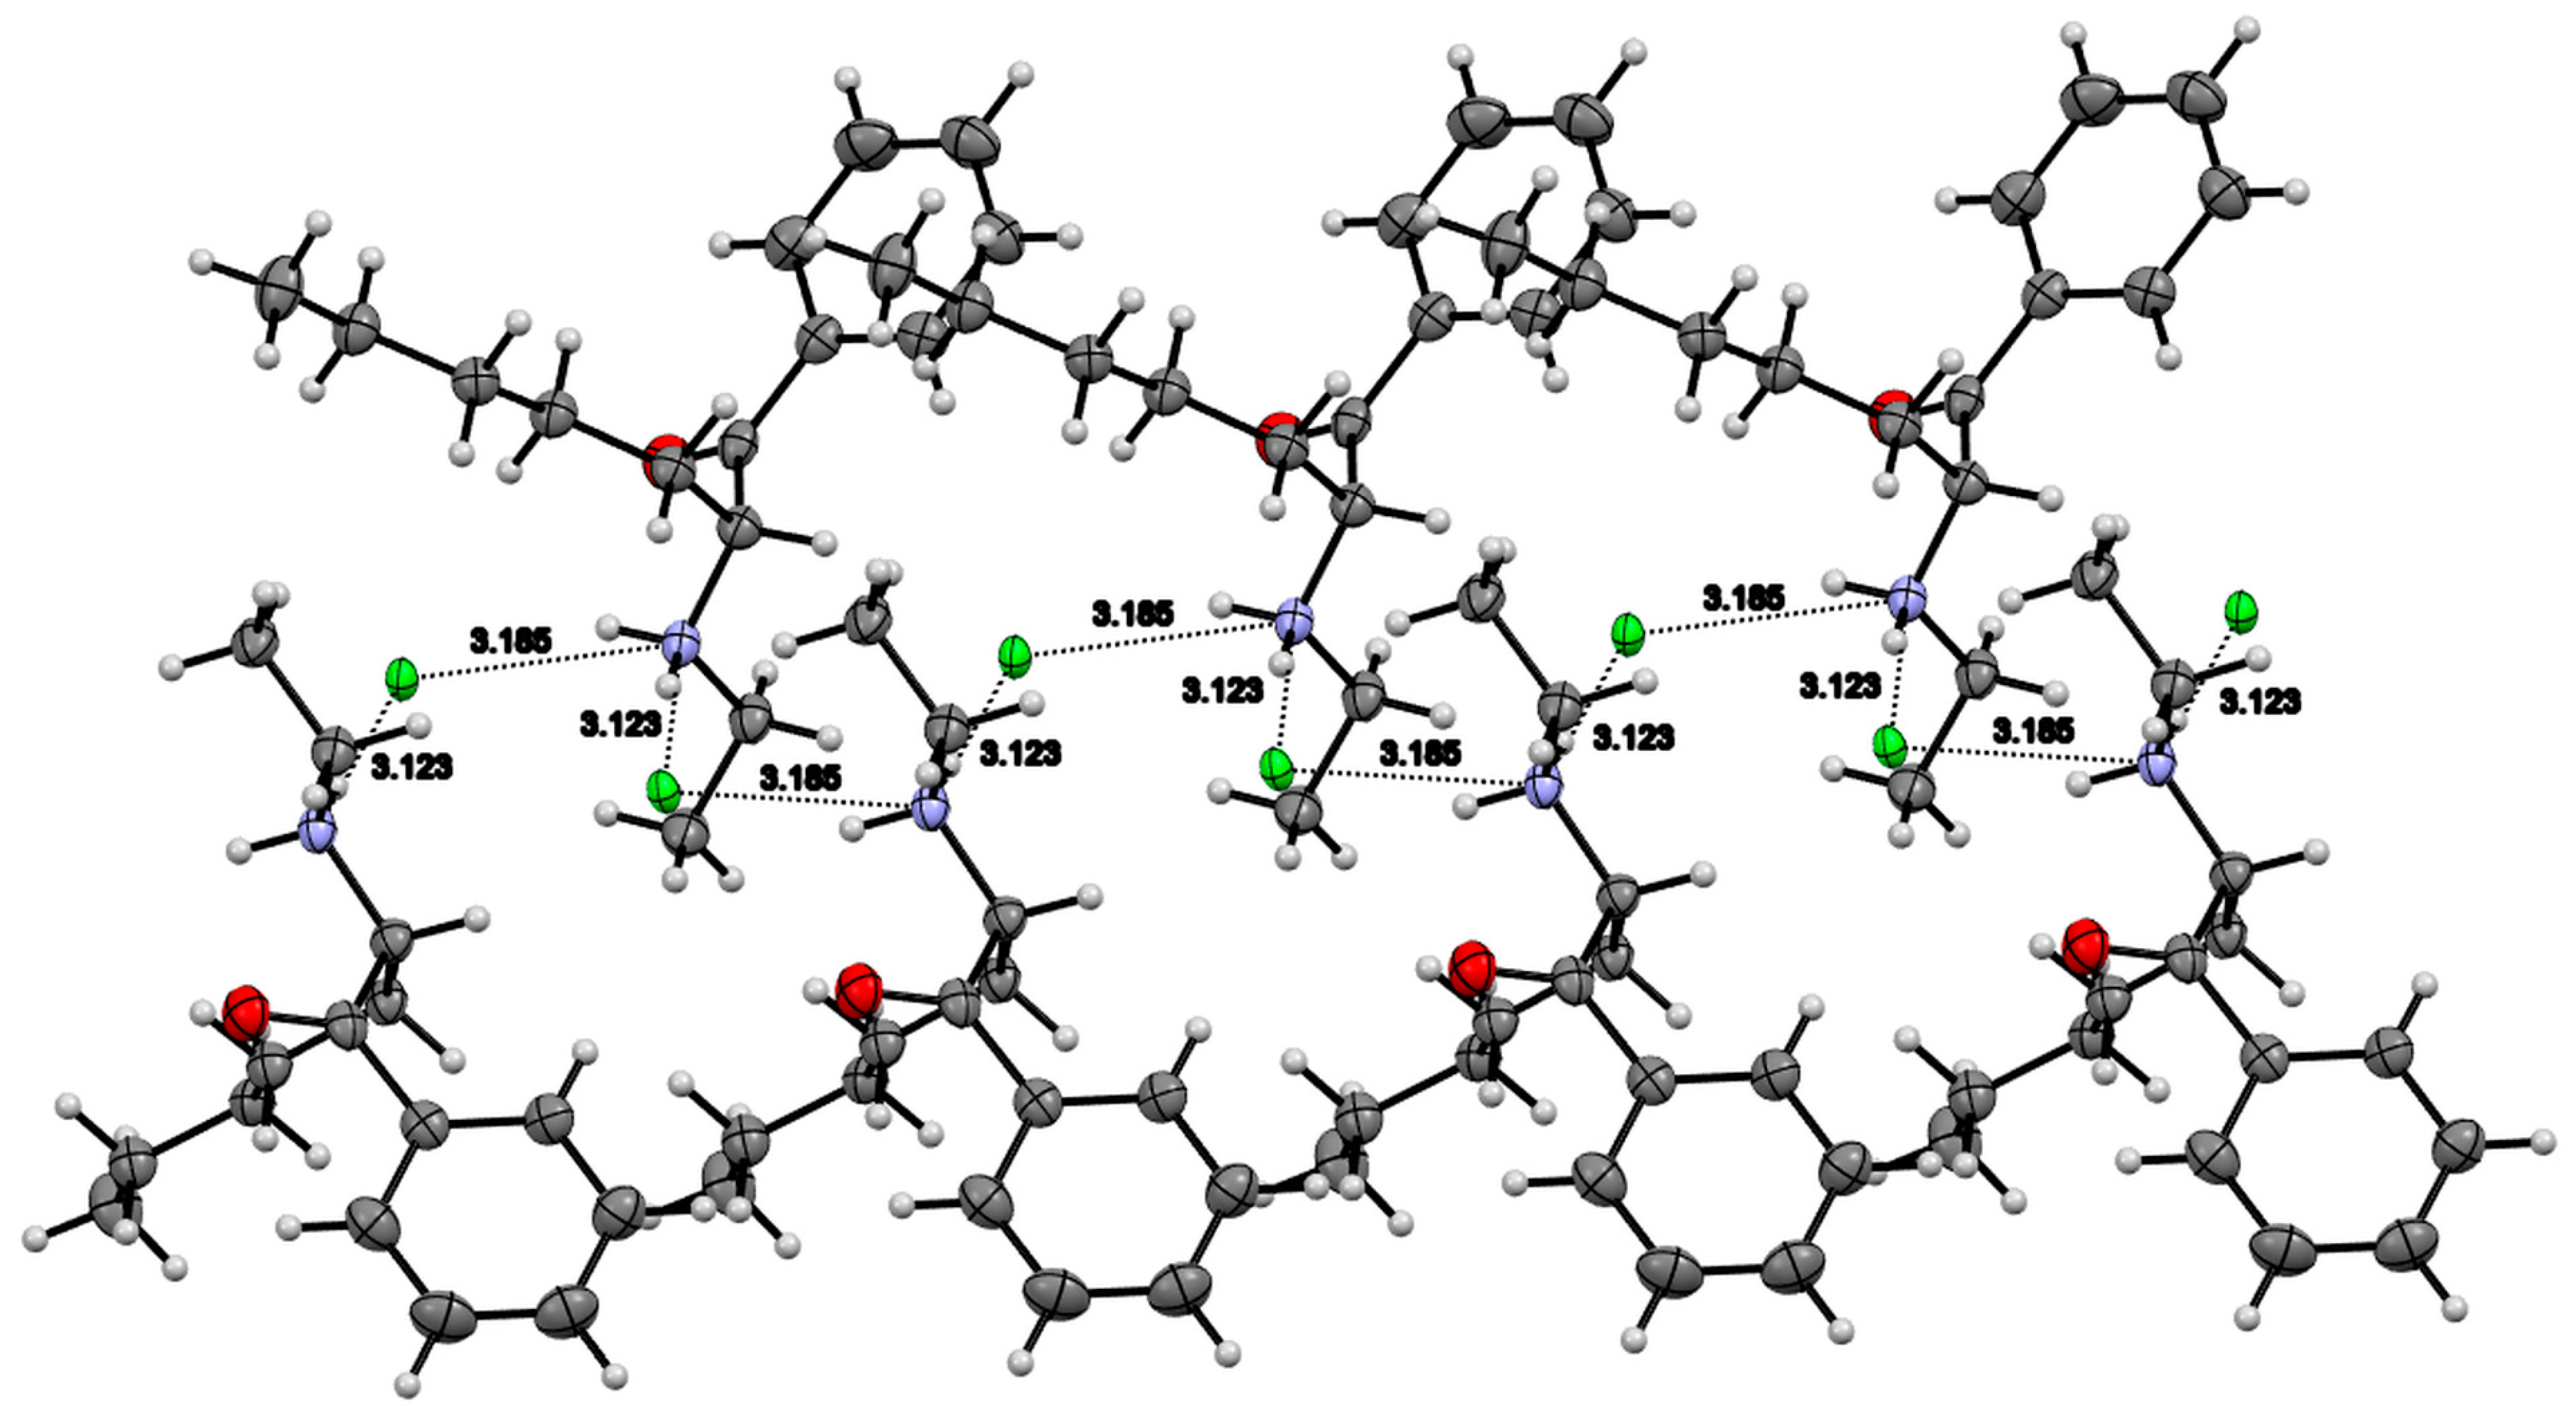
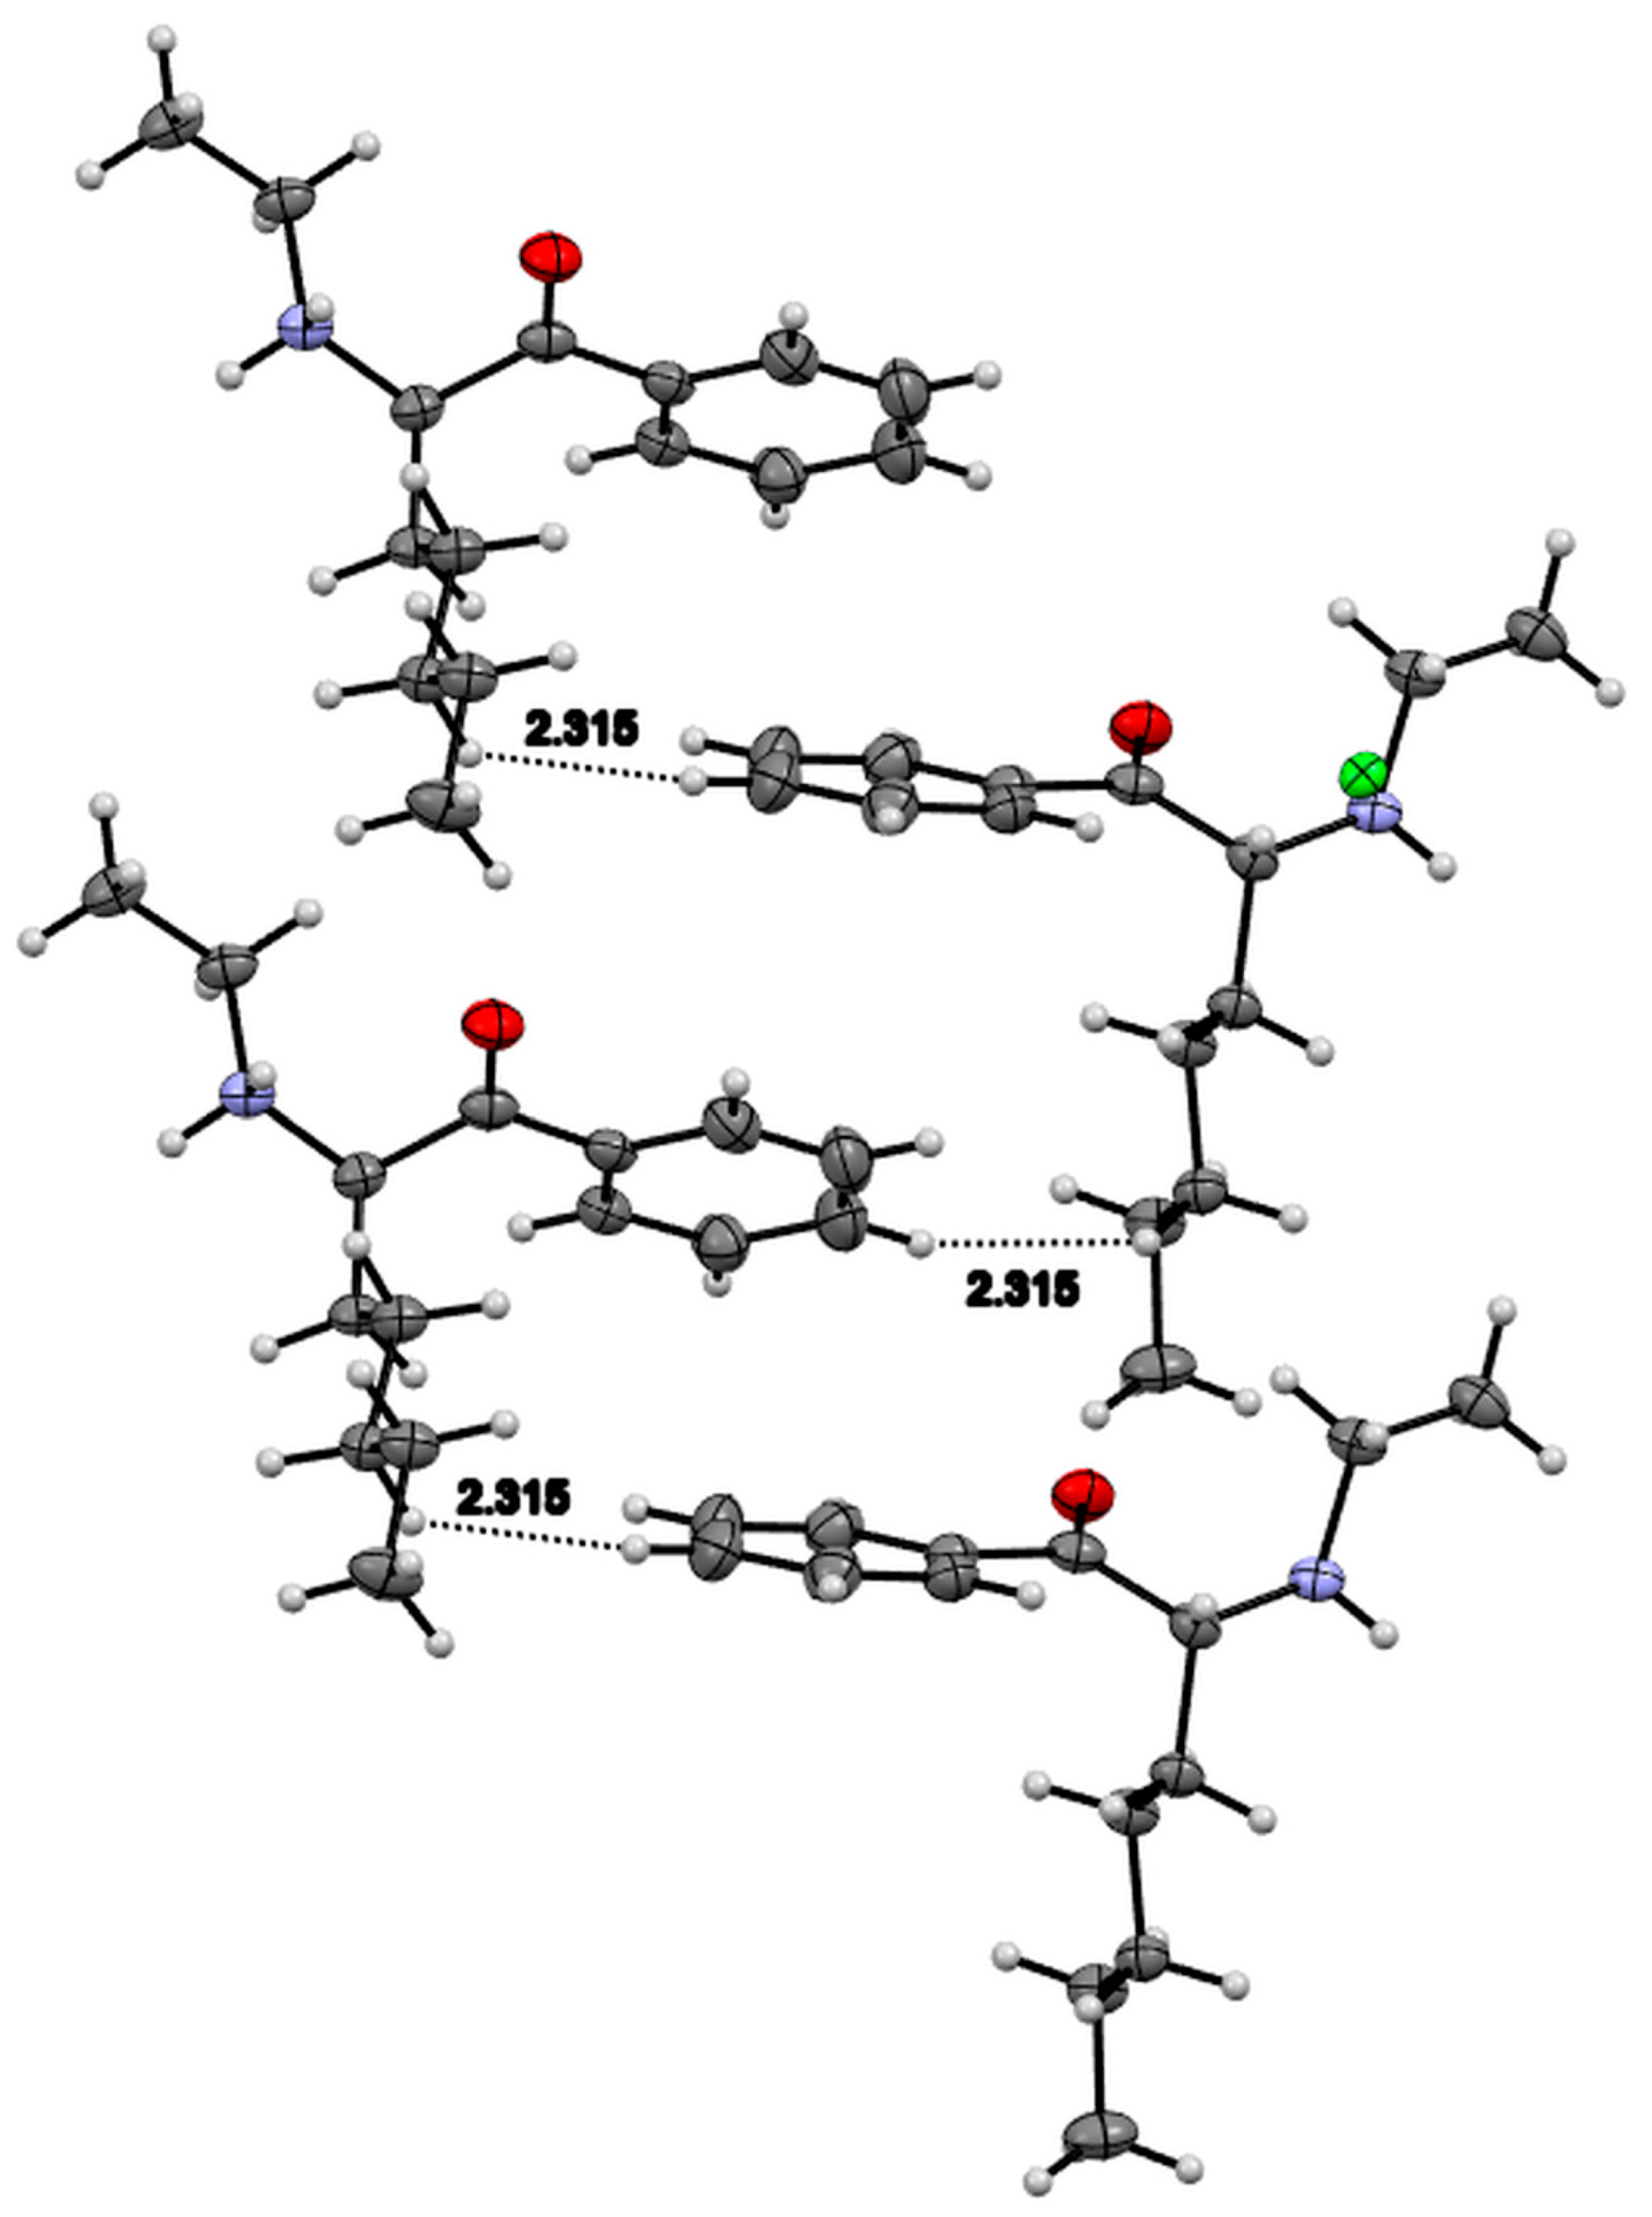
The IR spectra of compounds 1 and 2 are shown in the electronic Supplementary Material (Figures S9 and S10). In the IR spectra, the vibrations of the carbonyl group occurred at 1679 and 1684 cm−1 for compounds 1 and 2, respectively. Quite strong and wide vibrations in the region of 2500 cm−1 probably originate from the vibrations of the N+-H ion fragment.
TGA studies of both compounds showed that stability after melting was not very high. In the case of compound 1, whose DSC melting point was 211 °C (classically 205–207 °C with a clear change visible before the melting of the compound), the decomposition on the TGA graph was noted already at 180 °C (below the melting point of the compound) and also ends at about 225 °C. This process for compound 2, whose melting point was determined by DSC and was 160 °C (typically, it is 158–160 °C), started at the same temperature (approximately 160 °C) and ended at approximately 225 °C with total decomposition. TGA and DSC results are shown in the figures (Figures S11–S14). Two small signals seen in the graph of compound 2 at 90 °C and 95 °C may be related to the phase transitions occurring in the crystals of this compound.

3.4. X-ray Studies

Crystal data and structure refinement for both compounds are summarized in Table 1.
The crystal structure and arrangement of molecules in the unit cell of compound 1 are shown in Figure 9 and Figure 10. There are two molecules of both isomers (R and S) of the compound in the unit cell. Molecules form chains that consist of the same isomers. Short contacts can be found between molecules of the same isomers (only): H14A···C2 2.809 Å, which are in one chain (shown in Figure 11). Two such chains are connected by hydrogen bonds formed by the Cl ion and three adjacent molecules of the compound: C8H8 Cl 2.517 Å and C6H6 Cl 2.875 Å of the first molecule, N1H1 Cl 2.178 Å the second and C12H12B Cl 2.830 Å third particle (Figure 12). All these interactions are shorter than the sum of the vdW radii of the atoms and ions that comprise them (the sum of the vdW radii for H···Cl = 2.95 Å). There are no short contacts between the chains formed by pairs of the same isomers and pairs consisting of other isomers of the compound. The conformation of the molecule is also stabilized by the intramolecular bond N1H1···O1 with a length of 2.440 Å (sum of vdW = 2.72 Å).
The crystal structure and arrangement of molecules in the unit cell of compound 2 are shown in Figure 13 and Figure 14. An interesting feature of this relationship is the fact that only one of its isomers (R-isomer) is present in the unit cell of the examined crystal. In general, equimolar amounts of both isomers were present in all cathinones studied previously by us. In the previously described crystal structure of hexene (N-ethylhexedrone, NEH) both isomers occur in the unit cell [16]. This compound is a homologue of compound 2. Despite the similar size of the unit cells, they belong to different crystallographic groups. In compound 2, there is no π···π interaction between molecules, which is characteristic of its hexene homologue.
The hydrogen bonds formed by the interaction between the ammonium units of the molecules and the chlorine ions form a chain of molecules along the b axis (Figure 15). The distances between the N and Cl atoms alternate between 3.123 and 3.185 Å (smaller than the sum of the radii vdW = 3.30 Å). Between molecules belonging to different chains, there is a short contact CAr-H4···H13A-Caliph 2.315 Å, which is shown schematically in Figure 16.
New psychoactive substances appearing on the market every year are still a challenge for forensic chemists and toxicologists. In 2013, the Early Warning Advisory appeared, which collects data on adverse health effects associated with the use of NPS on the basis of case reports of poisoning; by 2022, over 1100 substances had been reported from various countries [17]. One of the most popular groups of NSPs in terms of potential chemical modifications and applications are cathinones. The subject of this study are two new derivatives.
In the case of compound 1, which is 4F-3Me-α-PVP, one fatal case of poisoning was reported at the beginning of 2022 [18]. Since 4F-3Me-α-PVP is a completely new cathinone derivative, there are no studies on its pharmacology or toxicity. Structurally, it is similar to α-PVP or 4F-α-PVP and for this reason the effects, potential side effects or concentrations in biological fluids of 4F-3Me-α-PVP are compared to these compounds [19].
In the case of compound 2, which is N-ethylheptedrone, it should be noted that this compound is a modification of the well-known N-ethylhexedrone (NEH), an NPS that is very popular on the drug market. Due to the popularity of NEH, there have been several publications regarding its effects, mechanism of action and toxicity. It is known that NEH is a reuptake inhibitor of dopamine (DAT) and noradrenaline (NET) transporters; therefore the mechanism of action is comparable to pyrrolidinyl cathinone derivatives [20,21]. The most common desired effects of NEH are typical of cathinones, such as agitation, psychomotor agitation, euphoria, etc. The side effects associated with NEH use include cardiovascular disorders, hyperthermia, anxiety, paranoia, etc., which are well-known and described side effects of using cathinone derivatives [22,23]. Considering the above, it can be expected that the effects and mechanism of action of N-ethylheptedrone will be comparable to NEH due to the structural similarity of these two compounds; N- ethylheptedrone has only one more methylene group in the N-alkyl chain.
For over a decade, governments of many countries and international agencies have been trying to limit the availability of new psychoactive substances on the market. Every year, new chemical compounds are recommended for legal review in order to limit their availability. Each new psychoactive substance identified on the market must be fully characterized before entering it on the list of controlled substances, which is why it seems so important to study both its physicochemical characteristics and toxicology.

4. Conclusions

In this paper, we present the chromatographic, spectroscopic and crystallographic characterization of two cathinone derivatives, i.e., 1-(4-fluoro-3-methylphenyl)-2-(pyrrolidin-1-yl)pentan-1-one (4F-3Me-α-PVP, MFPVP) hydrochloride (compound 1) and N-ethyl-2-amino-1-phenylheptan-1-one (N-ethylheptedrone) hydrochloride (compound 2), which are available on the NPS market. The presented work is a comprehensive physicochemical characterization of these compounds supplemented with a crystallographic characterization unreported so far. All crystallographic data obtained in this study are linked to the CCDC repository entry and characterization of the investigated compounds can be found there, including unit cell data, which is especially useful for rapid analysis. To our knowledge, this study provides the first detailed and comprehensive analytical work, including X-ray crystallographic data, on 4F-3Me-α-PVP and N-ethylheptedrone.

Supplementary Materials

The following supporting information can be downloaded at https://www.mdpi.com/article/10.3390/cryst13060934/s1. Figure S1: ESI-MS/MS spectrum of compound 1 (4F-3Me-α-PVP); Figure S2: ESI-MS/MS spectrum of compound 2 (N-ethylheptedrone); Figure S3: 1H nuclear magnetic resonance spectrum of compound 1 (4F-3Me-α-PVP); Figure S4: 13C nuclear magnetic resonance spectrum of compound 1 (4F-3Me-α-PVP); Figure S5: 1H nuclear magnetic resonance spectrum of compound 2 (N-ethylheptedrone); Figure S6: 13C nuclear magnetic resonance spectrum of compound 2 (N-ethylheptedrone); Figure S7: 1H-1H COSY nuclear magnetic resonance spectrum of compound 1 (4F-3Me-α-PVP)—aliphatic fragment; Figure S8: 1H-1H COSY nuclear magnetic resonance spectrum of compound 2 (N-ethylheptedrone)—aliphatic fragment; Figure S9: IR spectrum of compound 1; Figure S10: IR spectrum of compound 2; Figure S11: DSC of compound 1; Figure S12: DSC of compound 2; Figure S13: TGA of compound 1; Figure S14: TGA of compound 2.

Author Contributions

Conceptualization, M.R.; Methodology, M.R.; GC-MS, mass spectrometry, spectroscopic measurements, M.R. and P.K.; HR-MS measurements, M.R. and D.S.; X-ray measurements, M.K. and J.K.; Data analysis, M.R. and P.K.; Writing—original draft preparation, M.R and P.K.; Writing—review and editing, M.R., P.K. and M.K.; Supervision, M.R. and P.K. All authors have read and agreed to the published version of the manuscript.

Funding

This research received no external funding.

Data Availability Statement

Not applicable.

Conflicts of Interest

The authors declare no conflict of interest.

References

  1. EMCDDA European Drug Report 2022: Trends and Developments. 2022. Available online: https://www.emcdda.europa.eu/system/files/publications/13236/TDAT20001ENN_web.pdf (accessed on 22 December 2022).
  2. Valente, M.J.; Guedes de Pinho, P.; de Lourdes Bastos, M.; Carvalho, F.; Carvalho, M. Khat and synthetic cathinones: A review. Arch. Toxicol. 2014, 88, 15–45. [Google Scholar] [CrossRef] [PubMed]
  3. Szendrei, K. The chemistry of khat. Bull. Narc. 1980, 32, 5–35. [Google Scholar] [PubMed]
  4. Patel, N.B. “Natural Amphetamine” Khat: A Cultural Tradition or a Drug of Abuse? Int. Rev. Neurobiol. 2015, 120, 235–255. [Google Scholar] [CrossRef] [PubMed]
  5. Brenneisen, R.; Fisch, H.U.; Koelbing, U.; Geisshüsler, S.; Kalix, P. Amphetamine-like effects in humans of the khat alkaloid cathinone. Br. J. Clin. Pharmacol. 1990, 30, 825–828. [Google Scholar] [CrossRef] [PubMed] [Green Version]
  6. Kaizaki, A.; Tanaka, S.; Numazawa, S. New recreational drug 1-phenyl-2-(1-pyrrolidinyl)-1-pentanone (alpha-PVP) activates central nervous system via dopaminergic neuron. J. Toxicol. Sci. 2014, 39, 1–6. [Google Scholar] [CrossRef] [PubMed] [Green Version]
  7. Uralets, V.; Rana, S.; Morgan, S.; Ross, W. Testing for designer stimulants: Metabolic profiles of 16 synthetic cathinones excreted free in human urine. J. Anal. Toxicol. 2014, 38, 233–241. [Google Scholar] [CrossRef] [PubMed] [Green Version]
  8. National Forensic Laboratory. Slovenia. Analytical Report: 4F-3Me-α-PVP. 2020. Available online: https://www.policija.si/apps/nfl_response_web/0_Analytical_Reports_final/4F-3Me-%CE%B1-PVP-ID-2187-20_report.pdf (accessed on 20 December 2022).
  9. Hungarian Institute for Forensic Science. Hungary. Analytical Data for Ethyl-Heptedrone. 2019. Available online: https://www.policija.si/apps/nfl_response_web/0_Analytical_Reports_final/ETHYLHEPTEDRON-ID-HIFS-012.pdf (accessed on 20 December 2022).
  10. Rigaku Oxford Diffraction. CrysAlisPro Software System, Version 1.171.39.46; Rigaku Corporation: Wroclaw, Poland, 2018. [Google Scholar]
  11. Rigaku Oxford Diffraction. CrysAlisPro Software System, Version 1.171.38.41q; Rigaku Corporation: Wroclaw, Poland, 2015. [Google Scholar]
  12. Sheldrick, G.M. Crystal structure refinement with SHELXL. Acta Crystallogr. Sect. C Struct. Chem. 2015, 71, 3–8. [Google Scholar] [CrossRef] [PubMed] [Green Version]
  13. Matsuta, S.; Katagi, M.; Nishioka, H.; Kamata, H.; Sasaki, K.; Shima, N.; Kamata, T.; Miki, A.; Tatsuno, M.; Zaitsu, K.; et al. Structural characterization of cathinone-type designer drugs by EI mass spectrometry. Jpn. J. Forensic Sci. Technol. 2014, 19, 77–89. [Google Scholar] [CrossRef] [Green Version]
  14. Fornal, E. Study of collision-induced dissociation of electrospray-generated protonated cathinones. Drug Test. Anal. 2014, 6, 705–715. [Google Scholar] [CrossRef] [PubMed]
  15. Fornal, E. Formation of odd-electron product ions in collision-induced fragmentation of electrospray-generated protonated cathinone derivatives: Aryl α-primary amino ketones. Rapid Commun. Mass Spectrom. 2013, 27, 1858–1866. [Google Scholar] [CrossRef] [PubMed]
  16. Kuś, P.; Rojkiewicz, M.; Kusz, J.; Książek, M.; Sochanik, A. Spectroscopic characterization and crystal structures of four hydrochloride cathinones: N-ethyl-2-amino-1-phenylhexan-1-one (hexen, NEH), N-methyl-2-amino-1-(4-methylphenyl)-3-methoxypropan-1-one (mexedrone), N-ethyl-2-amino-1-(3,4-methylenedioxyphenyl)pentan-1-one (ephylone) and N-butyl-2-amino-1-(4-chlorophenyl)propan-1-one (4-chlorobutylcathinone). Forensic Toxicol. 2019, 37, 456–464. [Google Scholar] [CrossRef] [Green Version]
  17. UNODC Data from the UNODC Early Warning Advisory on the New Psychoactive Substances. 2022. Available online: https://www.unodc.org/unodc/en/scientists/ewa/data.html (accessed on 22 December 2022).
  18. Hobbs, J.M.; DeRienz, R.T.; Baker, D.D.; Shuttleworth, M.R.; Pandey, M. Fatal intoxication by the novel cathinone 4-fuoro-3-methyl-α-PVP. J. Anal. Toxicol. 2022, 46, e101–e104. [Google Scholar] [CrossRef] [PubMed]
  19. Kuropka, P.; Zawadzki, M.; Szpot, P. A review of synthetic cathinones emerging in recent years (2019–2022). Forensic Toxicol. 2023, 41, 25–46. [Google Scholar] [CrossRef] [PubMed]
  20. Kolaczynska, K.E.; Thomann, J.; Hoener, M.C.; Liechti, M.E. The pharmacological profile of second generation pyrovalerone cathinones and related cathinone derivative. Int. J. Mol. Sci. 2021, 22, 8277. [Google Scholar] [CrossRef] [PubMed]
  21. Gatch, M.B.; Forster, M.J. Methylenedioxymethamphetamine-like discriminative stimulus effects of pyrrolidinyl cathinones in rats. J. Psychopharmacol. 2020, 34, 778–785. [Google Scholar] [CrossRef] [PubMed]
  22. Gatch, M.B.; Shetty, R.A.; Sumien, N.; Forster, M.J. Behavioral effects of four novel synthetic cathinone analogs in rodents. Addict. Biol. 2021, 26, e12987. [Google Scholar] [CrossRef] [PubMed]
  23. Mikołajczyk, A.; Adamowicz, P.; Tokarczyk, B.; Sekuła, K.; Gieroń, J.; Wrzesień, W.; Stanaszek, R. Determination of N-ethylhexedrone, a new cathinone derivative, in blood collected from drivers—Analysis of three cases. Prob. Forensic Sci. 2017, 109, 53–63. [Google Scholar]
Figure 1. Structures of 4F-3Me-α-PVP (1) and N-ethylheptedrone (2).
Crystals 13 00934 g001
Figure 2. GC-EI-MS spectra of compounds 1 (A) and 2 (B).
Crystals 13 00934 g002
Figure 3. EI-MS fragmentation pathway of compound 1.
Crystals 13 00934 g003
Figure 4. EI-MS fragmentation pathway of compound 2.
Crystals 13 00934 g004
Figure 5. ESI-MS/MS fragmentation pathway of compound 1.
Crystals 13 00934 g005
Figure 6. ESI-MS/MS fragmentation pathway of compound 2.
Crystals 13 00934 g006
Figure 7. Probable arrangement of individual hydrogen atoms of compound 1 (based on the crystal structure discussed in this paper), whose signals in the 1H NMR spectra are distinguished by their location (see discussion in the text).
Crystals 13 00934 g007
Figure 8. Probable arrangement of individual hydrogen atoms of compound 2 (based on the crystal structure discussed in this paper), whose signals in the 1H NMR spectra are distinguished by their location (see discussion in the text).
Crystals 13 00934 g008
Figure 9. Crystal structure of compound 1.
Crystals 13 00934 g009
Figure 10. Unit cell of compound 1.
Crystals 13 00934 g010
Figure 11. Packing diagram of compound 1. Dashed lines represent the contacts between molecules in the formed chains.
Crystals 13 00934 g011
Figure 12. Hydrogen bonds of a chloride ion with protons of the three adjacent molecules for compound 1.
Crystals 13 00934 g012
Figure 13. Crystal structure of compound 2.
Crystals 13 00934 g013
Figure 14. Unit cell of compound 2.
Crystals 13 00934 g014
Figure 15. Short contacts between nitrogen atoms of ammonium units of compound 2 and chlorine ions.
Crystals 13 00934 g015
Figure 16. Short contacts CAr-H4···H13A-Caliph between molecules of compound 2.
Crystals 13 00934 g016
Table 1. Crystal data and structure refinement for compounds 1 and 2.
Compound 1Compound 2
Chemical formulaC16H23FClNOC15H24ClNO
Mr299.80269.80
Crystal system, space groupMonoclinic, P21/nOrthorhombic, P212121
Temperature (K)293100
a, b, c (Å)9.1188 (12), 7.0997 (8), 25.262 (4)7.0850 (5), 7.8818 (6), 27.695 (2)
β (°)98.951 (14)90
V3)1615.6 (4)1546.6 (2)
Z44
Radiation typeMoKαCuKα
µ (mm−1)0.242.09
Crystal size (mm)0.18 × 0.07 × 0.030.600 × 0.060 × 0.020
Tmin, Tmax0.869; 1.0000.605; 1.000
No. of measured, independent andobserved [I > 2σ(I)] reflections18582, 6413, 293620690, 3057, 2911
Rint0.0480.054
(sin θ/λ)max−1)0.8000.622
R[F2 > 2σ(F2)], wR(F2), S0.080, 0.269, 1.030.040, 0.113, 1.13
No. of reflections64133057
No. of parameters193166
Δρmax, Δρmin (e Å−3)0.69, −0.370.51, −0.32
CCDC22495002249501
Disclaimer/Publisher’s Note: The statements, opinions and data contained in all publications are solely those of the individual author(s) and contributor(s) and not of MDPI and/or the editor(s). MDPI and/or the editor(s) disclaim responsibility for any injury to people or property resulting from any ideas, methods, instructions or products referred to in the content.

