Article

An Operando Study of the Thermal Reduction of BaTiO3 Crystals: The Nature of the Insulator–Metal Transition of the Surface Layer

1
Forschungszentrum Jülich GmbH, Institute of Energy and Climate Research (IEK-14), 52425 Jülich, Germany
2
Forschungszentrum Jülich GmbH, Peter Grünberg Institute (PGI-1) and Institute for Advanced Simulation (IAS-1), 52425 Jülich, Germany
3
EOT GmbH, 55743 Idar-Oberstein, Germany
4
A. Chełkowski Institute of Physics, University of Silesia, 41-500 Chorzów, Poland
5
aixACCT Systems GmbH, 52068 Aachen, Germany
*
Author to whom correspondence should be addressed.
Jacek Szade has passed away.
Crystals 2023, 13(8), 1278; https://doi.org/10.3390/cryst13081278
Submission received: 17 July 2023 / Revised: 2 August 2023 / Accepted: 8 August 2023 / Published: 19 August 2023
(This article belongs to the Section Inorganic Crystalline Materials)

Abstract

:
The insulator-to-metal transition upon the thermal reduction of perovskites is a well-known yet not completely understood phenomenon. By combining different surface-sensitive analysis techniques, we analyze the electronic transport properties, electronic structure, and chemical composition during the annealing and cooling of high-quality BaTiO3 single crystals under ultra-high-vacuum conditions. Our results reveal that dislocations in the surface layer of the crystal play a decisive role as they serve as easy reduction sites. In this way, conducting filaments evolve and allow for turning a macroscopic crystal into a state of metallic conductivity upon reduction, although only an extremely small amount of oxygen is released. After annealing at high temperatures, a valence change of the Ti ions in the surface layer occurs, which becomes pronounced upon the quenching of the crystal. This shows that the reduction-induced insulator-to-metal transition is a highly dynamic non-equilibrium process in which resegregation effects in the surface layer take place. Upon cooling to the ferroelectric phase, the metallicity can be preserved, creating a “ferroelectric metal.” Through a nanoscale analysis of the local conductivity and piezoelectricity, we submit that this phenomenon is not a bulk effect but originates from the simultaneous existence of dislocation-based metallic filaments and piezoelectrically active areas, which are spatially separated.

1. Introduction

The physical and chemical properties of the surface and the surface layer of model ABO3 oxides with perovskite structure, here ferroelectric BaTiO3, are in the academic focus in aiming to understand the screening of spontaneous polarization, the electronic structure, and point defect chemistry (especially for Schottky disorder). It has been found that for a thorough understanding of a perovskite crystal’s behavior under gradients of the electrical and chemical potential, comprehension of the role of the surface is essential [1,2,3,4,5,6,7,8,9,10,11,12]. The finding of Känzig back in 1955 that a 100 Å thick surface layer has a significant impact on the temperature shift between ferroelectric and paraelectric phases in BaTiO3 single crystals opened an exciting chapter into the investigation of the properties of the surfaces of ternary and multinary oxides with perovskite structures [13]. The discovery that electronic doping (induced, for example, by the thermal reduction of BaTiO3) can lead to the coexistence between ferroelectricity and metallicity has had a further impact on investigating the properties of the surface layer [14,15]. Because thermal doping is connected to the incorporation of oxygen vacancies in the matrix, the exchange of oxygen between the crystal and surrounding with a low activity of oxygen (e.g., vacuum, H2, Ar, etc.) at the surface is of the utmost importance for this reaction. Hence, the surface plays the role of the “interface” for the system bulk/environment [14,16,17,18]. The main share of the investigation concerning the transformation of dielectric barium titanate into a metal was conducted via samples, which were quenched following thermal reduction to room temperature before electrodes were deposited on the reduced surface in order to investigate the electrical transport phenomena. In contrast to the insulator-to-metal (I/M) transition in non-ferroelectric SrTiO3, which has been observed for diluted concentrations of carriers (~1015 cm−3 [19,20,21,22]), it is assumed that the critical concentration for BaTiO3 (while fulfilling the Mott criterion) is on the order of 1020 cm−3 [17]. This allows for a direct analysis of the modifications induced in the electronic structure utilizing, for example, X-ray photoelectron spectroscopy (XPS). However, surface-sensitive in situ and operando investigations into the nature of the metallic states induced by the reduction of BaTiO3 are lacking in the literature.
The objective of this paper is to couple surface-sensitive techniques, such as XPS, with electrical measurements under ultra-high-vacuum (UHV) conditions. In this way, information regarding the electronic structure obtained under in situ and operando conditions can be directly correlated to the I/M transition of the crystal. Because our previous nanoscale studies of the I/M transition of thermally reduced SrTiO3 showed that the transition is inhomogeneous [19,20,21,22], we will not determine the amount of removed oxygen via indirect Hall carrier density measurements but will employ a spectrometric effusion measurement. Additionally, we will analyze the uniformity of the electrical conductivity of the reduced BaTiO3 using local conductivity atomic force microscopy (LC–AFM) in both in-plane and out-of-plane geometry.

2. Materials and Methods

2.1. Crystals

For our experiments, we used mono-domain BaTiO3 (100) pc crystals produced by Crystec, MaTecK, and FEE (all from Germany). The typical dimensions of the crystals were 5 × 5 × 0.5 mm3. The rms-value (determined for an area of 1 × 1 µm2) was in the range of 0.5 nm. The impurity level determined using inductively coupled plasma mass spectrometry (ICP–MS) (Agilent, Santa Clara, CA, USA) was lower than 30–40 ppm.

2.2. XPS Spectrometer

We used an XPS spectrometer PHI 5800 (Physical Electronics, Chanhassen, MN, USA) with a monochromatic Al Kα X-ray source (1486.6 eV) to study the electronic structure and stoichiometry of the surface. The determined full-width half-maximum (FWHM) on clean Ag (after sputtering in UHV) was 0.78 eV. In our investigation, we worked with a microfocus (300 × 700 µm2). The measurements were obtained with a power of the X-ray source of 200–250 W. The used pass energy (PE) was 23.5 eV, and the step in spectra acquisition was fixed at 0.05 eV. The sample’s charging was compensated with a neutralizer at low temperatures (T < 400 °C) for the as-received crystals; charging did not occur on the reduced crystals. The analysis of the spectra (curve-fitting) was obtained using the MultiPak software.
An essential element of the spectrometer for the direct study of the reduction phenomena was a heating system that was specially developed without using transition metals such as Ta, Mo, W, or semiconducting Si, which, at high temperatures, could dramatically lower the oxygen activity in the ambient of the heated samples and induce a decomposition of the oxide [23]. Additionally, the long duration of the experiment, many days at high temperatures (700–1100 °C), required an “optimal screening” of the infrared irradiation produced by the furnace and a reduction in its power. With such means, the pressure in the spectrometer chamber at the highest reduction temperature (1100 °C) could be limited to 10−9 mbar. The heating system had a low heat capacity, allowing for fast quenching experiments.

2.3. Effusion Apparatus

Effusion experiments were carried out in a UHV system with the residual gas analyzer E-Vision (MKS Instruments, Andover, MA, USA). The base pressure in the chamber, which was made of quartz glass, was <5 × 10⁻¹⁰ mbar. The detection limit of oxygen was at a partial pressure of 10−13 mbar using a multichannel plate detector and filaments of thoriated iridium. The chamber was designed as a vertical two-zone oven, in which the “park position” of the sample was heated permanently to 300 °C, whereas the temperature of the working zone, where the effusion measurements were performed, was stabilized with an accuracy of 0.5 °C (from 400–1000 °C). Moving the crystal (fixed with Pt wires) between the two stated zones was possible using a magnetic transfer system. The system’s calibration was obtained volumetrically at a constant temperature for three defined pressures of oxygen. The detection level of the apparatus was confirmed via test measurements without the crystal. Our study’s maximum temperature was limited to 1000 °C in order to avoid hydrogen permeation through the fused quartz.

2.4. Electrical Characterization

For the in situ measurement of the electrical properties, a resistance measurement system, aixDCA (aixACCT systems, Aachen, Germany), was used. This system allows the characterization of the resistance into a four-electrode configuration as illustrated in Figure 1, using an extremely low AC polarization voltage (typically 4 mV) while controlling the oxygen partial pressure as total pressure inside a UHV chamber (for details see [24]). With this system, it was possible to perform quenching experiments (i.e., cooling from 1000–200 °C) within very short intervals of 10–20 s.

2.5. Atomic Force Microscopy

The topography and local conductivity of the crystal surface was investigated on the nanoscale by an atomic force microscope (JSPM 4210, JEOL, Akishima, Japan). Using the piezoresponse force microscopy (PFM) mode, the piezoelectric properties were also investigated. As the study aimed to compare macroscopic measurements of the I/M transition with the electrical transport phenomena on the nanoscale, an essential aspect of our LC–AFM investigations was to determine the dependence of the local electrical resistivity of thermally reduced crystals as a function of temperature. Therefore, current maps were recorded in the same region of the sample with a dimension of 5 × 5 µm2 at different temperatures between 25 and 350 °C without mechanical readjustment of the position of the scanning area. The current sensitivity of our system was improved by using an additional external current-to-voltage converter with a resolution in the fA range. The measurements were performed using conducting Pt-coated cantilevers (PPP-CONTPt, Nanosensors, Neuchatel, Switzerland) with a force constant of 0.02–0.77 N/m. The universal use of the specified cantilever with a resonant frequency of 6–21 kHz for LC–AFM and PFM studies limited the maximum frequency for PFM measurements to f < 6 kHz.

3. Results and Discussion

3.1. The I/M Transition of BaTiO3 Induced by Thermal Reduction

3.1.1. Electrical Characterization

The thermal reduction of BaTiO3 leads to the removal of oxygen from the matrix in accordance with the following defect–chemical reaction:
BaTiO3 BaTiO3−x + x · ½ O2.
Due to the introduced oxygen vacancies in the crystal, some electrons will be thermally activated from F1 and F2 centers [25,26,27] and transferred to Ti atoms, whose valences change from Ti4+ to Ti3+. This electronic doping increases the electrical conductivity and can induce an insulator-to-metal transition if the critical concentrations of electronic charge carriers are reached. The reduction in the oxygen stoichiometry of the crystalline perovskite materials can be obtained in different ways. In all cases, the effective reduction process needs a low oxygen partial pressure in the ambient of the crystal, which can be reached via thermal treatment in reduction gases (e.g., H2, CO–CO2, H2–Ar, H2–H2O), in a vacuum, or in contact with materials whose oxygen affinity is higher than that of BaTiO3 (e.g., Ti, Mo, Ta, or Si).
The first observation of the “switching” of insulating BaTiO3 single crystals into a conducting state upon thermal reduction in H2 and an H2–N2 mixture was reported by Kolodiazhnyi [28]. However, it must be considered that using an extremely reducing medium such as H2 can lead to the effusion of Ba from BaTiO3. We investigated this effect by means of a mass-spectroscopic analysis of powdered BaTiO3 crystals brought into contact with the transition metal Ti as an oxygen getter [23]. Hence, we conducted our study of the reduction of oxygen stoichiometry in barium titanate, presented here under high-vacuum conditions at temperatures of 600–1000 °C, which allows for the physical control of the oxygen partial pressure [24]. Using the four-point technique and a very low AC polarization voltage, we analyzed the kinetics of the resistivity change for isothermal conditions as a function of the reduction time (Figure 2). After each reduction step, the sample was cooled to 50 °C by switching off the heater. Due to the heat capacity of the system, it took several hours to reach the final temperature, and hence it can be assumed that the sample was in quasi-equilibrium conditions during cooling. The resulting resistance-temperature curves were employed in order to check if they exhibit a characteristic mark of metallic behavior, namely, an increase in conductivity for a decrease in temperature (Figure 3).
Although the thermodynamic parameters (here, the temperature and oxygen partial pressure) are very well-defined and constant during the thermal treatment, it can be seen in Figure 2 that the progression of the reduction does not reach a characteristic plateau, which would be typical for reaching equilibrium conditions. Despite the long reduction time (60,000 s), the interfaces’ resistances exhibit a permanent decrease, but for the bulk, the same effect as for SrTiO3 crystals can be identified, namely self-healing [22]. This means that after a short time (here, 3500 s), the reduction reaches an “optimal” state (the resistance of the crystal bulk was minimal and is marked with an arrow in Figure 2), and the prolonged reduction leads to an increase in the resistance. Similar dependencies for R(t) were observed for the reduction temperatures 600–700 °C, 700–800 °C, and 900–1000 °C. Our investigation of the thermal dependence of the resistance reveals that for the sample reduced below 700 °C, the metallic character of the conductivity can be identified in the section of the R(T) curves of both interfaces for the temperature between the reduction temperature and 500 °C (Figure 3a). In contrast to the smooth course of the R(T) curves observed after thermal reduction at 700 °C, a singularity (a step-like increase) can be observed at Tc following reduction at higher temperatures (here 800–1000 °C). The resistance for the bulk and both interfaces after the reduction at temperatures of 800–900 °C exhibited typical metallic behavior (Figure 3b,c), namely a monotonic increase in the resistance with increasing temperature (except at the transition temperature). In the sample, which was reduced at 1000 °C, the metallic transition of the BaTiO3 crystal can be identified from the reduction temperature to Tc (Figure 3d). In this strongly reduced sample, the metallicity in the bulk and one interface disappears below the phase transition into the ferroelectric phase and only remains in one of the interfaces.
As the oxygen partial pressure in the UHV furnace was similar for all reduction temperatures, we can calculate the activation energy for the reduction of the system Pt/BaTiO3/Pt using the final resistances for these isobaric conditions. In this way, we estimated (from the Arrhenius plot) that the activation energy is smaller than 0.34 eV.

3.1.2. Oxygen Effusion

In Figure 4, the effusion of oxygen and carbon dioxide during thermal reduction is presented. When increasing the temperature from 300 to 750 °C, the effused oxygen originates from the dissociation of chemisorbed CO2 on the BaO-terminated part of the crystal surface
2 BaCO3  2 BaO + CO2 + CO + ½ O2
and reduction of the stoichiometry of the original crystal (cf. Formula (1)). The concentration of oxygen vacancies introduced in BaTiO3 during the thermal reduction process should equal the number of oxygen ions removed from the crystal matrix. Our effusion data shows that the reduction of BaTiO3 crystal from 750 to 850, 950, and 1000 °C only leads to seemingly negligible exhaustions of oxygen on the order of 1015/cm3 (Figure 4). Hence, thermogravimetric measurements would not enable a reliable determination of the decrease in mass in thermally reduced crystals, despite the extremely high sensitivity of contemporary balances. Based on our effusion measurements, we estimated the oxygen nonstoichiometry induced in the O sublattice. The nonstoichiometry x in BaTiO3−x is in the range of 10−7. This value does not agree with the data presented by Kolodiazhnyi [28], where a value of 2 × 10⁻⁴ was obtained, which had been estimated from the measurement of the concentration of electronic carriers introduced for similar reduction temperature regions 900–1000 °C. Our effusion investigation reveals that despite only a shallow concentration of removed oxygen ions (measured as O + O2) of only ~2–5 × 10¹⁵/cm3, the transition into the metallic state (see Figure 3) takes place. Hence, the crystal does not need to reach the critical concentration of carriers nc = 1.6 × 10²⁰/cm3 suggested by Kolodiazhnyi. Note that for the mentioned critical concentration of carriers in reduced BaTiO3, the author of a previous paper [28] reduced the crystal to at least 1000 °C in H2 atmosphere, leading to a nonstoichiometry of x = 2 × 10⁻³, which is 3–4 orders of magnitude higher than the calculated nonstoichiometry of our metallic crystal. It should be kept in mind that the determination of the nonstoichiometry using carrier concentration values obtained from Hall measurements is only valid if the oxygen vacancies introduced during the reduction process are distributed uniformly in the matrix of the crystals. At this point, caution is advised, as extensive studies on thermally reduced SrTiO3 crystals have shown that there is a significant inhomogeneity in the distribution of doped carriers. Hence, the carrier concentration cannot be treated as a parameter that is related to the entire volume of the crystal. We will explicitly analyze this topic by mapping the electrical conductivity using LC–AFM (see below).

3.1.3. Operando XPS Study of the Reduction of BaTiO3

Our operando XPS studies aim to analyze the modifications in the electronic structure and stoichiometry of the surface layer during the reduction of BaTiO3 crystals. By correlating the results with data from electrical measurements and effusion, we are able to scrutinize the nature of the I/M transition induced by removing oxygen. In particular, the search for the additional Ti state in the band gap, which may be generated due to the reduction in the oxygen stoichiometry, was the focus of our investigation. To further confirm that the I/M transition did indeed occur in the surface layer of the reduced crystal due to a change in the valence of Ti from 4+ to 3+, we conducted an XPS investigation of the valence band region with the highest possible energetic resolution. In this manner, we sought to identify an additional occupied state near the bottom of the conduction band, similar to the thermal reduction of SrTiO3.
Because the electrical characterization of the I/M transition shows that the temperature necessary for generating the metallic state is around 700 °C, we began our studies at 400 °C in order to follow the changes in the surface layer during the transition. This lowest temperature allowed us to collect the XPS spectra without charging effects, and we did not need to use the flood gun. Despite the heating of the sample under UHV conditions and the moderated temperature of 400 °C, we found that the epi-polished surface of BaTiO3 was contaminated. The O1s core line (Figure 5) exhibited an additional compound with a high binding energy (Table 1), and the signal of the C1s core line (Figure 6, Table 2) revealed the existence of carbon on the surface. For the optimal correlation of the XPS data with electrical data, the sample’s surface was prepared in exactly the same way as for the electrical measurements. In both cases, the sample’s surface was epi-polished. Even after the heating at 700 °C, the existence of residual adsorbates on the surface has been identified (Figure 6).
We started the analysis of the XPS spectra with the element of maximal concentration in the matrix, namely oxygen. We chose the core lines of oxygen with the highest cross-section according to Scofield [29], which in our case was the O1s line. We did not consider the O2p due to its low cross-section and partial hybridization with the density of the state of the valence band. Figure 5 presents all O1 spectra collected between the temperatures of 400 and 1100 °C. At first glance, the thermally induced change in the core lines’ shape seems relatively small. The binding energy determined by the analysis of the position of the core line’s maximum does not show an energetic shift for different temperatures; the maximum lies at 529.70 eV ± 0.05 eV (the measurements were obtained without using the flood gun). The deconvolution of the O1s line at 400 °C shows that the line can be fitted with two peaks: a mean peak at 529.7 eV and a small compound at a higher binding energy of about 530.9 eV (Table 1). Note that the residuals below the spectra (red dotted lines in Figure 5) show that such a fitting is acceptable. For temperatures above 900 °C, the O1s peaks are completely symmetrical and can be very well fitted with a single component.
Although carbon is not part of the “chemistry” of the clean surface layer of BaTiO3, it should be noted that the contamination with physically and chemically adsorbed species concerns all surfaces of perovskite materials if the sample is exposed to ambient conditions. The set of the C1s core lines in Figure 6 shows that the thermally induced desorption removes all carbon compounds between 400 and 700 °C (such as C=C, CH, CO, and COOH). At 800 °C, the crystalline sample is free of carbon compounds. The high temperature of the carbon desorption is typical for the thermal dissociation of BaCO3 (cf. Formula (2)). The binding energy of the compounds of the C1s core line with the highest intensity is 284.2 eV (Table 2).
The central part of our XPS analysis is dedicated to the thermal modifications of the Ti2p core line. Looking at the 3D representation of the spectra presented in Figure 7, no spectacular changes can be recognized. This is reasonable, as only a very small amount of oxygen was removed during thermal reduction. However, when we compare the shape of the Ti2p line collected at 400 °C and 1100 °C (Figure 7, bottom), distinct differences can be identified. The fitting reveals that an additional component with a binding energy of 456.6 eV exists that can be attributed to Ti2p with a valence of 3+ (Table 3).
The most challenging core line concerning the fitting is the Ba3d5/2 one (Figure 8). On the one hand, using the simple deconvolution, one can, with a good χ2, fit the Ba3d5/2 line with only two peaks (see, e.g., Singh et al. [30]). On the other, the variation in the area of the peaks and FWHM, which does not show a clear trend after two-component fitting, suggests that this procedure could be mathematically correct but deviates from physics. Therefore, we only employed this approach as a “template” to determine the correct energetic position of all compounds through simple but effective subtraction of the Ba3d lines collected at the same temperature (500 °C) after thermal quenching. We found four contributions (see Table 4): a main line (component 1), typical for Ba in the BaTiO3 matrix with a binding energy of 779.1–779.3 eV, and an additional compound (component 2), whose energetic position was shifted towards a higher binding energy of 780.6–780.9 eV. The core line (component 3) with the highest binding energy of 781.5–781.7 eV has only been found for the crystal, which has been heated at temperatures of ≥900 °C. Additionally, a new component appears at high reduction temperatures, which has a lower binding energy than that of the main compound. This line (component 4) possesses a binding energy of 777–777.5 eV and is not easy to fit due to the presence of the lowest intensity without the additional information of the correct position (the relative area related to the entire site of the Ba3d line is only a few percent). A more detailed analysis is presented below and relates to the quenched sample. For component 1, a permanent increase in the FWHM from 1.5 to 1.97 eV upon thermal reduction can be observed; the relative concentration of the Ba in this chemical form surface fluctuates slightly during heating (75–80%). The most interesting behavior shows component 2 exhibiting a permanent decrease in its contribution to the total area of the Ba3d5/2 core line. The inverse tendency in the area changes can be observed for component 3, which increases from 900 to 1000 °C. Component 4 could be associated with metallic barium, whose effusion we observed via mass spectrometry at extremely low oxygen partial pressures [23].
Analyzing valence electrons’ distribution provides essential information regarding the physical and chemical properties of the solid. The hybridization of 2p electrons of oxygen with 3d electrons of Ti contributes to the primary share of the density of state (DOS) of the valence band (VB). Of course, the measured VB spectra are an integrated DOS throughout the entire Brillouin zone. For the interpretation of the partial DOS, it should be taken into account that the Ti state in XPS VB spectra demonstrates an overestimated contribution of the occupied 3d state due to a higher cross-section of Ti than for oxygen. A detailed comparison between the calculated DOS and the experimental valence band will be presented below. The shape of the VB for 400 °C (Figure 9) is similar to the VB spectra that can be found in the literature. With the increasing reduction temperature, a bending of the spectra at ~5 eV disappears, and the VB spectra become unstructured. The magnification of the region of the top of the VB reveals the existence of a long tail of the occupied states, which reduces the effective broadness of the band gap. With the increase in the reduction temperature, the diffuse tail of this state is reduced, which allows us to attribute the origin of these states to contamination with carbon compounds. For the reduction temperatures of 800 and 900 °C, the width of the bandgap extrapolated from the VB region reaches the maximum value of ~3 eV. The tendency reverses again for the reduction at 1000 and 1100 °C. A new state at the top of the VB is then created, probably due to the change in the ratio Ba/Ti. In the bandgap region of the reduced crystal, an additional occupied state close to the Fermi level emerges, which could be connected to introducing d1 electrons (coming from Ti with valence 3+) and cannot be detected, although the I/M transition has been confirmed by electrical measurements. Hence, we can conclude that the sensitivity of the XPS method, which is only a few percent for the VB region, due to an extremal low cross-section for electronic states, is not sufficient for the analysis of metallic states at the surface.
The analysis of the composition (here, the Ba/Ti ratio) of the surface layer shows an increase in the concentration of Ba between 400 and 700 °C, followed by a successive decrease in the temperature region of 800–1100 °C (Figure 10). In order to analyze the results correctly, it must be kept in mind that the as-received surface is contaminated with one or many layers of chemical adsorbates due to its high affinity to CO and CO2. Therefore, in the photoemission, the intensity (yield) of the Ba3d line will be reduced, and we could falsely interpret this behavior as a reduction in stoichiometry. If the contamination is relatively low (after reduction at 700 °C), we are certain that the Ba/Ti represents the correct value and can be further analyzed.
During the progressive reduction (800–1100 °C), we observed a permanent increase in the Ti concentration; the Ba/Ti ratio changed from 0.85 at 800 °C to 0.67 at 1100 °C. This behavior resembles the Sr/Ti ratio change for SrTiO3 single crystals being reduced in the XPS spectrometer [31]. For SrTiO3, the enrichment of TiO oxides in the surface layer has even been confirmed by SIMS measurements and X-ray diffractometry.

3.1.4. Comparison to Density Functional Theory Calculations

To analyze the electronic structure obtained from the XPS measurements, we calculated 15-layer thick symmetric BaTiO3 films with different terminations using density functional theory with the Wu–Cohen exchange-correlation potential [32]. The calculations are performed using the linearized augmented plane-wave method [33] implemented in the FLEUR code [34]. A plane-wave cutoff of 4.5 (a.u.)−1 and muffin-tin radii of 2.70, 2.08, and 1.39 a.u. were used for Ba, Ti, and O atoms, respectively. The irreducible Brillouin zone was sampled with 28 k-points, and all structures were relaxed until the forces were smaller than 0.05 eV/Å.
From the density of states, one can see that the valence band in the bulk-like regions has a bandwidth of about 5.5 eV (lower panels in Figure 11), and the comparison with the experimental data (Figure 9) shows the dominance of the Ti 3d contributions in the spectra. The local oxygen DOS shows a characteristic two-peak structure with states involved in Ti-O bonds and, at lower binding energy, states oriented in the BaO planes. At the TiO2-terminated surface, the former ones are less affected, while the latter ones shift towards the Fermi level and induce a small tail extending into the band gap. On the BaO-terminated surface, mainly the peak at higher binding energy is affected, and the gap size is unchanged. Overall, the contribution of Ba states is small. Note the usual underestimation of the band gap in the DFT calculations [35].
We also investigated the surface-induced core level shifts for the BaO- and TiO2-terminated films. Generally, it can be observed that below the fourth layer of the film, the change of the O1s, Ti2p3/2, and Ba3d5/2 core levels is below 0.1 eV, i.e., bulk-like behavior has been reached. At the surface, the largest change is observed for the Ba3d line at the BaO-terminated surface with a shift of 1.3 eV to higher binding energies w.r.t. the bulk, while the corresponding O1s line is almost unchanged. In contrast, the Ti 2p line shifts by 0.5 eV to lower binding energy at the TiO2-terminated surface, and also the O 1s line in the surface layer has a shift of 0.9 eV in this direction. Comparing the experimental results, only component 2 of the Ba 3d5/2 core line could be purely surface related; for all other components, the surface-induced core level shifts are too small.

3.1.5. Conclusions from the In Situ Analysis of Thermal Reduction

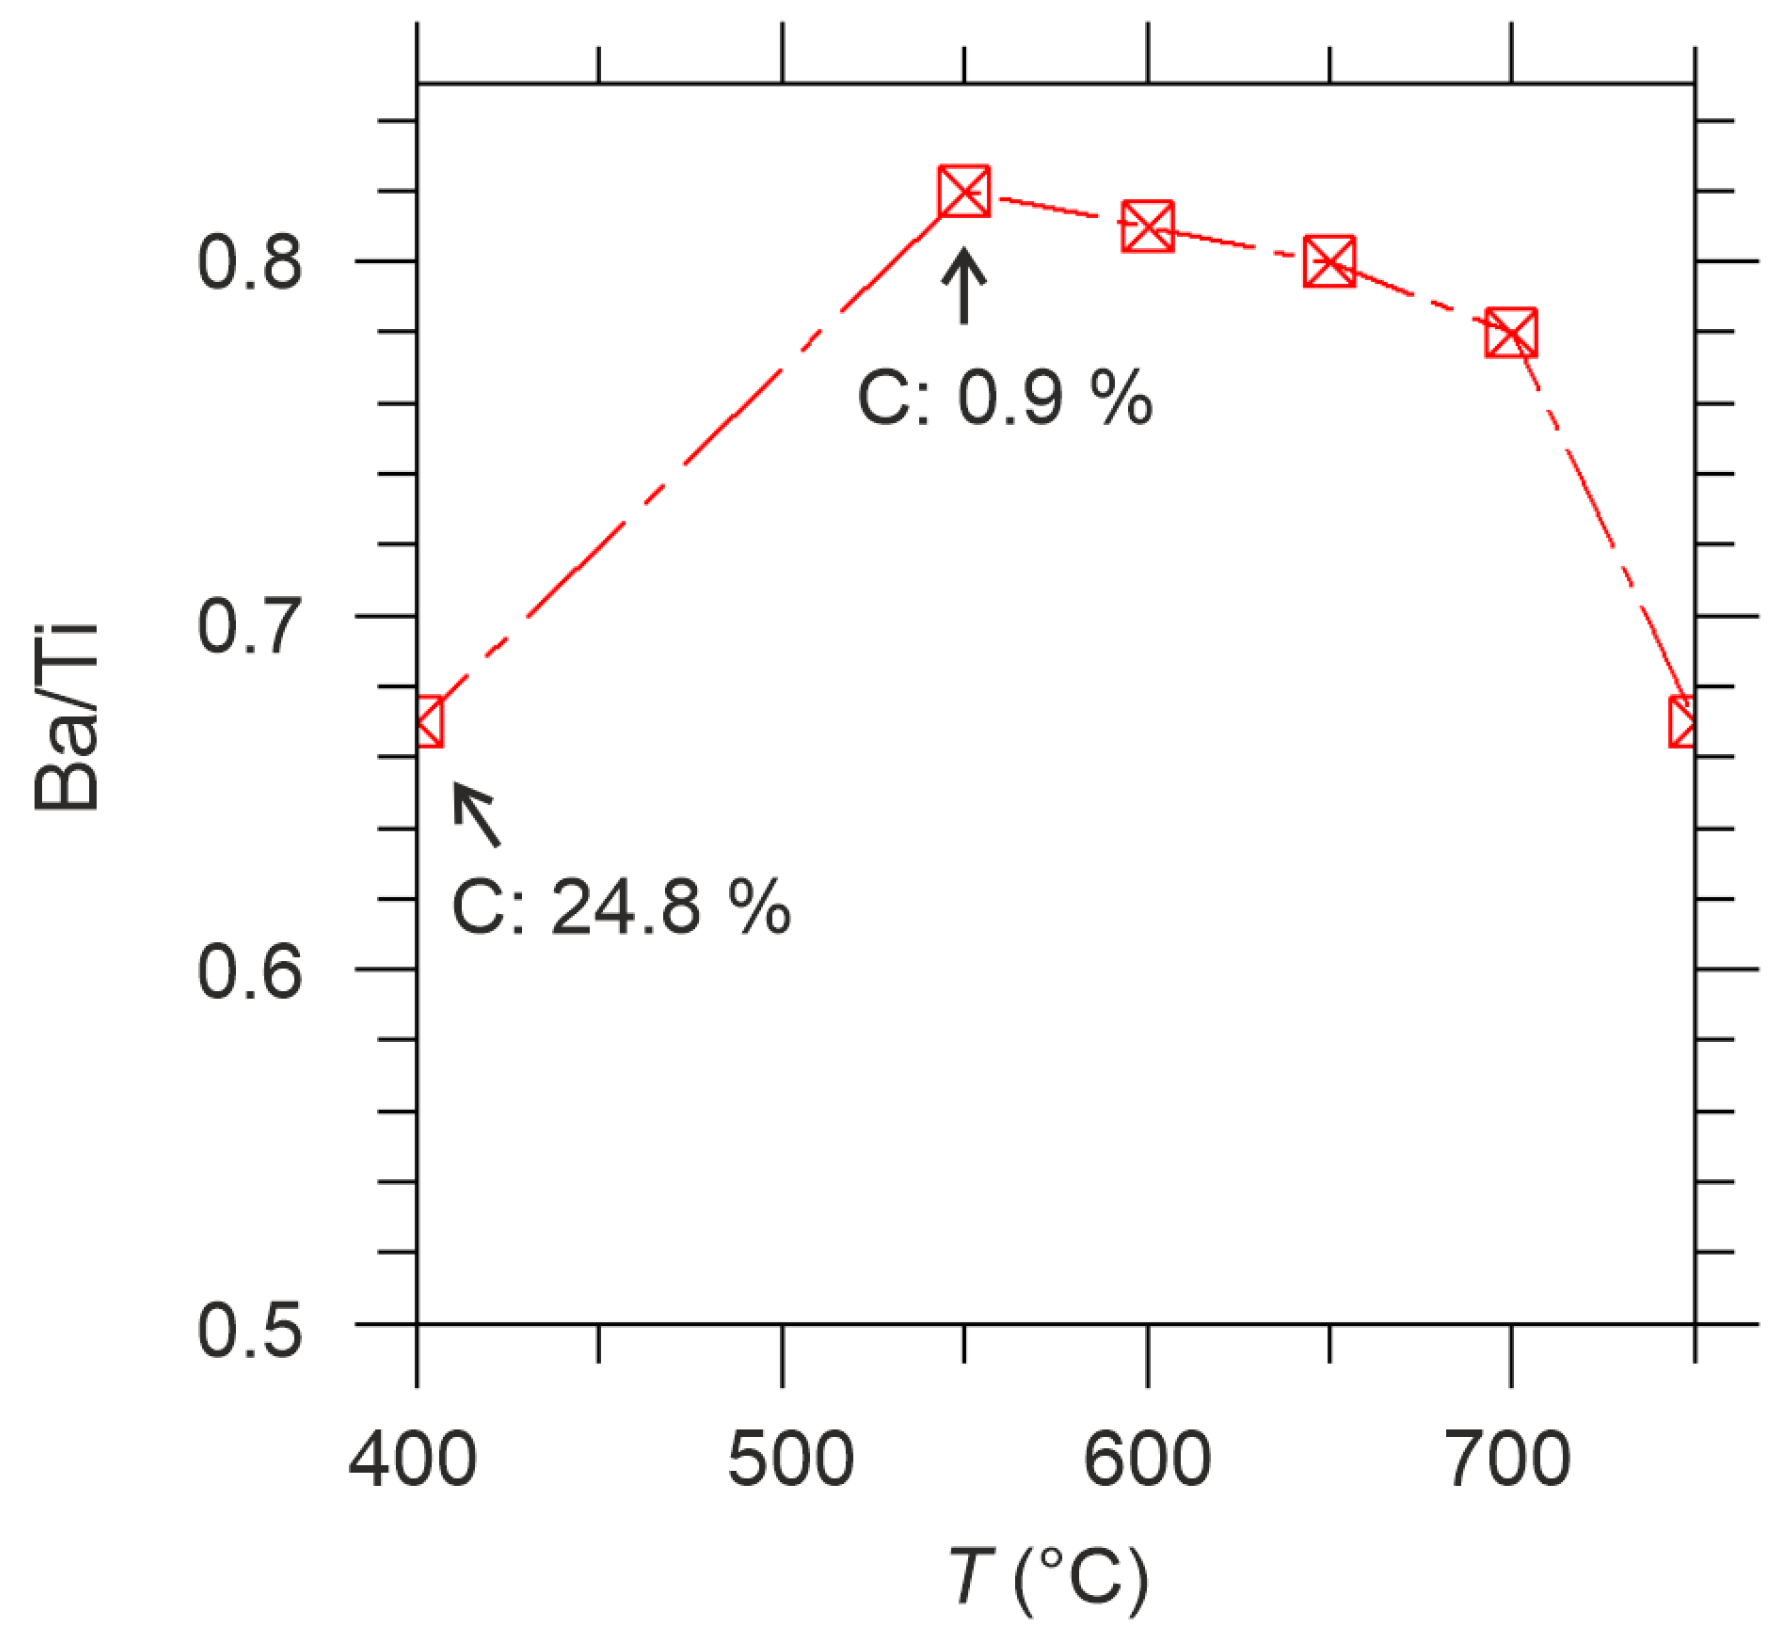
  • The unambiguous determination of the chemical composition of the surface layer of BaTiO3 single crystals (e.g., Ti/Ba ratio) up to 800 °C is difficult due to substantial surface contamination by physically and chemically adsorbed compounds, whose concentrations may vary during the reduction process. Therefore, it is necessary to monitor additional compounds of the O1s and C1s core line with higher binding energies as a function of annealing temperature and time;
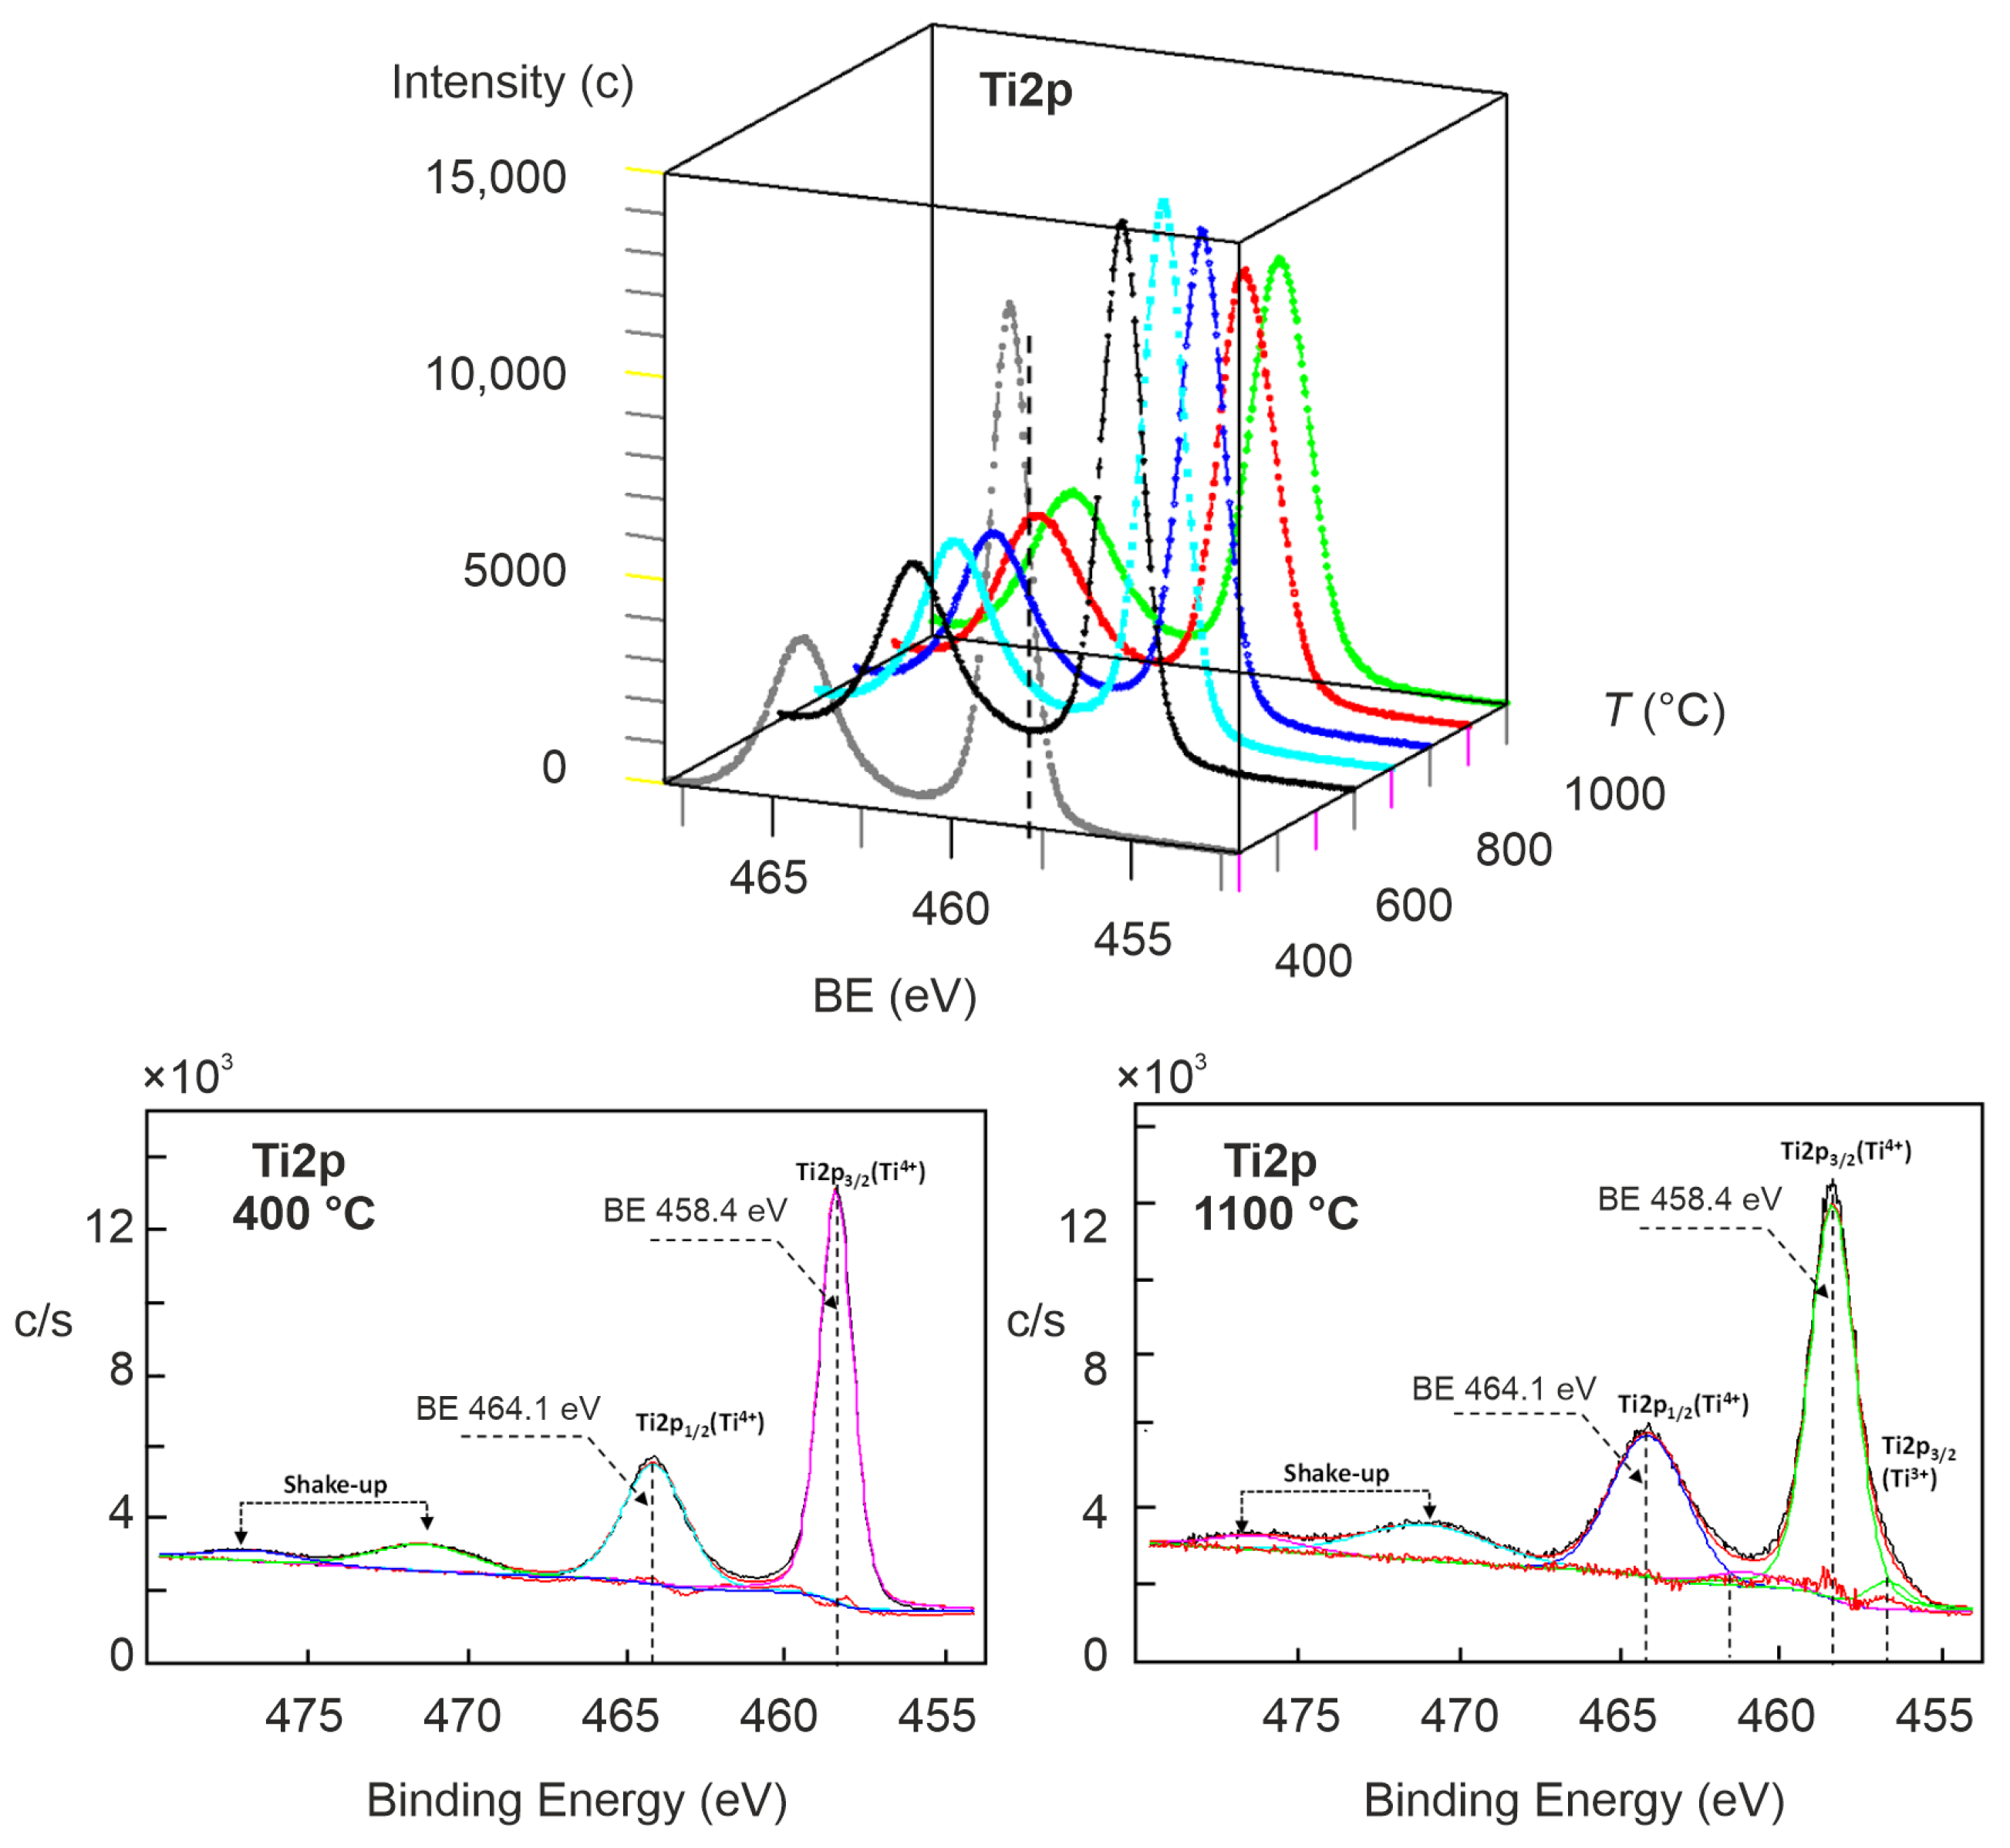
  • The analysis of the Ti2p core line shows that the valence of Ti (in ionic notation) at 900 °C is equal to 4+. Only at 1000 and 1100 °C do we observe a small contribution from the Ti ions with valence 3+ to the Ti2p lines. Despite this, we have no hints of an occupied state close to the Fermi level from the VB spectra;
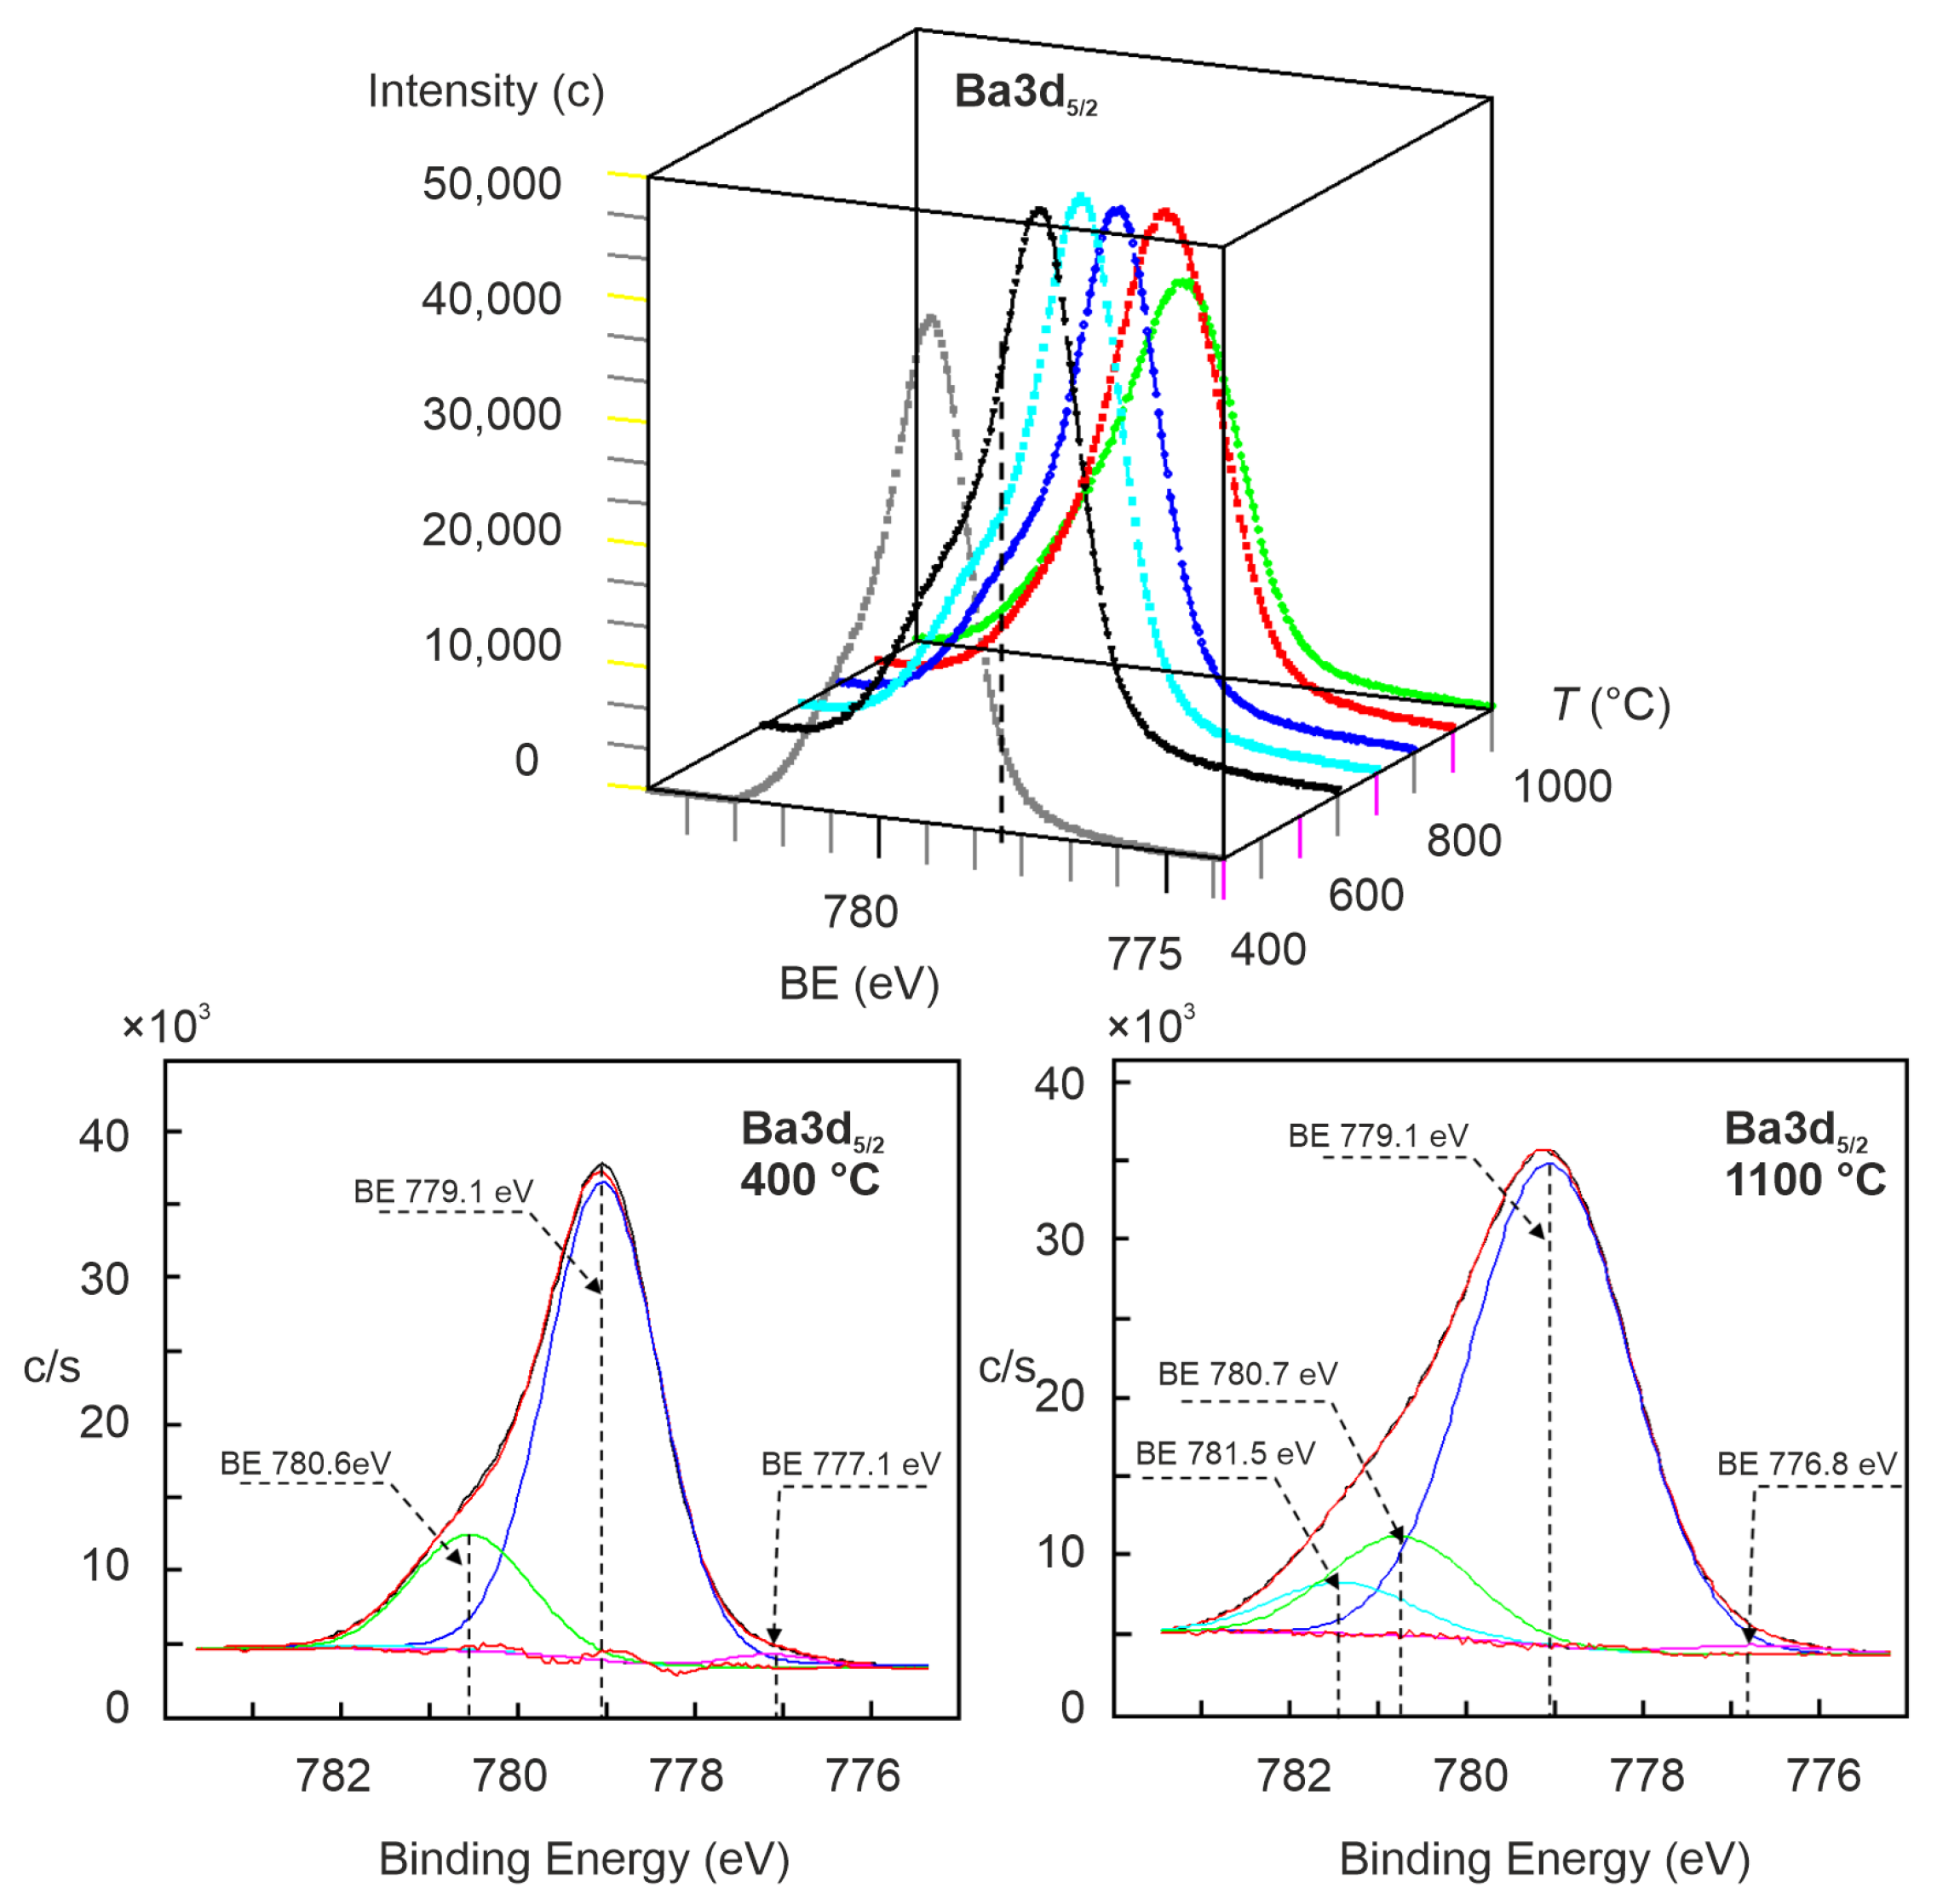
  • The highest variation of the chemical state in the surface layer during the reduction shows the Ba3d line, whose additional compounds (relative to the Ba in the matrix) could be connected with Ba bounded on the surface with BaO termination or represented by BaO-rich structures and metallic Ba (especially if the reduction temperature is higher than 800 °C);
  • Note: Although the maximum reduction temperature was extremely high (1100 °C), our in operando studies of the thermal reduction of the BaTiO3 crystal (100) are not as spectacular as the XPS studies presented in the literature on in situ-reduced crystal analyzed at RT after reduction, as it shows a much lower concentration of Ti with reduced valence. On the other hand, our XPS measurements are consistent with the data on the outflow of oxygen, as we cannot expect to observe a dramatic change in the oxygen stoichiometry in the surface layer when only a small quantity of atoms is removed from the crystal.

3.2. Quenching of Reduced Crystals: Freezing Defects in the Surface Layer by Means of Rapid Cooling

The slight change in the valences of Ti (see the analysis of the Ti2p core lines) compared to the dramatic changes reported in the literature for in situ-reduced crystals (after cooling to RT) led us to reflect on the role of the cooling process. In this part of the paper, we will analyze the impact of rapid cooling (so-called quenching) on the electronic structure of reduced BaTiO3. According to point defect chemistry, the rapid cooling of thermally reduced crystal should conserve (freeze) the defect concentration generated at high temperatures [36,37,38,39,40]. We obtained a systematic quenching of the reduced crystal from 800, 900, 1000, and 1100 °C to the same final temperature of 500 °C. This temperature was chosen as the limiting temperature at which the creation of oxygen vacancies in BaTiO3 becomes negligible.

3.2.1. XPS Investigation of Reduced BaTiO3 Quenched from 800 °C to 500 °C

The first cooling of the reduced BaTiO3 crystal from 800 to 500 °C (see Figure 12) did not reveal any significant changes in the shape of the core lines relative to the spectra recorded at 800 °C. The Ti2p core line can be fitted using one doublet, typical for Ti with 4+ valence, and the shape of the O1s line is very similar to the one measured at 800 °C. Only in the Ba3d line could an additional compound with a binding energy of 781.6 eV be found, which, in our opinion, could be associated with the double stacking of BaO on BaO as an effect of the BaO segregation during quenching. Although the reduced BaTiO3 crystal is metallically conductive at this temperature, the occupied states cannot be found in the spectra of the VB region of the quenched crystal. Due to the relatively minor modifications of the spectra determined at 800 °C to those at 500 °C, we adapted this set of core lines and VB spectra as a reference for the quenched crystals from a higher temperature to the same one (here, 500 °C).

3.2.2. XPS Investigation of Reduced BaTiO3 Quenched from 900 °C to 500 °C

Our choice of the set of spectra belonging to the sample quenched from 800 to 500 °C as a reference enables a simple comparison of the XPS data obtained after cooling from higher temperatures without a complicated and not always unambiguous fitting procedure (Figure 13). The difference between the Ti2p spectra for the sample quenched from 900 °C relative to our reference shows a dramatic increase in the compounds with lower binding energies typical for Ti with a valence of 3+. The origin of the existence of this valence is not the thermal reduction but is induced as so-called self-reduction during cooling [41]. Because incorporation of oxygen from the UHV ambient is not possible due to the sample being under UHV conditions, the equilibrium concentration of defects during cooling cannot be reached. Hence, oxygen from the surface layer is transferred towards the interior of the sample and driven by the difference in the formation enthalpy of oxygen vacancies on the surface and bulk [41]. This process is limited to the surface layer and results in a redistribution of oxygen from lower bounded surface states into the deeper part of the surface region to minimize the total energy in the system [42,43,44]. The analysis of the differences in the Ba3d5/2 lines reveals that the freezing of defects leads to an additional segregation process, namely that of the BaO compounds. In contrast, in comparing O1 spectra, no changes could be detected. Despite the increased concentration of Ti states with reduced valences in VB regions, no occupied state was identified in the band gap (with the sensitivity of our XPS).

3.2.3. XPS Investigation of Reduced BaTiO3 Quenched from 1000 °C to 500 °C

When increasing the reduction temperature to 1000 °C, the modifications in the XPS spectra for the quenched crystal became more significant and visible. The most crucial difference compared to the previous cooling experiment (900–500 °C) could be seen in the Ti2p core lines; namely, we found that part of the Ti has a valence of 2+. This indicates that the self-reduction process was more extensive during the quenching from 1000 °C than during that from 900 °C, in which only Ti with valence 3+ was formed. Although the Ba electronic states were not directly involved in the I/M transition, the Ba3d5/2 core line exhibits some changes. The difference analysis suggests that the concentration of the additional BaO compounds was reduced and that the amount of Ba in metallic form was smaller than for the crystal quenched from 900 °C. An additional change in the O1s core line can be proven; namely, its full-width half-maximum (FWHM) is larger, which can be observed directly in the difference spectra (Figure 14). This means that the disorder in the O1s sub-lattice is more considerable than that generated after quenching of the reduced sample from 800 and 900 °C, which indicates a more significant redistribution of oxygen vacancies in the upper part of the surface layer as an effect of self-reduction. In contrast to the previously discussed different XPS spectra, the freezing of defects from 1000 to 500 °C leads to a visible increase in a continuum of the occupied states in the band gap (see the insert of VB in Figure 14). Additionally, a shoulder on top of the VB region, which is dominated by the O2p states, reduced the width of the band gap.

3.2.4. XPS Investigation of Reduced BaTiO3 Quenched from 1100 °C to 500 °C

The quenching process of the reduced crystal from 1100 to 500 °C intensified the changes in the core line spectra (see Figure 15). In the Ti2p core lines, the contribution of Ti with valences 3+ and 2+ is increased. Although the Ba electronic states are not directly involved in the I/M transition, the Ba3d5/2 core line exhibits modifications. The difference analysis suggests that the concentration of the additional BaO compounds was reduced relative to the crystal quenched from 900 to 500 °C. The tendency in the widening of the O1s core line is retained; namely, the FWHM is broader, indicating a higher disorder in the oxygen sub-lattice. The analysis of the difference spectra of the VB regions confirmed the rise in the number of occupied states in the band gap, especially those close to the Fermi level (FL), with the same tendency observed for the additional compounds with lower binding energies in the Ti2p core line.

3.2.5. Change in the Ba/Ti Ratio during Quenching

During the quenching process, which induces a lowering of the Ti valences, the chemical composition of the surface also changed. This can be seen by analyzing the Ba/Ti ratio during reduction and subsequent quenching (Figure 16). Hence, not only self-reduction accompanied the rapid cooling, but a re-segregation of the Ba compounds took place. Despite the permanent lowering of the concentration of Ba in the surface layer with the increase in the reduction temperature (see the red line in Figure 16), we identified that the actual concentration of Ba after quenching is higher (see the dark line in Figure 16). This difference is especially evident for the higher reduction temperature (here, 1100 °C). This behavior suggests that the ratio of both types of cations (Ti and Ba) is a function of the temperature for constant oxygen activity; in other words, the stoichiometry of the surface layer follows the dynamic of the thermodynamic conditions and the diffusion of cations and anions occurred despite the short quenching time.

3.2.6. XPS Investigation of the De-Quenching by Repeated Reduction at 1100 °C

Our observation of a self-reduction process induced by quenching discussed above poses an important question: is the increase in the Ti state with valences 3+ and 2+ (generated by the freezing of defects) irreversible, or does it lead to modifications in the amount of Ti state with reduced valences by a “de-quenching” process. Therefore, we re-reduced a crystal at 1100 °C, which was previously quenched from 1100 to 500 °C. The comparison between the quenched and de-quenched crystal shows that the reduction stage in the crystal after the second reduction is related to a decrease in the concentration of the Ti state with low valences, which were generated after quenching. This conclusion can be derived from the analysis of the Ti2p and VB region spectra (see the differences between the Ti2p and VB spectra in Figure 15 and Figure 17). Therefore, the quenching and de-quenching “adjusted dynamically” the concentration and distribution of oxygen vacancies in the surface layer to the new thermodynamic conditions. We can suppose that at high temperatures, the difference in formation enthalpy of the oxygen vacancies on the surface and in the bulk is lower, and the self-reduction process is not as pronounced. Of course, the summed reduction time following the first annealing at 1100 °C and the additional reduction (of the quenched sample) was increased, which leads to a progression of the removal of oxygen (reduction of the area of the O1s line in Figure 17) and the segregation of BaO (reduction of the BaO compounds on the Ba3d core line in Figure 17). Hence, the equilibrium of the defect concentration during the reduction at constant thermodynamic conditions (here, UHV) of BaTiO3 cannot be reached. The final state of such a process is the formation of a “crust,” which consists of only lower Ti oxides. This phenomenon has also been observed by in operando XPS measurements of long-term reduced SrTiO3 crystals [45].

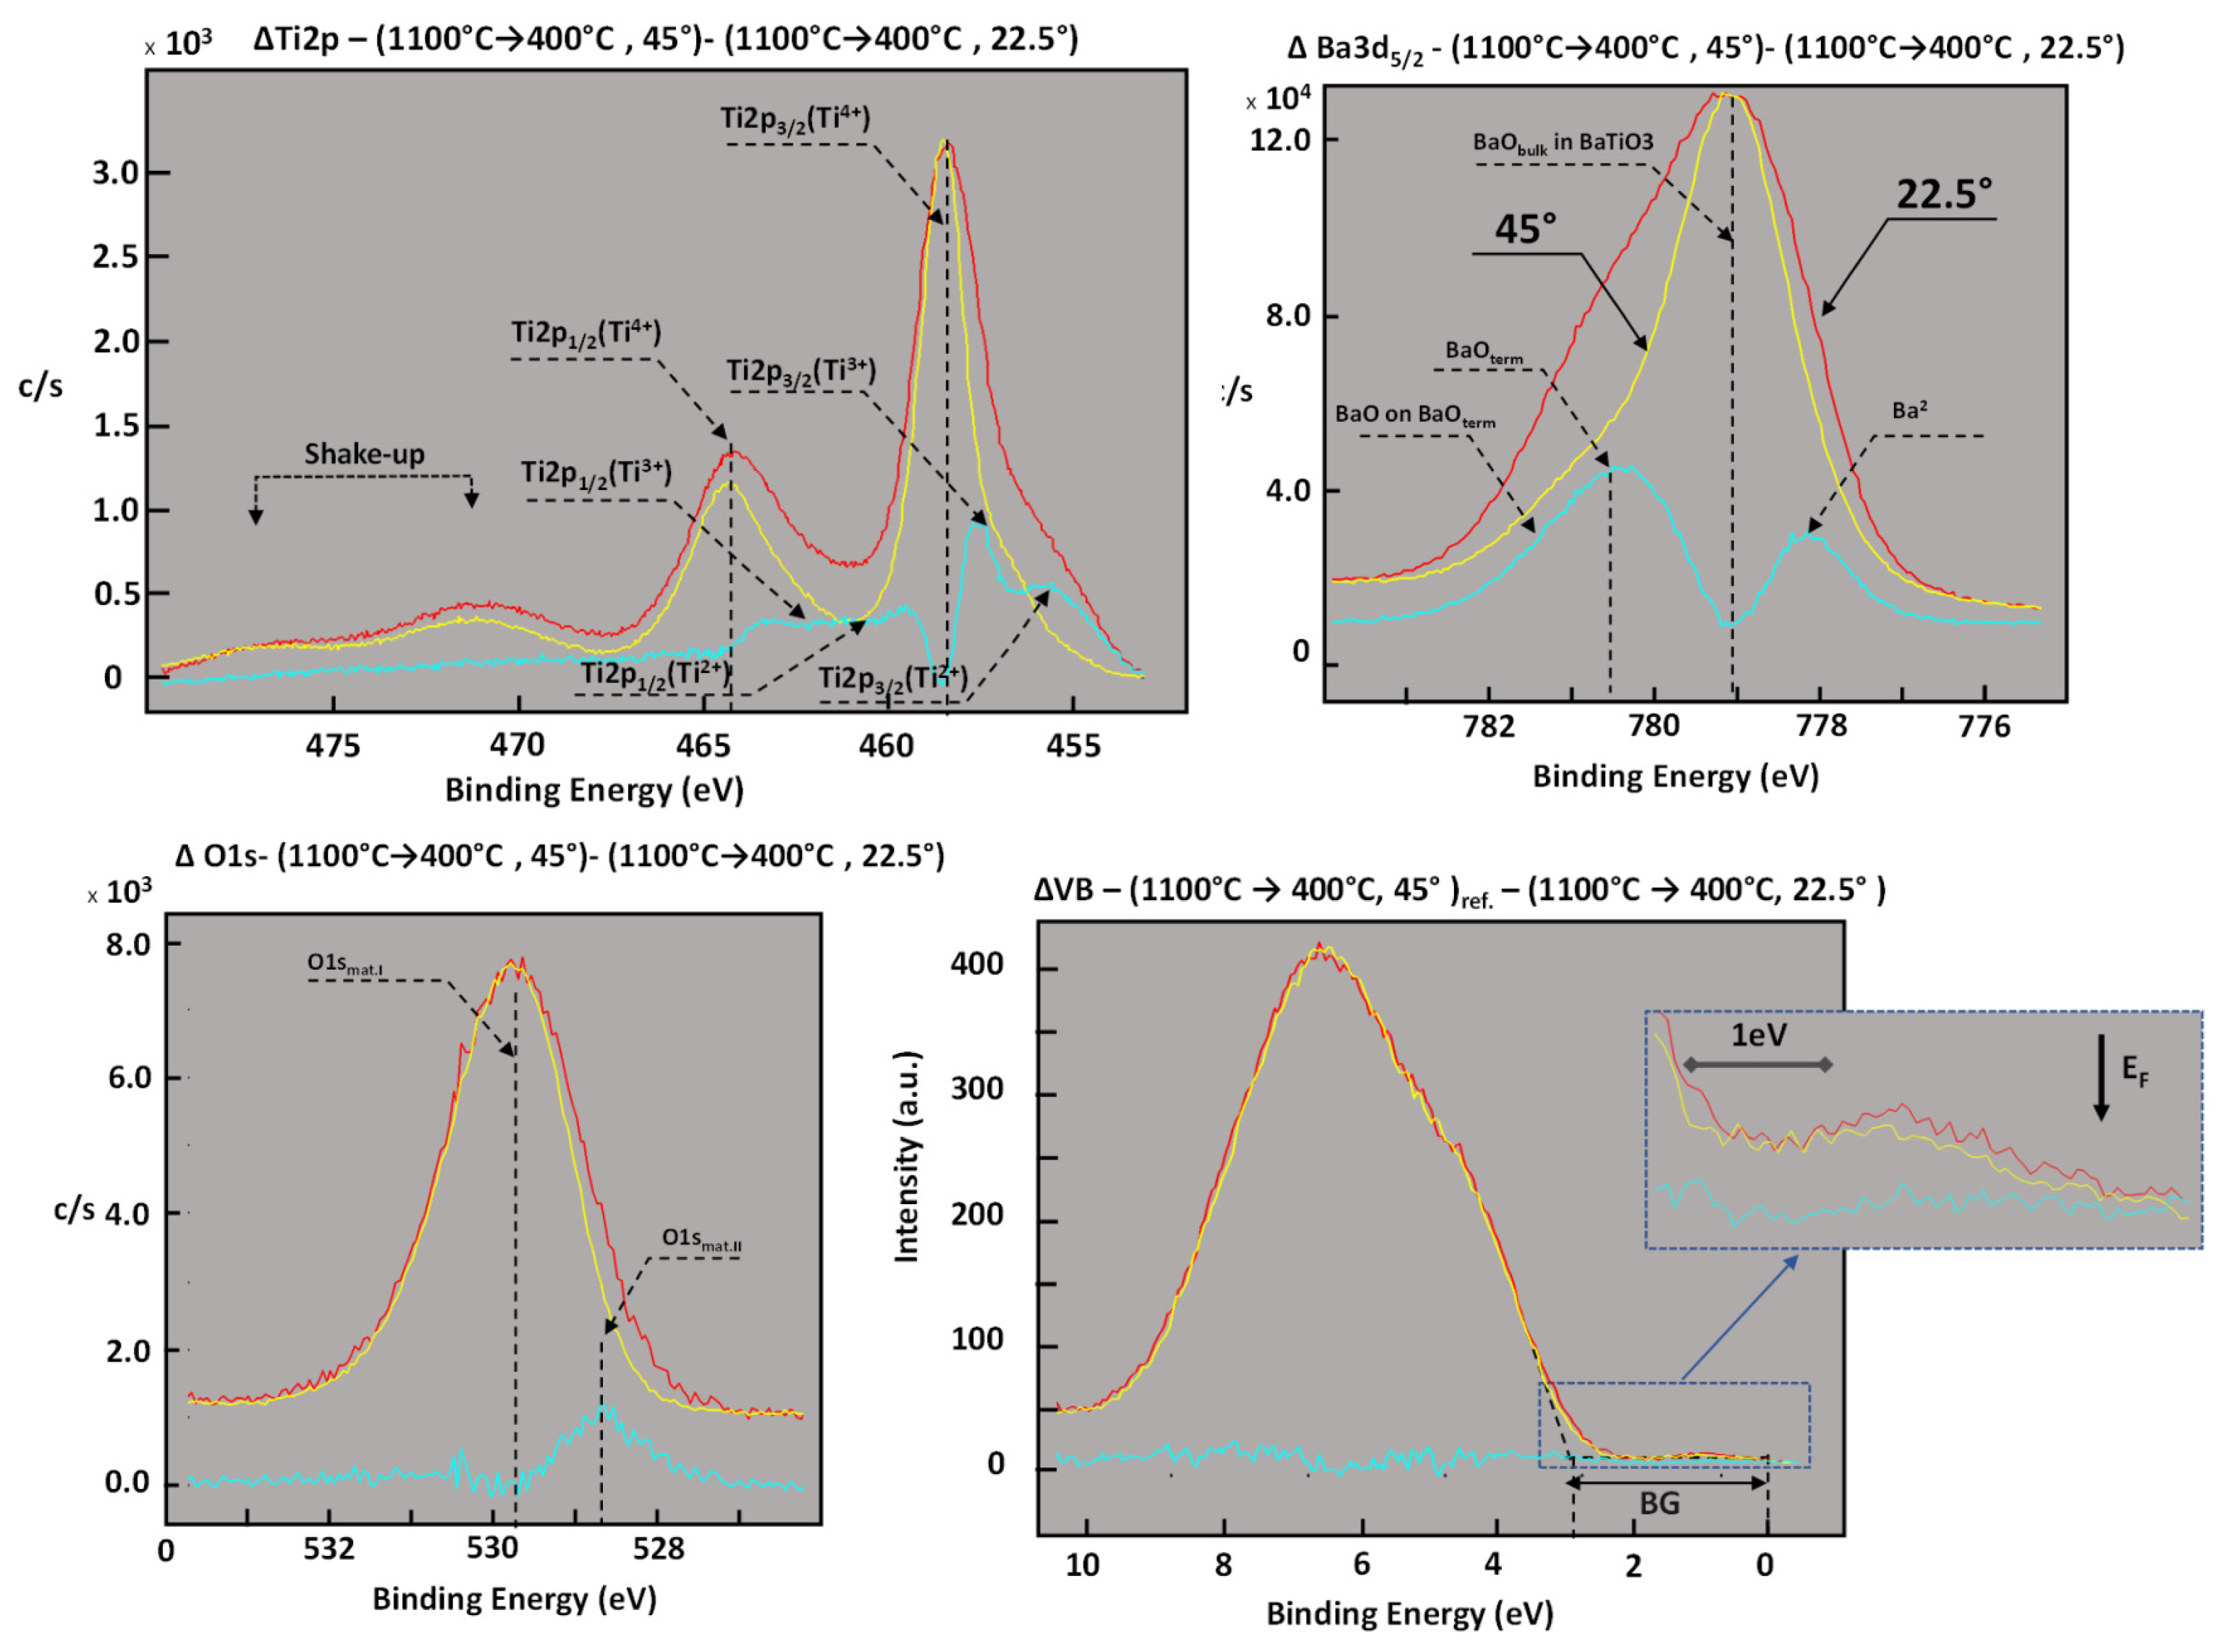
3.2.7. Angular Dependence of XPS Spectra of a Crystal Quenched from 1100 to 400 °C

Despite obtaining a lot of information from the XPS study of the dynamic of the quenching process, such as the change in the Ti valences and concentration of Ba, our analysis cannot yet answer whether the modifications are only limited to a thin surface layer or are extended to deeper regions. In other words, is the reduction or quenching of the surface layer homogenous or not? In order to tackle this question, we collected XPS spectra at two different angles (here, 45° and 22.5°) of a crystal, which was quenched to 400 °C after reduction at 1100 °C. The comparison of the spectra reveals that most of the changes concern the uppermost part of the surface layer (see Figure 18).
Our angular XPS analysis showed unusual changes in the top layer of the surface region. First, the Ba/Ti ratio was determined for the grazing angle (22.5°) 0.58, in comparison to a ratio of 0.78 for an angle of 45°. This indicates that the uppermost layers possess a much higher enrichment of Ti than the entire surface layer. Second, in this region, the concentration of the Ti with valences (3+ and 2+) is higher than in the deeper parts of the surface layer. Comparing the Ba3d spectra, we can conclude that there are more BaO and Ba compounds on the surface, which are not bound in the BaTiO3 matrix. Consequently, the FWHM of the O1s line is broader for the uppermost part of the surface layer, which can be connected to the increased disorder in this region (more different lower Ti oxides with higher concentrations of oxygen vacancies in the matrix). The most surprising finding for us was the observation of only minimal modifications of the VB region within the entire layer (determined for two different angles), despite the distinct changes in the Ti2p core lines for the different angles. This independence of the VB spectrum on the different angles can be understood if we assume that the number of d1 and d2 states out-of-plane (which contribute to the VB density of states) was the same (the analysis shows that this is not the case). This suggests that we have a dominant contribution of photoelectrons with a very short escape depth to the spectrum, which would mean that XPS spectroscopy of the VB is only sensitive in the 2–4 last monolayers.

3.3. Cooling of a Reduced BaTiO3 Crystal to the Ferroelectric Phase

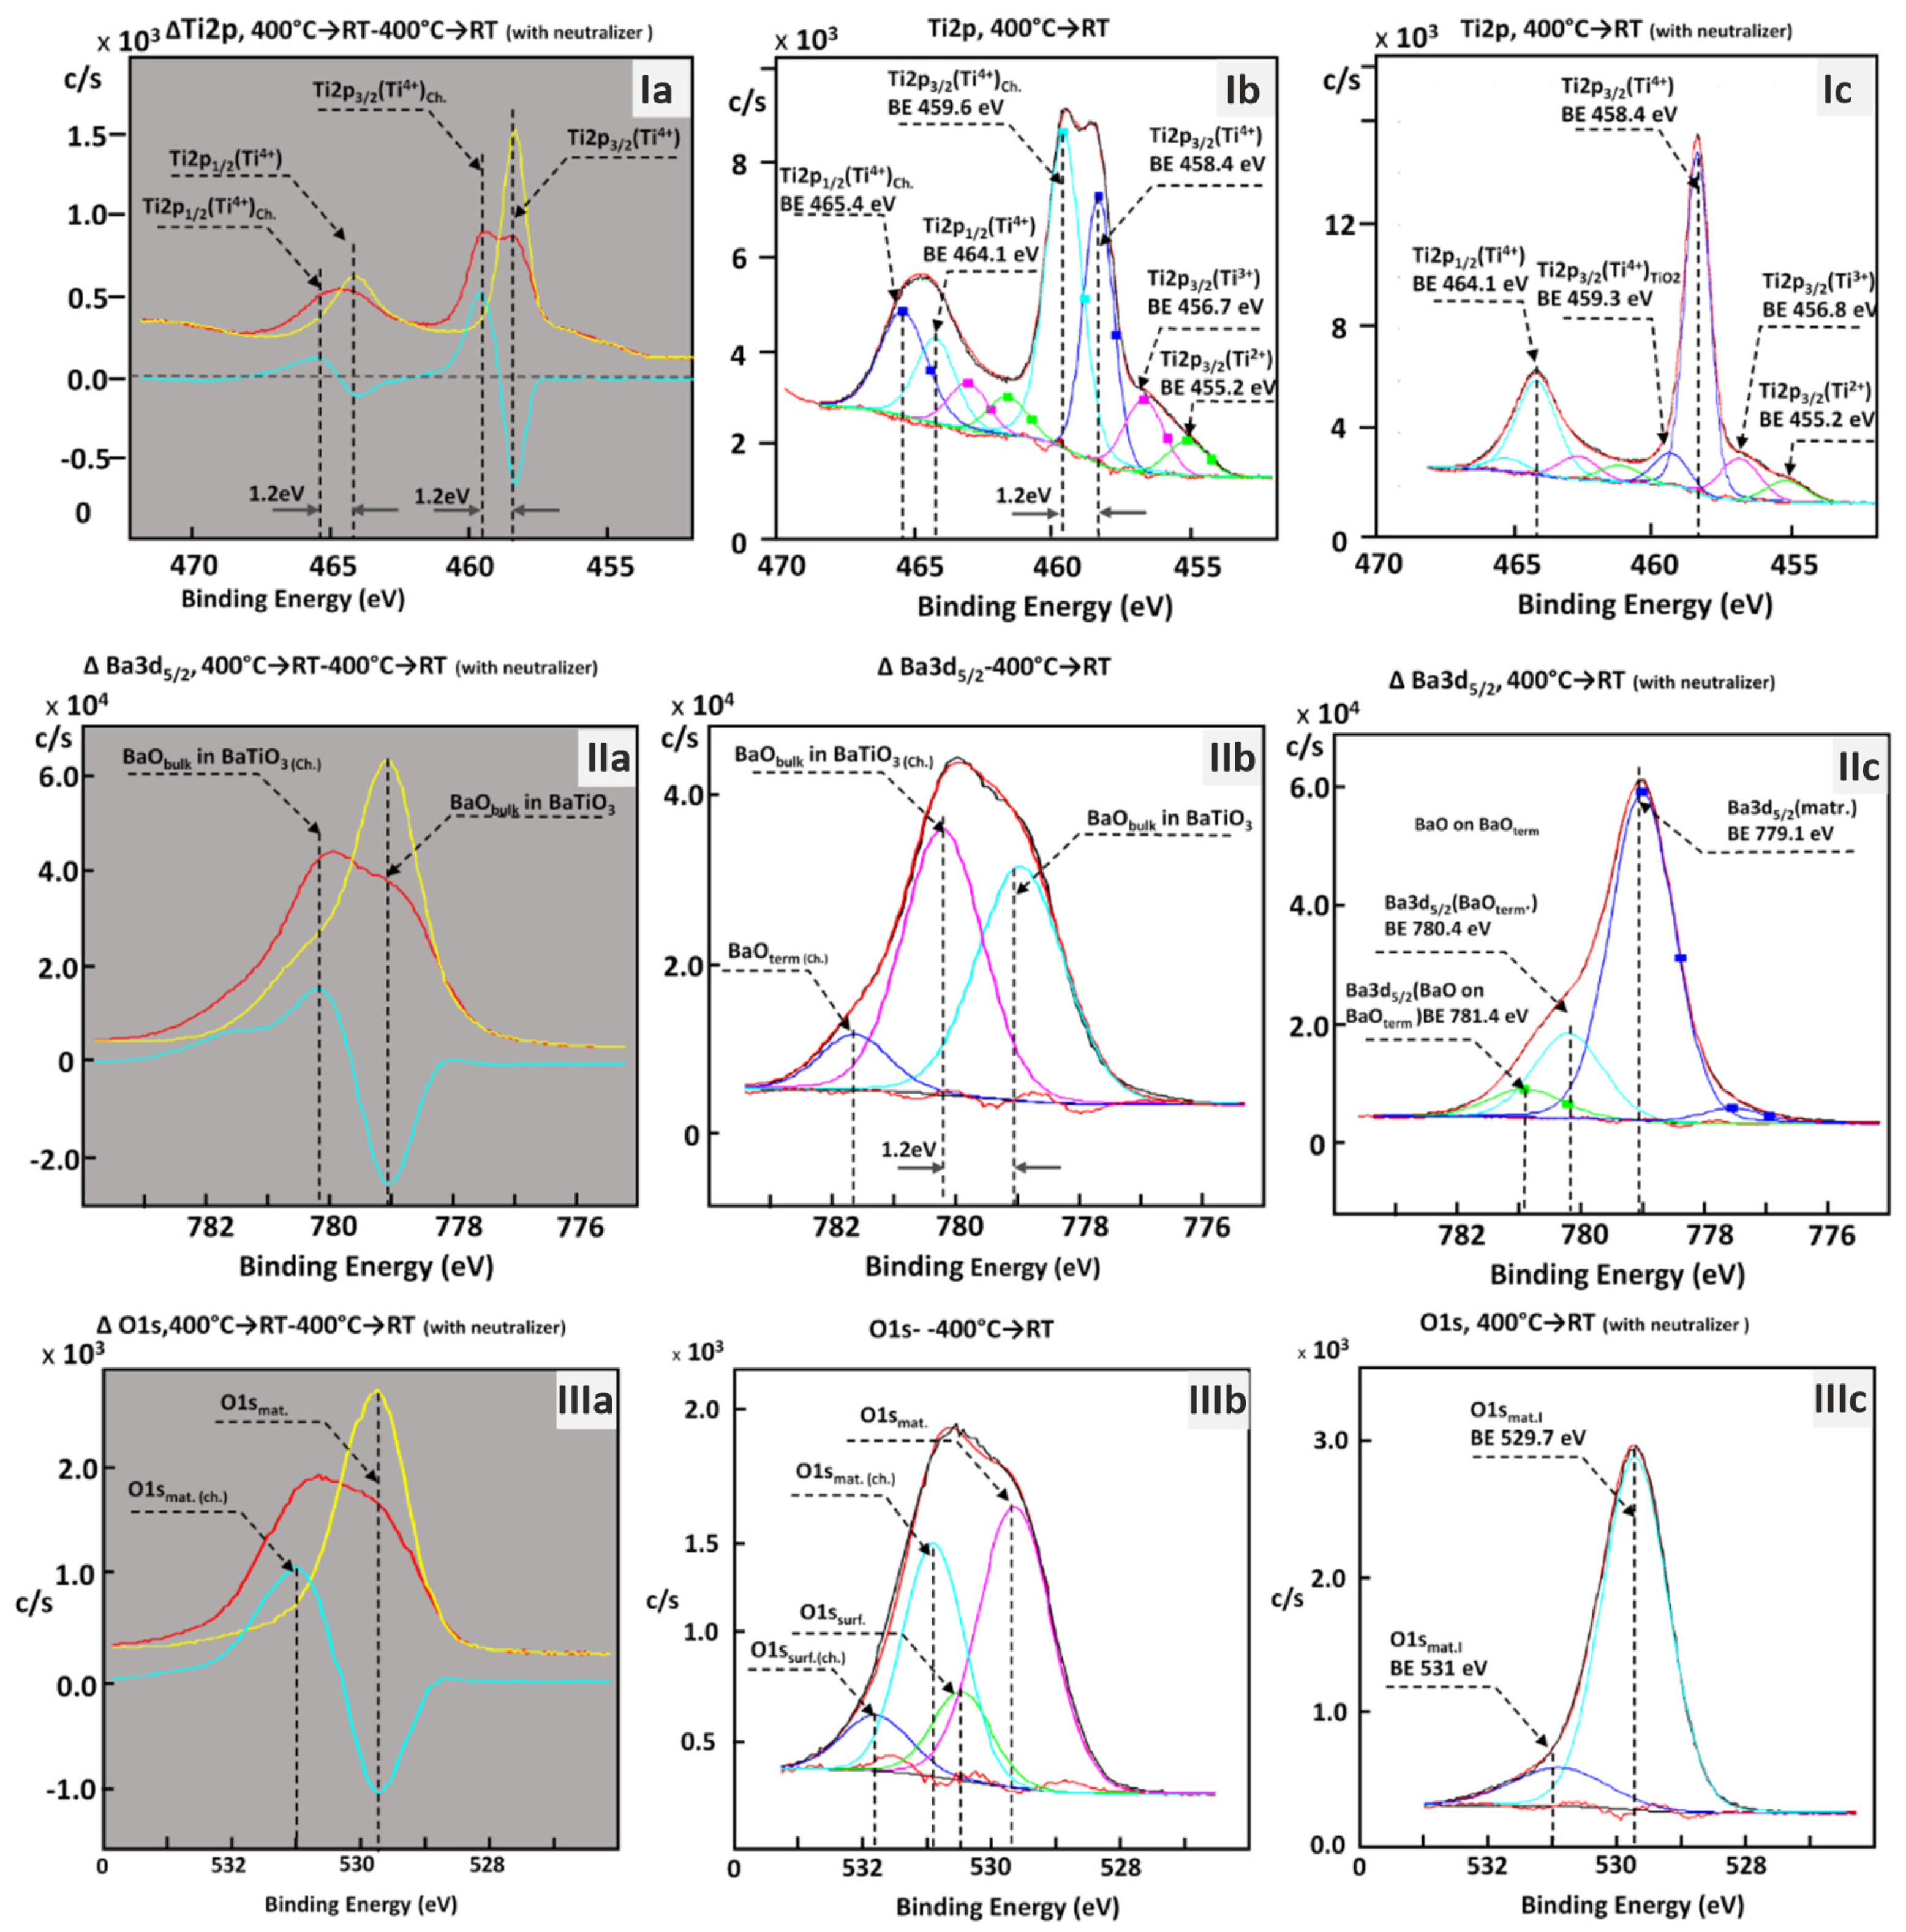
3.3.1. XPS Investigation of Reduced BaTiO3 Cooled from 400 °C to Room temperature

The stoichiometric analysis between the crystal quenched to 400 °C and then cooled to RT revealed that the Ba/Ti ratio is the same (0.78 at 400 °C and 0.77 at RT with an error of 1–2%). In contrast, the shape of the core lines significantly changed (Figure 19). This concerns all lines (Ti2p, Ba3d, and O1s) in which additional compounds at high binding energies could be found. The energetic shift of the new compounds was the same for all core lines (1.2 eV), which suggests that the new set of lines was shifted due to charging induced by photoemission. The energetic position of the “old” lines is the same as for XPS spectra measured at moderated and high temperatures. Such a feature observed in the XPS core line suggests that the ferroelectric phase can actively change the charge equilibrium on the surface layer of a sample irradiated by X-rays. Despite the charging, the occupied states in the band gap exist (VB not shown). This behavior allows the conclusion to be drawn that the transition into a ferroelectric state reduced the concentration of electrons coming from metallic d states of Ti; the portion of the free d electrons will be used to screen the polarization on the surface, and some metallic regions could switch into a semiconducting or insulated state.
Using the neutralizer, it was possible to compensate for the charging effect, and the core lines appeared in their usual shape, which means the lines had shifted to the correct energetic positions. In the XPS spectra, we observed the constriction of all core lines (their FWHM was reduced) relative to the width of the core lines in the paraelectric phase. In addition, we can assume that a new factor can contribute to the width of the core lines, namely the inhomogeneous charging (or, in other words, the modulation of the local surface potential), as an effect of the non-uniform distribution of defects [21,31,46], which is responsible for the change in the local electric conductivity. After switching on the flood gun, the ratio between both kinds of cations in the BaTiO3 matrix equals the Ba/Ti ratio determined for spectra obtained at 400 °C. Therefore, the total area of Ti2p and Ba3d in our XPS spectra (from the charged and compensated crystals) can be assumed to be the same, and hence the differences in the individual components of the lines can be determined.
The analysis of the composition (here, the Ba/Ti ratio) of the surface layer shows an increase in the concentration of Ba between 400 and 700 °C, followed by a successive decrease in the temperature region of 800–1100 °C (Figure 10). In order to analyze the results correctly, it must be kept in mind that the as-received surface is contaminated with one or many layers of chemical adsorbates due to its high affinity to CO and CO2. Therefore, in the photoemission, the intensity (yield) of the Ba3d line will be reduced, and we could falsely interpret this behavior as a reduction in stoichiometry. If the contamination is relatively low (after reduction at 700 °C), we are certain that the Ba/Ti represents the correct value and can be further analyzed.
During the progressive reduction (800–1100 °C), we observed a permanent increase in the Ti concentration; the Ba/Ti ratio changed from 0.85 at 800 °C to 0.67 at 1100 °C. This behavior resembles the Sr/Ti ratio change for SrTiO3 single crystals being reduced in the XPS spectrometer [31]. For SrTiO3, the enrichment of TiO oxides in the surface layer has even been confirmed by SIMS measurements and X-ray diffractometry.
The analysis of the spectra after compensation of the charging effect allows a “look behind the scenes” of the screening of the spontaneous polarization. We analyzed the amount of Ti3+/Ti2+ and found a value of 2.6 in the paraelectric phase and 1.5 in the ferroelectric one (see the Ti2p3/2 line in Figure 20). It can be assumed that a portion of the d1 states, whose amount has been reduced, is involved in the screening of polarization. This means that some of the d1 electrons of Ti do not belong to the free electron gas and cannot contribute to metallic conductivity. This could also explain the increase in sample resistance during the transition to the ferroelectric state (see the step-like increase in resistance at TC in Figure 3). An additional proof of the metallicity of the reduced BaTiO3 below TC is the existence of the occupied state close to the Fermi level (see Figure 21).
Despite the important conclusions derived from the analysis of the core lines and VB region of the surface layer of reduced BaTiO3 before and after the phase transition, we cannot propose a complete model of the charging effect yet because we need additional information about the distribution of metallic states in an out-of-plane direction. For the extension and finalization of such a model, it is necessary to “look inside the reduced crystal” to search for metallic states in the bulk. Even though the reduction time in the chamber of the XPS spectrometer was several hours, it cannot be assumed that this long annealing time was sufficient to reach the equilibrium state in the entire sample. Our angular-dependent XPS investigations revealed an inhomogeneous distribution of Ti with low valences perpendicular to the surface (see Figure 18), which raises doubts about the homogeneity of the I/M transition. Hence, we analyzed the electronic structure and stoichiometry of the deeper parts of the crystal by means of the mechanical removal of the surface layer via in situ scraping, analogously to our previous XPS study on reduced SrTiO3 crystals [45] (see the schematically depicted “canyon” in Figure 22a). Despite only a thin layer with a thickness of a few micrometers having been removed, the XPS spectra reveal that all indications of metallicity, such as the existence of Ti3+ and Ti2+ states and occupied states close to the Fermi level, were completely lost (Figure 22b,c). Note that the changes in the Ba3d levels were minimal and limited to the increase in the FWHM of Ba3d and O1s core lines (Figure 22b,c), which is probably connected to the increased roughness produced by the scraping. It should be underlined that after the removal of a thin layer from the surface region, the ratio between Ba/Ti was higher than 1 (here, 1.15). This indicates that during the reduction and quenching, not only the change in the valence but also the segregation of Ba is a crucial process [47,48,49,50,51]. The surplus of 15% of Ba relative to Ti after the scraping cannot be considered an error connected to the accuracy of the XPS spectrometer. Moreover, during the synthesis of the crystals or ceramics, a very high amount of stacking faults can be incorporated into the matrix (such as BaO on BaO [52,53,54,55,56]). Therefore, separation of the crystal along the BaO–BaO plane is more probable during scraping due to lower cohesion along such planar defects.

3.3.2. Model of the Quenching from the Paraelectric to Ferroelectric Phase

Our in operando XPS study of the surface layer of BaTiO3 crystals in different reduction stages allows us to present a simple model of the influence of the ferroelectric phase on the electronic structure and chemical state in-plane and out-of-plane (Figure 23). We should accept that the metallicity observed via the XPS investigations is mainly related to the doping of d1 and d2 electrons of Ti in the surface layer of stoichiometric BaTiO3 crystal, which possesses only d0 electrons. As a result, the surface layer in the paraelectric phase is in a metallic state, and the photoemission process (which induces a flow of photocurrent through the sample) does not change the surface potential due to a very low potential drop between the spectrometer and the positively charged surface. For the resistance of the sample of a few hundred Ohm (after reduction) and a photocurrent smaller than 1 nA, the shift of the spectra on the energy scale is in the microvolt range and hence significantly lower than the sensitivity of the spectrometer. Therefore, the XPS measurements of reduced crystals (above TC) can be obtained without using a flood gun. The situation changes in the ferroelectric phase if a portion of the d1 electrons are “immobilized” due to active participation in the screening of the polarization; this is an analog of the transition metal insulator for Ti2O3 or Ti4O7 if the creation of the bi-polarons eliminates the d electrons from the free electron gas [57,58]. Such a situation is schematically depicted in Figure 23 and Figure 24. A part of the area of the metallic surface (probably only with Ti3+ states) lost its good conductivity and switched into a highly ohmic state. Other regions were not affected by this process and retained their metallic properties. Because the highly ohmic areas were in contact (out-of-plane) with the stoichiometric BaTiO3 (see the conclusion from the XPS investigation on the scraped crystal), the charging effect on these regions was remarkable (about 1.2 V). The compensation of this charging effect (i.e., the minimizing of the potential shift) for those low conducting regions corresponds to forcing the current flow in the opposite direction to the photocurrent. Based on the measurement of the current flow (to the spectrometer), we calculated the resistance of the ferroelectric regions (Figure 24). The resistance in those areas is in the giga-Ohm range. Hence, this high ohmic resistance cannot hinder the creation in those regions of the ferroelectric state. Of course, we overcompensated the low ohmic areas due to the compensation of the charging effect on these dielectric regions, but for the current density generated by the flood gun, the local current flow through the metallic region to the ground of the spectrometer shifted the core lines to a minimal value.

3.4. Nanoscopic Analysis of the I/M Transition

3.4.1. LC–AFM Investigation of the Reduced BaTiO3 crystals

The disadvantage of using the preliminary models derived from the operando XPS study (schematically depicted in Figure 23 and Figure 24) for the description of the nature of the I/M transition induced by thermal reduction and quenching is caused by the lack of spectroscopic investigations of the distribution of Ti with different valences at the nanoscale. Hence, more information about the morphology of the regions with metallic and non-metallic states is needed. We encounter the same problem when analyzing the homogeneity of the current flow if we scrutinize the data obtained from the macroscopic electrical measurements. Because our spectrometer does not permit the inhomogeneity of the distribution of Ti with difference valences with a lateral resolution below a few micrometers to be studied, we used the LC–AFM method to investigate the uniformity of the in-plane electrical conductivity at the nanoscale [19,21,59]. The LC–AFM mapping of the electrical conductivity of reduced and quenched crystals (Figure 25) reveals the existence of discrete filaments (the smallest radius of the conducting filaments was 2 nm, similar to those observed on thermally reduced SrTiO3 [21,45]) and agglomerated filaments (islands), which can be considered responsible for channeling the current flow. The concentration of single filaments and their agglomeration increases with the increase in the reducing temperature (Figure 25b). The current–voltage curves measured on top of the conducting filaments (points 1 and 2 in Figure 25b) reveal an almost-ohmic behavior (Figure 25c), which can be expected for the contact between a Pt-coated cantilever and a metallic region on the sample.
In contrast, the rest of the reduced crystal (i.e., the area located between the conducting filaments) has a very high resistivity, and the current was below the noise level of the I/V converter. This enormous inhomogeneity in conductivity indicates that the concentration of oxygen removed by thermal reduction (cf. Figure 4) cannot be related to the entire crystal volume but only to a small region near the dislocations. Knowing the distribution in the 3D network of dislocations in SrTiO3, which can be considered similar to the epi-polished surface of BaTiO3, we determined that the local value of doping of the dislocation core in BaTiO3 is larger than 1021 cm−3. This concentration corresponds to the very high concentration of extrinsic donors (Nb in this case), which is necessary to bring an insulating BaTiO3 crystal to the metallic state [17]. In order to prove that the observed quasi-linear I/V curves are related to the metallic conductivity of the filaments and not to, e.g., a contact between a semiconductor and the metallic tip, which could also reveal a linear dependence for an appropriate elation between the work functions, we investigated the temperature dependence of the resistance. Therefore, we obtained a series of LC–AFM maps of the same region (with filaments) between RT and 250 °C. The measurements reveal an increase in the integrated resistance with increasing temperature, which indicates metallicity (Figure 26). Note that the contribution of the rest of the reduced sample (between the filaments) to the global current flow is insignificant, as these regions play the role of a “spectator” in the electric transport phenomena. This behavior is again very similar to that of reduced SrTiO3 crystals [19,45]. It can be further seen that the slope of the resistance–temperature curve changes at TC, illustrating the influence of the ferroelectricity (Figure 26).
The dimension of the regions with good conductivity increased upon thermal treatment above 1000 °C. Additionally, the formation of islands on the surface can be observed (see the topography maps in Figure 27). The coalescence of single filaments or groups thereof and the diffusion of Ba probably allows for the recrystallization of the surface layer in a similar way to what was found for the growth of the TiO nanowires of strongly reduced SrTiO3 [60,61]. This solid-state reaction can lead to the growth of crystallites with different conductivities (see Figure 28). In the AFM maps, two different crystallites can be identified, one with a rectangular shape (the contour was marked with the dashed line) and low conductivity and one with a triangular habitus and high conductivity. The LC–AFM mapping of the part of the triangular crystallite obtained with atomic resolution exhibits the perfect ordering of atoms on one of the facets of the crystallite. The distance between the atoms is 0.56 nm, which is similar to the atomic distances of the Magnéli phases. Furthermore, a vacancy can be observed in the last row of atoms (see the yellow arrow in Figure 28c).
Our previous operando X-ray diffraction study on thermally reduced BaTiO3 showed that for similar temperatures, a low Ti oxide (metallic oxide) and a Ruddlesden–Popper phase (insulator) can be created [48,50]. HRTEM investigations of barium titanate foils, obtained by Bursill et al. [51], have also proven that such a transition can be induced under vacuum conditions via electron irradiation at RT (see Figure 29). The same chemical and structural transformation schema of other model materials with perovskite structure, such as SrTiO3, has been presented in the literature (see, e.g., [45] and the references cited therein).
Moreover, our XPS spectra proved that a high concentration of titanium ions with reduced valence is present in the surface layer of reduced BaTiO3, which would be a prerequisite for creating the Magnéli phase. The easy transformation of BaTiO3 into new chemical compounds/phases is connected to a low stoichiometry range with respect to the surplus of Ti and BaO. Similar rules are valid for SrTiO3 [62].

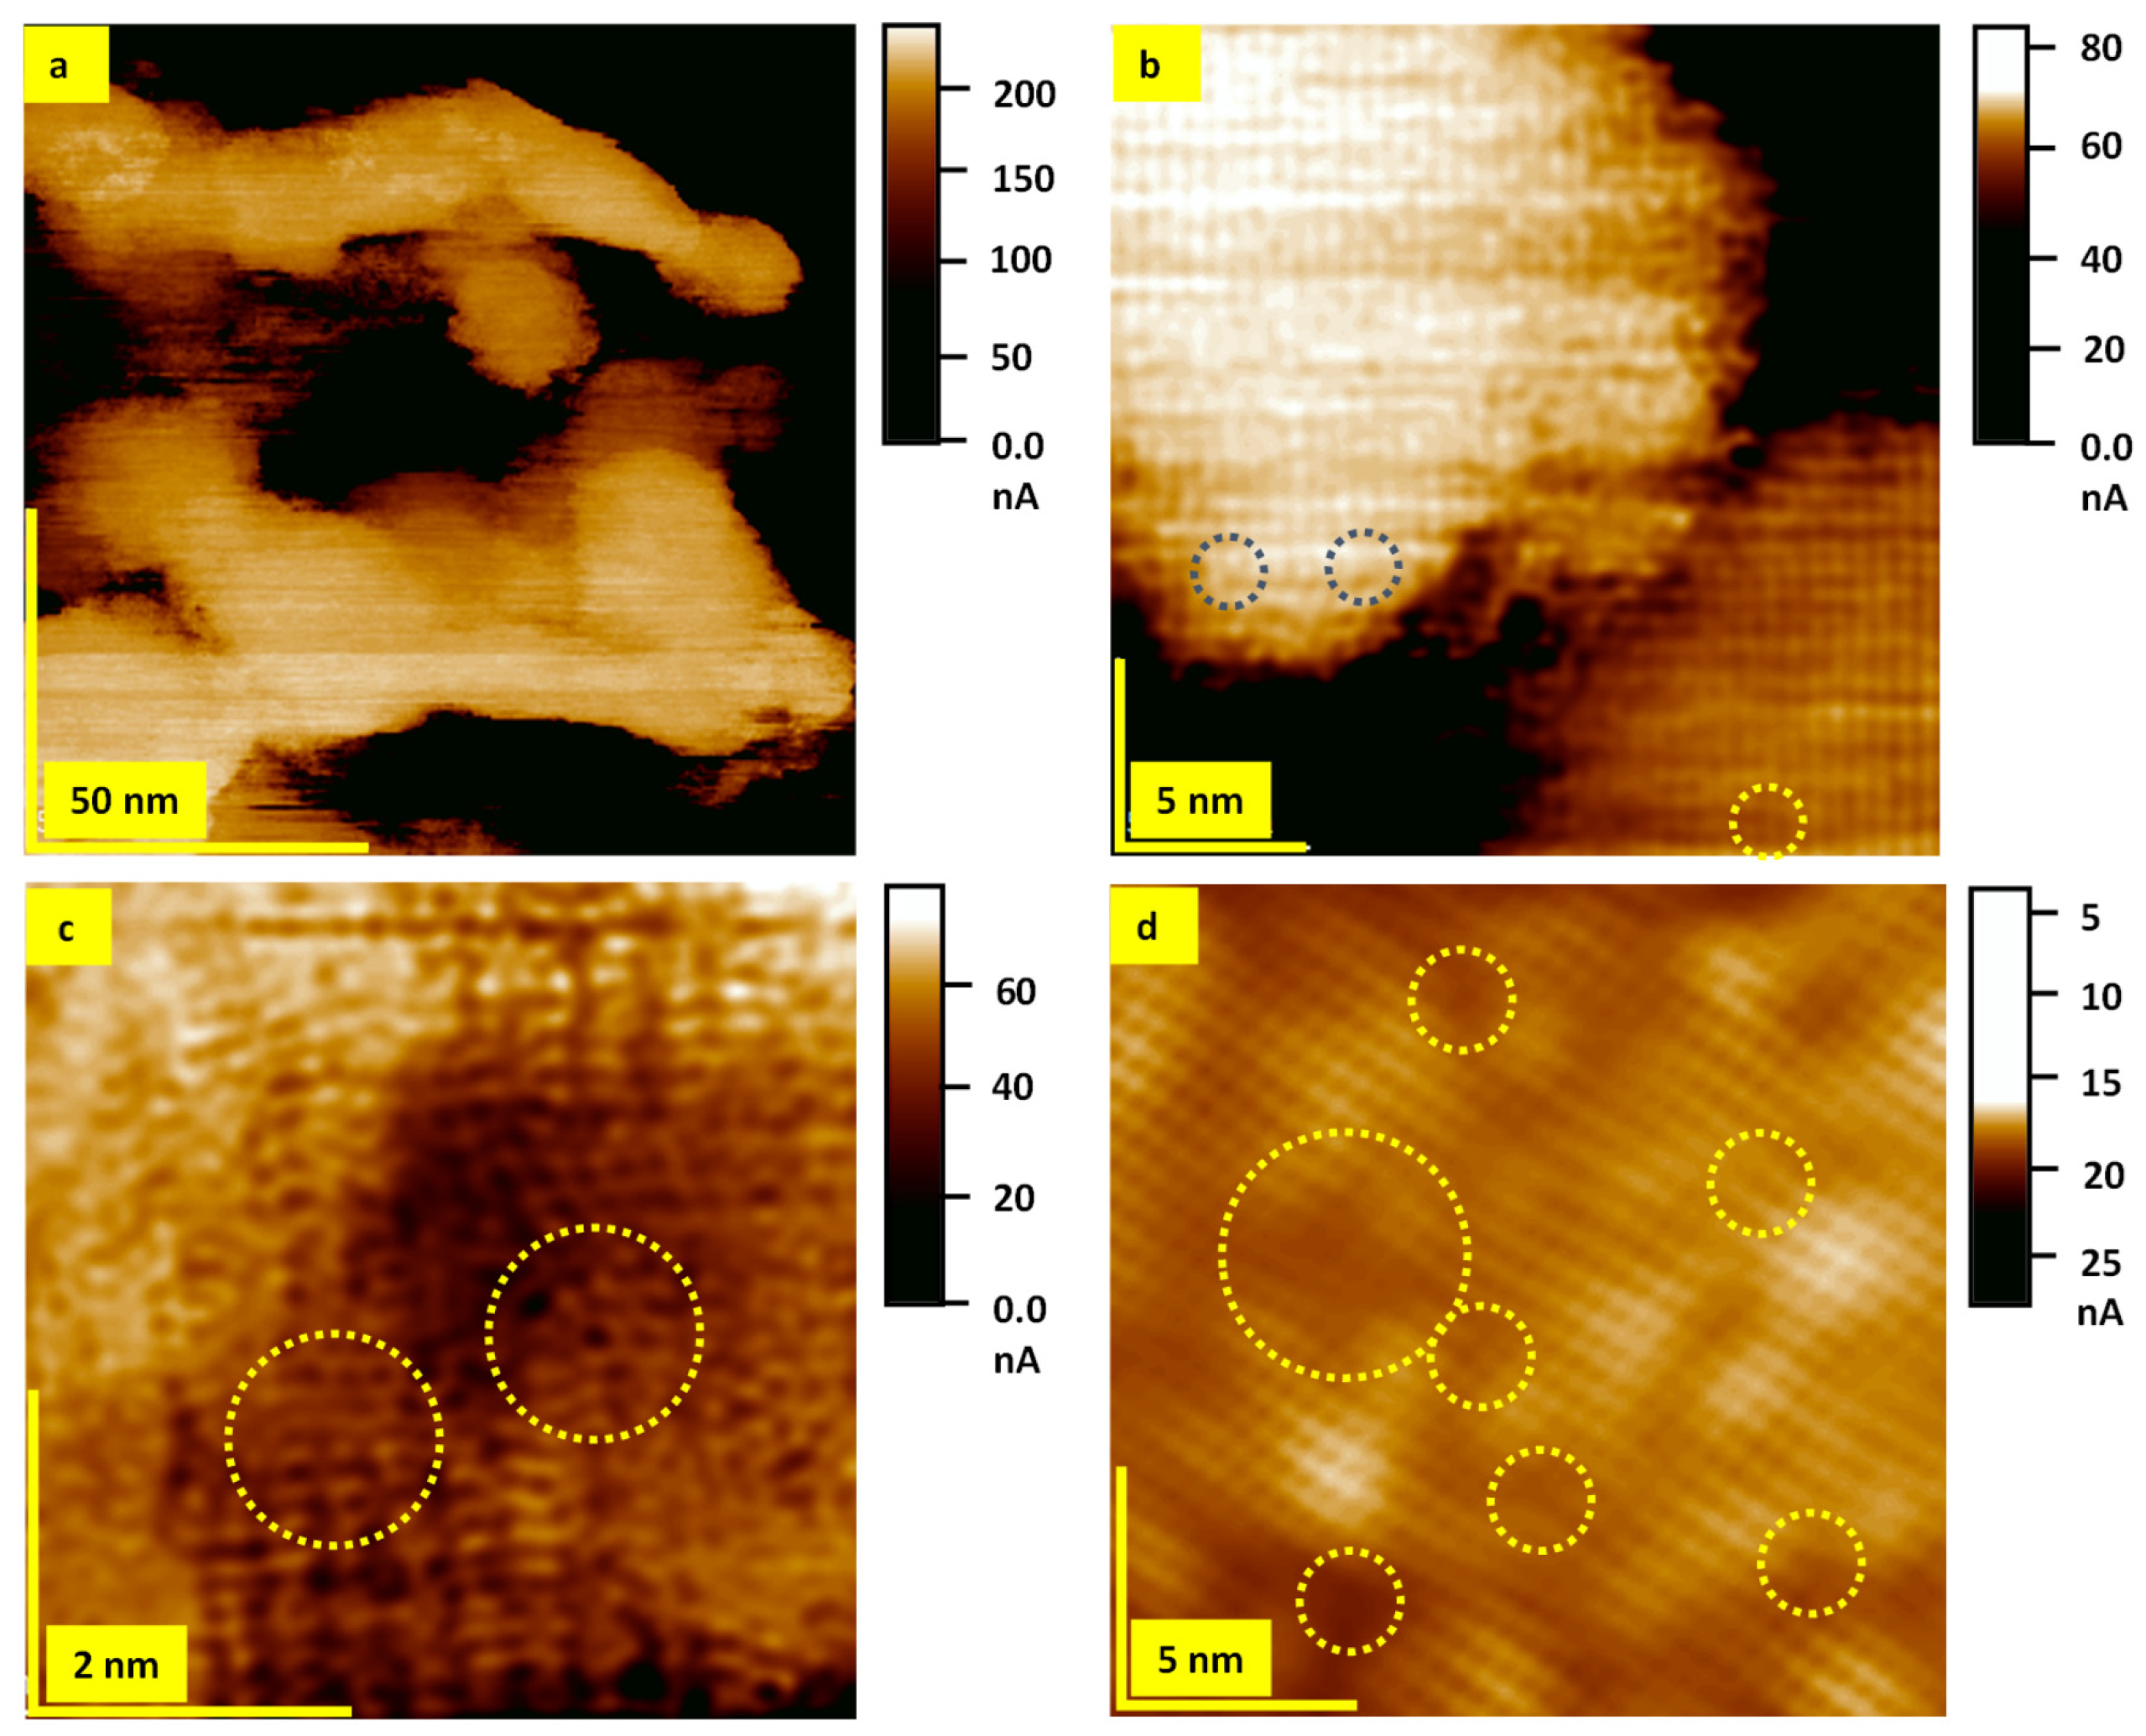
3.4.2. Investigation of Dislocations in the Surface Layer of BaTiO3 Crystals

If trying to find a “common denominator” for describing the I/M transition based on analyzing the macroscopic measurements of the electrical transport and the derivation from the surface-sensitive XPS method, the problem would arise of transferring the data obtained by the studies of the effusion process and the LC–AFM to this denominator. The critical point of our hypothetical search for this denominator is connected to understanding the nature of the transition into the metallic state of the surface region for the low concentration of defects introduced by reduction. The solution to this dilemma can be obtained using the same schema as for the SrTiO3 [19,21], namely, if we accept that in the epi-polished surface layer of BaTiO3, a very high dislocations density exists (about 109–1012/cm2). Using the etch pits technique, one can visualize the exit of the dislocation on the surface; for details of the preparation method, see [19,21]. After etching the thermally reduced BaTiO3 crystal with HF for several minutes, we analyzed the density and distribution of the etch pits, which mark the exits of the dislocations. It can be seen that the local density of dislocations can vary enormously (from 106–108/cm2; see Figure 30). This could relate to the interaction of dislocations with domain walls (Figure 30b) or be an effect of mechanical polishing. The dislocations tend to agglomerate in groups (see the islands in Figure 30a,c,d) or in linear arrangements along <100> or <110> directions (Figure 30b). Note that chemical etching on the SrTiO3 for many minutes can easily remove the dislocations with a very short length from the upper part of the network. Therefore, the density of the etch pits determined by optical analysis was found to be lower. In contrast, after a short contact of the crystal with the etchant and a subsequent topographical inspection with AFM, the density of the nano-etch pits identified on the AFM scan showed agreement with those determined from the TEM data [63,64,65]. It should be kept in mind that the dislocations in the ABO3 oxides with perovskite structure, as a linear defect, are not only responsible for a local crystallographic disorder or induced stress close to the core of dislocations, but the electronic structure of the core of dislocations themselves differs significantly from the ideal matrix of BaTiO3 [66]. Similar to the case of SrTiO3 [67], the dislocation cores have a high intrinsic concentration of defects, leading to a higher local conductivity than in the surrounding. These electrical properties of dislocations associated with the invariance of the Burgers vector of dislocations are responsible for the creation of a 3D network in the surface layer/region, which possesses a many-orders-of-magnitude-higher conductivity than the matrix in the dielectric BaTiO3, as confirmed by the LC–AFM investigations (Figure 31).
The other essential property of the dislocations in stoichiometric ABO3 perovskites is the easy enhancement of the local conductivity by preferentially removing oxygen from the core, which increases the already existing high concentration of oxygen defects along these line defects [21] and transforms the dislocations into metallic filaments (cf. Figure 25). The possibility of channeling the current between the LC–AFM tip (localized on the exit of the dislocations) and bottom electrode deposited on the opposite side of the sample suggested that the dislocations (as conducting filaments) are connected as a 3D network in the surface regions around the entire sample [19]. The concentration of the dislocations in bulk is relatively low, on the order of 104–105/cm2, which enables the bulk to be analyzed in terms of a semi-ideal band insulator. In contrast to Känzig’s conception of the skin in ferroelectric BaTiO3 [13], the skin discussed here has a higher conductivity than the bulk and possesses metallic properties.
Localized metallic properties related to a near-surface network of metallic filaments implicate, per se, a problem with understanding the nature of the transition into the ferroelectric state. If we suppose that the dislocations are uniformly distributed on the surface, the distance between neighboring dislocations could be on the order of 10 nm, considering a density of 1012/cm2. Such a dense network induces an inhibitory effect on the nucleation of a domain because a ferroelectric nucleus, which has a dimension of about 10 nm due to the super-paraelectric limit [68], cannot exist alone permanently. However, in mechanically polished BaTiO3 crystals, we can observe local clustering in the form of islands or linear/band agglomerations of dislocations (Figure 30). Such an inhomogeneity of the distribution of dislocations on the surface, which is automatically responsible for the “electrical uniformity,” may lead to an absence of dislocations in many large dielectric regions (with dimensions greater than 10 nm). In these areas, the nucleation of the domains could be possible, allowing for their permanent existence. It must also be taken into account that the dislocations can be rearranged through the interaction between the stress fields induced by the domain with the mechanically disturbed region close to the core of dislocations, which exists independent of the conductivity of the dislocations (see the ferroelectric and flexoelectric properties of the core of dislocations in paraelectric SrTiO3 [67]). The d electrons (localized along the dislocation core) can be involved in the electrostatic screening of the nascent domain. This screening, involving electrons from the dislocations’ metallic core, can reduce their electrical conductivity, and the dislocations can be switched to a semiconducting state [21,59]. For this non-metallic configuration, the shift in the position of dislocations due to electrostatic interaction with the charged domain walls cannot be excluded. It aligns with the tendency to minimize the electrostatic energy for such a ferroelectric system with dislocation walls [65].
Dislocations also play a decisive role in the formation of crystallites on the BaTiO3 surface in the course of long-term reduction (see Figure 28). In Figure 32, a further crystallite was investigated by means of LC–AFM. Close to the edge of the crystallite, it was possible to reach an atomic resolution of the electric conductivity. In the conductivity maps, an ordering of atoms typical for edge dislocations can be identified (marked with dashed circles). The dislocations’ exits reveal a higher electrical conductivity than the rest of the crystal (Figure 32d). In order to increase the contrast of the LC–AFM scans with atomic resolution, we applied moderate FFT filtering to this map.
The question regarding the coexistence of metallicity and ferroelectricity can be answered by investigating the piezoelectric response of reduced BaTiO3 crystals with metallic conductivity in the ferroelectric phase. Therefore, we compared the PFM scans with the mapping of the electrical conductivity (Figure 33). It can be seen that the metallic filaments coexist with the ferroelectric properties, represented here by piezoelectric activity, both out-of-plane (Figure 33c) and in-plane (Figure 33e). We observe a partial anticorrelation between regions with a high piezoelectric response and the position of filaments with good conductivity (Figure 33d–f). Note that it cannot be excluded that tiny metallic filaments also exist within the ferroelectric region, but the limited lateral resolution of the PFM (20–30 nm) does not allow for a more precise analysis of such a configuration. Our combined LC–AFM and PFM investigation provides a solution for the mystery of a “ferroelectric metal”. Either the surface is metallic, and ferroelectricity cannot arise, or the surface has dielectric properties and ferroelectric properties can be induced if the filament-free area is larger than the super-paraelectrical limit. The presented model can also be supported via simple optical inspection of metallically conducting BaTiO3 crystals using a polarization microscope in a “metallographic configuration” (Figure 34). We can identify the optically active region of the photography (here, the domains with polarization in-plane (Figure 34a) and the dark area without polarization or perpendicularly oriented polarization (Figure 34b)). The LC–AFM measurement (Figure 34c) reveals that the configuration of the dark parts is similar to the filaments’ distribution. Hence, we can assume that the absence of optical activity in this region relates to the metallic conductivity of the linear agglomerated filaments. In our view, the concept of a metallic ferroelectric is mistakenly interpreted without knowledge of the heterogeneity of the electrical conductivity of the thermal reduction of BaTiO3. If those conceptions were correct, then ferroelectric behavior should be observed in BaTiO3 with 20% doping of Nb (the critical doping level for transition into the metallic state with donators [17]). However, those ferroelectric properties of strongly doped BaTiO3 have not been presented in the literature thus far.

4. Summary and Conclusions

The combination of an in operando XPS analysis with the study of macroscopic and nanoscopic electrical conductivity and the determination of the amount of effused oxygen during thermal reduction allowed us to develop a model of the insulator–metal transition in the paraelectric and ferroelectric phases of thermally reduced BaTiO3 crystals:
  • During the thermal reduction process of BaTiO3 crystals, only an extremely low oxygen concentration on the order of 1015 atoms/cm3 was removed.
  • Despite this low level of oxygen vacancies incorporated into the crystal during the reduction, the electrical measurements of the resistance change as a function of the temperature exhibited metallic behavior;
  • The I/M transition at the nanoscale is only limited to the core of the dislocations. Hence, the doping level alongside such extended defects is 6–7 orders of magnitude higher than calculated when assuming a uniform distribution of oxygen vacancies. For such an enormous inhomogeneity, using “delta” parameters to describe the oxygen nonstoichiometry as BaTiO3−δ is not helpful;
  • The tendency of the agglomeration/accumulation of defects in the surface layer leads to a dramatic change in the electronic structure and local chemical composition of the surface layer;
  • The XPS investigation showed that the transformation into a metallic phase is connected with the reduction in the Ti valence from 4+ to 3+. This influence of the reduction process on the modification of core lines is clearly visible at extremely high reduction temperatures (1000–1100 °C). Despite the very high reduction temperatures, only a low level of the occupied state close to the Fermi level can be identified on the VB spectra. This observation aligns with the very low doping level determined by the effusion study;
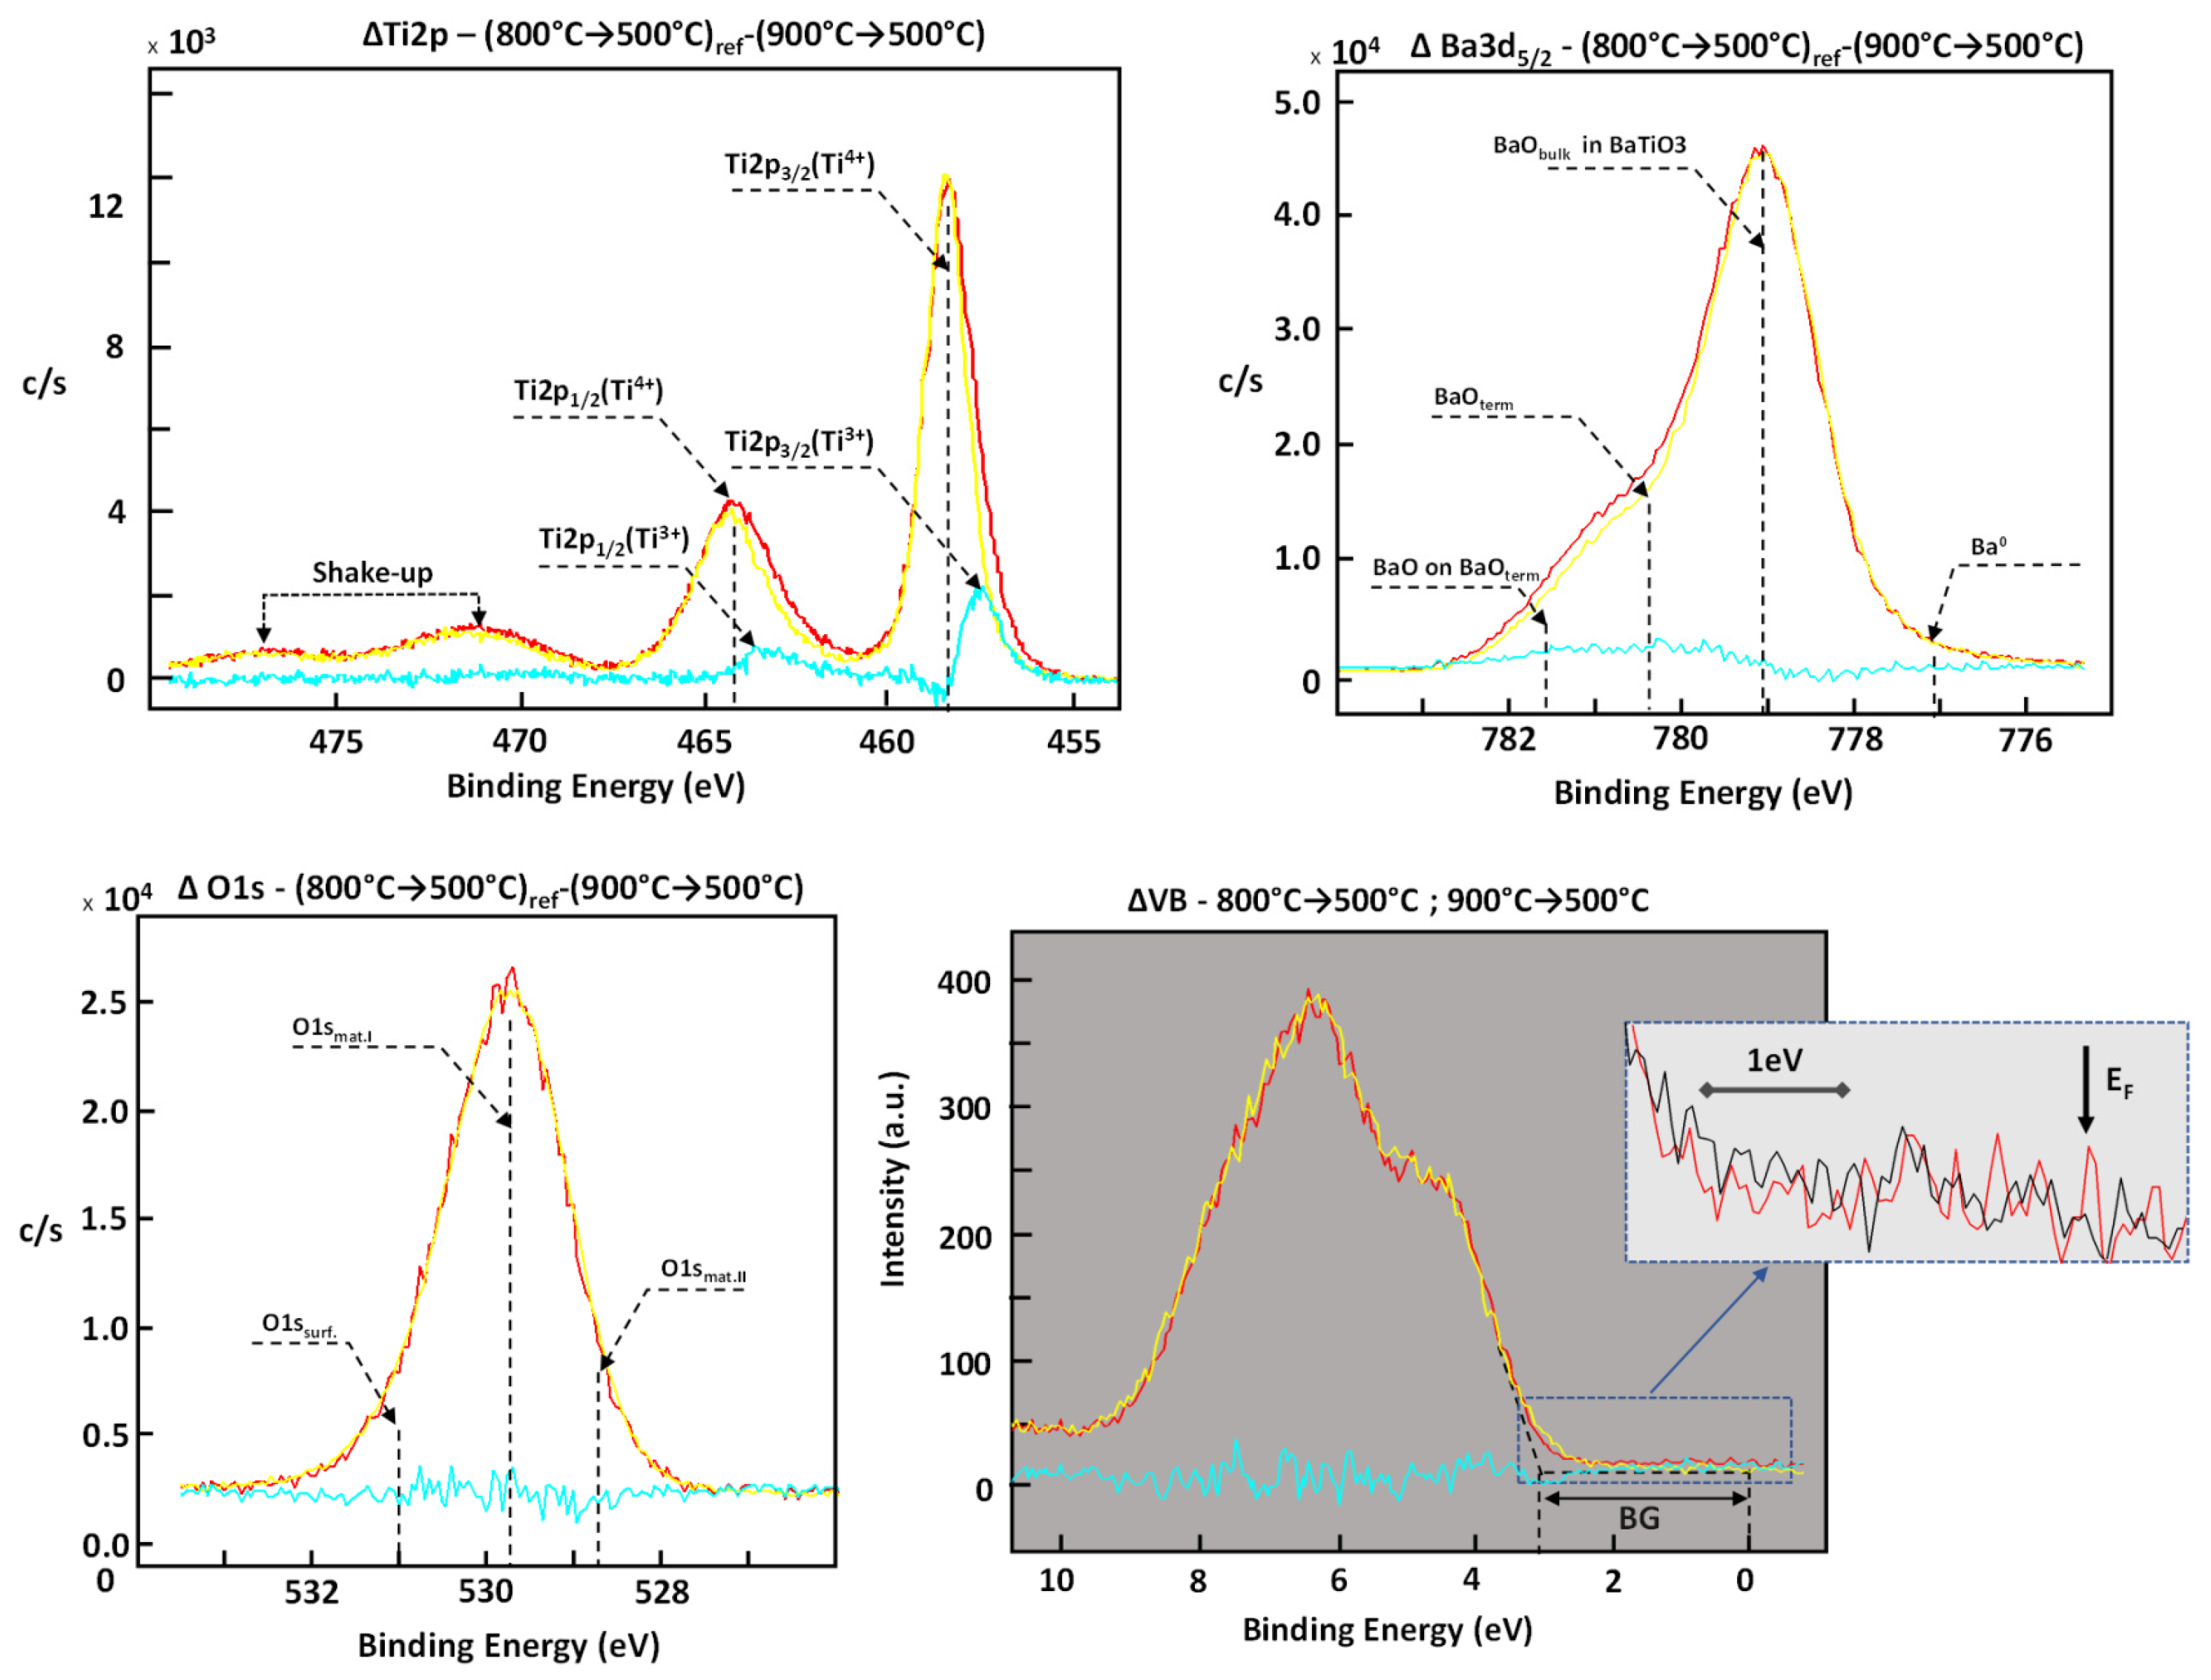
  • The in operando XPS analysis revealed that the transformation of the surface layer into the metallic state becomes enhanced if the reduced crystal is quenched from a high reduction temperature (900–1100 °C) to moderated temperatures (500–400 °C) in the paraelectric phase;
  • This self-reduction process is connected to the re-segregation of oxygen vacancies and leads to the enrichment of the upper part of the surface layer in Ti oxides with low valences (3+ and 2+). The XPS measurement for different angles supported this observation. The transformation of the surface layer during quenching is a complex process with “many facets,”, i.e., the amount of BaO in the upper part of the surface layer is significantly smaller than for the stoichiometric crystal, as BaO segregates into the deeper parts of the surface layer;
  • The topographical investigations show that thermal reduction is responsible for the growth of a new surface structure, in which dislocations with good conductivity can be identified with atomic resolution;
  • During the cooling of the reduced BaTiO3 crystal to RT, a step-like change in resistance occurs at the transition temperature between the paraelectric and ferroelectric phases. This contrasts with the continuous dependence of the resistance observed for thermally reduced SrTiO3 [21], although the crystal was reduced under similar conditions. The sudden increase in resistance at the transition temperature can also be deduced from the XPS analysis revealing a shift in the binding energy of the part of the core line as an effect of the additional charging of part of the surface layer in the ferroelectric phase;
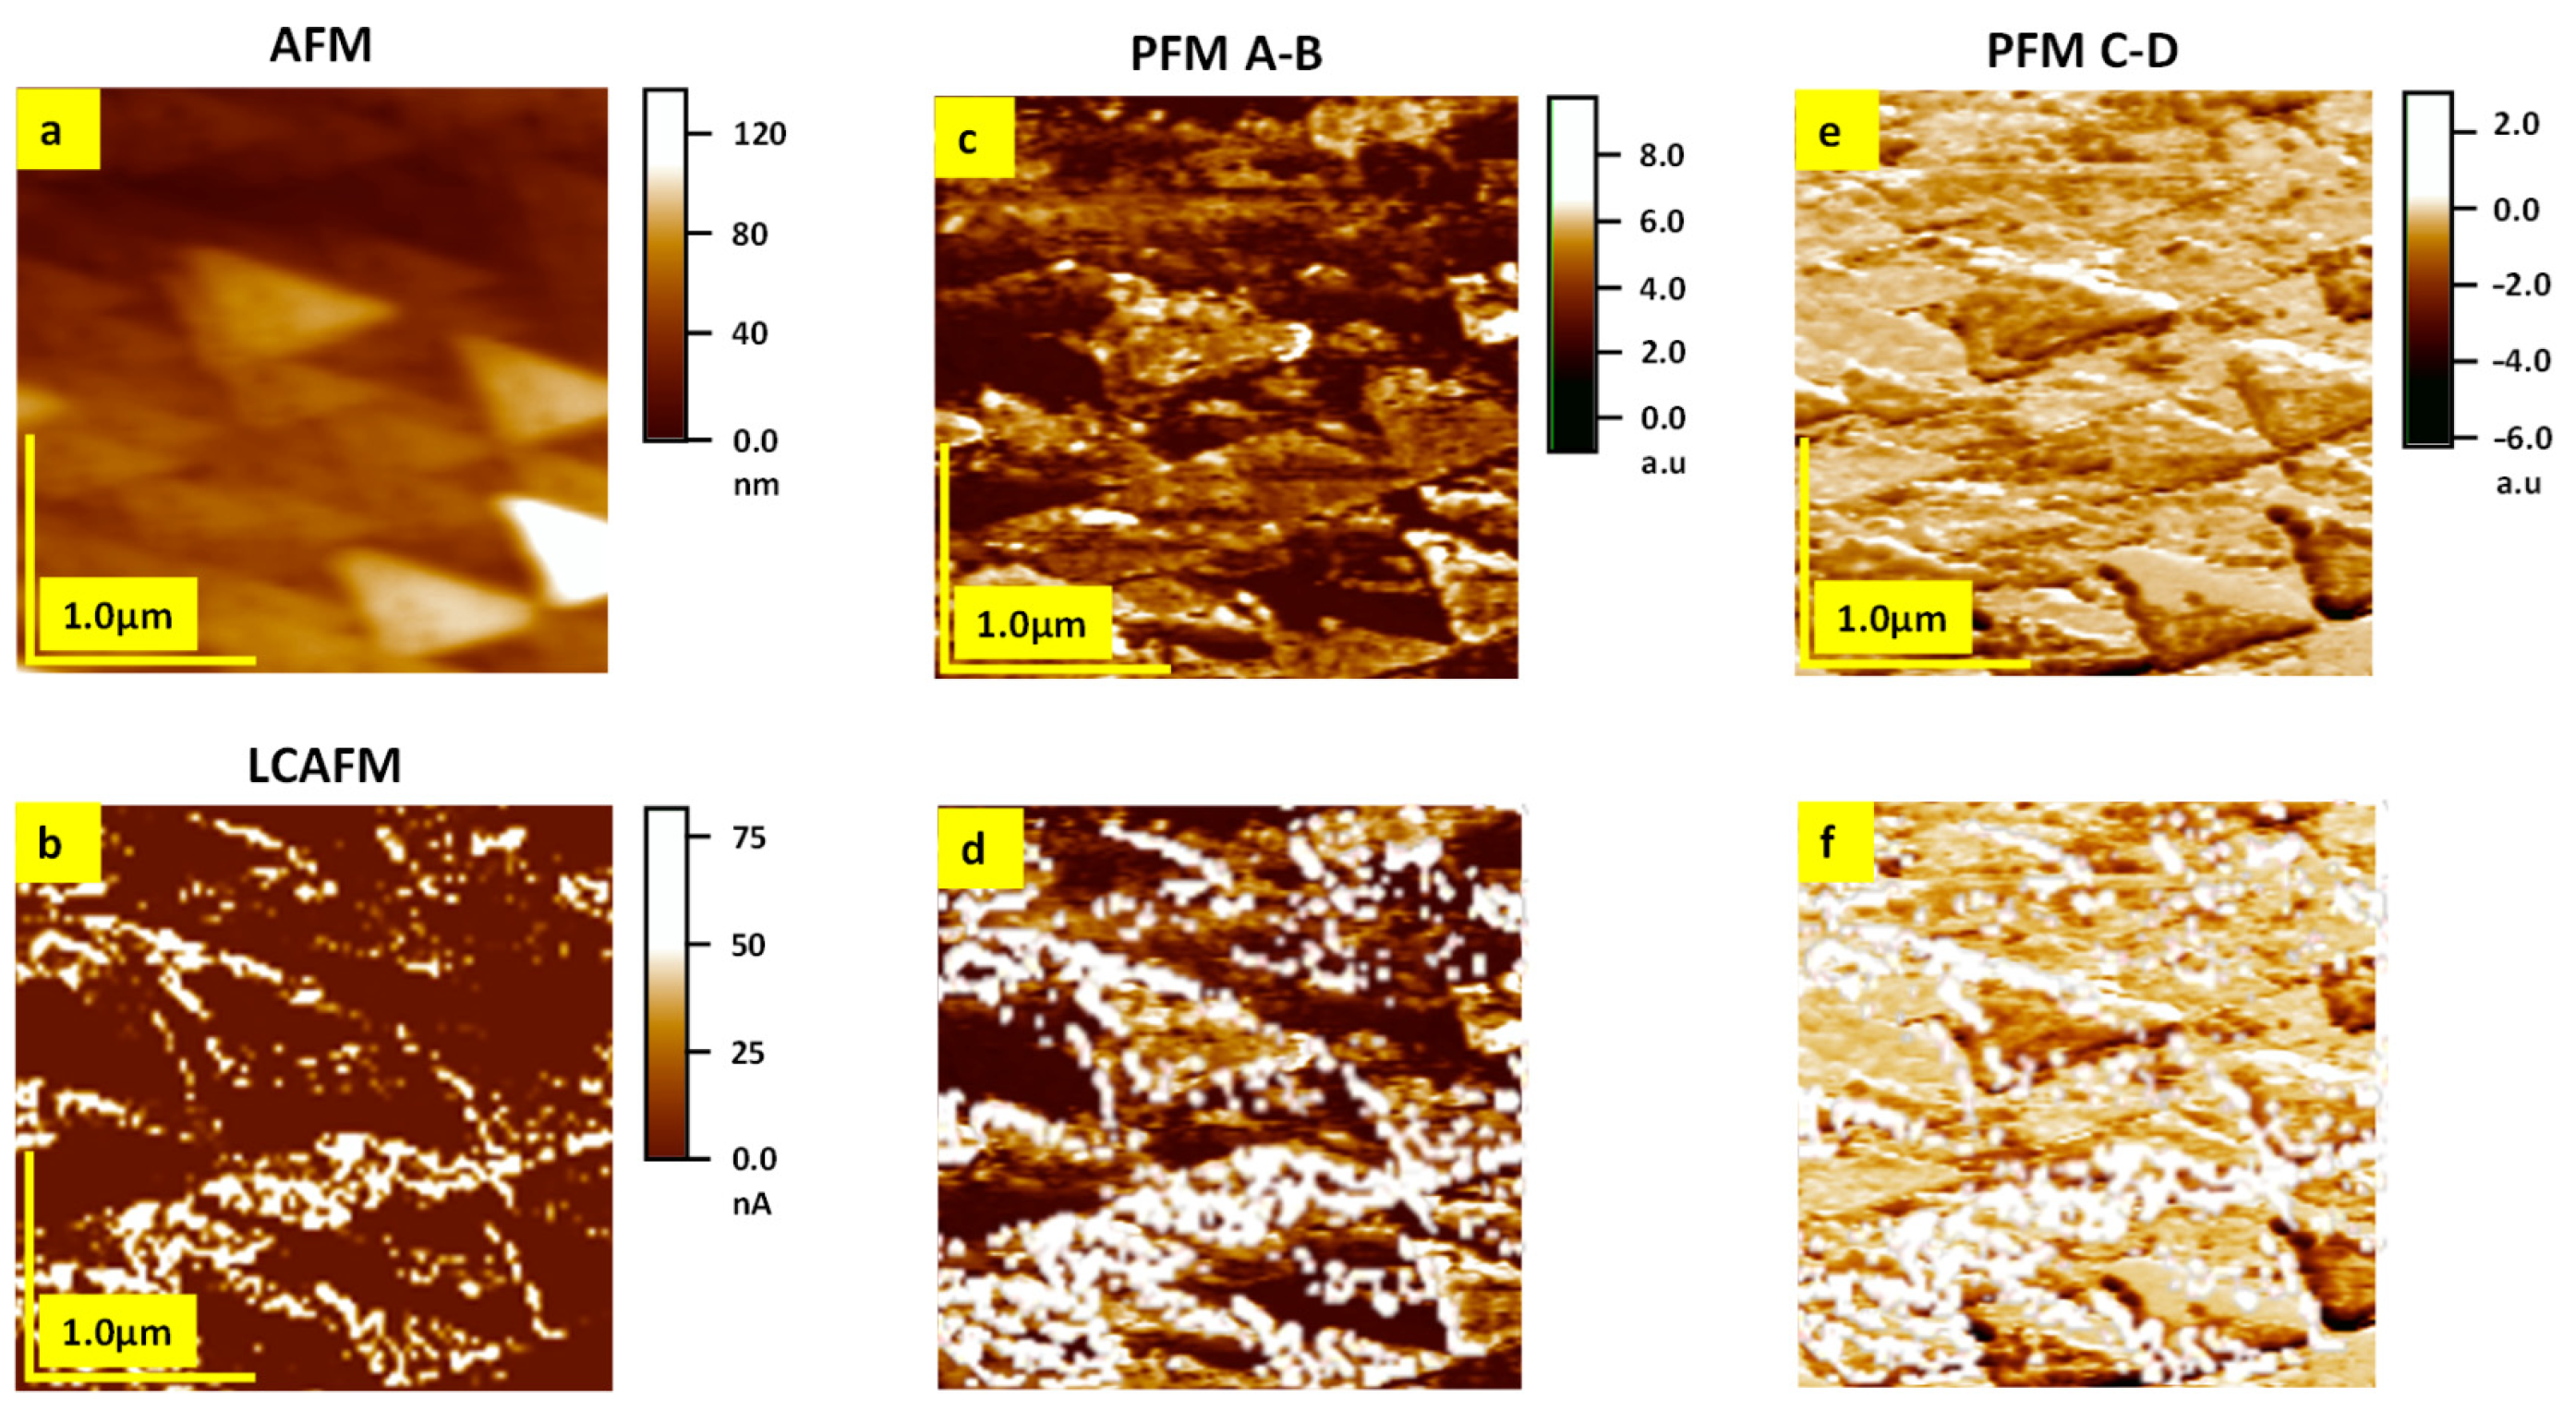
  • Combined PFM and LC–AFM measurements in the ferroelectric state demonstrate the negative correlation between the positions of the metallic filaments and piezoelectrically active areas.
The advantage of our approach of combined surface-sensitive investigations in different reduction states of the BaTiO3 surface is that we can directly correlate the electronic structure and composition of the surface with the observed macroscopic resistance changes. Our analysis describes the I/M transition in thermally reduced crystals as a preferential switching of dislocations in the surface region into the metallic state and the generation of metallically conducting regions in the upper portion of the surface layer. This means that the thermal reduction transforms the BaTiO3 crystal into a nanocomposite in which the metallic filaments/areas are separated by the dielectric/ferroelectric regions. Hence, describing thermally reduced crystal as a “ferroelectric metal” is questionable, as it suggests a homogeneous overlap of metallic and ferroelectric properties, which contravenes the experimental evidence for heterogeneity.

Author Contributions

Conceptualization, investigation, writing—original draft preparation, K.S. and J.S.; visualization and formal analysis, C.R., G.B. and K.S.; validation and writing—review and editing, C.R., D.R., C.K. and G.B. All authors have read and agreed to the published version of the manuscript.

Funding

This research received no external funding.

Data Availability Statement

Data are contained within the article.

Acknowledgments

We gratefully acknowledge C. Wood for proofreading the manuscript.

Conflicts of Interest

The authors declare no conflict of interest.

References

  1. Akbarian, D.; Yilmaz, D.E.; Cao, Y.; Ganesh, P.; Dabo, I.; Munro, J.; Van Ginhoven, R.; van Duin, A.C.T. Understanding the influence of defects and surface chemistry on ferroelectric switching: A ReaxFF investigation of BaTiO3. Phys. Chem. Chem. Phys. 2019, 21, 18240–18249. [Google Scholar] [CrossRef] [PubMed]
  2. Barzilay, M.; Elangoyan, H.; Ivry, Y. Surface Nucleation of the Paraelectric Phase in Ferroelectric BaTiO3: Atomic Scale Mapping. ACS Appl. Electron. Mater. 2019, 1, 2431–2436. [Google Scholar] [CrossRef]
  3. Barzilay, M.; Qiu, T.; Rappe, A.M.; Ivry, Y. Epitaxial TiOx Surface in Ferroelectric BaTiO3: Native Structure and Dynamic Patterning at the Atomic Scale. Adv. Funct. Mater. 2020, 30, 201902549. [Google Scholar] [CrossRef]
  4. He, D.Y.; Tang, X.J.; Liu, Y.X.; Liu, J.; Du, W.B.; He, P.F.; Wang, H.D. Phase Transition Effect on Ferroelectric Domain Surface Charge Dynamics in BaTiO3 Single Crystal. Materials 2021, 14, 4463. [Google Scholar] [CrossRef]
  5. Kalinin, S.V.; Bonnell, D.A. Imaging mechanism of piezoresponse force microscopy of ferroelectric surfaces. Phys. Rev. B 2002, 65, 125408. [Google Scholar] [CrossRef]
  6. Lee, H.; Kim, T.H.; Patzner, J.J.; Lu, H.D.; Lee, J.W.; Zhou, H.; Chang, W.S.; Mahanthappa, M.K.; Tsymbal, E.Y.; Gruverman, A.; et al. Imprint Control of BaTiO3 Thin Films via Chemically Induced Surface Polarization Pinning. Nano Lett. 2016, 16, 2400–2406. [Google Scholar] [CrossRef]
  7. Li, X.L.; Lu, H.B.; Li, M.; Mai, Z.H.; Kim, H.J. Temperature dependence surface structure of BaTiO3 thin films induced by ferroelectric phase transition. J. Appl. Phys. 2008, 103, 2894901. [Google Scholar] [CrossRef]
  8. Nishimatsu, T.; Iwamoto, M.; Kawazoe, Y.; Waghmare, U.V. First-principles accurate total energy surfaces for polar structural distortions of BaTiO3, PbTiO3, and SrTiO3: Consequences for structural transition temperatures. Phys. Rev. B 2010, 82, 134106. [Google Scholar] [CrossRef]
  9. Urakami, Y.; Yamato, M.; Watanabe, Y. Surface conduction on poled BaTiO3 single crystals in ultra high vacuum. Ferroelectrics 2007, 346, 32–36. [Google Scholar] [CrossRef]
  10. Watanabe, Y. BaTiO3 polar surface in ultrahigh vacuum calculated by local density functional theory with a large supercell. Ferroelectrics 2018, 534, 183–189. [Google Scholar] [CrossRef]
  11. Watanabe, Y.; Okano, M.; Masuda, A. Surface conduction on insulating BaTiO3 crystal suggesting an intrinsic surface electron layer. Phys. Rev. Lett. 2001, 86, 332–335. [Google Scholar] [CrossRef] [PubMed]
  12. Zhong, W.; Vanderbilt, D.; Rabe, K.M. First-principles theory of ferroelectric phase-transitions for perovskites—The case of BaTiO3. Phys. Rev. B 1995, 52, 6301–6312. [Google Scholar] [CrossRef] [PubMed]
  13. Känzig, W. Space Charge Layer Near the Surface of a Ferroelectric. Phys. Rev. 1955, 98, 549–550. [Google Scholar] [CrossRef]
  14. Lee, S.; Bock, J.A.; Trolier-McKinstry, S.; Randall, C.A. Ferroelectric-thermoelectricity and Mott transition of ferroelectric oxides with high electronic conductivity. J. Eur. Ceram. Soc. 2012, 32, 3971–3988. [Google Scholar] [CrossRef]
  15. Yimer, Z.; Fu, H.X. Origin of the persistence of soft modes in metallic ferroelectrics. Phys. Rev. B 2020, 101, 174105. [Google Scholar] [CrossRef]
  16. Akishige, Y.; Yamazaki, Y.; Mori, N. Pressure induced insulator-metal transition in hexagonal BaTiO3-δ. J. Phys. Soc. Jpn. 2004, 73, 1267–1272. [Google Scholar] [CrossRef]
  17. Kolodiazhnyi, T.; Tachibana, M.; Kawaji, H.; Hwang, J.; Takayama-Muromachi, E. Persistence of Ferroelectricity in BaTiO3 through the Insulator-Metal Transition. Phys. Rev. Lett. 2010, 104, 147602. [Google Scholar] [CrossRef]
  18. Li, G.; He, C.; Xiong, Y.; Zou, Z.; Liu, Y.L.; Chen, Q.L.; Zhang, W.L.; Yan, S.A.; Xiao, Y.G.; Tang, M.H.; et al. Coexistence of ferroelectricity and metallicity in M-doped BaTiO3 (M = Al, V, Cr, Fe, Ni, and Nb): First-principles study. Mater. Today Commun. 2021, 27, 102394. [Google Scholar] [CrossRef]
  19. Szot, K.; Rodenbücher, C.; Bihlmayer, G.; Speier, W.; Ishikawa, R.; Shibata, N.; Ikuhara, Y. Influence of dislocations in transition metal oxides on selected physical and chemical properties. Crystals 2018, 8, 241. [Google Scholar] [CrossRef]
  20. Szot, K.; Rodenbucher, C. Insulator-Metal Transition Associated with Resistive Switching in Real SrTiO3 and TiO2 Crystals. In Proceedings of the Joint IEEE International Symposium on the Applications of Ferroelectric/International Symposium on Integrated Functionalities/Piezoelectric Force Microscopy Workshop (ISAF/ISIF/PFM), Singapore, 24–27 May 2015; pp. 143–146. [Google Scholar]
  21. Szot, K.; Speier, W.; Bihlmayer, G.; Waser, R. Switching the electrical resistance of individual dislocations in single-crystalline SrTiO3. Nat. Mater. 2006, 5, 312–320. [Google Scholar] [CrossRef]
  22. Szot, K.; Speier, W.; Carius, R.; Zastrow, U.; Beyer, W. Localized metallic conductivity and self-healing during thermal reduction of SrTiO3. Phys. Rev. Lett. 2002, 88, 075508. [Google Scholar] [CrossRef] [PubMed]
  23. Rodenbücher, C.; Meuffels, P.; Speier, W.; Ermrich, M.; Wrana, D.; Krok, F.; Szot, K. Stability and Decomposition of Perovskite-Type Titanates upon High-Temperature Reduction. Phys. Status Solidi (RRL) Rapid Res. Lett. 2017, 11, 1700222. [Google Scholar] [CrossRef]
  24. Rodenbücher, C.; Korte, C.; Schmitz-Kempen, T.; Bette, S.; Szot, K. A physical method for investigating defect chemistry in solid metal oxides. APL Mater. 2021, 9, 011106. [Google Scholar] [CrossRef]
  25. Eglitis, R.; Popov, A.I.; Purans, J.; Jia, R. First principles hybrid Hartree-Fock-DFT calculations of bulk and (001) surface F centers in oxide perovskites and alkaline-earth fluorides. Low Temp. Phys. 2020, 46, 1206–1212. [Google Scholar] [CrossRef]
  26. Eglitis, R.I.; Purans, J.; Popov, A.I.; Jia, R. Tendencies in ABO3 Perovskite and SrF2, BaF2 and CaF2 Bulk and Surface F-Center Ab Initio Computations at High Symmetry Cubic Structure. Symmetry 2021, 13, 1920. [Google Scholar] [CrossRef]
  27. Sokolov, M.; Eglitis, R.I.; Piskunov, S.; Zhukovskii, Y.F. Ab initio hybrid DFT calculations of BaTiO3 bulk and BaO-terminated (001) surface F-centers. Int. J. Mod. Phys. B 2017, 31, s0217979217502514. [Google Scholar] [CrossRef]
  28. Kolodiazhnyi, T. Insulator-metal transition and anomalous sign reversal of the dominant charge carriers in perovskite BaTiO3−δ. Phys. Rev. B 2008, 78, 045107. [Google Scholar] [CrossRef]
  29. Scofield, J.H. Theoretical Photoionization Cross Sections from 1 to 1500 keV; Technical Report; Lawrence Livermore Laboratory, University of California: Livermore, CA, USA; p. UCRL–-51326.
  30. Singh, B.; Diwan, A.; Jain, V.; Herrera-Gomez, A.; Terry, J.; Linford, M.R. Uniqueness plots: A simple graphical tool for identifying poor peak fits in X-ray photoelectron spectroscopy. Appl. Surf. Sci. 2016, 387, 155–162. [Google Scholar] [CrossRef]
  31. Wrana, D.; Rodenbucher, C.; Belza, W.; Szot, K.; Krok, F. In situ study of redox processes on the surface of SrTiO3 single crystals. Appl. Surf. Sci. 2018, 432, 46–52. [Google Scholar] [CrossRef]
  32. Wu, Z.C. RE More accurate generalized gradient approximation for solids. Am. Phys. Soc. 2006, 73, 235116. [Google Scholar] [CrossRef]
  33. Krakauer, H.; Posternak, M.; Freeman, A.J. Linearized augmented plane-wave method for the electronic band structure of thin films. Phys. Rev. B 1979, 19, 1706–1719. [Google Scholar] [CrossRef]
  34. Wortmann, D.; Gregor, M.; Baadji, N.; Betzinger, M.; Bihlmayer, G.; Bröder, J.; Burnus, T.; Enkovaara, J.; Freimuth, F.; Friedrich, C.; et al. Fleur; Zenodo: Geneva, Switzerland, 2023. [Google Scholar] [CrossRef]
  35. Bilc, D.I.; Orlando, R.; Shaltaf, R.; Rignanese, G.M.; Íñiguez, J.; Ghosez, P. Hybrid exchange-correlation functional for accurate prediction of the electronic and structural properties of ferroelectric oxides. Phys. Rev. B 2008, 77, 165107. [Google Scholar] [CrossRef]
  36. Becker, K.D.; Schrader, M.; Kwon, H.S.; Yoo, H.I. Electrical and optical characterization of undoped BaTiO3 in the quenched state. Phys. Chem. Chem. Phys. 2009, 11, 3082–3089. [Google Scholar] [CrossRef] [PubMed]
  37. Kwon, H.S.; Yoo, H.I.; Kim, C.H.; Hur, K.H. Semiconductor-to-insulator transition of undoped-BaTiO3 in quenched state. J. Appl. Phys. 2010, 107, 3385426. [Google Scholar] [CrossRef]
  38. Macchi, C.; Somoza, A.; Dupasquier, A.; Garcia, A.L.; Castro, M. Positron trapping in BaTiO3 perovskite. J. Phys. Condens. Matter 2001, 13, 5717–5722. [Google Scholar] [CrossRef]
  39. Maier, R.A.; Randall, C.A. Low Temperature Ionic Conductivity of an Acceptor-Doped Perovskite: II. Impedance of Single-Crystal BaTiO3. J. Am. Ceram. Soc. 2016, 99, 3360–3366. [Google Scholar] [CrossRef]
  40. Yeo, H.G.; Kuk, M.H.; Kim, M.H.; Song, T.K.; Bae, D.S.; Park, T.G.; Lee, S.I.; Randall, C.A. Electrical Conductivity Revisited in Excess BaO into BaTiO3. J. Korean Ceram. Soc. 2005, 42, 308–313. [Google Scholar] [CrossRef]
  41. Rogala, M.; Bihlmayer, G.; Dabrowski, P.; Rodenbucher, C.; Wrana, D.; Krok, F.; Klusek, Z.; Szot, K. Self-reduction of the native TiO2 (110) surface during cooling after thermal annealing—In-operando investigations. Sci. Rep. 2019, 9, s41598. [Google Scholar] [CrossRef]
  42. Alexandrov, V.E.; Kotomin, E.A.; Maier, J.; Evarestov, R.A. First-principles study of bulk and surface oxygen vacancies in SrTiO3 crystal. Eur. Phys. J. B 2009, 72, 53–57. [Google Scholar] [CrossRef]
  43. Lee, S.B.; Phillipp, F.; Sigle, W.; Ruhle, M. Nanoscale TiO island formation on the SrTiO3(001) surface studied by in situ high-resolution transmission electron microscopy. Ultramicroscopy 2005, 104, 30–38. [Google Scholar] [CrossRef]
  44. Meyer, R.; Waser, R.; Helmbold, J.; Borchardt, G. Cationic surface segregation in donor-doped SrTiO3 under oxidizing conditions. J. Electroceram. 2002, 9, 103–112. [Google Scholar] [CrossRef]
  45. Szot, K.; Bihlmayer, G.; Speier, W. Nature of the Resistive Switching Phenomena in TiO2 and SrTiO3: Origin of the Reversible Insulator-Metal Transition. In Solid State Physics; Solid State Physics: 2014; Camley, R.E., Stamps, R.L., Eds.; Elsevier: Amsterdam, The Netherlands, 2014; Volume 65, pp. 353–559. [Google Scholar]
  46. Szade, J.; Psiuk, B.; Pilch, M.; Waser, R.; Szot, K. Self-neutralization via electroreduction in photoemission from SrTiO3 single crystals. Appl. Phys. A-Mater. Sci. Process. 2009, 97, 449–454. [Google Scholar] [CrossRef]
  47. Arend, H.; Montemezzani, G.; Szot, K.; Turcicova, H. Importance of oxidation and reduction of barium titanate in material science. Ferroelectrics 1997, 202, 1–10. [Google Scholar] [CrossRef]
  48. Szot, K.; Freiburg, C.; Pawelczyk, M. Layer structures BaO-BaTiO3 in the region of p-type conductivity on the surface of BaTiO3. Appl. Phys. A-Mater. Sci. Process. 1991, 53, 563–567. [Google Scholar] [CrossRef]
  49. Szot, K.; Hoffmann, S.; Speier, W.; Breuer, U.; Siegert, M.; Waser, R. Segregation phenomena in thin films of BaTiO3. Integr. Ferroelectr. 2001, 33, 303–310. [Google Scholar] [CrossRef]
  50. Szot, K.; Pawelczyk, M.; Herion, J.; Freiburg, C.; Albers, J.; Waser, R.; Hulliger, J.; Kwapulinski, J.; Dec, J. Nature of the surface layer in ABO3-type Perovskites at elevated temperatures. Appl. Phys. A-Mater. Sci. Process. 1996, 62, 335–343. [Google Scholar] [CrossRef]
  51. Bursill, L.; Peng, J.; Fan, X. Structure and reactivity of atomic surfaces of barium titanate under electron irradiation. Ferroelectrics 1989, 97, 71–84. [Google Scholar] [CrossRef]
  52. Buck, E.C. Effects of electron irradiation of barium titanate. Radiat. Eff. Defects Solids 1995, 133, 15–25. [Google Scholar] [CrossRef]
  53. Hirel, P.; Marton, P.; Mrovec, M.; Elsasser, C. Theoretical investigation of {110} generalized stacking faults and their relation to dislocation behavior in perovskite oxides. Acta Mater. 2010, 58, 6072–6079. [Google Scholar] [CrossRef]
  54. Li, Y.L.; Xie, L.; Yu, R.; Zhou, H.H.; Cheng, Z.Y.; Wang, X.H.; Li, L.T.; Zhu, J. Core Structures of <001> {110} edge dislocations in BaTiO3. AIP Adv. 2015, 5, 4927637. [Google Scholar] [CrossRef]
  55. Wunderlich, W.; Fujimoto, M.; Ohsato, H. Formation of stacking faults from misfit dislocations at the BaTiO3/SrTiO3 interface simulated by molecular dynamics. Mater. Sci. Eng. A-Struct. Mater. Prop. Microstruct. Process. 2001, 309, 148–151. [Google Scholar] [CrossRef]
  56. Jia, C.; Urban, K. The atomic structure of the dislocation cores in a small-angle grain boundary in BaTiO3 thin films. Philos. Mag. Lett. 1999, 79, 859–867. [Google Scholar] [CrossRef]
  57. Mott, N.F.; Friedman, L. Metal-insulator transitions in VO2, Ti2O3 and Ti2-XVXO3. Philos. Mag. 1974, 30, 389–402. [Google Scholar] [CrossRef]
  58. Liborio, L.; Mallia, G.; Harrison, N. Electronic structure of the Ti4O7 Magnéli phase. Phys. Rev. B 2009, 79, 245133. [Google Scholar] [CrossRef]
  59. Waser, R.; Dittmann, R.; Staikov, G.; Szot, K. Redox-Based Resistive Switching Memories—Nanoionic Mechanisms, Prospects, and Challenges. Adv. Mater. 2009, 21, 2632. [Google Scholar] [CrossRef] [PubMed]
  60. Marshall, M.S.; Becerra-Toledo, A.E.; Marks, L.D.; Castell, M.R. Surface and defect structure of oxide nanowires on SrTiO3. Phys. Rev. Lett. 2011, 107, 086102. [Google Scholar] [CrossRef] [PubMed]
  61. Wrana, D.; Rodenbucher, C.; Jany, B.R.; Kryshtal, O.; Cempura, G.; Kruk, A.; Indyka, P.; Szot, K.; Krok, F. A bottom-up process of self-formation of highly conductive titanium oxide (TiO) nanowires on reduced SrTiO3. Nanoscale 2019, 11, 89–97. [Google Scholar] [CrossRef]
  62. Szot, K.; Speier, W. Surfaces of reduced and oxidized SrTiO3 from atomic force microscopy. Phys. Rev. B 1999, 60, 5909–5926. [Google Scholar] [CrossRef]
  63. Doukhan, N.; Doukhan, J. Dislocations in perovskites BaTiO3 and CaTiO3. Phys. Chem. Miner. 1986, 13, 403–410. [Google Scholar] [CrossRef]
  64. Eibl, O.; Pongratz, P.; Skalicky, P.; Schmelz, H. Dislocations in BaTiO3 ceramics. Phys. Status Solidi 1988, 108, 495–502. [Google Scholar] [CrossRef]
  65. Balzar, D.; Ledbetter, H.; Stephens, P.W.; Park, E.T.; Routbort, J.L. Dislocation-density changes upon poling of polycrystalline BaTiO3. Phys. Rev. B 1999, 59, 3414. [Google Scholar] [CrossRef]
  66. Kurata, H.; Isojima, S.; Kawai, M.; Shimakawa, Y.; Isoda, S. Local analysis of the edge dislocation core in BaTiO3 thin film by STEM-EELS. J. Microsc. 2009, 236, 128–131. [Google Scholar] [CrossRef]
  67. Gao, P.; Yang, S.; Ishikawa, R.; Li, N.; Feng, B.; Kumamoto, A.; Shibata, N.; Yu, P.; Ikuhara, Y. Atomic-scale measurement of flexoelectric polarization at SrTiO3 dislocations. Phys. Rev. Lett. 2018, 120, 267601. [Google Scholar] [CrossRef]
  68. Polinger, V.; Bersuker, I.B. Origin of polar nanoregions and relaxor properties of ferroelectrics. Phys. Rev. B 2018, 98, 214102. [Google Scholar] [CrossRef]
Figure 1. Schematic of the electrical circuit used for in situ resistance measurements as a function of temperature, pressure, and time.
Crystals 13 01278 g001
Figure 2. Change in the resistances of the bulk and interfaces of a BaTiO3 (100) crystal (dimension 10 × 3 × 1 mm3) contacted with Pt electrodes upon reduction under isothermal conditions in UHV. The arrow marks the maximum reduction state, after which so-called self-healing takes place in the bulk. The resistances were measured using four-probe geometry, in which the potential drop between the two outer electrodes characterizes the total resistance, the potential drop between the inner electrodes the bulk resistance, and the potential drop between two adjacent outer and inner electrodes the interfaces’ resistance.
Crystals 13 01278 g002
Figure 3. Dependence of the resistance change as a function of the temperature of the entire sample and in its different regions following the thermal reduction of the crystal at 700 °C (a), 800 °C (b), 900 °C (c), and 1000 °C (d). After the reduction of the BaTiO3 crystal at high temperatures, a jump in the resistance could be observed at Tc, although the overall metallic trend in the function R(T) was conserved.
Crystals 13 01278 g003
Figure 4. Effusion of oxygen and carbon dioxide from a BaTiO3 single crystal during thermal reduction under UHV conditions: (a) 300–750 °C, (b) 750–850 °C, (c) 850–950 °C, and (d) 950–1000 °C.
Crystals 13 01278 g004
Figure 5. O1s spectra collected for the surface layer of an epi-polished BaTiO3 (100) crystal during high-temperature reduction. Bottom: the difference in O1s spectra at 400 °C (left) and 1100 °C (right).
Crystals 13 01278 g005
Figure 6. C1s spectra collected for the surface layer of an epi-polished BaTiO3 (100) crystal during high-temperature reduction. Bottom: the difference in C1s spectra at 400 °C (left) and 700 °C (right).
Crystals 13 01278 g006
Figure 7. Ti2p spectra collected for the surface layer of an epi-polished BaTiO3 (100) crystal during high-temperature reduction. Bottom: the difference in the Ti2p spectra at 400 °C (left) and 1100 °C (right).
Crystals 13 01278 g007
Figure 8. Ba3d5/2 spectra collected for the surface layer of an epi-polished BaTiO3 (100) crystal during high-temperature reduction. Bottom: the difference in Ba3d5/2 spectra at 400 °C (left) and 1100 °C (right).
Crystals 13 01278 g008
Figure 9. Valence band spectra collected for the surface layer of an epi-polished BaTiO3 (100) crystal during high-temperature reduction. The magnifications of the part of the DOS near the top of the valence band are depicted on the right.
Crystals 13 01278 g009
Figure 10. Stoichiometry change in the Ba and Ti sublattice in the surface layer as a function of the reduction temperature. The analysis was based on the determination of the area of the Ti2p core lines (Ti2p3/2 + Ti2p1/2 + shake-up) and the area of the Ba3d lines (Ba3d5/2 + Ba3d1/2) and the information depth was 5 nm.
Crystals 13 01278 g010
Figure 11. Density of states of TiO2-terminated (left) and BaO-terminated (right) 15-layer BaTiO3 films. Black, blue, and red lines indicate local contributions from the Ba, Ti, and O atoms, respectively. In the left column, from top to bottom, the topmost TiO2 layer, the subsurface BaO layer, the innermost TiO2 layer, and the central BaO layer are displayed. In the right column, the surface BaO layer is displayed on top, followed by the subsurface TiO2, the innermost BaO, and the central TiO2 layer at the bottom.
Crystals 13 01278 g011
Figure 12. Core lines of the Ti2p, Ba3d, O1s, and VB region obtained for a reduced BaTiO3 crystal after rapid cooling from 800 to 500 °C.
Crystals 13 01278 g012
Figure 13. Differences between the core lines of Ti2p, Ba3d, and O1s and the VB region obtained after subtracting the corresponding core lines of the reduced crystal quenched from 900 to 500 °C; the spectra of the sample quenched from 800 to 500 °C (yellow line) were used as reference spectra.
Crystals 13 01278 g013
Figure 14. Differences between the core lines of Ti2p, Ba3d, and O1s and the VB region obtained after subtracting the corresponding core lines of the reduced crystal quenched from 1000 °C to 500 °C; the spectra of the sample quenched from 800 to 500 °C (yellow line) were used as reference spectra. Note that in the band gap, the reference VB spectrum is shown as a black line.
Crystals 13 01278 g014
Figure 15. Differences between the core lines of Ti2p, Ba3d, and O1s and the VB region obtained after subtracting the corresponding core lines of the reduced crystal quenched from 1100 to 500 °C; the spectra of the sample quenched from 800 to 500 °C (yellow line) were used as reference spectra. Note that in the band gap, the reference VB spectrum is shown as a black line.
Crystals 13 01278 g015
Figure 16. Ba/Ti ratio determined using the Ba3d and Ti2p core lines after reduction (red line) and subsequent quenching to 500 °C (black line).
Crystals 13 01278 g016
Figure 17. Difference between the core lines of Ti2p, Ba3d, O1s, and the VB region obtained after subtracting the corresponding core lines of the de-quenched crystal (after reduction of the crystal at 1100 °C, quenching to 500 °C and heating to 1100 °C); the spectra of the sample reduced at 1100 °C (yellow line) were used as the reference spectra.
Crystals 13 01278 g017
Figure 18. Differences between the core lines of Ti2p, Ba3d, and O1s and the VB region obtained after subtracting the corresponding core lines of the crystal quenched from 1100 to 400 °C for two different angles; the XPS spectra of the sample obtained for 45° were used as reference spectra (yellow line).
Crystals 13 01278 g018
Figure 19. Difference spectra of the Ti2p (I), Ba3d (II), and O1s (III) core lines (a) as obtained for charged and neutralized samples of reduced BaTiO3 after cooling to the ferroelectric phase. The deconvolution of the charged spectra is shown in (b), and the neutralized spectra are depicted in (c).
Crystals 13 01278 g019
Figure 20. Ti2p line recorded on a BaTiO3 crystal reduced at 1100 °C and cooled to the paraelectric phase at 400 °C (left) and subsequently to the ferroelectric phase at RT (right).
Crystals 13 01278 g020
Figure 21. Modification of the VB states induced by the cooling of the reduced BaTiO3 crystal from the paraelectric phase (red spectrum) to the ferroelectric phase (yellow spectrum). The insert displays the reduction of the occupied states in the band gap during cooling.
Crystals 13 01278 g021
Figure 22. Investigation of the interior of the reduced crystal by mechanical removal of the surface layer. (a) Illustration of the scraping process; (be) differences in the XPS spectra of the core lines and the VB and between the original surface and deeper surface region after scraping. The missing state of Ti with 3+ and 2+ valences in (b) correlates with a dramatic reduction of the occupied states in the band gap (see insert in the VB spectrum).
Crystals 13 01278 g022
Figure 23. Schematic illustration of the proposed model to explain the step-like increase in the resistance of a metallically conducting BaTiO3 crystal at TC as an effect of a partial switching of the separated regions into the ferroelectric state.
Crystals 13 01278 g023
Figure 24. Schematic illustration of the origin of the energy shift of a part of the core lines (here, the Ti2p spectrum of the charged sample is depicted). The calculated resistance of the ferroelectric regions is in the range of 10 GΩ.
Crystals 13 01278 g024
Figure 25. LC–AFM analysis of the surface of the BaTiO3 crystals reduced at (a) 800 °C and (b) 950 °C. The local I/V characteristics (c) obtained in different positions on the surface show that the filaments and islands possess very good conductivity (points 1 and 2) as opposed to the areas lying between them (point 3).
Crystals 13 01278 g025
Figure 26. Temperature-dependence of the average surface resistance as measured with LC–AFM for BaTiO3 reduced at 800 °C, revealing metallic conductivity.
Crystals 13 01278 g026
Figure 27. AFM topography maps obtained in contact mode of BaTiO3 reduced for a long time at temperatures >1000 °C and revealed growth of crystallites. AFM topography maps (a) 1.0 μm (b) 500 nm.
Crystals 13 01278 g027
Figure 28. Combined AFM (a) and LC–AFM (b) investigation of long-term reduced BaTiO3. Note that for the reduction of noise on the mapping LC–AFM with atomic resolution (c), the presented scan was only filtered with frequent high filters; on the original scan, the atoms were very easily identifiable.
Crystals 13 01278 g028
Figure 29. Schematic illustration of the transformation of a stoichiometric thin BaTiO3 foil to TiO- and BaO-rich phases induced by electron irradiation during TEM investigations. Adapted with permission from Bursill et al. [51]. 1989, Taylor and Francis.
Crystals 13 01278 g029
Figure 30. Distribution of etch pits in different regions (ad) of thermally reduced BaTiO3 crystals analyzed by optical microscopy.
Crystals 13 01278 g030
Figure 31. LC-AFM mapping of stoichiometric BaTiO3 obtained at 220 °C shows filamentary conductivity. The filaments exist as a single object or as an agglomerate. The line scan along one of the smallest filaments illustrates that the increase in electrical conductivity is limited to a distance of 1.4–2 nm from the center point of the filaments.
Crystals 13 01278 g031
Figure 32. LC–AFM analysis of small crystallites that emerged on the surface of the thermally reduced BaTiO3 crystal after annealing at 1000 °C. (a) overview, (b,c) magnification with atomic resolution. Note that we used an opposite polarization for the LC–AFM mapping of the area presented in (d). The scan area was aligned to the <100> direction of the crystal in (ac), while it was rotated by 45° in (d).
Crystals 13 01278 g032
Figure 33. Combined PFM and LC–AFM analysis of thermally reduced BaTiO3 crystal after annealing at 1000 °C. (a) AFM topography, (b) current mapping, (c) in-plane, and (e) out-of-plane PFM maps. For the comparison between the position of the conducting filaments and the piezoelectric properties scan, the LC–AFM map (b) overlapped with the PFM maps in (d,f).
Crystals 13 01278 g033
Figure 34. Combined optical polarization and LC–AFM analysis of reduced BaTiO3. (a,b) microscopic images obtained using a crossed geometry of polarizer (P) and analyzer (A) with respect to the sample; (c) LC–AFM map; (d) topography of a reduced sample with pits that are characteristic of so-called “thermal etching”.
Crystals 13 01278 g034
Table 1. Fitting parameters for the O1s core line at different temperatures.
Component 1Component 2
T (°C)BE (eV)FWHM (eV)Area (%)BE (eV)FWHM (eV)Area (%)
400529.71.5289.4530.91.5710.6
700529.71.6994.5531.01.555.5
800529.71.7797.3531.11.802.7
900529.71.8097.5531.11.702.5
1000529.72.09100
1100529.72.12100
Table 2. Fitting parameters for the C1s core line at different temperatures (only the main components are shown).
Component 1Component 2Component 3
T (°C)BE (eV)FWHM (eV)Area (%)BE (eV)FWHM (eV)Area (%)BE (eV)FWHM (eV)Area (%)
400284.21.4569.1285.71.5619.5287.41.566.5
700284.21.4566.4286.01.5619.4
Table 3. Fitting parameters for the Ti2p3/2 core line at different temperatures.
Component 1Component 2
T (°C)BE (eV)FWHM (eV)Area (%)BE (eV)FWHM (eV)Area (%)
400458.41.26100
700458.41.34100
800458.41.33100
900458.31.44100
1000458.11.83100
1100458.41.6970456.61.430
Table 4. Fitting parameters for the Ba3d5/2 core line at different temperatures.
Component 1Component 2Component 3Component 4
T (°C)BE
(eV)
FWHM (eV)Area (%)BE
(eV)
FWHM (eV)Area (%)BE
(eV)
FWHM (eV)Area (%)BE
(eV)
FWHM (eV)Area (%)
400779.11.5180.6780.61.6019.4
700779.11.6277.6780.81.8222.4
800779.11.6478.4780.81.8421.6
900779.11.7376.9780.91.7017.5781.61.73.0777.31.72.6
1000779.21.9774.9780.91.8315.3781.71.93.4777.51.76.6
1100779.12.1077.2780.71.9011.4781.51.97.3776.8211.3
Disclaimer/Publisher’s Note: The statements, opinions and data contained in all publications are solely those of the individual author(s) and contributor(s) and not of MDPI and/or the editor(s). MDPI and/or the editor(s) disclaim responsibility for any injury to people or property resulting from any ideas, methods, instructions or products referred to in the content.

