Article

Room Temperature Corrosion Behavior of Selective Laser Melting (SLM)-Processed Ni-Fe Superalloy (Inconel 718) in 3.5% NaCl Solution at Different pH Conditions: Role of Microstructures

Nuclear Engineering and Industrial Management, University of Idaho, Idaho Falls, ID 83402, USA
*
Author to whom correspondence should be addressed.
Crystals 2024, 14(1), 89; https://doi.org/10.3390/cryst14010089
Submission received: 28 December 2023 / Revised: 14 January 2024 / Accepted: 16 January 2024 / Published: 18 January 2024
(This article belongs to the Section Inorganic Crystalline Materials)

Abstract

:
Inconel 718 (UNS N07718) is a nickel-base superalloy containing iron that is used at cryogenic temperatures (arctic pipe components) and at high temperatures (gas turbines). This alloy is also used in off-shore oil drilling due to its high overall strength and resistance to corrosion. Inconel 718 components are created by a selective laser melting (SLM) additive manufacturing route and result in isotropic fine-grained microstructures with metastable phases (such as Laves phases) that are not usually present in conventional manufacturing processes. In this work, SLM Inconel 718 alloy specimens were investigated in four different conditions: (1) As-manufactured (AS-AM), (2) Additively manufactured and hot isostatically pressed (AM-HIP), (3) As-manufactured and heat-treated (solution annealing followed by two-step aging), and 4) AM-HIP and heat-treated. Localized corrosion behavior was evaluated at room temperature in a 3.5% NaCl solution at three different pH conditions (pH 1.25, 6.25, and 12.25). Electrochemical tests, including linear polarization, cyclic polarization, potentiostatic conditioning, electrochemical impedance spectroscopy, and Mott–Schottky analyses, were used to compare the corrosion behaviors of the SLM specimens with that of the conventionally wrought IN718 samples. The results showed that the additively manufactured specimens showed better corrosion resistance than the wrought material in the acidic chloride solution, and the AM-HIP specimens exhibited superior corrosion resistance to the as-manufactured ones. Hot isostatic pressing resulted in the visible elimination of the dendritic structure, indicating compositional homogeneity as well as a significant decrease in porosity. In addition, the deleterious secondary phases, such as Laves and δ phases, were not observed in the microstructure of the HIPed samples. The AM-HIP material showed the highest corrosion resistance in all the pH conditions. The two-step aging treatment, in general, resulted in the deterioration of corrosion resistance, which could be attributed to the formation of γ′ and γ″ precipitates that increased the cathodic reaction catalytic activities. In the additively manufactured samples, the presence of the Laves phase was more detrimental to corrosion resistance than any other phases and MC carbide and grain boundary δ phase increased the susceptibility to corrosion in wrought materials.

1. Introduction

Inconel 718 (IN718) is a heat-treatable nickel–iron-base superalloy with a nominal composition of (in wt%) Ni (50–55%), Cr (17–21%), Nb (4.75–5.5%), Mo (2.8–3.3%), Ti (0.65–1.1%), Al (0.2–0.8%), Co (1% max.), C (0.08% max.), Mn (0.35% max), Si (0.35% max.), P (0.015% max), S (0.015% max), B (0.006% max.), Cu (0.3% max.), and Fe (balance–typically < 20%). IN718 contains an FCC matrix and a range of secondary phases including γ′ (Ni3(Ti,Al)), which is an ordered FCC phase, γ″ (Ni3Nb) with an ordered body-centered tetragonal lattice structure, MC and M6C type carbides, δ phase (Ni3Nb) with an orthorhombic lattice structure, and topologically close-packed (TCP) phases such as the A2B-type Laves phase ((Ni,Cr,Fe)2(Nb,Mo,Ti)) and μ phases [1]. IN718 is primarily strengthened by γ″ with mechanical strength provided by solid solution strengthening and precipitation hardening mechanisms. The alloy can be used at a wide range of temperatures from cryogenic to 650 °C [2]. High iron content (~20%) reduces cost, improves malleability, and expands the melting point. However, this results in reduced oxidation resistance at high temperatures [3].
Alloy additions of Cr, Mo, Ti, Al, and Nb result in solid solution strengthening. Cr also helps improve both corrosion and high-temperature oxidation resistance. The addition of Mo increases both the localized corrosion resistance and creep resistance, and since the Mo partitions to M6C, the creep resistance is further enhanced. The incorporation of Mo in the nickel matrix expands the γ lattice by forming a solid solution and increases the γ–γ′ mismatch effect. The addition of Ti and Al results in the precipitation of the γ′ phase. In IN718, the γ′ phase formation is influenced more by the content of titanium than by aluminum. The γ′ particles in Ni-Fe superalloys have a spherical morphology suggesting that the lattice misfit between γ–γ′ is less than 0.5%, and when the size of γ′ is in the range of 10–50 nm, an optimum strength is anticipated. The maximum volume fraction of γ′ is in the range of 0.2–0.3. Alloy strengthening is achieved by several possible mechanisms, such as the antiphase boundary and fault energy of γ′, γ–γ′ modulus mismatch, paired dislocations cutting the particles, and coherency strains. Among these, the antiphase boundary energy effect is the most significant mechanism, and the coherency strain effect is the least effective mechanism for strengthening IN718 [4].
Strengthening by γ″ occurs due to a 2–6% addition of Nb in the presence of iron that provides favorable electronic and crystallographic conditions. The addition of Cr also provides a favorable lattice mismatch. The γ″ particles are typically disc-shaped [5]. The precipitation kinetics of γ″ are sluggish, which is generally advantageous from the welding point of view, and the faster precipitation kinetics of γ′ leads to cracking due to the strain age hardening of the material during welding. Overall, the sluggish aging kinetics of IN718 renders the material weldable without strain age cracking [6]. Extended exposure at 650–760 °C transforms the γ″ phase to the δ phase, which is generally less effective in strengthening the matrix. The δ phase has a platelet morphology. Increasing Al, Ti, Nb, and Si promotes the Laves phase while increasing the content of B, and Zr minimizes the Laves and μ phases [1]. The solvus temperature of the γ″ and δ phases is ~915 °C and 995 °C, respectively [1]. IN718 does not form M23C6 but is reported to form grain boundary MC and M6C under certain conditions [7]. The addition of B leads to a segregation at grain boundaries that alters the surface energy of interfaces, leading to coalescence and spheroidization of the secondary phase precipitates along grain boundaries and results in better ductility [1].
Two types of heat treatments are generally employed for IN718, namely, Type-I: Solution annealing at 925–1010 °C followed by rapid cooling, usually in water, plus precipitation hardening at 720 °C for 8 h, furnace cooling to 620 °C, and holding at 620 °C for a total aging time of 18 h, followed by air cooling; and Type-II: Solution annealing at 1040–1065 °C followed by rapid cooling, usually in water, plus precipitation hardening at 760 °C for 10 h, furnace cooling to 650 °C, and holding at 650 °C for a total aging time of 20 h, followed by air cooling [8]. The yield strength after both types of heat treatments is typically around 1000 MPa at room temperature and 800 MPa at 650 °C. The room temperature hardness is around 36 on the Rockwell C scale (HRC). The Type-II heat treatment is preferred for tensile-limited applications and shows notch-brittleness during stress rupture tests at high temperatures [8]. There are several other heat treatment cycles employed for specific applications. For example, NACE (National Association of Corrosion Engineers) International Standard MR-0175 specified a heat treatment procedure consisting of solution annealing at 1010–1040 °C and aging at 790 °C for 6–8 h followed by air cooling for use in H2S-containing environments in oil and gas production. This heat treatment will result in a hardness in the range of 30–40 (Rockwell C), a minimum yield strength of 840 MPa, a minimum 20% elongation at room temperature, and an impact toughness of 55 J at −60 °C.
The corrosion properties of IN718 at room temperature are important because of the alloy’s application in off-shore oil field applications that require both high strength and stability against corrosion in chloride-containing environments. Several research groups have reported the microstructure influence of the wrought IN718 alloy on localized corrosion, and a microstructure not containing both the acicular δ phase and a continuous network of secondary phase precipitates along the grain boundaries has been recommended for acceptable corrosion resistance of IN718 by the API specification SPEC 6A718 [9]. Recently, Valle et al. [10] showed that the presence of up to 7 vol% of δ phase was not detrimental to corrosion resistance in an aerated 25% NaCl solution. The MC carbides present in the alloy acted as local cathodes and increased pitting susceptibility [11,12]. The presence of the Laves phase is detrimental due to a reduction in tensile strength and ductility [13]. The Laves phase in IN718 is formed by the microsegregation of Nb, Mo, etc., which has a large atomic size and low solubility in the matrix during the final stages of solidification at the interdendritic regions [14]. The Laves phase is characterized by the A2B stoichiometry, where A represents elements like Ni, Fe, Cr, and Co, while B represents larger atomic size elements such as Nb, Mo, Ti, and Si [15]. The Laves phase shows a hexagonal lattice structure with a P6/mmc space group. This topologically close-packed phase is bonded more by geometric factors than by the electronic effects [1]. A considerable amount of work is reported on the formation and dissolution behavior of the Laves phase during thermal heat treatments [16,17,18]. However, the influence of the Laves phase on the corrosion behavior of wrought IN718 has not been widely reported. The local enrichment of alloying elements due to micro-segregation at the interdendrites may promote galvanic coupling between the Laves phase and the adjacent regions, which could lead to enhanced corrosion.
The Inconel 718 alloy is a highly strain hardenable alloy, which makes forging and machining very difficult and expensive. Therefore, additive manufacturing (AM) techniques are widely used due to the ability to manufacture near-net shape components with intricate designs [19]. Selective laser melting (SLM) is a commonly used AM technique in which a laser beam is used to melt a layer of alloy powder selectively, and the layer-by-layer melting helps build the required 3D shape of a component. The high-energy density melting process also leads to very high cooling rates in the order of 106 °C/s [20], resulting in isotropic, fine-grained microstructures with metastable phases that are not usually obtained in conventional manufacturing processes such as casting or forging. Several studies are available on the corrosion behavior of the SLM IN718 alloy [18,19,20,21,22,23]. Guo et al. [21,22] focused on the selective dissolution of the secondary phases of the laser-formed IN718 to understand the electrochemical machining behavior and observed that the Nb-rich γ phase dissolved faster than the γ matrix, and the secondary phases (Laves and MC carbide) were embedded in the Nb-rich γ regions fell out. Zhang et al. [23] evaluated the effect of the Laves phase on the corrosion behavior of printed LSM IN718 in a 3.5% NaCl solution and determined that solution annealing at 980 °C dissolved most of the secondary phases, which improved the corrosion resistance. Du et al. [24] investigated the role of the build inclination angle on the Laves phase content of SLM IN718 and its effect on the corrosion behavior in 3.5% NaCl. They showed that an increase in the inclination angle increased the Laves phase content and that the icorr value decreased with the increased inclination angle. The increased corrosion resistance, in spite of having a larger Laves phase content, was attributed to the change in the crystallographic texture from high-energy (100) planes to low-energy (111) planes. This observation indicated that low-energy planes of the matrix determined the corrosion resistance more than the secondary phases. Luo et al. [2] compared the corrosion resistance of as-printed and heat-treated SLM IN718 specimens with that of the traditionally manufactured (TM) specimens in a 3.5% NaCl solution. The TM specimens reportedly showed higher corrosion resistance than the SLM specimens, while increasing the solution annealing temperature increased the corrosion resistance of the 3D-printed specimens. On the other hand, Li et al. [25] reported a decrease in the corrosion resistance of the SLM specimens after heat treatment in a 5 wt% NaNO3 solution. Siddaiah et al. [26] studied the tribo-corrosion behavior of SLM 718. Recently, the corrosion and passivation behaviors of alloy 718 have been investigated by several research groups [27,28,29,30]. The influence of heat treatment and microstructure on the corrosion behavior of the SLM IN718 material is not clearly understood.
It is known that the SLM process results in porosity depending on operating parameters such as laser power and scanning speed [31,32,33]. The role of porosity on localized corrosion is not fully understood, even though it is generally accepted that porosity may significantly affect localized corrosion [15]. It is reported that porosity affects the pit repassivation kinetics more than the pit initiation kinetics for the SLM 316L specimens [34]; however, the role of porosity on the corrosion behavior of SLM IN718 has not been widely reported to the best of our knowledge. To achieve 100% theoretical density after SLM, the components may be subjected to hot isostatic pressing (HIP). HIPing is widely used in eliminating casting defects [35]. Lee et al. [36] reported optimized process parameters for HIPing of IN718 (1180 °C, 175 MPa, four-hour soaking time) that showed uniform grain size, homogeneous composition, and improved mechanical properties.
The objectives of this study are the following: (a) evaluate the corrosion behavior of additively manufactured IN718 in 3.5% NaCl solutions at different pH conditions (pH 1.25, 6.5, and 12.5) and correlate the results with different microstructural conditions obtained by hot isostatic pressing, and two-step aging treatments; (b) compare the corrosion resistance of the additively manufactured material with the conventionally wrought material; and (c) understand the role of material porosity on the pitting corrosion behavior.

2. Materials and Methods

2.1. Materials

IN718 material fabricated by the selective laser melting (SLM) process was obtained in the form of 12.6 mm diameter rods from a vendor. The IN718 powder was supplied by Praxair Surface Technologies, Indianapolis, IN, USA (TruForm™ Metal Powders), with a nominal composition of (wt%) 53.5Ni-19Cr-18Fe-5(Nb+Ta)-3Mo-1Ti-0.5Al. The 3D printing was enacted using an SLM®-500 (SLM-Solutions, Lubeck, Germany,) printer with a maximum laser power of 400 W. The layer thickness was approximately 40 μm. Other process parameters are proprietary vendor information and were optimized to minimize porosity and grain size. The samples that were hot isostatically pressed employed the parameters reported by Lee et al. [36]. For comparison, traditionally manufactured 12.54 mm diameter rods were procured from Carpenter Technology Corporation, Reading, PA, USA. The composition of the wrought material was (in wt%) 52.65Ni-18.31Cr-18.2Fe-5.14(Nb+Ta)-2.88Mo-0.92Ti-0.51Al-0.08Si-0.04C-0.004B. It is noted that the additively manufactured (AM) and traditionally manufactured materials had a similar composition.

2.2. Heat Treatment

The 3D-printed specimens (referred to as AM), and 3D-printed and HIPed specimens (referred to as AM-HIP) were subjected to heat treatment consisting of solution treatment (980 °C for 1 h, air-cool), followed by a two-step aging process (720 °C for 8 h, furnace-cool to 620 °C at 55 °C/hour, hold at 620 °C for 8 h, air-cool). Heat-treated samples are designated (HT). The sample identification and heat-treated conditions are summarized in Table 1.

2.3. Microstructural Characterization

Specimens were analyzed using X-ray Diffraction (XRD) using a D5000 Diffractometer (Siemens AG, Munich, Germany). Microscopy was done using an optical and a field emission scanning electron microscope after etching with waterless Kalling’s etchant (5 g CuCl2, 100 mL HCl, and 100 mL ethanol). Vickers hardness measurements were carried out using a load of 500 g with a minimum of ten readings per specimen. Grain size was determined by the linear intercept method following the ASTM standard E 112-13. The porosity volume fraction of each specimen was determined by measuring its apparent density using the Archimedes principle, according to ASTM standard B 962-08.

2.4. Electrochemical Tests

Samples with an area of 1.25 cm2  ± 0.05 cm2 were cut from stock and fabricated into working electrodes for experimentation. The working electrodes were created by soldering insulated single-strand copper wire to the specimens and then cold mounting in an acrylic resin to expose one side of the sample. Prior to each series of experiments, the surface of each tested specimen surface was prepared by grinding with silicon carbide (SiC) papers consecutively down to 1500 grit before polishing using a 1 µm alumina slurry. A standard three-electrode cell was used for experimentation, using a saturated potassium chloride (KCl)-silver/silver chloride (Ag/AgCl) reference electrode (197 mV vs. standard hydrogen electrode) with a spiraled platinum (Pt) wire counter electrode with a surface area of 3.75 cm2. A computer-controlled potentiostat (Gamry Interface 1000, Gamry Instruments Inc., Warminster, PA, USA) was used to conduct the experiments. Electrochemical experiments were performed at room temperature in 3.5% sodium chloride (NaCl) solution at three pH levels: 6.25 (referred to as neutral NaCl solution), 1.25 (addition of 0.1 M hydrochloric acid (HCl)), and 12.25 (addition of 0.1 M sodium hydroxide (NaOH)). The neutral 3.5% NaCl solution was prepared by dissolving 35 g of sodium chloride salt in 900 mL high-purity water (Millipore, Burlington, MA, USA, 18.0 ± 0.2 MΩ·cm at 25 °C) and making up the solution to one liter by adding water in a class-A one-liter standard flask. The pH of the solution was measured using a calibrated pH meter (Oakton Instruments, Vernon Hills, IL, USA) and found to be 6.25 ± 0.1 in all the experiments. The 3.5% NaCl solution with pH 1.25 was prepared by adding 9.85 g of HCl (37% assay) to the water and making up the solution to one liter in a standard volumetric flask. This constituted 0.1 M HCl solution, which has about 9.55 g of chloride. An amount of 25.45 g of NaCl was dissolved in the 0.1 M HCl solution, and the volume was made up to 1 L by adding 0.1 M HCl in a standard volumetric flask. A similar procedure was followed to prepare the pH 12.25 solution. In this case, 35 g of NaCl was dissolved in 0.1 M NaOH solution. The allowable pH deviation was within 0.10 units of the specified level. The pH levels were selected to represent the possible service conditions anticipated in oil and chemical industries, as well as electrolyzers for hydrogen generation. All chemicals were ACS Reagent grade and procured from Sigma-Aldrich, Burlington, MA, United States.
The open circuit potential (OCP) was observed for 1 h before conducting linear polarization resistance tests over a range of OCP ± 25 mV using a scan rate of 0.5 mV/s. The samples were then equilibrated at the open circuit condition until a steady state potential was recorded. After reaching a steady state OCP, electrochemical impedance spectroscopy (EIS) measurements at OCP were carried out by superimposing an AC current of 10 mV. The frequency range was 0.01 Hz to 10 kHz. Finally, cyclic potentiodynamic polarization was performed, beginning at a potential of approximately 100 mV below OCP at a scan rate of 0.5 mV/s. The forward scan continued either until an apex potential of 1.6 VAg/AgCl or an apex current density of 5 mA/cm2 was reached. After reaching the apex current density, the scan was reversed back to the initial OCP. During the forward scan, the potential at which the current starts to increase monotonically is called transpassive potential (ETP). The increase in current could signify either a breakdown of the passive film or an oxygen evolution reaction. If the passive film breakdown occurred during the forward scan and pits were initiated, then the reverse scan would not trace the current profile of the forward scan. A ‘positive’ hysteresis would be recorded because of the increased time for the pits to repassivate. The cross-over potential of the reverse scan is called the pitting protection potential (EPP).
A freshly polished specimen was used for studying the pit initiation behavior. After initial conditioning at OCP, the time required for pit initiation and propagation was measured by potentiostatically conditioning at 50 mV below the transpassive potential (designated ETP-50). Initially, the current decayed, and after a certain period of time, it started to increase. When the current started to increase, the potentiostatic test was interrupted to evaluate the passive film using EIS. After the samples underwent the EIS at ETP-50, Mott–Schottky analysis was carried out, initializing at ETP-50 and ending at OCP at 1000 Hz with a 50 mV potential step. All the experiments were either duplicated or triplicated to ensure reproducibility. Only reproducible results are presented in this report. The tabulated values are the average of two or three test results.

3. Results

3.1. Microstructure

3.1.1. XRD Results

Figure 1 shows the XRD results of the SLM IN718 specimens in the four tested conditions. Four peaks are revealed for the as-printed (AS-AM) specimen. The peaks at 2θ values of 43.75, 50.9, and 74.75° correspond to the (111), (200), and (220) planes of the γ solid solution matrix. The average FCC lattice parameter of the matrix is 0.3585 nm, which is closer to the value reported for SLM IN718 by Vikram et al. [37]. The peak occurring at 46.45° could be associated with the (211) plane of the δ phase. The peaks of γ′ and γ″ coincide with the peaks of the γ matrix [38], making it difficult to resolve these peaks separately. The optical and scanning electron microstructures of AS-AM revealed a significant amount of the Laves phase, which is enriched in Si, Mo, and Nb in the form of (Ni,Fe,Cr)2(Nb,Mo,Ti) and has a hexagonally close-packed lattice structure. The Laves phase forms at the dendrites as a result of elemental segregation during solidification and exposure to temperatures in excess of 982 °C in the wrought materials [13]. However, the XRD results did not reveal any peaks corresponding to the Laves phase. The AS-AM specimen showed a predominant peak of the γ (200) plane, indicating a preferential growth in this orientation. Solution treatment at 980 °C followed by a two-step aging treatment did not alter the XRD peaks significantly. The intensity of the δ phase decreased after heat treatment. Hot isostatic pressing changed the preferential crystal orientation of the γ phase from the (200) direction to (111). The peak associated with the δ phase was not seen in any of the HIPed specimens. Heat treatment of the HIPed specimen changed the preferred crystallographic orientation of the γ back to (200), as seen in Figure 1. The XRD peaks shifted left (lower 2θ values) in general, indicating a marginal increase in the lattice parameters (0.3587 nm for As-AM (HT), 0.3595 nm for AM-HIP, 0.3591 nm for AM-HIP (HT)) after HIPing or heat treatment. The increase in the lattice parameter after HIPing could be attributed to the dissolution of Nb and Mo into the matrix diffusing out of the Laves and δ phases. These shifts could also be attributed to an elastic interaction of the stress fields around the secondary phase precipitates (δ, γ″, and γ′) and other solute atoms in the γ matrix [37].

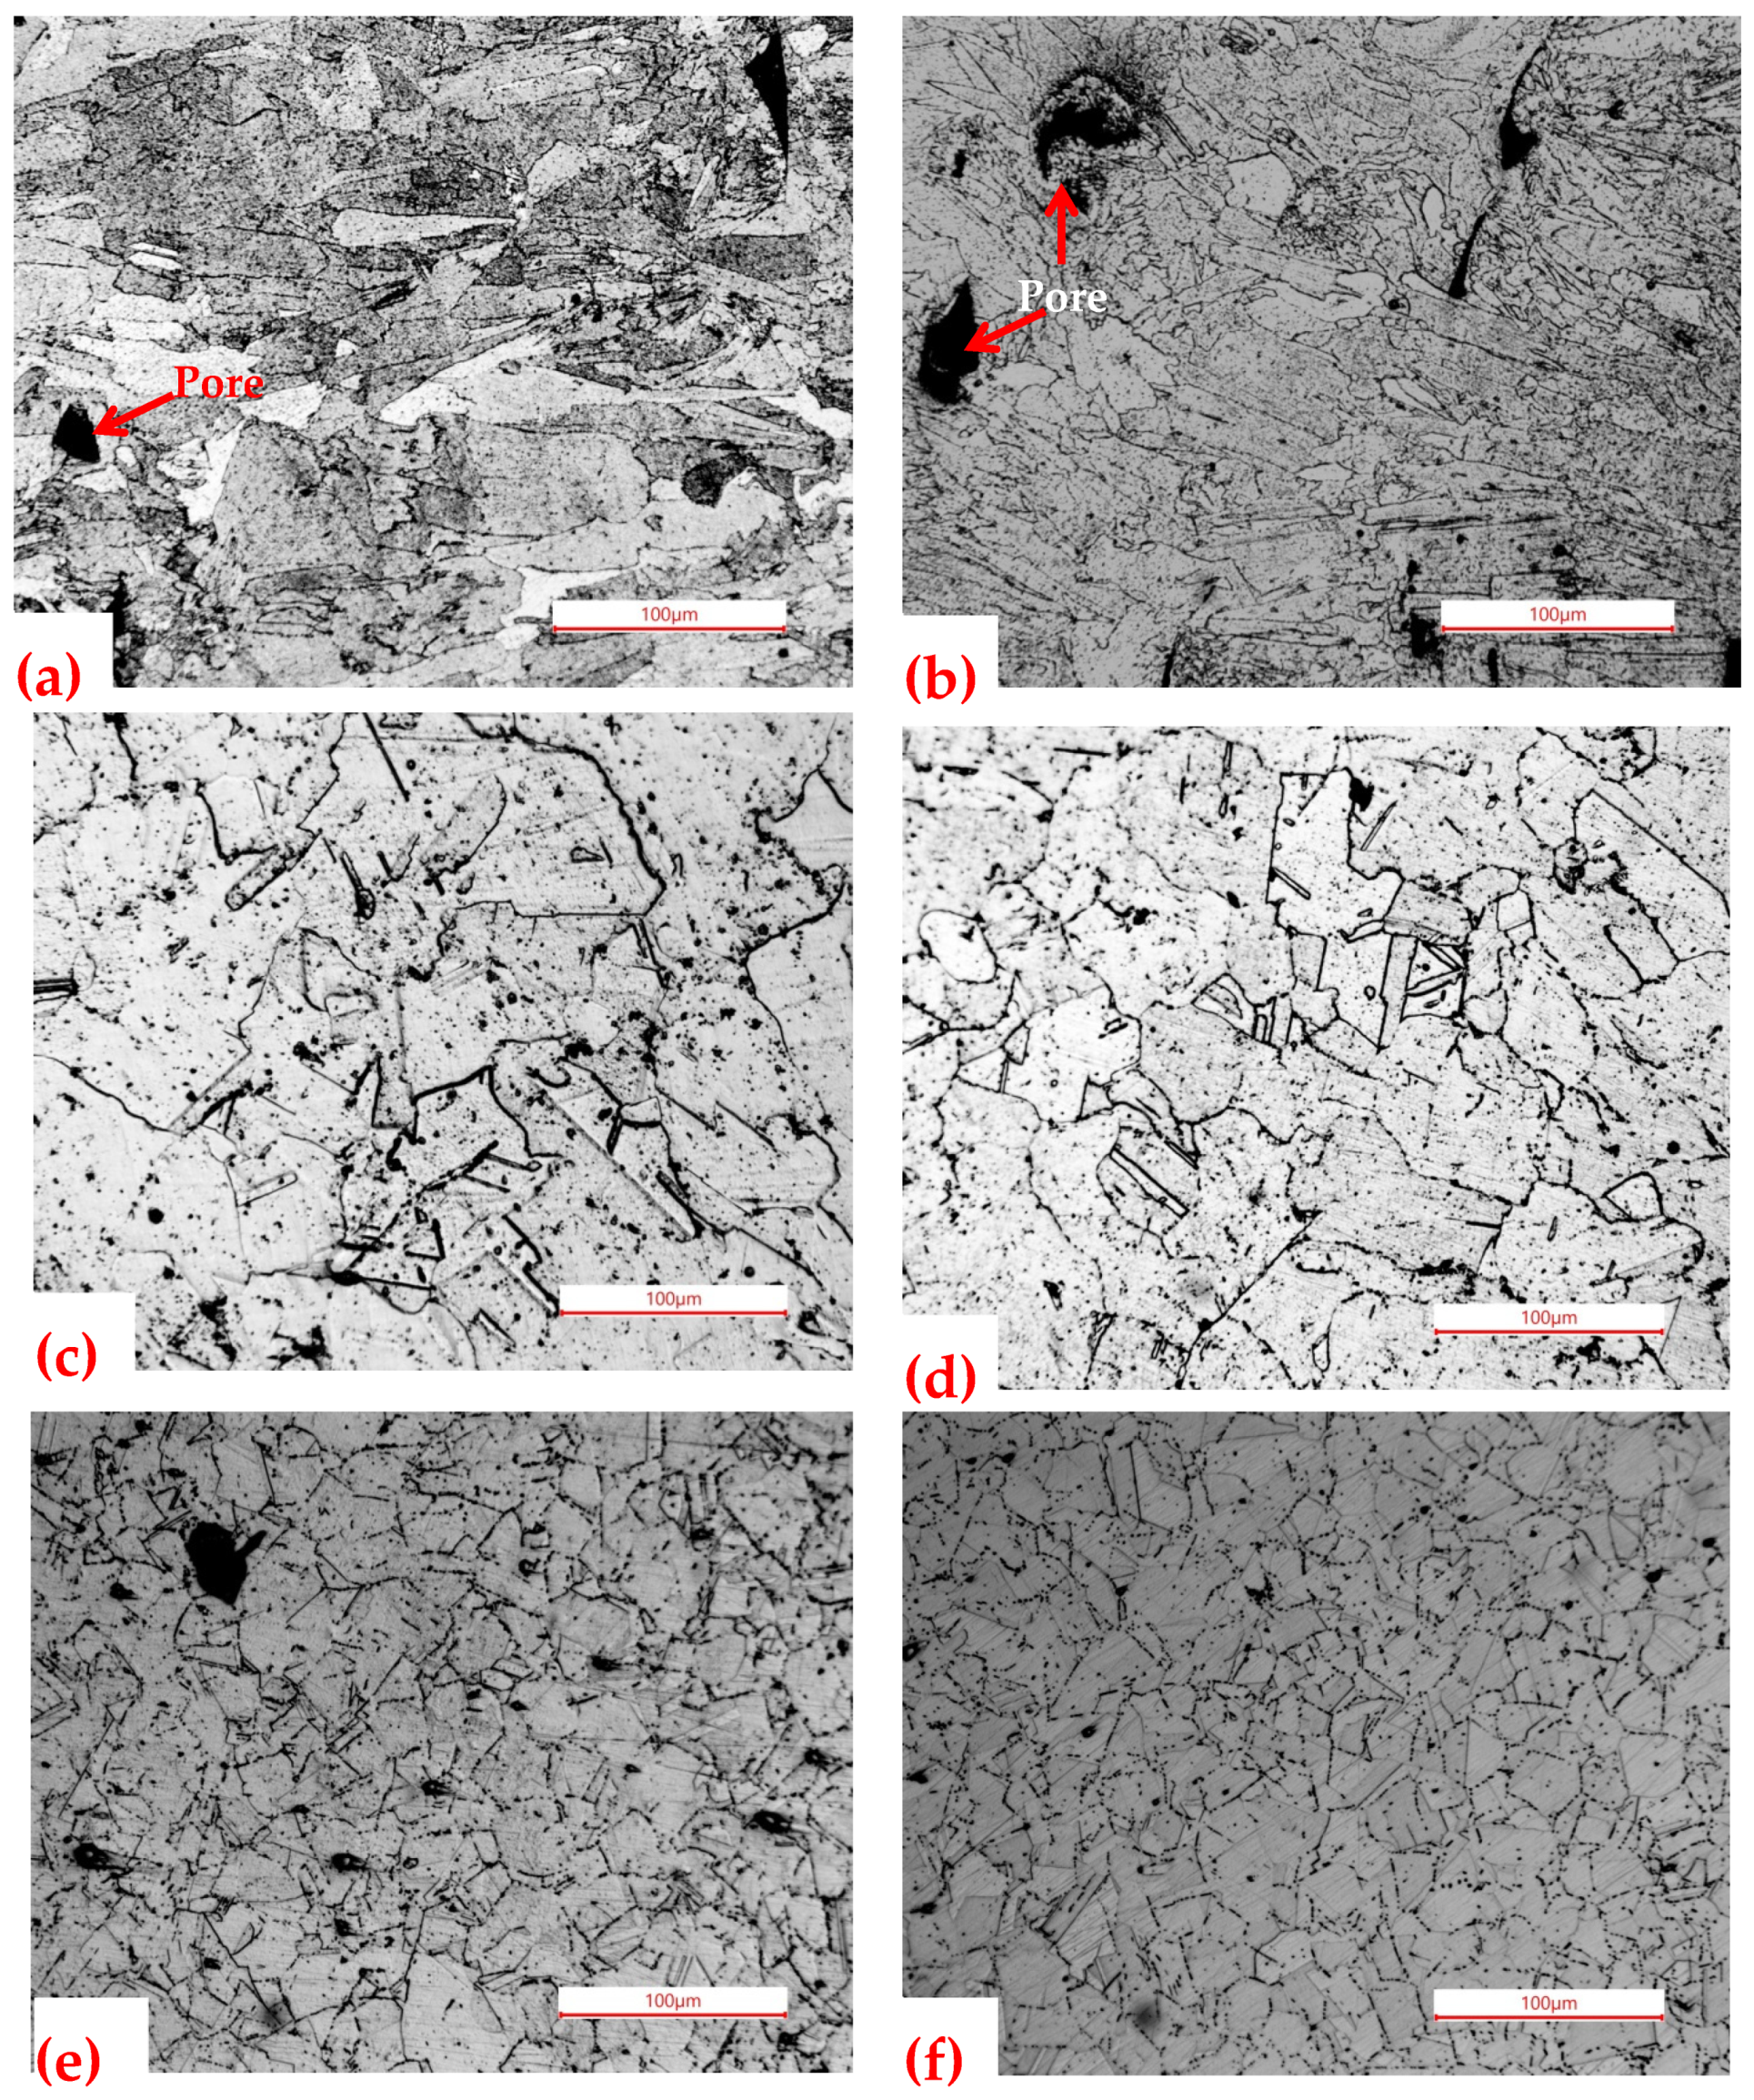
3.1.2. Optical Microstructure

Figure 2a–f shows the optical microstructures of the SLM IN718 specimens and wrought materials in the different heat-treated conditions. Of note, the as-printed (AS-AM) material revealed a columnar dendritic structure and the presence of discrete porosities. Table 2 summarizes the grain size and hardness of the specimens.
The AS-AM material showed an ASTM grain size number of 9.5 (predominantly representing the dimension in the transverse direction of columnar grains) and a porosity level of about 3 vol%. The average hardness was 420 VHN (Vickers hardness number or kgf/mm2) and increased after heat treatment. Heat treatment did not significantly alter either the grain size or porosity level, and the dendritic morphology was not affected by the 980 °C solution annealing treatment (Figure 2b). In addition, the average grain size did not change significantly after the heat treatment. After hot isostatic pressing, the dendritic structure disappeared, and an equiaxed grain structure appeared, as seen in Figure 2c. The grain size increased after HIPing (ASTM number 8), and annealing twins were seen. HIPing also decreased the porosity level from 3% to about 0.7% and resulted in a lower hardness than that of AS-AM. Heat treatment of the AM-HIP specimens (solution annealing at 980 °C followed by two-step aging treatment) increased the hardness, caused deeper etching of the grains (Figure 2d), and marginally increased the grain size. Figure 2e,f shows the microstructures of the wrought material before and after heat treatment. The wrought material in the as-received condition showed the lowest hardness, and the heat-treated wrought material showed the highest hardness among the investigated materials. The grain size of the wrought material was also comparable to the additively manufactured samples and an extensive network of grain boundary precipitates could be seen on the heat-treated wrought material, whereas the as-received material showed discrete grain boundary precipitates. The as-received wrought microstructure also showed a distribution of hard secondary phase particles that are possibly MC and M6C carbides. Even though the reported silicon content of the wrought material is <0.1%, the presence of M6C cannot be ruled out due to a decrease in the number density of secondary phase particles after solution treatment.

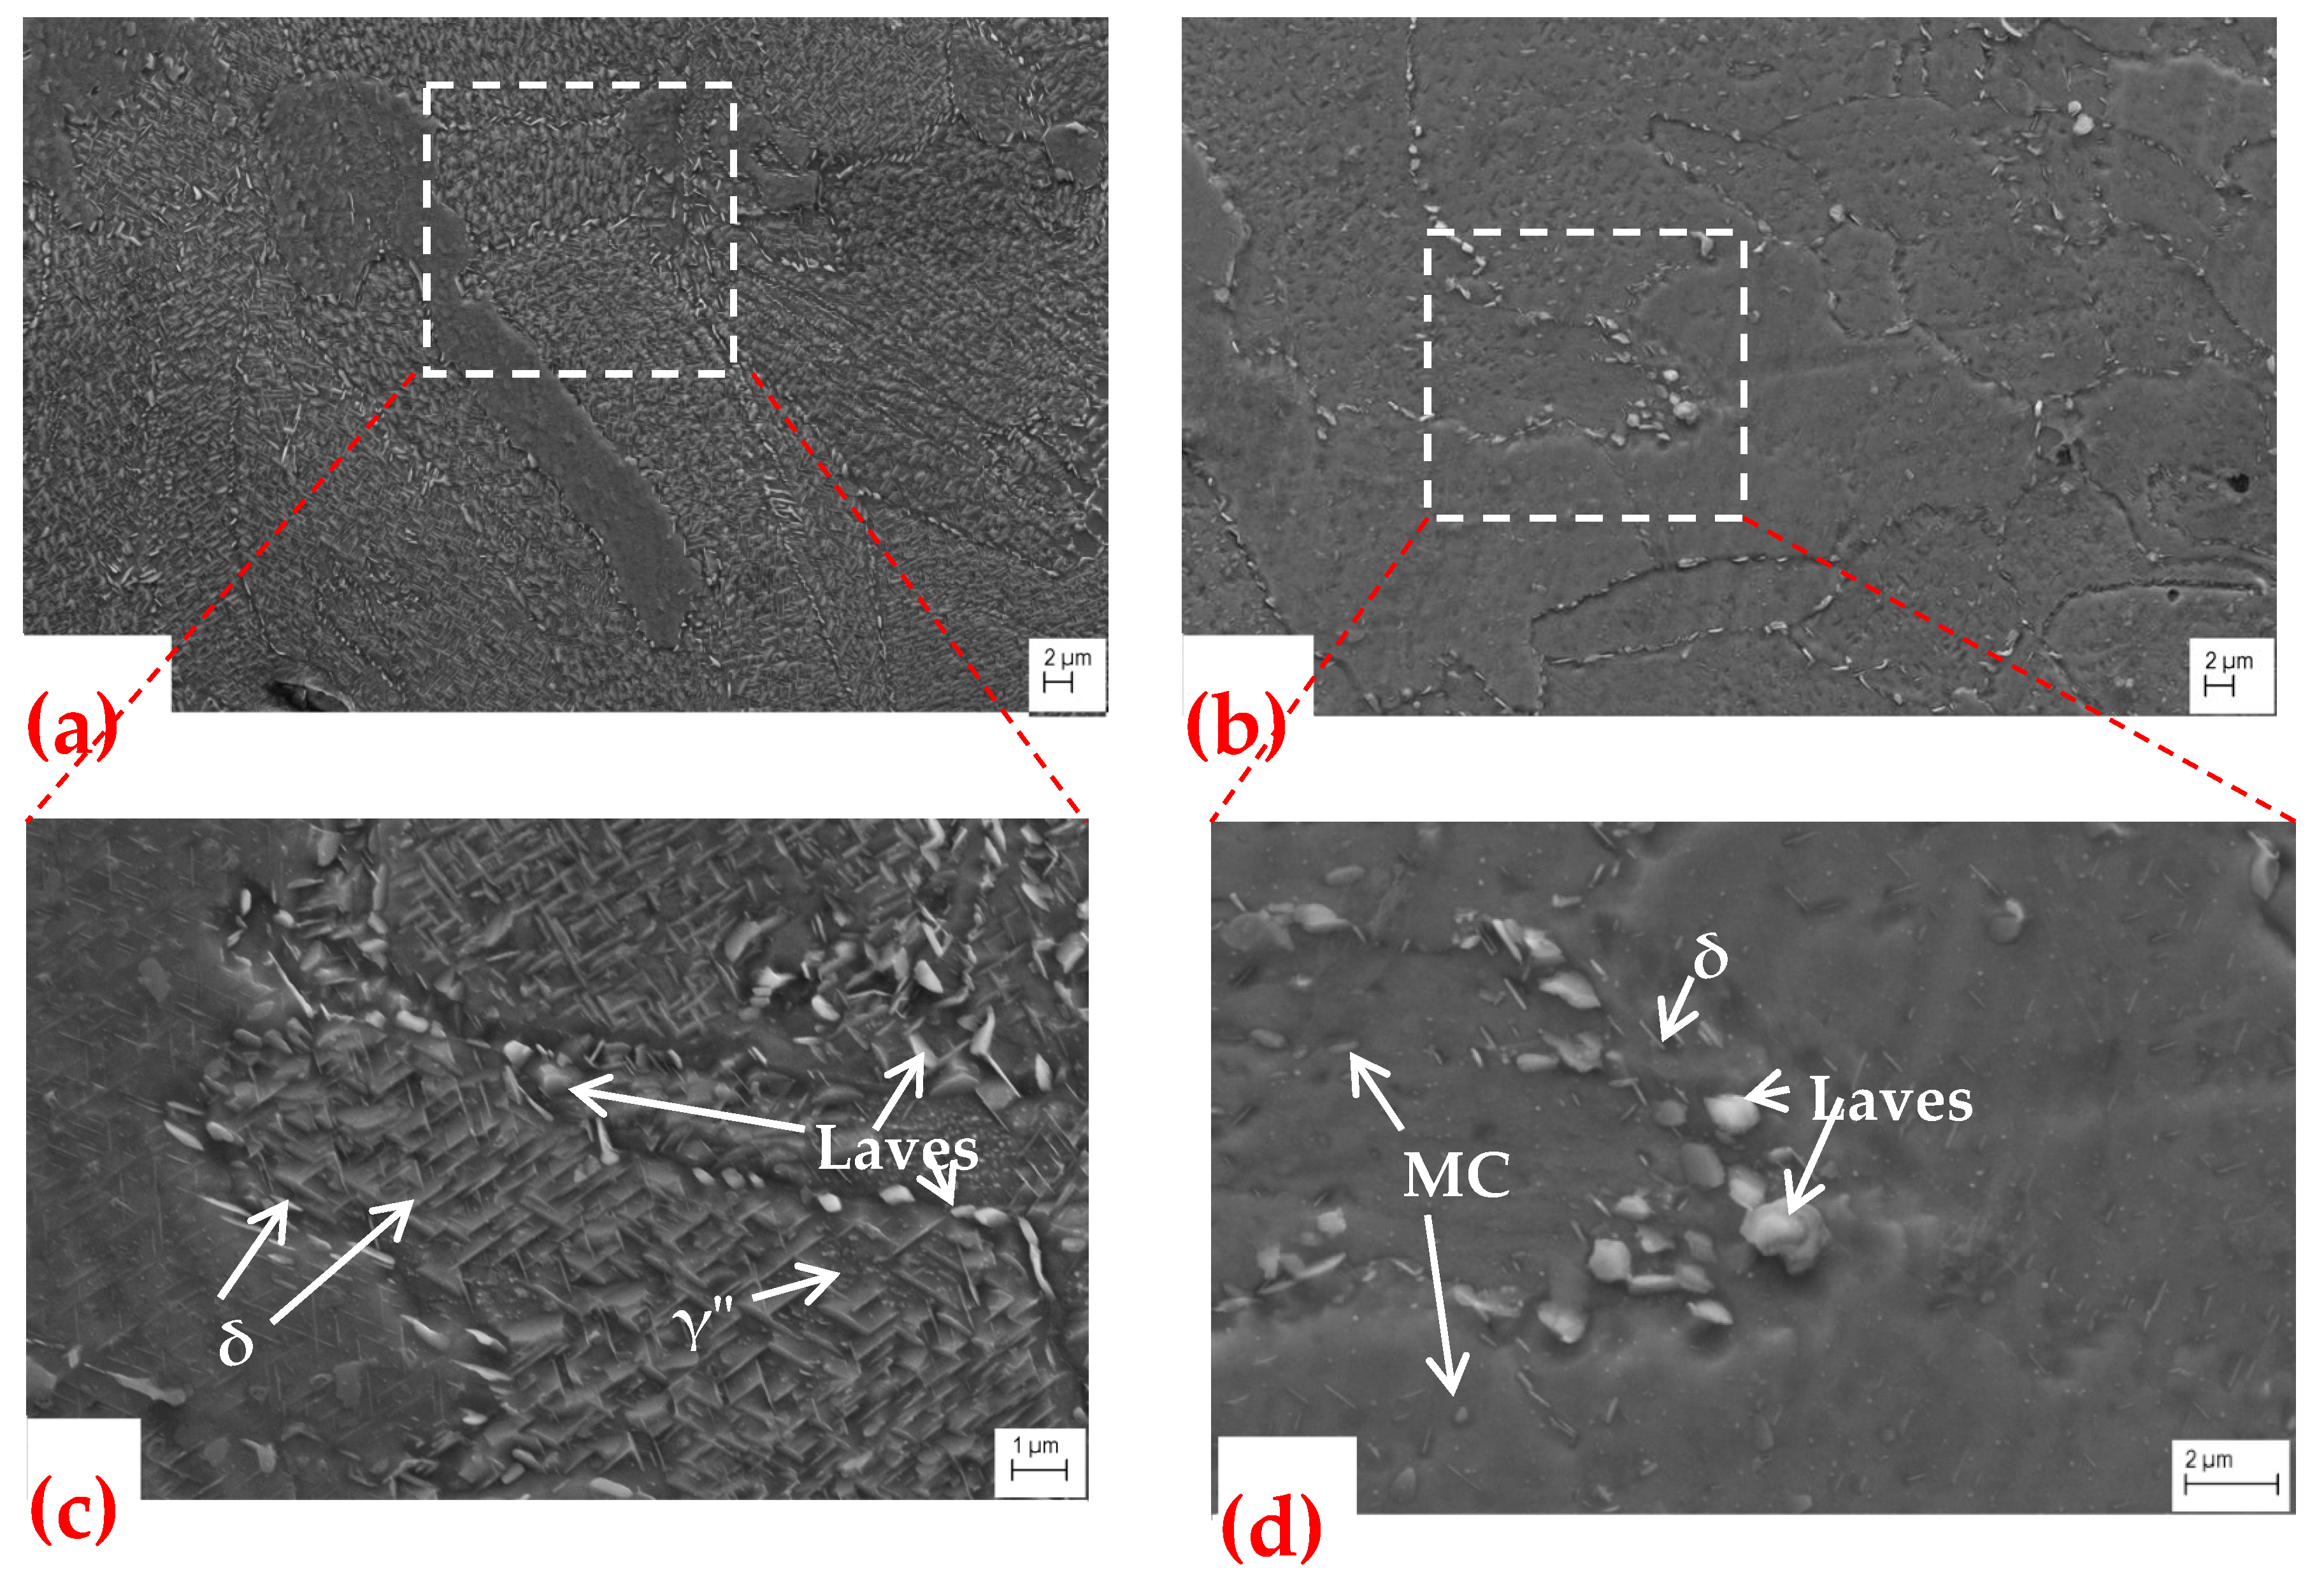
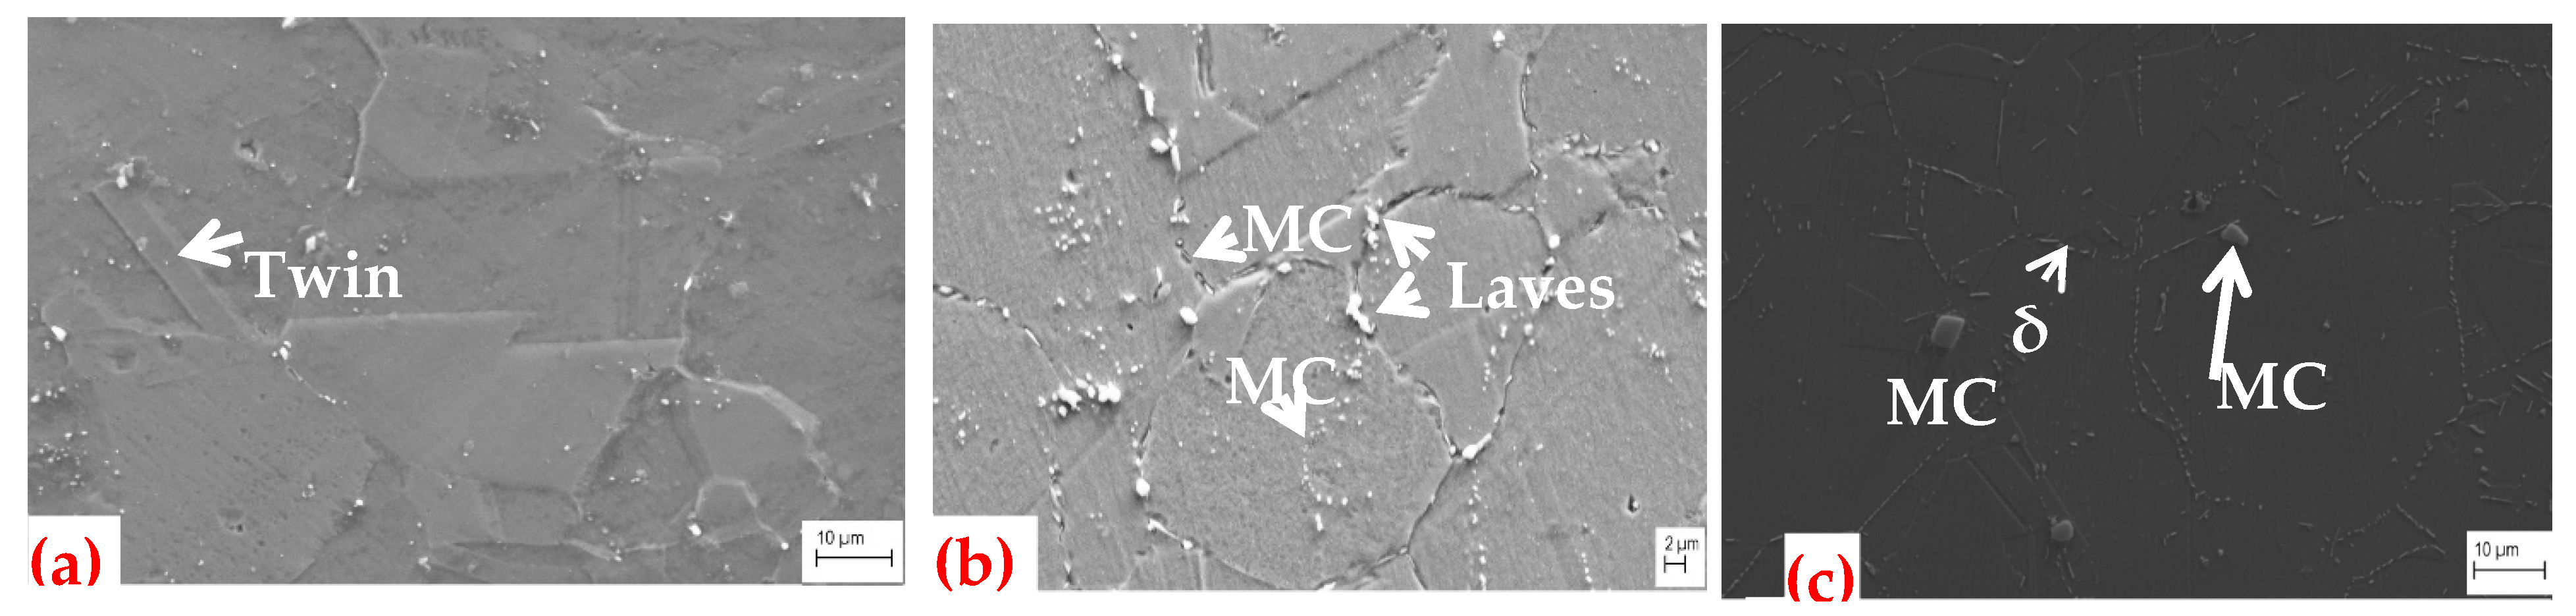
3.1.3. SEM Microstructures

Figure 3a,b shows the SEM images of the microstructures of the AS-AM and AS-AM (HT) specimens, respectively, and Figure 3c,d displays the respective images in zoomed-in detail, revealing an extensive network of needle-like δ phase inside the dendrite core and block-like Laves phase particles along the dendrite boundaries. The presence of other secondary phases such as γ″ and MC carbides in the γ matrix could be observed at higher magnifications. The fraction of the δ phase decreased considerably after heat treatment, as seen in Figure 3b,d. The solution treatment was carried out at a lower temperature (980 °C) than the solvus temperature of the δ phase (995 °C); therefore, the δ-phase needles at the grain boundaries were still present. Alternately, the grain boundary δ-phase needles could have formed around the partially dissolved Laves phase during the two-step aging treatment. Figure 4a shows the SEM image of the microstructure of the AM-HIP specimen. The hot isostatic pressing caused a complete dissolution of the undesirable phases (Laves and δ). The discrete particles inside the grains were identified by energy dispersive analysis (results not shown) as MC particles enriched in Nb. Figure 4b shows the microstructure of the HIPed specimen after heat treatment. After the two-step aging treatment, the precipitation of discrete Laves phase particles along the grain boundaries was observed and the regions adjacent to grain boundary precipitates were etched preferentially. Figure 4c displays the SEM image of the as-received wrought material and shows MC-type carbides present inside the grains and that the equiaxed grain boundaries contained discrete δ-phase micro-rods. No Laves phase was observed in the wrought material.

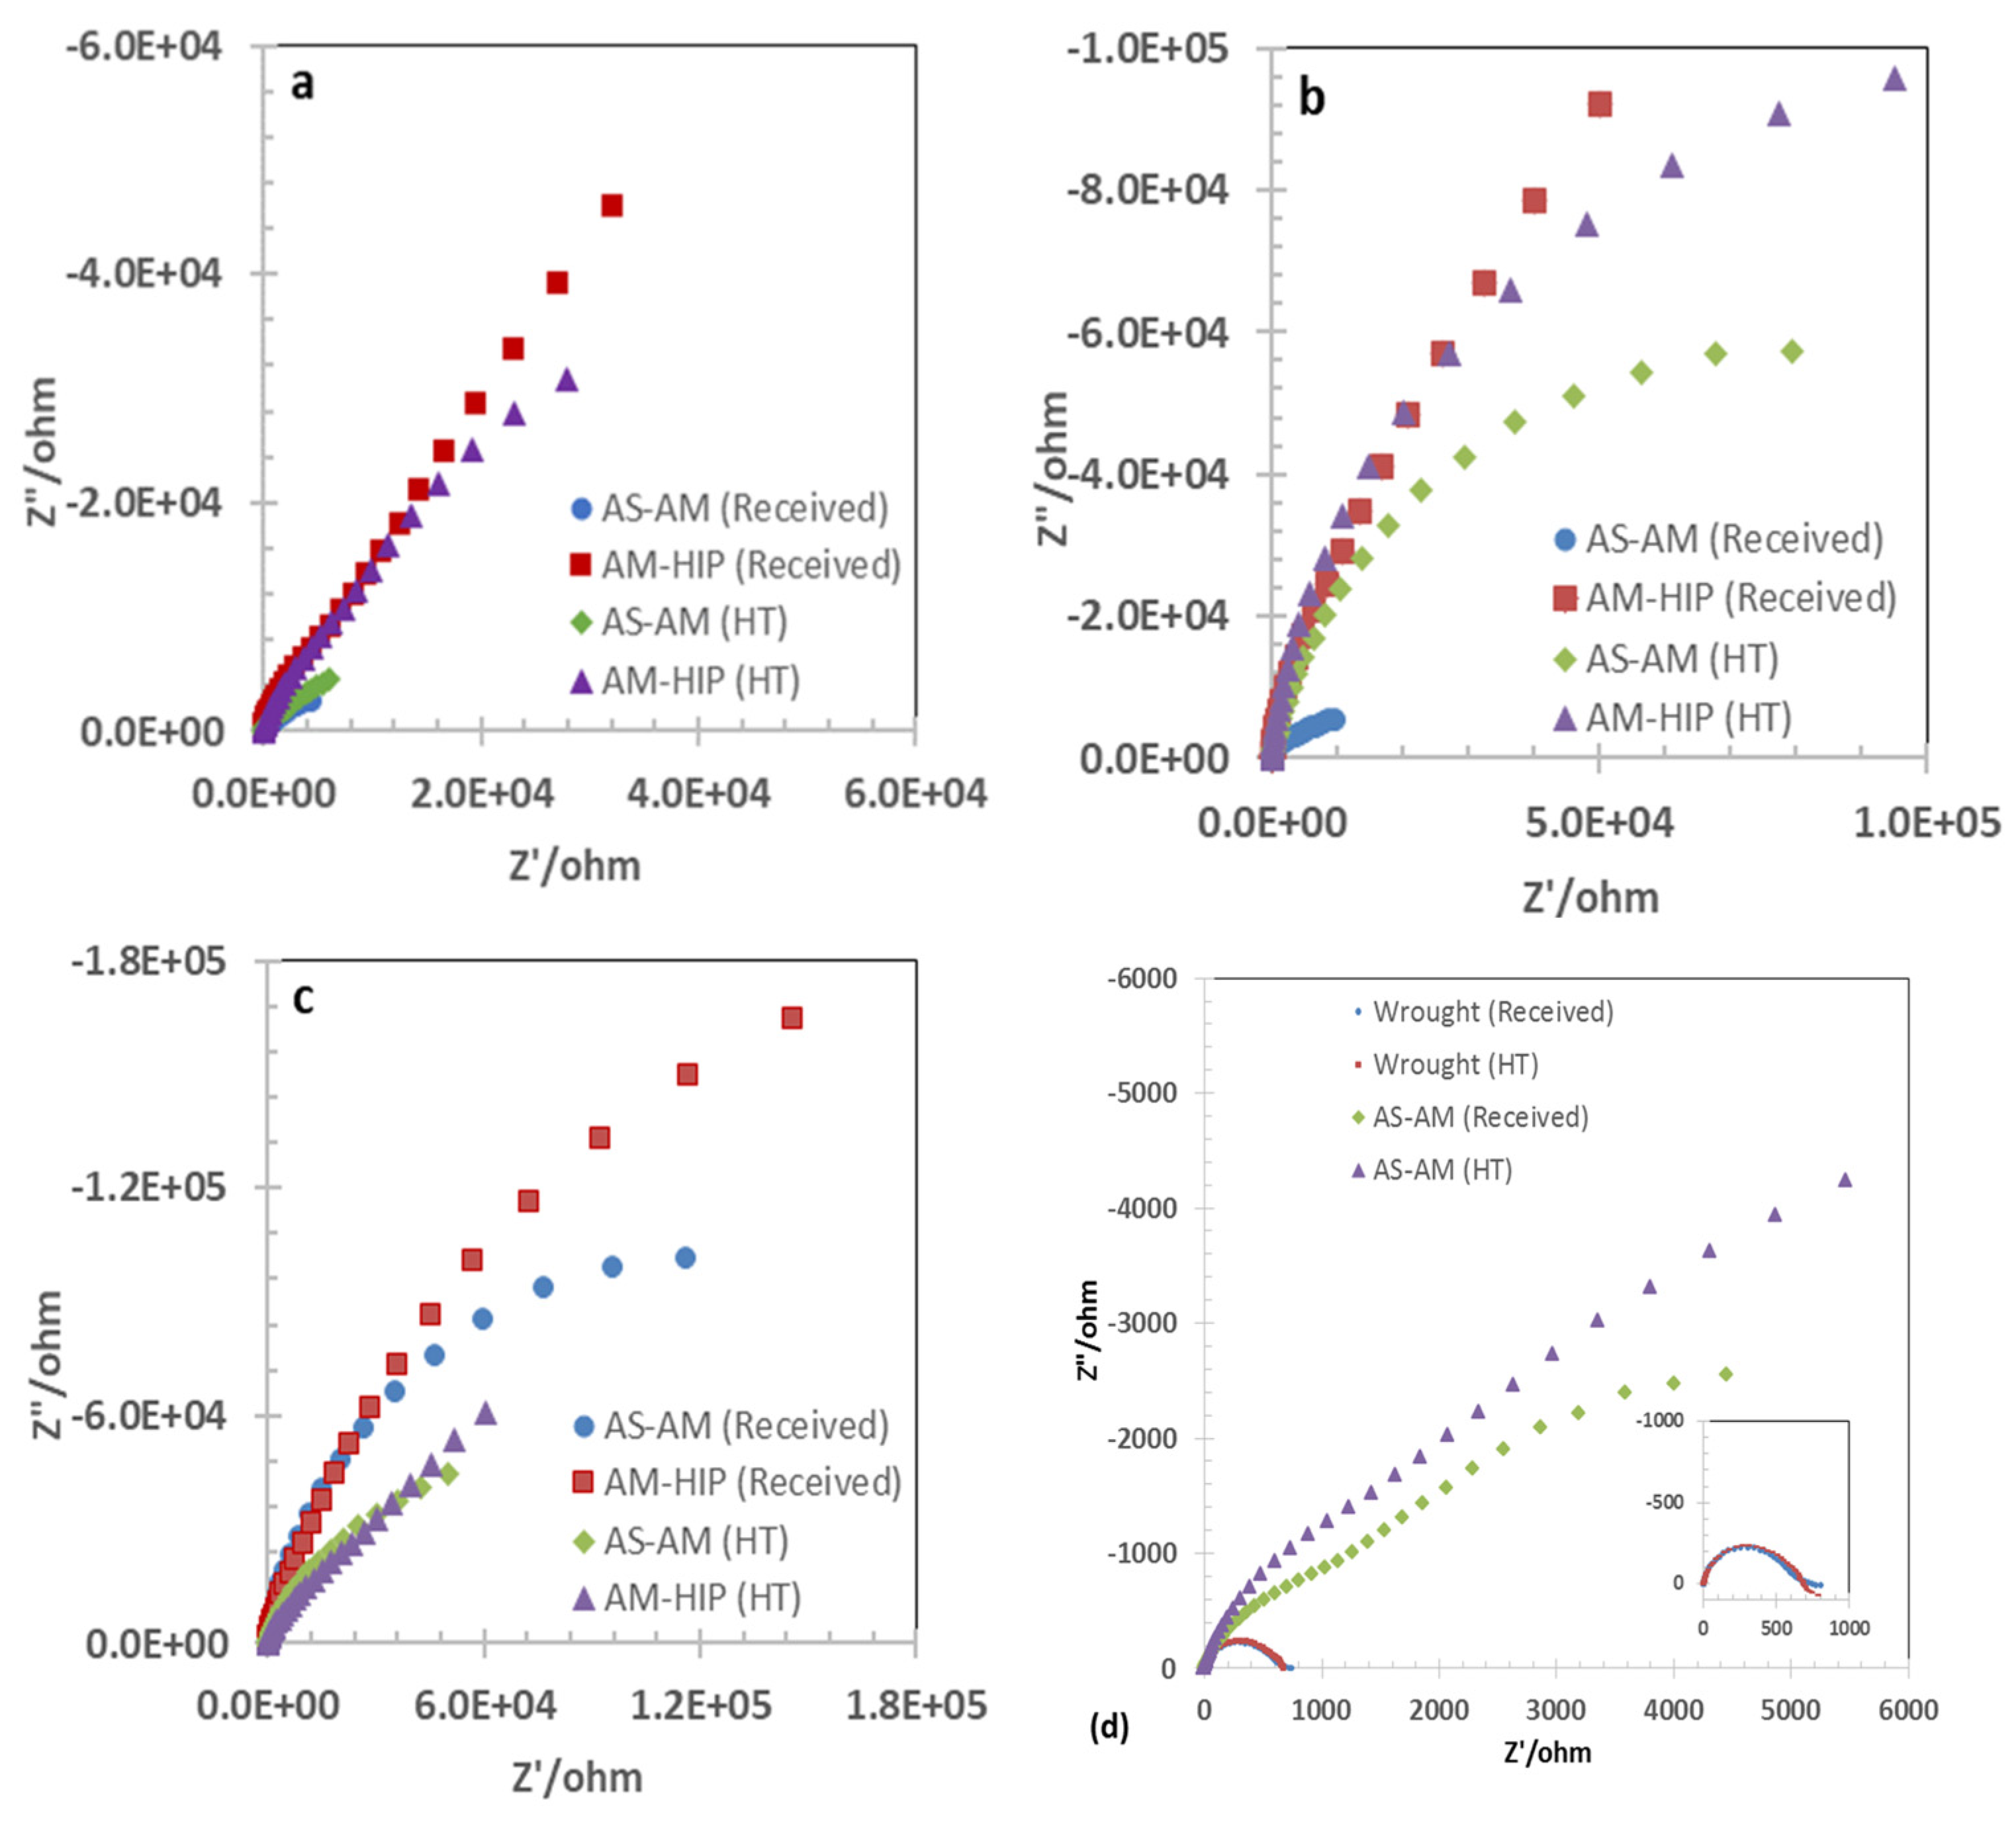
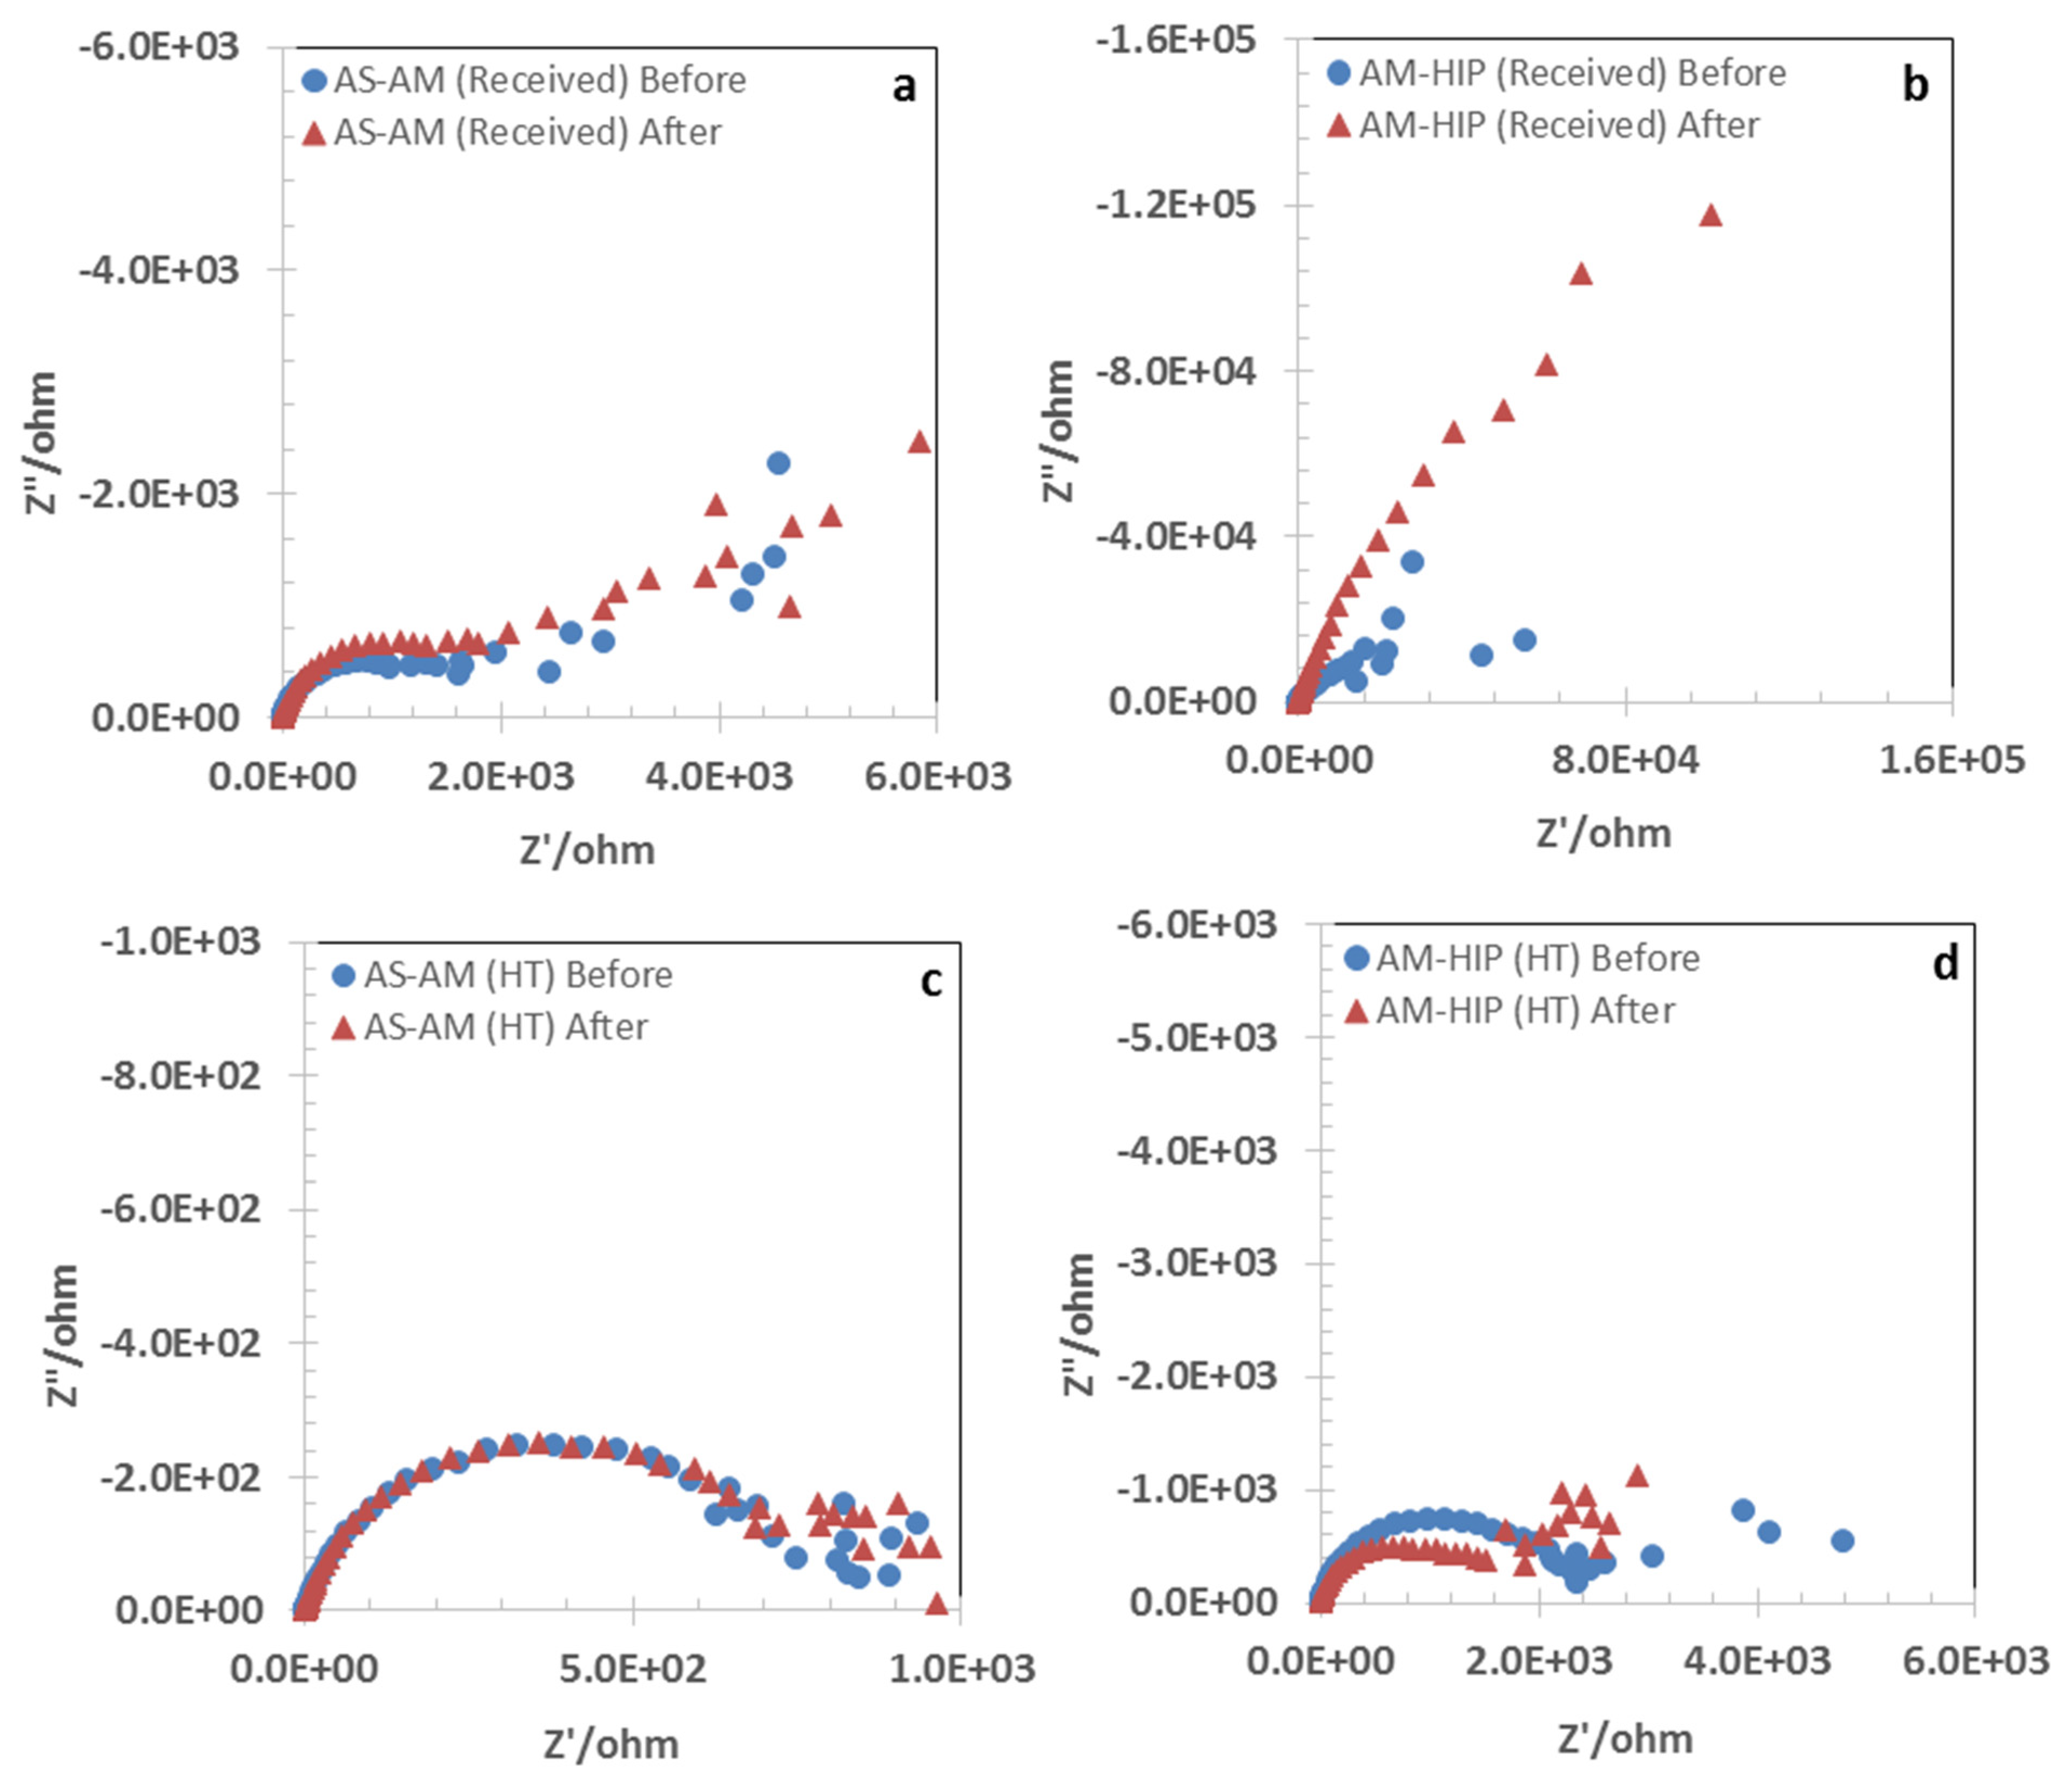
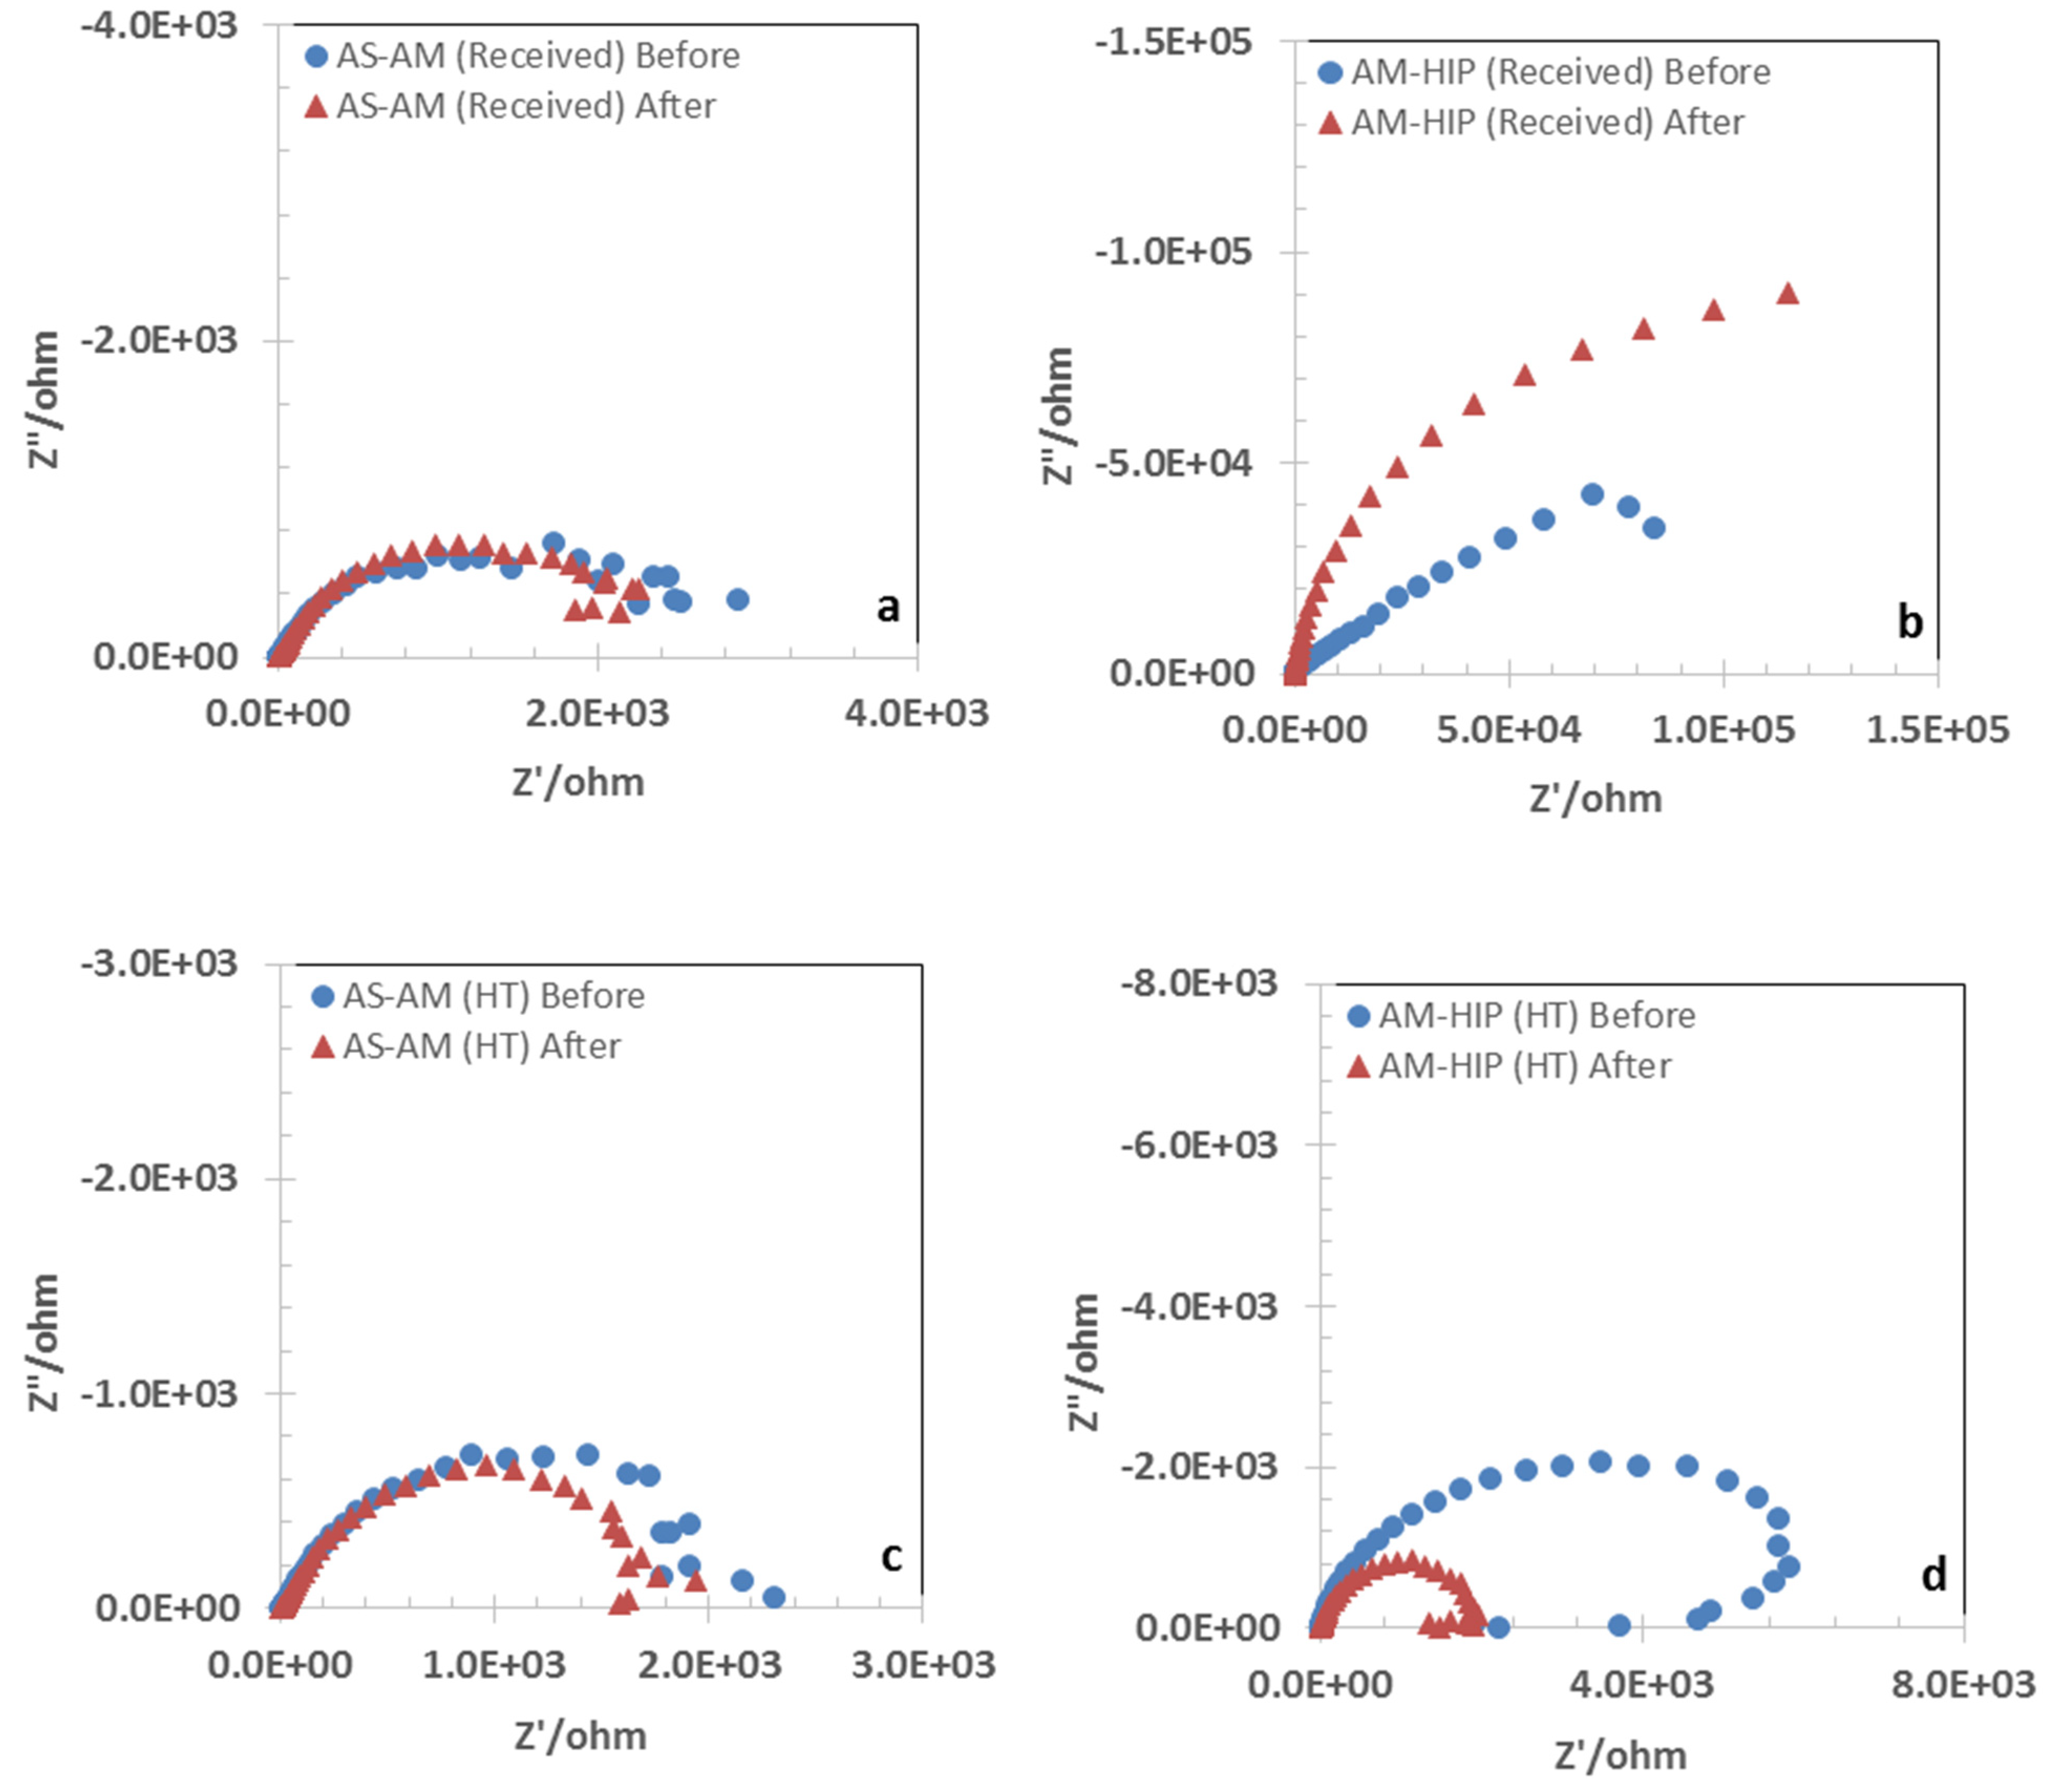
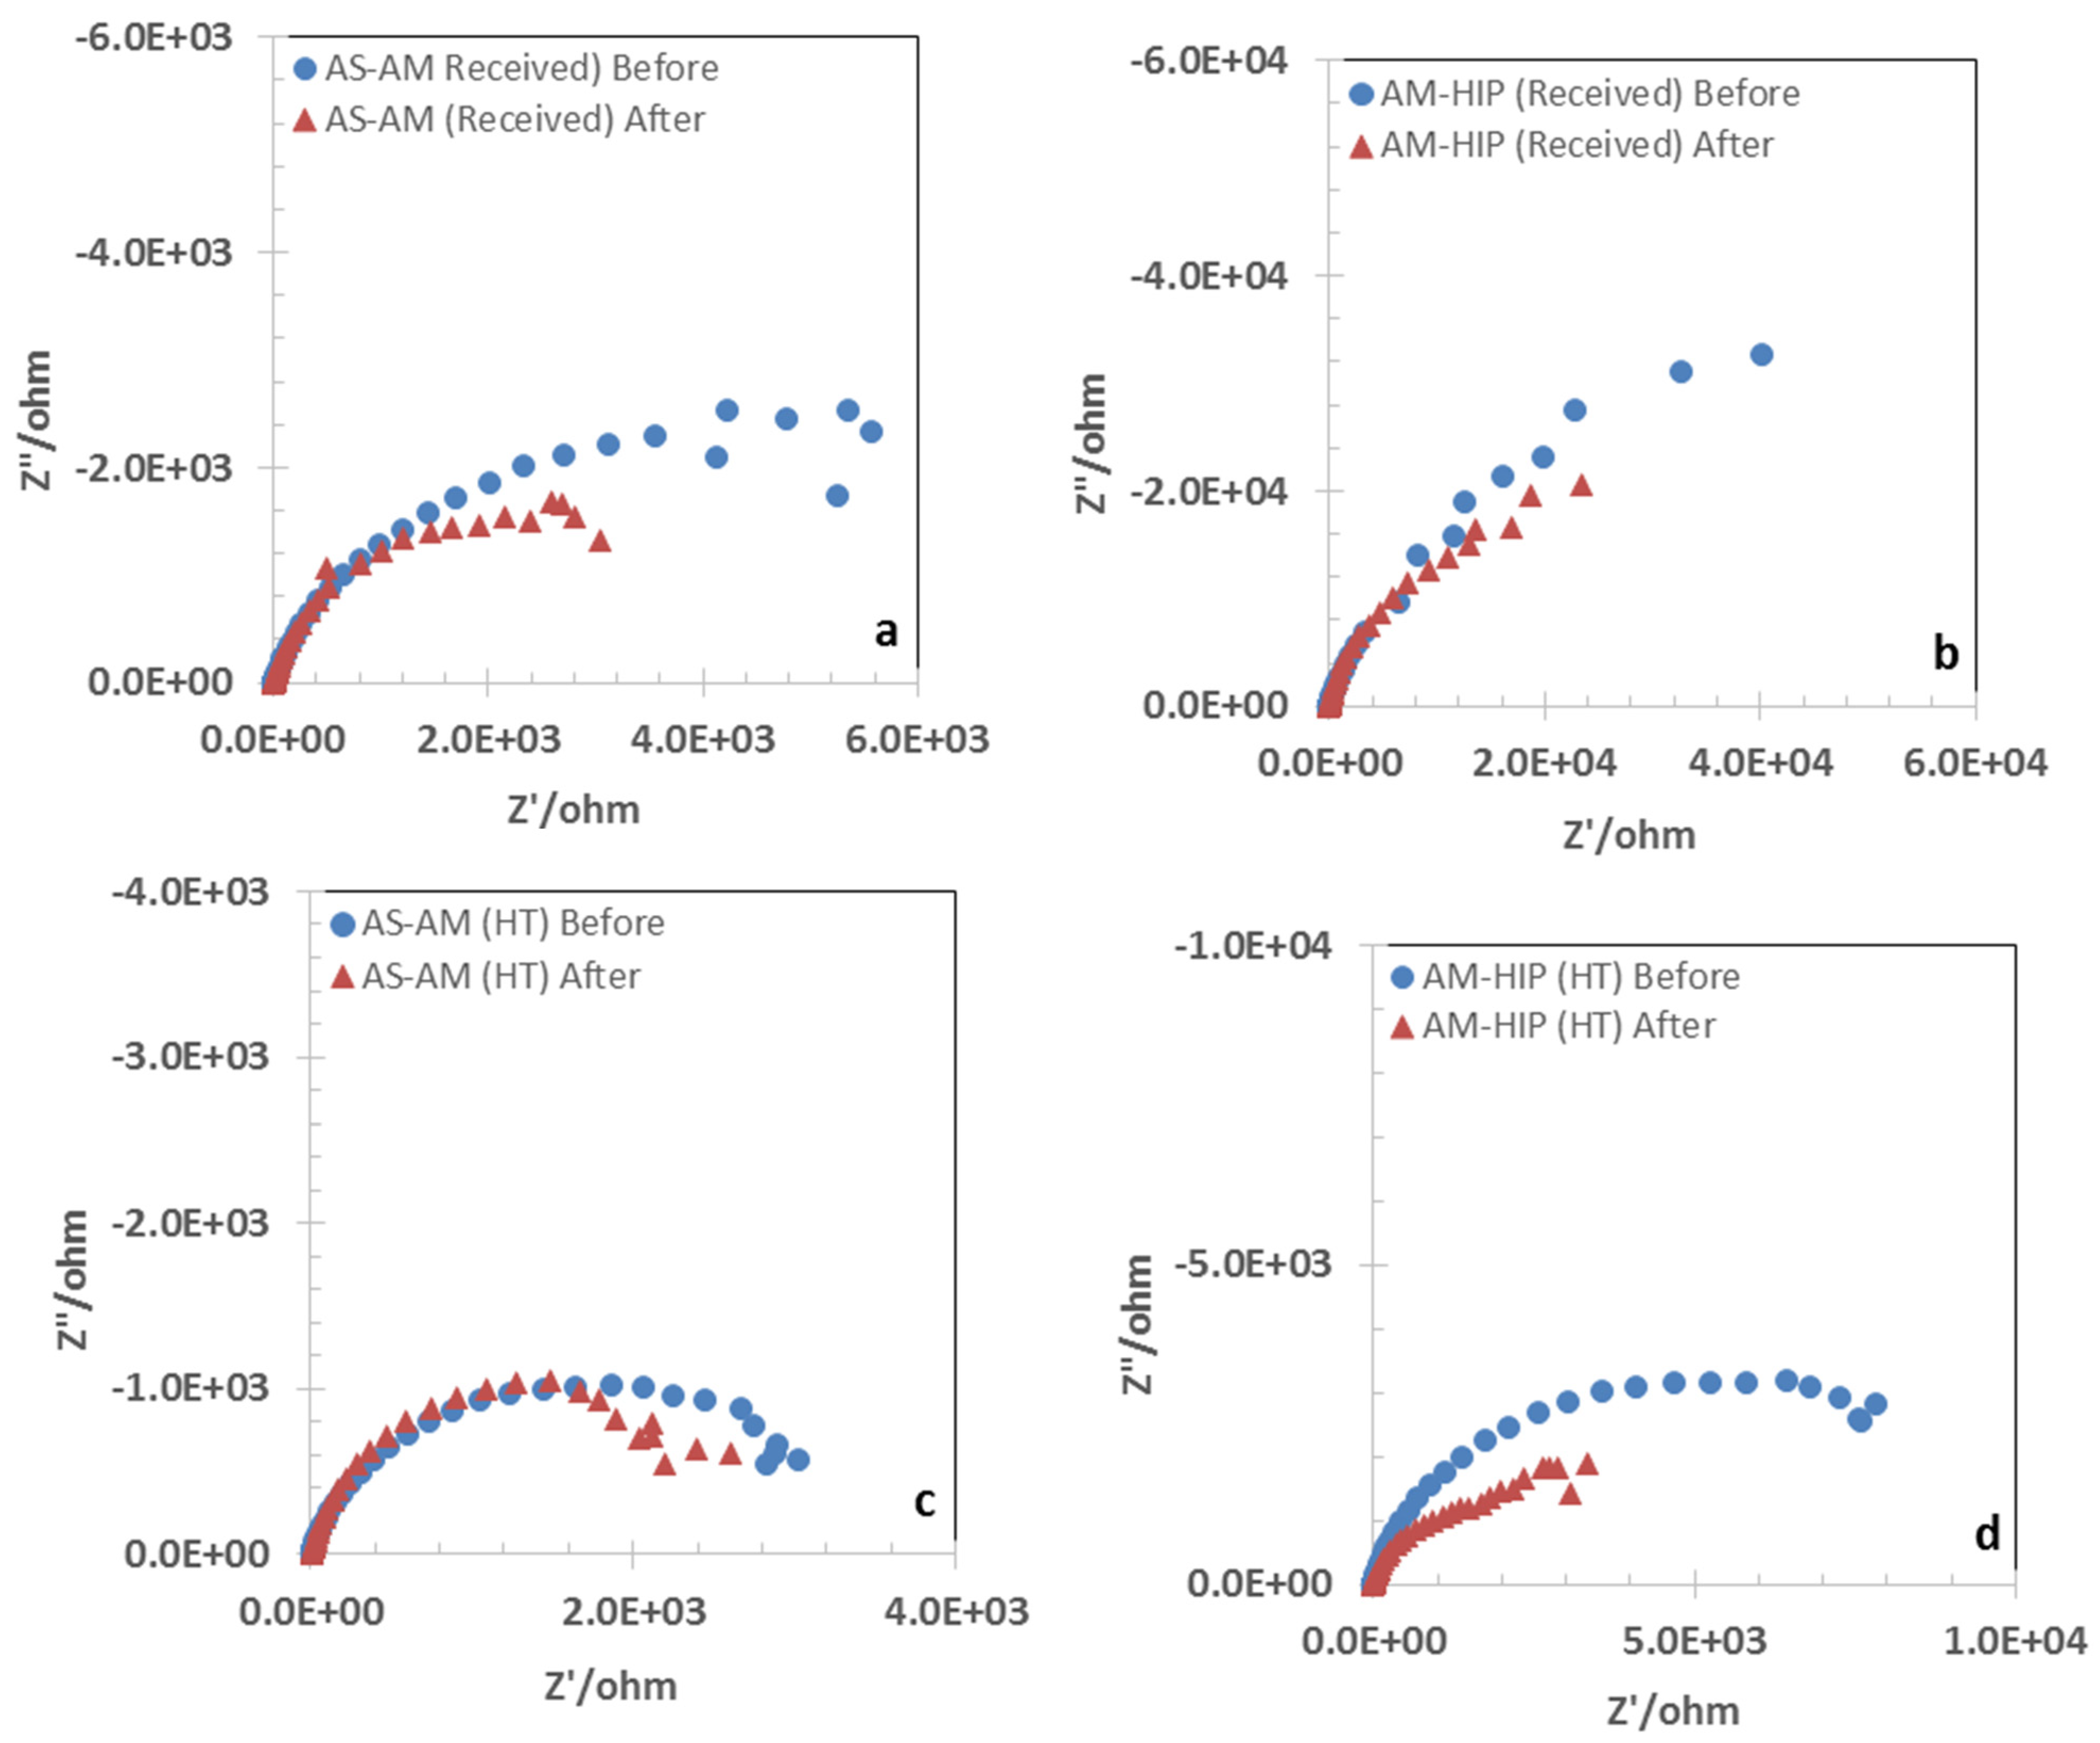
3.2. Open Circuit Potential and Impedance

Figure 5a–d shows the open circuit potential (OCP) of the IN718 specimens at different pH conditions as a function of time. The OCP is determined by the mixed potentials of anodic and cathodic reactions in which the anodic reaction is the dissolution of IN718 constituents, and the cathodic reactions are the reduction of dissolved oxygen (oxygen reduction reaction, ORR) and the hydrogen evolution reaction (HER). The solution was not deaerated; therefore, the ORR will be predominant in the neutral and alkaline solutions and HER will be predominant in the acidic environment. The OCP of the AS-AM and AS-AM (HT) specimens decreased with time, while the OCP of HIPed specimens increased initially and stabilized after about 20 min in an acidic chloride solution, as seen in Figure 5a. The IN718 contains about 18% Cr, which forms a Cr-rich oxide film on the surface in the air [39]. Thickening of this air-formed surface film, when immersed in the electrolyte, would increase the OCP as a function of time, provided that the activity of the cathodic reaction remains the same (when the cathodic Tafel slope is time-invariant). On the other hand, if the surface film dissolves, the OCP would decrease. The decrease in the OCP with time for the as-printed (AS-AM) and AS-AM (HT) specimens indicated that the air-formed film on these materials was not stable in the acidic pH solution. The HIPed specimens showed an increase in the OCP, indicating a possible thickening of the passive film during the initial exposure time, and reaching a steady state condition after 20 min. The AM-HIP (HT) exhibited a more noble OCP than the AM-HIP. Figure 5d shows the OCP of wrought materials in the acidic environment, and the continuous increase in the OCP indicates a possible thickening of the surface layer on these specimens. In the acidic chloride solution, the SLM specimens showed nobler OCP values than the wrought specimens, indicating a lower susceptibility to corrosion. The SLM specimens exhibited a plateau OCP profile in the neutral chloride solution, as seen in Figure 5b. The OCP trend in the neutral solution was similar to that observed in the acidic solution, and the HIPed specimens were more noble than the as-printed ones. Figure 5c shows the OCP profile in the alkaline chloride solution. Here, the OCP increased with time, indicating a possible thickening of the surface layer over time. Interestingly, both the AS-AM (HT) and AS-AM specimens showed more noble OCPs in the alkaline solution than in the HIPed specimens. This could possibly be attributed to the dissolution of the Laves and δ phases and reprecipitation at the surface. Table 3 summarizes the electrochemical test results, including the linear polarization resistance values of the specimens. A higher polarization resistance indicates greater corrosion resistance.
The AM-HIP specimens showed higher polarization resistance than the other specimens in all pH conditions. The AS-AM showed relatively high polarization resistance in the neutral and alkaline chloride solutions, and the wrought materials showed the lowest linear polarization resistance in the acidic chloride solution. In general, the SLM specimens showed better corrosion resistance than the wrought materials under the given test conditions. This could be attributed to the secondary phase precipitates (δ phase) on the grain boundaries of the wrought material.
Figure 6a–c shows the EIS results in the form of Nyquist plots of the SLM specimens at open circuit potential in different pH chloride solutions. Figure 6d compares the EIS data of the SLM and wrought materials in the acidic chloride solution. The EIS trend is similar to the linear polarization resistance. The wrought materials showed the least impedance. SLM AS-AM samples showed higher impedance than the wrought as-received specimens. The impedance spectra of the wrought materials showed a single time constant, whereas the spectra of SLM specimens could be fitted into a double time constant electrical equivalent circuit model. For brevity, the electrical equivalent circuit results are not presented here. The Nyquist plots are qualitatively discussed based on the diameter of the Nyquist plot’s semicircle. A diffusion-controlled Warburg behavior could be observed for the passive film of the AM-HIP (received) specimen that showed the highest impedance in the acidic chloride solution. As seen in Figure 6a,b, the impedance of the specimens followed the following order: AM-HIP > AM-HIP (HT) > AS-AM (HT) > AS-AM both in the acidic and neutral chloride solutions. This observation indicated that the Laves and δ phases in the material determined the general corrosion resistance as discussed earlier. The higher the content of Laves and δ phases, the lower the corrosion resistance in the pH 1.25 and 6.25 solutions. The impedance ranking was different in the alkaline solution and the AM-HIP specimen also showed the highest impedance. The ranking of impedance was AM-HIP > AS-AM > AM-HIP (HT) > AS-AM (HT). The higher impedance of the AS-AM could be a result of the formation of a re-precipitated surface layer after quickly reaching a supersaturation of the dissolved products. The presence of porosity could have also played a role. More analysis is required to support this reasoning.

3.3. Cyclic Polarization

Figure 7a–d illustrates the cyclic polarization (CP) behaviors of the SLM and wrought IN718 materials in chloride solutions of different pH conditions and Table 3 summarizes the cyclic polarization results. The major data derived from the CP tests are the passivation current density (ip), transpassive potential (ETP), and pitting protection potential (EPP). An effective corrosion resistance is characterized by a low passivation current density, high (or more positive) ETP, and high EPP. As discussed in the experimental section, the ETP could indicate either a breakdown potential of the passive film or simply the take-off potential of the oxygen evolution reaction (OER). Figure 7a shows the cyclic polarization of the SLM specimens in the acidic chloride solution. The AM-HIP showed the lowest passivation current density. Figure 7d compares the cyclic polarization behavior of wrought materials with that of the SLM specimens in the acidic chloride solution. The wrought materials showed a passivation current density two orders of magnitude higher than the SLM counterparts. The transpassive potentials ranged from 0.92 to 1.0 VAg/AgCl. The redox potential of the oxygen evolution reaction (OER) in pH 1.25 is 0.96 VAg/AgCl. Considering that an over potential is required for driving the OER, it is noted that the transpassivity observed in the acidic chloride solution is due to passive film breakdown and not due to the OER. The ‘positive’ hysteresis (cross-over of the reverse scan at a potential more negative than the ETP) of the CP plot observed during the reverse scan also supports the claim of passivity breakdown. The area of the hysteresis loop gives an idea about the ability (energy required) to repassivate the pits grown during the polarization. A smaller area indicates faster repassivation kinetics and better material pitting corrosion resistance. The polarization Figure as given in Figure 7a is crowded and therefore it is difficult to discern the behavior of AS-AM and AS-AM (HT). When closely observed, even though the EPP was recorded at −30 mVAg/AgCl, the reverse scan traced the forward scan very closely, exhibiting a lower hysteresis area. The EPP indicates that if the corrosion potential of the material is maintained below EPP, then there will not be any new pit initiation, and any existing pits will be repassivated. The CP results in the acidic solution indicated that heat treatment detrimentally affected the corrosion resistance of the IN718 specimens. The cyclic polarization of the wrought specimens showed a very high ‘passive’ current density but did not reveal a hysteresis behavior, indicating an absence of pit initiation. The high current density probably did not result in a protective passive film in the acidic chloride solution. The CP result could be correlated with a low linear polarization resistance and low impedance behavior of the wrought 718 material.
Figure 7b shows the CP results in the neutral chloride solution. The redox potential for the OER in pH 6.25 is at about 0.66 VAg/AgCl and the transpassive potentials of the SLM IN718 specimens were in the range of 0.96–1.09 VAg/AgCl. The over potential of 300 mV available for the OER and the shown positive hysteresis behavior indicated that the observed transpassivity could be associated with a passivity breakdown assisted by a possible oxygen evolution reaction, which could occur by the decomposition of the lattice oxygen of the passive film by the following reactions [40]:
4 O2− → 4 O1− + 4e
4 O1− → 2 (O2)2−
2 (O2)2− → 2 O2− + O2
The lattice oxygen evolution mechanism, as suggested above, involves the formation of oxygen vacancies in the passive film and the defects that could lead to the localized corrosion of the material, resulting in the hysteresis of the cyclic polarization. It is noted that the HIPed specimens showed higher transpassive potentials and pitting protection potentials than the as-printed specimens.
The redox potential of OER in the pH 12.25 solution is 0.31 VAg/AgCl and the transpassive potentials of the specimens varied in the range of 0.53–0.58 VAg/AgCl, as noted in Table 3. All the specimens showed a negative hysteresis in the basic solution, clearly indicating that no pitting occurred at this pH. Passive current density also increased after heat treatment. The transpassivity could be ascribed as a general dissolution of the material without any localized corrosion, and the increase in the current between 0.6 and 1.0 VAg/AgCl could be associated with the decomposition of lattice oxygen via Reaction (1). The oxygen evolution occurred without the lattice decomposition at potentials higher than 1 VAg/AgCl, as seen in Figure 7c.

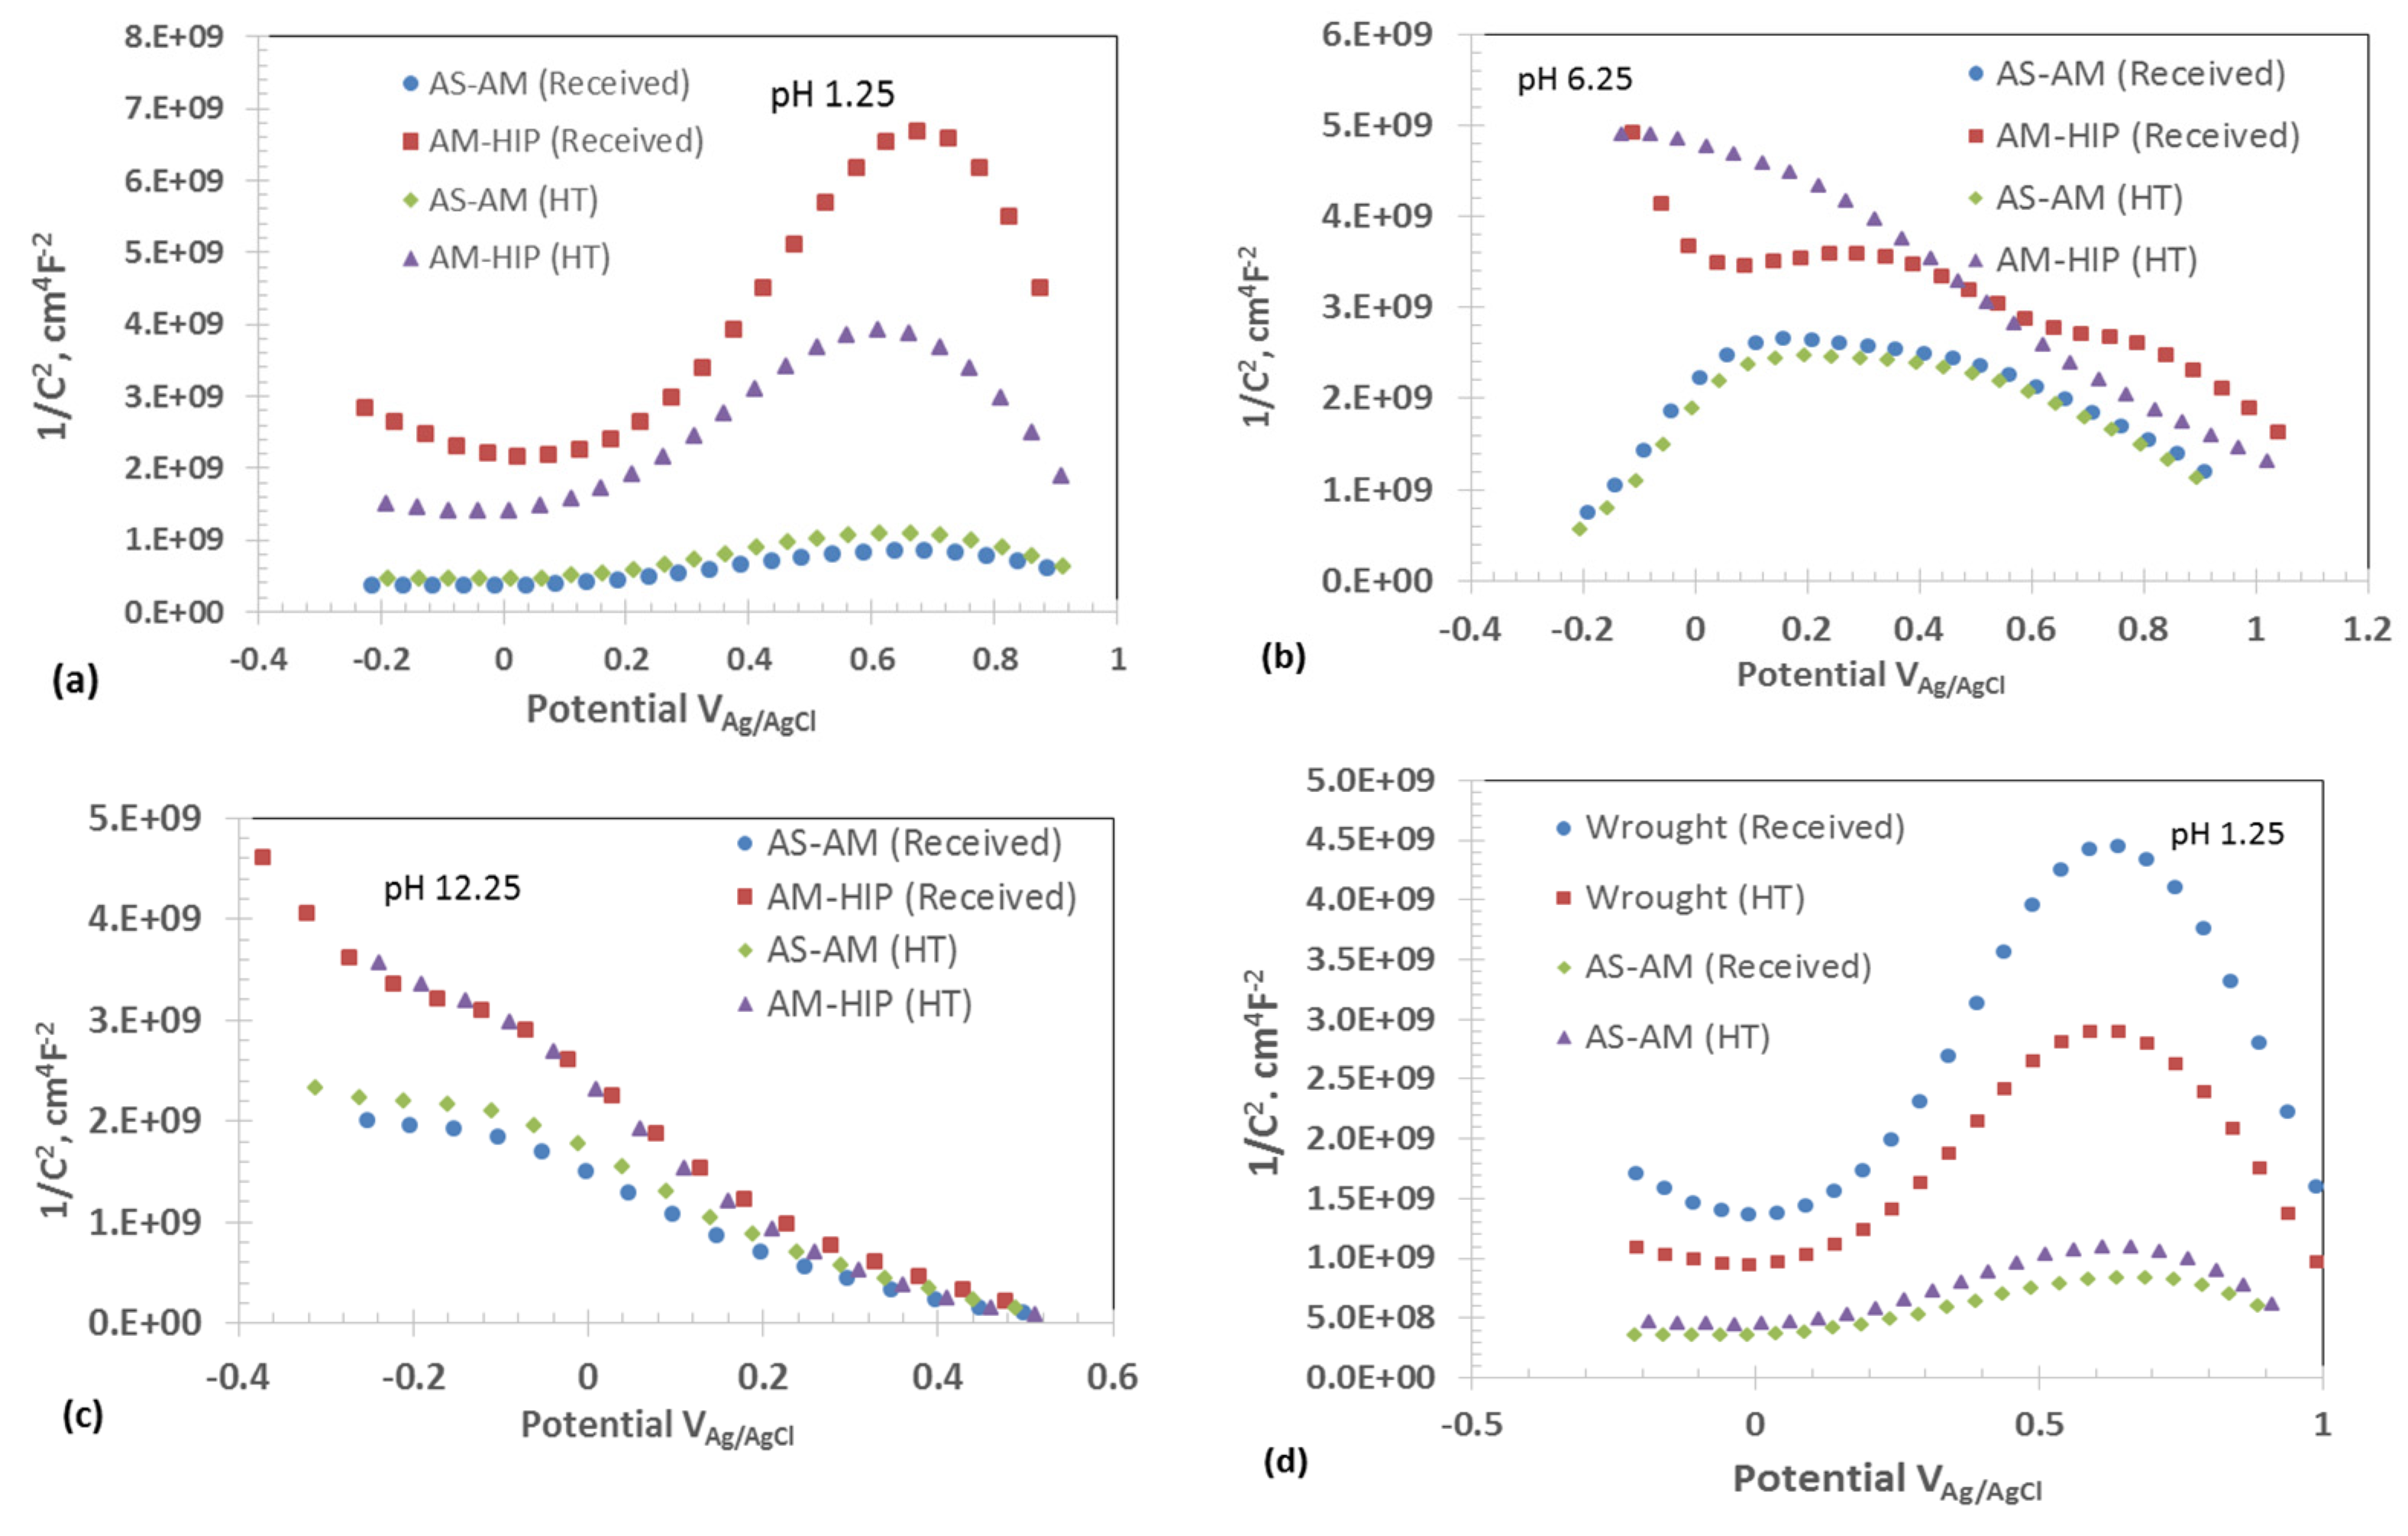
3.4. Potentiostatic Conditioning

Figure 8a–d displays the current density profile as a function of time in a log–log scale. During the potentiostatic conditioning at ETP-50 mV, (where ETP = transpassive potential), the current initially decayed, revealing the formation of a passive layer. The slope of the log i–log t plot gives a general idea about the kinetics of the passive film formation, in which a steeper slope equates to a faster passive film formation. In addition, the smaller the magnitude of current density, the more impervious the passive film will be [31]. Since the applied potential was closer to the transpassive potential, the initial current decay did not continue for long. After a certain amount of time, the current decay ceased and transitioned into current rise or current oscillations. The increase in the current or oscillations could be associated with a passivity breakdown. The time at which the current started to rise or oscillate indicates pit initiation. Figure 8a shows the log i–log t plots of the SLM IN718 specimens in the acidic chloride solution. The AS-AM (HT) samples showed the highest current density and the shallowest slope (−0.16) of the current profile. The slopes of the log i–log t plots are listed in Table 4. Typically, the current decayed slowly (shallow slope) during the first ten seconds of the potentiostatic conditioning and then a steeper slope was observed. The AM-HIP material showed a steeper slope than other SLM specimens in the acidic pH condition. Interestingly, the wrought materials showed a faster current decay, as observed in Figure 8d, and the slope observed on the heat-treated wrought sample was steeper than that of any other specimens of this study. The current decay slope could be related to the thickness of the passive film and also the mechanism of film formation. A slope of around −1 is associated with a thicker, impervious film [41] formed by a high electric field [39,42], whereas a slope of −0.5 indicates the formation of a thinner film by a diffusion-controlled mechanism which could be porous [39]. Therefore, AM-HIP indicates the formation of a relatively thicker and more protective film than other specimens in the acid chloride solution. The pit initiation time for all the SLM specimens was in the order of ten minutes in the pH 1.25 solution.
The current decay during potentiostatic conditioning in neutral and alkaline solutions followed the same trend that was observed in the acidic chloride solution. The slope of the current decay for the AM-HIP in the neutral solution was closer to −1, indicating the formation of a thicker and more impervious surface film than that observed in the acidic solution. No current rise was observed within 1 h of the potentiostatic conditioning because the applied potential was less than the EPP. Other SLM specimens showed an increase in the current or significant current oscillations, indicating a passivity breakdown within the test period. Figure 8c shows the current decay behavior in the alkaline solution. It is interesting to note that no hysteresis or pitting behavior was observed during the cyclic polarization in the alkaline chloride solution; however, a current decay and rise behavior was observed during the potentiostatic conditioning. All the SLM specimens showed passive film breakdown characteristics after about 10 min of potentiostatic conditioning at ETP-50 mVAg/AgCl.
The potentiostatic conditioning was interrupted to carry out EIS measurements and the results were compared with the initial EIS measurement. The variation in the impedance behavior indicated the change in the properties of the passive layer. Figure 9a–d shows the Nyquist plots of the AS-AM, AM-HIP, AS-AM (HT), and AM-HIP (HT) specimens in the acid chloride solution, respectively. The impedance increased after potentiostatic conditioning for the AM-HIP and AS-AM specimens, indicating a thickening of the passive film as a function of time in spite of current oscillations during the potentiostatic conditioning. There was no significant change in the impedance at the beginning and at the end of the potentiostatic conditioning for the As-AM (HT) specimen, while the impedance decreased for the AM-HIP (HT) specimen. The AS-AM (HT) specimen showed the lowest impedance value, which correlated with the highest current density, as observed in Figure 8a.
Figure 10a–d shows the Nyquist plots of the SLM IN718 specimens before and after the potentiostatic conditioning in the neutral chloride solution. The impedance increased for the AM-HIP specimen, indicating a stable passive condition that correlates well with the I–t profile. The AS-AM did not show a significant change in the impedance. A decrease in impedance was noticed for both of the heat-treated specimens in the neutral chloride solution, indicating the detrimental effect of the Laves phase in these specimens. Figure 11a–d exhibits the impedance spectra of the SLM IN718 specimens before and after the pit initiation conditions in the alkaline chloride solution. The impedance results corroborate with the log i–log t profiles that revealed incipient passive film instability in all the specimens. It is interesting to note that the results of the potentiostatic tests are different from those of cyclic polarization. All the specimens showed a decrease in impedance after the potentiostatic conditioning, indicating a passivity breakdown.
Figure 12a–d shows the Mott–Schottky plots in the three different pH conditions after the potentiostatic conditions. The Mott–Schottky plots showed both positive and negative slopes depending on the applied potential and pH conditions, in which the positive slope indicated n-type conductivity and a negative slope indicated p-type conductivity [41]. The results are summarized in Table 5 and Table 6. The presence of both types of conductivity in a single test condition could point to the presence of a dual-layered passive film. Depending on the applied potential and band-bending condition, one type of layer could be in a degenerate condition, and thus only the non-degenerate passive film would be revealed. An alternate explanation for the changeover of n-type conductivity to p-type conductivity at high anodic potentials could be due to the formation of an inversion layer enriched with holes due to very large band bending caused by the anodic polarization, or the formation of cation vacancies (by oxidative dissolution) in the passive film due to the oxidation of transition metal ions to higher valence states.
Charge carrier density of the passive film is calculated from the slope of the Mott–Schottky plots and flat band potential is estimated from the intercept of the linear portion of the Mott–Schottky plots at the potential axis. The magnitude of flat band potentials gives an indication of the extent of allowed band bending before the semiconducting film becomes degenerate during polarization. A more negative flat band potential will be advantageous for the n-type semiconductivity because it can accommodate a larger anodic polarization (upward band bending or depleted space charge layer). Similarly, a more positive flat band potential is desired for p-type semiconductivity.
The charge carrier densities and the flat band potentials are summarized in Table 4, Table 5 and Table 6. For a spinel structure of type NiCr2O4 or Ni(Fe,Cr)2O4, the number of oxygen ions will be 5.5 × 1022 cm−3. As seen in Table 4, the AS-AM (received) specimen showed a charge carrier density of 1.03 × 1022 cm−3. If all the charge carriers are assumed to be oxygen vacancies, this passive layer consisted of 20% of their oxygen sub-lattice as vacant sites. An increase in the charge carrier density would lead to higher conductivity or lower impedance and lower resistance to corrosion. N-type semiconducting behavior was predominately observed in the acidic solution, while both n-type and p-type semiconductivity were observed in the neutral pH solution and only p-type behavior was noted in the alkaline conditions. The charge carrier density was in the order of 1021 cm−3 for the p-type semiconductivity. It should be noted that both NiO and Cr2O3 show p-type semiconductivity [43]; however, the passive film could consist of other alloying additions such as Fe, Mo, and Nb. Therefore, a spinel-type composition is expected. Zhang and Ojo [39] reported that the passive film formed on a wire-arc-manufactured IN718 material consisted of 25.65% NiO and 47.40% Cr2O3. The charge carrier density was the lowest in the AM-HT specimen in the acidic chloride solution, which is related to the high impedance and low current density observed in this specimen in all the test environments. The data presented in Table 4, Table 5 and Table 6 indicate that AM-HIP specimens show better semiconducting behavior for enhanced corrosion resistance than other specimens.
Figure 13a,b shows the optical microstructures after the potentiostatic conditioning at ETP-50 mVAg/AgCl in the acidic chloride solution. Localized corrosion preferentially occurred at the regions adjacent to the Laves phase and along the boundaries of existing pores and the regions surrounding the carbides also underwent dissolution. Figure 14a shows the as-polished specimen of AM-HIP and the distribution of MC carbides. Figure 14b shows the microstructure after potentiostatic conditioning at ETP-50 mVAg/AgCl in the acidic chloride solution. To evaluate the preferential pit initiation site, the surface was etched with waterless Kalling’s reagent. Pitting occurred around the grain boundary precipitates—most probably MC carbides. The role of MC carbides acting as cathodic sites and initiating pitting has been reported by other researchers [11,12,44].

4. Discussion

The IN718 alloy is predominantly used in applications that require very high strength, toughness, and corrosion resistance at a wide range of temperatures in the range of −65 to 650 °C. The ordered BCT γ″, ordered FCC-γ′, and M6C-type precipitates form during heat treatment at 720 °C, and during the aging step at 620 °C, aging γ′ precipitates predominantly form at the γ″ denuded zone. The strengthening of 718 is generally determined by the precipitation of γ″. The γ″ formation kinetics are very sluggish and will take more than 1000 h if aged only at 620 °C [1]. The second step 620 °C aging treatment gives resistance to high-temperature notch sensitivity, as γ′ precipitates form in the γ″ denuded zones, strengthening the affected regions. In addition to the aging treatments, solution treatment also plays a critical role in determining the creep-rupture strength of alloy 718 [1].
Laves and δ phases are less desirable microstructures that detrimentally affect the toughness and corrosion resistance of the alloy, and the SLM process invariably forms these phases, so a tight control of these phases is required. The SLM process parameters also need to be optimized to minimize macroscopic defects such as porosity, hot cracking, and surface roughness. Additional processing steps such as machining, shot peening, hot isostatic pressing, and other related processing steps are required to remove macroscale defects. These additional steps will increase the manufacturing cost, so the method of additive manufacturing should be designed to minimize the manufacturing cost with optimized mechanical and corrosion properties. The as-printed (AS-AM) specimens showed a multi-phase microstructure with fine columnar grains of a γ dendrite core, uniform distribution of δ-phase needles in the γ-phase, MC carbides, Laves phase as interdendrites, and unresolved γ′ and γ″ precipitates. These complex microstructures are advantageous for enhanced mechanical properties, but the corrosion resistance may be impaired due to the presence of multiple phases that act as local anodes and cathodes. The Laves and δ phases are enriched in Nb and Mo, which deplete the alloy content in the γ matrix. Based on the thermodynamic calculations, Zhang and Ojo [39] showed that lower Nb content in the γ matrix increased the activity of Ni but decreased the activity of Cr; therefore, the passive film formed on the surface was less protective due to lower Cr2O3 content and higher NiO content. In addition, the pores present in the AS-AM material adversely affected the repassivation kinetics during cyclic polarization and pitting growth.
When the 3D-printed material was heat treated to obtain optimized mechanical properties by the conventional type-I heat treatment, corrosion resistance was lessened. The δ phase dissolved during the solution-annealed treatment. The Laves phase content could have increased due to exposure at 980 °C [13], and the lower corrosion resistance of the AS-AM (HT), in spite of having lower δ phase content, indicated that the corrosion behavior was influenced more by the Laves phase than by other phases. The two-step aging treatment, in general, resulted in the deterioration of the corrosion resistance, which could be attributed to the formation of γ′ and γ″ precipitates that increased the cathodic reaction catalytic activities. The AM-HIP material showed the highest corrosion resistance in all the pH conditions with a decrease in corrosion resistance after the heat treatment. Hot isostatic pressing resulted in the disappearance of the dendritic structure, indicating compositional homogeneity and a decrease in the material porosity. In addition, the detrimental secondary phases (Laves and δ phases) were not observed in the microstructure of the HIPed samples. The MC carbides present in the AM-HIP possibly affected the pitting behavior in the alkaline chloride solution. When the HIPed material was heat treated, the Laves formed along the grain boundaries and the microstructure did not resolve the δ phase. The SLM materials showed better corrosion resistance than the wrought materials investigated in this study; however, the comparison was made only in the acidic chloride solution. The lower corrosion resistance of the wrought material could be attributed to the presence of MC carbides and discrete δ-phase particles along the grain boundaries that acted as local cathodes. These microstructural conditions in the wrought material resulted in a high passivation current density and low impedance. Overall, the correlation of microstructure with the corrosion resistance of IN718 indicated that the Laves phase played a significant role in determining corrosion properties.

5. Conclusions

Selective laser melting (SLM)-processed Inconel 718 alloy specimens were investigated in four different conditions: (1) As-manufactured (AS-AM), (2) Additively manufactured and HIPed (AM-HIP), (3) As-manufactured and heat-treated (solution annealing followed by two-step aging), and (4) AM-HIP and heat-treated. Localized corrosion behavior was evaluated in a 3.5% NaCl solution at three different pH conditions: pH 1.25, 6.25, and 12.25. Linear polarization, cyclic polarization, potentiostatic conditioning, electrochemical impedance spectroscopy, and Mott–Schottky analyses were carried out at room temperature. Based on the test results, the following conclusions could be drawn:
Among the four conditions tested, the AM-HIP without heat treatment showed the lowest passive current density and the highest impedance in all the pH conditions. In general, the HIPed specimens showed higher resistance to corrosion than the non-HIPed specimens. The higher corrosion resistance of the HIPed condition could be correlated to the decrease in the porosity level and the absence of the dendritic structure.
The transpassivity observed during the cyclic polarization in the alkaline chloride solution could be attributed to the oxygen evolution reaction induced by the decomposition of lattice oxygen of the passive film. No passivity breakdown could be noted during cyclic polarization measurements in the alkaline pH condition.
Positive hysteresis during the cyclic polarization was observed on the SLM specimens, which indicated the initiation of localized corrosion in the neutral and acidic chloride solutions. No passivity breakdown was observed in the wrought specimens in the acidic chloride solution. However, the passivation current density was two orders of magnitude higher than that observed on the SLM specimens.
A dual-layered passive film was observed on the SLM and wrought IN718 specimens. It is assumed that the inner layer is a p-type semiconductor consisting of either NiO or Cr2O3, and the outer layer is an n-type semiconductor with a defective spinal (Ni(Fe,Cr)2O4) structure. The passive films of the AM-HIP specimens showed lower defect density, which leads to higher impedance and higher corrosion resistance. Heat treatment generally resulted in the deterioration of the corrosion resistance.
The presence of the Laves phase was more detrimental to the corrosion resistance than any other phase in the case of the additively manufactured materials. The presence of MC carbide and the grain boundary δ phase increased the susceptibility to corrosion in the wrought materials.

Author Contributions

Conceptualization, K.S.R. and I.C.; methodology, T.T. and K.S.R.; formal analysis, T.T. and K.S.R.; investigation, T.T.; resources, I.C. and K.S.R.; data curation, T.T. and K.S.R.; writing—original draft preparation, T.T. and K.S.R.; writing—review and editing, K.S.R. and I.C.; supervision, K.S.R.; project administration, I.C. and K.S.R.; funding acquisition, I.C. and K.S.R. All authors have read and agreed to the published version of the manuscript.

Funding

This research project was funded by the Idaho Global Entrepreneurial Mission (IGEM) grant program administered by the Idaho Department of Commerce.

Data Availability Statement

The data presented in this study are available on request from the corresponding author.

Conflicts of Interest

The authors declare no conflict of interest.

References

  1. Sims, C.T.; Hagel, W.C. The Superalloys; John Wiley & Sons: Hoboken, NJ, USA, 1972; pp. 113–143. [Google Scholar]
  2. Luo, S.; Huang, W.; Yang, H.; Yang, J.; Wang, Z.; Zeng, X. Microstructural evolution and corrosion behaviors of Inconel 718 alloy produced by selective laser melting following different heat treatments. Addit. Manuf. 2019, 30, 100875. [Google Scholar]
  3. Sahraeian, R.; Omidvar, H.; Hadavi, S.M.M.; Shakerin, S.; Maleki, V. An Investigation on high-temperature oxidation and hot corrosion resistance behavior of coated TLP (Transient Liquid Phase)-bonded IN738-LC. Trans. Indian Inst. Met. 2018, 71, 2903–2918. [Google Scholar] [CrossRef]
  4. Cozar, R.; Pineau, A. Morphology of γ′ and γ″ precipitates and thermal stability of inconel 718 type alloys. Metall. Trans. 1973, 4, 47–59. [Google Scholar] [CrossRef]
  5. Thomas, A.; El-Wahabi, M.; Cabrera, J.M.; Prado, J.M. High temperature deformation of Inconel 718. J. Mater. Process. Technol. 2006, 177, 469–472. [Google Scholar]
  6. Janaki Ram, G.D.; Venugopal Reddy, A.; Prasad Rao, K.; Madhusudhan Reddy, G. Microstructure and mechanical properties of Inconel 718 electron beam welds. Mater. Sci. Technol. 2005, 21, 1132–1138. [Google Scholar]
  7. Gao, M.; Wei, R.P. Grain boundary niobium carbides in Inconel 718. Scr. Mater. 2006, 37, 1843–1849. [Google Scholar]
  8. INCONEL®alloy 718 (UNS N07718/W.Nr. 2.4668), Technical Brochure, Special Metals. Available online: www.specialmetals.com (accessed on 14 November 2020).
  9. API SPEC 6A718-2004; Specification of Nickel Base Alloy 718 (UNS N07718) for Oil and Gas Drilling and Production Equipment. American Petroleum Institute: Washington, DC, USA, 2004.
  10. Valle, L.C.M.; Santana, A.I.C.; Rezende, M.C.; Dille, J.; Mattos, O.R.; de Almeida, L.H. The influence of heat treatments on the corrosion behavior of nickel-based alloy 718. J. Alloys Compd. 2019, 809, 151781. [Google Scholar] [CrossRef]
  11. Chen, T.; John, H.; Xu, J.; Lu, Q.; Hawk, J.; Liu, X. Influence of surface modifications on pitting corrosion behavior of nickel-base alloy 718. Part 1: Effect of machine hammer peening. Corros. Sci. 2013, 77, 230–245. [Google Scholar] [CrossRef]
  12. Wei, X.; Zheng, W.J. Effect of carbides on sensitivity of pitting corrosion in Inconel 718 alloy. Anti-Corros. Methods Mater. 2020, 67, 158–165. [Google Scholar] [CrossRef]
  13. Schirra, J.J.; Caless, R.H.; Hatala, R.W. The effect of Laves phase on the mechanical properties of wrought and cast + HIP Inconel 718. In Superalloys 718,625 and Various Derivatives; Edward, J.L., Ed.; The Minerals, Metals & Materials Society: Warrendale, PA, USA, 1991; pp. 375–388. [Google Scholar]
  14. Radhakrishna, C.; Rao, K.P. The formation and control of Laves phase in superalloy 718 welds. J. Mater. Sci. 1997, 32, 1977–1984. [Google Scholar] [CrossRef]
  15. Kruk, A.; Cempura, G. Decomposition of the Laves phase in the fusion zone of the Inconel 718/ATI 718Plus® welded joint during isothermal holding at a temperature of 649 °C. Mater. Charact. 2023, 196, 112560. [Google Scholar] [CrossRef]
  16. Zhang, S.; Wang, L.; Lin, X.; Yang, H.; Huang, W. The formation and dissolution mechanisms of Laves phase in Inconel 718 fabricated by selective laser melting compared to directed energy deposition and cast. Compos. Part B 2022, 239, 109994. [Google Scholar] [CrossRef]
  17. Zhang, S.; Lin, X.; Wang, L.; Yu, X.; Huc, Y.; Yang, H.; Lei, L.; Huang, W. Strengthening mechanisms in selective laser-melted Inconel718 superalloy. Mater. Sci. Eng. A 2021, 812, 141145. [Google Scholar] [CrossRef]
  18. Ghaemifar, S.; Mirzadeh, H. Dissolution kinetics of Laves phase during homogenization heat treatment of additively manufactured Inconel 718 superalloy. J. Mater. Res. Technol. 2023, 24, 3491–3501. [Google Scholar]
  19. Sander, G.; Tan, J.; Balan, P.; Gharbi, O.; Feenstra, D.R.; Singer, L.; Thomas, S.; Kelly, R.G.; Scully, J.R.; Birbilis, N. Corrosion of Additively Manufactured Alloys: A Review. Corrosion 2018, 74, 1318–1350. [Google Scholar] [CrossRef] [PubMed]
  20. Herzog, D.; Seyda, V.; Wycisk, E.; Emmelmann, C. Additive manufacturing of metals. Acta Mater. 2016, 117, 371–392. [Google Scholar] [CrossRef]
  21. Guo, P.; Lin, X.; Xu, J.; Li, J.; Liu, J.; Huang, W. Electrochemical Removal of Different Phases from Laser Solid Formed Inconel 718. J. Electrochem. Soc. 2017, 164, E151–E157. [Google Scholar] [CrossRef]
  22. Guo, P.; Lin, X.; Li, J.; Zhang, Y.; Song, M.; Huang, W. Electrochemical behavior of Inconel 718 fabricated by laser solid forming on different sections. Corros. Sci. 2018, 132, 79–89. [Google Scholar] [CrossRef]
  23. Zhang, Q.; Li, H.; Yang, Y. Effects of Solution Heat Treatment on Laves Phase and Corrosion Behaviors in Selective Laser Melted Inconel 718 Alloy. IOP Conf. Ser. Mater. Sci. Eng. 2019, 677, 022081. [Google Scholar] [CrossRef]
  24. Du, D.; Dong, A.; Shu, D.; Zhu, G.G.; Sun, B.; Li, X.; Lavernia, E. Influence of build orientation on microstructure, mechanical and corrosion behavior of Inconel 718 processed by selective laser melting. Mater. Sci. Eng. A 2019, 760, 469–480. [Google Scholar] [CrossRef]
  25. Li, J.; Zhao, Z.Y.; Bai, P.K.; Qu, H.Q.; Liu, B.; Li, L.; Wu, L.Y.; Guan, R.G.; Liu, H.; Guo, Z.H. Microstructural evolution and mechanical properties of IN718 alloy fabricated by selective laser melting following different heat treatments. J. Alloys Compd. 2019, 772, 861–870. [Google Scholar]
  26. Siddaiah, A.; Kasar, A.; Kumar, P.; Akram, J.; Misra, M.; Menezes, P.L. Tribocorrosion Behavior of Inconel 718 Fabricated by Laser Powder Bed Fusion-Based Additive Manufacturing. Coatings 2021, 11, 195. [Google Scholar]
  27. Diljith, P.K.; Jinoop, A.N.; Paul, C.P.; Krishna, P.; Bontha, S.; Bindra, K.S. Understanding the corrosion behaviour of laser directed energy deposition-based additive manufacturing built Inconel 718 under acidic environments. Prog. Addit. Manuf. 2021, 6, 395–406. [Google Scholar]
  28. Tang, Y.; Shen, X.; Liu, Z.; Xiao, Y.; Yang, L.; Lu, D.; Zhou, J.; Xu, J. Corrosion Behaviors of Selective Laser Melted Inconel 718 Alloy in NaOH Solution. Acta Metall. Sin. 2022, 58, 324–333. [Google Scholar]
  29. Zhang, Y.; Yua, J.; Lin, X.; Guo, P.; Yan, Q.; Liu, J.; Huang, W. Synergistic effect of transpassive film and gamma double prime phase on the electrochemical dissolution behavior of Inconel 718 manufactured by laser directed energy deposition. Mater. Charact. 2023, 204, 113207. [Google Scholar] [CrossRef]
  30. Zhang, Y.; Yua, J.; Lin, X.; Guo, P.; Yan, Q.; Liu, J.; Huang, W. Passive behavior of laser directed energy deposited Inconel 718 after homogenization and aging heat treatment. Corros. Sci. 2022, 205, 110439. [Google Scholar] [CrossRef]
  31. Koutiri, I.; Pessard, E.; Peyre, P.; Amlou, O.; De Terris, T. Influence of SLM process parameters on the surface finish, porosity rate and fatigue behavior of as-built Inconel 625 parts. J. Mater. Process. Technol. 2018, 255, 536–546. [Google Scholar] [CrossRef]
  32. Dilip, J.J.S.; Zhang, S.; Teng, C.; Zeng, K.; Robinson, C.; Pal, D.; Stucker, B. Influence of processing parameters on the evolution of melt pool, porosity, and microstructures in Ti-6Al-4V alloy parts fabricated by selective laser melting. Prog. Addit. Manuf. 2017, 2, 157–167. [Google Scholar]
  33. Kumar, P.; Farah, J.; Akram, J.; Teng, C.; Ginn, J.; Misra, M. Influence of laser processing parameters on porosity in Inconel 718 during additive manufacturing. Int. J. Adv. Manuf. Technol. 2019, 103, 1497–1507. [Google Scholar]
  34. Sander, G.; Thomas, S.; Cruz, V.; Jurg, M.; Birbilis, N.; Gao, X.; Brameld, M.; Hutchinson, C.R. On The Corrosion and Metastable Pitting Characteristics of 316L Stainless Steel Produced by Selective Laser Melting. J. Electrochem. Soc. 2017, 164, C250–C257. [Google Scholar] [CrossRef]
  35. Koizumi, M. Hot Isostatic Pressing Theory and Applications, International Conference on Hot Isostatic Pressing; Elsevier Applied Science: London, UK; New York, NY, USA, 1992; pp. 11–187. [Google Scholar]
  36. Lee, S.C.; Chang, S.H.; Tang, T.P.; Ho, H.H.; Chen, J.K. Improvement in the Microstructure and Tensile Properties of Inconel 718 Superalloy by HIP Treatment. Mater. Trans. 2006, 47, 2877–2881. [Google Scholar] [CrossRef]
  37. Vikram, R.J.; Singh, A.; Suwas, S. Effect of heat treatment on the modification of microstructure of selective laser melted (SLM) IN718 and its consequences on mechanical behavior. J. Mater. Res. 2020, 35, 1949–1962. [Google Scholar]
  38. Popovich, V.A.; Borisov, E.V.; Popovich, A.A.; Sufiiarov, V.S.; Masaylo, D.V.; Alzina, L. Impact of heat treatment on mechanical behaviour of Inconel 718 processed with tailored microstructure by selective laser melting. Mater. Des. 2017, 131, 12–22. [Google Scholar] [CrossRef]
  39. Zhang, L.N.; Ojo, O.A. Corrosion behavior of wire arc additive manufactured Inconel 718 superalloy. J. Alloys Compd. 2020, 829, 154455. [Google Scholar] [CrossRef]
  40. Luo, K.; Roberts, M.R.; Guerrini, N.; Tapia-Ruiz, N.; Hao, R.; Massel, F.; Pickup, D.M.; Ramos, S.; Liu, Y.S.; Guo, J.; et al. Anion redox chemistry in the cobalt free 3d transition metal oxide intercalation electrode Li[Li0.2Ni0.2Mn0.6]O2. J. Am. Chem. Soc. 2016, 138, 11211–11218. [Google Scholar] [PubMed]
  41. Raja, K.S.; Jones, D.A. Effects of dissolved oxygen on passive behavior of stainless alloys. Corros. Sci. 2006, 48, 1623–1638. [Google Scholar] [CrossRef]
  42. Liu, L.; Li, Y.; Wang, F. Influence of micro-structure on corrosion behavior of a Ni-based superalloy in 3.5% NaCl. Electrochim. Acta 2007, 52, 7193–7202. [Google Scholar] [CrossRef]
  43. Raja, K.S.; Shoji, T. Semiconducting properties of surface oxide films of pure iron, nickel and chromium metals in pure water at 288 °C. J. Mater. Sci. Lett. 2003, 22, 1347–1349. [Google Scholar] [CrossRef]
  44. Zhang, B.; Xiu, M.; Tan, Y.T.; Wei, J.; Wang, P. Pitting corrosion of SLM Inconel 718 sample under surface and heat treatments. Appl. Surf. Sci. 2019, 490, 556–567. [Google Scholar]
Figure 1. XRD patterns of the SLM processed specimens: as 3D-printed (AS-AM), 3D-printed and heat-treated (AS-AM (HT)), 3D-printed and HIPed (AM-HIP), and 3D-printed, HIPed and heat-treated (AM-HIP (HT)).
Crystals 14 00089 g001
Figure 2. Optical microstructures of the IN718 specimens: (a) as 3D-printed (AS-AM), (b) 3D-printed and heat-treated (AS-AM (HT)), (c) 3D-printed and HIPed (AM-HIP), (d) 3D-printed, HIPed and heat-treated (AM-HIP (HT)), (e) TM-AR wrought material as-received, and (f) TM heat-treated (TM-HT).
Crystals 14 00089 g002
Figure 3. Secondary electron images (FE-SEM) of the etched microstructures of SLM-IN718 specimens: (a,c) as 3D-printed (AS-AM), (b,d), 3D-printed, and heat-treated (AS-AM (HT)).
Crystals 14 00089 g003
Figure 4. Secondary electron images (FE-SEM) of the etched microstructures of SLM + HIPed-IN718 specimens: (a) 3D-printed + HIPed (AM-HIP), (b) 3D-printed + HIPed + heat-treated (AM-HIP (HT)), and (c) wrought as-received IN 718.
Crystals 14 00089 g004
Figure 5. Open circuit potentials (OCP) of the SLM IN718 specimens as a function of time in different pH conditions of 3.5% NaCl solution at room temperature: (a) pH 1.25, (b) pH 6.25, (c) pH: 12.5, and (d) OCP of wrought IN718 specimens.
Crystals 14 00089 g005
Figure 6. Nyquist plots at OCP of the SLM IN718 specimens as a function of time in different pH conditions of 3.5% NaCl solution at room temperature: (a) pH 1.25, (b) pH 6.25, and (c) pH: 12.5. (d) Nyquist plots of wrought specimens in comparison with that of SLM AS-AM and AS-AM (HT) in 3.5% NaCl (pH: 1.25) at room temperature OCP.
Crystals 14 00089 g006
Figure 7. Cyclic polarization plots of the SLM IN718 specimens in different pH conditions of 3.5% NaCl solution at room temperature: (a) pH 1.25, and (b) pH 6.25. (c) pH 12.25, and (d) comparison with wrought specimens in pH 1.25 chloride solution.
Crystals 14 00089 g007
Figure 8. Current vs. time plots of the SLM IN718 specimens in different pH conditions of 3.5% NaCl solution at room temperature under potentiostatic conditioning (E = ETP − 50 mV): (a) pH 1.25, (b) pH 6.25, (c) pH 12.25, and (d) I–t plot of wrought IN718 alloy in pH 1.25 chloride solution.
Crystals 14 00089 g008
Figure 9. Nyquist plots of the SLM IN718 specimens in acidic 3.5% NaCl solution (pH 1.25) at room temperature before and after potentiostatic conditioning (E = ETP − 50 mV. (a) AS-AM (received), (b) AM-HIP (received), (c) AS-AM (HT), and (d) AM-HIP (HT).
Crystals 14 00089 g009
Figure 10. Nyquist plots of the SLM IN718 specimens in neutral 3.5% NaCl solution (pH 6.25) at room temperature before and after potentiostatic conditioning (E = ETP − 50 mV. (a) AS-AM (received), (b) AM-HIP (received), (c) AS-AM (HT), and (d) AM-HIP (HT).
Crystals 14 00089 g010
Figure 11. Nyquist plots of the SLM IN718 specimens in alkaline 3.5% NaCl solution (pH 12.25) at room temperature before and after potentiostatic conditioning (E = ETP − 50 mV. (a) AS-AM (received), (b) AM-HIP (received), (c) AS-AM (HT), and (d) AM-HIP (HT).
Crystals 14 00089 g011
Figure 12. Mott–Schottky plots of the SLM IN718 specimens in different pH conditions of 3.5% NaCl solution at room temperature after potentiostatic conditioning (E = ETP − 50 mV): (a) pH 1.25, (b) pH 6.25, (c) pH 12.25, and (d) Mott–Schottky plots of wrought IN718 alloy in pH 1.25 chloride solution in comparison with that of AS-AM specimens.
Crystals 14 00089 g012
Figure 13. (a,b) Optical microstructures of as-printed (AS-AM) specimen after potentiostatic conditioning at 0.887 VAg/AgCl in 3.5% NaCl (pH 1.25) at two nearby locations.
Crystals 14 00089 g013
Figure 14. Optical microstructures of printed and HIPed (AM-HIP) specimen: (a) as polished before testing and (b) after potentiostatic conditioning at 0.875 VAg/AgCl in 3.5% NaCl (pH 1.25) and etched to reveal grain structure.
Crystals 14 00089 g014
Table 1. Specimen identification and processing condition.
Specimen IDProcessing Condition
AS-AM or AS-AM (Received)SLM 3D-printed without further conditioning
AS-AM (HT)3D-printed and subjected to the solution annealing at 980 °C followed by two-step aging treatment
AM-HIP or AM-HIP (Received)3D-printed and hot isostatically pressed
AM-HIP (HR)3D-printed and hot isostatically pressed + heat-treated (solution annealing at 980 °C followed by two-step aging treatment).
Wrought (Received)Traditionally manufactured wrought material in mill annealed condition—as-received
Wrought (HT)Wrought material heat-treated (solution annealing at 980 °C followed by two-step aging treatment)
Table 2. Summary of hardness, grain size, and porosity of IN718 specimens.
Specimen IDVickers Hardness—Range (Average), kgf/mm2ASTM Grain Size Number (Average Diameter, μm)Porosity, vol%
AS-AM (Received)360–510 (420)9.5 (13.3)2.92 ± 0.2
AS-AM (HT)419–535 (474)9.5 (13.2)2.77 ± 0.15
AM-HIP (Received)344–454 (408)8 (22.5) 0.67 ± 0.06
AM-HIP (HT)483–546 (516)7.5 (25.8)0.69 ± 0.05
Wrought—Received339–409 (370)7.5 (26.7)N.A
Wrought (HT)518–600 (562)7.0 (32.7)N.A
Table 3. Summary of the room temperature electrochemical polarization measurements of IN718 specimens in 3.5% NaCl solution at different pH conditions.
pHSpecimen IDLinear Polarization Resistance
(ohm·cm2)
OCP (VAg/AgCl)Passivation Current Density, ip (A/cm2)Transpassive Potential,
ETP (VAg/AgCl)
Pitting Protection Potential, EPP (VAg/AgCl)
1.25AS-AM Received5427.3−0.0902.90 × 10−50.937−0.029
AS-AM (HT)7580.3−0.1596.67 × 10−50.9620.082
AM-HIP Received63,682−0.0934.52 × 10−60.9250.047
AM-HIP (HT)47,586−0.0865.01 × 10−50.960−0.129
Wrought Received658−0.2161.76 × 10−31.04-
Wrought (HT)467−0.2201.83 × 10−31.04-
6.25AS-AM Received281,180−0.3333.28 × 10−50.9590.072
AS-AM (HT)91,058−0.1965.16 × 10−50.944−0.115
AM-HIP Received222,641−0.1433.88 × 10−61.0901.050
AM-HIP (HT)157,219−0.1558.03 × 10−51.0700.880
12.25AS-AM Received162,270−0.3292.02 × 10−50.547-
AS-AM (HT)55,027−0.2918.21 × 10−60.539-
AM-HIP Received211,407−0.2774.33 × 10−60.528-
AM-HIP (HT)93,244−0.3066.32 × 10−60.560-
Table 4. Summary of potentiostatic and Mott–Schottky measurements in pH 1.25 solution.
pH = 1.25 n-Type
SpecimenSlope of Log(i)–Log(t) Plot Charge Carrier Density (cm−3)Flat Band Potential
(VAg/AgCl)
AS-AM Received−0.391.03 × 1022−0.23
AS-AM (HT)−0.167.35 × 1021−0.19
AM-HIP Received−0.629.79 × 10200.02
AM-HIP (HT)−0.301.68 × 1021−0.07
Wrought (Received)−0.421.32 × 10210.09
Wrought (HT)−0.942.21 × 1021−0.05
Table 5. Summary of Mott–Schottky measurements in pH 6.25 solution.
pH = 6.25p-Type n-Type
SpecimenSlopeCharge Carrier Density (cm−3)Flat Band Potential,
(VAg/AgCl)
SlopeCharge Carrier Density (cm−3)Flat Band Potential
(VAg/AgCl)
AS-AM Received−3.01 × 1093.60 × 10210.328.18 × 1091.33 × 1021−0.27
AS-AM (HT)−3.10 × 1093.50 × 10211.287.87 × 1091.38 × 1021−0.25
AM-HIP Received−3.13 × 1093.47 × 10211.49---
AM-HIP (HT)−4.52 × 1092.40 × 10211.19---
Table 6. Summary of Mott–Schottky measurements in pH 12.25 solution.
pH = 12.25p-Type
SpecimenSlopeCharge Carrier Density (cm−3)Flat Band Potential
AS-AM Received−4.09 × 1092.65 × 10210.36
AS-AM (HT)−4.79 × 1092.27 × 10210.36
AM-HIP Received−7.24 × 1091.50 × 10210.34
AM-HIP (HT)−1.16 × 1099.40 × 10210.31
Disclaimer/Publisher’s Note: The statements, opinions and data contained in all publications are solely those of the individual author(s) and contributor(s) and not of MDPI and/or the editor(s). MDPI and/or the editor(s) disclaim responsibility for any injury to people or property resulting from any ideas, methods, instructions or products referred to in the content.

