
Photocatalytic Decomposition of Amoxicillin Using Zinc Ferrite Nanoparticles
by
 , and
, and
Aya Jezzini
1, 
Yujin Chen
1,
Anne Davidson
1,
Gilles Wallez
2,
Tayssir Hamieh
3,4,* and
and
Joumana Toufaily
4 1
Laboratoire de Réactivité de Surface LRS, Sorbonne Université, UMR 7197, 75252 Paris, France
2
Institut de Recherche de Paris, UMR 8247, Physicochimie des Matériaux Témoins de l’Histoire, 75001 Paris, France
3
Faculty of Science and Engineering, Maastricht University, P.O. Box 616, 6200 MD Maastricht, The Netherlands
4
Laboratory of Materials, Catalysis, Environment and Analytical Methods (MCEMA), Faculty of Sciences, Lebanese University, Badaro, Beirut P.O. Box 6573/14, Lebanon
*
Author to whom correspondence should be addressed.
Crystals 2024, 14(3), 291; https://doi.org/10.3390/cryst14030291
Submission received: 11 February 2024
/
Revised: 14 March 2024
/
Accepted: 17 March 2024
/
Published: 21 March 2024
(This article belongs to the Special Issue Photocatalytic Materials: New Perspectives and Challenges)
Abstract
:Catalysts enriched in Zinc ferrite (ZFO) were synthesized using coprecipitation and hydrothermal methods. Mixtures of crystalline nanoparticles (ZFO and α-Fe2O3, several allotropic varieties of FeO) were characterized by various techniques such as X-ray diffraction (XRD), transmission electron microscopy (TEM, SEM), N2 sorption, UV-visible spectrophotometry (UV-Vis) and X-ray photoelectron spectroscopy (XPS). After detailed characterizations, the catalytic performance of the solids (1 g/L) in the degradation of amoxicillin (AMX) (10 mg/L) as an antibiotic pollutant in water was evaluated. In addition, we used air as the oxygen source and adjusted the pH to 5.0. Consequently, the catalysts obtained via the hydrothermal method HT-ZFO had a high activity (100% of AMX removal in less than 100 min when an LED (75 W) light was used) compared to a similar mixture of oxides with graphene HT-ZFO-GO (a longer time of 150 min) that was necessary for the complete degradation of AMX. Impregnation with an aqueous solution containing 80 mg of GO obtained using Hummer’s method, reduced into RGO by an ultrasound treatment, enhances the initial reaction rate but is associated with a prolonged time for complete AMX removal (10 ppm in water) that we attribute to its spontaneous corrosion.
1. Introduction
Substantial traces of micropollutants (metals, pesticides and pharmaceuticals) are found in wastewater because they are not completely removed at the basic water treatment stations. The pharmaceutical industries are associated with antibiotics, and their discharge into the environment endangers the health of humans and animals. Indeed, their entry into the food chain can hinder the growth of good bacteria and increases the resistance to antibiotics. Amoxicillin is a semi-synthetic beta-lactam antibiotic that is used to treat a variety of illnesses in humans and as a growth stimulant in veterinary medicine. Amoxicillin is likely to be found in environmental samples in its original form rather than as a metabolite because of its low metabolism within the body [1]. For instance, catalysts based on active semi-conducting oxide nanoparticles have been proposed for the new advanced oxidation process (AOP), which aims to remove antibiotic traces. A number of oxides, including titania [1], have been tested for use in these AOP reactions, and a number of oxidants have been added, such as diluted O2 from air, H2O2 and ozone [2]. Photons in the UV or visible spectrum have the ability to produce pairs of electrons in the conduction band (CB) and holes in the valence band (VB) when their energy surpasses the oxide band gap. Electrons of CB can react with diluted O2 molecules in air and in water. Additionally, they are consumed to generate superoxide O2•− then transformed into peroxide HOO• radicals. When holes react with water molecules, –OH ions are formed in basic conditions and very active •OH radicals are generated. Previous studies show that the photogenerated holes also play a significant role in the oxidation of organic molecules [3].
The most common semiconductor used in environmental applications and scientific research is TiO2 [4]. TiO2 has great potential for water treatment and fuel production through the degradation of pollutants and the generation of hydrogen and electricity. Waste, drinking, surface, and ground waters can all be effectively treated with TiO2 and UV irradiation. Ultraclean water ideal for the pharmaceutical and microelectronics industries can be obtained [5]. TiO2 has been identified as one of the most effective materials for photocatalytic hydrogen production [6]. It has been the subject of numerous studies because of its chemical stability, high photocatalytic activity, low cost, and environmental friendliness [7]. However, its wide band gap energy requires the use of UV irradiation [8]. Since UV makes up less than 5% of solar radiation, other heterogeneous catalysts can be used to produce good visible activity.
We have previously tested the photocatalytic activity of iron oxide nanoparticles in water because their aqueous solutions are colored and can be activated by visible light. Our first results regarding Fe/SBA-15 catalysts [9,10] in water have shown that because of a spontaneous photocorrosion occurring with reduced Fe(II) ions, a large amount of the Fe species was dissolved, giving isolated Fe(II) cations diluted in water with the important participation of a Fenton mechanism, a purely homogeneous catalytic reaction, as already observed with other Fe-loaded materials, in particular with maghemite [11].
Our goal here is to study the activity of other semi-conducting oxide nanoparticles that are known to be less sensitive to corrosion than maghemite. We have used Zn-ferrites, ZFOs, because their photocatalytic activity under visible light is demonstrated and because their stability in water and band gap values are compatible with excitation by visible light [12]. Also, ZFO nanostructured materials have a spinel structure and are interesting oxides because of the presence of Fe ions in two oxidation states, Fe2+ and Fe3+, their high oxygen anions’ mobility, their low cost and their magnetic properties. All of these are important for applications, like wastewater treatment, the photocatalytic decomposition of pesticides, and AMX antibiotics, for instance [13], and in other fields such as magnetic filtration or energy applications [14].
Recently, materials related to graphene, both in its oxidized and reduced form, have drawn attention due to their strong adsorption capacity, large specific surface area, and good conductivity, all of which have increased photocatalytic activity [15,16,17].
The goal of the current study is to synthesize mixtures of semiconductor oxide nanoparticles, which contain mainly zinc ferrite produced via different techniques, to obtain different morphologies, structures, and textures, and test them in the photocatalytic degradation of amoxicillin. Initially, we attempted to add an organic surfactant throughout the synthesis process in an attempt to improve the catalyst activity of the catalysts produced by coprecipitation. In fact, the purpose of its removal by calcination is to produce both micropores and mesopores. This triblock is indeed able to give well-ordered liquid crystals with inorganic salts diluted in acidic water solutions containing Zn2+ and NO3− ions [18]. Following that, we attempted to activate the catalyst produced by coprecipitation without the need for a surfactant by moving toward hybrid materials in the presence of reduced graphene GR that was produced using sonication. In addition to the nature and weight % of all the phases that a catalyst contains, it is well known that its specific surface area is one of the factors affecting its photocatalytic performance [15]. Semiconductor materials with large specific surfaces are beneficial to the adsorption of pollutants. For this reason, we compare our catalyst obtained via coprecipitation with the catalysts obtained via hydrothermal methods, as described by Xia et al. [19], which have larger specific surface areas.
2. Experimental
2.1. Materials/Reagents
Inorganic salts, ferric nitrate nona-hydrate, Fe(NO3)3·9H2O and zinc nitrate hexahydrate Zn(NO3)2·6H2O came from Sigma–Aldrich (Saint Quentin Fallavier, France) and PROLABO (Paris, France), respectively. The first solid salt is commercialized at a purity ACS grade of 98%, the second one has a purity indicated to be higher than 99.0%. The used triblock copolymer belongs to the Pluronic BASF family (Levallois Perret), it contains two poly-ethylene glycol chains PEO around a poly-propylene PPO chain and its global formula is PEO13PPO30PEO13 (L64), L for liquid. Triblock copolymers in a number of 10,196 are associated with the law of E.U. n°1272/2009, relative to cosmetic compounds. The graphite (GP) necessary to prepare both the reduced graphene RGO (physically, using ultrasounds, in ethanol) and the oxidized graphene GO (chemical preparation, in water) is commercialized by Sigma–Aldrich (Saint Quentin Fallavier, France). The additional solids of NaOH, K2S2O8 and P2O5, phosphorous oxide anhydride and liquid absolute ethanol (95%), H2SO4 (98%) and H2O2 (30%) are Sigma-Aldrich compounds and used as received. Distilled water is obtained with an Auto-still TM 4000X apparatus, distributed by JENCONS (Scientific) LTD (Leighton Buzzard, United Kingdom).
2.2. Oxidized Graphene (GO) Obtained via Hummer’s Method [20]
Graphene oxide (GO) was synthesized from graphite commercial powder (GR) using a modified Hummer’s method [20]. Briefly, 1.0 g of GR, 6.7 mL of 98% H2SO4, 0.8 g of K2S2O8, and 0.8 g of P2O5 were mixed to form a solution, which was maintained at 80 °C for 4.5 h. The resulting pre-oxidized product was cleaned with water and dried in a vacuum oven at 50 °C. After drying, 5.0 g of KMnO4, 40 mL of 98% H2SO4, and 85 mL of H2O were mixed with the pre-oxidized product at a temperature below 20 °C. After 2 h, 8 mL of H2O2 (at a 30% volume in water) diluted in 150 mL of distilled water was added. Thus, a yellow solution was obtained. The solid was recovered via centrifugation and washed with an acidic aqueous solution of HCl (0.1 mol·L−1). It was then dried under a vacuum at 30 °C for 10 h.
2.3. Reduced and Exfoliated Graphite (RGO) Obtained Using Ultrasounds
In solution, the usual method to obtain reduced graphene (RGO) is the addition of a reducing organic agent such as hydrazine [21]. Graphene exfoliated sheets can be dispersed and stabilized in solvents such as N,N-dimethyl formamide (DMF) or N-methyl-2-pyrrolidone (NMP) [22]. Less toxic reagents like Vitamin C can also be used [23]. Here we have used ultrasounds (as recommended by Stankovitch et al. [24]) in water and applied them to ethanol suspensions of graphite as follows: we used a static 500 W vibrator (Vibra-Cell VXC 505, Bio-Block®, Paris, France) with a horn made of a titanium alloy Ti-6Al-4V electrode introduced into 50 mL of absolute ethanol in a beaker of 50 mL containing 5 g of suspended commercial graphite. We have used this apparatus at 50% of its power of 500 W, at a 20 kHz frequency and with pulses of 15 s separated by equilibration times of 15 s, for 2 h. After 2 h of sonication, the solution was black.
The obtained black liquor was centrifuged at 6000× g rotations per minute (rpm) for 10 min, the powder was recovered and then washed once with distilled water (20–25 mL) followed by two washings with ethanol (20–25 mL).
2.4. Synthesis of Oxides Mixtures of Nanoparticles
2.4.1. By Coprecipitation
- Oxides mixtures, enriched in ZFO
The synthesis of unsupported ZFO nanoparticles was based on the method described by K. Ramamurthy et al. [25] with adapted experimental parameters. In the published work, hydrated Fe and Zn nitrate salts with a ratio of 1:1 in Fe and Zn salts were used. In our method, we used a ratio of 2:1 of the cationic Fe and Zn salts in order to obtain zinc ferrite as a main phase. The experimental setup is shown in Figure 1. To elaborate more, a sample was prepared in pure water and calcined before being labelled Copr-ZFO. For further illustration, a solution at 0.45 mol·L−1 of Fe(NO3)3·9H2O was mixed with 1 mL of NaOH at a concentration of 10 mol·L−1. The temperature was set at 35 °C and then 50 mL of an aqueous solution of Zn(NO3)2·6H2O at 0.225 mol·L−1 was added dropwise with a parallel addition of 9 mL of NaOH at 10 mol·L−1 (using two independent dropping funnels). After the complete addition, the temperature was set at 60 °C, and the agitation with a magnetic stirring bar was set at 700 rotations per min (rpm) for 1 h. Also, the pH was kept at pH = 14 via the addition of a solid (NaOH). Then, the mixture was maintained at 60 °C for 1 h. Finally, the obtained brown precipitate was recovered via centrifugation (6000 rpm, 15 min), washed once with 25 mL of distilled water, and then two times with 20–25 mL of technical ethanol. Then, the brown precipitate was left to dry in the air for 24 h at room temperature and calcined at 2 °C·min−1 up to 500 °C (6 h) before characterization.
A second preparation method was made in different conditions. Still in water, two different weights of L64 and PEO13PPO30PEO13 were introduced, with 3.6 and 1.8 of a triblock copolymer, L64. The rest of the synthesis was repeated as previously described to obtain two calcined samples labelled Copr-ZFO-L64 = 3.6 g and Copr-ZFO-L64 = 1.8 g.
- Nanoparticles mixed with reduced graphene (RGO) (Copr-ZFO-RGO)
Copr-ZFO-RGO was prepared using a similar protocol of coprecipitation in ethanol as explained above with the addition of reduced graphite (RGO) obtained via an ultrasound in the aqueous solution of Fe(NO3)3·9H2O. The obtained precipitate was recovered via centrifugation (6000× g rpm, 15 min), washed once with 25 mL of distilled water, and then two times with 20–25 mL of ethanol. The precipitate was left to dry in the air at room temperature for 12 h, then heat treated at 450 °C in argon and characterized.
2.4.2. Hydrothermal Treatments—Xia et al. [19]
The ZnFe2O4 graphene (HT-ZFO-GO) was synthesized using a hydrothermal method. In a typical synthesis procedure, 80 mg of the obtained GO (prepared using Hummer’s method) was dispersed in a glass vial for ultrasounds with 70 mL of ethanol and a sonication treatment of 1 h. Then, 0.8080 g of Fe(NO3)3·9H2O and 0.2975 g of Zn(NO3)2·6H2O solids were added at room temperature. Stirring was maintained for 30 min. The obtained suspension was introduced into an autoclave of 100 mL and treated at 180 °C for 20 h under the autogenous pressure of ethanol and water. The Teflon container was weighed when it was filled with reagents and after 20 h of heating and cooling to room temperature to look for leaks. Then, the obtained solid was recovered via filtration on paper and washed with 200 mL of water.
Then, (HT-ZFO) was prepared using a similar hydrothermal treatment without using GO.
2.5. Characterization Techniques
The specific surface areas, pore volumes, and diameters of the main pores were measured via N2 sorption using a BET apparatus (Micromeritics, Paris, France). Specific surface areas were calculated from the analysis of the relative pressure range (0.05–0.25) using the Brünauer–Emmett–Teller (BET) method. The overall pore volume was measured from a single point at a relative pressure of P/P0 = 0.98. The BJH method was also applied to the desorption branch of the isotherm. Measures of t-plots or alpha plots were performed to obtain microporous volumes.
TEM micrographs offered unique advantages. For example, they provided the possibility to study a solid with a resolution that can be as small as 2 Å and enabled us to obtain local compositions and electron diffraction results on specific kinds of nanoparticles (selected area electron diffractions, SAED). We also used a microscope, the JEOL JEM2011 (Paris, France), operating at 200 kV. Calcined catalytic powders were suspended in ethanol and dried on carbon-coated copper grids.
XRD diffractograms are first measured with a Cu Kα wavelength (Kα1, 1.5405 Å) on an Advance D8 Bruker diffractometer (Paris, France) and are used for routine evaluation as well as cutting-edge research (Scherer equation applied to a given diffraction peak, identified with three Miller indexes h, k and l diffractions). We have used them for the analysis of 1D and 2D crystalline data sets, first to identify the inorganic species present as crystalline particles. The geometry of the observed unit-cells and correct unit-cell parameters were calculated. The program DIFFRAC-SUITE 11 also allows for a clear presentation of XRD data and phase identification and quantification. Diffractions reported here were recorded in the 5 < 2θ < 90° range.
An additional and more complete analysis was made using the Full-Prof program. This program provides the very precise measurement of XRD peak positions and intensities. We have used a Co-irradiation rather than Cu-irradiation to obtain more diffraction peaks between 10 and 130°. This program has been found to be particularly helpful for initiating measurements and the mathematical treatment to correlate the full width at half maximum of each peak, of Miller indices h, k, and l, and obtaining evaluations of the strains’ and particles’ dimensions and shapes. Four main crystalline phases were identified: Zn-ferrite with a spinel structure (ICDD 77-0011), hematite with a hexagonal structure (ICDD 00-33-0664), and ZnO with hexagonal (04-0004-2776) and cubic structures (04-025-0531).
An XPS spectrometer working at a vacuum of 10−9 Torr (mm Hg) and using an Al Kα source working at 1486.6 eV was used. We have used an acquisition time of 0.1 s, a step size of 0.2684 in energy and a number of steps of 4096. We begin by measuring and analyzing the «survey» spectra recorded between 1100 and 1 eV. In this survey, main elements were identified because their XPS peaks were located in specific positions, as found in the American NIST database. These things considered, a very careful examination was necessary since several atoms can give XPS peaks at similar positions. In addition, differences were made by systematically analyzing several peaks’ positions by element. For instance, Si 2s and Si 2p were used for silicon, or O 2s and O 1s for oxygen elements. The main peaks were studied after the subtraction of a Shirley-type background. Also, a peak located at 285 eV was used as a reference and was attributed to the C 1s peak.
A Cary 5000 spectrometer (Varian) was used to record spectra in the 200–2500 nm spectral range in air and at room temperature. This apparatus was equipped with a diffuse reflectance internal cell (70 mm diameter) and covered with Teflon® (polytetrafluoroethylene). The same material was used to measure a blank for baseline measurements. Spectra were collected with a split broad width (SBW) of 2 nm and a rate of 600 nm per minute.
2.6. Photocatalytic Tests
A 75 W LED lamp, not heating, was placed above a double-glass-walled reactor. The emission spectra of the LED lamp were obtained experimentally with a visible fiber spectrometer over the range of 350 to 800 nm, with a resolution of 2 nm and an average taken over 10 recordings (DIDALAB device, Didalab, Elancourt, France). The maximum wavelength of the radiation is located around 600 nm. It is important to state that there is a sharp emission peak around 450 nm and the radiation takes place only in the visible spectra (Figure 2).
Furthermore, an aqueous solution of 10.00 ± 0.04 ppm of AMX in distilled water was prepared. An amount of 80 mL of this solution was introduced into the reactor, and then 80 mg of solid catalyst were dispersed in it. AMX was stable for hydrolysis at a pH of 5 [26]. For this reason, all of the photocatalytic tests were carried out at a pH of 5 at which we have checked that the AMX molecule was not destroyed. The reactor was placed in a black box and thermalized with a 16 L water bath. The temperature was set at 25 °C, the system was left to equilibrate for 30 min, and then the LED lamp was turned on. Samples were then taken at 35, 40, 45, 75, 105, 165 and 225 min of the test with a 1 mL syringe fitted with a 15 cm needle and 0.45 μm filters. The AMX concentration in water was measured as a function of time via HPLC with a Lachrom Elite (Hitachi, Tokyo, Japan), VWR-Hitachi apparatus (Merck Hitachi cooperation, Morrisville, NC, USA) using a C18 Hypersil column (150 mm × 4.6 mm, 4 μm) and a UV detector. The flow rate of the elution solvent (methanol/water; 90/10% v/v) was set at 0.8 mL·min−1 and the injected volume was 20 μL. Indeed, detection at the column outlet was carried out using a diode array detector fixed at λ = 230 nm.
In order to identify the product of the AMX degradation, a given solution after catalytic tests was characterized with HPLC-MS equipment, PROMINENCE-I-C, MS2020, commercialized by Shimadzu (Marne La Vallée, France) of the technical platform of Sorbonne University, with a volume of 20 µL injected and a flux of 15 µL/s. Then, an efficient liquid mixture was obtained by mixing 90% (in weight) water, 10% methanol, and 1% formic acid.
3. Results
3.1. Zn and Fe Containing Powders
Our samples’ specific surface areas, measured via N2 sorption at 77 K and treated using the Brunäuer Emmett Tayler, BET model, are compared in Table 1. It contains the BET averaged values calculated with the mixture. Table 2 contains two results obtained via XRD, the % in weight of the identified phases and the size of the ZFO nanoparticles. The surface of the chemically prepared GO sample obtained using Hummer’s method was large, significantly larger than that of the commercial GP. Its specific surface area was indeed equal to 85.4 m2·g−1. A surface area of 100 m2·g−1 was measured with the (HT-ZFO-GO) nanocomposite which had a surface that was also much larger than that of the non-supported (HT-ZFO) (54 m2·g−1) powder and those of the samples prepared via coprecipitation.
The specific surface area of the samples co-precipitated and calcined varied with the amount of added L64 surfactant added in water during their synthesis. With the samples prepared with low surfactant concentrations, with 1.8 g of L64, the porosity was mainly microporous and macroporous, associated with a hysteresis between 0.8 and 1 and probably due to intergrain porosities.
Based on the XRD analysis, ZnFe2O4 was identified as the main crystalline phase in all samples prepared using the coprecipitation and hydrothermal methods. The diffraction peaks corresponding to this phase were observed at specific 2θ values: 18.2° (111), 29.9° (220), 35.2° (311), 42.8° (400), 53.11° (422), 56.6° (511), and 62.2° (440). These peaks indicate the presence of ZnFe2O4 nanoparticles with a face-centered cubic spinel structure in the Fd-3m space group, as confirmed by the associated h, k, and l Miller indices. In order to differentiate between the various crystalline phases present in addition to the zinc ferrite, samples generated via coprecipitation with the surfactant L64 at 3.6 g and 1.8 g were subjected to X-ray diffraction examinations using a device with a cobalt anticathode (λ = 0.179 nm, Kα of Cobalt). Figure 3 displays the diffraction pattern of the sample Copr-ZFO-L64 = 1.8 g, which was produced via the coprecipitation of the two metal nitrates precursors with sodium hydroxide and 1.8 g of L64. ZnFe2O4 diffraction peaks overlap with minor diffraction peaks of hexagonal hematite α-Fe2O3 and hexagonal (wutzite) or cubic (zincite) ZnO structures.
In addition, Figure 4 presents the diffractogram of the coprecipitated ZFO with added reduced GO (Copr-ZFO-RGO). A narrow peak attributed to the 002 diffraction of the carbon-based lattice, hexagonal and formed by hybridized sp2 carbon atoms in graphene, near 26°. The peak due to 3D graphite is rather observed at 27°. A heat treatment performed under argon at 450 °C instead of air was possible to keep the signature of C species. In that case, some new peaks of ZnO (cubic) were detected.
Moreover, for the samples obtained using the hydrothermal method, the oxide mixture is very enriched in ZnFe2O4 with a cubic structure and also contains ZnO with a zincite (hexagonal) structure and hematite, both of which have a hexagonal structure.
No typical diffraction peaks of oxidized GO (001) or reduced RGO (002) graphene (broad peak circa 25°) can be observed in the X-ray diffraction of the HT-ZFO-GO.
The obtained diffraction patterns were analyzed by the Fullprof program 3.30 [27], with which the Rietveld method was applied to all the diffraction peaks and to all the present crystalline species. We have worked for mixtures of four crystalline phases, hematite, ZFO, and ZnO zincite (hexagonal) or wurtzite (cubic). The EVA program 4.3 provided by Bruker was used to identify the phases and estimate the crystalline phases’ proportions in a weight % given in the left column of Table 2. The sizes indicated in the right column were obtained by applying the Scherer equation with a β constant value of 0.9. With Copr-ZFO-L64 = 3.6 g, the size of the ZFO nanoparticles was equal to 9.0 nm, and it was larger with Copr-ZFO-L64 = 1.8 g at 17.0 nm. The calculated sizes then nicely follow the % of the ZFO phase. Furthermore, the samples obtained via the hydrothermal method are much smaller compared to those obtained via coprecipitation. Precise simulations were obtained using the “Fullprof program” and the obtained results are summarized in Table 2.
Ultrasounds are used to transform commercial graphite 3D into graphene as has been well established in publications such as the work of Stankovick et al. [24], now cited more than 10,000 times. In that article, graphene was obtained in water and hydrazine was added as a stabilizer and reducer. We have used more simple experimental conditions, the replacement of the solvent, water, by ethanol. After the ultrasound treatment (500 W, 45%, pulses 15 s and 15 s stops for an overall time of 2 h), particularly flat but small nanoparticles (compare Figure 5b,c,f) were formed in the presence of Zn and Fe nitrate hydrated precursors. Larger C-sheets were present in Figure 5e and were formed via the chemical synthesis, GO. Figure 5g showed a TEM image of the HT-ZFO-GO hybrid sample on which the ZnFe2O4 nanoparticles were dispersed on GR graphene nanosheets, in pale grey. The commercial graphite GP powder was marketed by the company Aldrich (GP: 7782-42.5). It contains particles of sizes between 100 and 20 μm. We have verified that this size was almost the one observed on the SEM image at a small enlargement (Figure 5a). The important size enlargement of x50 has shown that sheets of C-species were already present inside GP and contain a large amount of thin graphene layers rolled up on themselves, forming concentric cylinders of diameters between 200 and 250 nm (Figure 5a). We have applied a grinding followed by an ultrasound treatment to increase the size of the carbon sheets having a flat aspect.
Spectroscopic information about carbon and oxygen atoms was obtained via XPS (Figure 6). With our commercial graphite powder, GP, the O 1s peak was very small, 0.6% compared to 99.4% in an atomic value % of the peak C 1s. The C 1s over O 1s was then equal to 166. The O 1s increases to be 3% atomic after washing with water. The obtained values deserve attention. Different kinds of O-atoms were expected to be present (hydroxyls, peroxides, carbonyls and carboxylic groups) but the relative % of these species was dependent on the initially used GP and on the experimental conditions. A complete XPS analysis (Table 3) was used to compare the intensities of the C 1s and O 1s signals obtained first on our commercial graphite powder GP and after its first contact with water. The ratio between the surface of the C hybridized sp2 and sp3 is equal to 4.05 with our commercial graphite GP, to 6.08 after its washing with water. For the two samples, C-atoms in both sp2 and sp3 hybridizations were detected. The sp2 atoms belong to graphene domains, in which there are phenyl groups in which each carbon atom is linked to three carbon atoms to form a regular hexagonal flat sheet. The presence of sp3 carbon atoms is relative to structural defects inside those that are amorphous. The percentage of C sp2 atoms was not changing significantly after washing the sample with water (C hybridized sp2 atomic percentage, 58.38 before washing and 62.91% after washing).
For our synthesized GO powder, the typical C 1s over O 1s ratio was located between 1.5 and 2.5. As observed with the commercial sample described above, the C 1s peak was well resolved. With GO, it can even be decomposed into five contributions that were assigned to five distinct functional groups, C-C-C and C hybridized sp2, C-O, C=O, COOH, and CO2 groups [24] with an additional very small peak due to a π-π* transition revealing the formation of flat carbon-sheet domains in which an electronic transition occurred. With RG powder, all the observed peaks were broader than the ones observed with GO and only three peaks were seen through the decomposition of the C 1s peak. The peak O 1s, on the same GO sample, was measured. Three distinct O 1s peaks were observed and located at 530.91, 532.36 and 533.95 eV. The second and third peaks were attributed to O-H, O-C (linked by a single bound) and C-O-C (linked by a double bound). The first peak was due to an extra-oxygen species, water molecules, and was similar to the peak observed on perovskite oxide surfaces [28].
In Table 3, the XPS spectra obtained in five samples are compared. The three first samples in Table 3 correspond to (i) commercial GP, (ii) the same sample washed with water, and (iii) GO obtained via chemical synthesis. The described fourth and fifth samples were HT-ZFO and its equivalent after the dispersion via graphene as the GO species on it (still no heat treatment). The GO was transformed into RGO during an ultrasound treatment applied before to add Fe and Zn precursors.
The XPS spectrum (Figure 7) of the sample prepared via a hydrothermal treatment with HT-ZFO and uncalcined already contained a lot of C-species 30%. These species were not formed if ethanol was replaced by water and not detected via XRD. Furthermore, the XPS spectra were important to demonstrate the coexistence of C, Zn and Fe species at the surface of our sample as well as at the surface of the hybrid catalyst.
In the enlargement relative to the C1s peak before and after the addition of GO and the transformation in RGO, the decomposition of the C 1s signal into four components was possible and was given in Table 3. With the sample prepared via hydrothermal treatment and uncalcined, the ratio between the first XPS peak, attributed to C-C-C and C=C species over the others C species was equal to 70.9/(13.4 + 2.4 + 13.4), then 2.2. After the deposition of the secondary C species, it was equal to 52.3/(31.8 + 3.4 + 11.9) = 1.1.
In the XPS survey of HT-ZFO uncalcined, two clear peaks at 1044.9 and 1021.8 eV were observed and assigned to the Zn 2p½ and Zn 2p3/2 photo-peaks. Their relative positions demonstrate that the zinc cations were divalent, Zn2+. The signature of the Fe cations, located between 733.6 and 711.2 eV, was more complex because of the spin-orbit coupling giving Fe 2p½ and Fe2p3/2 contributions and of several satellites. However, thanks to the satellite positions, a main attribution to Fe3+ rather than Fe2+ cations was proposed. The ratio between Fe and Zn species was equal to 6.8 over 12.5 for the first sample and 4.9 over 9.6 for the second, near two with the two samples. Between the two samples, there was a decreased metallic contribution and an increase in C contribution, as expected. A parallel decrease in O species was observed and was compatible with a mixture of oxides, ZFO, ZnO (hexagonal, zincite, as seen in XRD) and a hematite 5% in weight, as detected in XRD.
3.2. More Information Provided by XRD
The powder samples were scanned over the 10–130° 2θ range, with a step 0.03° during 3 h. The Rietveld analyses were performed with the Fullprof suite [27]. The Thompson–Cox–Hastings peaks profile function with anisotropic spherical harmonics expansion was implemented for all the crystalline phases, as made by Levy et al. [29]. The average dimensions of the zinc ferrite crystallites were computed on the basis of the resolution function measured on an LaB6 reference. The included GFourier program was used to model the shape of coherence of the XRD data on the FWHM measured for the various peaks, and then the h, k, and l directions that were affected by the nanoparticle’s sizes and also by some crystallographic strains. From a crystal-chemical point of view, the zinc ferrite phase only exhibited very faint variations from one sample to the other, with a cell parameter that did not depart from the value measured by Levy et al. via synchrotron diffraction (8.441 Å) [23]. Likewise, the measurement of the site occupancy factors of the cations with a (Zn1−x, Fex) [Fe2x,Znx]O4 model did not reveal significant deviations from the used direct spinel archetype.
3.3. Photocatalytic Results
To access the relative catalytic activity of our solids, experiments were conducted with 1L of aqueous solution prepared with 10 mg of AMX at a pH of 5; to be more specific, 80 mL of this solution were taken and used to suspend 80 mg of the solid catalyst. In addition, the light was turned on after 30 min of equilibration in the dark. A first blank experiment was made at a pH of 5 where no significant decay in AMX concentration occurred during a 225 min illumination.
The degradation rate of the given organic molecules in heterogeneous photocatalysis may depend upon the adsorption capability of the catalyst surface.
Looking at the first 30 min of contact between the solid catalysts and the solutions containing AMX, the phenomenon observed is the spontaneous adsorption of AMX on the surface of the solids. It is more effective in the case of the solids prepared via the hydrothermal treatment (Figure 8A,B) than the samples prepared via coprecipitation.
Samples prepared via coprecipitation using 3.6 and 1.8 g of L64 surfactant had better catalytic activities under the visible light than the sample obtained under similar conditions but without surfactant. A percentage of 73 and 79% of the introduced AMX molecules were degraded in 250 min by Copr-ZFO-L64 = 3.6 g and Copr-ZFO-L64 = 1.8 g, respectively. Figure 8(Ac) shows that the initial C species present in the sample Copr-ZFO-RGO did not produce a better activity (45%) than observed with the sample obtained via coprecipitation with the two metallic salts and one added surfactant (1A–1B). Consequently, the better activities of the sample obtained with surfactant were attributed to the high surface area of this sample compared to the other sample (Table 1). However, these solids are less active than those obtained via the hydrothermal method.
None of our coprecipitated samples were able to remove 100% of the AMX antibiotic in our experimental conditions. The situation was clearly different with the mixture of oxides obtained using a hydrothermal treatment.
Spinel nanoparticles, obtained via hydrothermal treatment, are particularly active and small. Their activity has been associated or not with an exfoliated and reduced graphite. While looking at the first 30 min of the photocatalytic test carried out (Figure 8B), we noticed that the phenomenon of the adsorption of AMX on the surface of the materials is more efficient in the case of the HT-ZFO-GO composite, which is consistent with the fact that it has a specific surface area twice as large as the ZnFe2O4 alone. The light was turned on after 30 min. Then, we observed the complete oxidation of the AMX. However, the sample obtained via coprecipitation, Copr-ZFO-L64 = 3.6 g and via hydrothermal HT-ZFO-GO have the same BET surface area but different adsorption properties. The mixtures of nanoparticles that were prepared using a hydrothermal method in ethanol HT-ZFO-GO, enriched in C species detected by XPS, had a higher adsorption of AMX on the surface than the Copr-ZFO-L64 = 3.6 g. The presence of the amorphous carbone species may lead to the improved detected adsorption.
Furthermore, the degradation of AMX is faster in the presence of a spinel/ZnO/hematite mixture obtained via the hydrothermal method without graphene (the 100% decomposition of AMX is obtained after 100 min of testing) compared to a similar mixture of oxides with graphene (a longer time of 150 min is necessary for the complete disappearance of AMX) (Table 4). This unexpected drop in activity is associated with the presence of carbonaceous particles in solution despite their low weight (2% by mass), which might slow down the arrival of light on the active NPs.
To analyze the catalytic results summarized in Figure 9, we have supposed that the rate of the reaction of AMX oxidation was of the first order, in which case it was changing with time and depended of the remaining AMX concentration in the solution. Using a kinetical constant that was labelled kapp for the apparent, v = kapp × [AMX]1residual was calculated:
where kapp (kinetic constant) is expressed in min−1, an initial [AMX]0 = Co concentration and [AMX] = Ct concentration of AMX remaining in solution at a given t time of a reaction in minutes. On the graph representing Ln (Co − Ct)/Co as a function of time, kapp was the slope that was measured at short times. The kapp rate constant with the catalysts synthesized via the hydrothermal treatment in ethanol was presented in Figure 9, the kapp initial of the photocatalytic removal of AMX under visible light was 0.075 min−1 on HT-ZFO-GO, higher than the one measured on the catalyst without added carbon-species HT-ZFO with which a three-times-lower kapp constant was obtained: 0.0287 min−1.
−Ln Ct/C0 = kapp × t
However, care should be taken, because several active species were present and after an initially very rapid reaction, the removal of 100% of the AMX required more time when additional GR was present (150 min instead of 100 min with HT-ZFO) (Table 5). Almost the same rate of reaction has been reported recently with MOF catalysts, In-based MOF and oxidized graphene [30]. Some other studies carried out on the removal of AMX via heterogeneous photocatalysis with semiconductors under visible light and at the same pH are summarized in Table 5, which shows the high catalytic activity of our catalyst.
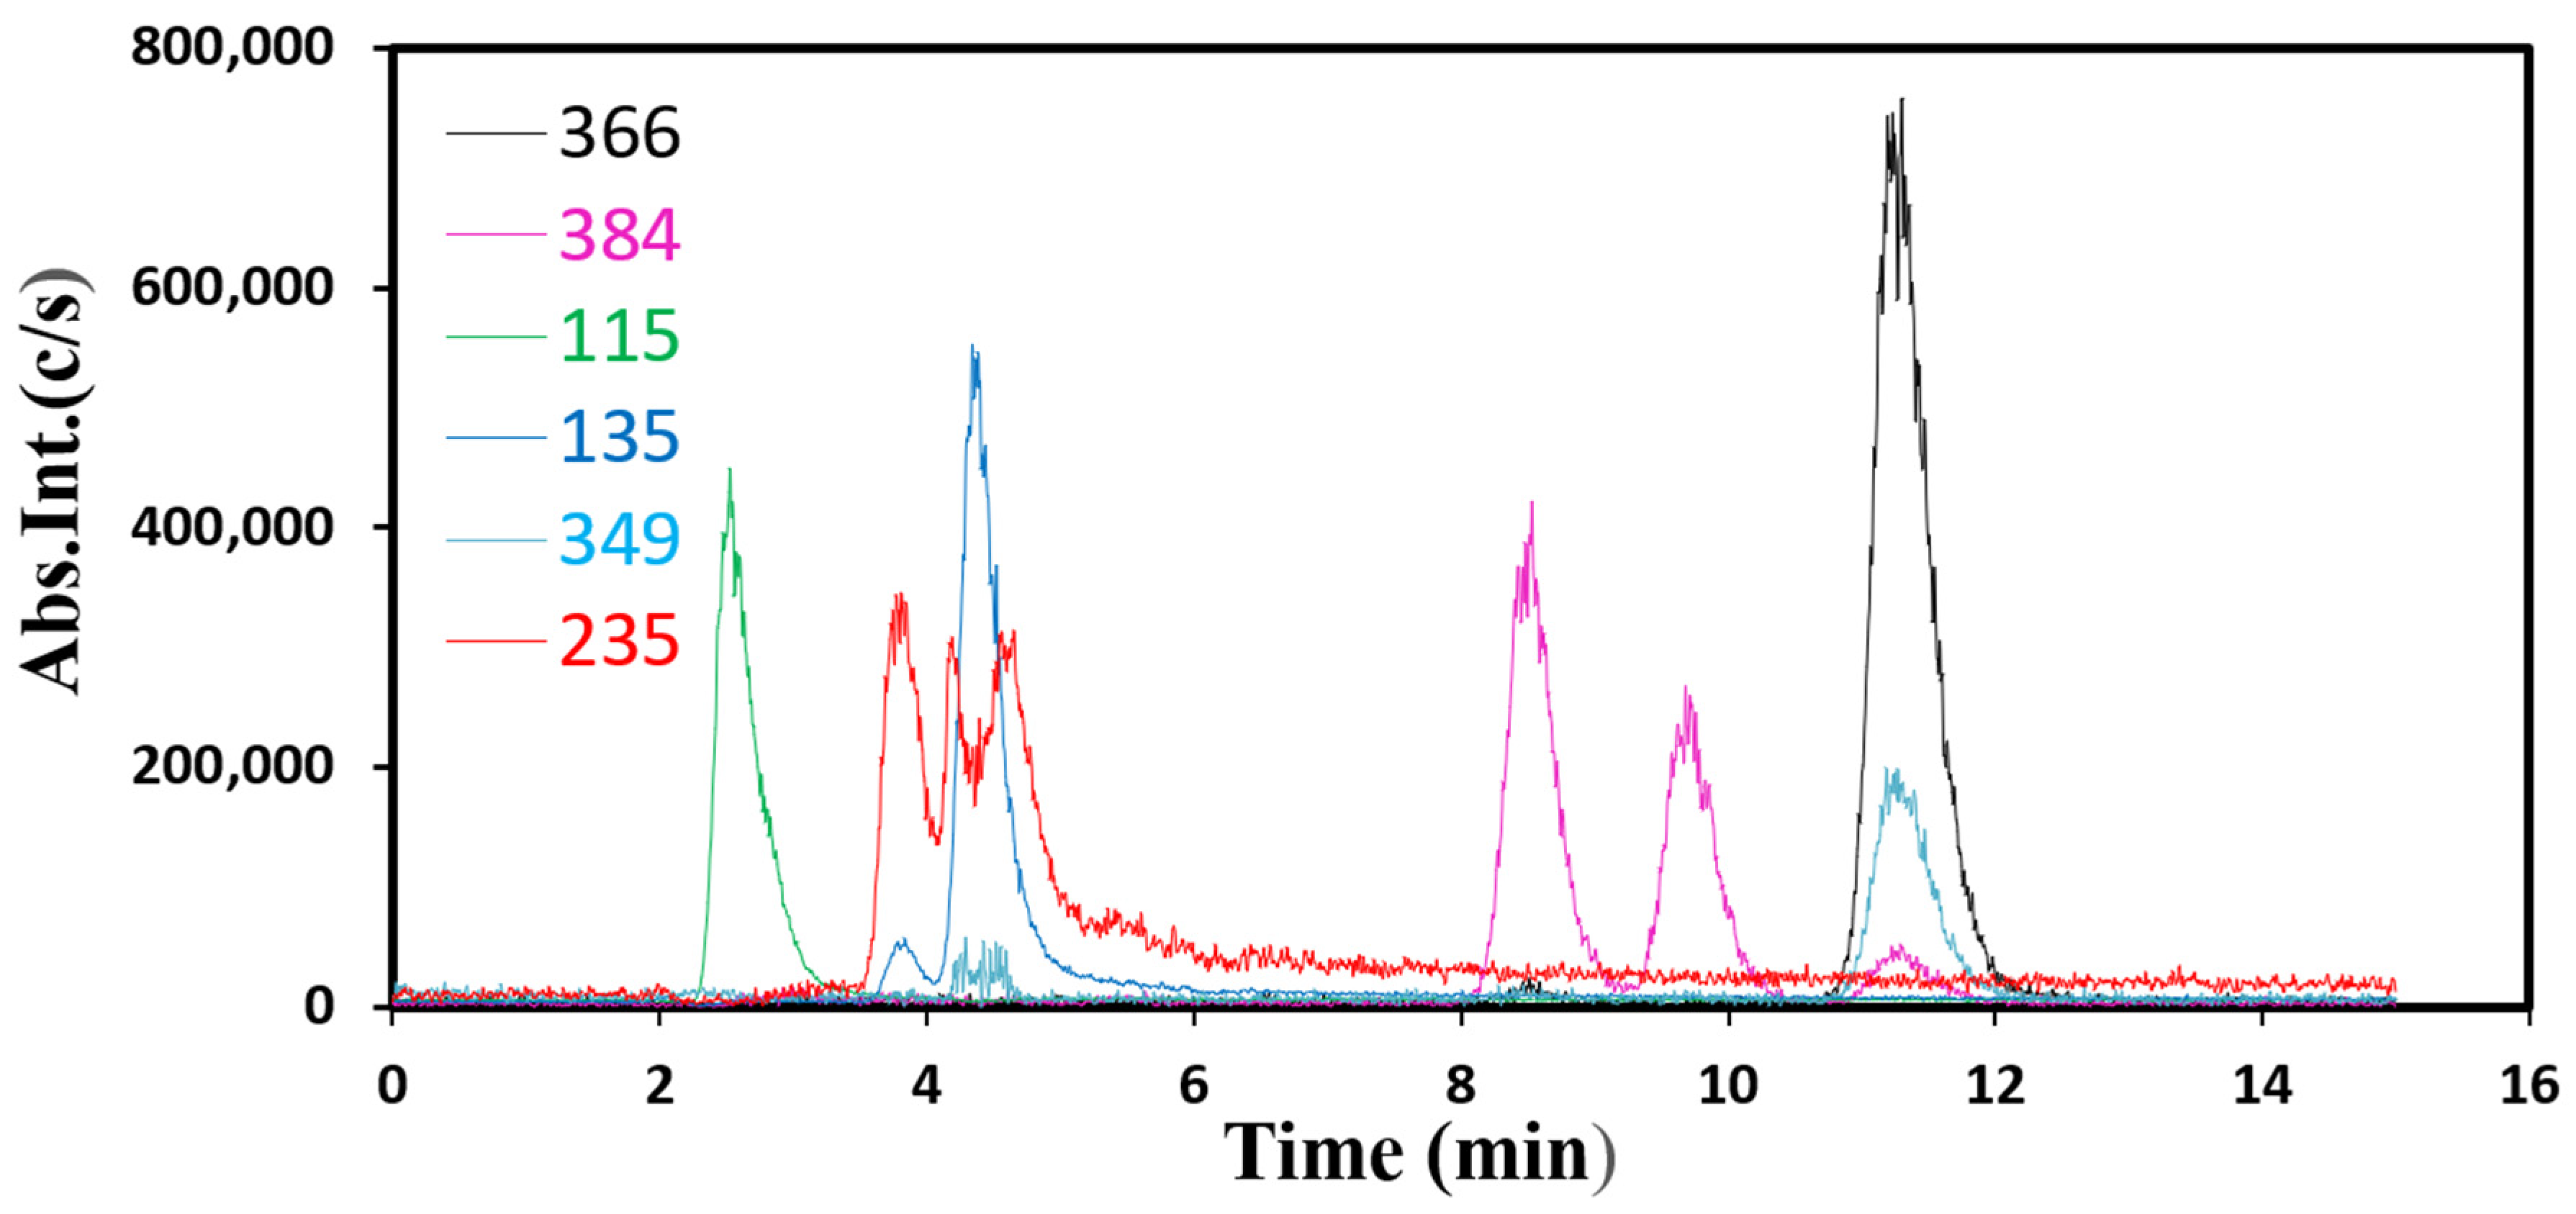
Finally, with a co-precipitated sample prepared with a surfactant (L64, 3.6 g) Copr-ZFO-L64 = 3.6 g, a solution after the catalytic tests that yields up to 80% AMX degradation was characterized using the LC-ESI-MS equipment, on a platform of teaching at Sorbonne University to study the fragments of AMX removal (Figure 10, additional Mass Spectra presented in Supplementary Information 4). On this equipment, the spectra were recorded by the UV-visible spectra on the gas generated by the solution recovered after 225 min of a catalytic test and storage in a refrigerator at 4 °C for a few days. We have identified several cationic fragments, with our attributions being correlated with five references. The first one [33] described the strongly acidic decomposition of AMX molecules in water. The second [34] was important since the mean and standard deviations in the measured masses were taken into account using five distinct experimental batches. The third study [35] was devoted to AMX contamination in pigs treated with AMX alone and treated with a mixture of AMX and a clavulanic antibiotic. Extractions were made using 10 mM of a potassium dihydrogeno phosphate of sodium buffer at a pH of 4.5. Ref. [36] was devoted to the degradation products formed when AMX molecules were submitted to sunlight in the presence of Fe2+ cations and of H2O2. More oxidized products are expected to be formed in these conditions. The last publication also deserves attention since fragments were identified and attributions of MS signals were discussed. The main fragments detected at several times of elution within our experimental set-up were presented in the Mass spectra that are presented in Supplementary Information:
- -
- At 11.3 min of elution, m/z = 366
- -
- At 8.5 and 9.7 min of elution, same m/z = 384
- -
- At 2.5 min of elution m/z = 115
- -
- At 4.4 min m/z = 135, 235 and 349
Figure 10 presents the superposed HPLC chromatographic measurements.
LC-ESI-MS spectra were collected in the positive ion mode with which only positively charged fragments were detected. The peak at m/z 366 was not due only to AMX-H+ residual ions, but rather to its mixture with diketopiperazine 2, 5 amoxicillin cation that corresponds to the same chemical formulae. The second molecule was formed by the opening of the β-rings, and some atoms’ rearrangement to form six-atom rings. AMX and this molecule have the same weight but different polarities. The peak at m/z 349 was due to AMX molecules after the departure of an ammonia NH3 group. The peak at m/z 384 was absent because of the complete hydrolysis of this molecule, formed via the hydration of AMX. The peak m/z 235 was due to a disulfide molecule C9H16NO2S2. An m/z value of 114 has been attributed to C4H4NOS, which was protonated at +1 in our samples.
4. Conclusions
The present study evaluated the degradation of AMX via visible irradiation in the presence of ZFO as a catalyst. Catalysts rich in ZFO, containing traces of hematite and/or FeO (wurtzite, zincite), with different sizes and shapes were prepared using coprecipitation and a hydrothermal method. Both catalysts obtained via the hydrothermal method with and without GO were able to completely remove AMX from an aqueous solution. This catalyst had high adsorption properties, larger than the ones of the samples prepared via coprecipitation. Therefore, high adsorption plays a crucial role in promoting the efficiency of photocatalytic reactions. Moreover, it can be supposed that the active species (h+, •OH, and •O2−) produced during the photocatalytic reaction, have a role in promoting AMX degradation.
Author Contributions
Methodology, A.J., Y.C., A.D., T.H. and J.T.; Software, A.J. and J.T.; Validation, A.J., Y.C., A.D., G.W., T.H. and J.T.; Formal analysis, A.J., Y.C., A.D. and J.T.; Investigation, A.J., A.D., G.W., T.H. and J.T.; Resources, A.D. and J.T.; Writing—original draft, A.J., A.D. and J.T.; Writing—review & editing, A.J., A.D. and T.H.; Supervision, Y.C., A.D., G.W., T.H. and J.T. All authors have read and agreed to the published version of the manuscript.
Funding
The MCEMA Laboratory had financed the PhD of Aya Jezzini. Measurements were funded by Sorbonne University, CNRS and Région Ile de France, and are part of FCMat FR2482.
Data Availability Statement
The original contributions presented in the study are included in the article, further inquiries can be directed to the corresponding author.
Acknowledgments
David Montero is gratefully acknowledged for helping conduct SEM experiments. Antoine Miche is also acknowledged for helping conduct XPS measurements and Sandra Casale for conducting the TEM experiments. The Federation of Chemistry and Materials of Paris-Center. Romain Descamps is also working for Sorbonne Université, UFR de Chimie, Plateforme Chimie Analytique Physique Spectroscopies (CAPS), Paris, France, and is acknowledged for his kind technical assistance in Mass Spectroscopy.
Conflicts of Interest
The authors declare no conflicts of interest.
References
- Dimitrakopoulou, D.; Rethemiotaki, I.; Frontistis, Z.; Xekoukoulotakis, N.P.; Venieri, D.; Mantzavinos, D. Degradation, mineralization and antibiotic inactivation of amoxicillin by UV-A/TiO2 photocatalysis. J. Environ. Manag. 2012, 98, 168–174. [Google Scholar] [CrossRef] [PubMed]
- Andreozzi, R.; Canterino, M.; Marotta, R.; Paxeus, N. Antibiotic removal from wastewaters: The ozonation of amoxicillin. J. Hazard. Mater. 2005, 122, 243–250. [Google Scholar] [CrossRef] [PubMed]
- Al-Madanat, O.; AlSalka, Y.; Curti, M.; Dillert, R.; Bahnemann, D.W. Mechanistic insights into hydrogen evolution by photocatalytic reforming of naphthalene. ACS Catal. 2020, 10, 7398–7412. [Google Scholar] [CrossRef]
- Malato, S.; Fernández-Ibáñez, P.; Maldonado, M.; Blanco, J.; Gernjak, W. Decontamination and disinfection of water by solar photocatalysis: Recent overview and trends. Catal. Today 2009, 147, 1–59. [Google Scholar] [CrossRef]
- Armaković, S.J.; Savanović, M.M.; Armaković, S. Titanium dioxide as the most used photocatalyst for water purification: An overview. Catalysts 2022, 13, 26. [Google Scholar] [CrossRef]
- AlSalka, Y.; Al-Madanat, O.; Hakki, A. TiO2-based photocatalytic hydrogen production: How to transfer it to an applicable approach? Appl. Catal. A Gen. 2023, 662, 119287. [Google Scholar] [CrossRef]
- Narayan, H.; Alemu, H.; Macheli, L.; Sekota, M.; Thakurdesai, M.; Rao, G. Role of particle size in visible light photocatalysis of Congo Red using. Bull. Mater. Sci. 2009, 32, 499–506. [Google Scholar] [CrossRef]
- Sun, S.; Yang, X.; Zhang, Y.; Zhang, F.; Ding, J.; Bao, J.; Gao, C. Enhanced photocatalytic activity of sponge-like ZnFe2O4 synthesized by solution combustion method. Prog. Nat. Sci. Mater. Int. 2012, 22, 639–643. [Google Scholar] [CrossRef]
- Tabaja, N. Nanoparticules D’oxydes de fer et de Ferrites Obtenues par Nano-Réplication: Réactivité Chimique et Application en Dépollution des Eaux. Chimie Analytique; Université Pierre et Marie Curie—Paris VI; Université Libanaise, Faculté des Sciences: Beyrouth, Liban, 2015; Available online: https://theses.hal.science/tel-01255306 (accessed on 1 February 2024).
- Tabaja, N.; Brouri, D.; Casale, S.; Zein, S.; Jaafar, M.; Selmane, M.; Toufaily, J.; Davidson, A.; Hamieh, T. Use of SBA-15 Silica Grains for Engineering Mixtures of Oxides CoFe and NiFe for Advanced Oxidation Reactions under Visible and NIR. Appl. Catal. B Environ. 2019, 253, 369–378. [Google Scholar] [CrossRef]
- Ferroudj, N.; Nzimoto, J.; Davidson, A.; Talbot, D.; Briot, E.; Dupuis, V.; Bée, A.; Medjram, M.S.; Abramson, S. Maghemite nanoparticles and maghemite/silica nanocomposite microspheres as magnetic Fenton catalysts for the removal of water pollutants. Appl. Catal. B Environ. 2013, 136–137, 9–18. [Google Scholar] [CrossRef]
- Naseri, M.G.; Saion, E.B.; Hashim, M.; Shaari, A.H.; Ahangar, H.A. Synthesis and characterization of zinc ferrite nanoparticles by a thermal treatment method. Solid. State Commun. 2011, 151, 1031–1035. [Google Scholar] [CrossRef]
- Pérez-Parada, A.; Agüera, A.; Gómez-Ramos, M.d.M.; García-Reyes, J.F.; Heinzen, H.; Fernández-Alba, A.R. Behavior of amoxicillin in wastewater and river water: Identification of its main transformation products by liquid chromatography/electrospray quadrupole time-of-flight mass spectrometry. Rapid Commun. Mass. Spectrom. 2011, 25, 731–742. [Google Scholar] [CrossRef]
- Yao, C.; Zeng, Q.; Goya, G.F.; Torres, T.; Liu, J.; Wu, H.; Ge, M.; Zeng, Y.; Wang, Y.; Jiang, J.Z. ZnFe2O4 Nanocrystals: Synthesis and Magnetic Properties. J. Phys. Chem. C 2007, 111, 12274–12278. [Google Scholar] [CrossRef]
- Chen, X.-J.; Dai, Y.-Z.; Wang, X.-Y.; Guo, J.; Liu, T.-H.; Li, F.-F. Synthesis and characterization of Ag3PO4 immobilized with graphene oxide (GO) for enhanced photocatalytic activity and stability over 2,4-dichlorophenol under visible light irradiation. J. Hazard. Mater. 2015, 292, 9–18. [Google Scholar] [CrossRef]
- Shi, X.F.; Xia, X.Y.; Cui, G.W.; Deng, N.; Zhao, Y.Q.; Zhuo, L.H.; Tang, B. Multiple exciton generation application of PbS quantum dots in ZnO@ PbS/graphene oxide for enhanced photocatalytic activity. Appl. Catal. B Environ. 2015, 163, 123–128. [Google Scholar] [CrossRef]
- Zhu, M.; Chen, P.; Liu, M. Graphene Oxide Enwrapped Ag/AgX (X = Br, Cl) Nanocomposite as a Highly Efficient Visible-Light Plasmonic Photocatalyst. ACS Nano 2011, 5, 4529–4536. [Google Scholar] [CrossRef] [PubMed]
- Mata, J.P. Concentration, temperature, and salt-induced micellization of a triblock copolymer Pluronic L64 in aqueous media. J. Colloid Interface Sci. 2005, 292, 548–556. [Google Scholar] [CrossRef] [PubMed]
- Xia, H.; Qian, Y.; Fu, Y.; Wang, X. Graphene anchored with ZnFe2O4 nanoparticles as a high-capacity anode material for lithium-ion batteries. Solid. State Sci. 2013, 17, 67–71. [Google Scholar] [CrossRef]
- Hummers, W.S.; Offeman, R.E. Preparation of Graphitic Oxide. J. Am. Chem. Soc. 1958, 80, 1339. [Google Scholar] [CrossRef]
- Tarcan, R.; Todor-Boer, O.; Petrovai, I.; Leordean, C.; Astilean, S.; Botiz, I. Reduced graphene oxide today. J. Mater. Chem. C (RSC) 2020, 8, 1198. [Google Scholar] [CrossRef]
- Park Ruoff Park, S.; Ruoff, R.S. Chemical Methods for the Production of Graphenes. Nat. Nanotechnol. 2009, 4, 217–224. [Google Scholar] [CrossRef]
- Merino, F. Vitamin C Is an Ideal Substitute for Hydrazine in the Reduction of Graphene Oxide Suspensions. J. Phys. Chem. C 2010, 114, 6426–6432. [Google Scholar] [CrossRef]
- Stankovich, S.; Dikin, D.A.; Piner, R.D.; Kohlhaas, K.A.; Kleinhammes, A.; Jia, Y.; Wu, Y.; Nguyen, S.T.; Ruoff, R.S. Synthesis of graphene-based nanosheets via chemical reduction of exfoliated graphite oxide. Carbon 2007, 45, 1558–1565. [Google Scholar] [CrossRef]
- Sinthiya, M.M.; Ramamurthi, K.; Mathuri, S.; Manimozhi, T.; Kumaresan, N.; Margoni, M.M.; Karthika, P.C. Synthesis of zinc ferrite (ZnFe2O4) nanoparticles with different capping agents. Int. J. Chem. Tech. Res. 2015, 7, 2144–2149. [Google Scholar]
- Zia, H.; Shalchian, N.; Borhanian, F. Kinetics of amoxicillin degradation in aqueous solutions. Can. J. Pharm. Sci. 2008, 12, 80–83. [Google Scholar]
- Carvaval, R. Fullprof: A Program for Rietveld Refinement and Pattern Matching Analysis, Abstracts of the Satellite Meeting on Powder Diffraction of the XV Congress of the IUCr. In Proceedings of the Satellite Meeting on Powder Diffraction of the XV Congress of the IUCr, Toulouse, France, 16–19 July 1990; p. 127. [Google Scholar]
- Zhao, X.; Yang, Q.; Cui, J. XPS study of surface absorbed oxygen of ABO3 mixed oxides. J. Rare Earths 2008, 26, 511–514. [Google Scholar] [CrossRef]
- Levy, D.; Pavese, A.; Hanfland, M. Synthetic MgAl2O4 (spinel) at high-pressure conditions (0.0001–30 GPa): A synchrotron X-ray powder diffraction study. Am. Mineral. 2003, 88, 93–98. [Google Scholar] [CrossRef]
- Yang, C.; You, X.; Cheng, J.; Zheng, H.; Chen, Y. A novel visible-light-driven In-based MOF/graphene oxide composite photocatalyst with enhanced photocatalytic activity toward the degradation of amoxicillin. Appl. Catal. B Environ. 2017, 200, 673–680. [Google Scholar] [CrossRef]
- Al-Musawi, T.J.; Yilmaz, M.; Ramírez-Coronel, A.A.; Al-Awsi, G.R.L.; Alwaily, E.R.; Asghari, A.; Balarak, D. Degradation of amoxicillin under a UV or visible light photocatalytic treatment process using Fe2O3/bentonite/TiO2: Performance, kinetic, degradation pathway, energy consumption, and toxicology studies. Optik 2023, 272, 170230. [Google Scholar] [CrossRef]
- Fakhri, A.; Khakpour, R. Synthesis and characterization of carbon or/and boron-doped CdS nanoparticles and investigation of optical and photoluminescence properties. J. Lumin. 2015, 160, 233–237. [Google Scholar] [CrossRef]
- Reyns, T.; Cherlet, M.; De Baere, S.; De Backer, P.; Croubels, S. Rapid method for the quantification of amoxicillin and its major metabolites in pig tissues by liquid chromatography-tandem mass spectrometry with emphasis on stability issues. J. Chromatogr. B 2008, 861, 108–116. [Google Scholar] [CrossRef] [PubMed]
- Trovó, A.G.; Pupo Nogueira, R.F.; Agüera, A.; Fernandez-Alba, A.R.; Malato, S. Degradation of the antibiotic amoxicillin by Photo-Fenton process—Chemical and toxicological assessment. Water Res. 2011, 45, 1394–1402. [Google Scholar] [CrossRef] [PubMed]
- Frański, R.; Czerniel, J.; Kowalska, M.; Frańska, M. Electrospray ionization collision-induced dissociation tandem mass spectrometry of amoxicillin and ampicillin and their degradation products: ESI-CID-MS/MS of amoxicillin and ampicillin and degradation products. Rapid Commun. Mass. Spectrom. 2014, 28, 713–722. [Google Scholar] [CrossRef] [PubMed]
- Arsand, J.B.; Hoff, R.B.; Jank, L.; Meirelles, L.N.; Díaz-Cruz, M.S.; Pizzolato, T.M.; Barceló, D. Transformation products of amoxicillin and ampicillin after photolysis in aqueous matrices: Identification and kinetics. Sci. Total Environ. 2018, 642, 954–967. [Google Scholar] [CrossRef]
Figure 1.
Experimental setup used for coprecipitation.
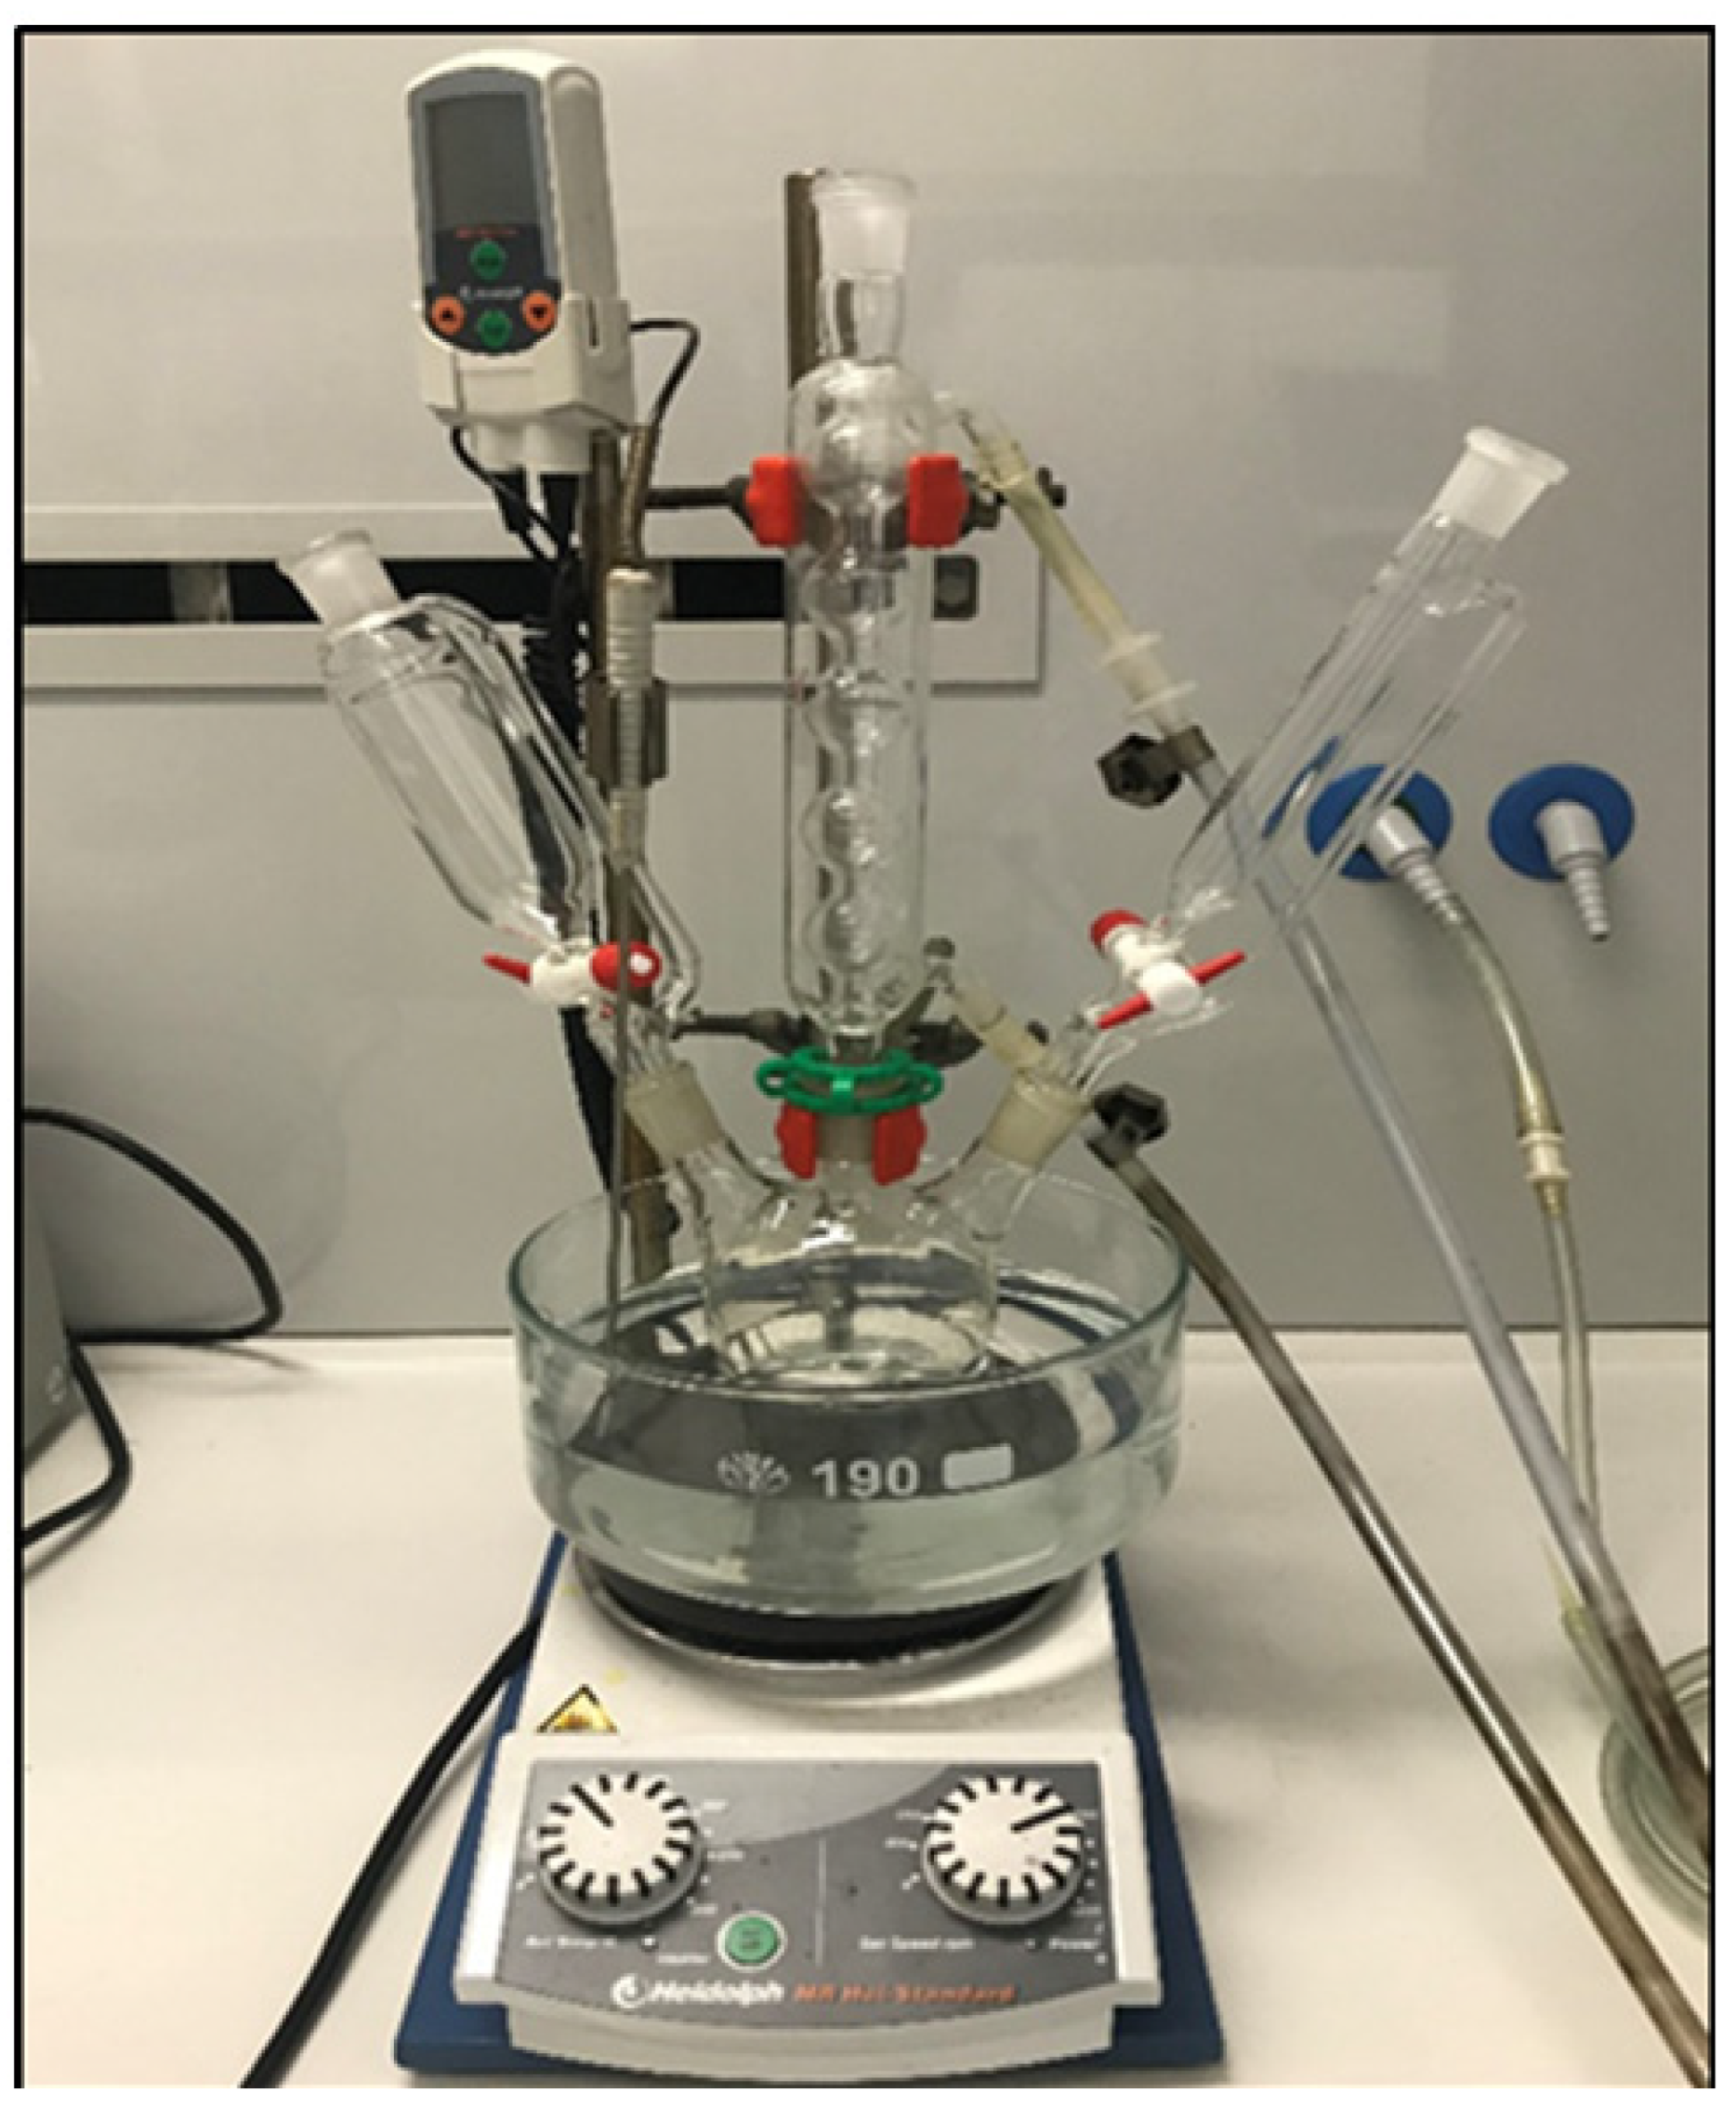
Figure 2.
Spectra of the used LED lamp.
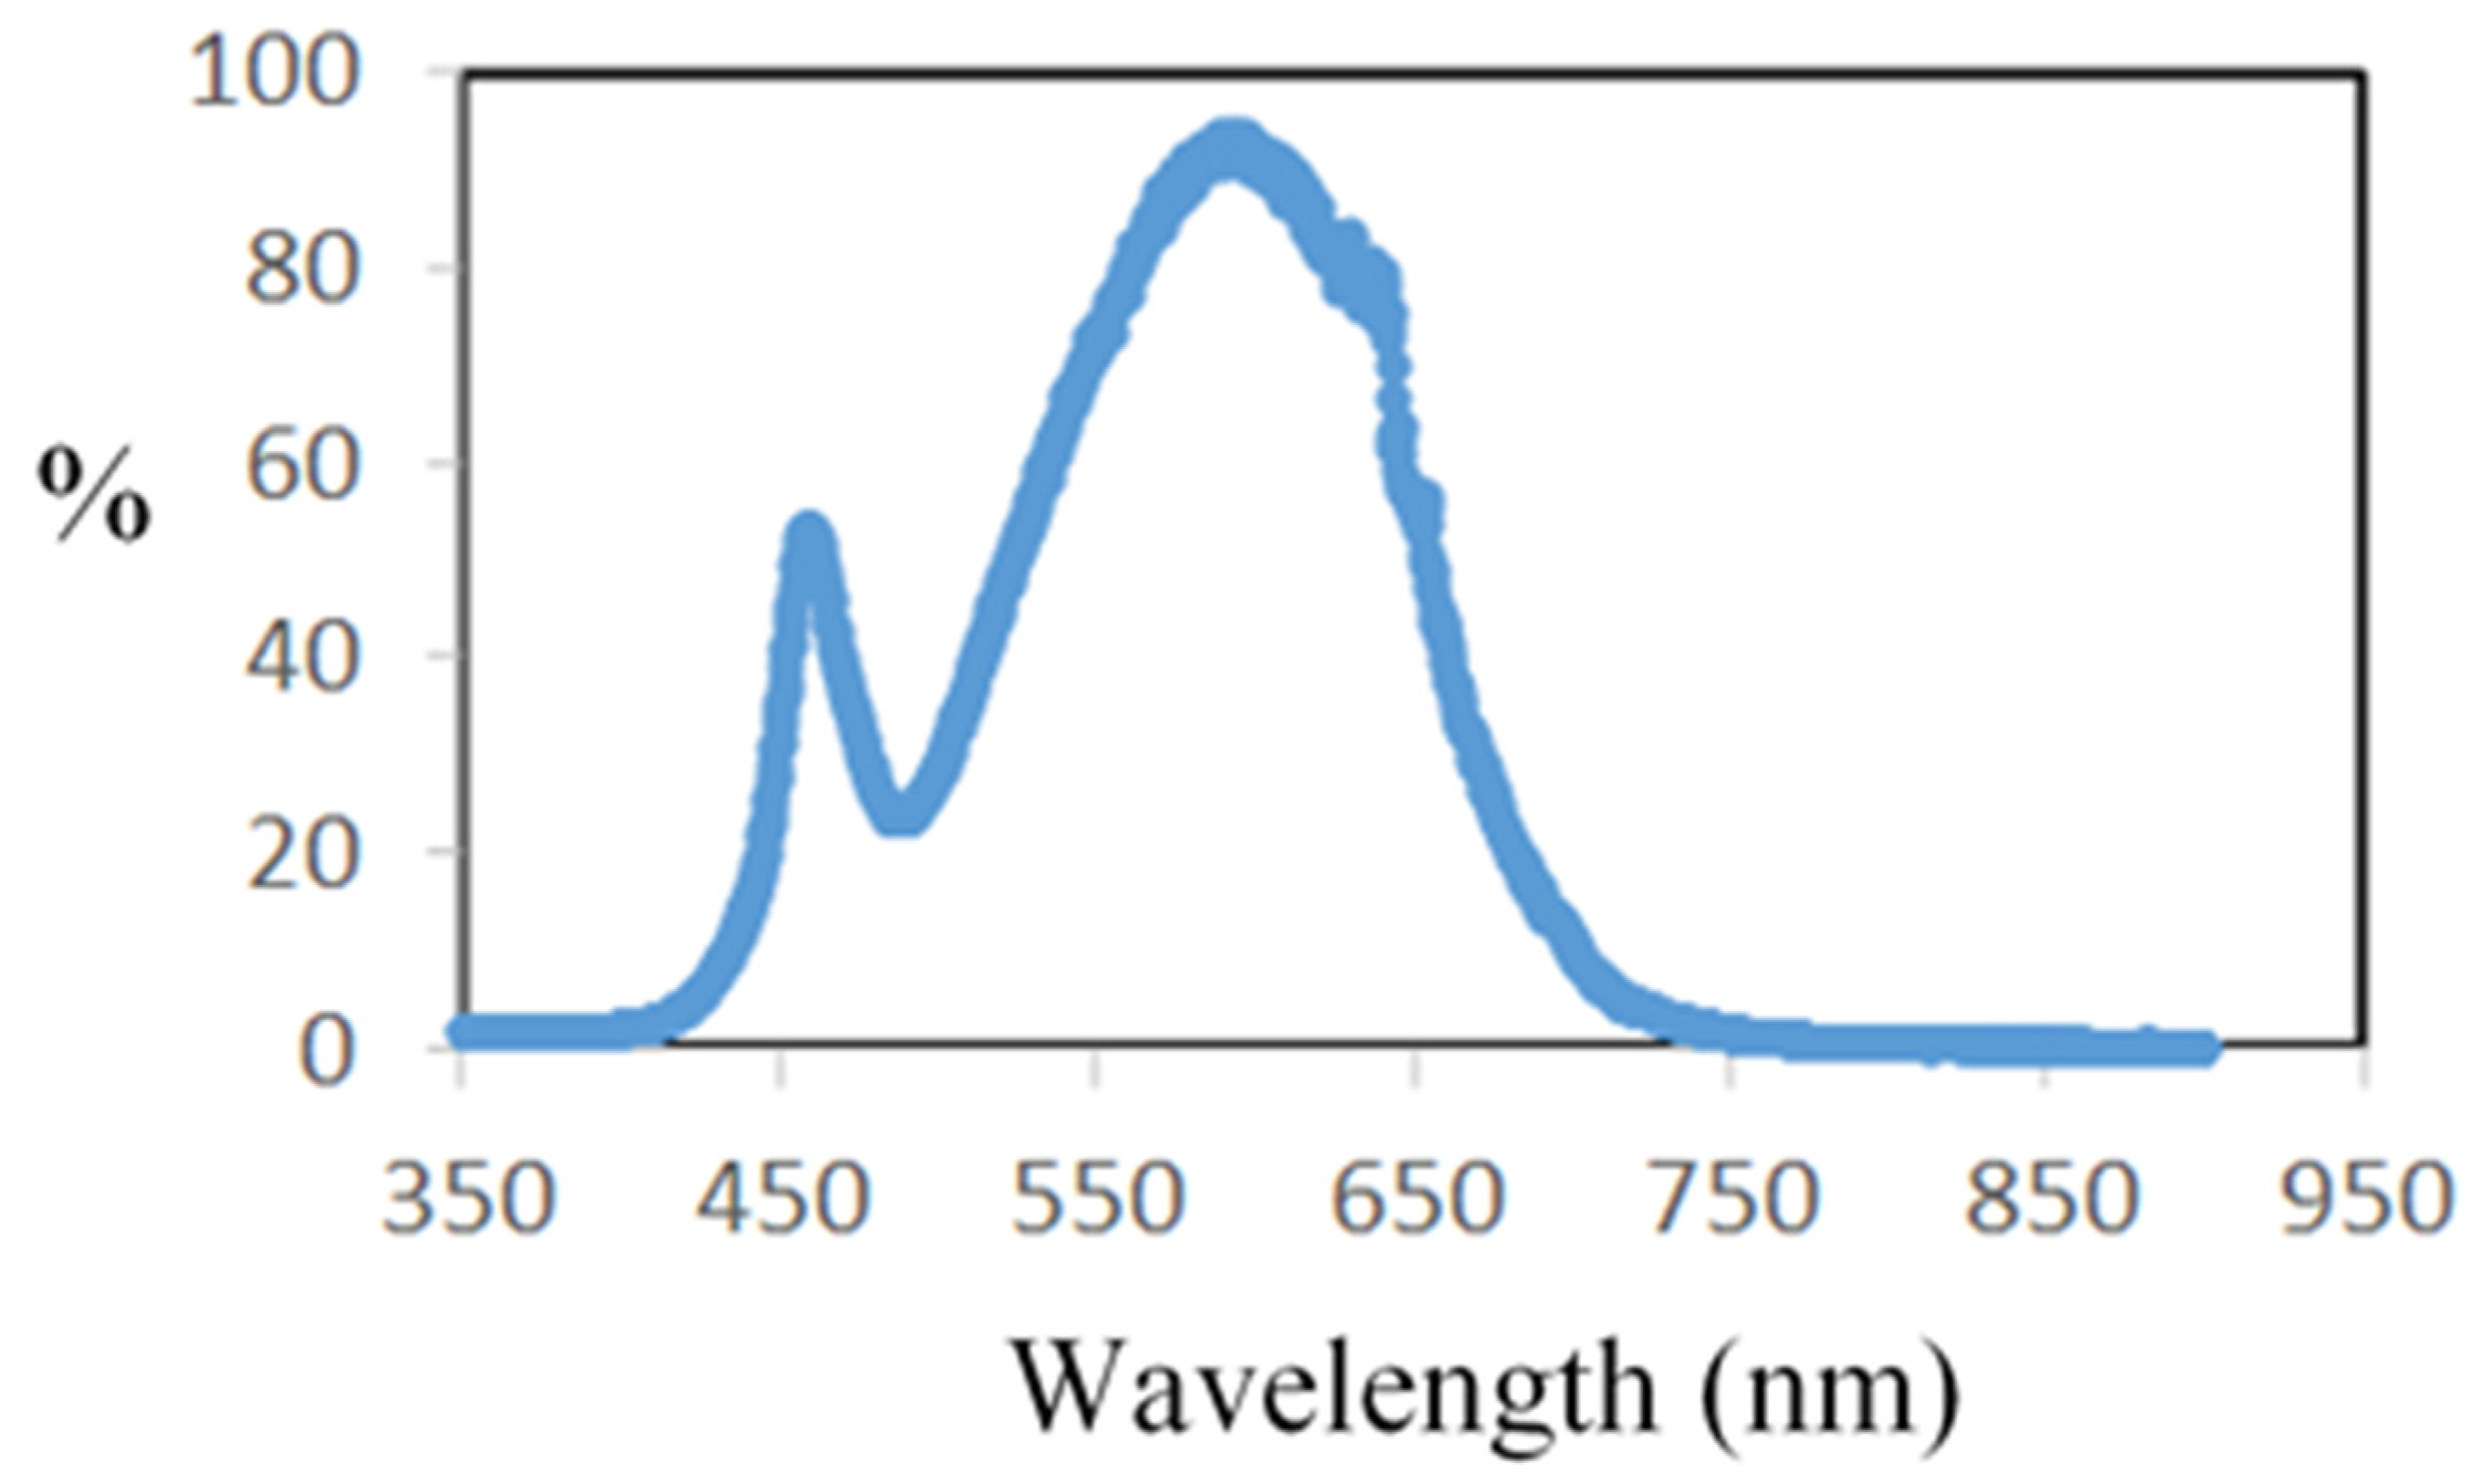
Figure 3.
XRD diffraction patterns recorded with a diffractometer equipped with a Co source on Copr-ZFO-L64 = 1.8 g. Possible hkl values of diffraction peaks indexed, in black: cubic spinel ZnFe2O4, in blue: ZnO (hexagonal), in Red: hematite, α-Fe2O3.
Figure 3.
XRD diffraction patterns recorded with a diffractometer equipped with a Co source on Copr-ZFO-L64 = 1.8 g. Possible hkl values of diffraction peaks indexed, in black: cubic spinel ZnFe2O4, in blue: ZnO (hexagonal), in Red: hematite, α-Fe2O3.
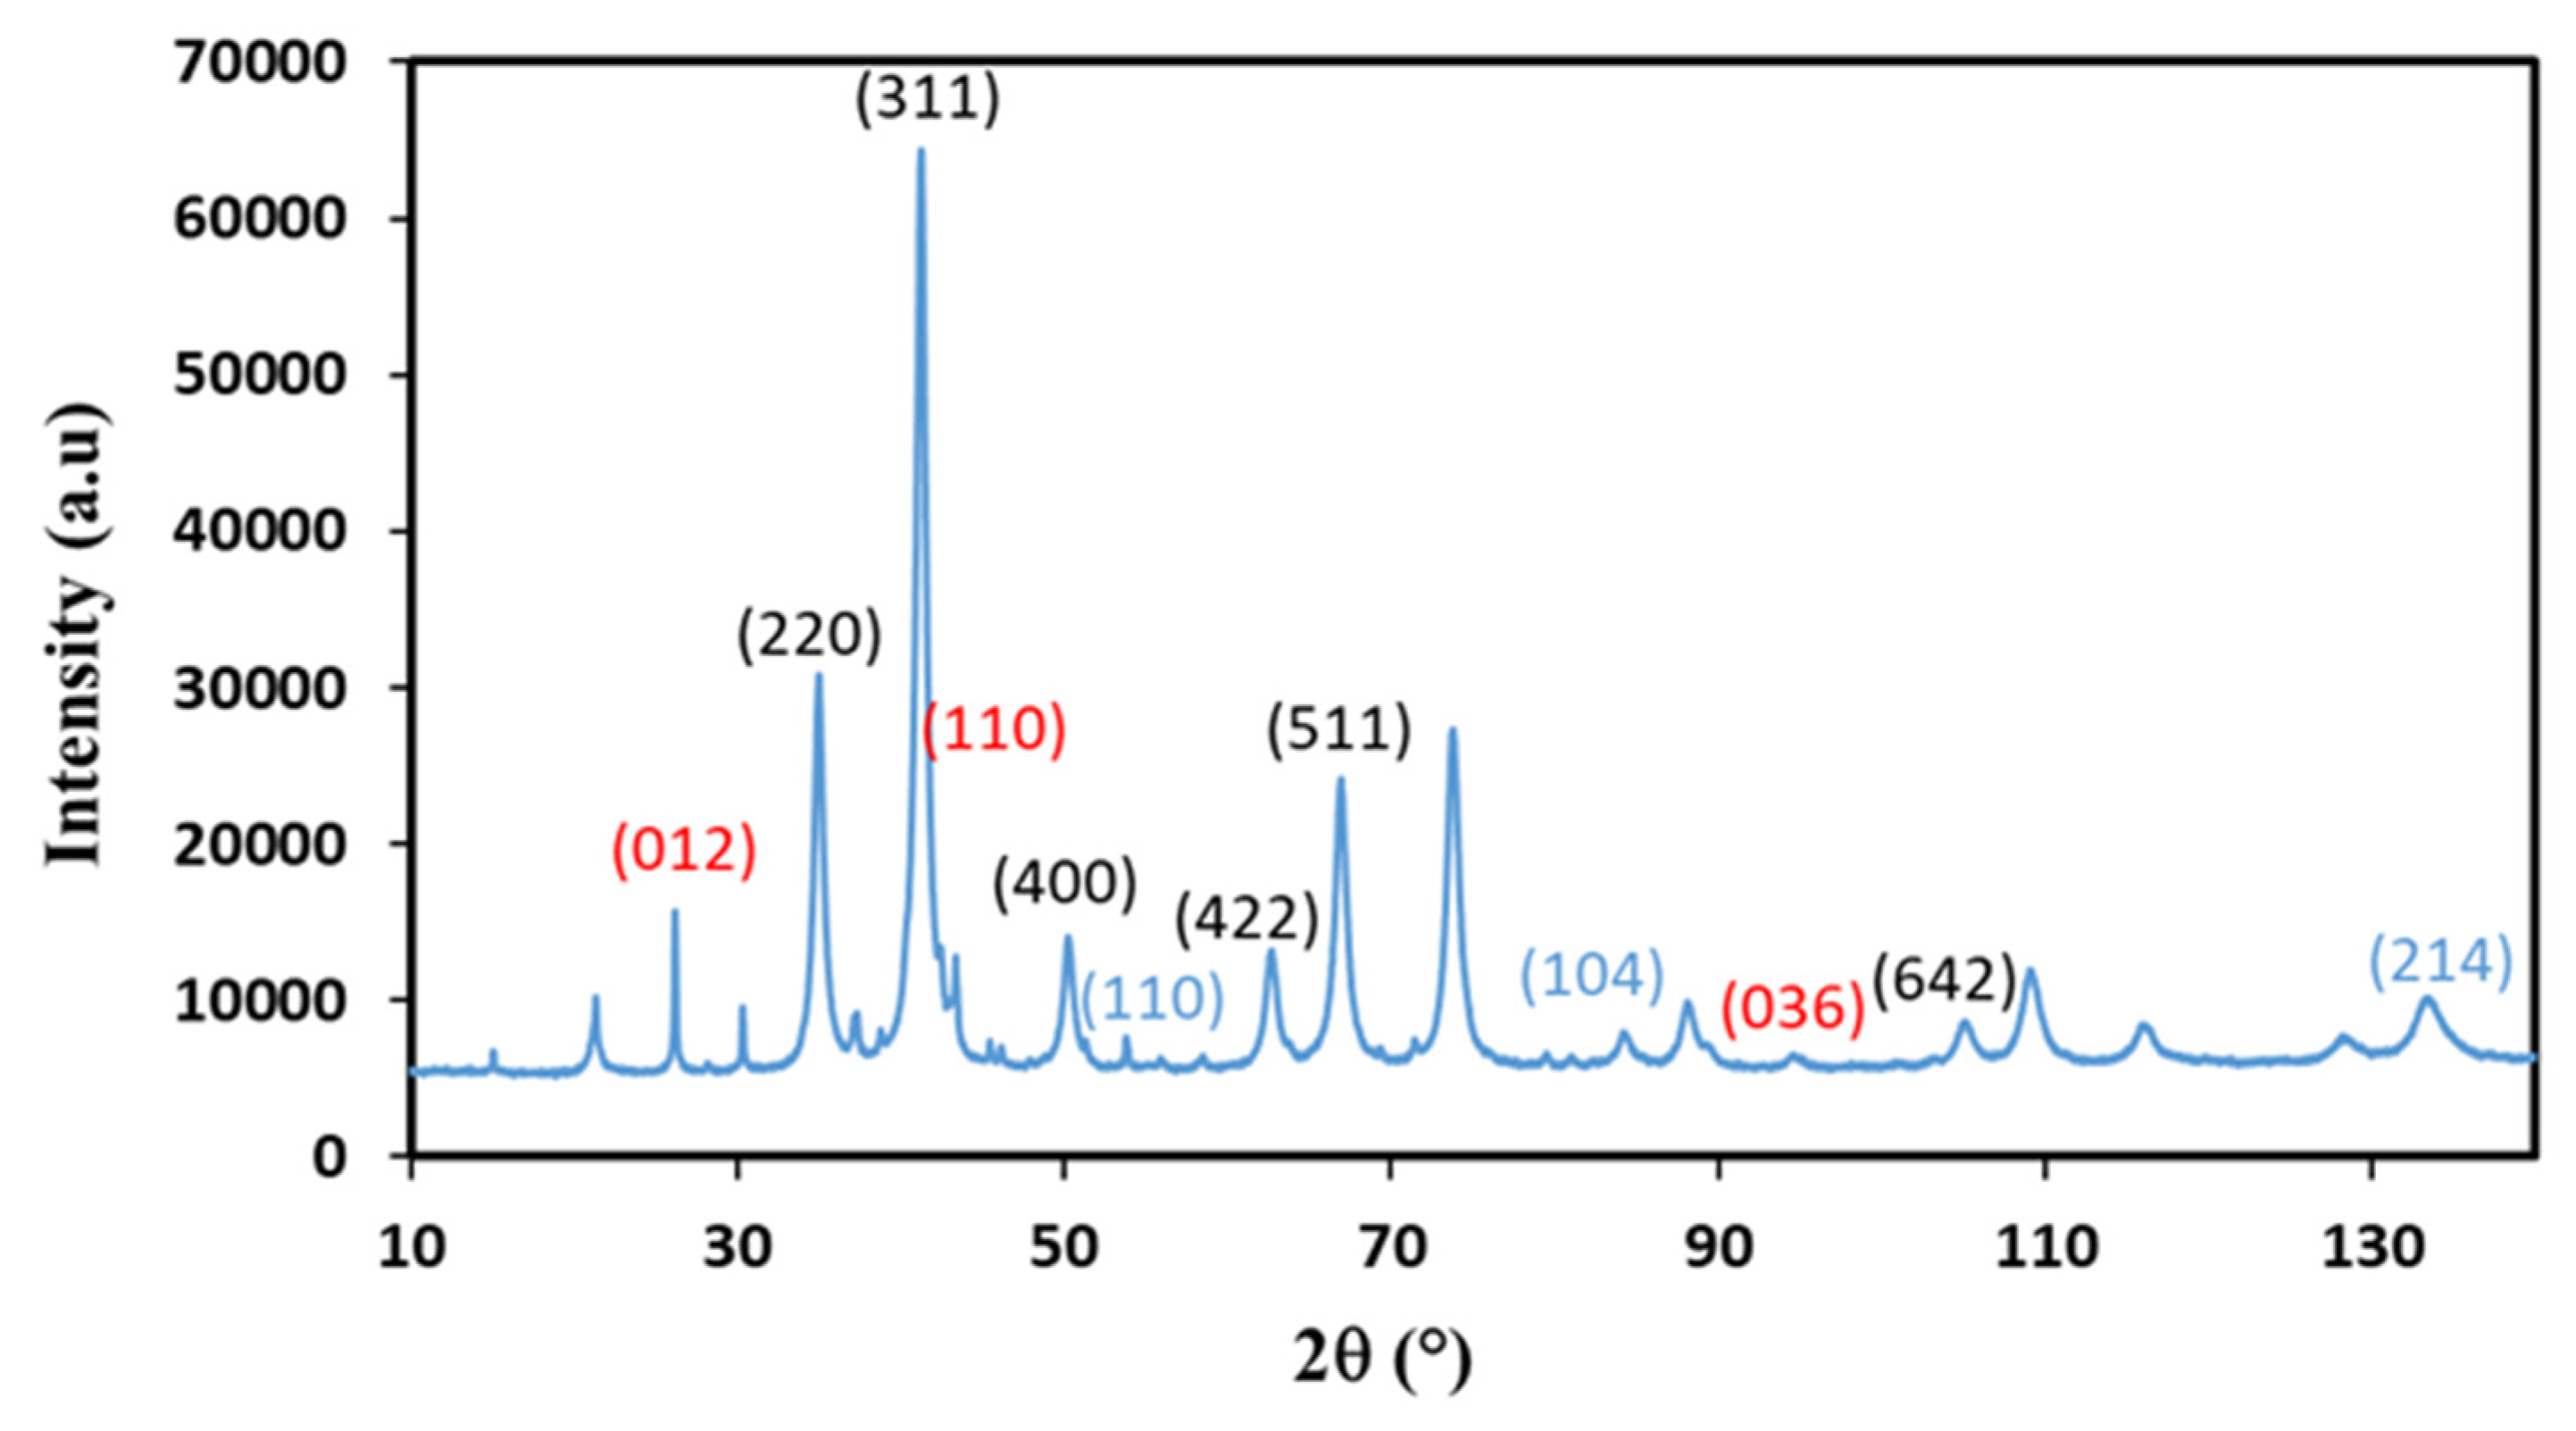
Figure 4.
XRD diffraction patterns recorded with a diffractometer equipped with the Cu Kα radiation of Copr-ZFO-RGO heat treated under Argon. Main crystalline phase (indexation in black): spinel ZnFe2O4. Indexation in blue: ZnO (hexagonal).
Figure 4.
XRD diffraction patterns recorded with a diffractometer equipped with the Cu Kα radiation of Copr-ZFO-RGO heat treated under Argon. Main crystalline phase (indexation in black): spinel ZnFe2O4. Indexation in blue: ZnO (hexagonal).
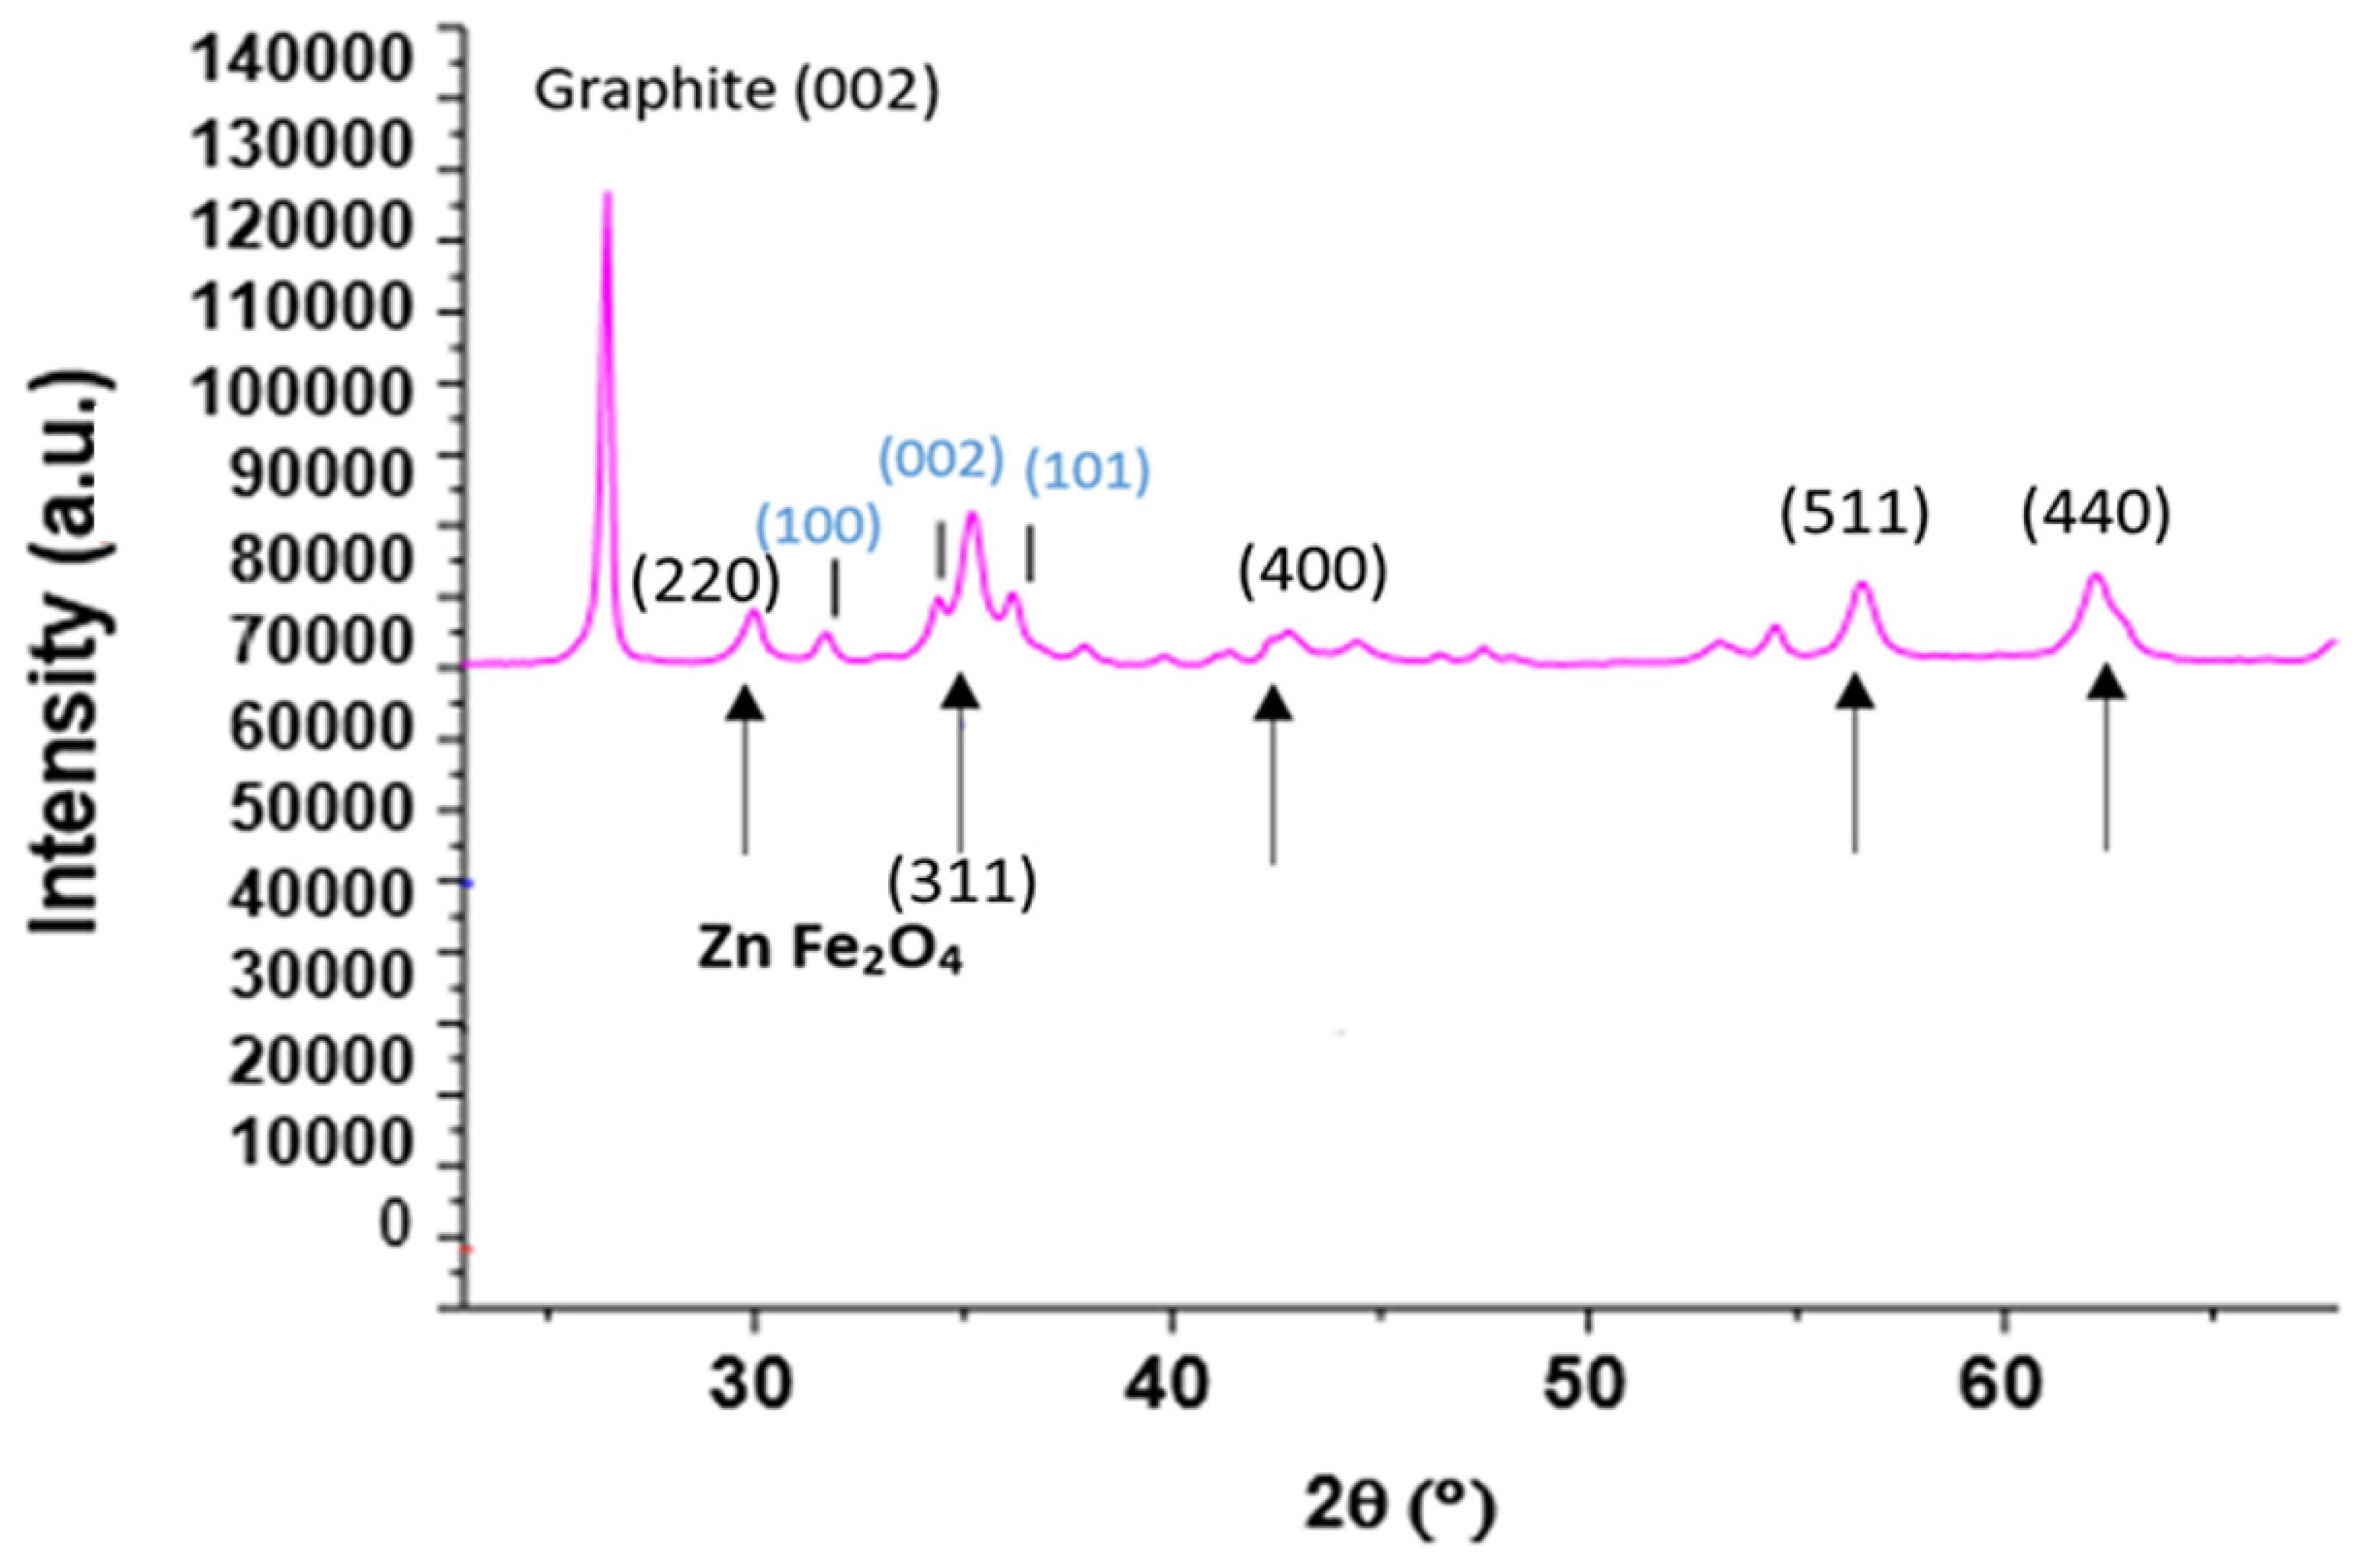
Figure 5.
SEM and TEM micrographs, PART A: (a) SEM image of the commercial graphite sample, GP, large scale (100 μm), PART B: SEM image of the (b) commercial graphite powder, scale/50 (2 μm) to evidence thin sheets of C-species forming large cylinders (diameter: 250 nm in average, with a length of several microns) and the (c) same sample grinded. PART C TEM images: (d) image on a particularly thin nanoparticle present in the GP, a (e) particular thin GO particle obtained via a chemical method, the (f) same, then (d) after an ultrasound treatment, and (g) with the hydrothermal treatment HT-ZFO-GO nanoparticles.

Figure 6.
C 1s and O 1s regions as measured via XPS with three samples: (a) commercial graphite (GP), (b) GR washed, and (c) GO obtained via a chemical treatment (Pi-Pi* transition, i.e., bonding to antibonding transition).
Figure 6.
C 1s and O 1s regions as measured via XPS with three samples: (a) commercial graphite (GP), (b) GR washed, and (c) GO obtained via a chemical treatment (Pi-Pi* transition, i.e., bonding to antibonding transition).

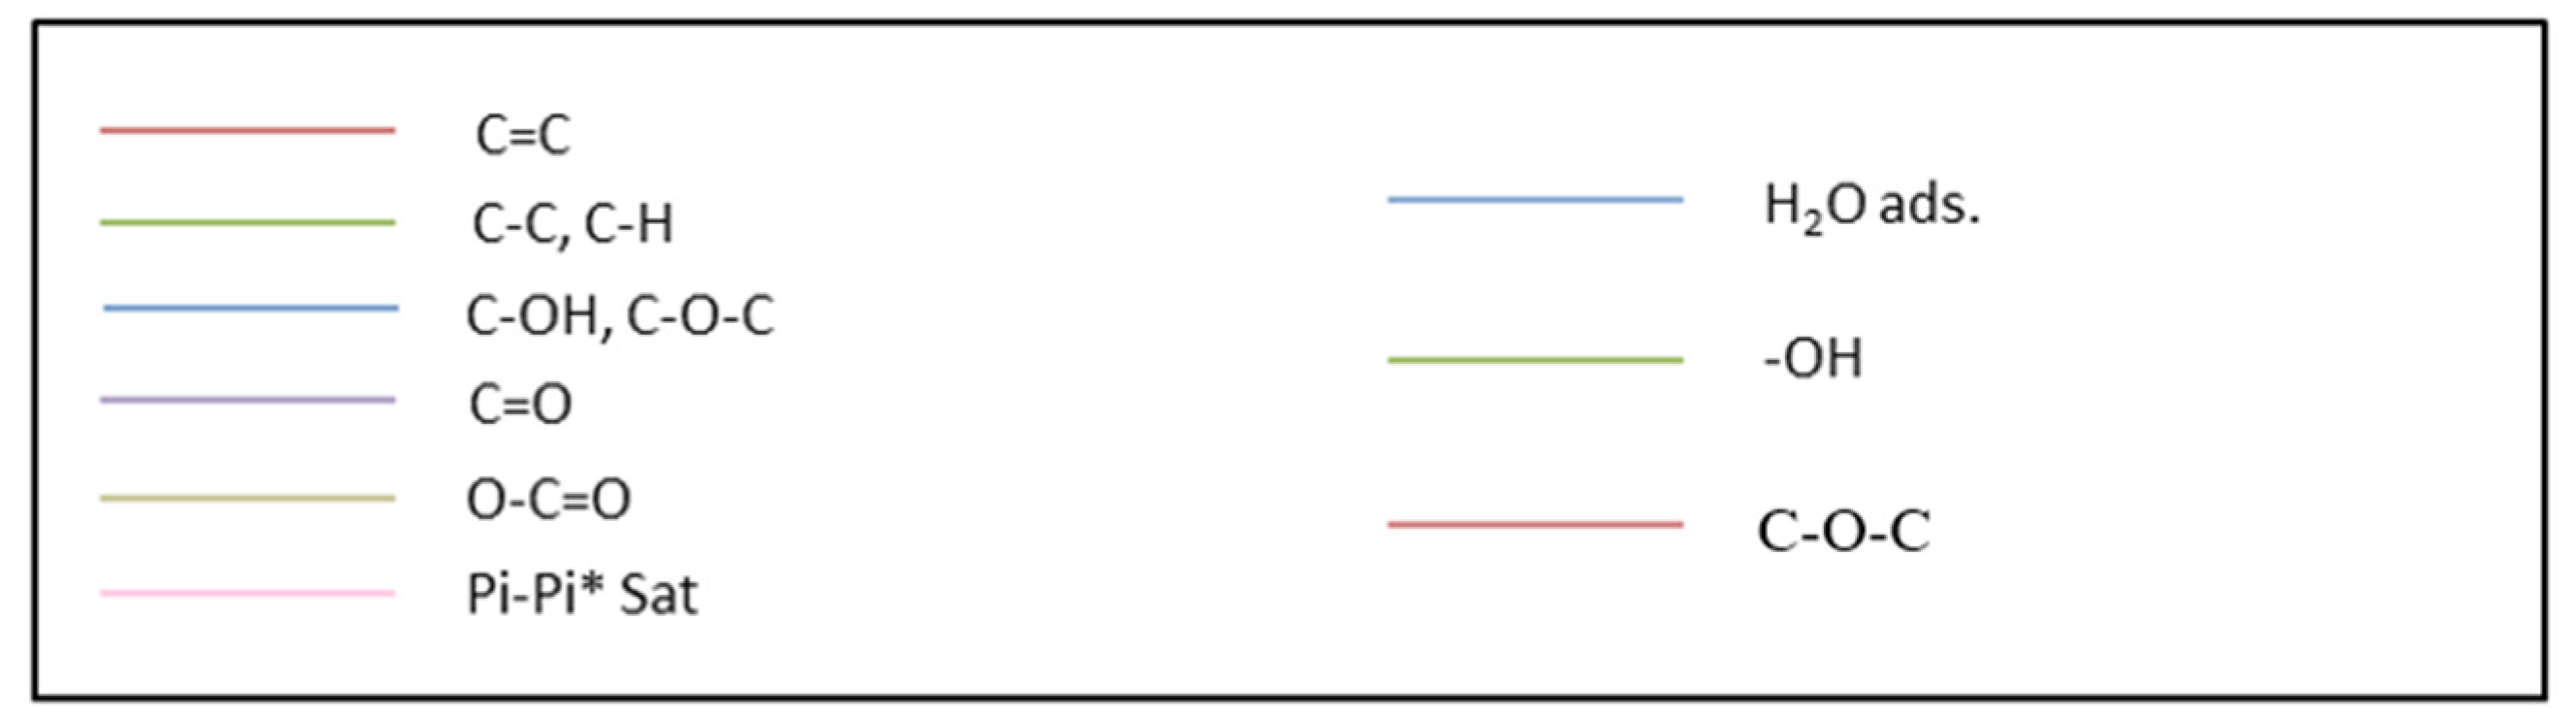
Figure 7.
Survey XPS spectrum of the sample containing HT-ZFO uncalcined with indicated positions of the O 1s, C 1s, Fe 2p and Zn 2p peaks positions. A TEM image of this sample is presented in the graphical abstract. As indicated in the text, this sample contains small ZFO particles and a large amount of C species that were generated during the hydrothermal treatment performed in ethanol.

Figure 8.
Catalytic tests and relative catalysts activities. (A) Several solid samples obtained via the coprecipitation of (a) Copr-ZFO-L64 = 3.6 g, (b) Copr-ZFO-L64 = 1.8 g and (c) Copr-ZFO-RGO. (B) Two solids prepared via hydrothermal treatment without and with the final addition of 80 mg of GO, reduced using a sonothermal treatment of (a) HT-ZFO and (b) HT-ZFO-GO.

Figure 9.
Rate of removal of AMX, measured on (a) HT-ZFO, (b) HT-ZFO-GO.

Figure 10.
Representative HPLC curves of the [M-H+] fragments to detect fragments at 2.5, 4.4, 8.5, 9.7 and 11.3 min of elution.
Figure 10.
Representative HPLC curves of the [M-H+] fragments to detect fragments at 2.5, 4.4, 8.5, 9.7 and 11.3 min of elution.

Table 1.
Catalyst specific surface area, obtained using the BET formula applied to the first points of the N2 isotherm.
Table 1.
Catalyst specific surface area, obtained using the BET formula applied to the first points of the N2 isotherm.
| Preparation Method | Specific Surface Area (m2·g−1) |
|---|---|
| Commercial Graphite GP | 14 |
| Chemical Method GO | 85 |
| Physical Method (RGO) Ultrasounds (pulses of 15 s, stop 15 s, overall time 2 h) | 16 |
| HT-ZFO | 54 |
| HT-ZFO-GO | 100 |
| Copr-ZFO | 35 |
| Copr-ZFO-L64 = 3.6 g | 51 |
| Copr-ZFO-L64 = 1.8 g | 47 |
| Copr-ZFO-RGO | 17 |
Table 2.
Composition of the crystalline phases and averaged values of dimension calculated with EVA, on ZFO nanoparticles, with a spinel (cubic) structure.
Table 2.
Composition of the crystalline phases and averaged values of dimension calculated with EVA, on ZFO nanoparticles, with a spinel (cubic) structure.
| Sample | Composition Fullprof Qualitative Quantification of Identified Phases in Weight (%) | Size of ZFO Nanoparticles (nm) |
|---|---|---|
| HT-ZFO | 86% ZFO 4% Fe-oxide (hematite variety) (α-Fe2O3, hematite variety) 10% Zn-oxide (hexagonal, wurtzite) | 6.0 |
| HT-ZFO-GO | 95% ZFO 5% Fe-oxide (α-Fe2O3, hematite) | 7.0 |
| Copr-ZFO-L64 = 3.6 g | 91% ZFO 9% Zn-oxide (hexagonal, zimcite) | 9.0 |
| Copr-ZFO-L64 = 1.8 g | 97% ZFO 2% Zn-oxide 1% (α-Fe2O3, hematite variety) | 17.0 |
| Copr-ZFO-RGO | 12% ZnFe2O4 8% ZnO (wurtzite) 81% Graphite | 11.0 |
Table 3.
Comparison of XPS results (main peaks’ position, relative surface for each decomposition peak and overall atomic %). In 3A, three samples: (3A1) Commercial GP, this sample contains a lot of thin layers of graphene stabilized by (3A2) commercial GP washed with water and (3A3) GO obtained via synthesis. In 3B, two samples: (3B1) HT-ZFO, as obtained via a hydrothermal treatment and (3B2) HT-ZFO-GO with some additional deposit of GO. On the two last samples, the total of the identified species is not equal to 100% because of some impurities (Si, Cl) present in small proportions.
| A. Sample | Peak | Attribution | Position (eV) | Relative Surface % | By Element Atomic Percentage |
|---|---|---|---|---|---|
| Commercial Sigma Aldrich | C 1s | C sp2 | 284.530 | 58.38 | 99.4 |
| C sp3 | 285.006 | 14.40 | |||
| C-OH, C-O-C | 286.690 | 7.48 | |||
| C=O | 288.300 | 5.20 | |||
| COOH | 290.015 | 4.33 | |||
| π-π* | 291.875 | 9.72 | |||
| O 1s | O with two negative charges | 532.561 | 18.12 | 0.6 | |
| -OH | 534.038 | 76.42 | |||
| O with one negative charge | 536.41 | 5.46 | |||
| Washed graphite | C 1s | C sp2 | 284.534 | 62.91 | 97.2 |
| C sp3 | 285.000 | 10.34 | |||
| C-OH, C-O-C | 286.415 | 6.69 | |||
| C=O | 287.729 | 4.45 | |||
| COOH | 289.103 | 3.23 | |||
| π-π* | 291.345 | 12.37 | |||
| O 1s | C-OH | 531.824 | 70.74 | 2.8 | |
| C=O | 533.303 | 23.36 | |||
| COOH | 535.208 | 5.90 | |||
| GO | C 1s | C sp2 | 284.118 | 29.94 | 63.0 |
| C sp3 | 283.353 | 14.47 | |||
| C-OH C-O-C | 285.506 | 13.81 | |||
| C=O | 286.713 | 32.31 | |||
| COOH | 288.483 | 5.66 | |||
| π-π* | 290.522 | 3.82 | |||
| O 1s | O with two negative charges; C=O | 530.91 | 4.75 | 30.0 | |
| C-OH or C-O | 532.36 | 47.09 | |||
| O with one negative charge C-O-C | 533.95 | 48.17 | |||
| B1 | Attribution | Position | Area | Atomic % | |
| HT-ZFO | C sp2 C=C | 284.4 | 57.5 | 2.2 | |
| C sp3 C-C | 284.9 | 488.1 | 18.8 | ||
| C-OH, C-O-C | 286.3 | 96.3 | 3.7 | ||
| C=O | 287.8 | 20.4 | 0.8 | ||
| O-C=O | 288.6 | 102.1 | 3.9 | ||
| π -> π* | 290.5 | 35.7 | 1.4 | ||
| N 1s | 399.9 | 17.9 | 0.4 | ||
| O 1s (O with two negative charges, O2−) | 529.8 | 2000.8 | 26.3 | ||
| O 1s (−OH, hydroxide) | 531.3 | 1448.1 | 19.1 | ||
| O 1s (O with one negative charge O−) | 532.7 | 67.2 | 0.9 | ||
| Zn 2p | 1021.4 | 2879.8 | 6.5 | ||
| Fe 2p | 710.8 | 4815.4 | 12.5 | ||
| Cl 2p | 198.6 | 40.3 | 0.8 | ||
| Si 2p | 100.7 | 48.6 | 2.7 | ||
| B2 | Attribution | Position | Area | Atomic % | |
| HT-ZFO-GO | C sp2 | 284.6 | 378.0 | 14.5 | |
| C sp3 | 285.1 | 344.9 | 13.4 | ||
| C-OH, C-O-C | 285.5 | 122.4 | 4.7 | ||
| C=O | 287.9 | 35.6 | 1.5 | ||
| π -> π* | 291.1 | 77.2 | 2.9 | ||
| N 1s | 400.1 | 39.4 | 0.8 | ||
| O 1s (O with two negative charges) | 530.2 | 1601.8 | 21.0 | ||
| O 1s (-OH, Hydroxide) | 531.8 | 1232.5 | 16.2 | ||
| O 1s (O with one negative charge) | 533.2 | 182.53 | 2.4 | ||
| Zn 2p | 1021.9 | 2109.5 | 4.8 | ||
| Fe 2p | 711.2 | 3170.7 | 9.2 | ||
| Cl 2p | 198.8 | 29.5 | 0.6 | ||
| Si 2p | 103.4 | 3.7 | 3.7 | ||
Table 4.
Results obtained by photocatalyst.
| Sample | Removal of AMX after 165 or 225 min (in Concentration %) |
|---|---|
| Copr-ZFO | Weak |
| Copr-ZFO-RGO | 45% of AMX removal after 225 min but never 100% |
| Copr-ZFO-L64 = 1.8 g | Strong, 79% of AMX removal after 225 min but never 100% |
| Copr-ZFO-L64 = 3.6 g | Strong, 73% of AMX removal after 225 min but never 100% |
| HT-ZFO-GO | Very strong, 100% AMX removal after 100 min |
| HT-ZFO | Very strong, 100% AMX removal in less than 100 min if light is on. |
Table 5.
Performances of photocatalytic degradation properties reported in several reports.
| Article | Optimum Conditions | Efficiency (%) |
|---|---|---|
| This study | 1 g/L HT-ZnFe2O4, 10 mg/L AMX Under visible LED light pH = 5 | −100% in less than 100 min |
| Tarek Al Musawi et al. (2023) [31] | 0.75 mg/L Fe2O3/bentite/TiO2,25 mg/L AMX Under visible LED light pH = 5 | −98.8% after 90 min |
| Yang et al. (2017) [30] | 0.6 g/L MOF/graphene oxide, 20 mg/L AMX Under visible light pH = 5 | −93% after 120 min |
| Fakhri et al. (2015) [32] | 0.1 g/L C-B-CdS nanoparticles, 10 mg/L AMX Under visible light pH = 5 | −40% after 120 min |
Disclaimer/Publisher’s Note: The statements, opinions and data contained in all publications are solely those of the individual author(s) and contributor(s) and not of MDPI and/or the editor(s). MDPI and/or the editor(s) disclaim responsibility for any injury to people or property resulting from any ideas, methods, instructions or products referred to in the content. |
© 2024 by the authors. Licensee MDPI, Basel, Switzerland. This article is an open access article distributed under the terms and conditions of the Creative Commons Attribution (CC BY) license (https://creativecommons.org/licenses/by/4.0/).
Share and Cite
MDPI and ACS Style
Jezzini, A.; Chen, Y.; Davidson, A.; Wallez, G.; Hamieh, T.; Toufaily, J. Photocatalytic Decomposition of Amoxicillin Using Zinc Ferrite Nanoparticles. Crystals 2024, 14, 291. https://doi.org/10.3390/cryst14030291
AMA Style
Jezzini A, Chen Y, Davidson A, Wallez G, Hamieh T, Toufaily J. Photocatalytic Decomposition of Amoxicillin Using Zinc Ferrite Nanoparticles. Crystals. 2024; 14(3):291. https://doi.org/10.3390/cryst14030291
Chicago/Turabian StyleJezzini, Aya, Yujin Chen, Anne Davidson, Gilles Wallez, Tayssir Hamieh, and Joumana Toufaily. 2024. "Photocatalytic Decomposition of Amoxicillin Using Zinc Ferrite Nanoparticles" Crystals 14, no. 3: 291. https://doi.org/10.3390/cryst14030291
Note that from the first issue of 2016, this journal uses article numbers instead of page numbers. See further details here.