Article

A Comparative Computational Study of the Solidification Kinetic Coefficients for the Soft-Sphere BCC-Melt and the FCC-Melt Interfaces

1
State Key Laboratory of Precision Spectroscopy, School of Physics and Electronic Science, East China Normal University, Shanghai 200241, China
2
Laboratory of Multi-Scale Mathematical Modeling, Department of Theoretical and Mathematical Physics, Ural Federal University, Lenin Ave., 51, 620000 Ekaterinburg, Russia
*
Author to whom correspondence should be addressed.
Crystals 2024, 14(4), 292; https://doi.org/10.3390/cryst14040292
Submission received: 7 February 2024 / Revised: 16 March 2024 / Accepted: 17 March 2024 / Published: 22 March 2024
(This article belongs to the Section Industrial Crystallization)

Abstract

:
Using the non-equilibrium molecular dynamics (NEMD) simulations and the time-dependent Ginzburg–Landau (TDGL) theory for solidification kinetics, we study the crystal-melt interface (CMI) kinetic coefficients for both the soft-sphere (SS) BCC-melt and the FCC-melt interfaces, modeled with the inverse-power repulsive potential ( n = 8 ). The collective dynamics of the interfacial liquids at four equilibrium CMIs are calculated and employed to eliminate the discrepancy between the predictions of the kinetic coefficient using the NEMD simulations and the TDGL solidification theory. The speedup of the two modes of the interfacial liquid collective dynamics (at wavenumbers equal to the principal and the secondary reciprocal lattice vector of the grown crystal) at the equilibrium FCC CMI is observed. The calculated local collective dynamics of the SS BCC CMIs are compared with the previously reported data for the BCC Fe CMIs, validating a hypothesis proposed recently that the density relaxation times of the interfacial liquids at the CMIs are anisotropic and material dependent. With the insights provided by the improved application of the TDGL solidification theory, an attempt has been made to interpret the variation physics of the crystal-structure dependence of the solidification kinetic coefficient.

1. Introduction

The kinetic coefficient μ n ^ of the crystal-melt interface (CMI) is defined as the ratio of the degree of interface undercooling Δ T = T m T (within the temperature range near the melting point T m ) to the interface velocity V (during the steady-state solidification stage),
μ n ^ = V n ^ Δ T ,
and its anisotropy plays a crucial role in governing the solidification process [1], i.e., the evolution of micro-structural morphology during solidification.
The crystal-structure dependence of the CMI properties, such as the interfacial free energy and the kinetic coefficient, has been examined computationally [1,2], motivated by experimental observation of the primary nucleation and the dendrite growth of metastable phases (i.e., body-centered-cubic (BCC)) in rapidly quenched melts with stable face-centered-cubic (FCC) structures [3,4,5,6,7,8,9]. For example, Sun et al. [10] and Mendelev et al. [11], respectively, calculated the iron (Fe) and terbium (Tb) CMI μ n ^ for both the FCC and BCC crystal structures, employing the same interatomic potentials. For the Fe CMI system [10], modeled with an embedded atom method (EAM) potential, μ n ^ for FCC was found to be about 20–25% lower than for BCC, while simulations for an EAM model of Tb [11] reported values of μ n ^ for FCC 12–35% lower than BCC. However, to the best of the authors’ knowledge, the sizeable effects of crystal structure on the magnitude of the CMI μ n ^ have not been well interpreted yet. Sun et al. found that the Mikheev and Chernov theoretical model [12] of the solidification μ n ^ predicts roughly equal magnitudes for the FCC and BCC CMIs. They also employed the microscopic solvability theory [13], which states that the growth velocity and tip radius of the dendrite growth are determined by the anisotropy in γ n ^ (smaller values of the anisotropy lead to slower growth rates) together with the calculated anisotropies in the CMI free energies ( γ n ^ ) to draw a clue that it is unable to understand the trend towards a reduction in μ n ^ for FCC structures relative to BCC.
Recently, there have been some advancements in quantitative predicting μ , i.e., the time-dependent Ginzburg–Landau (TDGL) solidification theory [14,15,16]. Variations in the solidification kinetic properties have been elucidated, including: (i) the crystalline anisotropy in μ for elemental BCC CMI systems [17]; (ii) the effect of orientational ordering (polarization or magnetization) on the solidification kinetics [15]; (iii) the changes in solidification rates with varying numbers of principal elements in multi-principal element alloy [18]. The integration of atomistic simulation experiments and the TDGL solidification theory not only aids in elucidating the underlying physics, but also enables the validation of the theory and its subsequent refinement [16]. Besides the above elucidations, we are optimistic that the understanding of the crystal-structure dependence of the CMI kinetic coefficient could also be facilitated through the application of the TDGL solidification theory.
Among the developments and applications of the TDGL solidification theory, one recent study by Zhang et al. [16] eliminated much of the discrepancy between the prediction of μ MD using the non-equilibrium molecular-dynamics (NEMD) simulations and μ GL for one BCC CMI system by identifying that the time scale of the liquid density relaxation does not hold the exact value of that in the bulk melt phase, as was assumed in the original formalism of the TDGL solidification theory [14,15]. However, such progress, i.e., a significantly improved prediction of both the magnitude and the anisotropy in μ has not been substantiated in the FCC CMI systems. It is noted that the TDGL solidification theory for the FCC CMI system [15] encompasses two distinct density relaxation times, and the variations in them at the CMI may be more complicated than that in the BCC CMI system (only one density relaxation time is considered).
Wang et al. [17] (including some of the authors of the current study) have proposed a hypothesis that the dynamic time scale due to density fluctuation and relaxation at the CMI should have anisotropic and material-dependent values for each CMI orientation. Till today, only half of this hypothesis has been validated, i.e., Zhang et al. [16] have computationally demonstrated the collective dynamics of the BCC Fe CMI interfacial liquids are anisotropic. Whether such anisotropy holds true in other BCC material systems beside the BCC Fe has not been validated yet.
Here, we focus on the soft-sphere (SS) model system, described by the pairwise inverse-power repulsive potential [19], U ( r i j ) = ϵ ( σ r i j ) n (see details in the next section). At certain softness ( 1 / n ) range, the free energy difference between the FCC and BCC phases is small, metastable BCC or FCC CMIs are quite stable for long simulation runs [20], which enables a direct comparison of solidification kinetics property for the BCC and FCC structures using the same interatomic potential. This study utilizes both the NEMD simulations of the solidification process and the TDGL solidification theories (for both BCC and FCC CMIs) to understand the crystal-structure dependence of the CMI kinetic coefficient, i.e., the trend towards a reduction in μ for FCC structures relative to BCC. We inspect the collective dynamics of the interfacial liquids using Zhang et al.’s algorithm [16], the decays of the density wave amplitudes of both the principal or secondary reciprocal lattice vectors (RLVs) of an SS FCC crystal at (100) CMI are calculated and compared to those of their bulk melt phase. Through calculating the collective dynamics of the SS BCC(100), (110), and (111) CMI interfacial liquids, we validate the other half of the hypothesis proposed by Wang et al. [17], i.e., material-dependence in the anisotropy of the density relaxation times of the interfacial liquids at the CMIs.

2. Methods

2.1. Soft-Sphere Model Potential

The current study utilizes the SS model system, described by the pairwise inverse-power repulsive potential [19]. The potential energy between particles i and j at a separation r i j is given by the form of
U ( r i j ) = ϵ σ r i j n ,
where ϵ and σ set the energy and length scales, respectively.
This model potential exhibits several useful characteristics, as detailed in [21]. It captures the role of intermolecular repulsion in various properties of interest, and has been widely used in exploring fluid transport properties (diffusion coefficient [22] and thermal conductivity [23]), viscoelasticity [24], polymorphic transitions [25] and the fundamental physics associated with crystal-melt phase transitions [20]. In the inverse-power repulsive potential, the repulsion range decreases with increasing the power parameter n, approaching the hard-sphere (HS) limit as n . For n between 6 and 8, the free energy difference between the FCC and BCC crystal phases is small, the MD simulations for both the metastable FCC or BCC CMIs are found stable over sufficiently long time simulations [26]. This feature enables a direct comparison of solidification kinetics property for the BCC and FCC CMIs using the same potential function.
We conduct the MD simulations with the n = 8 SS system. An interaction truncation as reported by Heyes et al. [27] is adopted. Specifically, r c = σ [ ϵ / ( 10 4 k B T ) ] 1 / 6 . A smooth function developed by Morris et al. [28] is also employed to ensure both the potential and the force smoothly go to zero at r c ,
f ( x ) = 1 x < 0 1 3 x 2 + 2 x 3 0 x < 1 0 1 x
where x = ( r i j r m ) / ( r c r m ) , r m = 0.95 r c . Parameters employed for the simulation and the computation use dimensionless reduced units. The particle mass, σ , ϵ , and the Boltzmann constant k B are set as 1.

2.2. Simulation Details
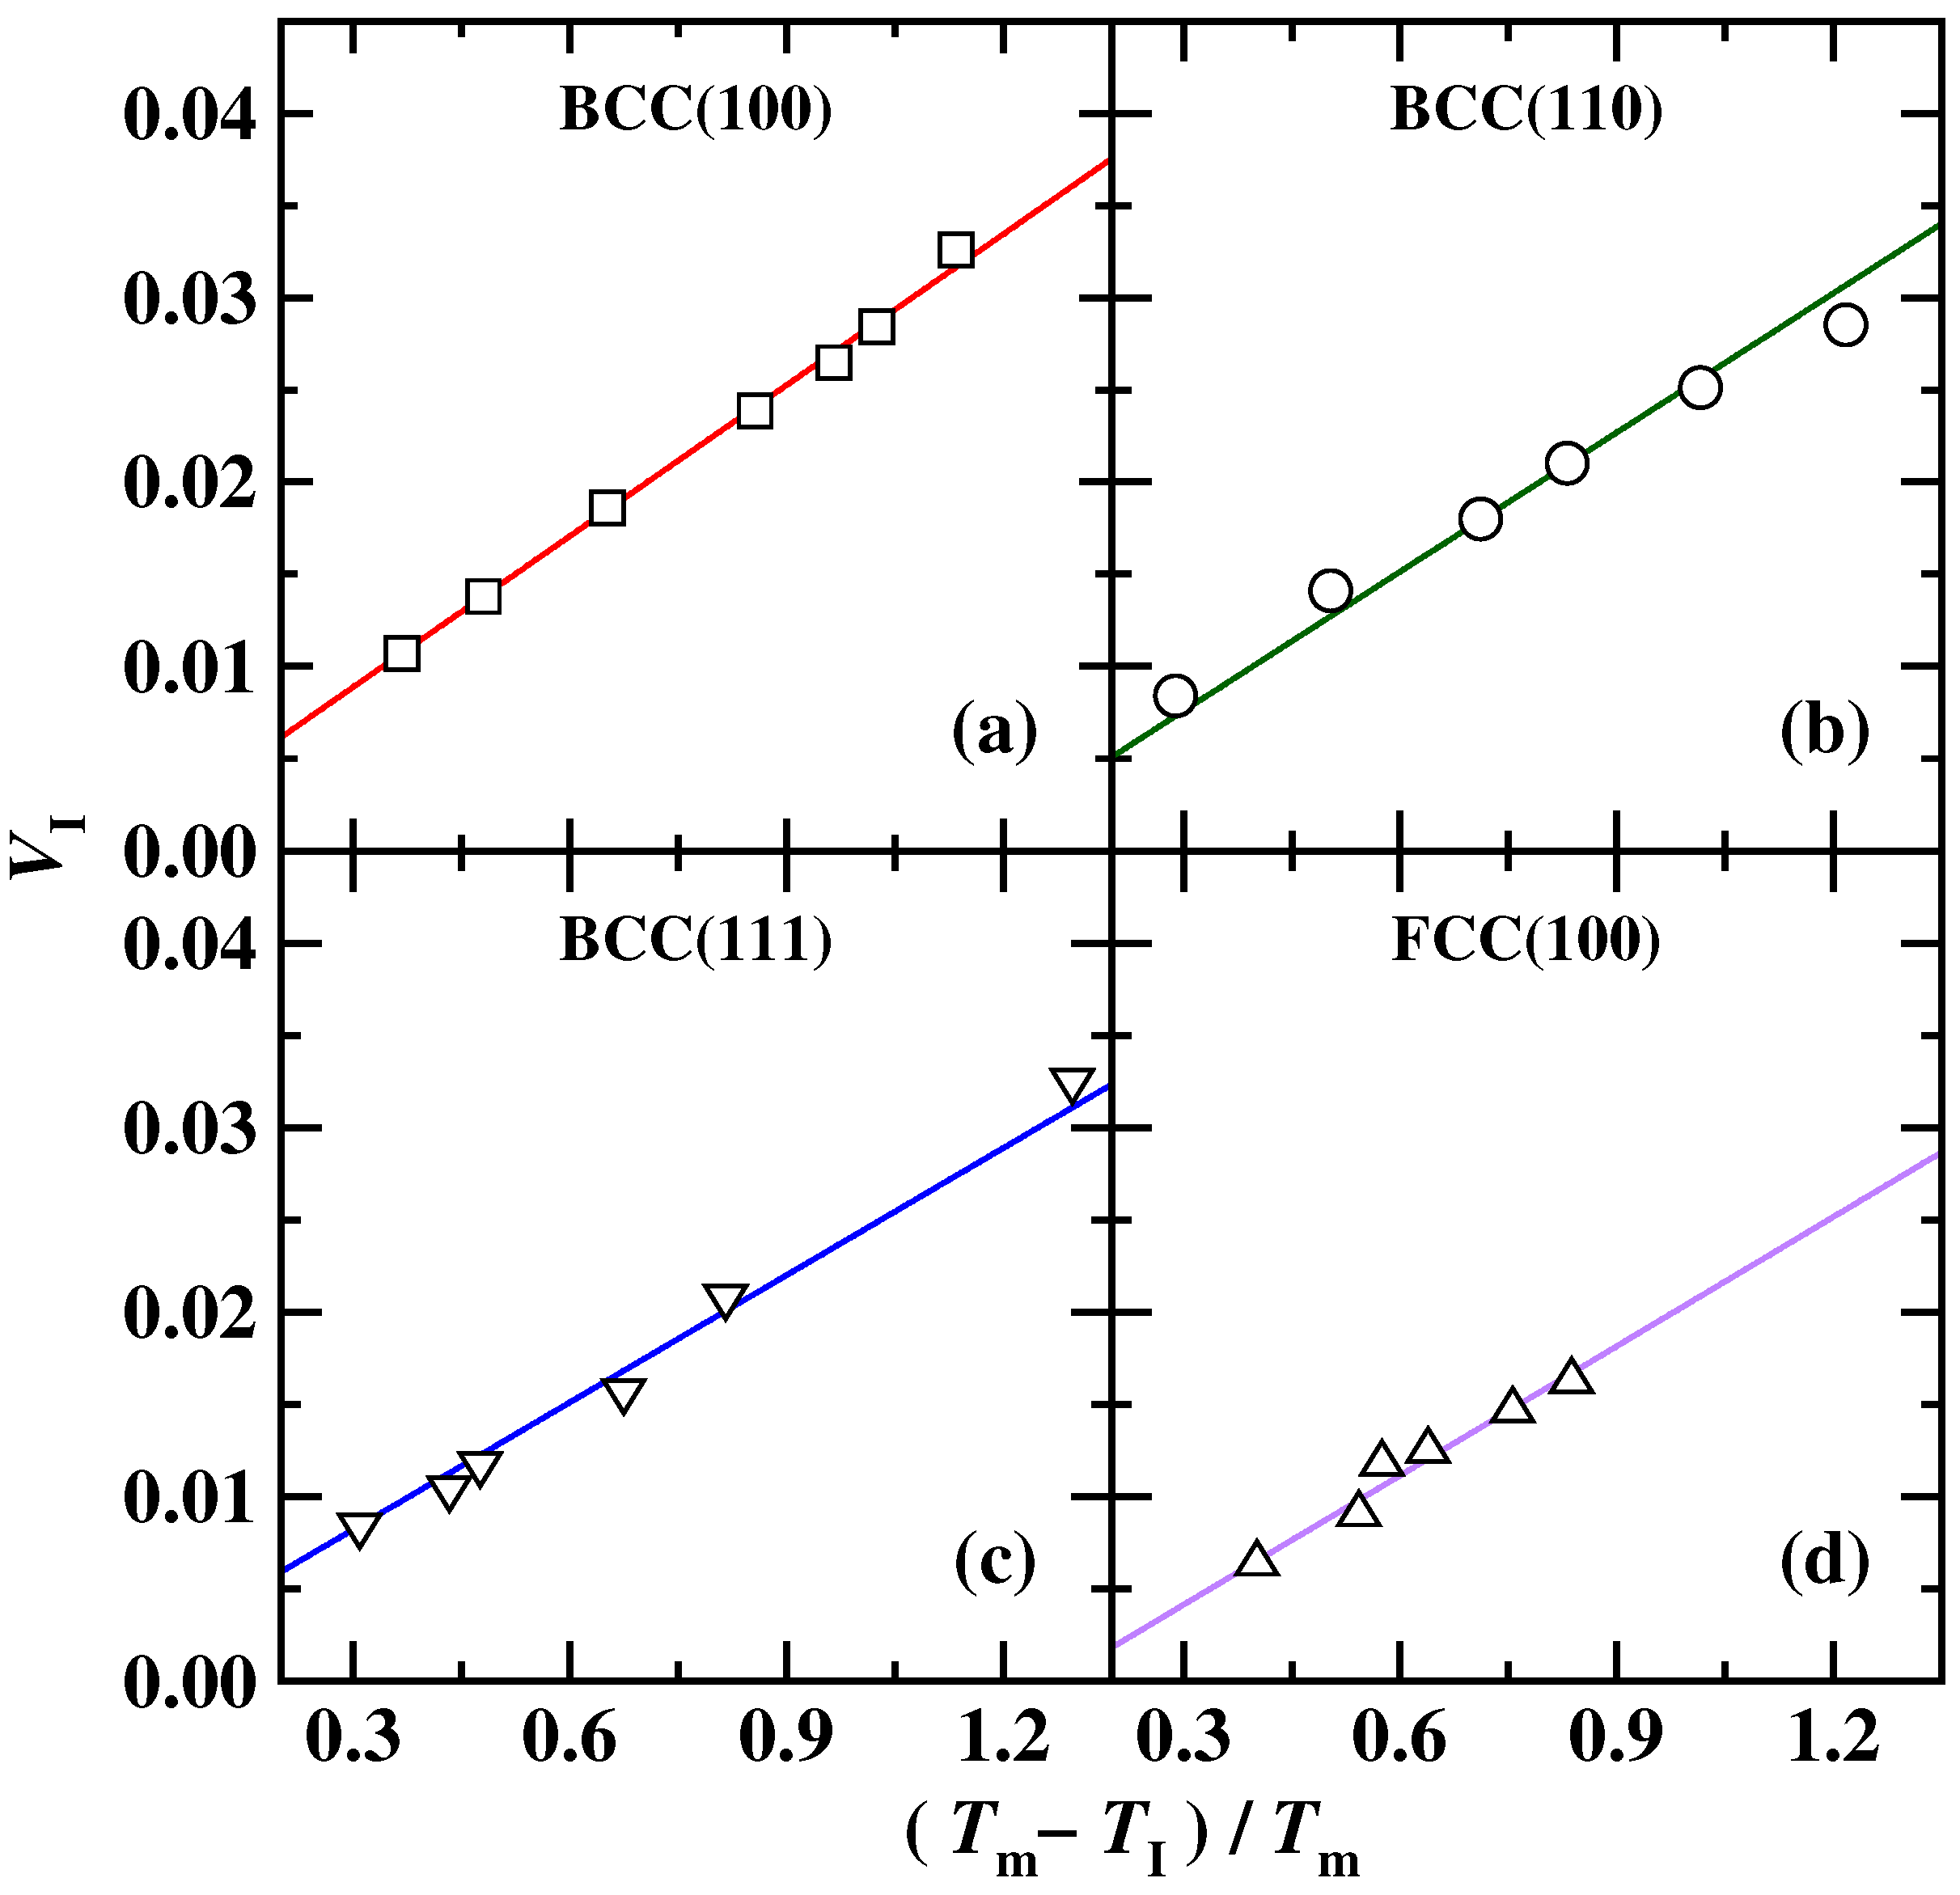
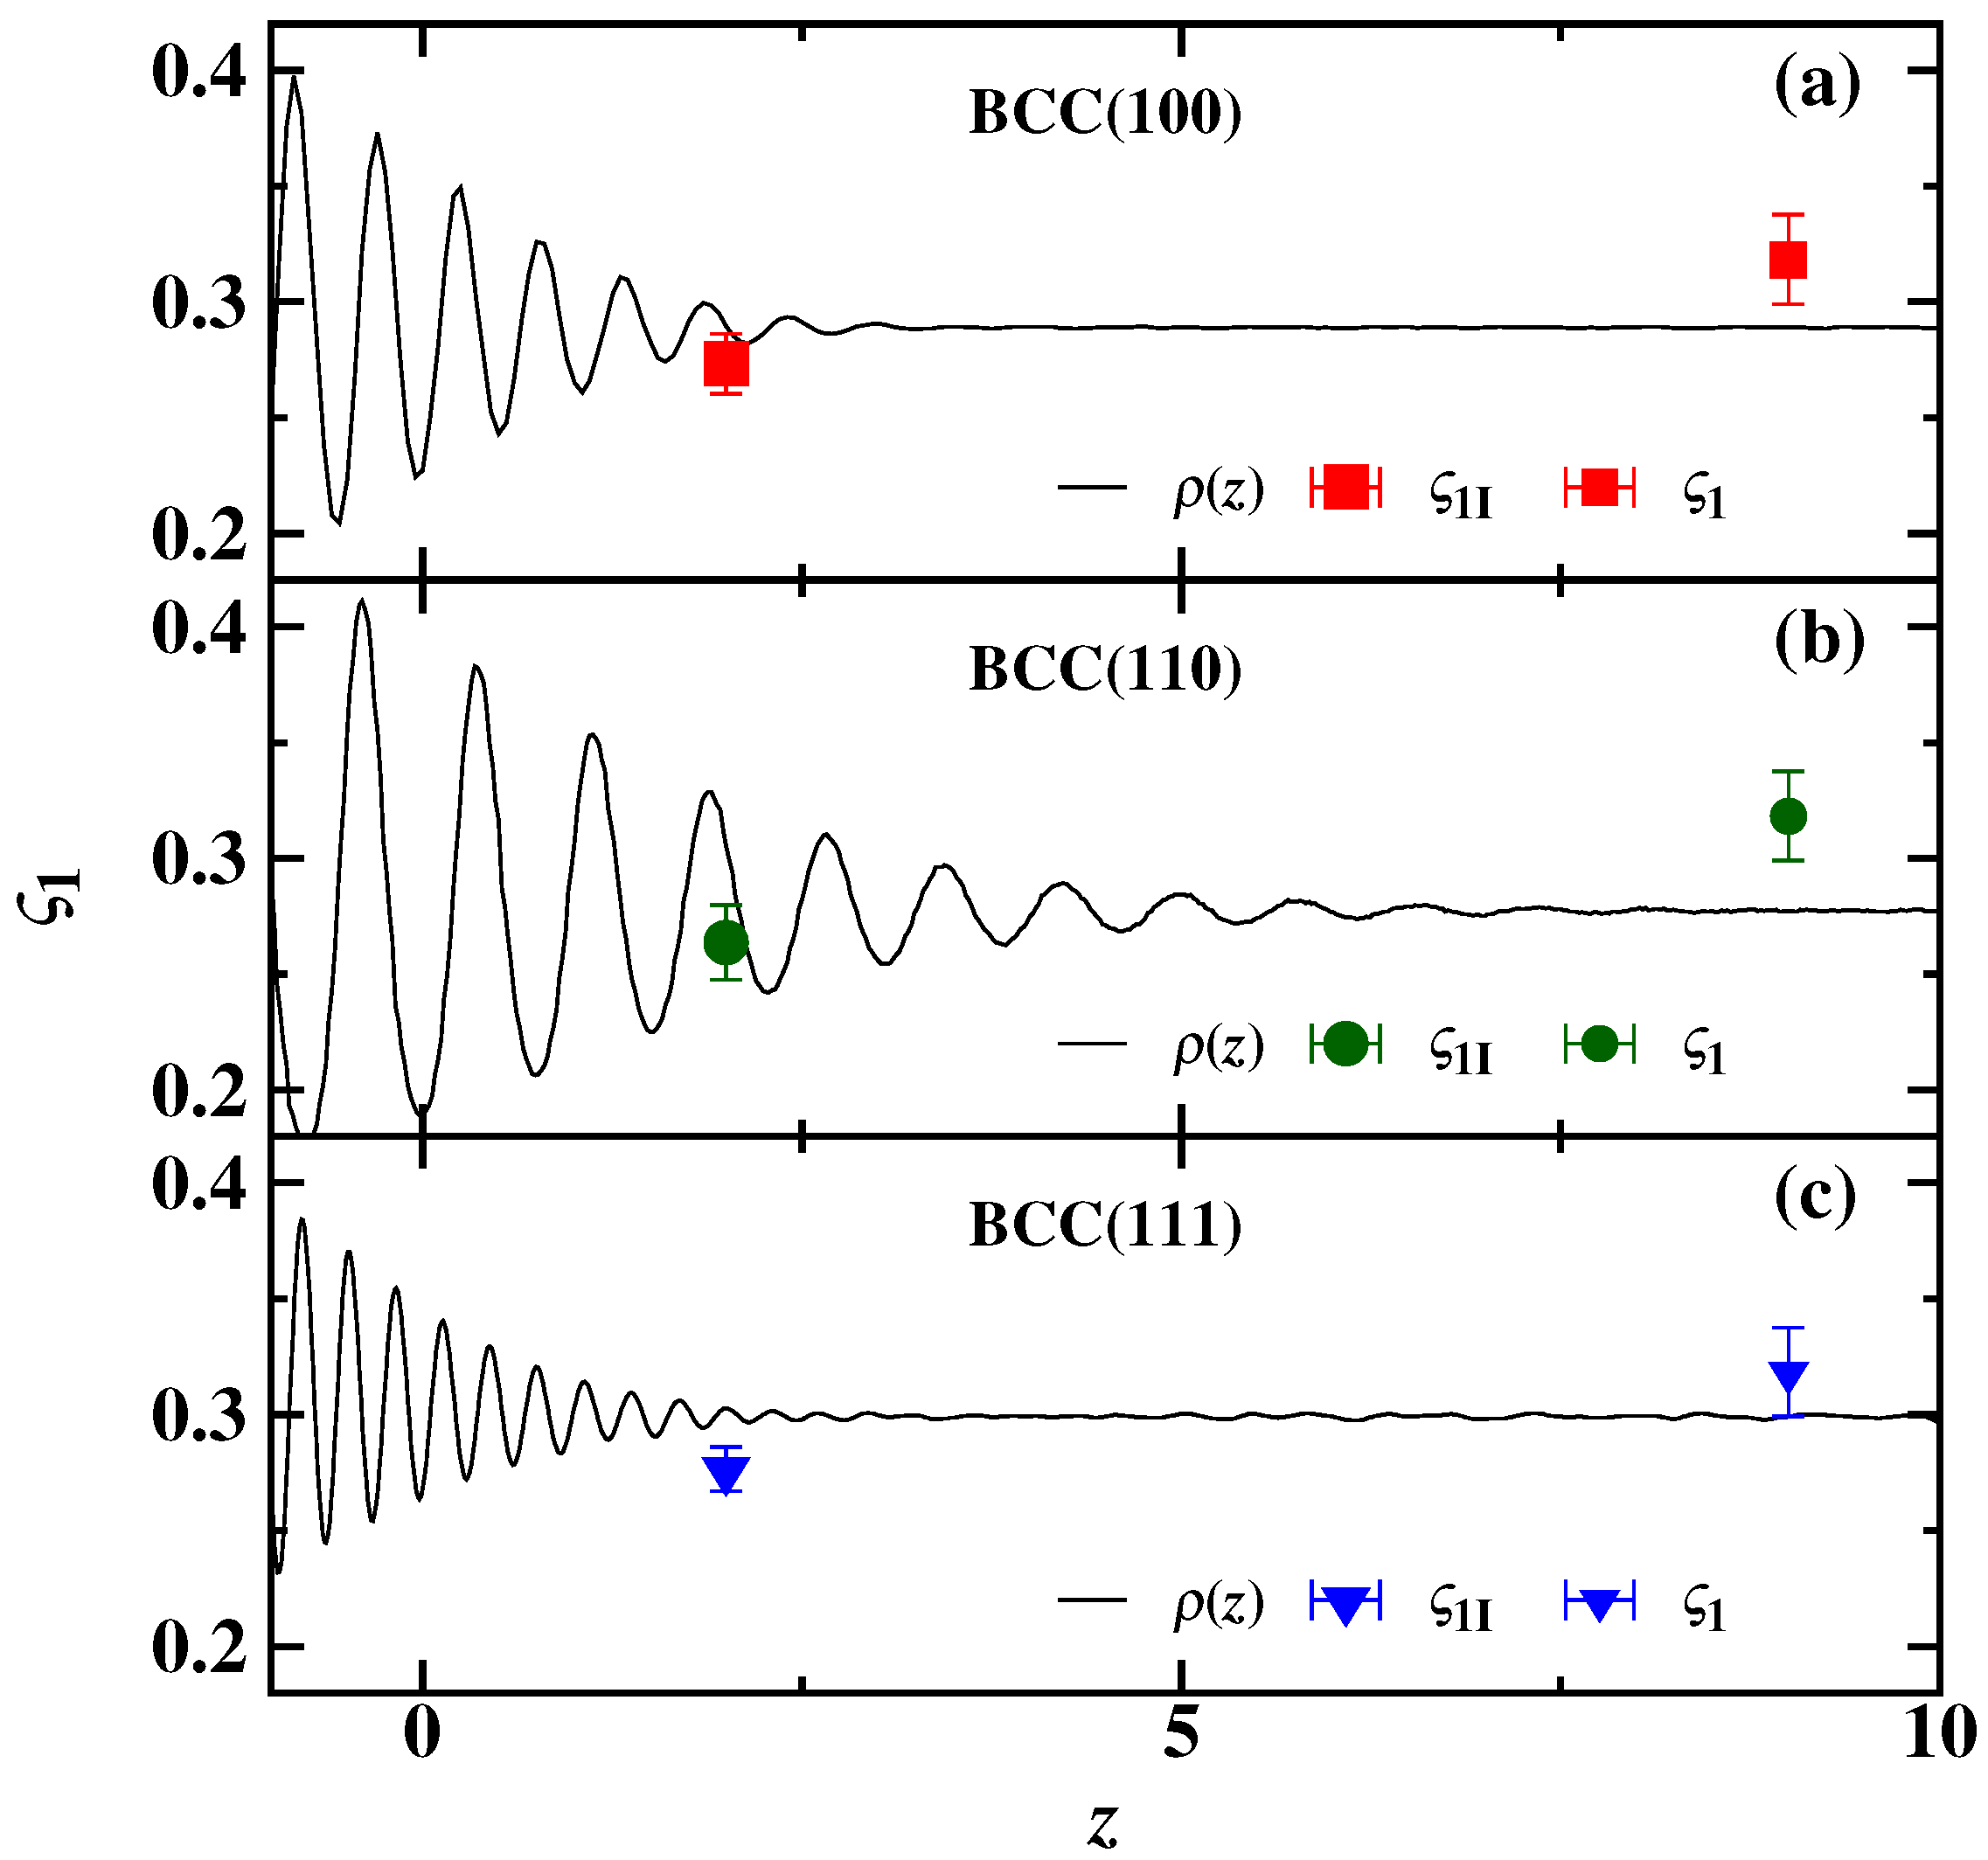
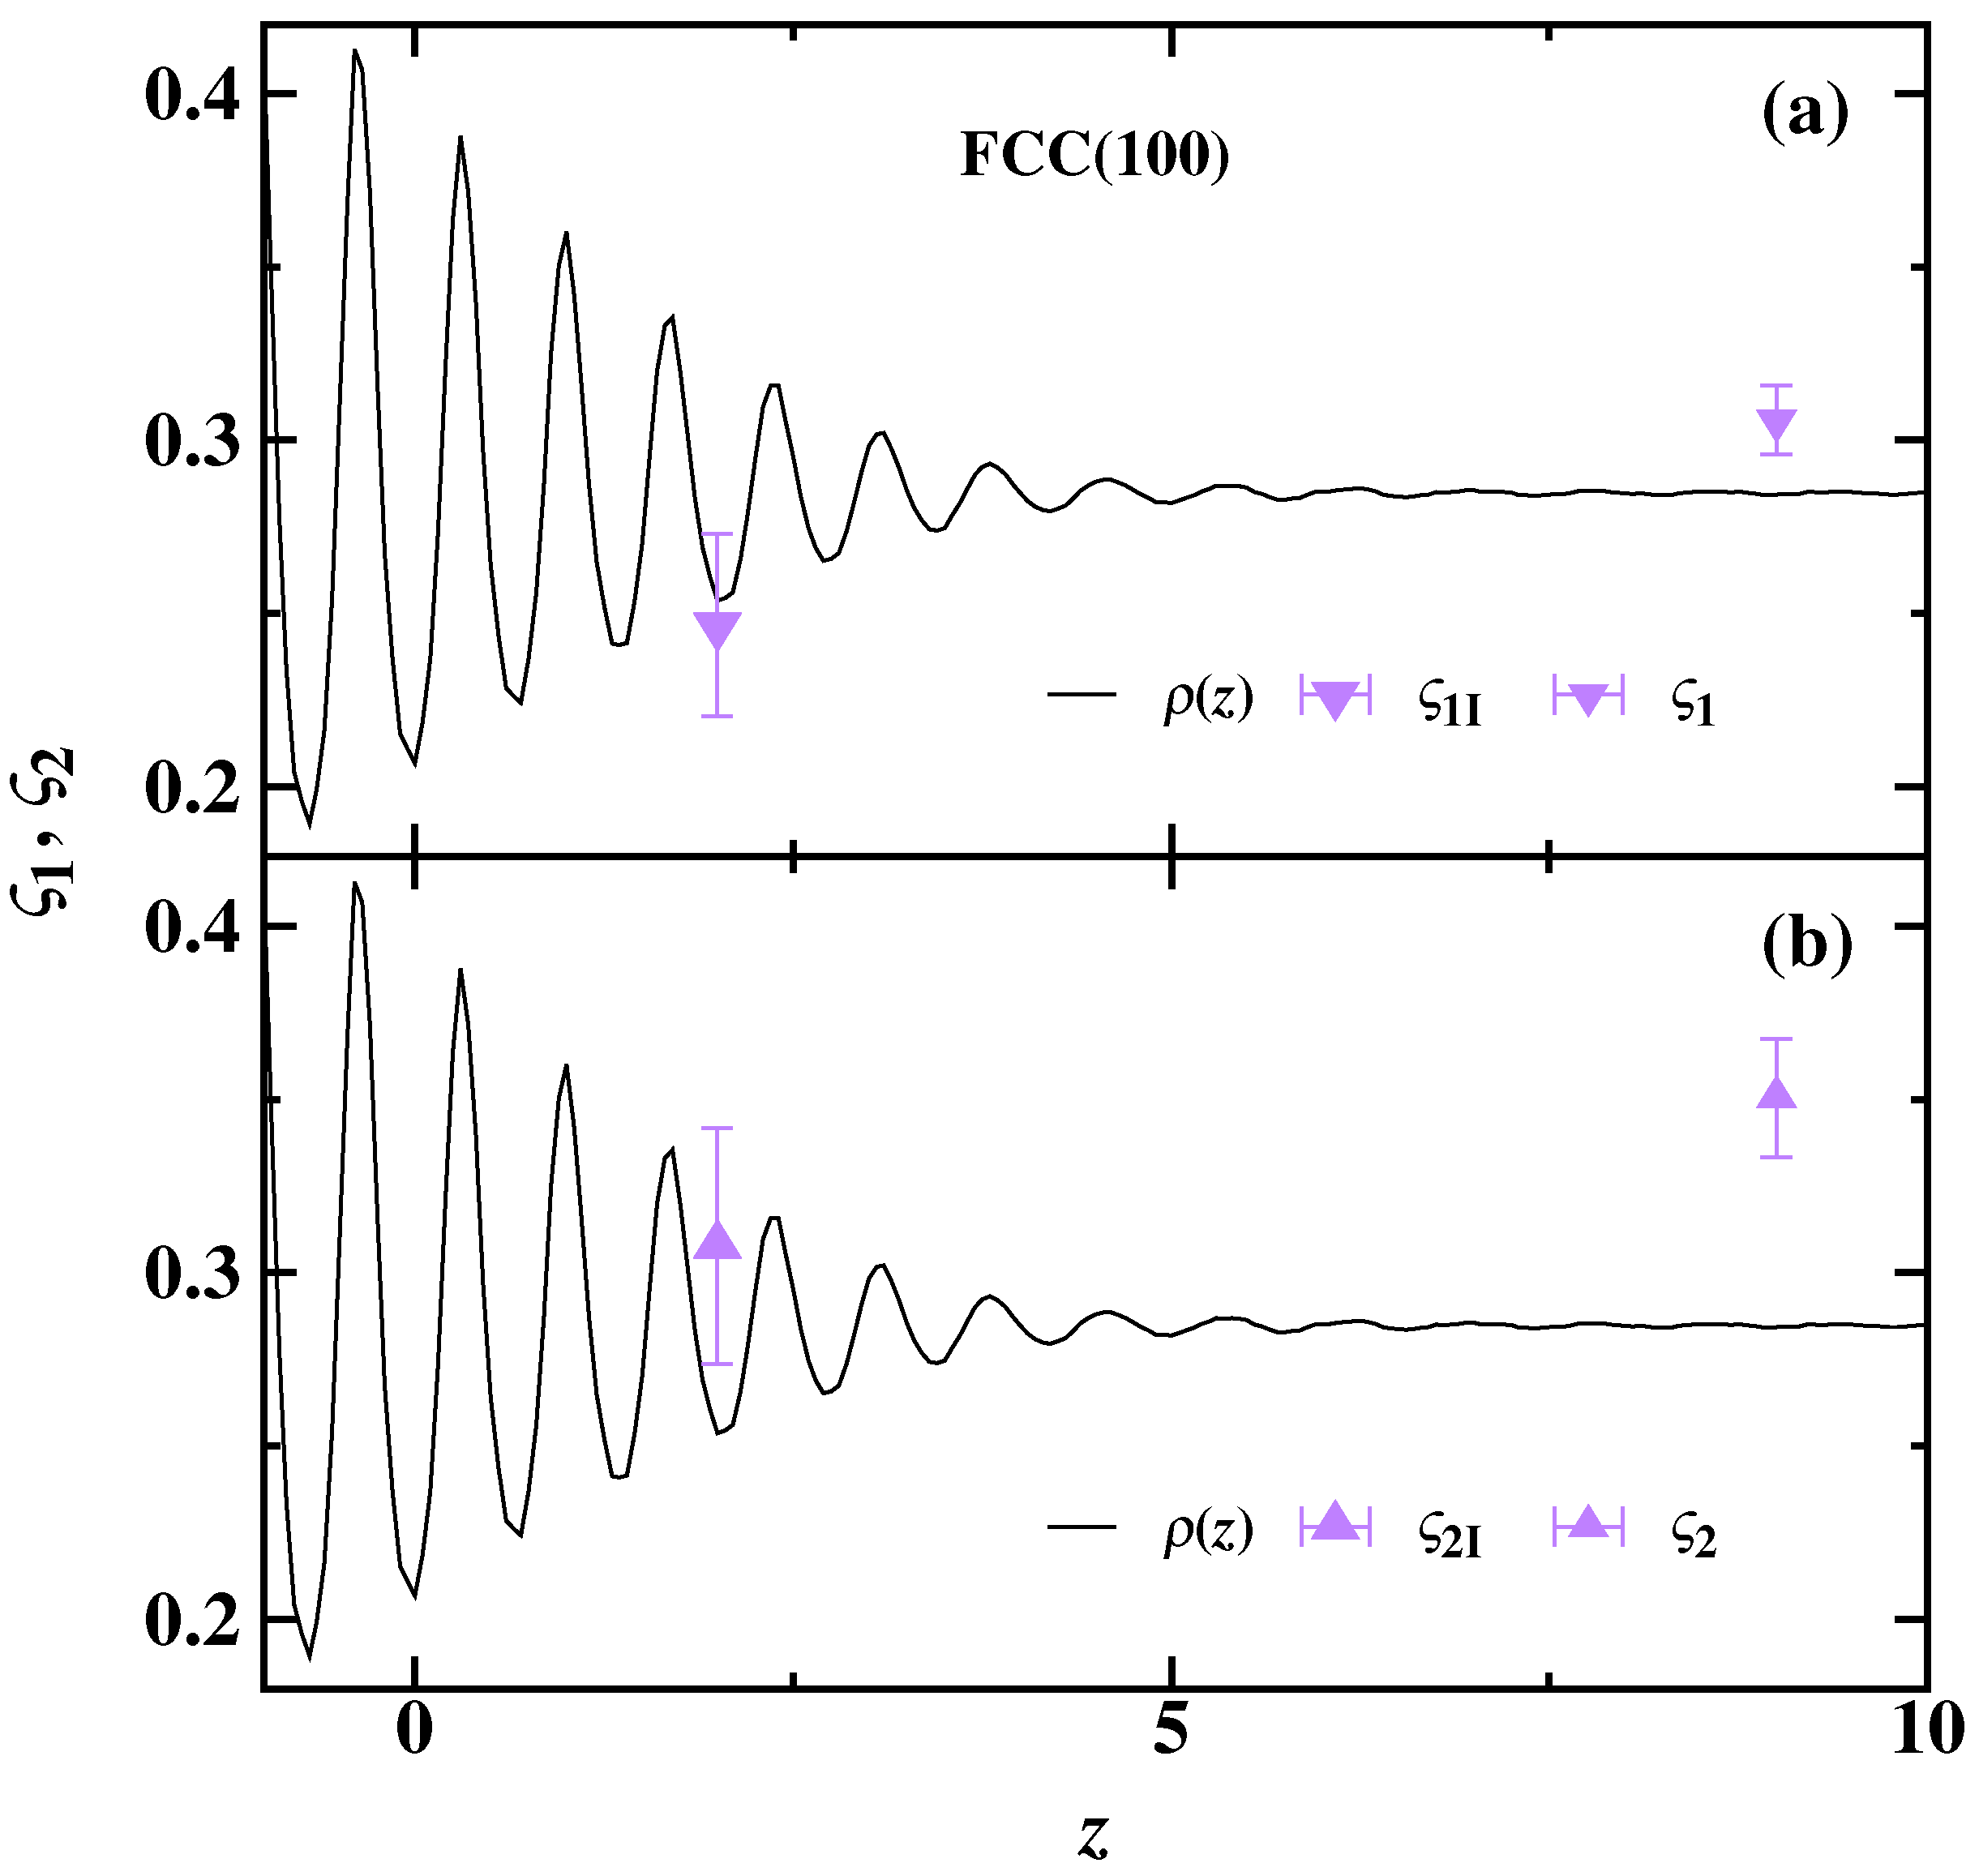
All MD simulations in this study are conducted using Large-scale Atomic/Molecular Massively Parallel Simulator (LAMMPS) software (3Mar20 version) [29], including both the crystal-melt two phase equilibrium (for determining the Ginzburg–Landau order parameters and the collective dynamics properties at the CMI) and non-equilibrium free solidification simulations (for measuring the kinetic coefficients). The canonical (constant N , V , T ) and the isothermal-isobaric (constant N , P , T ) MD simulations are employed, using the same time step, thermostat and (or) barostat as employed in [17].
We employed the crystal-melt coexistence technique [30,31] to prepare four equilibrium CMI systems, namely BCC(100), BCC(110), BCC(111), and FCC(100). The direction normal to the CMI is defined as the z axis, while the two orthogonal directions parallel to the interface are defined as x and y. Due to the application of periodic boundary conditions in orthogonal coordinates, each simulation cell contains two CMIs. The three dimensions of the simulation cells are approximately 16 σ × 16 σ × 150 σ , containing over 50,000 particles. The number of particles in the crystal and melt phases is approximately equal for each simulation system. Each equilibrium MD simulation is run for at least 3,000,000 steps, the particle coordinations for the equilibrated systems are recorded every MD step to compute the GL order parameters (distribution of density wave amplitudes) and the dynamic properties of the interface liquids.
To calculate the collective dynamics properties of the bulk liquid and compare them with the results obtained for the interfacial liquids at the equilibrium CMIs, we carry out independent simulation of bulk melt sample containing 4000 SS particles at the crystal-melt coexisting temperature and pressure. We run 5,000,000 MD steps and use 2,500,000 trajectory coordinations for collecting 250 block averages and the statistical errors.
Five different configurations during crystal-melt coexisting equilibrium simulations are employed as the starting configurations of the replica NEMD simulations of free solidification. The free solidification simulations are conducted by imposing a small undercooling ( Δ T / T m < 2 % ) in the N p z A x y T NH ensemble, in which T NH represents the global Nosé–Hoover thermostat control temperature. According to Davidchack and Laird [20], for the n = 8 SS system, the precise coexistence pressures under T m = 1.0 for the FCC and BCC crystal-melt systems are p = 46.39 and p = 47.1 , respectively. Meanwhile, the cross-section dimensions (parallel to the interface), A x y = L x L y , are adjusted based on the lattice constants measured at different undercooling temperatures.

2.3. Measurement of μ n ^ MD

We employ the free solidification method in MD simulations to measure μ n ^ MD for both SS BCC and FCC CMI systems. It is known that the NEMD simulation of crystal-melt transition, which employs a single global thermostat, results in the presence of appreciable temperature gradients [32,33]. The instantaneous CMI position ξ is identified by analyzing the trajectory coordination dumped from the NEMD simulations at intervals of 1000 MD timesteps [32]. Within the steady-state growth regimes, the interface velocities V I are extracted from the linear correspondences between the migration of the CMI interface ξ t and times t. Then, μ n ^ MD are obtained through a weighted linear fit to the relationship between the interface velocity V I and the interface temperature T I (rather than the imposed global thermostat temperature, T NH ). For each system, errors in V I and T I are averaged over 10 sets of samples obtained from 5 replica simulations. Further details on measuring V I can be found in [32,33].

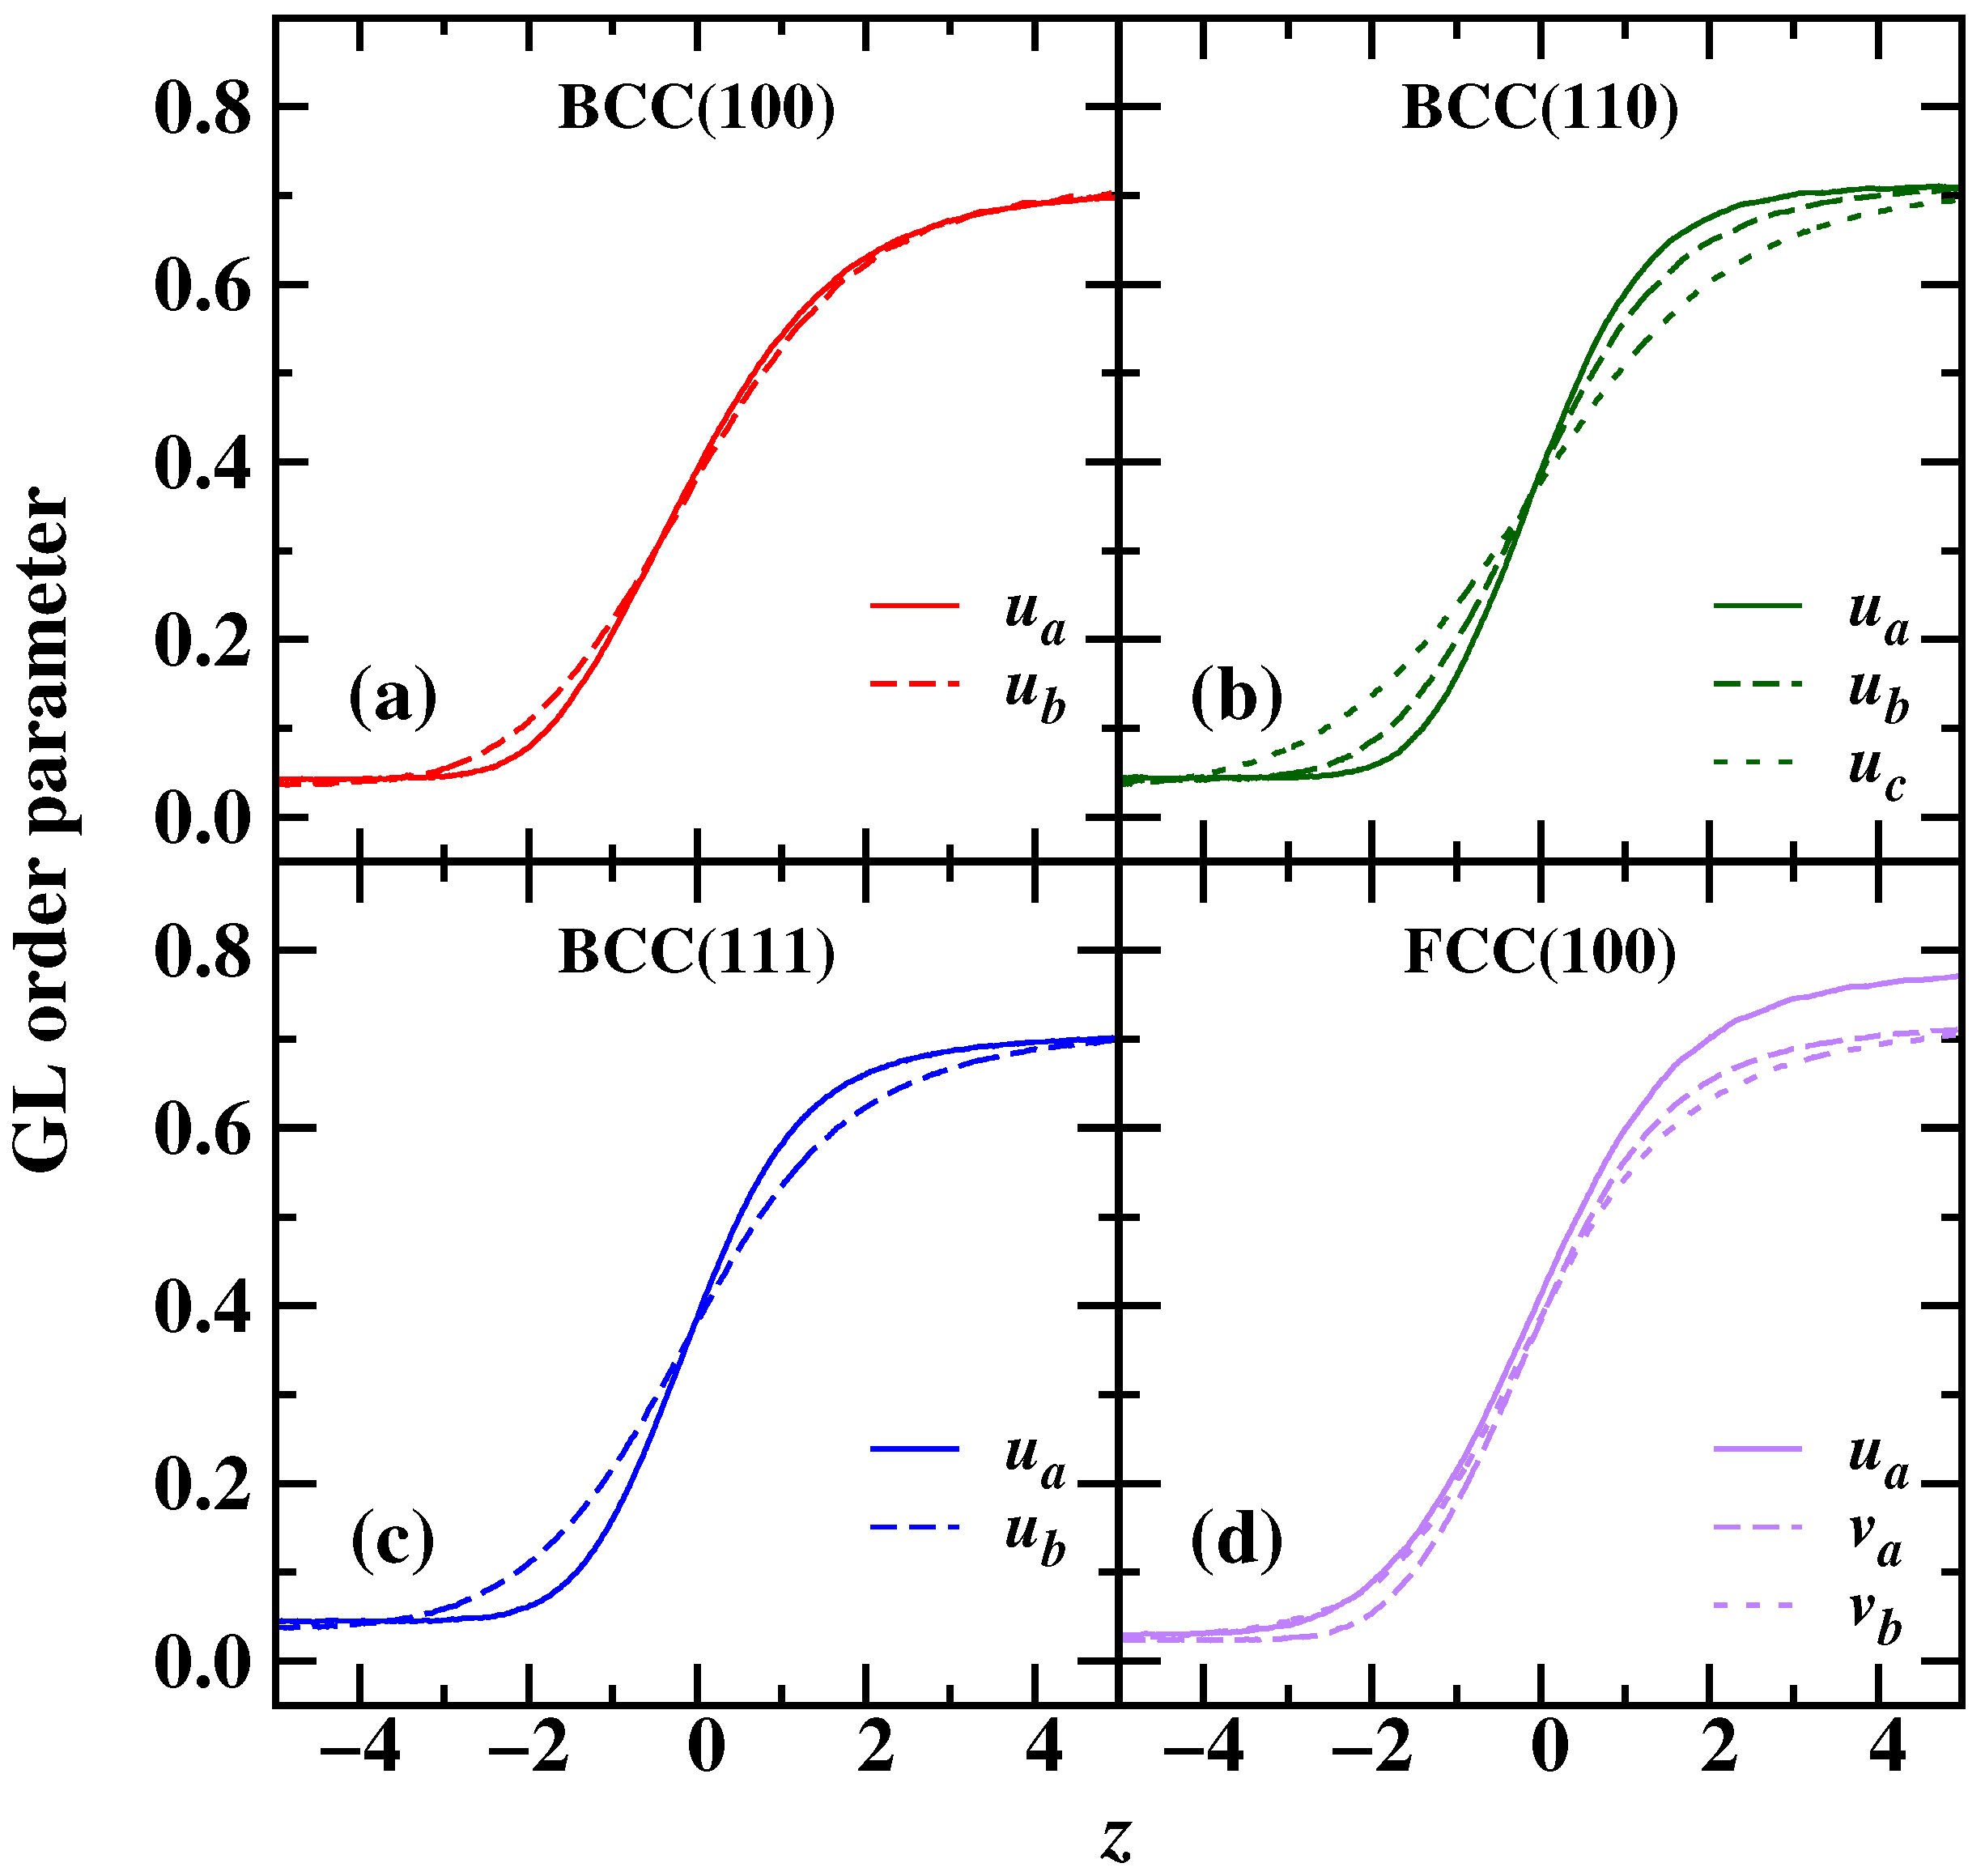
2.4. TDGL Theoretical Prediction of μ n ^ GL

Wu et al. [14] and Xu et al. [15] derived the TDGL solidification theory for the BCC and FCC CMI systems, respectively. For the pure substance, the TDGL solidification theory quantitatively predicts the magnitude and anisotropy of CMI kinetic coefficients without any fitting parameters.
The TDGL analytical expression for the CMI kinetic coefficient of a BCC or FCC CMI orientation, is given as
μ n ^ GL = Δ H k B T m 2 A n ^ ,
in which, Δ H is the per-particle latent heat of the crystal-melt phase transition at T = T m . For the BCC CMI system, the anisotropy factor A n ^ has the form of [14],
A n ^ = ς 1 K i d u i ( z ) d z 2 d z ,
while for the FCC CMI systems, A n ^ has the form of [15],
A n ^ = ς 1 K i d u i ( z ) d z 2 + ς 2 G i d v i ( z ) d z 2 d z .
In the above two equations, K i represents the principal reciprocal lattice vectors (RLVs) of the FCC or the BCC crystals, respectively. G i represents the secondary RLVs of the FCC crystal. The GL order parameters u i are amplitudes of density waves corresponding to K i , and v i are amplitudes of density waves corresponding to G i .
The dissipation time constants (DTCs) are defined as the ratio between the dynamic time scales of the liquid density waves relax at the given RLVs and the corresponding static structure factors in the melt phase,
ς 1 = τ ( | K i | ) / S ( | K i | ) ,
ς 2 = τ ( | G i | ) / S ( | G i | ) .
A new method for calculating the density relaxation times and DTCs of interfacial liquids was outlined in [16] by Zhang et al. We distinguish the density relaxation times ( ς 1 I and ς 2 I ) of the local interfacial liquids from those of the bulk melt phase for the subsequent applications of the TDGL theory. The TDGL analytical expressions for the CMI kinetic coefficients and the anisotropy factors (both BCC and FCC) are as follows:
μ n ^ I GL = Δ H k B T m 2 A n ^ I ,
A n ^ I = ς 1 I K i d u i ( z ) d z 2 d z ,
A n ^ I = ς 1 I K i d u i ( z ) d z 2 + ς 2 I G i d v i ( z ) d z 2 d z .
In the calculation of the dynamical structure factor for the local interfacial liquids, the possible impact of the adjacent structural ordering environment on the local collective dynamics properties of interest is taking into account. The intermediate scattering function (ISF) and the dynamical structure factor (DSF) are as determined with the following definitions:
F I ( k , t ) = 1 N ( z m ) i = 1 N ( z m ) j = 1 N ( z m ) exp [ i k · ( r i ( t ) r j ( 0 ) ) ] ,
S I ( k , ω ) = 1 2 π F I ( k , t ) exp ( i ω t ) d t .
In the current calculation, at the equilibrium CMIs under T m = 1 and p = 46.39 (FCC) and p = 47.1 (BCC), the time–spatial intercorrelation is compared between the N ( z m ) particles within a slab region of interest [e.g., for the FCC(100) CMI, a thickness of l = 2.7 , locates at z m = 1.35 ], and the N ( z m ) particles within a thicker slab containing the region of interest and two neighboring transition regions (with a thickness of λ = z m ). The detailed method of the interfacial density relaxation times can be found in [16]. The dynamic time scales of the liquid density wave relaxation, are obtained by computing the inverse half-width of the dynamic structure factors.
The distribution of the GL order parameters (instantaneous density amplitudes) along interface normal direction (z) for an instantaneous trajectory within an equilibrium MD simulation of the CMI, is calculated from Fourier transform of the instantaneous particle number density ρ ( r , t ) . The expressions for u i (both for BCC and FCC) and v i (only for FCC) are given by
u ^ i ( z , t ) = 1 V z 0 L x 0 L y z Δ z 2 z + Δ z 2 d x d y d z ρ ( r , t ) exp ( i K i · r ) ,
v ^ i ( z , t ) = 1 V z 0 L x 0 L y z Δ z 2 z + Δ z 2 d x d y d z ρ ( r , t ) exp ( i G i · r ) .
V z = L x L y Δ z , the width of the fine-graining grids along z is Δ z = 0.02 .
Attention is given to eliminating capillary fluctuations in CMIs. All profiles of u ^ i ( z , t ) and v ^ i ( z , t ) are aligned based on the instantaneous CMI position ξ t to eliminate artificial broadening effects due to interface fluctuations and random drift of the crystal. The calculation involves computing the time-averaged real and imaginary components of the density amplitudes, followed by the modulus operation,
u i ( z ) = | u ^ i [ z ξ ( t ) , t ] | ,
v i ( z ) = | v ^ i [ z ξ ( t ) , t ] | .
We calculate one sub-averaged GL order parameter profile every 500 consecutive MD steps, as 1 coarse-graining time window. The final GL order parameter profile is constructed from aligning and averaging 4000 sub-averaged profiles, compassing 2,000,000 instantaneous MD trajectories. Based on the different orientations of reciprocal lattice vectors with respect to the interface normal, the GL order parameters are categorized into 2–3 categories, shown in Table 1.

3. Results and Discussion

Figure 1 presents the NEMD simulation snapshots of an instantaneous configuration of BCC(100), (110), (111), and FCC(100) CMIs during steady-state solidification, showing spatial particle-packing variation across the CMIs. Figure 2 shows that the interface velocities V I vary linearly with the interface temperature T I over four CMI systems. The results of μ n ^ MD extracted through the slopes of the V I ( T I ) datasets, are summarized in Table 2. For the BCC CMIs, the resulting values of μ n ^ MD are 2.7(1), 2.5(1), and 2.3(1) for the BCC(100), BCC(110), and BCC(111) orientations, respectively. μ 100 MD and μ 110 MD are close in magnitude, while the μ 111 MD is the smallest. The anisotropies μ 100 MD / μ 110 MD , μ 100 MD / μ 111 MD , and μ 110 MD / μ 111 MD are 1.09(6), 1.19(8), and 1.09(9), respectively. These data (both the magnitude and anisotropic trends) are similar to those reported by Wang et al. [17] for the same system, in which μ n ^ MD were obtained from V I ( T I ) datasets for each orientation with less solidification data points but three melting simulation data points. For the FCC(100) CMI, we get μ MD to be 2.3(2). Comparing with the μ MD obtained for BCC CMIs, μ 100 MD of the FCC(100) is 15% smaller than BCC(100). This sizeable effect of crystal structure on the magnitude of the CMI kinetic coefficient is similar to the Fe and Tb considered previously [10,11].
Next, the CMI kinetic coefficients for all systems are predicted using the TDGL solidification theory as μ n ^ GL , based on input parameters obtained from the equilibrium MD simulations. μ n ^ GL are compared to μ n ^ MD to address the questions as to what extent the TDGL solidification theory can quantitatively interpret the crystal-structure dependence of the CMI kinetic coefficient. In Table 2, the results of μ n ^ GL calculated using Equations (4)–(6) are presented. For all crystal orientations studied, μ n ^ GL underestimates μ n ^ MD by around 12∼22 percent. Such underestimation using the TDGL solidification theory predicting μ has been reported in several previous studies [14,15,17]. Besides this discrepancy, the TDGL theory correctly predicts the anisotropy trend of the μ n ^ MD for the three BCC CMIs, as well as a seemingly reasonable decreasing trend between BCC(100) and FCC(100) CMI.
In Equation (4), both Δ H and A (including its contributing components) contribute the variation trend in μ n ^ GL , note that we are working at T m = 1.0 . All the contributing parameters in Equations (4)–(11), are depicted in Table 3. For example, the prediction of μ n ^ GL for the FCC(100) CMI system, in the framework of the TDGL solidification theory, jointly uses the values of Δ H , T m , and A which is determined by two DTCs ( ς 1 , ς 2 ) and three spatial integration of the square-gradient terms of the GL order parameters (SISGs for short) Λ u , Λ v a , Λ v b . Λ u a = d z [ d u a ( z ) d z ] , Λ v a = d z [ d v a ( z ) d z ] , and Λ v b = d z [ d v b ( z ) d z ] denote the SISGs.
Δ H for FCC CMI is 21% greater than the BCC CMIs; however, FCC CMI has an A with the magnitude at least 30% greater than those of the BCC CMIs, explaining the reason why FCC(100) CMI has a smaller predicted μ n ^ GL than BCC(100) CMI. We further look into the integrand terms in A, the magnitudes of the DTCs of the bulk melt phases have similar magnitude. Specifically, ς 1 = 0.32(2) and 0.31(1) correspond to the magnitudes of the principal-set RLVs of the BCC and FCC crystal, respectively. ς 2 = 0.35(4) corresponds to the magnitude of the second-set RLVs of the FCC crystal. The nearly constant magnitude of the DTCs suggest that the variation in μ n ^ GL with respect to the interface orientation and crystal structure, is determined by the variation in the SISG terms.
In applying the TDGL solidification theory for the equilibrium and the non-equilibrium CMIs, the accuracy of the GL order parameter fields is crucial for predicting reasonable thermodynamics and kinetics properties of the CMIs. There have been reports (basically two types) on producing the GL order parameters across the CMIs. A first type numerically minimizes the global free-energy functional with specific boundary conditions to solve the GL order parameter fields for the CMIs [14,34,35,36]. A few theoretical predictions of the related properties using this first type of data could hardly reach a satisfactory precision level [36]. The second type directly uses the atomistic trajectories in the MD simulation of the CMIs to calculate the mean density field and its Fourier amplitudes, as described above in Section 2.
If one carefully carries out this calculation in a fine-grained [10] with sufficient sampling, an improved precision level in predicting CMI properties through determining the SISGs might be achieved. For example, following Wu et al. [36] and Shih et al. [37], by employing the bulk BCC crystal value of the GL order parameters in Figure 3, u c = 0.71 , we predict the latent heat of fusion per atom ( Δ H ) which is only 1.4% off the measured value in the Table 3. Using the first type of data (GL order parameter), Wu et al. [36] predicted the latent heat of fusion that is about 43% underestimated the measured value. As shown below, with improved consideration of the interfacial liquid dynamics, the crystal structure and interfacial orientation dependence of the solidification kinetic coefficients can be quantitatively predicted with satisfied precision.
In order to address the underestimation issue (between μ n ^ MD and μ n ^ GL ), we apply the algorithm by Zhang et al. [16] in the current CMI systems for determining the collective dynamics timescale of the liquid phase at the interface, and for improving the TDGL predictions of the μ n ^ MD . At the equilibrium BCC and FCC CMIs, the density wave relaxation times of the interfacial liquid, at the corresponding sets of RLVs, are calculated and presented in Figure 4, Figure 5 and Figure 6. Figure 4 illustrates the DSFs at given crystal RLVs, for the local liquids in the slab interfacial region of interest and the bulk melt. The ISF and DSF results for the interfacial liquids exhibit faster decay in dynamic response compared to the bulk data, indicating that the density relaxations in the interfacial liquids occur on time scales shorter than those in the bulk melt phase. The extracted density relaxation times, i.e., inverse half-width of the DSFs, are rescaled by the corresponding static structure factors and plotted in Figure 5 and Figure 6. The reductions in the magnitudes of ς 1 I (and ς 2 I ) in the interfacial region reach approximately 20% (or 12%) of the bulk melt phase values ς 1 (or ς 2 ), respectively, see in Table 3. Both the in-plane structural ordering of the CMI liquids and the lower activation energy of crystallization [38] for the liquid-like particles within the CMI region have been suspected [16] to be responsible for the speeding-up of the collective dynamics. The underlying reasons that quantitatively connect the in-plane ordering and the collective dynamics of the interfacial liquids based on inhomogeneous fluid statistical mechanics remain unresolved.
The above computational analysis provides evidence that could further validate the hypothesis proposed by Wang et al. [17] that the dynamic time scale due to density fluctuation and relaxation at the CMI have anisotropic and material-dependent values. Zhang et al. [16] validated part of this hypothesis; they reported that collective dynamics of the BCC Fe CMI interfacial liquids are anisotropic, especially, BCC(110) CMI has a slower local collective dynamics compared to the BCC(100) and BCC(111) CMIs. In the current BCC SS CMI system, the acceleration of the local collective dynamics among three BCC CMIs is nearly identical, indicating a difference anisotropy scenario comparing with BCC Fe and a validation of the second half of hypothesis proposed by Wang et al. [17]. A recent computational study [39], compared the SS CMI system with metallic CMI systems in the interface excess stress, and demonstrated that the pure repulsive interaction model system produces a more symmetric excess stress field across the CMI, compared with the metallic system. We speculate that the long-ranged attractive interaction results in a more significant anisotropic local collective dynamics, as its role further complicates the CMI stress field.
With the calculated interfacial DTCs for each CMI, we re-predict the μ , (labeled as μ n ^ I GL ; see Table 2) yielding a satisfactory agreement with μ n ^ MD . The statistical error bars of μ n ^ I GL and μ n ^ MD are overlap with each other, as well as the anisotropies among the three BCC CMIs. This further implies that the reductions in the magnitudes of the DTCs in the interfacial region persist throughout all the CMIs examined in this study, and no other parameters besides DTC are responsible for the deviation between the μ n ^ GL and the μ n ^ MD .
By improving the prediction on μ n ^ MD , one can re-interpret the crystal structure dependent on the CMI kinetic coefficients at a higher precision level using analytical expressions, Equations (9)–(11). Specifically, for BCC(100) CMI system, the summation of all twelve contributing terms [the product of the sum of SISGs ( Σ Λ u a + Σ Λ u b = 0.954 ) and the DTC ( ς 1 = 0.27 ( 1 ) )] results in an A I = 0.26 ( 1 ) ; for FCC(100) CMI system, the summation of all fourteen contributing terms [ Σ Λ u a × ς 1 + ( Σ Λ v a + Σ Λ v b ) × ς 2 ] results in an A I = 0.39 ( 3 ) . The anisotropy factor A I for the FCC(100) CMI is 1.5 times greater than the BCC(100) CMI system, while the latent heat Δ H for the FCC-melt transition is about 1.21 times greater than the BCC-melt transition. Consequently, the magnitude of the kinetic coefficient μ I GL for the Fe FCC(100) CMI is only 81% of the the Fe BCC(100) CMI.

4. Summary

In this study, by combining the NEMD simulation and the TDGL solidification theory for both BCC and FCC CMIs, we explore the variation physics of crystal-structure dependence of the solidification kinetic coefficient, and extend a recent achievement of improving the use of the TDGL solidification theory into the FCC CMI system via a model SS system described by the pairwise inverse-power repulsive potential. We employ the recently proposed algorithm by Zhang et al. [16], calculate the collective dynamics of the interfacial liquid, and eliminate the discrepancy between the prediction of μ MD using NEMD simulations and μ GL TDGL solidification theory for the SS BCC(100), (110), (111), and the FCC(100) CMI systems. We validate that the anisotropic local collective dynamics are material-dependent by calculating the local collective dynamics of the three SS BCC CMIs and comparing them with the previously reported data for the BCC Fe CMIs. We demonstrate that by combining the TDGL solidification theory and the local collective dynamics calculation technique by Zhang et al. [16], one might be able to quantitatively understand the CMI kinetic coefficient variation due to the crystal structure change. We conclude that, for BCC and FCC CMIs made of the same elemental substance, FCC CMI systems require more free energy dissipation fluxes than BCC CMI systems, i.e., a more significant magnitude of the overall dissipation length-scale (or the sum of all the SISG terms) leading to a sizeable reduction in μ n ^ for FCC CMI systems relative to BCC CMI systems.
For the future studies, it would be useful to carry out computational investigation on the magnitudes of two DTCs in the interfacial region for the FCC CMIs described with interaction beyond the pure repulsive model, e.g., for LJ or FCC metallic systems, and examine how the speeding-up of the collective dynamics in the interfacial liquids differ from the those found in the current SS CMIs. Additional calculated data would benefit the advancement of the predictive theory for the collective dynamics of the local interfacial liquids and structure- and material-dependent aspects of CMI solidification kinetics.

Author Contributions

Conceptualization, D.V.A. and H.L.; validation, Z.L. and X.Z.; formal analysis, Z.L. and Y.W.; investigation, Y.W. and S.L.; data curation, Z.L., X.Z., Y.W., S.L. and H.L.; writing—original draft preparation, Z.L. and Y.Y.; writing—review and editing, Y.Y.; visualization, H.L.; supervision, D.V.A. and Y.Y.; project administration, D.V.A. and Y.Y.; funding acquisition, Y.Y. All authors have read and agreed to the published version of the manuscript.

Funding

This research was funded by Yang Yang of the Chinese National Science Foundation (Grant No. 11874147), the Natural Science Foundation of Shanghai (Grant No. 23ZR1420200).

Data Availability Statement

The raw data supporting the conclusions of this article will be made available by the authors on request.

Conflicts of Interest

On behalf of all authors, the corresponding author states that there are no conflicts of interest.

References

  1. Asta, M.; Beckermann, C.; Karma, A.; Kurz, W.; Napolitano, R.; Plapp, M.; Purdy, G.; Rappaz, M.; Trivedi, R. Solidification microstructures and solid-state parallels: Recent developments, future directions. Acta Mater. 2009, 57, 941–971. [Google Scholar] [CrossRef]
  2. Wu, L.; Zhu, Y.; Wang, H.; Li, M. Crystal–melt coexistence in FCC and BCC metals: A molecular-dynamics study of kinetic coefficients. Model. Simul. Mater. Sci. Eng. 2021, 29, 065016. [Google Scholar] [CrossRef]
  3. Ghosh, G. Observation and kinetic analysis of a metastable b.c.c. phase in rapidly solidified Ni 9at.%Zr and Ni 8at.%Zr 1at.%X alloys. Mater. Sci. Eng. A 1994, 189, 277–284. [Google Scholar] [CrossRef]
  4. Volkmann, T.; Herlach, D.M.; Löser, W. Nucleation and phase selection in undercooled Fe-Cr-Ni melts: Part I. Theoretical analysis of nucleation behavior. Metall. Mater. Trans. A 1997, 28, 453–460. [Google Scholar] [CrossRef]
  5. Zambon, A.; Badan, B.; Eckler, K.; Gärtner, F.; Norman, A.; Greer, A.; Herlach, D.; Ramous, E. Microstructure and phase selection in containerless processing of Fe–Ni droplets. Acta Mater. 1998, 46, 4657–4670. [Google Scholar] [CrossRef]
  6. Li, M.; Lin, X.; Song, G.; Yang, G.; Zhou, Y. Microstructure evolution and metastable phase formation in undercooled Fe–30 at.% Co melt. Mater. Sci. Eng. A 1999, 268, 90–96. [Google Scholar] [CrossRef]
  7. Herlach, D.M. Metastable materials solidified from undercooled melts. J. Phys. Condens. Matter 2001, 13, 7737. [Google Scholar] [CrossRef]
  8. Greer, A.; Walker, I. Primary crystallization in (Fe, Ni)-based metallic glasses. J. Non-Cryst. Solids 2003, 317, 78–84. [Google Scholar] [CrossRef]
  9. Notthoff, C.; Feuerbacher, B.; Franz, H.; Herlach, D.M.; Holland-Moritz, D. Direct Determination of Metastable Phase Diagram by Synchrotron Radiation Experiments on Undercooled Metallic Melts. Phys. Rev. Lett. 2001, 86, 1038–1041. [Google Scholar] [CrossRef]
  10. Sun, D.Y.; Asta, M.; Hoyt, J.J. Crystal-melt interfacial free energies and mobilities in FCC and BCC Fe. Phys. Rev. B 2004, 69, 174103. [Google Scholar] [CrossRef]
  11. Mendelev, M.I.; Zhang, F.; Song, H.; Sun, Y.; Wang, C.Z.; Ho, K.M. Molecular dynamics simulation of the solid-liquid interface migration in terbium. J. Chem. Phys. 2018, 148, 214705. [Google Scholar] [CrossRef] [PubMed]
  12. Mikheev, L.; Chernov, A. Mobility of a diffuse simple crystal—melt interface. J. Cryst. Growth 1991, 112, 591–596. [Google Scholar] [CrossRef]
  13. David, A.; Kessler, J.K.; Levine, H. Pattern selection in fingered growth phenomena. Adv. Phys. 1988, 37, 255–339. [Google Scholar] [CrossRef]
  14. Wu, K.A.; Wang, C.H.; Hoyt, J.J.; Karma, A. Ginzburg–Landau theory of the BCC-liquid interface kinetic coefficient. Phys. Rev. B 2015, 91, 014107. [Google Scholar] [CrossRef]
  15. Xu, X.Q.; Laird, B.B.; Hoyt, J.J.; Asta, M.; Yang, Y. Kinetics of Crystallization and Orientational Ordering in Dipolar Particle Systems. Cryst. Growth Des. 2020, 20, 7862–7873. [Google Scholar] [CrossRef]
  16. Zhang, X.; Lu, W.; Liang, Z.; Wang, Y.; Lv, S.; Liang, H.; Laird, B.B.; Yang, Y. Local collective dynamics at equilibrium BCC crystal–melt interfaces. J. Chem. Phys. 2022, 157, 084709. [Google Scholar] [CrossRef]
  17. Wang, Y.; Liang, Z.; Zhang, X.; Lu, W.; Yu, Z.; Ma, X.; Liang, H.; Yang, Y. Understanding the kinetic anisotropy of the soft-sphere BCC crystal–melt interfaces. J. Phys. Condens. Matter 2022, 34, 264004. [Google Scholar] [CrossRef]
  18. Cui, D.; Zhang, J.; Li, X.; Liang, Z.; Zhang, X.; Yang, Y.; Wang, H. Atomistic insights into sluggish crystal growth in an undercooled CoNiCrFe multi-principal element alloy. J. Alloy Compd. 2023, 941, 168881. [Google Scholar] [CrossRef]
  19. Hansen, J.P.; McDonald, I.R. Chapter 2—Statistical Mechanics, 4th ed.; Academic Press: Oxford, UK, 2013. [Google Scholar] [CrossRef]
  20. Davidchack, R.L.; Laird, B.B. Crystal Structure and Interaction Dependence of the Crystal-Melt Interfacial Free Energy. Phys. Rev. Lett. 2005, 94, 086102. [Google Scholar] [CrossRef]
  21. Brańka, A.C.; Heyes, D.M. Thermodynamic properties of inverse power fluids. Phys. Rev. E 2006, 74, 031202. [Google Scholar] [CrossRef]
  22. Heyes, D.M.; Brańka, A.C. Self-diffusion coefficients and shear viscosity of inverse power fluids: From hard- to soft-spheres. Phys. Chem. Chem. Phys. 2008, 10, 4036. [Google Scholar] [CrossRef] [PubMed]
  23. Heyes, D.M.; Powles, J.G. Thermal conductivity of fluids with steeply repulsive potentials. Mol. Phys. 2001, 99, 1077–1089. [Google Scholar] [CrossRef]
  24. Powles, J.G.; Heyes, D.M. Viscoelastic behaviour of fluids with steeply repulsive potentials. Mol. Phys. 2000, 98, 917–927. [Google Scholar] [CrossRef]
  25. Mladek, B.M.; Gottwald, D.; Kahl, G.; Neumann, M.; Likos, C.N. Formation of Polymorphic Cluster Phases for a Class of Models of Purely Repulsive Soft Spheres. Phys. Rev. Lett. 2006, 96, 045701. [Google Scholar] [CrossRef]
  26. Agrawal, R.; Kofke, D.A. Solid-Fluid Coexistence for Inverse-Power Potentials. Phys. Rev. Lett. 1995, 74, 122–125. [Google Scholar] [CrossRef]
  27. Heyes, D.M.; Brańka, A.C. The influence of potential softness on the transport coefficients of simple fluids. J. Chem. Phys. 2005, 122, 234504. [Google Scholar] [CrossRef]
  28. Morris, J.R. Complete mapping of the anisotropic free energy of the crystal-melt interface in Al. Phys. Rev. B 2002, 66, 144104. [Google Scholar] [CrossRef]
  29. Plimpton, S. Fast Parallel Algorithms for Short-Range Molecular Dynamics. J. Comput. Phys. 1995, 117, 1–19. [Google Scholar] [CrossRef]
  30. Du, H.; Liang, H.; Yang, Y. Molecular Dynamics Simulation of Monolayer Confined Ice-Water Phase Equilibrium. Acta Chim. Sin. 2018, 76, 483. [Google Scholar] [CrossRef]
  31. Liang, Z.; Zhang, X.; Lv, S.; Liang, H.; Yang, Y. Crystal-Melt Interface Kinetics and the Capillary Wave Dynamics of the Monolayer Confined Ice-Water Coexistence Lines. Acta Chim. Sin. 2021, 79, 108. [Google Scholar] [CrossRef]
  32. Yang, Y.; Humadi, H.; Buta, D.; Laird, B.B.; Sun, D.; Hoyt, J.J.; Asta, M. Atomistic Simulations of Nonequilibrium Crystal-Growth Kinetics from Alloy Melts. Phys. Rev. Lett. 2011, 107, 025505. [Google Scholar] [CrossRef]
  33. Monk, J.; Yang, Y.; Mendelev, M.I.; Asta, M.; Hoyt, J.J.; Sun, D.Y. Determination of the crystal-melt interface kinetic coefficient from molecular dynamics simulations. Model. Simul. Mater. Sci. Eng. 2009, 18, 015004. [Google Scholar] [CrossRef]
  34. Wu, K.A.; Karma, A.; Hoyt, J.J.; Asta, M. Ginzburg–Landau theory of crystalline anisotropy for BCC-liquid interfaces. Phys. Rev. B 2006, 73, 094101. [Google Scholar] [CrossRef]
  35. Wu, K.A.; Karma, A. Phase-field crystal modeling of equilibrium BCC-liquid interfaces. Phys. Rev. B 2007, 76, 184107. [Google Scholar] [CrossRef]
  36. Wu, K.A.; Lin, S.C.; Karma, A. Two-mode Ginzburg–Landau theory of crystalline anisotropy for FCC-liquid interfaces. Phys. Rev. B 2016, 93, 054114. [Google Scholar] [CrossRef]
  37. Shih, W.H.; Wang, Z.Q.; Zeng, X.C.; Stroud, D. Ginzburg–Landau theory for the solid-liquid interface of BCC elements. Phys. Rev. A 1987, 35, 2611–2618. [Google Scholar] [CrossRef]
  38. Freitas, R.; Reed, E.J. Uncovering the effects of interface-induced ordering of liquid on crystal growth using machine learning. Nat. Commun. 2020, 11, 3260. [Google Scholar] [CrossRef]
  39. Lu, W.L.; Liang, H.T.; Ma, X.M.; Yuan, Z.F.; Zhang, X.; Liang, Z.; Yang, Y. Atomistic Simulation Study of the FCC and BCC Crystal-Melt Interface Stresses. Surf. Interfaces 2022, 28, 101639. [Google Scholar] [CrossRef]
Figure 1. Snapshots of the CMI crystal-melt interfaces during steady-state solidification selected from the non-equilibrium MD simulation. (a) BCC(100) CMI. (b) BCC(110) CMI. (c) BCC(111) CMI. (d) FCC(100) CMI. The SS particles are color-coded based on the structural order parameter, red for crystal while green for melt phases.
Crystals 14 00292 g001
Figure 2. CMI velocities V I as functions of the interface temperatures T I , obtained from the NEMD simulations of the n = 8 soft-sphere (a) BCC(100), (b) BCC(110), (c) BCC(111) CMIs and (d) FCC(100) CMI. The weighted-least-squares fits to the data are represented with solid lines, and the slopes of the fits yield the CMI kinetic coefficients μ n ^ MD .
Crystals 14 00292 g002
Figure 3. GL order parameter profiles, as the function of the distance relative to the CMI position, across equilibrium SS (a) BCC(100), (b) BCC(110), (c) BCC(111) CMIs and (d) FCC(100) CMI. z > 0 for crystals, and z < 0 for melt. The GL order parameter profiles for all CMIs computed from the equilibrium MD simulations using Equations (14)–(17).
Crystals 14 00292 g003
Figure 4. The normalized DSFs at the principal RLVs (solid lines) and at the second set of RLVs (dashed lines), for the interfacial liquids (colored lines) at (a) BCC(100), (b) BCC(110), (c) BCC(111), and (d) FCC(100) CMIs. The black lines are the corresponding data for the bulk melt phase.
Crystals 14 00292 g004
Figure 5. The dissipative time constants ς 1 and ς 1 I corresponding to the principal RLVs, of the SS (a) BCC(100), (b) BCC(110), (c) BCC(111) CMIs. z = 0 corresponds to the position of the CMI, z > 0 for melt, and z < 0 for crystal. The subscript “I” denotes data obtained from the interfacial liquids. The fine-grained particle number density profiles ρ ( z ) are plotted as a guide to the eye.
Crystals 14 00292 g005
Figure 6. For the FCC(100) CMI. The dissipative time constants (DTCs) (a) ς 1 and ς 1 I corresponding to the principal RLVs, represented with the down-pointing triangles; (b) ς 2 and ς 2 I corresponding to the second set of RLVs, represented with the up-pointing triangles. The subscript “I” denotes data obtained from the interfacial liquids. z * = 0 corresponds to the position of the CMI, z * > 0 for melt, and z * < 0 for crystal. The fine-grained particle number density profiles ρ ( z ) are plotted as a guide to the eye.
Crystals 14 00292 g006
Table 1. Classifications of the density wave amplitude order parameters (GL order parameters), the RLV subsets with respect to the BCC-melt and FCC-melt CMI normals.
n ^ BCC(100)BCC(110)BCC(111)FCC(100)
OP category u a u b u a u b u c u a u b u a v a v b
Numbers of K or G 4828266842
( K ^ · n ^ ) 2 or ( G ^ · n ^ ) 2 0 1 2 0 1 4 10 2 3 1 3 01
Table 2. Summary of the magnitude and anisotropy of the BCC SS CMI kinetic coefficients, predicted by the NEMD simulations and the TDGL solidification theory. Subscript “I” stands for the TDGL prediction using the density relaxation times of the local interfacial liquids.
μ n ^ MD μ n ^ GL μ n ^ I GL
μ 100 BCC 2.7(1)2.3(2)2.7(1)
μ 110 BCC 2.5(1)2.1(1)2.4(2)
μ 111 BCC 2.3(1)2.0(1)2.3(1)
μ 100 FCC 2.3(2)1.8(1)2.2(2)
μ 100 BCC / μ 110 BCC 1.09(6)1.13(10)1.11(9)
μ 100 BCC / μ 111 BCC 1.19(8)1.16(10)1.19(6)
μ 110 BCC / μ 111 BCC 1.09(9)1.03(9)1.07(8)
Table 3. Summary of the contributing parameters used for predicting μ n ^ GL and μ n ^ I GL . Subscript “I” stands for the TDGL prediction using the density relaxation times of the local interfacial liquids. Including, Δ H the latent heat, A the anisotropy factor, Λ the spatial integration of the square-gradient terms of the GL order parameters (SISG), ς the dissipative time constant (DTC).
n ^ Δ H A A I Σ Λ u a Σ Λ u b Σ Λ u c Σ Λ v a Σ Λ v b ς 1 ς 2 ς 1 I ς 2 I
BCC(100)0.7080.30(2)0.26(1)0.3450.609---0.32(2)-0.27(1)-
BCC(110)0.7080.35(2)0.29(2)0.2330.7280.129--0.32(2)-0.26(2)-
BCC(111)0.7080.36(2)0.31(1)0.6650.452---0.32(2)-0.28(1)-
FCC(100)0.8580.47(2)0.39(3)0.860--0.4130.1720.31(1)0.35(4)0.25(3)0.31(3)
Disclaimer/Publisher’s Note: The statements, opinions and data contained in all publications are solely those of the individual author(s) and contributor(s) and not of MDPI and/or the editor(s). MDPI and/or the editor(s) disclaim responsibility for any injury to people or property resulting from any ideas, methods, instructions or products referred to in the content.

