
Crystallization of Polymers with a Reduced Density of Entanglements

Centre of Molecular and Macromolecular Studies, Polish Academy of Sciences, 90-363 Lodz, Poland
Crystals 2024, 14(4), 385; https://doi.org/10.3390/cryst14040385
Submission received: 22 March 2024
/
Revised: 13 April 2024
/
Accepted: 18 April 2024
/
Published: 20 April 2024
(This article belongs to the Section Macromolecular Crystals)
Abstract
:Since methods for reducing macromolecule entanglements have been developed, it has become possible to better understand the impact of polymer chain entanglement on the crystallization process. The article presents basic information about the disentangling of macromolecules and the characterization of the degree of entanglement. The basic knowledge of polymer crystallization was also presented. Then, it was discussed how polymers crystallize during their disentangling. Non-isothermal and isothermal crystallization experiments using disentangled polymers, and for comparison using entangled polymers, are described in more detail. The influence of disentangling on both nucleation and crystal growth is highlighted. It is also shown how the crystallization of polymers changes when macromolecules re-entangle.
1. Introduction
It has been known for 70 years that polymer macromolecules are entangled with each other and these entanglements affect the properties of the polymer. The ability to crystallize is common among polymers. By examining equilibrium entangled polymers, it was determined that the crystallization process also depends on the entanglement of the macromolecules. When methods for disentangling macromolecules were developed, it was possible to extend crystallization research to polymers in which there is no equilibrium state of entanglement of macromolecule chains. The obtained results are presented in this review. The article begins by presenting basic information about macromolecule entanglements and methods of disentangling them (Section 2). Later, information about the crystallization of polymers is presented, to which the results of crystallization studies of partially disentangled polymers will refer (Section 3). The main part of the article describes the results of research on the crystallization of partially disentangled polymers. First, the crystalline state formed during polymer disentangling is discussed (Section 4). Later, non-isothermal crystallization from the disentangled polymer (Section 5) and crystallization in isothermal conditions are described (Section 6). Attention is paid to specific aspects, such as the growth of spherulites and crystallization regimes. Since macromolecules remaining at high temperatures for a longer period of time have the ability to re-entangle, it is shown how this affects the crystallization process and that, for example, the crystal growth rate can be used to assess the progress of macromolecule re-entanglement (Section 7). Each of Section 4, Section 5, Section 6 and Section 7 ends with a brief summary of the results.
2. Entanglements of Macromolecules
Early studies of rheological properties of polymers, including measurements of the zero shear viscosity, ηo, showed that for low-molecular-weight polymers the relationship ηo~M applies, where M is the molecular weight of the polymer, while when the molecular weight is above a certain limit, the relationship changes to ηo~M3.4 [1]. The reason for the change is that higher-M macromolecular chains are long enough to entangle with others [2,3,4]. The concept of entanglements was introduced in 1950s by Bueche [5]. Therefore, both the size of macromolecules and the fact that their chains interpenetrate, creating entanglements that are nodes of the physical network, are responsible for the high viscosity observed in the polymer melt.
The macromolecules are entangled not only in the melt or concentrated solution, but also in the amorphous phase of the solid polymer, so it is not surprising that the mechanical properties of thermoplastic polymers during deformation depend on this entanglement. This is analogous to the deformation of rubber, which is controlled by nodes of the macromolecular network formed by cross-linking of rubber. The basic equations described equilibrium shear modulus of rubber Ge [6] and the shear modulus in the rubbery plateau region GN0 of a thermoplastic polymer [7,8] have a similar form:
and
where ρr is the density of the rubber, R is the gas constant, T is the temperature, Mr is the molecular mass between the network nodes (i.e., cross-linking points) [9], g is a coefficient equal to 1 or 0.8, ρ is the density of the polymer, and Me is the molecular mass between entanglements [7].
The measurement of GN0 in a rheological oscillatory shear experiment allows the determination of Me [10]. If the polymer is not specially treated, the entanglement is assumed to be at the equilibrium level and characterized by Me [11]. Typical Me values for the most commonly used polymers are shown in Table 1. Data for more polymers can be found elsewhere [10,12,13].
Since it is not always possible to determine GN0 directly on the basis of rheological experiment, other methods also based on rheological tests have been proposed [14,15,16,17]. It is difficult to find a way to increase the entanglement density above the equilibrium state, it is much easier to reduce the entanglement. Therefore appropriate methods have been developed and the properties of partially disentangled polymers are being investigated.
The movement of polymer chains in liquids (i.e., concentrated solution or melt) has been described by two dynamical models, known as the Rouse model [18,19] and the tube model [8]. In the tube model, according to the reptation concept formulated by de Gennes [20], the polymer chain moves inside the virtual tube (Figure 1). The shape of the tube and its diameter depend on the constraints resulting from the presence of other macromolecules [8,19,20,21,22]. The movement of the macromolecule along the tube is free, but it is forbidden in the transverse direction. The movement of the chain inside the virtual tube resembles the movement of a snake and is called reptation. The time of diffusion along the length of the tube is a parameter describing the dynamics of the chain [19].
There are four main approaches to disentangling polymers [13]. The most frequently used method involves dissolving the polymer. In principle, any polymer can be disentangled by this method if the solvent can be selected for it. In a concentrated solution, macromolecules take the form of coils that interpenetrate and entangle with each other. It is known that in a dilute solution the number of contacts between macromolecules is limited and below a certain critical concentration of C*, the chains of macromolecules form separated coils [24]. Therefore, by changing the concentration, the level of entanglement can be controlled, from equilibrium to zero. However, the polymer in solution does not have many applications. For this reason, an important step in this method is to obtain a disentangled polymer in the solid state from solution. One possibility is to quickly freeze the solution, for example, using liquid nitrogen, and then dry it (solvent sublimation) [25,26,27,28,29]. Freeze-drying leads to the collapse of individual macromolecular chains into compact globules without significant chain entanglement. The disentangling state obtained by dissolution can also be fixed by crystallization from the solution [30] or adding a non-solvent to the solution, causing the precipitation of the disentangled polymer [31].
There are some approaches to characterizing polymer solutions and entanglements. The overlap concentration C* can be calculated from the following equation:
where ρ is the bulk density of the polymer, Me is the molecular mass between entanglements in the melt, and M is the molecular mass of the polymer [24,32,33]. The value of C* can also be estimated from the following equation:
where N is the degree of polymerization and ρs is the density of the solvent [24,34]. The reduction in entanglement in the solution compared to the equilibrium entanglement in the melt can be described by a power law,
where Mes is the molecular mass between entanglements in solution, φ is the volume fraction of polymer in the solution, and α is the dilution exponent [27,35,36,37,38]. The value of the α exponent is proposed to be between 1.0 and 2.0, e.g., for PCL studied by Tian et al. [39] it was 1.3.
C* = ρ (Me/M)
C* ≈ N−4/5ρ ρs
Mes = Meφ−α
As a result of macromolecular movement, the actual concentration limit at which chain separation occurs is significantly shifted towards a lower concentration [40]. This is called the dynamic contact concentration Cs. For example, for atactic polystyrene C* = 1 wt.%, while Cs = 6 × 10⁻² wt.% [32,40].
The second possibility to disentangle the polymer is to do it directly during polymerization. If the polymerization catalysts are selected in such a way that the chain growth sites are separated and the process temperature is low, the synthesized macromolecules will be able to crystallize before becoming entangled with neighboring macromolecules. This method was typically used for ultra-high molecular weight polyethylene (UHMWPE) and sometimes for poly(tetrafluoroethylene). The resulting disentangled polymer is referred to as nascent [41,42,43].
One laboratory method, applicable mainly to PE with a low molecular weight (Mw), e.g., 55,000 g/mol, is melt crystallization under pressure with the formation of crystals with extended chains [44]. The procedure used was to melt the polymer, apply a pressure of 630 MPa, crystallize for 1 h, cool under pressure, and finally reduce the pressure. The crystallinity of the resulting material was very high, so the amorphous phase was limited and had few entanglements.
The methods described above require some procedure that is effective in laboratory research, but less so in industrial applications. For this reason, shear disentanglement of polymer melts has recently received much attention. There are observations that intense shear flow can orient macromolecules and lead to their partial disentanglement. Much of the previous research involved shearing polymer melts in laboratory equipment such as heating stages and observing the effect of melt shear on crystallization [45,46,47,48]. Such measurements are still carried out for selected polymers, e.g., poly(ether ether ketone) [49,50]. The interpretation of crystallization results took into account the orientation of macromolecules and their disentangling. However, since these publications generally do not provide a more precise analysis of the degree of disentanglement of macromolecules due to shearing in the melt, they are not discussed in this review, and interested readers are referred to the relevant reviews [51,52,53,54].
The effects of polymer shear application are studied on a small scale using rheometers [55,56,57,58]. To process larger amounts of polymer, processing machines such as extruders are modified. The idea is to obtain an extensive shear field, which leads to the modification of the material being processed continuously [59,60,61]. It was also announced that the addition of nanoparticles can support polymer disentangling [62,63,64,65,66].
Disentangled polymer tends to re-entangle if the appropriate thermal conditions occur [44]. The re-entanglement time depends on the temperature and the difference between the initial and equilibrium entanglement densities [67]. Usually this process is not very fast and takes several minutes or more [30].
The terms “entangled” and “disentangled” are often used in the literature on the subject. The first one means the equilibrium entanglement of macromolecules. The second term usually means partial, not complete, disentangling of polymer chains. This is how their use should be understood in the following description of the experimental results.
3. Basic Facts about Polymer Crystallization
Polymers with a regular structure (tacticity) of the macromolecular chain have the ability to crystallize [68]. Melt crystallization as appropriate to the processing situation is usually studied, and much less attention is paid to solution crystallization [69,70]. Crystallization of polymers from the melt occurs under undercooling conditions, and the crystallization temperature is much lower than the melting temperature [71]. Crystallization can occur under non-isothermal conditions (i.e., at a changed temperature) or isothermal conditions (i.e., at a constant temperature). A special case is cold crystallization, which occurs in some solidified polymers when heated: those that are poorly able to crystallize in a “normal” way.
Crystallization is the result of two processes: nucleation and crystal growth. Crystallization nucleation may be primary or secondary. Primary nucleation is defined as leading to the formation of a stable nucleus (seed) of the future crystal. Secondary nucleation means a nucleation process on the surface of an existing crystal. It is necessary for the growth of polymer crystals. Another classification, based on the type of primary nucleus, distinguishes three types of nucleation: homogeneous, heterogeneous, and self-nucleation (self-seeding). Homogeneous nucleation is uncommon because to produce a nucleus of a critical size, local ordering of disentangled macromolecules is necessary, which is not a typical case, and requires high undercooling. Self-nucleation is the result of the incomplete destruction of the existing crystal structure during melting [72,73].
There is an energy barrier that must be overcome for the crystals to achieve stable growth, i.e., adding another fragment of a macromolecule to the crystal should reduce its free energy [74]. Otherwise, a nucleus that is too small will disappear. The barrier is lower when crystallization begins on the surface of existing impurities in the melt, such as dust particles. This type of nucleation on a foreign surface is called heterogeneous and is the most frequently observed.
The growth of crystals from the nucleus occurs by depositing part of the macromolecular chain on the growing surface. This process is described by the Hoffman–Lauritzen theory [74,75,76]. First, a straightened fragment of a macromolecule is deposited on the surface of an existing crystal, creating the so-called stem. It is energetically advantageous that a second fragment of the same macromolecule, rather than another macromolecule, will join the crystal surface near the first stem. The close packing of macromolecular fragments requires tight chain folding and is known as adjacent reentry. To participate in crystallization, the macromolecule is dragged from the melt to the growth front and partially disentangled [75]. The degree of disentanglement obtained locally will depend on the chain mobility as well as the entanglement number [77].
In this way, a whole new layer of the crystal surface is filled step by step. However, the next layer may begin to form even before the previous one is filled. This is due to the competition between secondary nucleation on the crystal surface and the filling of the substrate. The kinetics of these processes are characterized by the secondary nucleation rate, i, and the layer propagation rate, g. Which process dominates depends on the temperature. At the highest temperatures i << g and then crystallization is described as occurring in regime I [78,79]. Nucleation of a new layer before filling the previous one means that we are dealing with crystallization regime II or III. In mode II, at intermediate undercooling, i is proportional to g and multiple layers can grow simultaneously. The last case is regime III, in which, at high undercooling, intense secondary nucleation dominates, i.e., i > g, and as a result, there are a number of partially filled layers on the crystal surface at the same time (see Figure 2) [74,80].
The crystal growth rate G is controlled by two factors—the transport term and the driving force term—both of which depend differently on temperature. The transport factor, related to the chain mobility near the crystal surface, is an increasing function of temperature, the driving force term, representing the deposition (nucleation) of a single strand, decreases with increasing temperature. According to Hoffman and Lauritzen theory [74,75,76,78],
where Go is a pre-exponential factor depending on the molecular mass, U* is the activation energy of the transport of chain segments to the crystallization site (i.e., activation energy of reptation), R is the gas constant, T is the crystallization temperature, Tref is a reference temperature, below the glass transition, when the free volume is close to zero, Kg is a constant depending on the regime of crystallization, ΔT = Tmo − T, and Tmo is equilibrium melting temperature. The factor exp[−(Kg/T ΔT)] in Equation (6) represents the formation of the secondary nucleus. The Go exp[−U*/R(T − Tref)] factor represents the slowdown of crystal growth due to the resistance of the melt to pulling the macromolecule by crystallization forces [44].
Polymer crystals, although they grow according to the principles described above, can have various shapes. Most often, polymer crystals obtained from the melt have the shape of lamellas or long tapes. Crystal thickness, lc, is one of the frequently determined parameters when describing crystallization. DSC or SAXS measurements show that it increases with decreasing undercooling, i.e., when the crystallization temperature is higher (lc~1/ΔT). The thickness of the crystals is usually in the range of 5–20 nm, the dimensions in the other directions are much larger. The Gibbs–Thomson equation describes relation between the lamellae thickness, lc, and the melting temperature Tm [81,82]:
where σe is surface free energy for basal interface of crystal, and ΔHv is the enthalpy of fusion per unit volume.
Typically, during the crystallization of a polymer from a melt, instead of the growth of single, isolated crystals, the formation of crystal aggregates is observed. The two most common forms of such structures are spherulites and shish-kebabs. Spherulites are objects in which radial lamellae spread in three-dimensional space from a central core that was formed as a result of primary nucleation, usually of a heterogeneous nature [83]. The space created between the lamellae during the expansion of the spherulite is filled by branching new lamellae. The rate of spread of spherulite in the polymer volume is the same in every direction perpendicular to the surface, and since the direction of growth of individual lamellas is the local direction of spherulite growth, the crystal growth rate G can be determined from the observation of spherulite expansion.
When characterizing polymer crystallization, it is often reported how the filling of the space with growing spherulites changes over time. Spherulites spreading in space meet after some time, creating boundaries. The shape of the boundaries provides information about the nature of spherulitic nucleation. If it occurs simultaneously, the boundaries are straight lines; if the nucleation is extended in time, the boundaries are curved. The growth rate of spherulites depends on temperature and is constant throughout most of the isothermal growth process. However, when the volume is almost filled with spherulites, the growth conditions may change. Spherulites may surround certain volumes (pockets) of the melt [84,85]. Because the density of the formed crystals is greater than the density of the melt in these closed areas (so-called weak spots), an melt deficit occurs and the so-called negative pressure increases, causing three-dimensional stretching of the melt and slowing the growth of spherulites. When the negative pressure is higher than the strength of melt, rapid break and voids formation occur. The occluded pockets with or without cavitation weaken the material after crystallization, which is why they are called weak spots [86]. In HDPE and PP, an increase in the melting temperature of the outer parts of spherulites present in weak spots was observed [87,88].
The process of formation of the spherulitic structure can be described mathematically using the approach proposed by Avrami [89]. The appropriate equation describing the progress of spherulitic crystallization with time is as follows:
where X is the volume fraction of crystallized material, t is time, n is the Avrami index, and k is a rate constant of isothermal crystallization. The k coefficient depends on the nucleation density N and the growth rate of spherulites, G:
X = 1 − exp(−ktn)
k = 4πNG3/3
Based on the acquired knowledge about polymer crystallization, briefly presented above, two questions could be formulated. Under what circumstances does the presence of entanglements affect crystallization? What changes in the course of crystallization can we expect after the disentangling of macromolecules? The answer to the first question is that both nucleation and crystal growth depend on the constraints caused by entanglement in the melt. The answer to the second question is provided in the following sections, devoted to the crystallization of partially disentangled polymers. Before we move on, however, we need to discuss the methods used in the study of crystallizing polymers.
The two main techniques used in crystallization studies are differential scanning calorimetry (DSC) and polarizing light microscopy (PLM), usually using a heat stage [79,90,91]. In DSC studies, the crystallization temperature, cold crystallization temperature, melting temperature, heat of crystallization, heat of fusion, crystallinity, and crystallization progress can be measured under non-isothermal or isothermal conditions. From the analysis of the first heating process, it is possible to learn about the initial crystalline structure of the tested material, resulting from the previous processing. Melt crystallization and second heating provide information about the properties of the material processed under controlled conditions.
Crystallization studies can also be performed using a hot stage connected to a polarizing microscope. The hot stage usually has a programmed temperature, and the tested sample placed on it is simultaneously in the light path through the microscope. Polarization of light helps in observing birefringent objects. Images from the microscope are already standardly registered in the computer’s memory. The formation of a spherulitic structure, the conversion of the melt to a crystalline phase, and the growth of spherulites are examples of topics studied using this equipment.
Information about the internal structure of the crystals, their dimensions and the degree of crystallinity of the polymer can be obtained from X-ray scattering studies at small (SAXS) and wide angles (WAXS) [82]. X-ray examinations are most often performed after crystallization, but it is also possible, for example, to attach a heating stage with the sample to an X-ray apparatus and, using a powerful synchrotron source, conduct in situ measurements. For some polymers, it may also be useful to use other methods, such as Raman [92] or infrared spectroscopy [93,94].
4. Crystallization during Process of Disentangling
In the final phase of the process of disentangling the macromolecules, the polymer solidifies and then often crystallizes. Some research groups analyze the crystal structures created in this way, because to some extent they characterize the chain disentangling process itself. Most often, disentangling macromolecules is achieved by freezing a dilute solution and then removing the solvent. The obtained structure and crystallinity depend, of course, on the conditions and nature of the preparation process, but when it is performed in a similar way to obtain differently entangled samples, these samples can be compared and certain conclusions can be drawn. Unfortunately, most authors who use freezing dissolution to disentangle polymers limit themselves to providing solution concentrations and do not attempt to determine the obtained degree of disentangling by specifying the Me value.
Some early research was devoted to obtaining partially disentangled PET [26,28,95]. The level of disentanglement was controlled by preparing more or less concentrated solutions in phenol, dropping them into water with ice or into liquid nitrogen and extracting them [26,95]. Ji et al. [95] observed that the maximum level of crystallinity was obtained when the concentration in the solution was intermediate and amounted to 0.2 wt.% (see Figure 3). Both a higher concentration, which gives more contacts of macromolecules, and a more dilute solution, in which it is difficult to find macromolecules near an existing nucleus or to form a new nucleus, are not favorable for obtaining high crystallinity. The results of Sun et al. [26] were consistent with the above. WAXS measurement showed that the disentangled PET had significantly higher crystallinity than the compared solution cast PET film, and the highest crystallinity (47%) was measured for PET obtained from a medium concentration solution (0.2 wt.%). The conclusions that in a highly dilute solution the distance between the chains becomes too large to crystallize during the extraction process were also presented by Xie et al. [28].
The dependence of the crystallinity of poly(vinylidene fluoride) (PVDF) on the concentration of solution in dioxane and the freezing rate (i.e., fast in liquid nitrogen, slow in the refrigerator) was studied by Xue et al. [96] (Figure 3b). Also for this polymer there was an optimal concentration level in the solution. The cooling rate was only important for very dilute solutions, where the more separated macromolecules needed time to travel longer distances to the crystallization sites.
The third polymer whose structure was examined
after disentangling was isotactic polystyrene. It was investigated by Xue and
his colleagues [94,97]. WAXS studies showed
that only polystyrene from a dilute solution crystalized effectively during
freezing. Crystallinity was determined by comparing the bands visible in the
infrared. There was a concentration limit around 0.04 g/dL below which a considerable
amount of crystalline material was formed, and much less above this limit (Figure 4a). The
properties of freeze-dried iPS were also of interest to Bu and co-workers [32]. They confirmed weak crystallization when
freezing and the ability to cold crystallize. A large depression (up to 40 °C)
in the cold-crystallization temperature, proportional to disentanglement, was
observed when compared to entangled iPS (Figure 4b). The application of an annealing time of 10 h at 100 °C (i.e., at
glass transition) for collective particles obtained from a solution with a
concentration of 10−2 wt.% resulted in an increase in the cold-crystallization
temperature from 136 to 144 °C, but it was still 20 °C lower than the
temperature of the bulk, for a completely entangled polymer.
An example of a polymer with rigid chains is polycarbonate (PC) [98]; therefore, it is difficult to crystallize, and the time needed to create a spherulitic structure with a crystallinity of 25% is over a week at a high temperature of 190 °C. Partially disentangled Bisphenol-A polycarbonate was compared with PC obtained from an entangled solution by FTIR, DSC, and WAXS methods [99]. Both materials crystallized during processing; however, disentangled PC had a higher overall crystallinity (42.5 vs. 33.6%) and more perfect structure, as judged by a narrower melting peak (Figure 5). The crystallinity of freeze-dried PC can be increased to 80% by annealing at 190 °C for 289 h. It was much higher than when annealing ordinary crystallized samples [100].
Polyphenylene sulfide (PPS) is another example of a rigid polymer but with excellent dielectric properties. Its properties were tested on four different samples: polymerization disentangled powder, fully entangled PPS obtained by re-entangling this powder, and two samples disentangled by the solution method [101]. Me mass measurements gave values of 1188, 354, 609, and 709 g/mol, respectively, i.e., the PPS from synthesis was the most disentangled. During DSC heating, melting was similar for samples entangled and disentangled in solution (at Tm = 280 °C), but in addition, a second, dominant melting peak was observed at 296 °C for polymerized PPS. The presence of this peak was explained as a result of crystallization with extended-chain crystals, which is possible for the resulting reactor powder.
Two different solvents, xylene and mineral oil, were used to disentangle PP. Disentanglement stabilization was achieved in these studies by crystallization during cooling at a rate of 15 °C/h [102]. Heating the obtained powders showed that their melting point was 1.3–1.4 °C higher than that of entangled PP. Crystallinity was also higher, especially for PP prepared from xylene, which was rheologically confirmed to have the highest Me.
Much easier than dissolving PP is dissolving poly(ethylene oxide) (PEO), which can be performed using water at ambient temperature [67]. Two disentangled and one fully entangled PEO showed a melting peak at 64.7–71.4 °C, lower for PEO obtained from a more diluted solution. The samples had a similar crystallinity of 72–74%. The crystals grew in a monoclinic form, and their length in the direction perpendicular to the (120) plane, calculated using the Scherrer method [103], was 20 nm. In my opinion, this size should be interpreted as the size of blocks between large dislocations, which are part of much longer lamellae.
The disentangling of polycaprolactone (PCL) was effectively controlled by Tian et al. [39] using different proportions of chloroform solvent and ethanol non-solvent. The first DSC heating of PCL showed an increase in initial crystallinity from 56% to 68% for the -disentangled polymer, accompanied by a moderate increase in melting point from 64 to 66 °C. The PCL used for disentangling had a low Mw = 80,000 g/mol and was therefore sensitive to annealing. After 10 min at 100 °C, all samples became completely entangled.
A polymer that has recently received a lot of attention is PLA. It exists in the form of two enantiomers, designated L and D, which are capable of crystallization. PLA, which is a mixture of them, has a limited ability to crystallize when the content of one of the enantiomers increases. In an equilibrium entangled polymer, crystallization often occurs only during annealing. Freeze-dried poly(L-lactide) (PLLA) was examined using DSC [104]. Measurements during heating showed that PLLA prepared from 0.07 wt.% dioxane solution undergoes a two-step cold crystallization (at 78 °C and in a wide temperature range of 110–155 °C). For the reference entangled sample, only the second range was observed (see Figure 6). These findings suggest increased chain mobility for freeze-dried PLLA.
These studies were extended in the next work [105], in which the number of concentrations was increased and the DSC procedure with step scanning mode was used (heating step of 2 °C at a rate of 5 °C/min, followed by 1.5 min at a constant temperature). A surprising result was that a decrease in the cold-crystallization temperature to 78–81 °C was observed even for the polymer obtained from a 5 wt.% solution, while the critical chain overlap concentration for PLLA was estimated at 0.3 wt.%. This was explained by the increased chain mobility at the polymer/air interface resulting from the higher surface-to-volume ratio in the resulting solution samples compared to bulk PLLA.
A unique possibility of PLA crystallization is the formation of stereocomplex crystals. This opens up an interesting perspective for obtaining high-performance materials [106]. Enantiomers L and D were dissolved in a 1:1 ratio in dioxane, preparing solutions with concentrations below and above the overlapping concentration (C* = 0.2% by weight). Freeze-dried, differently disentangled mixtures were heated in DSC. It was observed that samples obtained from concentrated solution were crystalline, while more-disentangled samples were amorphous or slightly crystalline and showed cold crystallization before melting.
Composites using polymers disentangled in solutions are still rarely created and studied. One of the first tested was a composite made of partially disentangled polypropylene, containing 1% by weight dispersed Al2O3 nanopowder [107]. This composite was compared with a similar nanocomposite, but with entangled macromolecules, and with a polypropylene homopolymer, partially disentangled and fully entangled. DSC tests of the initial structures showed similar crystallinity for all materials and a 1 °C lower melting temperature for the disentangled materials (both the homopolymer and its composite).
Psarski et al. [44] obtained PE with extended chain crystals as a result of crystallization at a temperature of 235 °C under a pressure of 630 MPa. The grown crystals were 170 nm thick and the crystallinity of PE was 92%, which means a drastic reduction in entanglements in amorphous phase. The polymer was almost completely disentangled. For comparison, crystallization at lower pressure resulted in PE with chain-folded crystals with a thickness of 30 nm. The crystallinity of this second polymer was 72% and was assumed to be entangled.
Ultra high molecular weight polyethylene (UHMWPE) is practically the only polymer synthesized while preventing the entanglement of the growing macromolecule chains. The nascent polymer obtained from the reactor was compared with another fully entangled one [108,109]. Pandey et al. [108] tested thermal properties when heating with different rates. It was found that disentangled UHMWPE had lower melting temperature. For the entangled polymer this temperature increases linearly with logarithm of the heating rate, but for the disentangled polymer the dependence could be described by two lines, with the slope changing around the heating rate of 0.8 °C/min (Figure 7). Authors linked this observation to the way crystals melt. During slow heating, melting of the disentangled polymer begins from the outer surface by successive detachment of chain stems. At higher rates, the energetic requirement changes and it is possible to initiate melting in various places of crystals, including inside them. Meanwhile, in an entangled polymer, melting only occurs through clusters because macromolecular chains are common to many crystals. The second observation from Pandey’s work was that the melting point of disentangled UHMWPE increases with molecular weight. This can be explained by the lower entanglement density occurring in the amorphous region of the higher Mw samples, supporting the growth of more perfect crystals.
Xue et al. [109] focused on another issue related to the properties of UHMWPE, namely melting under isothermal conditions. This polymer studied by DSC showed two melting peaks at temperatures of 132 °C and 144 °C. When the sample temperature was maintained at 140 °C, an increase in the first peak and a decrease in the second peak with annealing time were observed. In both materials, the relative content of surviving crystals (Xs), having a higher Tm, decreased exponentially with time and reached a constant value, indicating incomplete melting (Figure 8). The authors suggested that the observed melting behavior was related to prior nonlinear crystal growth caused by the rejection of entanglements that had accumulated at the growth front. The exponential decay of Xs with time provided a characteristic melting time τ that was much higher for the disentangled UHMWPE, suggesting a dependence on the difference in entanglement density in the polymer.
Recently, there has been an increasing number of studies on polymers that have been disentangled during shearing. The melt shear process is performed either in a rheometer, on a laboratory scale, or using specially modified extruders. The effectiveness of melt shear procedures, i.e., steady-state shear (5 s−1) and ramping up shear (0–10 s−1) for disentangling iPP was examined by Liu et al. [57]. The application of shear in the rheometer resulted in increase in Me from 11,442 g/mol to 18,974 g/mol for the steady-shear treated polymer and 67,181 g/mol for the ramping up-shear treated iPP, meaning that the later approach was most effective. Studies of materials obtained from shearing using DSC in heating mode showed that Tm increased from 164.6 to 165.7 °C for the more-disentangled iPP, but the crystallinity was similar (39–41%). The lamellar thickness determined by the SAXS correlation-function approach increased with disentangling from 6.7 to 7.7 nm.
Another shearing protocol, the so-called complex shear was used to disentangle poly(L-lactide) (PLLA) [110]. This was achieved by using a self-developed polymer melt disentanglement machine, connected to the end of the extruder and providing a superposition of rotational shear and vibration shear. The pellets of PLLA extruded in this way were injection molded using a machine, in which the pressure during the packaging stage could vary periodically with time. Samples of disentangled and entangled PLLA, injected by classical or vibration molding, were examined. After applying vibration during injection, two shear layers appeared in PLLA, located between the surface and the center of the sample and thicker for the disentangled polymer. The average crystallinity of the tested polymer was 14–16% for classic injection and 28–32% for vibration injection, and in both cases the higher value represented the disentangled polymer. When the samples were melted by DSC, cold crystallization occurred (Figure 9), less intense in those samples that crystallized more during injection. The melting temperature was slightly higher for disentangled PLLA.
To summarize the observations on the crystallinity of polymers resulting from the process of disentangling macromolecules, it should be noted that the polymers were characterized by a quite significant degree of crystallinity. Most of the tested polymers were disentangled in a solution that was finally frozen in liquid nitrogen. The time for crystallization was on the order of seconds, and yet a crystalline structure was formed.
Reducing entanglements promoted an increase in the degree of crystallinity in some polymers (PET, PVDF), although for very dilute solutions crystal formation was limited by the separation of macromolecules. However, there were also groups of polymers in which the degree of crystallinity did not depend on the density of macromolecule entanglements. If cold crystallization is possible in a disentangled polymer, it generally occurs at lower temperatures or with an increase in crystallinity degree. There is no consensus on the influence of chain disentangling on the melting temperature. The increase or decrease in this temperature usually does not exceed 1–2 °C. Table 2 summarizes observations on the crystalline properties of polymers immediately after disentangling.
5. Non-Isothermal Crystallization of Disentangled and Entangled Polymers
5.1. General Remarks
Usually polymers are processed by melting. Experiments have shown that short-term melting does not significantly disturb the disentangling state (this is discussed in Section 7), because re-entangling takes time, much longer for a lower temperature of melt. When a polymer is semi-crystalline, it crystallizes in the final processing step, and the state of entanglement in the polymer can affect crystallization and therefore the properties of the final polymer product.
As discussed in Section 3, entanglement of macromolecular chains influences at least two aspects of crystallization: nucleation and transport of macromolecules to the crystal surface. The macromolecule diffuses in the melt to the crystallization site through the environment formed by other macromolecules, and the rate of diffusion is controlled by obstacles in the chain path, including entanglements [111]. In a crystal structure, the fragments of macromolecules are ordered and there are no entanglements inside the crystal, which means that the fragment of the chain adjacent to the crystal surface must be disentangled. It is not yet clear whether this means local disentanglement in the melt near the crystal surface or simply pushing the entanglements some distance away from the surface [112,113,114]. In the case of a rapidly crystallizing high-molecular-weight polymer, the second option is probably preferred [115,116]
Another question that is being answered in studies on the crystallization of disentangled polymers is whether the thickness of the growing crystal depends on the distance between the entanglements, i.e., on the length of the disentangled fragment of the chain capable of crystallization.
It is known that crystallization can be accelerated by shearing the polymer melt, which is known as flow-induced crystallization [117]. This is explained by the fact that the orientation and stretching of macromolecules during shear causes some disentangling of the chains [118]. However, only recently have attempts been made to integrate knowledge of shear-induced crystallization and polymer shear disentanglement.
There are phenomena in the crystallization of partially disentangling polymers that are only easily visible during non-isothermal crystallization, others are observed during the isothermal process, and there is a group of phenomena visible in both conditions. For this reason, observations from non-isothermal and isothermal experiments are discussed separately below.
5.2. Crystallization Kinetics, Crystallization Temperature, and the Degree of Crystallinity
We will start reviewing the experimental results with those in which the polymer was disentangled in solution, quickly frozen, and the solvent removed. Using DSC, the crystallization of disentangled and entangled iPP was studied during cooling of the melt at three rates: 10, 30, 50 °C/min [119]. The disentangled samples had a 2–5 °C higher crystallization temperature (peak maximum), which additionally depended—as could be expected—on the cooling rate. The crystallinity of the disentangled samples was 3–6% higher than that of the entangled ones. The crystallization temperature and crystallinity decreased with increasing cooling rate. SAXS measurement confirmed that thicker lamellae had grown in the disentangled samples.
These observations were extended to more different degrees of disentanglement and to a second polypropylene with a higher Mw (400 kg/mol instead of 250 kg/mol) [120]. It was observed that at the same concentration in solution, the higher-molecular-weight iPP was slightly less disentangled. DSC studies have been extended here to include observations of structure formation using PLM. It was found that the filling of the space visible in the PLM occurs earlier (i.e., in a shorter time) in the case of disentangled polymers and those with a lower molecular weight. The analysis of iPPs obtained from variously concentrated solutions showed that this polymer derived from 10 wt.% solution, as expected, has properties similar to those of an undissolved, fully entangled polypropylene (Figure 10).
The non-isothermal crystallization of PEO was studied by Krajenta et. al. [67]. Crystallization started first in the least-entangled polymer, with the maximum thermal effect at 44.8 °C, while for the entangled PEO it was 41.0 °C. Analysis of the increase in crystallinity over time showed that the process was completed after 1.2 min in all samples, but the final crystallinity was higher for PEO obtained from the most dilute solution (Figure 11).
The crystallization kinetics of PLA obtained by freeze-extraction from a broad range of concentration in solution was studied by Hong et al. [121] and Wang et al. [122]. Preliminary WAXS studies of Hong’s specimens [121] showed partial crystallinity in all samples. When cooling the molten samples with different rates, the occurrence of crystallization was confirmed, with an increase in its temperature for the concentration of the solution used below 0.5 wt.%. The obtained crystallinity increased slightly for the less-entangled PLA.
In the slow (3 °C/min), non-isothermal crystallization performed by Wang et. al. [122], the temperature position of the crystallization peak was almost constant (i.e., 95.3–96.3 °C) when the polymer was obtained from concentrated solutions, while when the concentration was below C* = 11 g/L the crystallization temperature increased up to 101.3 °C. The temperatures measured in the experiment by Wang et al. [122] were much lower than those reported by Hong et al. [121]. This may indicate differences in the ability of the PLA used to crystallize.
PLLA and PDLA with different entanglement reduction, capable of forming stereocomplex crystals, were examined by Sun et al. [106]. It was observed that disentanglement promoted crystallization (visible as a higher Tc) and a higher degree of crystallinity was obtained (Figure 12). The melting experiment after crystallization further showed that stereocomplex crystals (with higher Tm) grew in the material from the most dilute solution, while as the concentration in the solvent increased during preparation, more PLLA and PDLA homocrystals were formed instead of stereocomplex crystals. The enhanced stereocomplex crystallization of less-entangled samples is probably the result of the strong dependence of this type of crystallization on the chain diffusion capacity, which is greater in more-disentangled material.
The crystallization of PLA was also investigated when examining the properties of PLA composites with 0.1 and 1.0 wt.% of multi-walled carbon nanotubes [123]. The experiments showed that disentangled and entangled homopolymers and the entangled PLA composite crystallized poorly (only 1–6%) on cooling. The situation was opposite in the case of composites made of disentangled PLA, where the crystallinity was 23–28% and the crystallization process started at a temperature 5–10 °C higher, with a maximum temperature peak at 99–101 °C. The low-crystalline samples additionally crystallized upon heating, but in the case of disentangled composites, as might be expected, the cold crystallization was most limited. The total crystallinity, resulting from cooling and heating before melting, was between 38 and 46%, decreasing slightly with higher nanotube content, but the effect of disentanglement was not visible.
Elucidating the role of chain entanglement in the polymorphic crystallization of polybutene-1 (PB) and the possible crystal phase transition was the aim of the research by Ni et al. [124]. Molten PB crystallizes in the metastable form II, which spontaneously transforms into the thermodynamically stable form I at room temperature. The non-isothermal tests carried out showed an unexpected drop in the crystallization temperature from 85 °C for bulk PB to 68 °C for the most-disentangled polymer. A similar trend was observed for melting after crystallization, when the crystals in the disentangled samples melted first (Tm = 104 to 118 °C). Crystallization was found to occur in form II, and crystallinity ranged from 68% for the bulk polymer to 53% for the most-disentangled PB. This means that chain disentanglement inhibited the crystallization kinetics, probably due to steric effects resulting from the structure of the PB macromolecule.
The properties of PPS disentangled in various ways: through polymerization or in two solution freezing processes were studied by Hu et al. [101]. The polymerized PPS crystallized at a higher temperature than the solution-disentangled samples (which also had two Tc, see Figure 13), and especially higher than the entangled polymer. Observations of the development of the spherulite structure using the PLM method showed that nucleation occurred the earliest in PPS from polymerization, then in two other disentangled samples, and finally, spherulites began to grow in a completely entangled sample.
The non-isothermal crystallization of polymers in which the disentangled state was obtained by melt shear has been the topic of several publications. For example, Hu et al. [125] examined PLA samples previously disentangled by applying different shearing procedures. The molten samples were cooled at a slow rate of 3 °C/min. The temperature of the maximum crystallization effect shifted upwards by 1.5 °C between the entangled and most-disentangled PLA, and crystallization as a whole was faster for the disentangled PLA (see Figure 14). The final degree of crystallinity achieved in Hu’s samples was the highest (25% vs. 15%) when the sample was disentangled more effectively.
Two iPPs disentangled by steady shear or ramp shear were melted, and their non-isothermal crystallization was measured by DSC [57]. The crystallization temperature increased from 107.7 to 109.4 to 110.1 °C and the crystallinity increased from 40 to 41 to 42% when the entangled polymer was compared to two less-entangled ones. Melting these samples after crystallization showed an increase in Tm from 162.1 through 164.0 to 164.7 °C, which was the highest for the least-entangled iPP. The authors commented on the results, noting that large differences in the level of entanglement cause only a small change in temperatures.
PCL and its blends containing 20% poly(styrene-co-acrylonitrile) were disentangled using strong melt shear [126]. For comparison, similar samples were disentangled using the “self-nucleation” method, meaning that the disentangling occurred by melting the crystals and keeping the melt just above the melting temperature. After disentangling, weak shear was applied to the materials at different rates. Raman spectroscopy monitored the progress of non-isothermal crystallization (see Figure 15). The application of weak shear led to disordering and re-entanglement of the melt, which was visible as deceleration of the crystallization, as measured by half-time. However, when the weak shear rate was higher, additional disentanglement was achieved and crystallization occurred more quickly.
Non-isothermal crystallization of UHMWPE was the subject of research by Fan et al. [127]. The polymer obtained as a result of the synthesis, with Mη = 4 × 10⁶ g/mol, was disentangled in solutions of various concentrations. It was observed that the crystallization temperature slightly decreased with a decrease in the solution concentration, from 117.3 °C for a concentration of 1 × 10⁻³ g/mol to 115.7 °C for a concentration of 1 × 10⁻⁵ g/mol. C* for this polymer was estimated at 3.4 × 10⁻³ g/mol, while cs was estimated at 4.8 × 10⁻⁴ g/mol. This unexpected temperature result was explained by the presence of small crystals from the freezing process, especially more in the less-entangled UHMWPE, where the long single chains probably form more than one crystal. Smaller crystals melt earlier (i.e., at lower melting temperatures) and—according to the authors—should crystallize later, i.e., at a lower temperature, during a non-isothermal process. It appears that this may not be the only cause of the observed behavior and requires further confirmation with experimental facts.
The properties of composites in which the entanglement density has been reduced are rarely studied. Composites of entangled and disentangled iPP containing 1wt.% Al2O3 were investigated and compared with the entangled and disentangled homopolymer [107]. The crystallization temperature under non-isothermal conditions was higher in the case of disentangled iPP, but the presence of the filler slightly lowered it, which indicated that the nanoparticles were an obstacle to crystallization. Full analysis of the melt-to-solid conversion curves confirmed that the disentangled iPP crystallized first, then its composite, then the entangled PP, and finally its composite (see Figure 16a). There were no influence of disentangling or filling on the crystallinity degree of iPP. Increasing the cooling rate resulted in the known effect of lowering the crystallization temperature. At the highest cooling rate (50 °C/min) two effects were visible: (a) still disentangled PP crystallized before entangled one, but (b) crystallization occurs at a higher temperature in the composite than in the corresponding homopolymer (Figure 16b). The latter can be explained by the short time available for solidification when intense nucleation, including on fillers, dominates over the crystallization transport factor enhanced by disentanglement.
Most of the above-described experiments on non-isothermal crystallization showed that it proceeds similarly in different polymers. Characteristic features include an increase in the crystallization temperature and an increase in the degree of crystallinity with disentangling. These effects resulted from the easier transport of macromolecules to the crystallization sites. In the case of PP, the increase in lamella thickness was measured when grown from disentangled melt. The nucleation of spherulites was noticed at higher temperatures in the less-entangled PPS. Preferential crystal growth in the form of stereocomplexes was observed where it could occur, i.e., in a mixture of disentangled PLA enantiomers. The exceptions to these observations were PB, in which both Tc and the degree of crystallinity decreased with disentangling, and UHMPE, in which the crystallization temperature of the disentangled polymer was lower. In the case of PB, this is explained by its specific structure.
6. Isothermal Crystallization of Partially Disentangled Polymers
6.1. Formation of Crystal Structure over Time
When analyzing the properties of non-fully entangled polymers, observations often focus on the progress of crystallization over time while maintaining a constant temperature. Variously disentangled syndiotactic polypropylene was crystallized at three selected temperatures by [128]. The rate of crystallization was similar for the disentangled samples but higher than for the entangled sample. The crystal structure was examined by FTIR and WAXS. It turned out that the crystals in the disentangled samples had a trans-planar conformation (zigzag packing) mixed with a helical chain conformation, while the crystals of the entangled sample had a helical conformation. The change in conformation to a more stable one may be the reason for the relationship presented in Figure 17.
Polypropylene with a different tacticity, i.e., isotactic, was studied by Pawlak et al. [119]. The transformation of melt into crystals was much faster in the two disentangled samples than in the entangled one. The half-conversion times for crystallization at 135 °C were 26 min for PP with Me = 14,560 g/mol, 31 min for PP with Me = 18,010 g/mol, and 43 min for entangled PP with Me = 9900 g/mol. Similarly to Sun’s research [128], this time was not the shortest for the most-disentangled polymer, which, however, cannot be attributed to conformational changes.
The crystallization of iPP at low temperatures (119–127 °C) was also investigated. Also, at these temperatures, the half-time of transformation of the melt into the solid phase was shorter for the disentangled polymer [129].
In Pawlak’s and Xiao’s research [119,129], the iPP used was disentangled in solution. However, polypropylene was also disentangled by a large amplitude oscillatory shear (LAOS) using the Ares rheometer [130]. The growth rate of spherulites at 135 °C was examined using PLM. Much more intensive spherulitic nucleation occurred in the disentangled sample compared to the entangled sample (Figure 18).
Liu et al. [57] used various melt shear procedures to disentangle iPP. Faster crystallization of less-entangled samples was visible when performed at 125 °C. The half-time of the melt-to-crystalline phase transformation increased with entanglement from 0.91 to 1.98 min. The Avrami coefficients were determined as follows: n = 2.85–2.52 (without regularity), log k = −1.07, −0.54, −0.04, respectively for increasingly entangled PP. The obtained crystallinities were similar, about 46%, but the melting temperature increased with disentangling from 164.4 through 165.6 to 166.3 °C, which means the existence of thicker crystals in the disentangled samples.
Variously entangled PLA samples were isothermally crystallized at 110 °C by Wang et al. [122]. Crystallization was fast and depended on the previous concentration in the solution. Its half-life was only 2.33 min for PLA from the most dilute solution, increased to 5.79 min when the polymer was from a solution at concentration C* and was constant for more concentrated solutions. Surprisingly, the time for the concentrated solution was much shorter than the half-time for PLA pellets (45.5 min). The Avrami n parameter was 2.43–2.81, independent of disentanglement, while the k coefficient decreased with entanglement from 69.4 to 7.1. The same parameters for PLA pellets were n = 2.64 and k = 0.29. The growing lamellae had both the disordered α’ form and the ordered α form, with a preference for growing α crystals in the less-entangled PLA. Total crystallinity decreased slightly with entanglement from 40% to 34%. The lamellas were thicker in the case of -entangled PLA, but the effect was not very strong (7.3 vs. 6.4 nm).
The crystallization of PLA in shear-disentangled samples was also investigated [125]. The full crystallization time at Tc = 110 °C shortened from 14 min to 10 min for the most-disentangled sample, so the differences were much smaller than in Wang’s research [122]. This may be due to the different polymer used and may also be the result of less disentangling. The Avrami parameters for this PLA were as follows: n was almost constant (2.68–2.73), k increased with disentangling from 3.63 × 10⁻³ to 9.55 × 10⁻³.
The growth of stereocomplex crystals from PLLA/PDLA blends was examined by DSC. Crystallization at 180 °C and 120 °C was much faster in the less-entangled polymers. WAXS studies have shown that during crystallization at 180 °C only crystals of stereocomplexes grow (this temperature is higher than the Tm of the homopolymer), while during crystallization at 120 °C at a concentration greater than 0.1% by weight homocrystal growth dominates [106].
Isothermal crystallization at temperatures of 120 °C and 125 °C of disentangled and entangled PLA homopolymers and their composites containing 0.1 and 1.0 wt.% multi-walled carbon nanotubes was investigated by Barangizi et al. [123]. Delayed crystallization was observed in the disentangled PLA, possibly due to the removal of part of the nucleus during solution preparation. The slightly higher growth rate in disentangled PLA did not compensate for the weaker nucleation. In all composites, crystallization was faster than in homopolymers, and the crystallization time was shortened with the increase in filler content, which indicates increased nucleation on nanotubes. Additionally, this time was shortened by faster crystal growth, which was visible as a significant difference between the disentangled and entangled composite with the same filler content.
Bu et al. [32] examined variously disentangled iPS, crystallizing it in a wide range of temperatures, and found that the crystallization half-time is much shorter for the disentangled samples both in the case of low and high undercooling, i.e., in the crystallization temperature range of 120–220 °C (Figure 19).
Variously disentangled samples of polybutene-1 form II were subjected to isothermal crystallization at 90 °C [124]. The crystallization half-time was observed to increase dramatically (see Figure 20) when the polymer was prepared from a solution more dilute than 0.5 wt.%, which agrees with the non-isothermal observations that disentanglement hinders PB crystallization. Both the nucleation density and growth rate decreased with disentangling. The observed crystallization tendencies, opposite to those in other polymers, may result from the chemical structure of PB. Side ethyl groups are characterized by high mobility, improved by disentangling, which may hinder the close proximity of other chains and thus hinder crystallization. Another conclusion that resulted from additional solid-state annealing was that disentanglement aids the transformation of form II into the stable form I, possibly by reducing the nucleation barrier and increasing chain mobility.
The conversion of melt into PEO crystals was also studied [67]. When PEO thin films were crystallized at 56 °C, the half-time decreased from 20 min for the completely entangled sample to just 3 min for the most-disentangled sample. The same tendency, but with much longer times (110 to 50 min), was observed for volume (bulk) samples examined by DSC. The disentangled samples formed thicker (12.3 vs. 11.1 nm, SAXS method) and more perfect crystals (larger block length, determined by WAXS method).
Disentangling low-molecular PE by high-pressure crystallization was performed by Psarski et al. [44]. DSC was used to study the kinetics of crystallization at 123 °C after melting at 160 °C. A shorter crystallization time was observed compared to the entangled sample.
The crystallization kinetics of PP/Al2O3 composites containing 1 wt.% of nanopowder, both partially disentangled and fully entangled, were compared with the kinetics of PP homopolymers [107]. Crystallization at 137 °C was the fastest for the disentangled composite and the slowest for the fully entangled homopolymer. This means that the nucleation activity effect of Al2O3 dominates over the nanoparticle obstacles in transporting the chains into the growing crystal. The description of the process using the Avrami approach gave the following coefficient values: n =2.95–3.05 for all materials, k equal to 1.6–1.8 × 10⁻¹⁰ for homopolymers, but 3.0 × 10⁻¹⁰ for the disentangled composite and 2.0 × 10⁻¹⁰ for the entangled composite. Nucleation density calculations, according to Equation (9), gave the following nucleation densities: 1.8 × 10¹¹ m−3 for the disentangled homopolymer, 5.1 × 10¹¹ m−3 for the disentangled composite, 7.2 × 10¹¹ m−3 for the entangled homopolymer, and 10.6 × 10¹¹ m−3 for the entangled composite. The slightly higher nucleation density in the more-entangled homopolymer was probably due to the incomplete destruction of pre-existing nuclei, which is more likely in the entangled melt. A positive nucleation effect of nanopowders was observed in both composites, although it was not very strong.
6.2. Spherulite Growth Measurements
In many isothermal crystallization studies, an important element was determining the growth rate of spherulites, the most typical structures formed in polymers. An example is the work of Wang et al. [30], who prepared disentangled PP by mixing 5 wt.% with hot oil at 180 °C and then gradually cooling, allowing the complete crystallization of iPP and stabilization of the obtained disentanglement. The growth of spherulites was observed using the PLM method at a temperature of 135 °C (Figure 21). Spherulitic nucleation was much more intense in the disentangled sample, and the growth rate was also faster after disentanglement.
The research material of Pawlak et al. involved PP dissolved in hot oil and in the second variant in hot xylene, in both cases with the stabilization of disentanglement by crystallization [119]. It was found that in the temperature range of 127–140 °C, spherulites grew faster in less-entangled PP. This was most visible at moderate undercooling (131–137 °C). At low temperatures, crystallization was rapid and the increased chain mobility after disentangling had a limited effect on the growing structure, while at high temperatures crystallization was slow and the obstacles to the movement of macromolecules caused by entanglements were less significant. A higher growth rate of spherulites from the disentangled melt was also confirmed when disentangling was achieved by the LAOS method [130].
Faster growth of spherulites from a more disentangled polymer was also observed for a number of other polymers. We can mention PLA tested by Krajenta et al. [131] and Liu et al. [31], PLLA/PDLA blend [106], PE [44], or PEO [67]. The exception was PB, where spherulite growth slowed down in the more-disentangled polymer. The proposed explanation was that the highly mobile side groups of the PB chain hinder the approach to neighboring chains, which is necessary for crystallization [124]. Observation of spherulite growth in differently entangled PP/Al2O3 composites and PP homopolymers confirmed that it was faster in the case of disentangled PP [107]. The presence of filler reduced this growth rate. The authors wondered whether nanoparticles are encapsulated during spherulite growth or whether they accumulate in the melt ahead of the growth front. Precise measurements of the increase in the diameter of the spherulite over time showed a linear change, thus excluding the effect of filler or impurity accumulation.
Slightly less consistent than observations of spherulite growth rates are observations of spherulite nucleation density. For solution-disentangled PLA samples, it was observed that spherulite nucleation decreased with the degree of disentanglement [131]. A different result was obtained by Liu et al. [31]. The number of primary nuclei in the freeze-extracted PLLA samples increased with the reduction in precursor solution concentration. Also, in the case of the PLLA/PDLA blend, an increase in the spherulitic nucleation density with disentanglement was observed (Figure 22) [106]. When the tested polymer was PEO, the following nucleation density values were obtained: 1.47 × 10¹¹ m−3 for fully entangled PEO, 1.03 × 10¹² m−3 for less-entangled PEO, and 3.05 × 10¹² m−3 for the most-disentangled polymer [67]. Disentangled PB was characterized not only by slower spherulite growth but also by suppressed spherulite nucleation in the more-disentangled polymer [124]. When Psarski et al. [44] compared high-pressure disentangled PE with entangled PE, they noticed that there were twice as many nuclei of spherulites in entangled PE. The result was explained by the deactivation of some of the heterogeneous nuclei in the high-pressure crystallization process.
The issue of nucleation was the subject of research by Yamazaki et al. [132]. They used PE samples and checked whether the nucleation frequency, I, is controlled by the entanglement density in the melt ν. The entanglement density was changed by melting crystals of different thickness, assuming that ν immediately after melting is related to the crystal thickness. An experimental formula was proposed: I(ν)~exp(−γν), where γ is a constant. It was found that the I−ν relationship is controlled by topological diffusion near the melt–nucleus interface and diffusion in the nucleus, and not by the process of formation of a nucleus of a critical size.
6.3. Regimes of Crystallization
As mentioned in Section 3, the secondary nucleation density and the way in which a fragment of a macromolecule is incorporated into a growing crystal depend on the temperature, which allows for the separation of crystallization regimes. Changing the degree of entanglement of macromolecules in the melt affects the rate of chain diffusion to the crystal growth surface, but could also be expected to influence the mode of incorporation, thus changing the temperature ranges of the regimes. Such research has been carried out for the first time for iPP [119]. The subject of the studies were the temperature positions of crystallization regimes, examined on the example of the transition between regime II and III. A temperature shift was observed from 136 °C for the entangled iPP to 132 °C for the polymer with the most limited entanglements (Figure 23a). This means that in a disentangled sample at a lower temperature, more perfect lamella growth is still preferred (according to regime II); while in the entangled polymer, crystallization already takes place according to regime III.
A change in the boundary temperatures of the crystallization regimes after disentangling was also found for PLA [131]. For the fully entangled polymer, the transition temperatures were as follows: regime I–II 153.0 °C, regime II–III 119.3 °C. When PLA had six times less entanglement, the temperatures were 151.0 °C and 118.3 °C. Crystallization regimes for differently entangled PEOs were also analyzed [67]. In the case of the transition from regime I to regime II, the limiting temperature was shifted down by 1.3 °C when the polymer was more disentangled (Figure 23b).
Changes in crystallization regimes were also studied by comparing fully entangled PET with another PET prepared from a trifluoroacetic acid solution, called reorganized PET (RPET) [133]. The focus was on the transition between crystallization regimes I and II. In the case of RPET, the temperature was 7 °C lower than in the entangled polymer.
An interesting question was whether, if an disentangled polymer was used to produce a composite, the transitions between regimes would behave in the composite similarly to the behavior in the homopolymer. This was tested on the example of a PP/Al2O3 nanocomposite [107]. It was found that the presence of nanoparticles almost completely reduces the transition temperature shift between regime II and III that exists as a result of disentangling.
6.4. Other Aspects of Isothermal Crystallization
Some crystallization issues were studied only using one polymer, by one team. For example, Wang et al. [134] discovered the translational and rotational motion of PP spherulites during their crystallization from a melt with a reduced number of entanglements. No such effect was observed for the entangled melt. The strange aspect was not only the movement of spherulites, even those with sizes larger than the thickness of the sample, but the fact that it only affected some of them. The rate of spherulite movement decreased with the observation time (from 40 to 1.5 µm/min), which can be attributed to re-entanglement. The authors did not provide any explanation for the movement of some spherulites.
The final phase of spherulite growth in iPP was analyzed by Pawlak et al. [119]. The course of crystallization was observed when some volumes of the melt were occluded by growing spherulites. Figure 24 shows the final stage of creating the spherulite structure. Nowacki et al. [135] found that cavitation in entangled iPP does not occur during crystallization at temperature above 137 °C. Repeated measurements of the entangled iPP samples showed that no voids were formed from the temperature of 138 °C. Similar temperature limits were found for medium entanglement (137 °C) and low entanglement (139 °C) PP, which does not confirm Nowacki’s assumption that the temperature limit can be lowered by reduced entanglement.
The growth of spherulites under negative pressure is equivalent to the growth at reduced undercooling. As a result, spherulite fragments growing around the weak point have a higher melting point. After releasing the negative pressure and heating the sample, it is observed that the center of the spherulite melts earlier (i.e., at a lower temperature) with increasing temperature than the outer layer. When observed using the PLM method, white rings are visible, which are still unmelted parts of the spherulites. It was found for iPP [119] that the difference in melting temperatures was larger (0.60 °C vs. 0.90 °C) for disentangled PP, probably as a result of a greater increase in negative pressure during crystallization due to the faster growth of spherulites.
The equilibrium melting temperature is an important parameter used to characterize the crystal structure of a polymer. Until recently, there was a little information on whether it changes when the polymer has limited macromolecular entanglements. Such observations were made for PEO [67]. The equilibrium melting temperature was determined using the Hoffman–Weeks method by crystallizing the samples at a selected temperature Tc and then observing through a microscope at which temperature Tm the melting occurred. The relationship between Tc and Tm is described by a straight line. Its intersection with the Tc = Tm line determined the desired equilibrium melting temperature. The determined temperature decreased only slightly as PEO was disentangled, from 70.5 °C to 70.1 °C (Figure 25).
A much larger difference in the equilibrium melting point was observed when completely entangled PET was compared to another PET prepared from a trifluoroacetic acid solution, called reorganized PET (RPET) [133]. Using Hoffman–Weeks extrapolation, the calculated equilibrium melting point was found to be several degrees higher for RPET.
The crystallographic form of growing crystals may depend on disentanglement [136,137]. This was shown on the example of PEO crystallization at a temperature of 45 °C, but with two methods of reaching the crystallization temperature: classically from the melt, after its entanglement for 15 min of annealing, or by increasing the temperature in the solid state of the disentangled polymer. After crystallization from the solid state, the presence of a unique, stable triclinic form of the crystal structure was identified, while samples crystallized from the melt had a common monoclinic form [137].
6.5. Molecular Dynamics Simulations
Experimental work is increasingly supported by calculations using molecular dynamics (MD) simulations. The object of MD simulation studies with primitive path analysis performed by Luo et al. [138] was the crystallization of a coarse-grained polyvinyl alcohol system, having 1000 chains, each containing of 1000 monomers over a time scale up to about 8 μs. A relaxed system was cooled from 495 to 412 K with a cooling rate of 31.4 K/μs. The authors showed a dependence of both crystallization time and crystalline stem length on the local entanglement length.
Zou et al. [139] used atomistic molecular dynamics simulations to study the crystallization of linear and cyclic polyethylene. Isothermal nucleation simulations of samples with different entanglement topologies showed that for linear and unlinked cyclic PE oligomers, the nucleation rate of PE crystals increases slightly with decreasing entanglement density. In the absence of conventional polymer entanglement, unlinked rings can nucleate about twice as fast as their fully entangled linear counterparts. The authors also confirmed that nucleation as a local phenomenon does not require the large-scale relaxation of polymer chains.
The object of research using MD simulation and primary path analysis was the crystallization of the melt under the influence of cyclic stretching [140]. Poly(vinyl alcohol) (PVA) systems with different entanglement densities and similar local order were constructed by cyclic stretching, which made it possible to determine the involvement of entanglement in polymer nucleation and crystal growth. Nucleation was favored in less-entangled regions. The nucleation rate and crystal growth rate decreased exponentially and linearly, respectively, with increasing entanglement density. The lower entanglement density resulted in a shorter nucleation time and ultimately led to a smaller average crystal cluster size and a larger number of crystal regions.
The evolution of entanglement during isothermal crystallization of bimodal and unimodal polymers with an equivalent average Mw was analyzed using coarse-grained MD simulations [141]. At the beginning of crystal growth, the entanglement concentration decreased rapidly, but at the end of crystallization it became saturated at a level lower than the initial one. The increasing crystallinity and lamella thickness were linearly proportional to the degree of disentanglement. Compared with the unimodal system, the increase in crystallinity of the bimodal system was faster than the change in disentanglement. An explanation has been proposed that longer chains in a two-component system move slower, participating in the chain-sliding diffusion mechanism during crystal formation.
The above-mentioned works do not exhaust the possibilities offered by computer simulations. While experimental studies measure the behavior of large assemblies of macromolecules, computer calculations allow the analysis of the entanglement process at the level of individual macromolecules. This enables a better understanding of the connections between the presence of entanglements, the disentangling of macromolecules and their participation in the formation of crystals.
6.6. Cold Crystallization in Isothermal Conditions
Some polymers crystallize poorly under typical conditions. Only a few papers describe their cold crystallization in isothermal conditions, taking into account the influence of the degree of entanglement of macromolecules. A very slowly crystallizing polymer, isotactic poly(methyl methacrylate) (PMMA), was disentangled in solutions of poly(ethylene glycol)(PEG) or dioxane [29] and annealed at Tg (i.e., 60 °C). When the solvent was dioxane, crystallinity reached 35% for annealed samples from a low-concentration solution; however, it was low and did not change for solution concentrations above 5 wt.%. The opposite effect was observed for the polymer dissolved in PEG, where the crystallinity after annealing increased with the concentration in the solution and was most effective for solutions with a concentration of 10–15 wt.% (Figure 26). Similar annealing results for dilute dioxane solution and concentrated PEG solution may, according to the authors, suggest that the molecular size of the solvent plays a role, medium for PEG and small for dioxane.
Amorphous disentangled and entangled PLLA was prepared by Sasaki and used for cold isothermal crystallization studies [105]. To characterize the crystallization progress, the overall crystallization rate Gc, defined as Gc = 1/t1/2, where t1/2 is the crystallization half-time, was used. Regardless of the selected crystallization temperature, Gc values were higher for less-entangled PLLA. The authors determined the values of the constant in Equation (6) and found a decrease in the activation energy for the chain diffusion process upon disentangling from 6.4 kJ/mol for bulk PLLA to 4.0 kJ/mol for most of the disentangled granules. However, the Kg value, depending on the crystallization regime, was constant.
6.7. Conclusions about Isothermal Crystallization
The observations of crystallization under isothermal conditions are mostly consistent with studies under non-isothermal conditions. The overall crystallization process is faster for less-entangled polymer, which is mostly confirmed by the half-time measurements. The research showed that the thicker crystals grew from the less-entangled melt. In the case of PLLA and PLLA/PDLA, a preference for growth in the specific crystal form depending on the level of entanglement was observed. The exception to the rule was crystallization of PB, in which the formation of the crystal structure was delayed by disentanglement, which was due to reduced nucleation and slower crystal growth.
In addition to a general analysis of the course of crystallization as a function of time, a number of more detailed studies were also carried out. An example is the measurement of the crystallization rate based on the growth of spherulites. In almost all cases, crystals and spherulites grew faster in the case of a lower density of macromolecular entanglements, which can be explained by the easier diffusion of macromolecular chains to the crystallization sites. However, the results of measurements of the spherulitic nucleation density as a function of the degree of chain disentanglement are varied. In most studies, an intensification of nucleation was observed. It may be suspected that the results obtained depend on the preparation of the samples, their possible contamination, or the removal of nucleus. The issue requires further research. The easier diffusion of less-entangled chains favored a more perfect structure of the growing crystals, which resulted in the observed shift in temperatures of the crystallization regimes.
7. Re-Entangling of Polymer Chains
Since polymer crystallization from a melt is sensitive to the concentration of macromolecule entanglements, attempts were made to use the observations of the crystallization process to characterize the process of re-entanglement of polymer chains [30,44,134]. Experiments focused on the isothermal nucleation and growth of spherulites, studied using a hot stage connected to a PLM, or on the analysis of non-isothermal crystallization or melting using DSC. Often in crystallization studies, changing the concentration of entanglements was achieved by controlling the annealing time of the polymer in the melt.
Yamazaki et al. [142] investigated the synthesized PE, assuming that the nascent reaction powder contained no entanglements and that, after melting, the progression of entanglement over time could be observed. Measurements showed that spherulite nucleation was reduced for the longer-annealed and more-entangled melt. According to the authors, the entanglement recovery process consisted of two stages: in the first (lasting 20 min), simple loops were created, and in the second, more complex loops were created, making nucleation less difficult (Figure 27).
The change in the nucleation density of spherulites with polymer entanglement was also studied on the example of iPP crystallization [120]. It was found that this density was initially lower in less-entangled samples and decreased with the annealing time at 185 °C. For PP with a higher Mw, a plateau was reached after 120 min, while for PP with a lower Mw, a decrease in nucleation was still observed after this time. With the longest annealing time, even more nuclei were formed in the initially more-entangled polymer. Separate studies of nucleation progress with annealing for fully entangled polymers have shown that some reduction in nucleation density is also observed. This means that the effect of re-entanglement on nucleation cannot be separated from the deactivation of some nuclei during annealing.
The conclusions from the above observations also concerned nucleation changes in other polymers. This applies to measurements of spherulitic nucleation in variously entangled PLA [131] or PEO [67].
The second “tool” showing the progress of re-entanglement is the measurement of the spherulite growth rate. A decrease in the growth rate of spherulites in disentangled, isothermally crystallized HDPE was observed after a long, 25 min, isothermal crystallization at a temperature of 126 °C [44]. The result was interpreted as confirmation of an increase in the density of entanglements over time.
Wang et al. [30] correlated the rheological results with measurements of the growth rate of spherulites and thus analyzed the re-entanglement progress in the disentangled PP resulting from annealing at 180 °C for selected times. A decrease in growth rate was observed over time, reaching a plateau after 20–25 min, but at a level higher than the constant growth rate for fully entangled PP (Figure 28a). These observations were consistent with rheological studies of the change in storage modulus over time, showing that growth rate measurements can be used to indicate the occurrence of re-entanglement.
iPP disentangled by another method, through the shear in melt, was used for re-entanglement tests after its annealing at 180 °C. The growth rate of spherulites was measured at a temperature of 135 °C [130]. The time of full entanglement was about 1000 s and the rate of entangled PP was reached (Figure 28b), unlike the longer time and higher final rate in the studies described above [30]. The reason may be the lower initial degree of disentangling in iPP obtained by melt shear.
For the re-entanglement experiment, Pawlak et al. [119] used iPP obtained from two solutions with different concentrations. The samples were annealed at 185 °C and a decrease in the spherulite growth rate was observed with the annealing time. After 50 min, the rates were similar to those measured for the fully entangled polymer. This experiment again confirms that the entanglement time depends very much on the degree of disentanglement.
In a continuation of these studies, disentangled iPP with two different molecular weights was examined [120]. The samples were annealed at 185 °C or 200 °C, and the spherulite growth rate was measured after the selected annealing time. The growth rate, initially significantly higher, gradually approached a constant value for entangled PP during the experiment. The time for complete re-entanglement was longer for lower initial entanglement, higher Mw, and lower annealing temperature. Depending on conditions, complete re-entanglement required 50–150 min. The authors also checked that after 30 min of melt annealing, the transition temperature of regime II–III returned to that characteristic of an entangled polymer. The reason for the shorter time in this case is not entirely clear.
When disentangled PLLA with a molecular weight of 210 kg/mol was annealed for various times at 190 °C, the rate of spherulitic growth at 135 °C was found to decrease with annealing time as re-entanglement progressed and reached a constant value after 15 min [31].
In one case, the melting temperature was chosen as an indicator of the progress of macromolecule entanglement. Bu et al. [32], analyzing disentangled iPS, observed that during annealing at 100 °C, i.e., at the cold-crystallization temperature, for 1, 5, and 10 h, the melting temperature shifted with the annealing time towards the Tm of the completely entangled polymer, which indicated re-entanglement.
The nascent UHMWPE was non-isothermally crystallized after melting at 160 °C for various times (5–240 min) or at various temperatures (160–220 °C) for 5 min [127]. The crystallization temperature was measured. It decreased with increasing annealing time or annealing temperature. However, after 100 min of heating at 160 °C, no further changes in Tc were observed. The annealing dependence of Tc was interpreted as entanglement with time and a change in local conformation from parallel extended chains initially existing after crystal melting to interpenetrating random coils. This was confirmed by the lack of effect in the case of entangled HDPE tested under the same conditions.
Studies of the polymer entanglement process have shown that measuring the growth rate of spherulites can be used to assess the degree of disentanglement of macromolecules in the polymer.
8. Concluding Remarks
The classic description of polymer crystallization emphasizes the important role of the ease of diffusion of macromolecule chain through the melt to the crystallization site. Because there are other macromolecules in the path, entangled with them, it is believed that the entanglements of macromolecules influence the crystallization process. This was fully confirmed when it became possible to conduct research using polymers in which the entanglement of macromolecular chains was significantly reduced, even several times. Table 3 presents a summary of studies on polymer crystallization, with an indication of the literature references, taking into account the type of polymer and the type of experiments performed.
The role of entanglements was already visible in the process of disentangling macromolecules, when in the final phase the disentangled polymer is transformed into the solid state. It turned out that these polymers, which under standard conditions usually crystallize poorly or not at all, can achieve a significant degree of crystallinity after disentangling. Often, the disentangling of polymers was performed in a solution with rapid freezing. It is somewhat surprising that during sudden changes in temperature, in a short time, the tested solidified polymers showed a significant degree of crystallinity, similar to that obtained during slower crystallization.
The main research on the influence of entanglement density on the course of crystallization included experiments in isothermal and non-isothermal conditions, conducted using DSC or a heat stage connected to PLM. The most important trends in property changes due to the disentangling of macromolecules are presented in Table 4. As can be seen from Table 4, the process of transformation of the melt into the crystalline phase proceeds faster after the disentangling of the macromolecules. The crystallization temperature is generally higher in the disentangled polymer, while the results for the melting temperature show discrepancies. Typically, disentangling promotes an increase in the degree of crystallinity. Crystal growth, determined based on the growth of spherulites, was faster in polymers with reduced entanglement and the crystal thickness increased. The supporting conditions for crystal growth resulted in the possibility of crystallization at lower temperatures than usual in a regime that provided a better regularity of crystal structure, e.g., in regime II; while in the entangled polymer, crystallization already took place in regime III. There is no consensus on the influence of disentanglement on the nucleation of spherulitic crystallization; however, this may result from the preparative procedures used, during which some of the nuclei could be removed from the polymer or deactivated. Finally, the cold crystallization is facilitated by the disentangling of macromolecules.
Early research on disentangled polymers focused on expanding the knowledge on polymers. Currently, it is possible to disentangle polymers on an industrial scale, either by polymerization or in extrusion processing. Since new materials made of disentangled polymers have interesting mechanical properties, they may soon find practical applications for special purposes. In some applications of polymers, it is advantageous to create a crystalline structure. In such a case, it will be possible to take advantage of the fact that even polymers that are usually difficult to crystallize are able to achieve significant degrees of crystallinity after disentangling the chains, even at short processing times.
Funding
This research was funded by the Centre of Molecular and Macromolecular Studies, Polish Academy of Sciences, grant 500-03.
Data Availability Statement
No new data were created.
Conflicts of Interest
The author declare no conflicts of interest. The funders had no role in the design of the study; in the collection, analyses, or interpretation of data; in the writing of the manuscript; or in the decision to publish the results.
References
- Berry, G.C.; Fox, T.G. The viscosity of polymers and their concentrated solutions. Adv. Polym. Sci. 1968, 5, 261–357. [Google Scholar]
- Wool, R.P. Polymer entanglements. Macromolecules 1993, 26, 1564–1569. [Google Scholar] [CrossRef]
- Watanabe, H. Viscoelasticity and dynamics of entangled polymers. Prog. Polym. Sci. 1999, 24, 1253–1403. [Google Scholar] [CrossRef]
- Litvinov, V.M.; Ries, M.E.; Baughman, T.W.; Henke, A.; Matloka, P.P. Chain entanglements in polyethylene melts. Why is it studied again? Macromolecules 2013, 46, 541–547. [Google Scholar] [CrossRef]
- Bueche, F. Viscosity, self-diffusion and allied effects in solid polymers. J. Chem. Phys. 1952, 20, 1959–1964. [Google Scholar] [CrossRef]
- Treloar, L.R.G. The Physics of Rubber Elasticity, 3rd ed.; Clarendon Press: Oxford, UK, 1975; pp. 64–65. [Google Scholar]
- Ferry, J.D. Viscoelastic Properties of Polymers; John Wiley &Sons: New York, NY, USA, 1981; p. 552. [Google Scholar]
- Zulli, F.; Giordano, M.; Andreozzi, L. Onset of entanglement and reptation in melts of linear homopolymers: Consistent rheological simulations of experiments from oligomers to high polymers. Rheol. Acta 2015, 54, 185–205. [Google Scholar] [CrossRef]
- Ward, M.; Sweeney, J. Mechanical Properties of Solid Polymers; John Wiley & Sons Ltd.: Chichester, UK, 2013; p. 72. [Google Scholar]
- Fetters, L.J.; Lohse, D.J.; Richter, D.; Witten, T.A.; Zirkel, A. Connection between polymer molecular weight, density, chain dimensions, and melt viscoelastic properties. Macromolecules 1994, 27, 4639–4647. [Google Scholar] [CrossRef]
- Eckstein, A.; Suhm, J.; Friedrich, C.; Maier, R.; Sassmannshausen, J.; Bochmann, M.; Mulhaupt, R. Determination of plateau moduli and entanglement molecular weights of isotactic, syndiotactic, and atactic polypropylenes synthesized with metallocene catalysts. Macromolecules 1998, 31, 1335–1340. [Google Scholar] [CrossRef]
- Fetters, L.J.; Lohse, D.J.; Colby, R.H. Chain dimensions and entanglement spacing. In Physical Properties of Polymers Handbook, 2nd ed.; Mark, J.E., Ed.; Springer Science: New York, NY, USA, 2007; pp. 447–454. [Google Scholar]
- Pawlak, A. The Entanglements of macromolecules and Their Influence on the Properties of Polymers. Macromol. Chem. Phys. 2019, 220, 1900043. [Google Scholar] [CrossRef]
- Raju, V.R.; Menezes, E.V.; Marin, G.; Graessley, W.W.; Fetter, L.J. Concentration and molecular weight dependence of viscoelastic properties in linear and star polymers. Macromolecules 1981, 14, 1668–1676. [Google Scholar] [CrossRef]
- Wu, S. Chain structure and entanglement. J. Polym. Sci. Part B Polym. Phys. 1989, 27, 723–741. [Google Scholar] [CrossRef]
- Nobile, M.R.; Cocchini, F. Evaluation of molecular weight distribution from dynamic moduli. Rheol. Acta 2011, 40, 111–119. [Google Scholar] [CrossRef]
- Liu, C.; He, J.; van Ruymbeke, E.; Keunings, R.; Bailly, C. Evaluation of different methods for the determination of the plateau modulus and the entanglement molecular weight. Polymer 2006, 47, 4461–4479. [Google Scholar] [CrossRef]
- Rouse, P.E. A theory of the linear viscoelastic properties of dilute solutions of coiling polymers. J. Chem. Phys. 1953, 21, 1272–1280. [Google Scholar] [CrossRef]
- Doi, M. Viscoelastic and rheological properties. In Materials Science and Technology. A Comprehensive Treatment. Volume 12 Structure and Properties of Polymers; Cahn, R.W., Haasen, P., Kramer, E.J., Thomas, E.L., Thomas, E.L., Eds.; VCH Verlag: Weinheim, Germany, 1993; pp. 389–425. [Google Scholar]
- DeGennes, P.G. Reptation of polymer chain in the presence of fixed obstacles. J. Chem. Phys. 1971, 55, 572–579. [Google Scholar] [CrossRef]
- Doi, M.; Edwards, S.F. Dynamics of concentrated polymer systems. 4. Rheological properties. J. Chem. Soc. Faraday Trans. II 1979, 75, 38–54. [Google Scholar] [CrossRef]
- Doi, M.; Edwards, S.F. The Theory of Polymer Dynamics; Clarendon: Oxford, UK, 1986. [Google Scholar]
- Pawlak, A.; Krajenta, J. Progress in Studies of Disentangled Polymers and Composites. J. Compos. Sci. 2023, 7, 521. [Google Scholar] [CrossRef]
- De Gennes, P.G. Scaling Concepts in Polymer Physics; Cornell University Press: Ithaca, NY, USA, 1979. [Google Scholar]
- Cao, J.; Gu, F.M.; Liu, Y.J.; Bi, S.G.; Bu, H.S. Single-chain single crystals. Macromol. Symp. 1997, 124, 89–109. [Google Scholar] [CrossRef]
- Sun, B.; Lu, Y.; Ni, H.; Wang, C. Highly crystallizable poly(ethylene terephthalate) prepared by freeze-extracting solutions. Polymer 1998, 39, 159–163. [Google Scholar] [CrossRef]
- Huang, Q.; Mednova, O.; Rasmussen, H.K.; Alvarez, N.J.; Skov, A.L.; Almdal, K.; Hassager, O. Concentrated polymer solutions are different from melts: Role of entanglement molecular weight. Macromolecules 2013, 46, 5026–5035. [Google Scholar] [CrossRef]
- Xie, Z.P.; Liu, D.; Zhu, P.P.; Yang, H.Y. Crystallization behavior of chain-disentangled poly(ethylene terephthalate). Acta Polym. Sin. 2010, 5, 522–529. [Google Scholar] [CrossRef]
- Zhou, D.; Li, L.; Che, B.; Cao, Q.; Lu, Y.; Xue, G. Metastable isotactic poly(methyl methacrylate) prepared by freeze-extracting solutions in poly(ethylene glycol). Macromolecules 2004, 37, 4744–4747. [Google Scholar] [CrossRef]
- Wang, X.H.; Liu, R.; Wu, M.; Wang, Z.; Huang, Y. Effect of chain disentanglement on melt crystallization behaviour of isotactic polypropylene. Polymer 2009, 50, 5824–5827. [Google Scholar] [CrossRef]
- Liu, X.T.; Bao, R.Y.; Li, Y.M.; Yang, W.; Xie, B.H.; Yang, M.B. Effect of chain entanglement on the melt-crystallization behavior of poly(L-lactide) acid. J. Polym. Res. 2016, 23, 164. [Google Scholar] [CrossRef]
- Bu, H.S.; Gu, F.M.; Bao, L.; Chen, M. Influence of entanglements on crystallization of macromolecules. Macromolecules 1998, 31, 7108–7110. [Google Scholar] [CrossRef]
- Kotliar, A.M.; Kumar, R.; Back, R.A. Rheology of Polymers that are initially in the disentangled state. J. Polym. Sci. Part B Polym. Phys. 1990, 28, 1033–1045. [Google Scholar] [CrossRef]
- Sun, Q.; Zhou, D.; Wang, X.; Xue, G. Crystallization and relaxation behavior of partially disentangled poly(vinyl chloride) prepared from large molecule solvent dioctyl phthalate. Macromolecules 2002, 35, 7089–7092. [Google Scholar] [CrossRef]
- Graessley, W.W. The entanglement concept in polymer rheology. Adv. Polym. Sci. 1974, 16, 1–179. [Google Scholar]
- Heo, Y.; Larson, R.G. Universal scaling of linear and nonlinear rheological properties of semidilute and concentrated polymer solutions. Macromolecules 2008, 41, 8903–8915. [Google Scholar] [CrossRef]
- Luo, C.F.; Kroger, M.; Sommer, J.U. Entanglements and Crystallization of Concentrated Polymer Solutions: Molecular Dynamics Simulations. Macromolecules 2016, 49, 9017–9025. [Google Scholar] [CrossRef]
- Plazek, D.J.; Raghupathi, N.; O’Rourke, V.M. New evidence for molecular entanglements. J. Polym. Sci. Part B Polym. Phys. 1980, 18, 1837–1846. [Google Scholar] [CrossRef]
- Tian, N.; Liu, D.; Wei, H.; Liu, Y.; Kong, J. Crystallization of polycaprolactone with reduced entanglement. Europ. Polym. J. 2018, 102, 38–44. [Google Scholar]
- Qian, R. Intermolecular excimer interactions in polymers. In Macromolecules; Benoit, H., Rempp, R., Eds.; Pergamon Press: Oxford, UK, 1982; pp. 139–154. [Google Scholar]
- Lippits, D.R.; Rastogi, S.; Talebi, S.; Bailly, C. Formation of entanglements in initially disentangled polymer melts. Macromolecules 2006, 39, 8882–8885. [Google Scholar] [CrossRef]
- Chen, P.; Yang, H.; Chen, T.; Li, W. Weakly entangled ultrahigh molecular weight polyethylene prepared via ethylene extrusion polymerization. Ind. Eng. Chem. Res. 2015, 54, 11024–11032. [Google Scholar] [CrossRef]
- Romano, D.; Tops, N.; Bos, J.; Rastogi, S. Correlation between thermal and mechanical response of nascent semicrystalline UHMWPEs. Macromolecules 2017, 50, 2033–2042. [Google Scholar] [CrossRef]
- Psarski, M.; Piorkowska, E.; Galeski, A. Crystallization of Polyethylene from Melt with Lowered Chain Entanglements. Macromolecules 2000, 33, 916–932. [Google Scholar] [CrossRef]
- Monasse, B. Nucleation and anisotropic crystalline growth of polyethylene under shear. J. Mater. Sci. 1995, 30, 5002–5012. [Google Scholar] [CrossRef]
- Rozanski, A.; Monasse, B.; Szkudlarek, E.; Pawlak, A.; Piorkowska, E.; Galeski, A.; Haudin, J.M. Shear-induced crystallization of isotactic polypropylene based nanocomposites with montmorillonite. Eur. Polym. J. 2009, 45, 88–101. [Google Scholar] [CrossRef]
- Chen, Q.; Fan, Y.; Zheng, Q. Rheological scaling and modeling of shear-enhanced crystallization rate of polypropylene. Rheol. Acta 2006, 46, 305–316. [Google Scholar] [CrossRef]
- Jiang, S.; An, L.; Jiang, B. Crystallization Kinetics in Shearing-Induced Oriented and Stretched Poly(ethylene oxide). J. Polym. Sci. Part B Polym. Phys. 2004, 42, 656–665. [Google Scholar] [CrossRef]
- Nazari, B.; Rhoades, A.M.; Schaake, R.P.; Colby, R.H. Flow-Induced Crystallization of PEEK: Isothermal Crystallization Kinetics and Lifetime of Flow-Induced Precursors during Isothermal Annealing. ACS Macro Lett. 2016, 5, 849–853. [Google Scholar] [CrossRef] [PubMed]
- Seo, J.; Parisi, D.; Gohn, A.M.; Han, A.; Song, L.; Liu, Y.; Schaake, R.P.; Rhoades, A.M.; Colby, R.H. Flow-Induced Crystallization of Poly(ether ether ketone): Universal Aspects of Specific Work Revealed by Corroborative Rheology and X-ray Scattering Studies. Macromolecules 2020, 53, 10040–10050. [Google Scholar] [CrossRef]
- Paukszta, D.; Bednarek, W.H. In situ optical microscope studies at isotactic polypropylene crystallization induced by shear forces—A review. Polym. Test. 2018, 72, 238–243. [Google Scholar] [CrossRef]
- Nie, C.; Peng, F.; Cao, R.; Cui, K.; Sheng, J.; Chen, W.; Li, L. Recent progress in flow-induced polymer crystallization. J. Polym. Sci. 2022, 60, 3149–3175. [Google Scholar] [CrossRef]
- Sheng, J.; Chen, W.; Cui, K.; Li, L. Polymer crystallization under external flow. Rep. Prog. Phys. 2022, 85, 036601. [Google Scholar] [CrossRef] [PubMed]
- Lamberti, G. Flow induced crystallization. Chem. Soc. Rev. 2014, 43, 2240–2252. [Google Scholar] [CrossRef] [PubMed]
- Wang, Y.; Liu, M.; Chen, J.; Luo, J.; Min, J.; Fu, Q.; Zhang, J. Efficient disentanglement of polycarbonate melts under complex shear field. Polymer 2020, 201, 122610. [Google Scholar] [CrossRef]
- Wang, B.; Cavallo, D.; Chen, J. Delay of re-entanglement kinetics by shear-induced nucleation precursors in isotactic poly-propylene melt. Polymer 2020, 210, 123000. [Google Scholar] [CrossRef]
- Liu, M.; Chen, J.; Luo, J.; Min, J.; Fu, Q.; Zhang, J. Investigating the disentanglement of long chain branched polypropylene under different shear fields. J. Appl. Polym. Sci. 2022, 139, 51642. [Google Scholar] [CrossRef]
- Kamkar, M.; Salehiyan, R.; Goudoulas, T.B.; Abbasi, M.; Saengow, C.; Erfanian, E.; Sadeghi, S.; Natale, G.; Rogers, S.A.; Giacomini, A.J.; et al. Large amplitude oscillatory shear flow: Microstructural assessment of polymeric systems. Prog. Polym. Sci. 2022, 132, 101580. [Google Scholar] [CrossRef]
- Chen, K.-Y.; Zhou, N.-Q.; Liu, B.; Jin, G. Improved Mechanical Properties and Structure of Polypropylene Pipe Prepared under Vibration Force Field. J. Appl. Polym. Sci. 2009, 114, 3612–3620. [Google Scholar] [CrossRef]
- Ibar, J.P. Processing Polymer Melts under Rheo-Fluidification Flow Conditions, Part 1: Boosting Shear-Thinning by Add-ing Low Frequency Nonlinear Vibration to Induce Strain Softening. J. Macromol. Sci. B Phys. 2013, 52, 407–441. [Google Scholar] [CrossRef]
- An, F.Z.; Gao, X.Q.; Lei, J.; Deng, C.; Li, Z.M.; Shen, K.Z. Vibration assisted extrusion of polypropylene. Chin. J. Polym. Sci. 2015, 33, 688–696. [Google Scholar] [CrossRef]
- Nusser, K.; Schneider, G.J.; Pyckhout-Hintzen, W.; Richter, D. Viscosity decrease and reinforcement in polymer-silsesquioxane composites. Macromolecules 2011, 44, 7820–7830. [Google Scholar] [CrossRef]
- Chai, S.-C.; Xu, T.-Y.; Cao, X.; Wang, G.; Chen, Q.; Li, H.-L. Ultrasmall Nanoparticles Diluted Chain Entanglement in Polymer Nanocomposites. Chin. J. Polym. Sci. 2019, 37, 797–805. [Google Scholar] [CrossRef]
- Senses, E.; Ansar, S.M.; Kitchens, C.L.; Mao, Y.; Narayanan, S.; Natarajan, B.; Faraone, A. Small Particle Driven Chain Dis-entanglements in Polymer Nanocomposites. Phys. Rev. Lett. 2017, 118, 147801. [Google Scholar] [CrossRef]
- Romo-Uribe, A. Dispersion at Single Unit TiO2 Nanoparticles Reduced Tg, Induced Chain Disentanglement and Reduced Tensile Modulus in Waterborne Acrylic Coatings. Macromol. Mater. Eng. 2021, 306, 200059. [Google Scholar] [CrossRef]
- Sui, Y.; Yui, Y.; Wei, P.; Cong, C.; Meng, X.; Ye, H.-M.; Zhou, Q. Nanoscale effects of TiO2 nanoparticles on the rheological behaviors of ultra-high molecular weight polyethylene (UHMWPE). Soft Matter 2023, 19, 5459–5467. [Google Scholar] [CrossRef] [PubMed]
- Krajenta, J.; Polinska, M.; Lapienis, G.; Pawlak, A. The crystallization of poly(ethylene oxide) with limited density of macromolecular entanglements. Polymer 2020, 197, 122500. [Google Scholar] [CrossRef]
- Sperling, L.H. Introduction to Physcial Polymer Science; John Wiley & Sons, Inc.: Hoboken, NJ, USA, 2006; Chapter 6. [Google Scholar]
- Wunderlich, B. Macromolecular Physics; Academic Press: New York, NY, USA, 1973. [Google Scholar]
- Mandelkern, L. Crystallization of Polymers. Vol 2. Kinetics and Mechanisms; Cambridge University Press: Cambridge, UK, 2004. [Google Scholar]
- Phillips, P.J. Polymer crystals. Rep. Prog. Phys. 1990, 53, 549–604. [Google Scholar] [CrossRef]
- Michell, R.M.; Mugica, A.; Zubitur, M.; Muller, A.J. Self-Nucleation of Crystalline Phases within Homopolymers, Polymer Blends, Copolymers, and Nanocomposites. Adv. Polym. Sci. 2017, 276, 215–256. [Google Scholar]
- Sangroniz, L.; Cavallo, D.; Müller, A.J. Self-nucleation effects on polymer crystallization. Macromolecules 2020, 53, 4581–4604. [Google Scholar] [CrossRef]
- Hoffman, J.D.; Davis, G.T.; Lauritzen, J.I., Jr. The Rate of crystallization of linear Polymers with Chain Folding. In Treatise on Solid State Chemistry. Volume 3. Crystalline and Noncrystalline Solids; Hannay, N.B., Ed.; Plenum Press: New York, NY, USA, 1976; pp. 497–614. [Google Scholar]
- Hoffman, J.D. Role of reptation in the rate of crystallization of polyethylene fractions from the melt. Polymer 1982, 23, 656–670. [Google Scholar] [CrossRef]
- Hoffman, J.D. Regime III crystallization in melt-crystallized polymers: The variable cluster model of chain folding. Polymer 1983, 24, 3–26. [Google Scholar] [CrossRef]
- Jin, F.; Huang, Z.; Zheng, Y.; Sun, C.; Kafle, N.; Ma, J.; Pan, P.; Miyoshi, T. Impact of Entanglement on Folding of Semicrystalline Polymer during Crystallization. ACS Macro Lett. 2023, 12, 1138–1143. [Google Scholar] [CrossRef] [PubMed]
- Clark, E.J.; Hoffman, J.D. Regime III Crystallization in Polypropylene. Macromolecules 1984, 17, 878–885. [Google Scholar] [CrossRef]
- Monasse, B.; Haudin, J.M. Growth transition and morphology change in polypropylene. Coll. Polym. Sci. 1985, 263, 822–831. [Google Scholar] [CrossRef]
- Pelzbauer, Z.; Galeski, A. Growth Rate and Morphology of Polyoxymethylene Supermolecular Structures. J. Polym. Sci. Part C 1972, 38, 23–32. [Google Scholar] [CrossRef]
- Crist, B. Yet Another Visit to the Melting of Polyethylene Crystals. J. Polym. Sci. Part B Polym. Phys. 2007, 45, 3231–3236. [Google Scholar] [CrossRef]
- Strobl, G. The Physics of Polymers; Springer: Berlin/Heidelberg, Germany, 2007; Chapter 5. [Google Scholar]
- Crist, B.; Schultz, J.M. Polymer spherulites: A critical review. Prog. Polym. Sci. 2016, 56, 1–63. [Google Scholar] [CrossRef]
- Galeski, A.; Piorkowska, E. Localized volume deficiencies as an effect of spherulite growth. I. The two-dimensional case. J. Polym. Sci. Polym. Phys. Ed. 1983, 21, 1313–1322. [Google Scholar] [CrossRef]
- Galeski, A.; Piorkowska, E. Localized volume deficiencies as an effect of spherulite growth. II. The three-dimensional case. J. Polym. Sci. Polym. Phys. Ed. 1983, 21, 1323–1339. [Google Scholar] [CrossRef]
- Pawlak, A.; Piorkowska, E. Effect of Negative Pressure on Melting Behavior of Spherulites in Thin Films of Several Crystalline Polymers. J. Appl. Polym. Sci. 1999, 74, 1380–1385. [Google Scholar] [CrossRef]
- Pawlak, A.; Galeski, A. Stability of Spherulite Growth. J. Polym. Sci. Part B Polym. Phys. 1990, 28, 1813–1821. [Google Scholar] [CrossRef]
- Piorkowska, E.; Galeski, A. Crystallization of isotactic polypropylene and high-density polyethylene under negative pressure resulting from uncompensated volume change. J. Polym. Sci. Part B Polym. Phys. 1993, 31, 1285–1291. [Google Scholar] [CrossRef]
- Avrami, M. Kinetics of phase change. II Transformation-Time Relations for Random Distribution of Nuclei. J. Chem. Phys. 1940, 8, 212–224. [Google Scholar] [CrossRef]
- Menczel, J.D.; Judovits, L.; Prime, R.B.; Bair, H.E.; Reading, M.; Swier, S. Differential scanning calorimetry. In Thermal Analysis of Polymers; Menczel, J.D., Prime, R.B., Eds.; John Wiley & Sons, Inc.: Hoboken, NJ, USA, 2009. [Google Scholar]
- Wunderlich, B. Thermal Analysis of Polymeric Materials; Springer-Verlag: Berlin/Heidelberg, Germany, 2005. [Google Scholar]
- Chalmers, J.M.; Edwards, H.G.M.; Lees, J.S.; Long, D.A.; Mackenzie, M.W.; Willis, H.A. Raman spectra of polymorphs of isotactic polypropylene. J. Raman Spectr. 1991, 22, 613–618. [Google Scholar] [CrossRef]
- Beckett, D.R.; Chalmers, J.M.; Mackenzie, M.W.; Willis, H.A.; Edwards, H.G.M.; Lees, J.S.; Long, D.A. The far-infra-red spectra of crystalline isotactic polypropylene polymorphs. Eur. Polym. J. 1985, 21, 849–852. [Google Scholar] [CrossRef]
- Xue, G.; Wang, Y.; Liu, S.; Liao, Y.T. FT-IR Study of Concentration Dependence for Crystallization of Isotactic Polystyrene Arising from Freeze-Drying Dilute Solutions. Macromolecules 1995, 28, 4344–4346. [Google Scholar] [CrossRef]
- Ji, G.; Ni, H.; Wang, C.; Xue, G.; Liao, Y.-T. Concentration Dependence of Crystalline Poly(ethylene terephthalate) Prepared by Freeze-Extracting Solutions. Macromolecules 1996, 29, 2691–2693. [Google Scholar] [CrossRef]
- Xue, G.; Wang, Y.X.; Liu, S.; Liao, Y.T. Concentration Dependence of Crystalline Poly(vinylidene fluoride) Prepared by Freeze-Extracting Solutions. Macromolecules 1995, 28, 3476–3478. [Google Scholar] [CrossRef]
- Xue, G.; Wang, Y.; Gu, X.; Lu, Y. Rapid Crystallization of Isotactic Polystyrene by Shock-Cooling and Subsequent Freeze-Drying of Its Very Dilute Solution. Macromolecules 1994, 27, 4016–4017. [Google Scholar] [CrossRef]
- Wissler, G.E.; Crist, B., Jr. Glass transition in semicrystalline polycarbonate. J. Polym. Sci. Polym. Phys. 1980, 18, 1257–1270. [Google Scholar] [CrossRef]
- Ji, G.; Li, F.; Zhu, W.; Dai, Q.; Xue, G.; Gu, X. Rapid Crystallization of Polycarbonate by Shock-Cooling and Freeze-Drying Method. J. Macromol. Sci. Part A Pure and App. Chem. 1997, 34, 369–376. [Google Scholar] [CrossRef]
- Ji, G.; Xue, G.; Ma, J.; Dong, C.; Gu, X. Concentration dependence of crystallinity of polycarbonate by shock-cooling and subsequent freeze-drying of its various solutions. Polymer 1996, 37, 3255–3258. [Google Scholar] [CrossRef]
- Hu, S.; Yang, F.; Cao, Y.; Yan, Y.; Wu, T.; Fu, Q. Influence of chain entanglements and melt memory effect on the crystallization behavior of polypropylene sulfide. Polymer 2023, 285, 126390. [Google Scholar] [CrossRef]
- Krajenta, J.; Pawlak, A.; Galeski, A. Deformation of Disentangled Polypropylene Crystalline Grains into Nanofibers. J. Polym. Sci. Part B Polym. Phys. 2016, 54, 1983–1994. [Google Scholar] [CrossRef]
- Alexander, L.E. X-Ray Diffraction Methods in Polymer Sciences; Wiley-Interscience: New York, NY, USA, 1970; p. 335. [Google Scholar]
- Sasaki, T.; Yamauchi, N.; Irie, S.; Sakurai, K. Differential Scanning Calorimetry Study on Thermal Behaviors of Freeze-Dried Poly(L-lactide) from Dilute Solutions. J. Polym. Sci. Part B Polym. Phys. 2005, 43, 115–124. [Google Scholar] [CrossRef]
- Sasaki, T.; Morino, D.; Tabata, N. Origin of enhanced cold crystallization rate for freeze-dried poly(L-lactide) from solutions. Polym. Eng. Sci. 2011, 51, 1858–1865. [Google Scholar] [CrossRef]
- Sun, C.; Zheng, Y.; Xu, S.; Ni, L.; Li, X.; Shan, G.; Bao, Y.; Pan, P. Role of Chain Entanglements in the Stereocomplex Crystallization between Poly(lactic acid) Enantiomers. ACS Macro. Lett. 2021, 10, 1023–1028. [Google Scholar] [CrossRef] [PubMed]
- Barangizi, H.; Pawlak, A. Crystallization of partially disentangled polypropylene in nanocomposites with aluminum oxide. Polymer 2022, 254, 125049. [Google Scholar] [CrossRef]
- Pandey, A.; Toda, A.; Rastogi, S. Influence of Amorphous Component on Melting of Semicrystalline Polymers. Macromolecules 2011, 44, 8042–8055. [Google Scholar] [CrossRef]
- Xue, J.; Lu, Y.; Wang, B.; Chen, J.; Shen, C.; Zhang, B. The Isothermal Melting Kinetics of Ultra-High Molecular Weight Polyethylene Crystals. Macromol. Rapid Commun. 2024, 225, 2300704. [Google Scholar] [CrossRef] [PubMed]
- Zhang, Y.; Chen, J.; Fu, Q.; Zhang, J. Novel Strategy to Improve the Performance of Poly(L-lactide): The Synergistic Effect of Disentanglement and Strong Shear Field. ACS Sustain. Chem. Eng. 2023, 11, 9630–9642. [Google Scholar] [CrossRef]
- Yamazaki, S.; Hikosaka, M.; Gu, F.; Ghosh, S.K.; Arakaki, M.; Toda, A. Effect of entanglement on nucleation rate of poly-ethylene. Polymer J. 2001, 33, 906–908. [Google Scholar] [CrossRef]
- Robelin-Souffache, E.; Rault, J. Origin of the long period and crystallinity in quenched semicrystalline polymers. Macromolecules 1989, 22, 3581–3594. [Google Scholar] [CrossRef]
- Bartczak, Z.; Kozanecki, M. Influence of molecular parameters on high-strain deformation of polyethylene in the plane-strain compression. Part I. Stress—Strain behavior. Polymer 2005, 46, 8210–8221. [Google Scholar] [CrossRef]
- Zhang, Y.S.; Zhong, L.W.; Yang, S.; Liang, D.H.; Chen, E.Q. Memory effect on solution crystallization of high molecular weight poly(ethylene oxide). Polymer 2012, 53, 3621–3628. [Google Scholar] [CrossRef]
- Flory, P.J.; Yoon, D.Y. Molecular morphology in semicrystalline polymers. Nature 1978, 272, 226–229. [Google Scholar] [CrossRef]
- Jani, F.; Sepahi, A.; Afzali, S.K.; Moyad, S.H. Experimental study on the effect of molecular weight and chemical composition distribution on the mechanical response of high-density polyethylene. Polym. Eng. Sci. 2023, 63, 176–188. [Google Scholar] [CrossRef]
- Peters, G.W.M.; Balzano, L.; Steenbakkers, R.J.A. Flow-induced Crystallization. In Handbook of Polymer Crystallization; Piorkowska, E., Rutledge, G.C., Eds.; John Wiley & Sons, Inc.: Hoboken, NJ, USA, 2013; Chapter 17; pp. 399–431. [Google Scholar]
- Martins, J.A.; Zhang, W.; Brito, A.M. Origin of the melt memory effect in polymer crystallization. Polymer 2010, 51, 4185–4194. [Google Scholar] [CrossRef]
- Pawlak, A.; Krajenta, J.; Galeski, A. The Crystallization of Polypropylene with Reduced Density of Entanglements. J. Polym. Sci. Part B Polym. Phys. 2017, 55, 748–756. [Google Scholar] [CrossRef]
- Krajenta, J.; Safandowska, M.; Pawlak, A. The re-entangling of macromolecules in polypropylene. Polymer 2019, 175, 215–226. [Google Scholar] [CrossRef]
- Hong, H.; Rongjie, L.; Yaling, Z. Concentration Dependence of Crystalline Poly(L-lactide) Prepared by Freeze-drying Solutions. Polym. Polym. Compos. 2009, 17, 31–35. [Google Scholar] [CrossRef]
- Wang, Y.; Fu, J.; Liu, M.; Fu, Q.; Zhang, J. Understanding the effect of chain entanglement state on melt crystallization of the polymer freeze-extracted from solution: The role of critical overlap concentration. Polymer 2019, 178, 121588. [Google Scholar] [CrossRef]
- Barangizi, H.; Krajenta, J.; Pawlak, A. The influence of entanglements of macromolecules on the mechanical and thermal properties of polylactide composites with carbon nanotubes. Exp. Polym. Lett. 2023, 17, 738–758. [Google Scholar] [CrossRef]
- Ni, L.; Xu, S.; Sun, C.; Qin, Y.; Zheng, Y.; Zhou, J.; Yu, C.; Pan, P. Retarded Crystallization and Promoted Phase Transition of Freeze-Dried Polybutene-1: Direct Evidence for the Critical Role of Chain Entanglement. ACS Macro Lett. 2022, 11, 257–263. [Google Scholar] [CrossRef] [PubMed]
- Hu, H.; Chen, J.; Yang, T.; Wang, P.; Min, J.; Fu, Q.; Zhang, J. Regulation of Entanglement Networks under Different Shear Fields and Its Effect on the Properties of Poly(L-lactide). Ind. Eng. Chem. Res. 2023, 62, 7434–7446. [Google Scholar] [CrossRef]
- Liu, X.; Yu, W. Weak Shear-Induced Slowdown in Crystallization of Less-Entangled Poly(ε-caprolactone). Macromolecules 2021, 54, 3347–3357. [Google Scholar] [CrossRef]
- Fan, Z.; Wang, Y.; Bu, H. Influence of Intermolecular Entanglements on Crystallization Behavior of Ultra-High Molar Mass Polyethylene. Polym. Eng. Sci. 2003, 43, 607–614. [Google Scholar] [CrossRef]
- Sun, Q.; Fu, Q.; Xue, G.; Chen, W. Crystallization Behavior of Syndiotactic Poly(propylene) Freeze-Dried from Toluene at Very Dilute Concentration. Macromol. Rapid Comm. 2001, 22, 1182–1185. [Google Scholar] [CrossRef]
- Xiao, Z.; Sun, Q.; Xue, G.; Yuan, Z.; Dai, Q.; Hu, Y. Thermal behavior of isotactic polypropylene freeze-extracted from solutions with varying concentrations. Europ. Polym. J. 2003, 39, 927–931. [Google Scholar] [CrossRef]
- Wang, B.; Cavallo, D.; Zhang, X.; Zhang, B.; Chen, J. Evolution of chain entanglements under large amplitude oscillatory shear flow and its effect on crystallization of isotactic polypropylene. Polymer 2020, 186, 121899. [Google Scholar] [CrossRef]
- Krajenta, J.; Safandowska, M.; Pawlak, A.; Galeski, A. All-polymer composites—A new approach with the use of disentangled semi-crystalline polymers. Part 1. Disentangling and properties of disentangled polylactide. Polimery 2020, 65, 167–173. [Google Scholar] [CrossRef]
- Yamazaki, S.; Hikosaka, M.; Toda, A.; Wataoka, I.; Gu, F. Role of entanglement in nucleation and ‘melt relaxation’ of polyethylene. Polymer 2002, 43, 6585–6593. [Google Scholar] [CrossRef]
- Gaonkar, A.A.; Murudkar, V.V.; Deshpande, V.D. Comparison of crystallization kinetics of polyethylene terephthalate (PET) and reorganized PET. Thermoch. Acta 2020, 683, 178472. [Google Scholar] [CrossRef]
- Wang, X.H.; Wang, Z.; Luo, K.; Huang, Y. Translation and Rotation of Spherulites during the Crystallization of Isotactic Polypropylene with Reduced Chain Entanglements. Macromolecules 2011, 44, 2844–2851. [Google Scholar] [CrossRef]
- Nowacki, R.; Kolasinska, J.; Piorkowska, E. Cavitation during isothermal crystallization of isotactic polypropylene. J. Appl. Polym. Sci. 2001, 79, 2439–2448. [Google Scholar] [CrossRef]
- Gu, F.; Bu, H.; Zhang, Z. Unique morphologies found in freeze-dried poly(ethy1ene oxide) prepared from dilute solutions. Macromol. Chem. Phys. 1998, 199, 2597–2600. [Google Scholar] [CrossRef]
- Gu, F.M.; Bu, H.S.; Zhang, Z. A unique morphology of freeze-dried poly(ethylene oxide) and its transformation. Polymer 2000, 41, 7605–7609. [Google Scholar] [CrossRef]
- Luo, C.; Sommer, J.-U. Frozen Topology: Entanglements Control Nucleation and Crystallization in Polymers. Phys. Rev. Let. 2014, 112, 195702. [Google Scholar] [CrossRef] [PubMed]
- Zou, L.; Zhang, W. Molecular Dynamics Simulations of the Effects of Entanglement on Polymer Crystal Nucleation. Macromolecules 2022, 55, 4899–4906. [Google Scholar] [CrossRef]
- Zhu, C.; Zhao, J. Nucleation and Crystallization of Polymer Melts under Cyclic Stretching: Entanglement Effect. Macromolecules 2023, 56, 5490–5501. [Google Scholar] [CrossRef]
- Zhai, Z.; Fusco, C.; Morthomas, J.; Perez, M.; Lame, O. Disentangling and Lamellar Thickening of Linear Polymers during Crystallization: Simulation of Bimodal and Unimodal Molecular Weight Distribution Systems. ACS Nano 2019, 13, 11310–11319. [Google Scholar] [CrossRef] [PubMed]
- Yamazaki, S.; Gu, F.; Watanabe, K.; Okada, K.; Toda, A.; Hikosaka, M. Two-step formation of entanglement from disentangled polymer melt detected by using nucleation rate. Polymer 2006, 47, 6422–6428. [Google Scholar] [CrossRef]
- Fu, J.; Wang, Y.; Shen, K.; Fu, Q.; Zhang, J. Insight into Shear-Induced Modification for Improving Processability of Polymers: Effect of Shear Rate on the Evolution of Entanglement State. J. Polym. Sci. B Polym. Phys. 2019, 57, 598–606. [Google Scholar] [CrossRef]
Figure 1.
The idea of a macromolecule (red) moving inside a virtual tube caused by the entanglements of other macromolecules (blue). The red arrow shows the direction of movement of the macromolecule [23].
Figure 1.
The idea of a macromolecule (red) moving inside a virtual tube caused by the entanglements of other macromolecules (blue). The red arrow shows the direction of movement of the macromolecule [23].
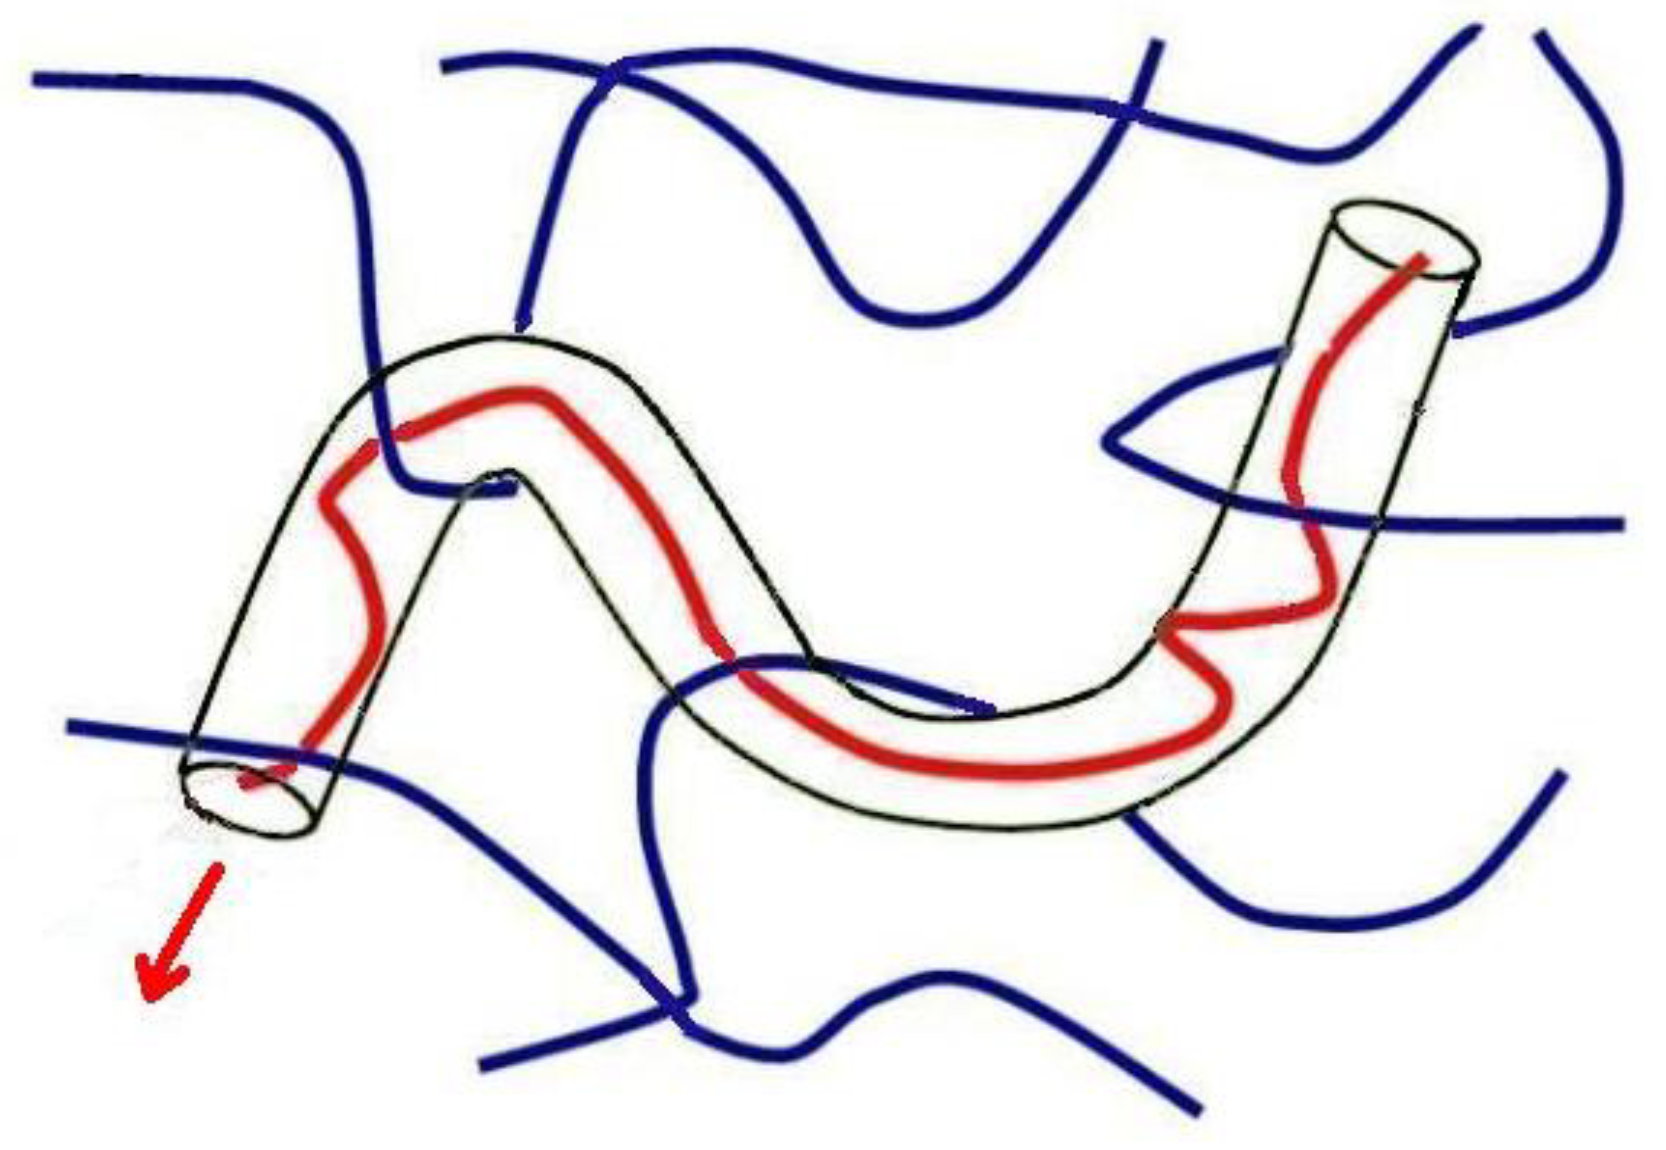
Figure 2.
Deposit mechanism of molecular nuclei on a growing lamella in three regimes of crystallization. Adapted from [79]. Reproduced with permission: 1985, Springer Verlag.
Figure 2.
Deposit mechanism of molecular nuclei on a growing lamella in three regimes of crystallization. Adapted from [79]. Reproduced with permission: 1985, Springer Verlag.
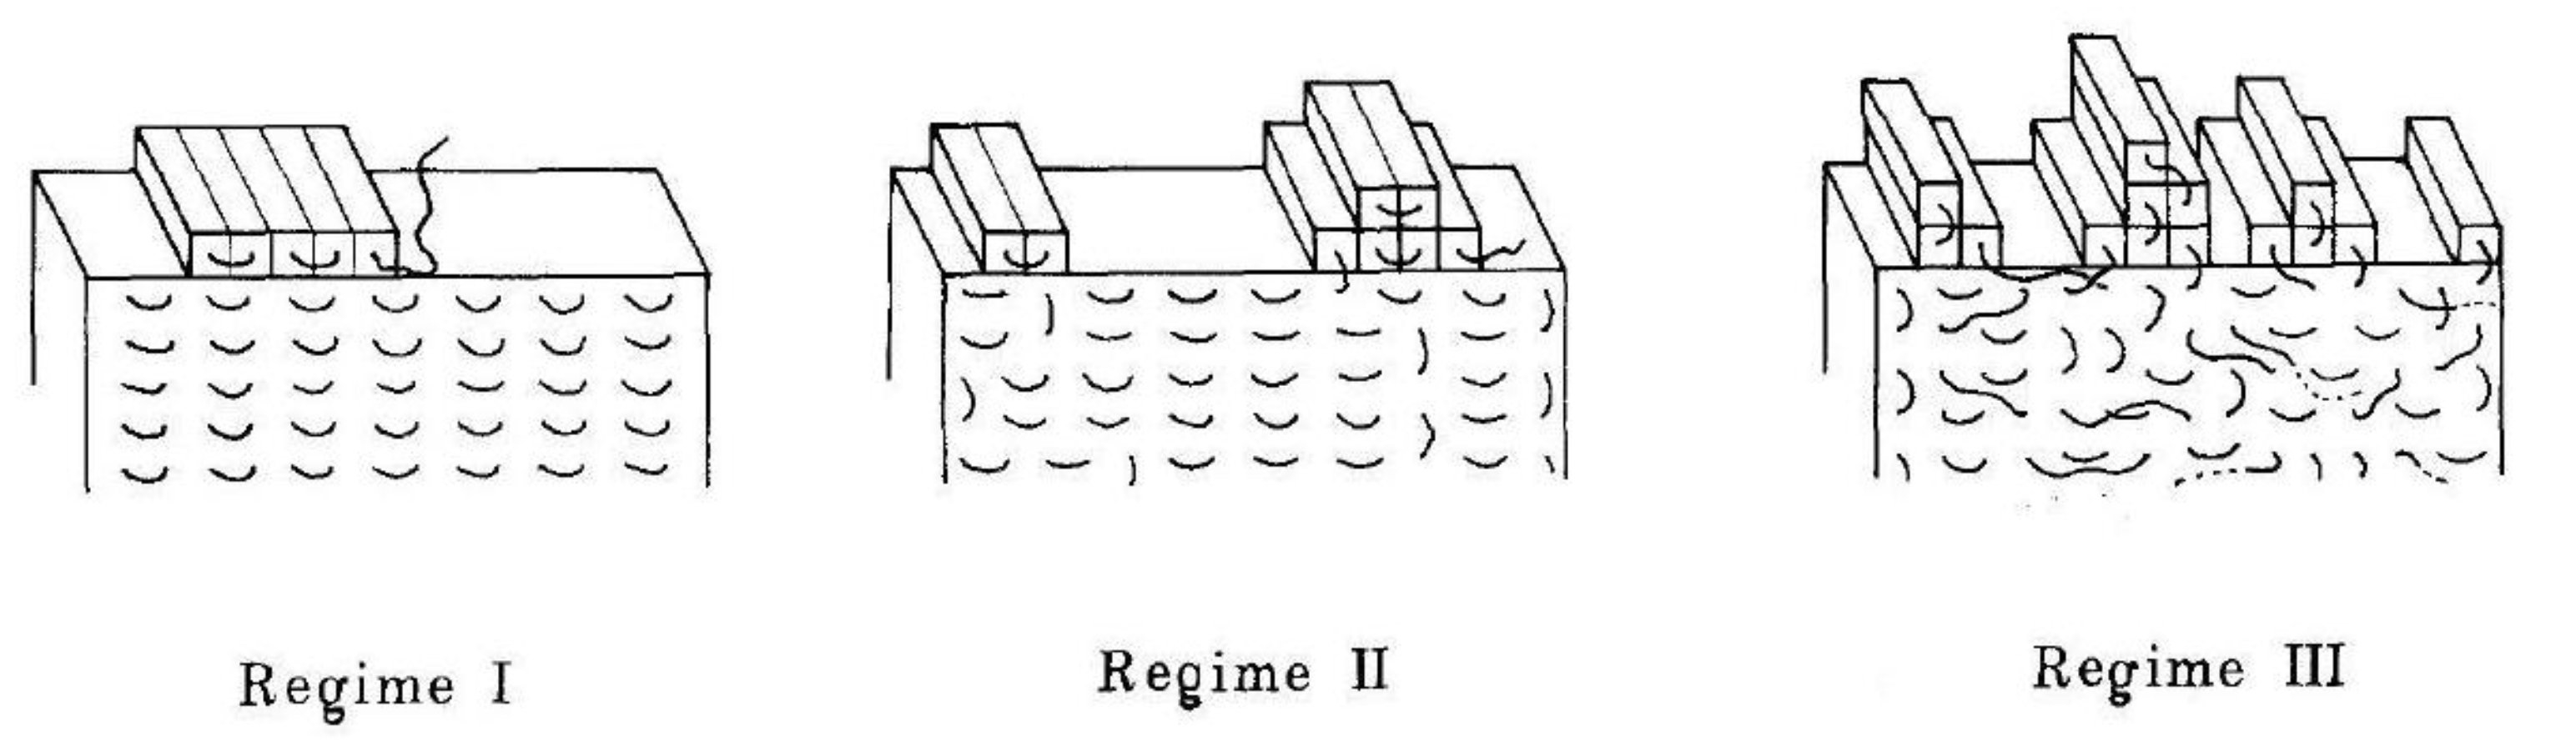
Figure 3.
(a) Plots of the crystallinity versus log of concentration of the original PET solutions: A—freeze-extracted, B—after annealing for 1 h at 150 °C, C—after annealing for 5 h at 150 °C, D—after annealing for 24 h at 200 °C. The range of concentration was 0.03–60 wt.% [95]; (b) Crystallinity of freeze-extracted PVDF in the function of a concentration in a solvent and applied rate of cooling during freezing: A—rapid cooling in liquid nitrogen, B—slow cooling inside a refrigerator [96]. Reproduced with permission: 1995 and 1996, American Chemical Society.
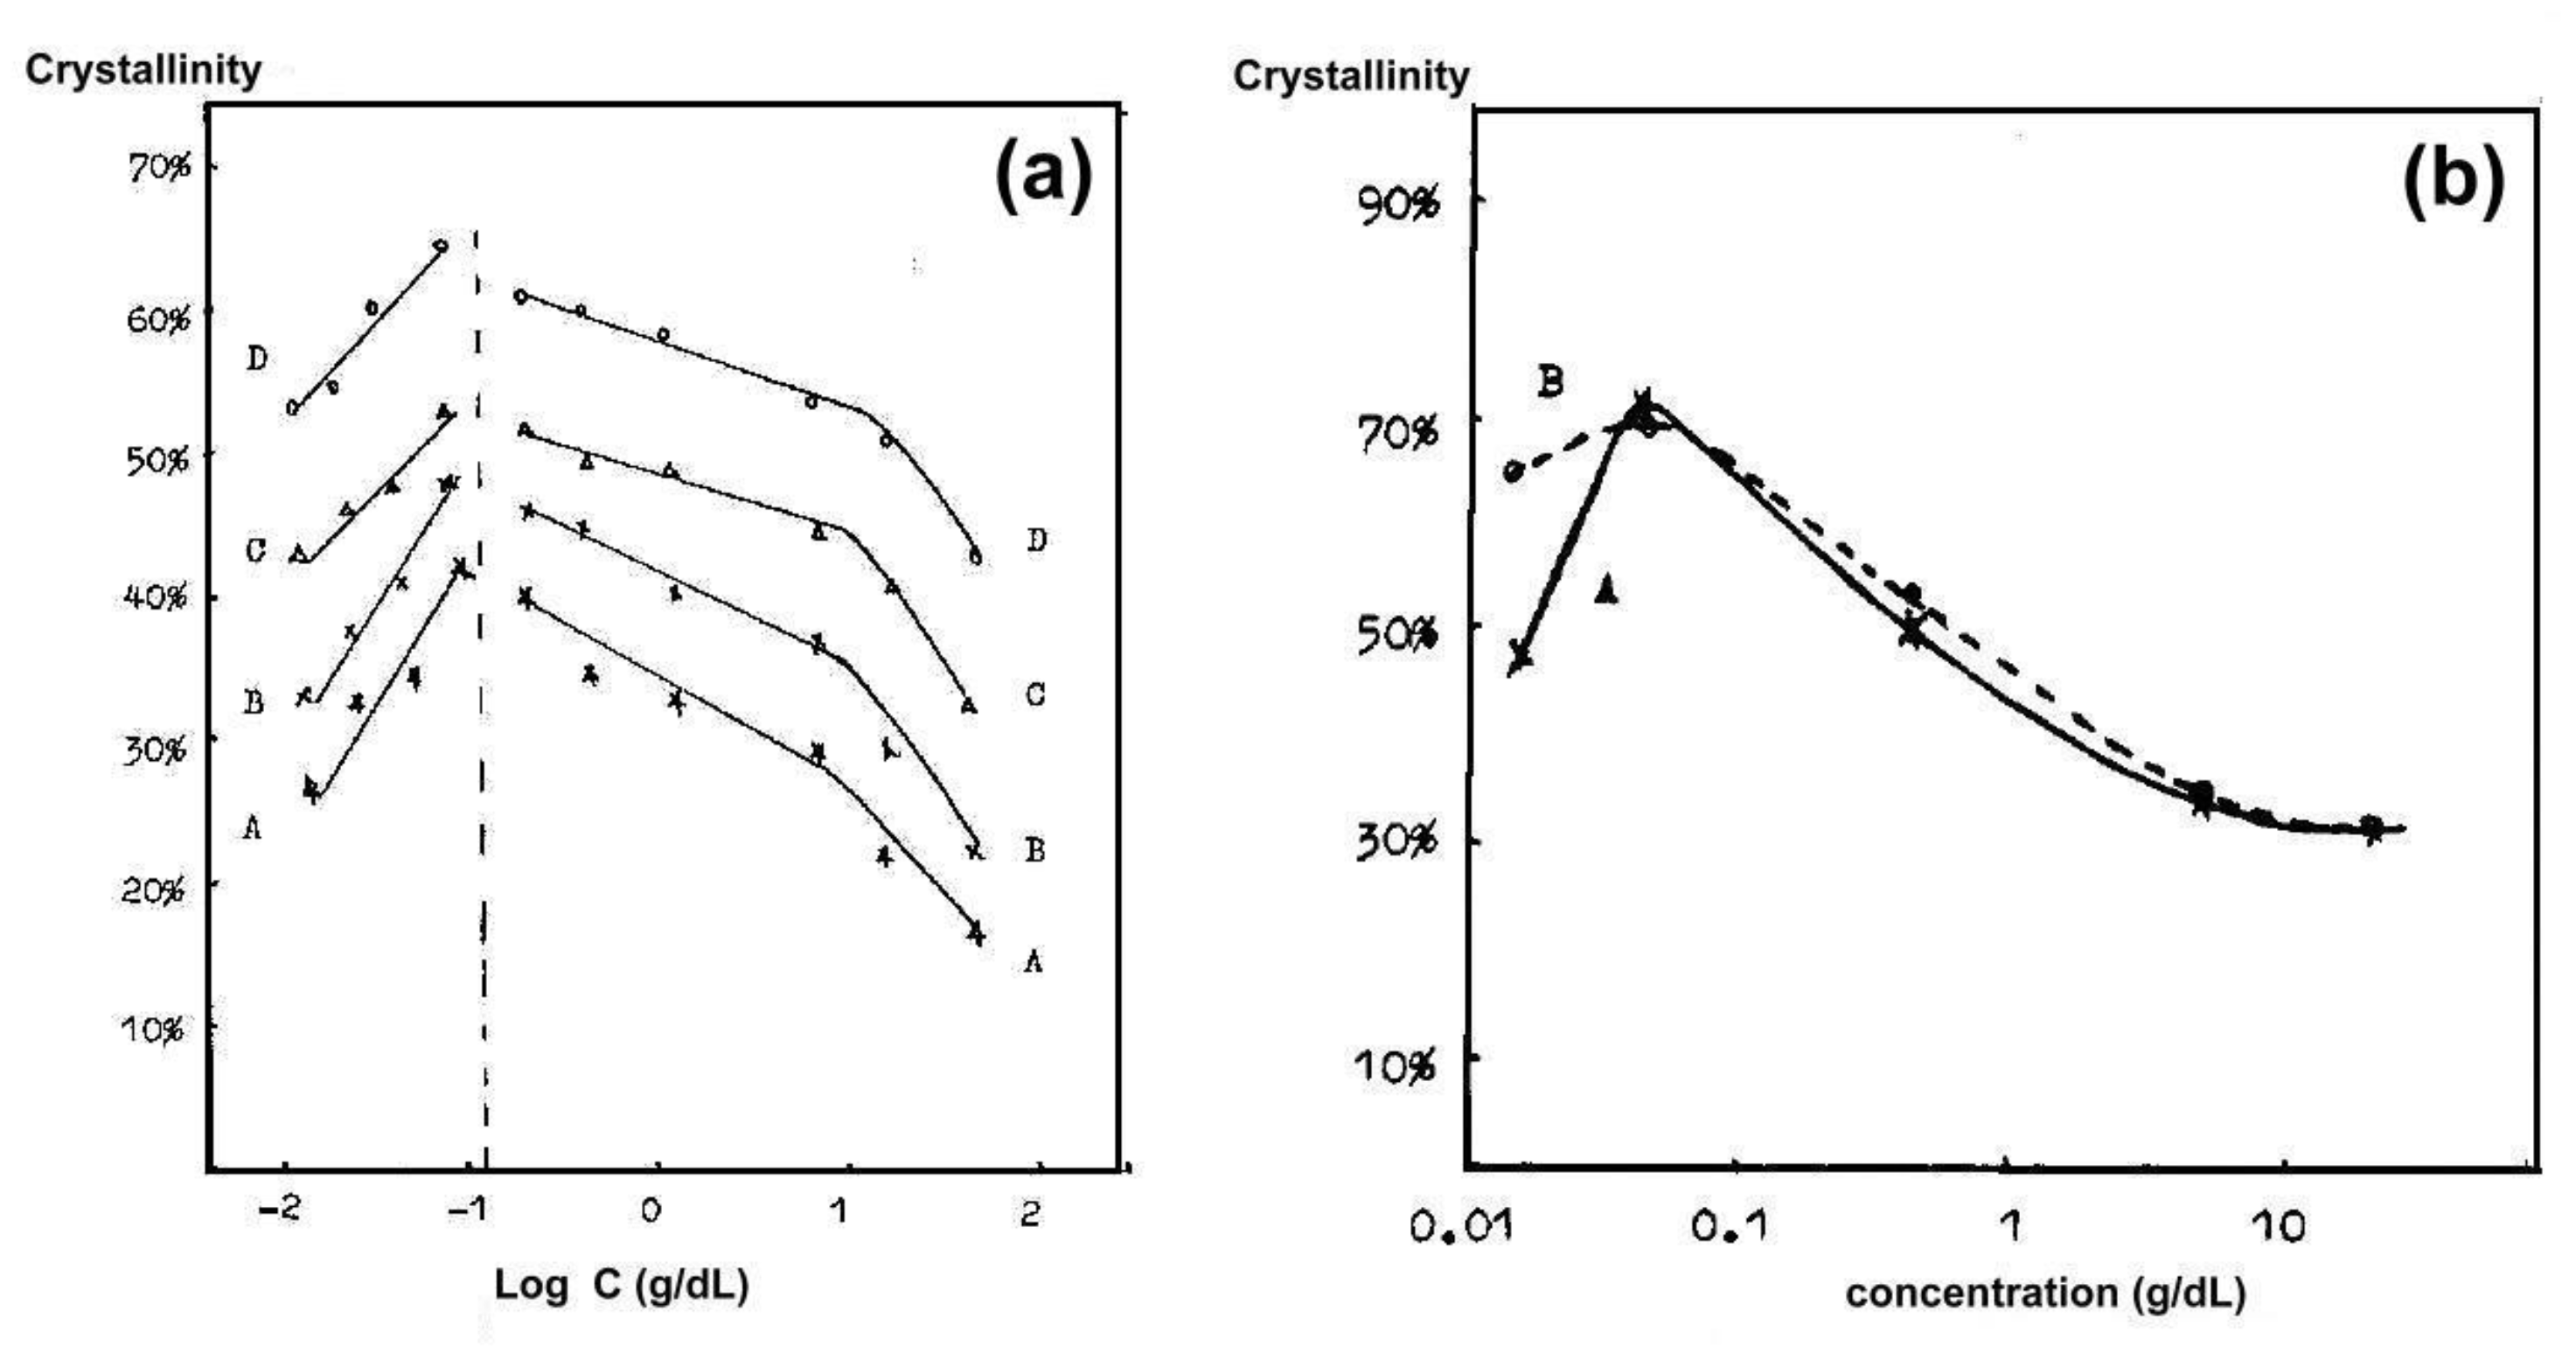
Figure 4.
Crystalline properties of freeze-dried iPS. (a) Plots of the relative intensities of IR spectral bands, showing the share of the crystalline phase, as a function of the concentration for freeze-dried iPS: immediately after preparation (A) and after 3 (B) or 90 min (C) of annealing at 180 °C. Lower concentrations are shown on the right side of the figure [94]; (b) DSC traces of collective particles prepared from solutions of various concentrations: A—bulk iPS, B—1 × 10⁻¹ wt.% solution, C—1 × 10⁻² wt.% solution, D—2 × 10⁻³ wt.% solution, E—1 × 10⁻³ wt.% solution [32]. Reproduced with permission: 1995 and 1998, American Chemical Society.

Figure 5.
WAXS recorded from: (A) a freeze-drying prepared PC; (B) a hot-precipitated PC; (C) amorphous PC [99]. Reproduced with permission: 1997, Taylor & Francis.
Figure 5.
WAXS recorded from: (A) a freeze-drying prepared PC; (B) a hot-precipitated PC; (C) amorphous PC [99]. Reproduced with permission: 1997, Taylor & Francis.
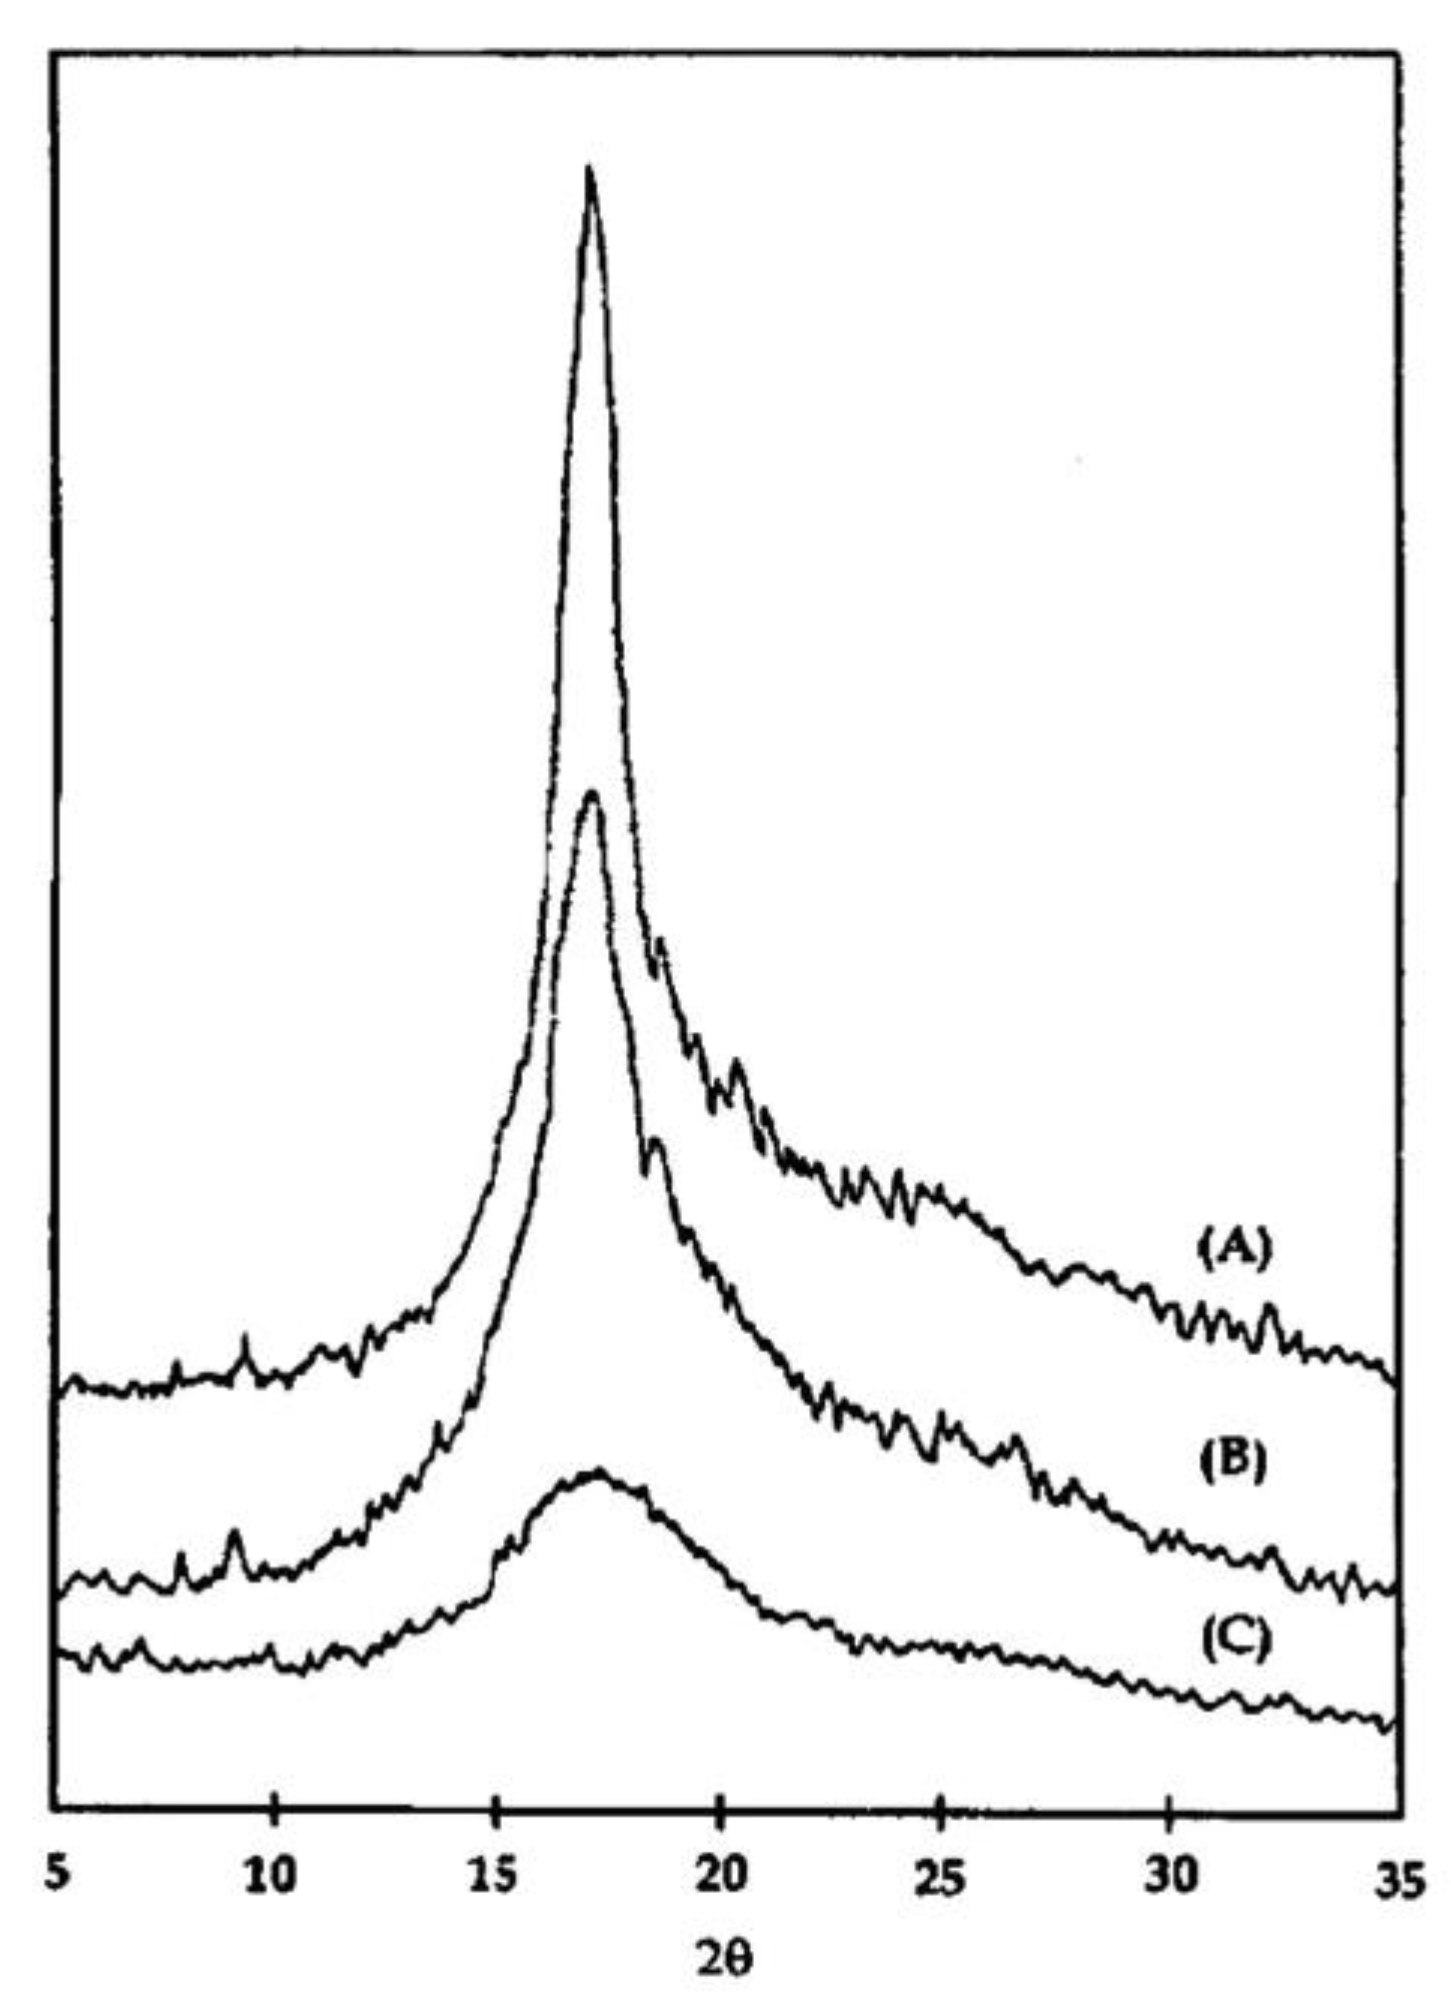
Figure 6.
DSC heating traces for disentangled PLLA (PLLA-FDA) and for reference bulk PLLA sample [104]. Reproduced with permission: 2005, John Wiley & Sons.
Figure 6.
DSC heating traces for disentangled PLLA (PLLA-FDA) and for reference bulk PLLA sample [104]. Reproduced with permission: 2005, John Wiley & Sons.
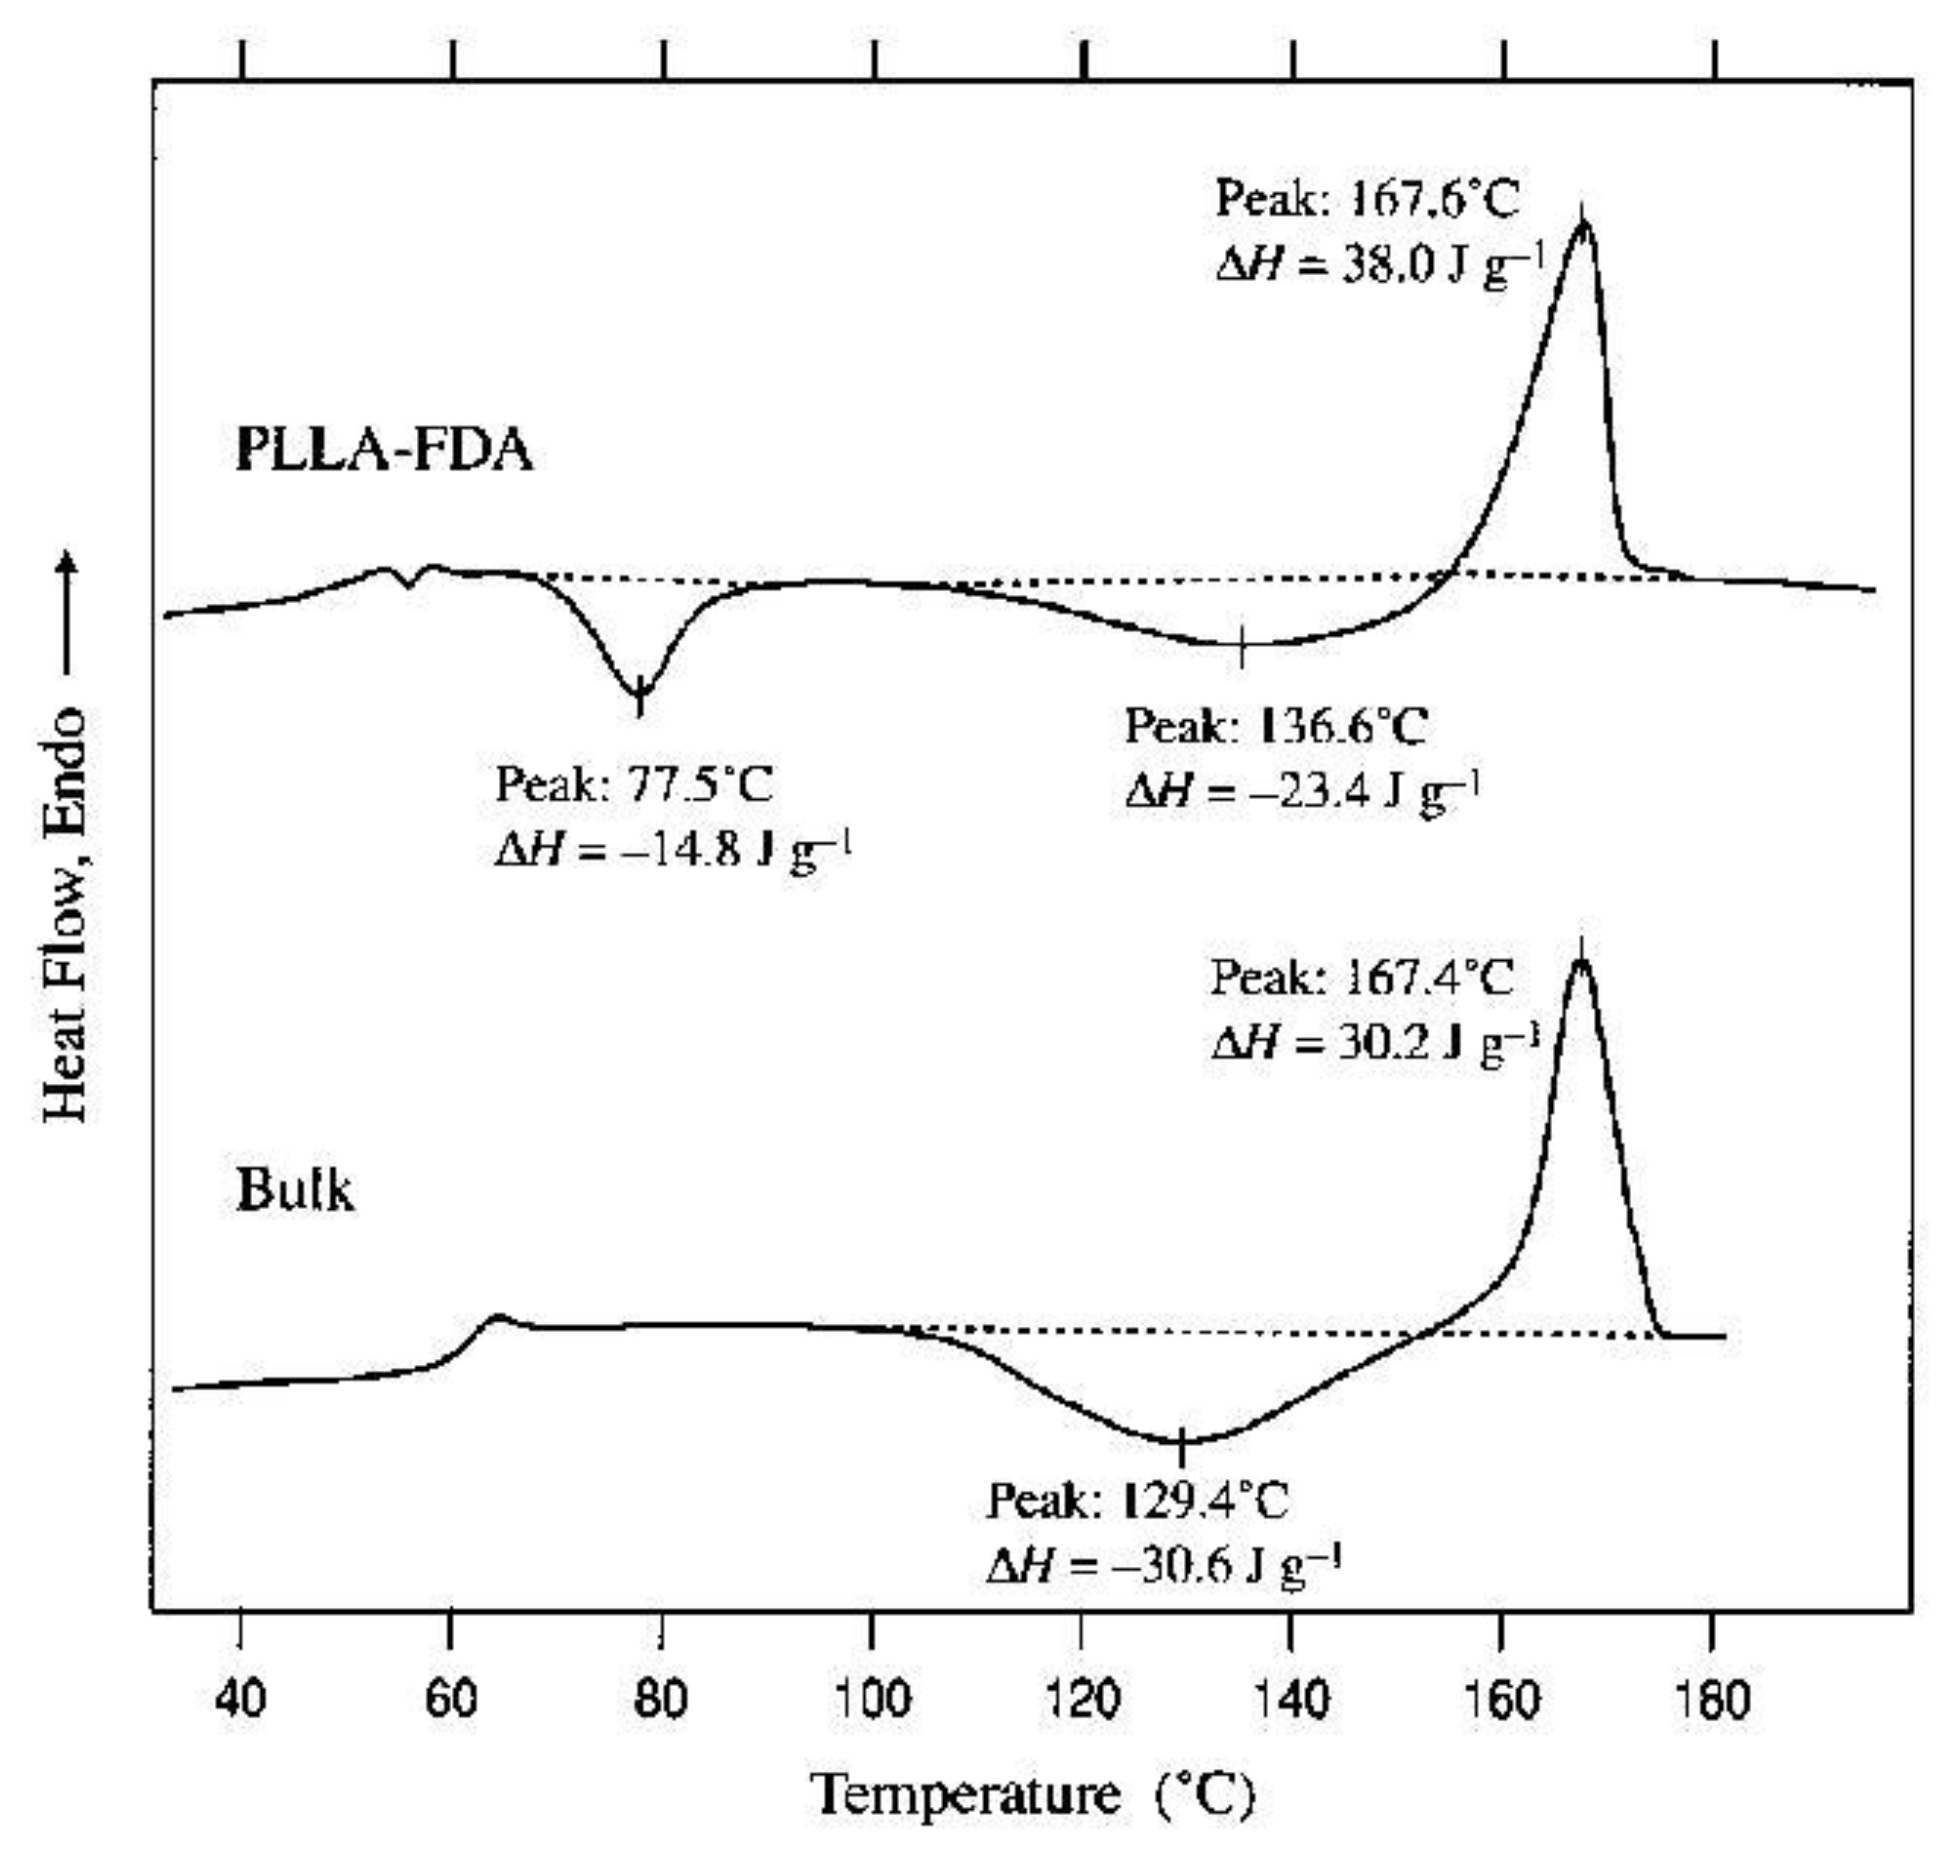
Figure 7.
Heating rate comparison between nascent, disentangled (dPE_4M_2.5), and commercially available entangled (ePE_4M_8.4) UHMWPE of a similar Mw [108]. Reproduced with permission: 2011, American Chemical Society.
Figure 7.
Heating rate comparison between nascent, disentangled (dPE_4M_2.5), and commercially available entangled (ePE_4M_8.4) UHMWPE of a similar Mw [108]. Reproduced with permission: 2011, American Chemical Society.
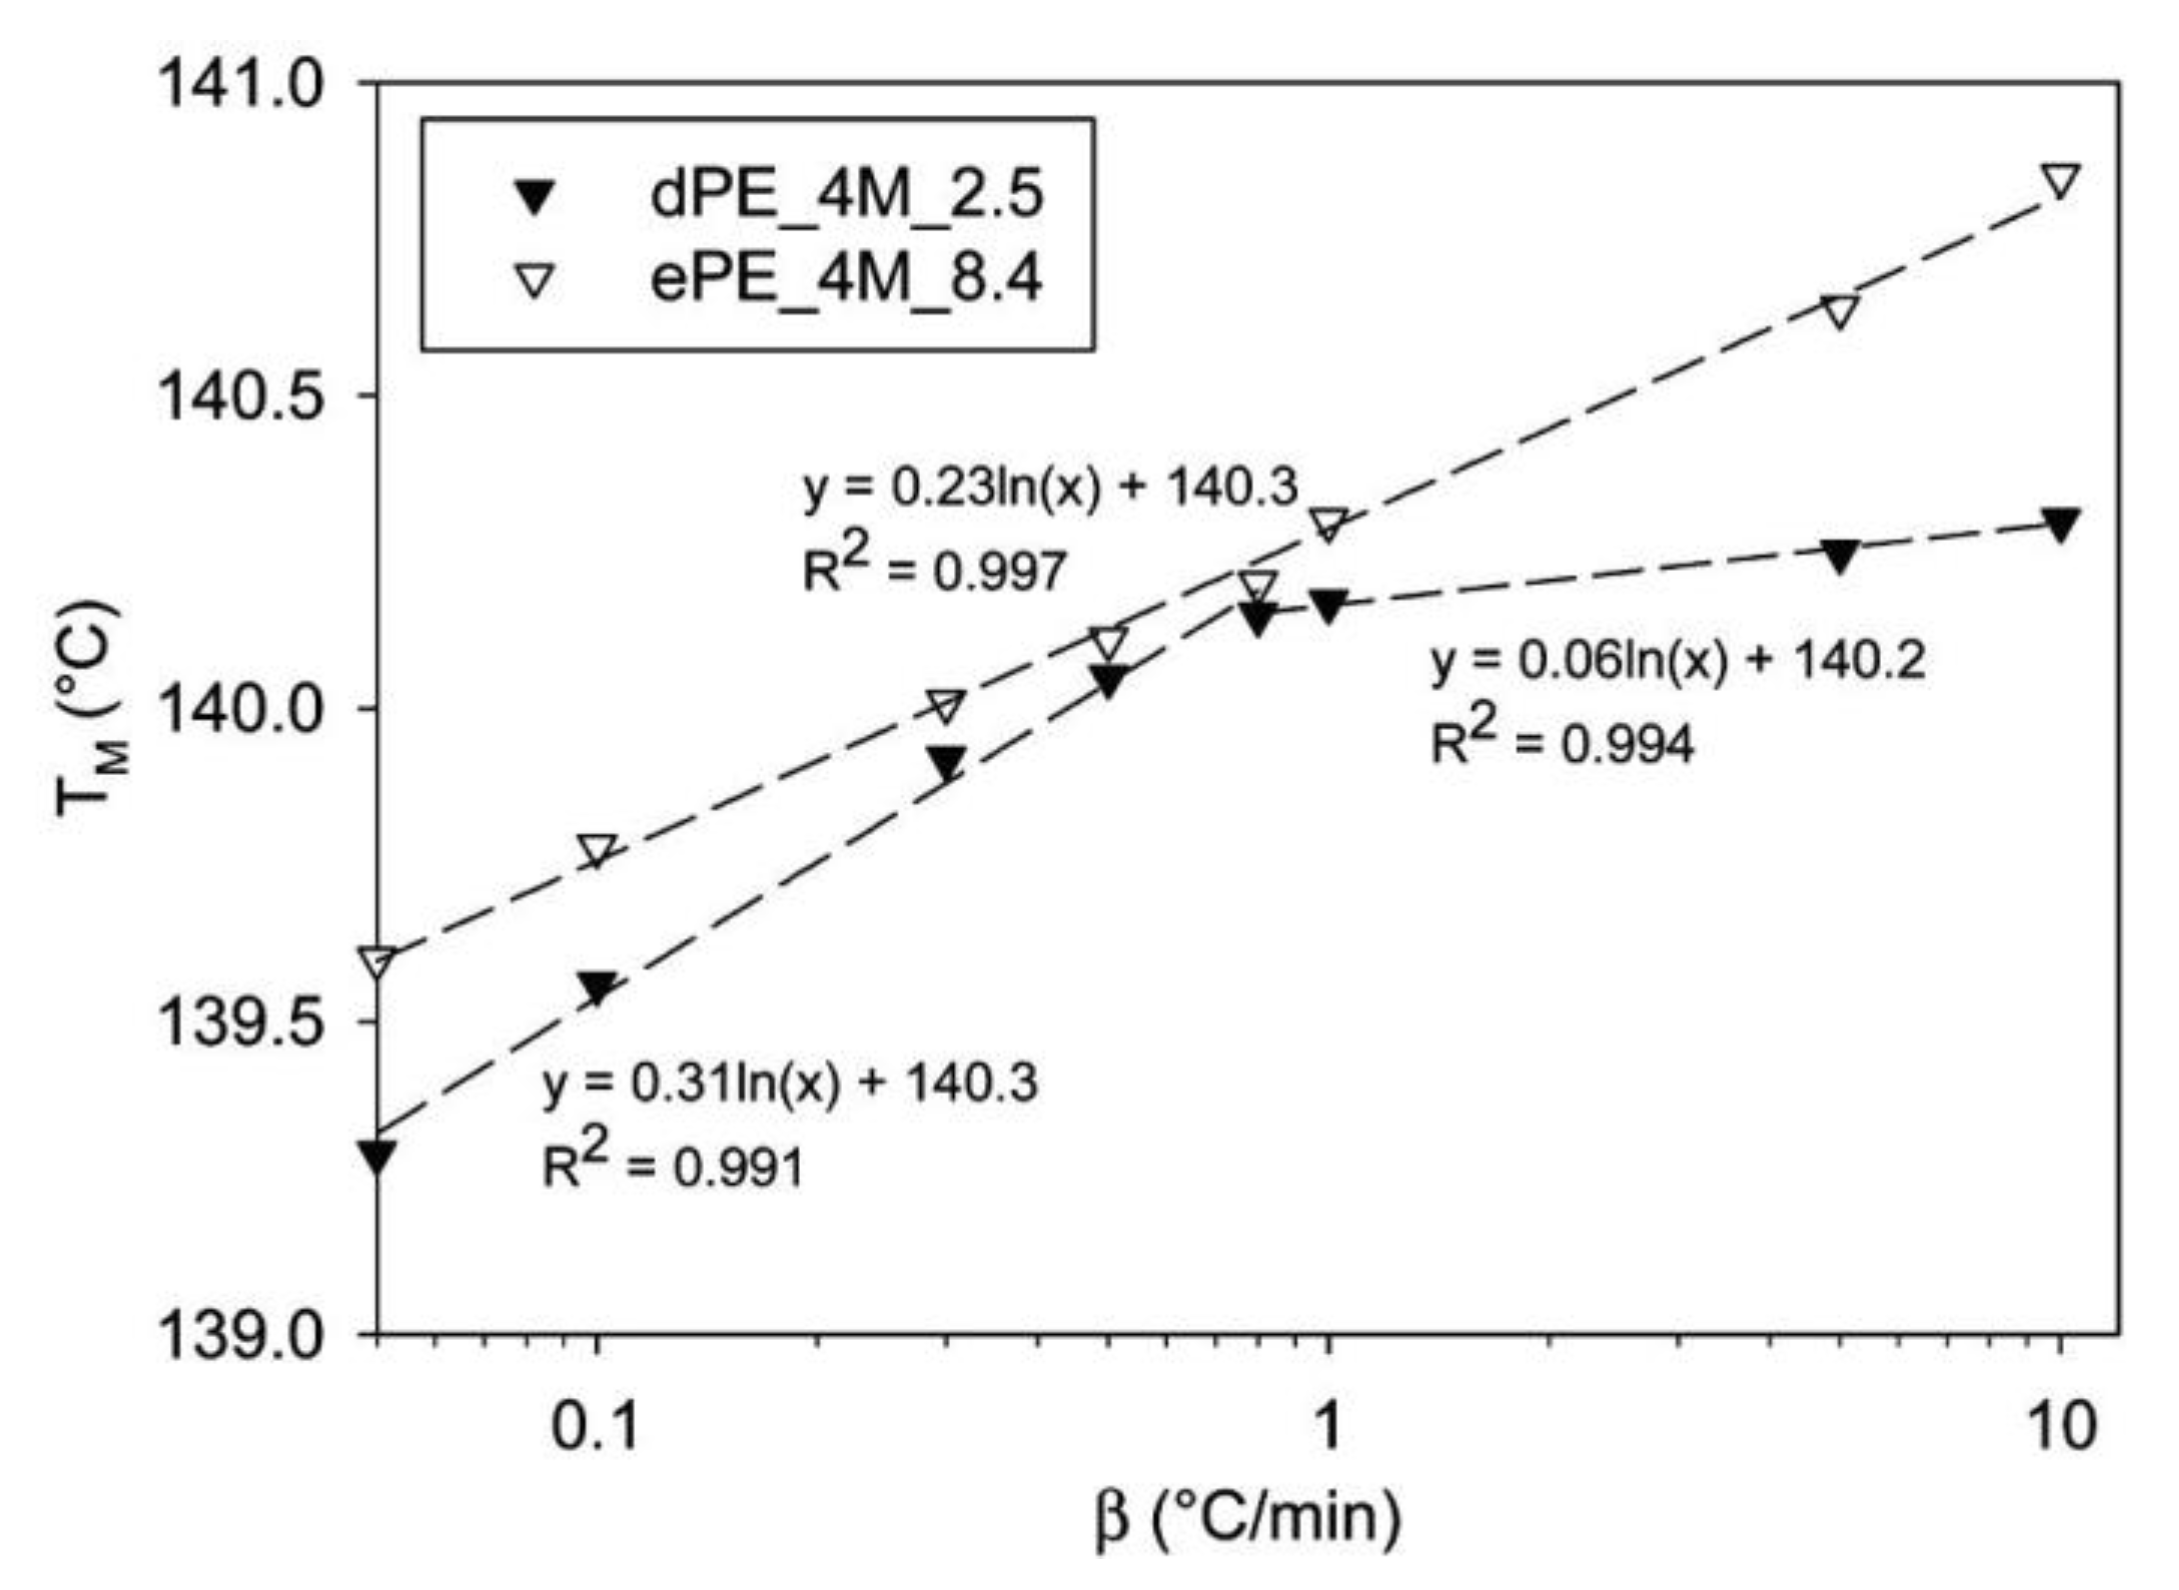
Figure 8.
Plots of the percentage of surviving crystals (Xs) against time at various isothermal annealing temperatures. On the left, nascent UHMWPE, on the right, melt-crystallized UHMWPE [109]. Reproduced with permission: 2024, John Wiley & Sons.
Figure 8.
Plots of the percentage of surviving crystals (Xs) against time at various isothermal annealing temperatures. On the left, nascent UHMWPE, on the right, melt-crystallized UHMWPE [109]. Reproduced with permission: 2024, John Wiley & Sons.
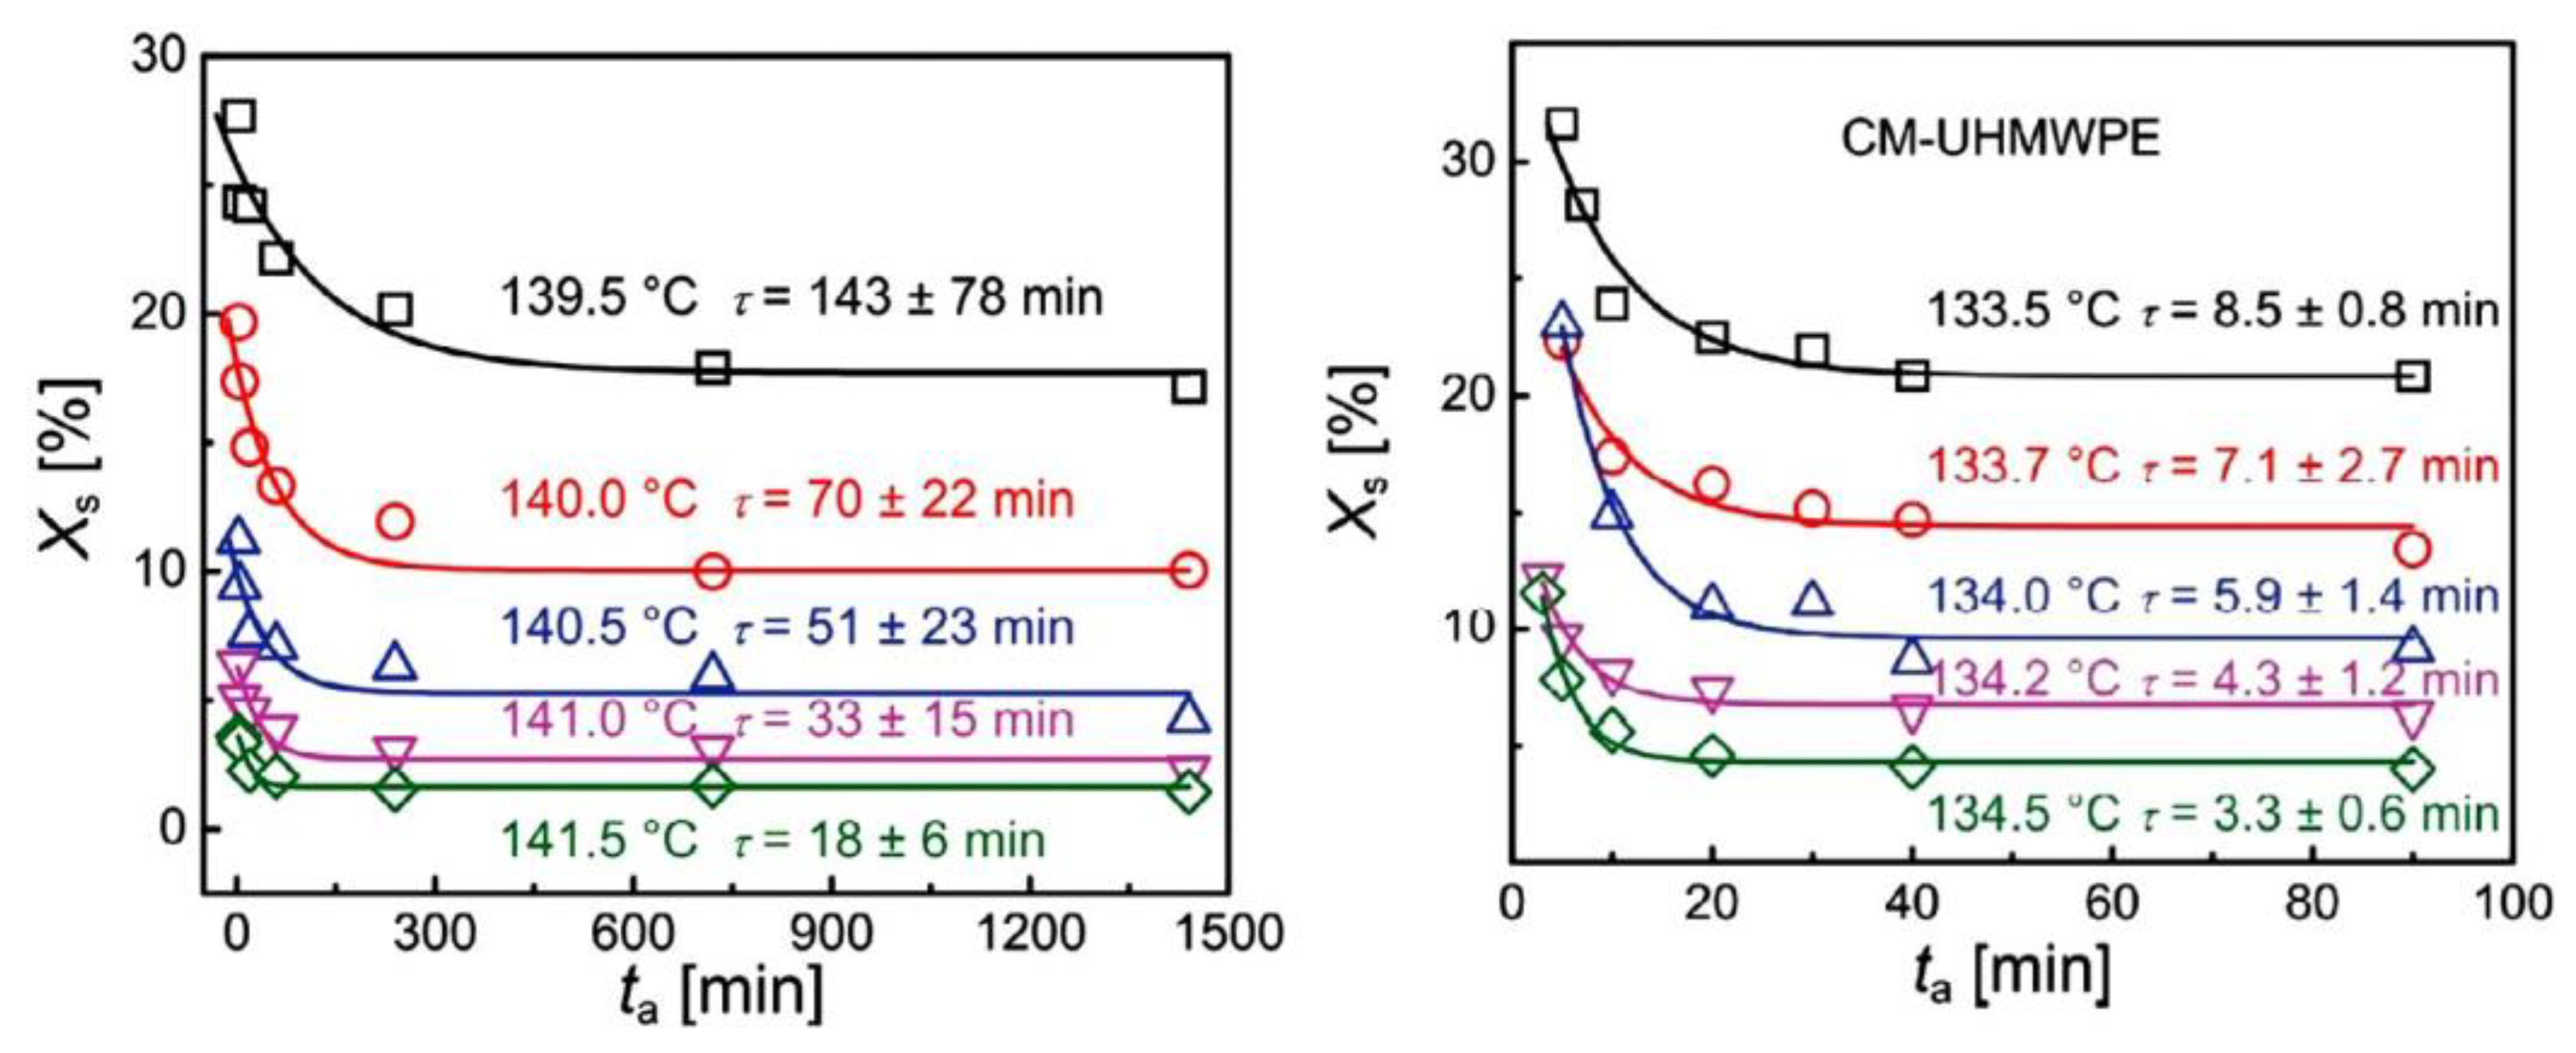
Figure 9.
DSC curves recorded during the melting of injection molded entangled and disentangled PLLA. The abbreviations indicated the processing protocols used: UP—untreated, DP—disentangled, CIM—classic injection molding, VIM—vibrational injection molding [110]. Reproduced with permission: 2023, American Chemical Society.
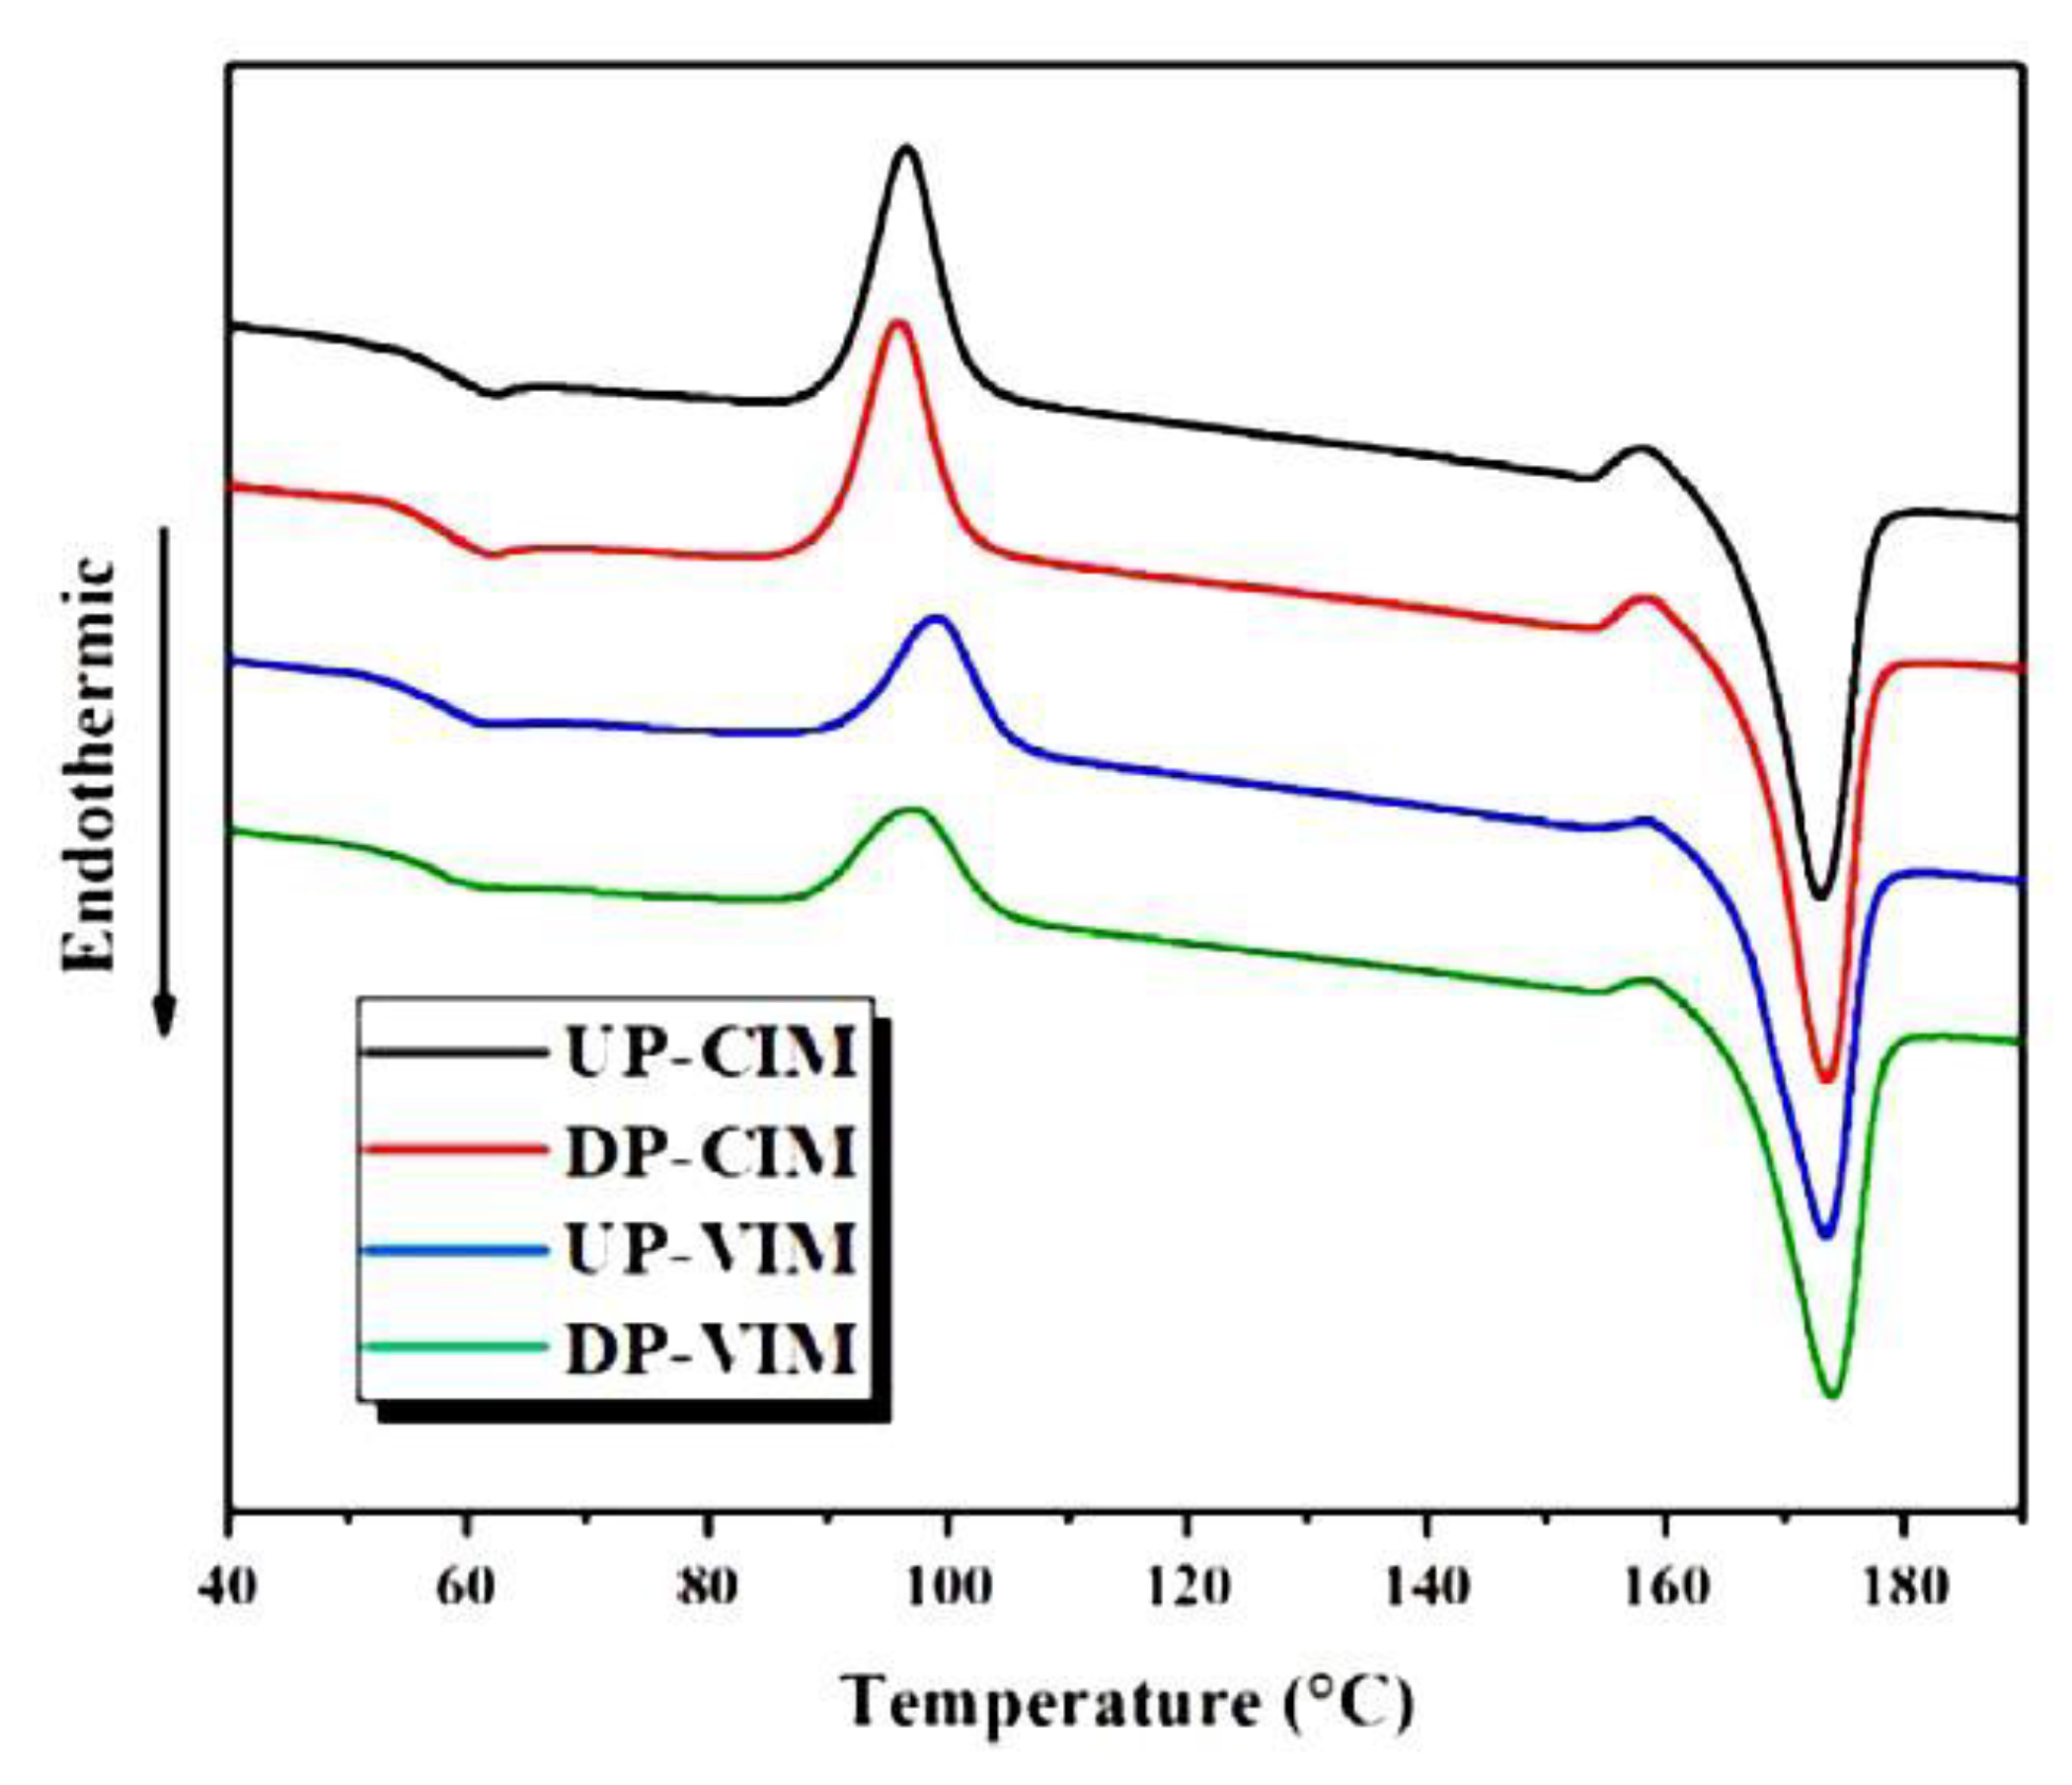
Figure 10.
Conversion of melt into solid state during cooling iPP from 210 °C at a rate of 30°/min, measured from the brightness of images observed in a PLM. The samples were kept for 3 min at 210 °C to remove self-nucleation. The two PPs used were designated PPN and PPH (higher Mw). The letter i means the entangled polymer, the number means the concentration of the solution in xylene from which the disentangled polymer was obtained [120]. Reproduced with permission: 2019, Elsevier.

Figure 11.
(a) Heat flow measured by DSC during the cooling of differently entangled PEOs and (b) progress of crystallization over time during cooling at a rate of 10 °C/min. PEOi—entangled polymer; PEO 1% and PEO 0.5% mean polymer dissolved in 1 and 0.5 wt.% aqueous solution, respectively [67]. Reproduced with permission: 2020, Elsevier.
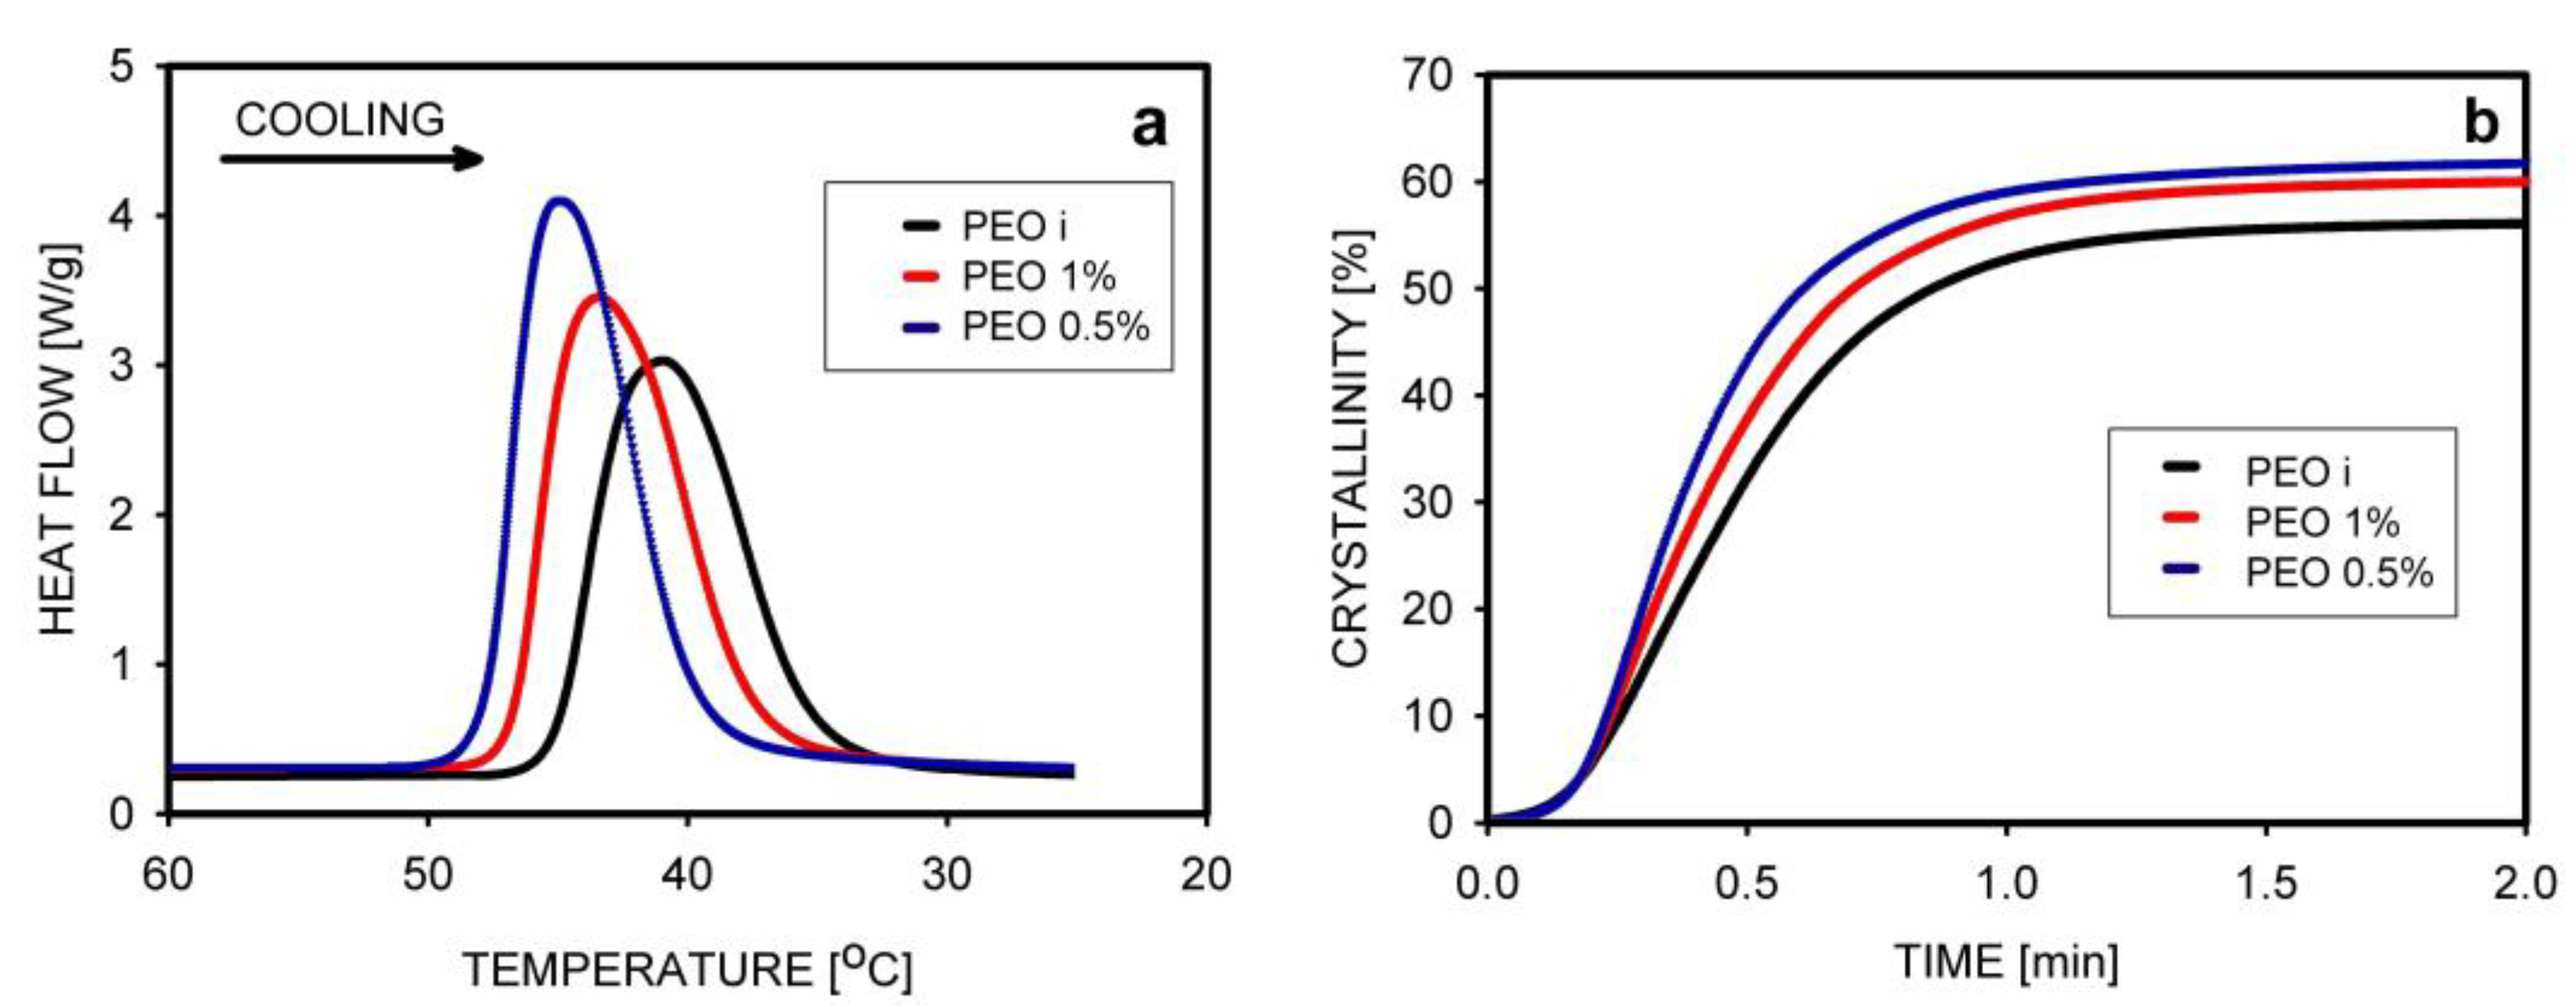
Figure 12.
(a) Non-isothermal crystallization of the PLLA/PDLA mixture obtained from solutions of different concentrations. A bulk, entangled sample is also shown for comparison; (b) Melting of previously crystallized samples, showing the presence of homocrystals and stereocomplex crystals [106]. Reproduced with permission: 2021, American Chemical Society.
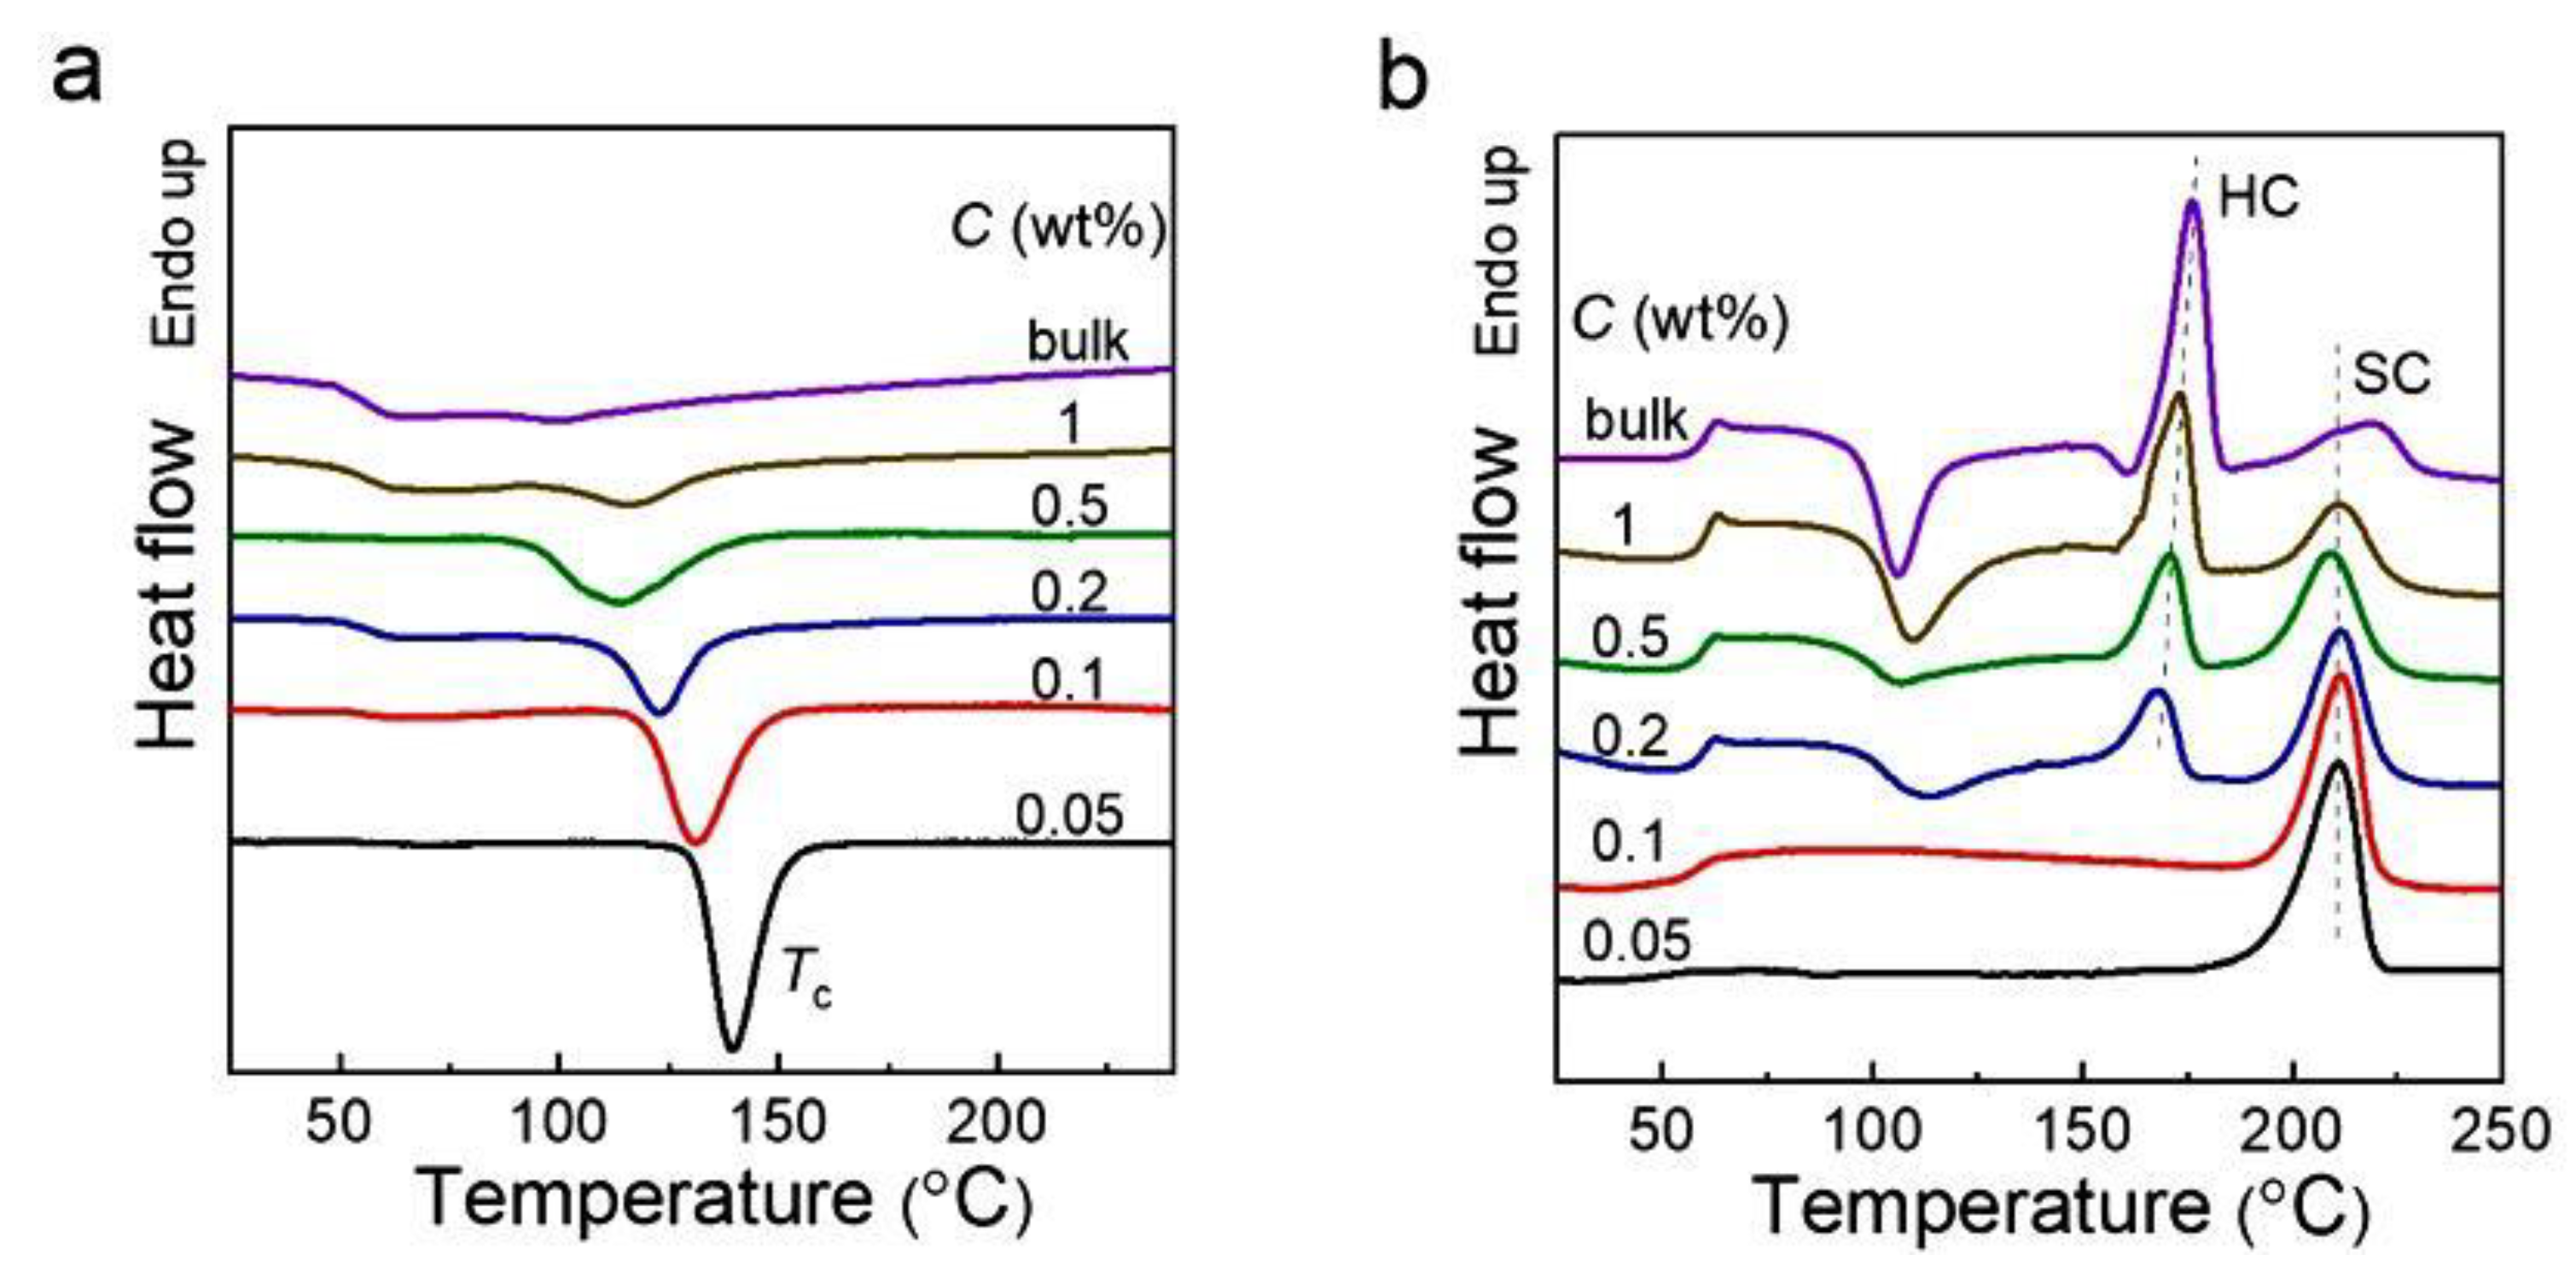
Figure 13.
Non-isothermal crystallization of PPS. PPS-0 means disentangled polymer obtained by polymerization, PPS-1 and PPS-2 are solution-disentangled polymers, PPS-3 means entangled polymer [101]. Reproduced with permission: 2023, Elsevier.
Figure 13.
Non-isothermal crystallization of PPS. PPS-0 means disentangled polymer obtained by polymerization, PPS-1 and PPS-2 are solution-disentangled polymers, PPS-3 means entangled polymer [101]. Reproduced with permission: 2023, Elsevier.
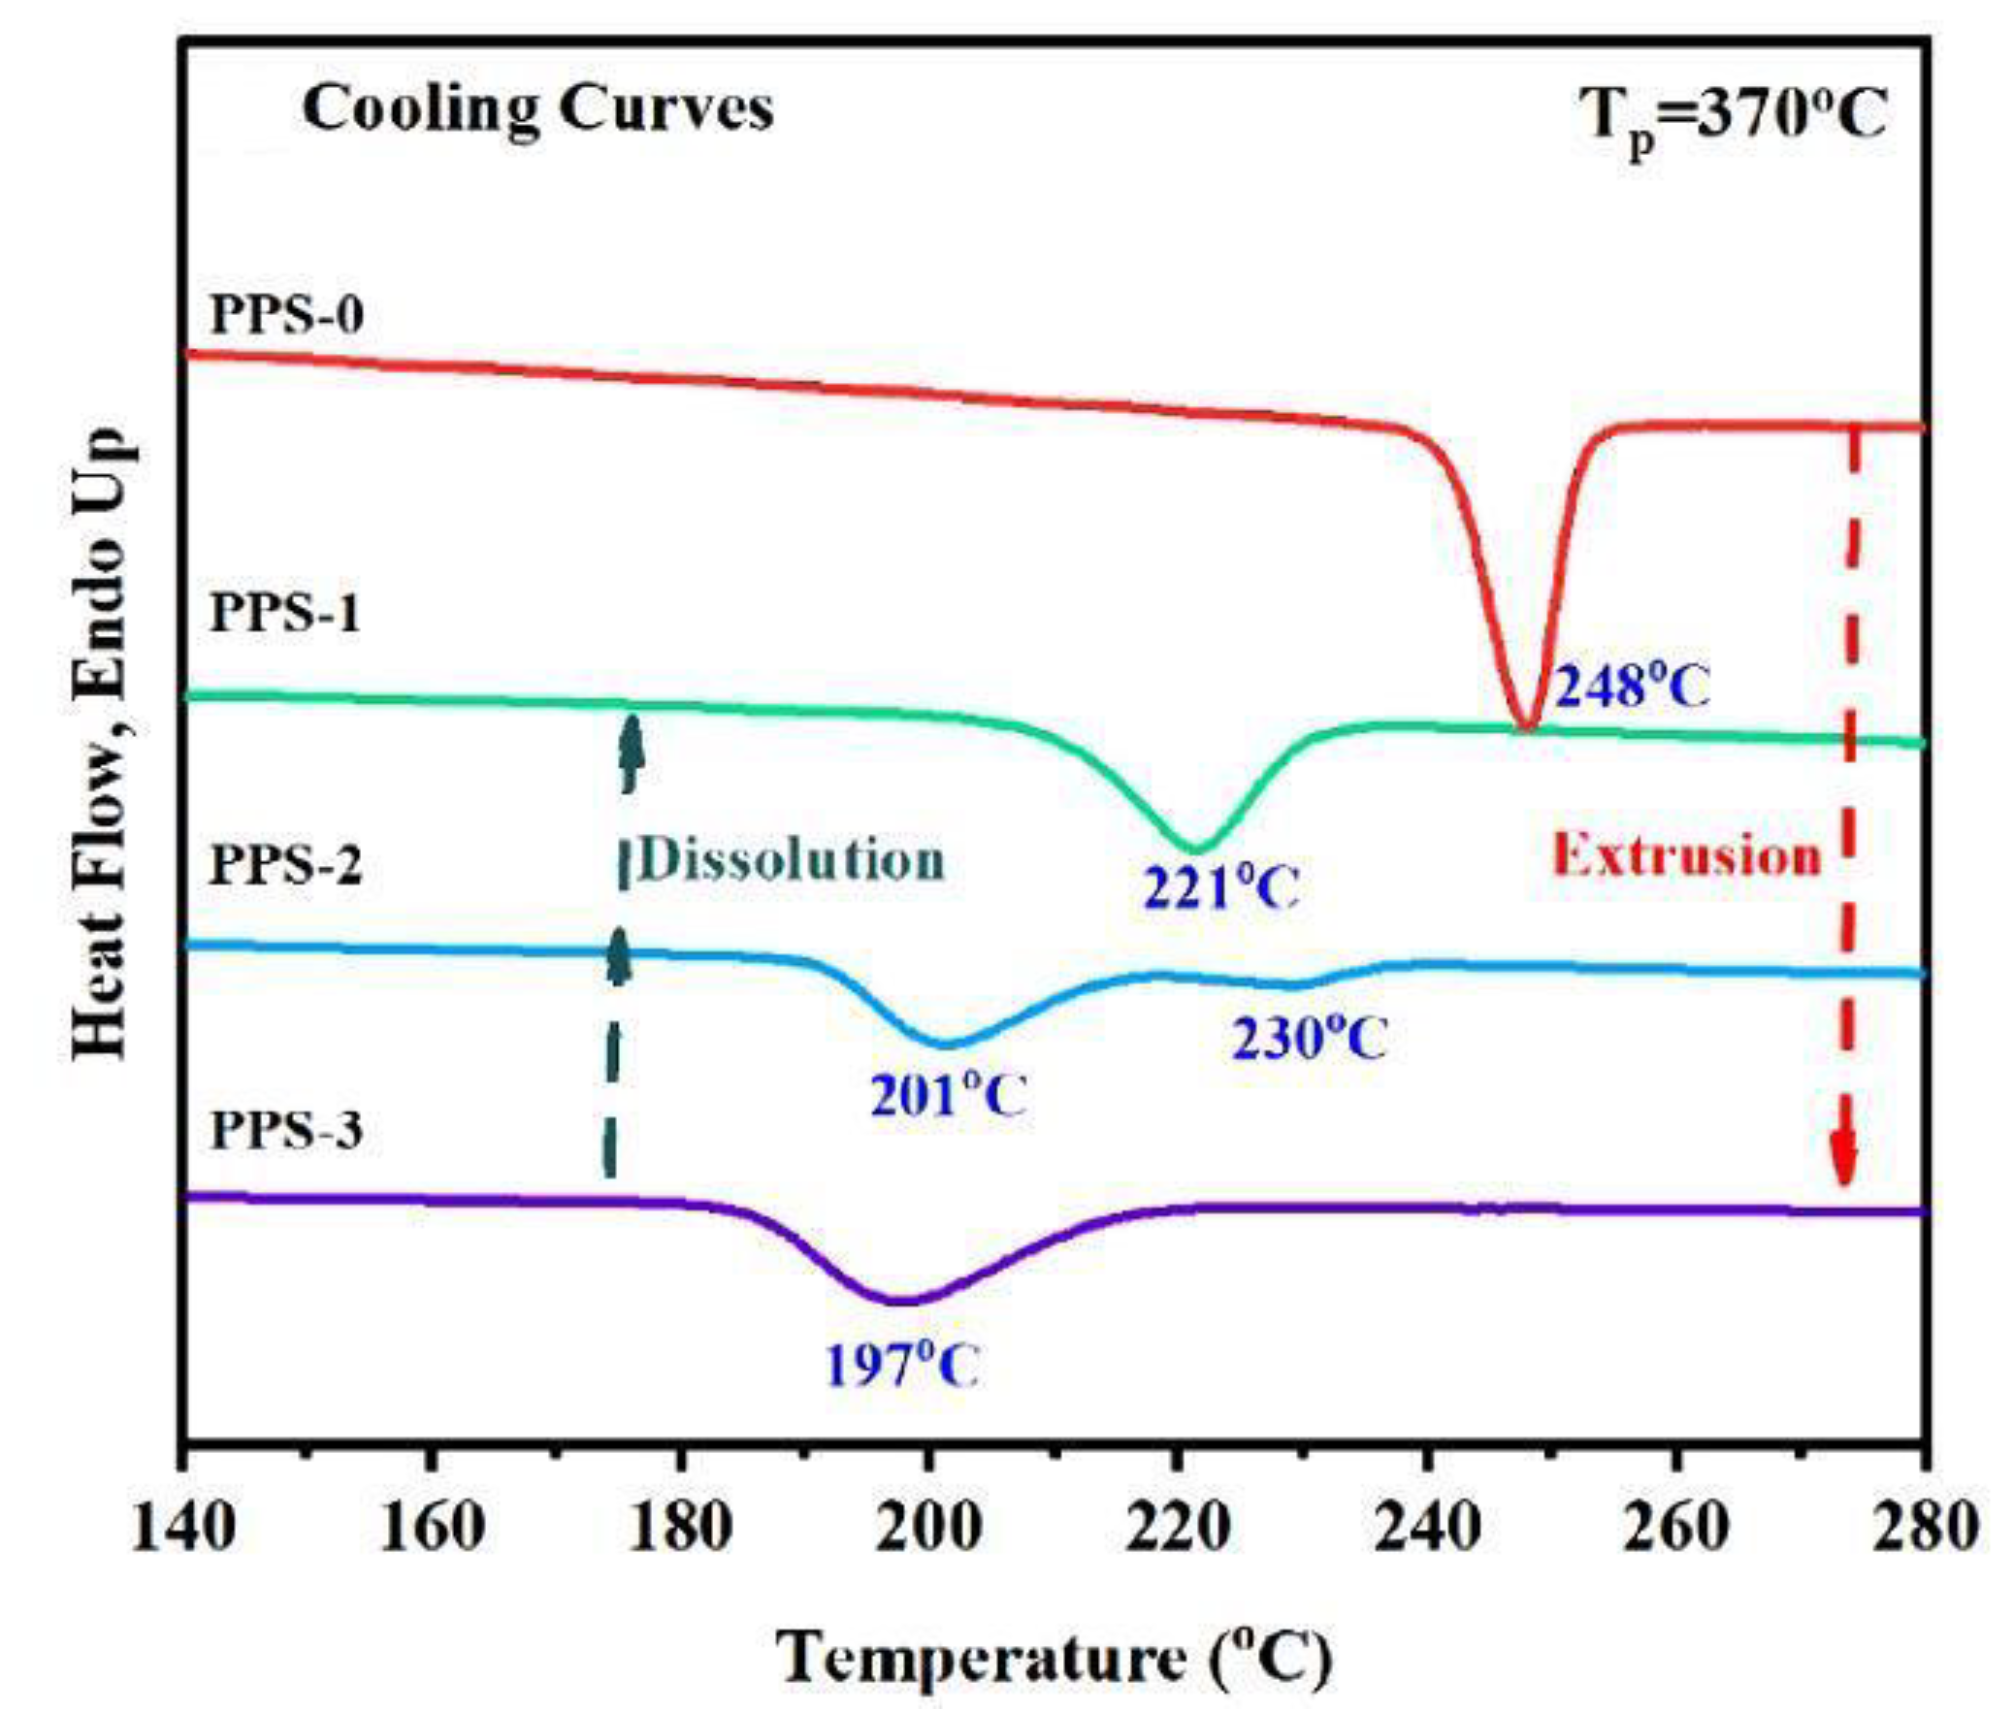
Figure 14.
(a) DSC curves for cooling PLA at rate of 3 °C/min, showing crystallization peaks; (b) Change in the crystallinity as a function of time [125]. Reproduced with permission: 2023, American Chemical Society.
Figure 14.
(a) DSC curves for cooling PLA at rate of 3 °C/min, showing crystallization peaks; (b) Change in the crystallinity as a function of time [125]. Reproduced with permission: 2023, American Chemical Society.
Figure 15.
(a) Relative crystallinity vs. temperature for the non-isothermal crystallization of the “self-nucleated” melt of PCL/SAN blend at a cooling rate of 20 °C/min after shearing melt with rates of 0.1, 0.2, 0.4, 0.6 and 0.7 s−1; (b) Half-crystallization temperature as a function of shear time for different shear rates [126]. Reproduced with permission: 2021, American Chemical Society.

Figure 16.
(a) Conversion of the melt into a solid polymer during the non-isothermal crystallization of iPP at a rate of 10 °C/min. The numbers represent the concentration of the solution from which the disentangled PP was obtained. The letter “c” means composite. (b) Crystallization temperature for samples cooled at different cooling rates [107]. Reproduced with permission: 2022, Elsevier.
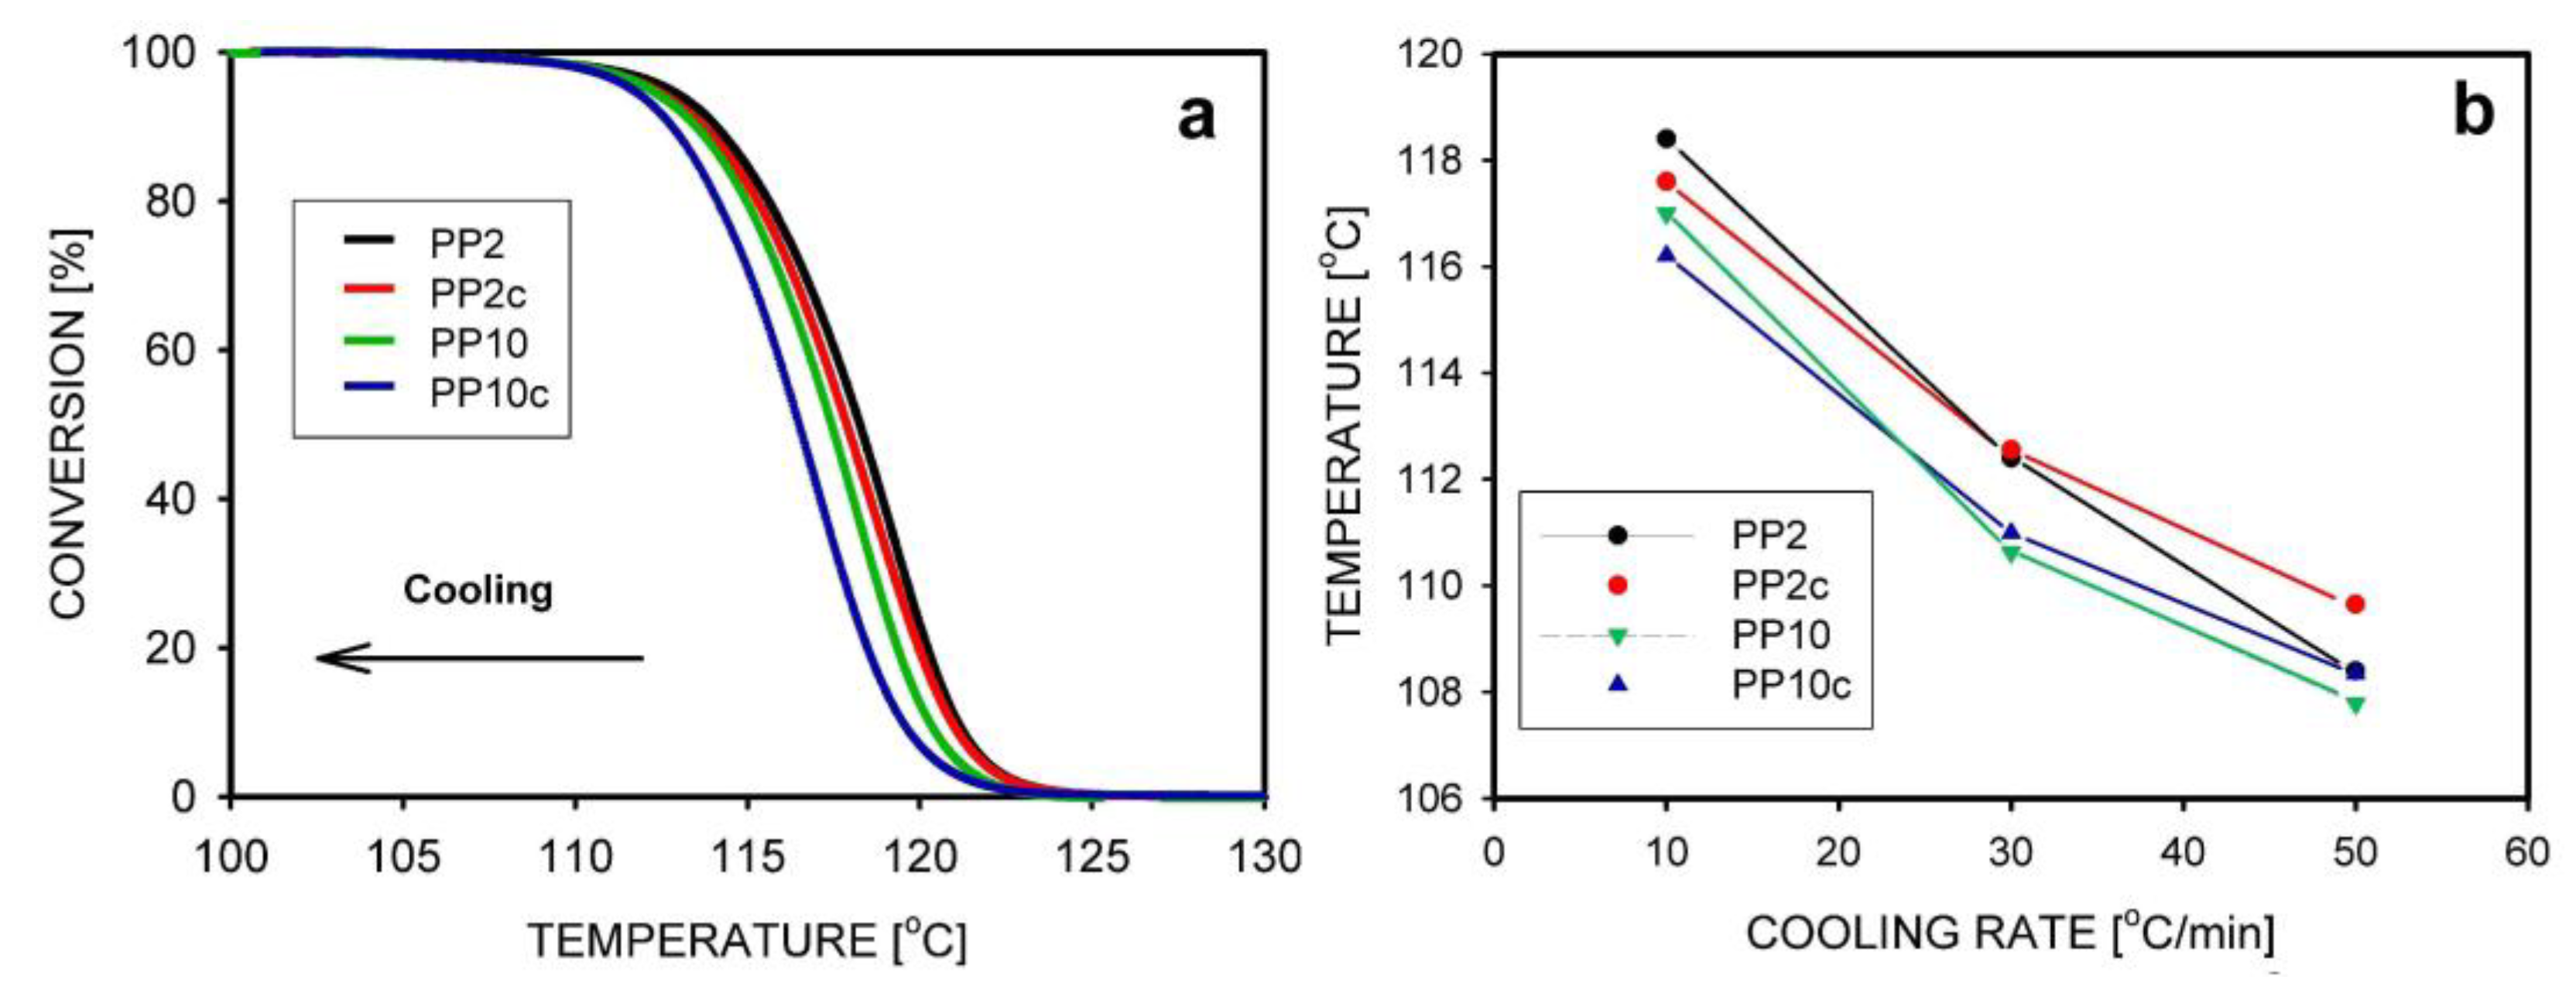
Figure 17.
The rate of crystallization
versus the concentration of sPP freeze-dried from toluene. Samples were
crystallized at temperatures: 95 °C (●), 100 °C (▲),
and 105 °C (▼) [128]. Reproduced with permission: 2001, Jon Wiley &
Sons.
Figure 17.
The rate of crystallization
versus the concentration of sPP freeze-dried from toluene. Samples were
crystallized at temperatures: 95 °C (●), 100 °C (▲),
and 105 °C (▼) [128]. Reproduced with permission: 2001, Jon Wiley &
Sons.
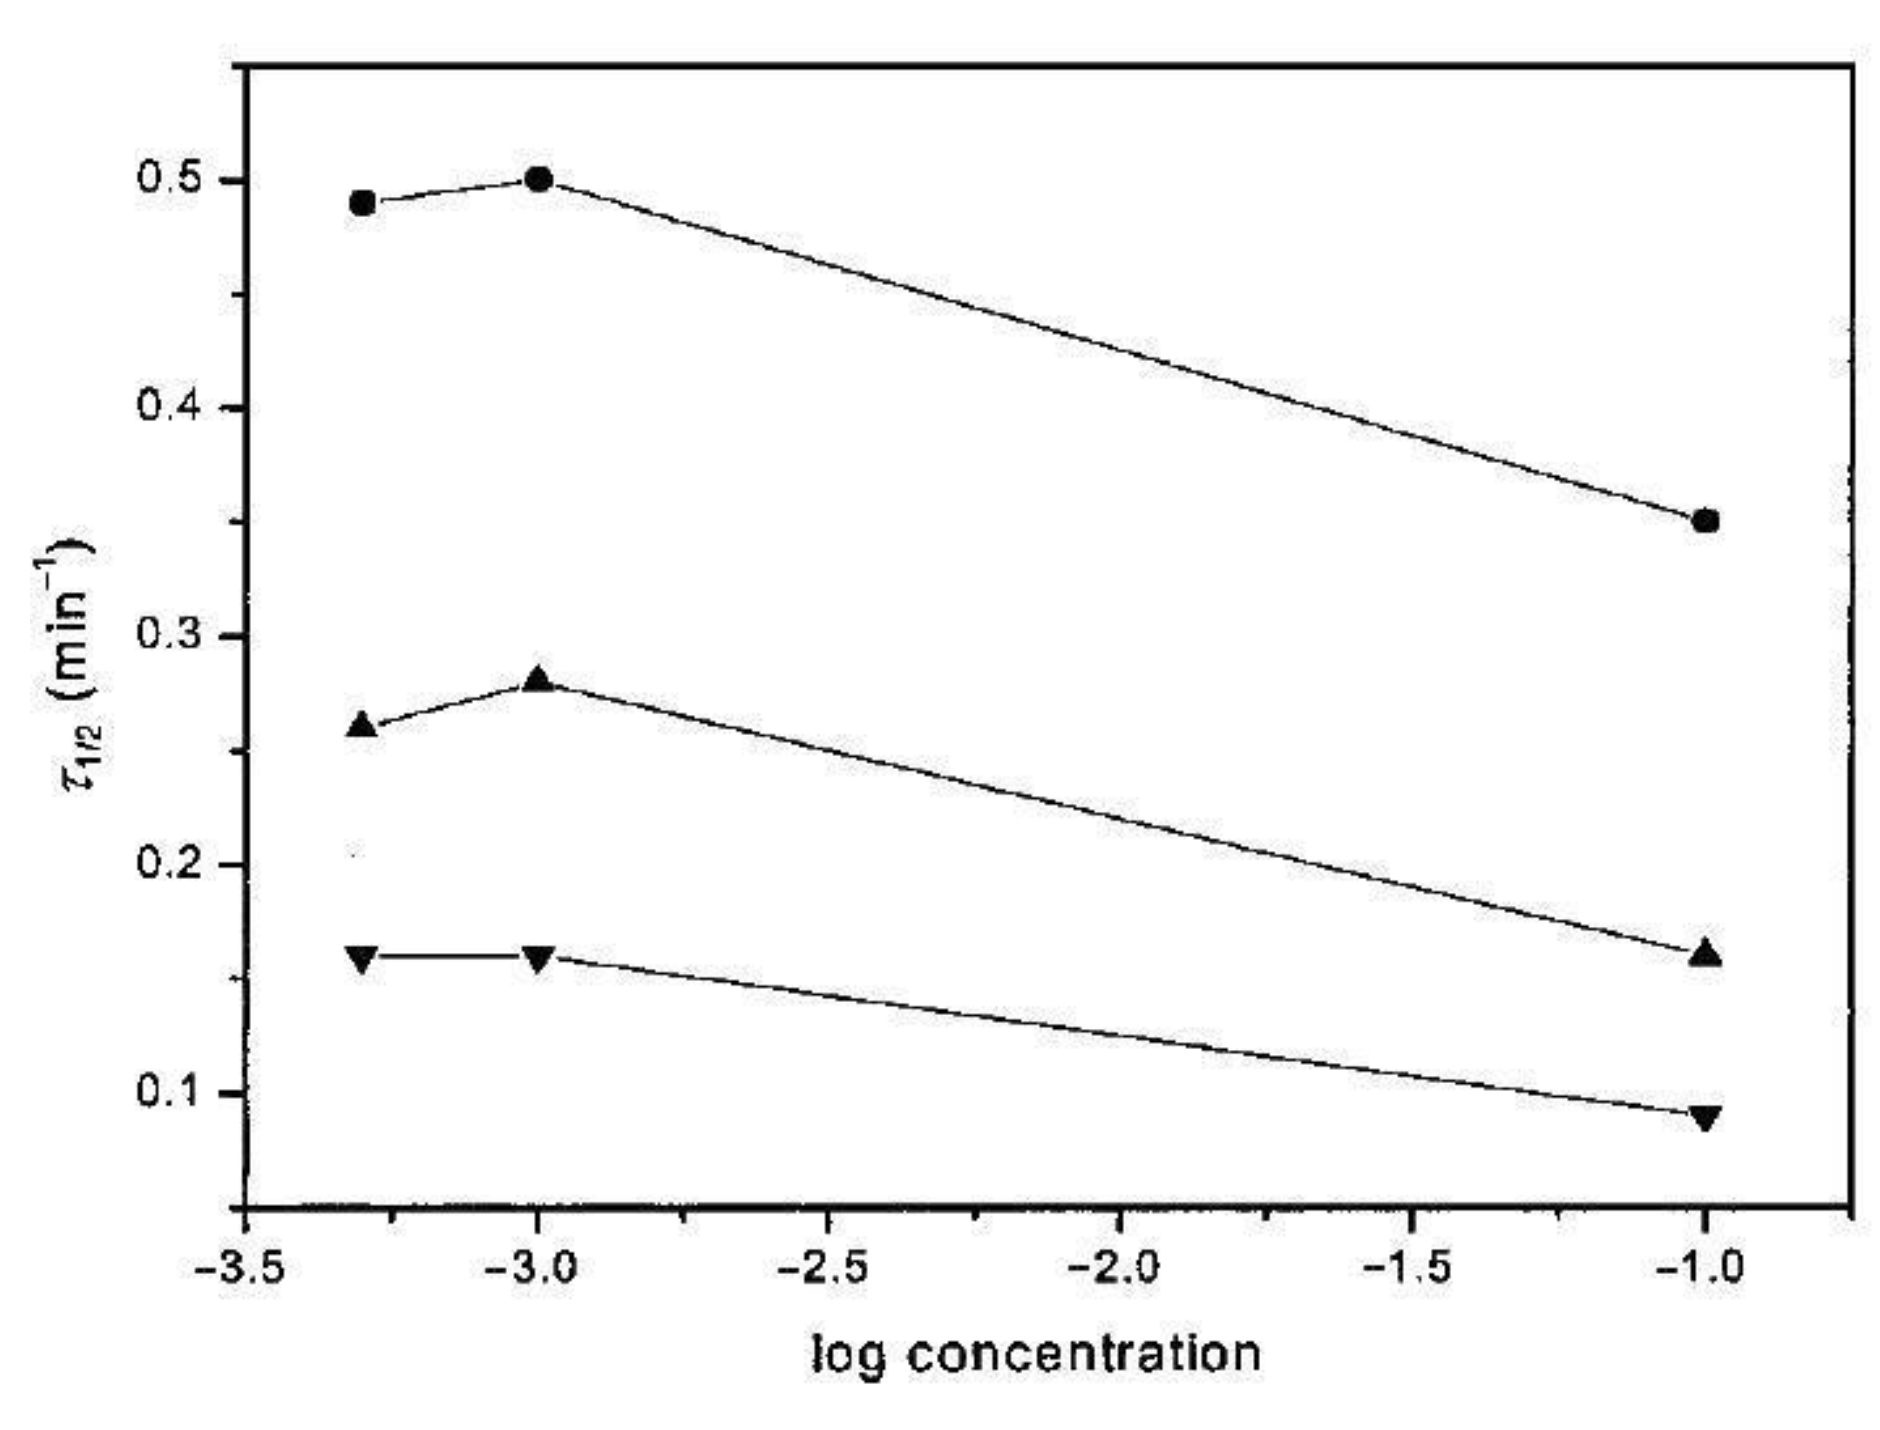
Figure 18.
Polarized light micrographs of entangled (a–c) and partially disentangled iPP melt (d–f). Isothermal crystallization at 135 °C. Increased nucleation and growth of spherulites during measurement in the disentangled polymer is visible [130]. Reproduced with permission: 2020, Elsevier.
Figure 18.
Polarized light micrographs of entangled (a–c) and partially disentangled iPP melt (d–f). Isothermal crystallization at 135 °C. Increased nucleation and growth of spherulites during measurement in the disentangled polymer is visible [130]. Reproduced with permission: 2020, Elsevier.
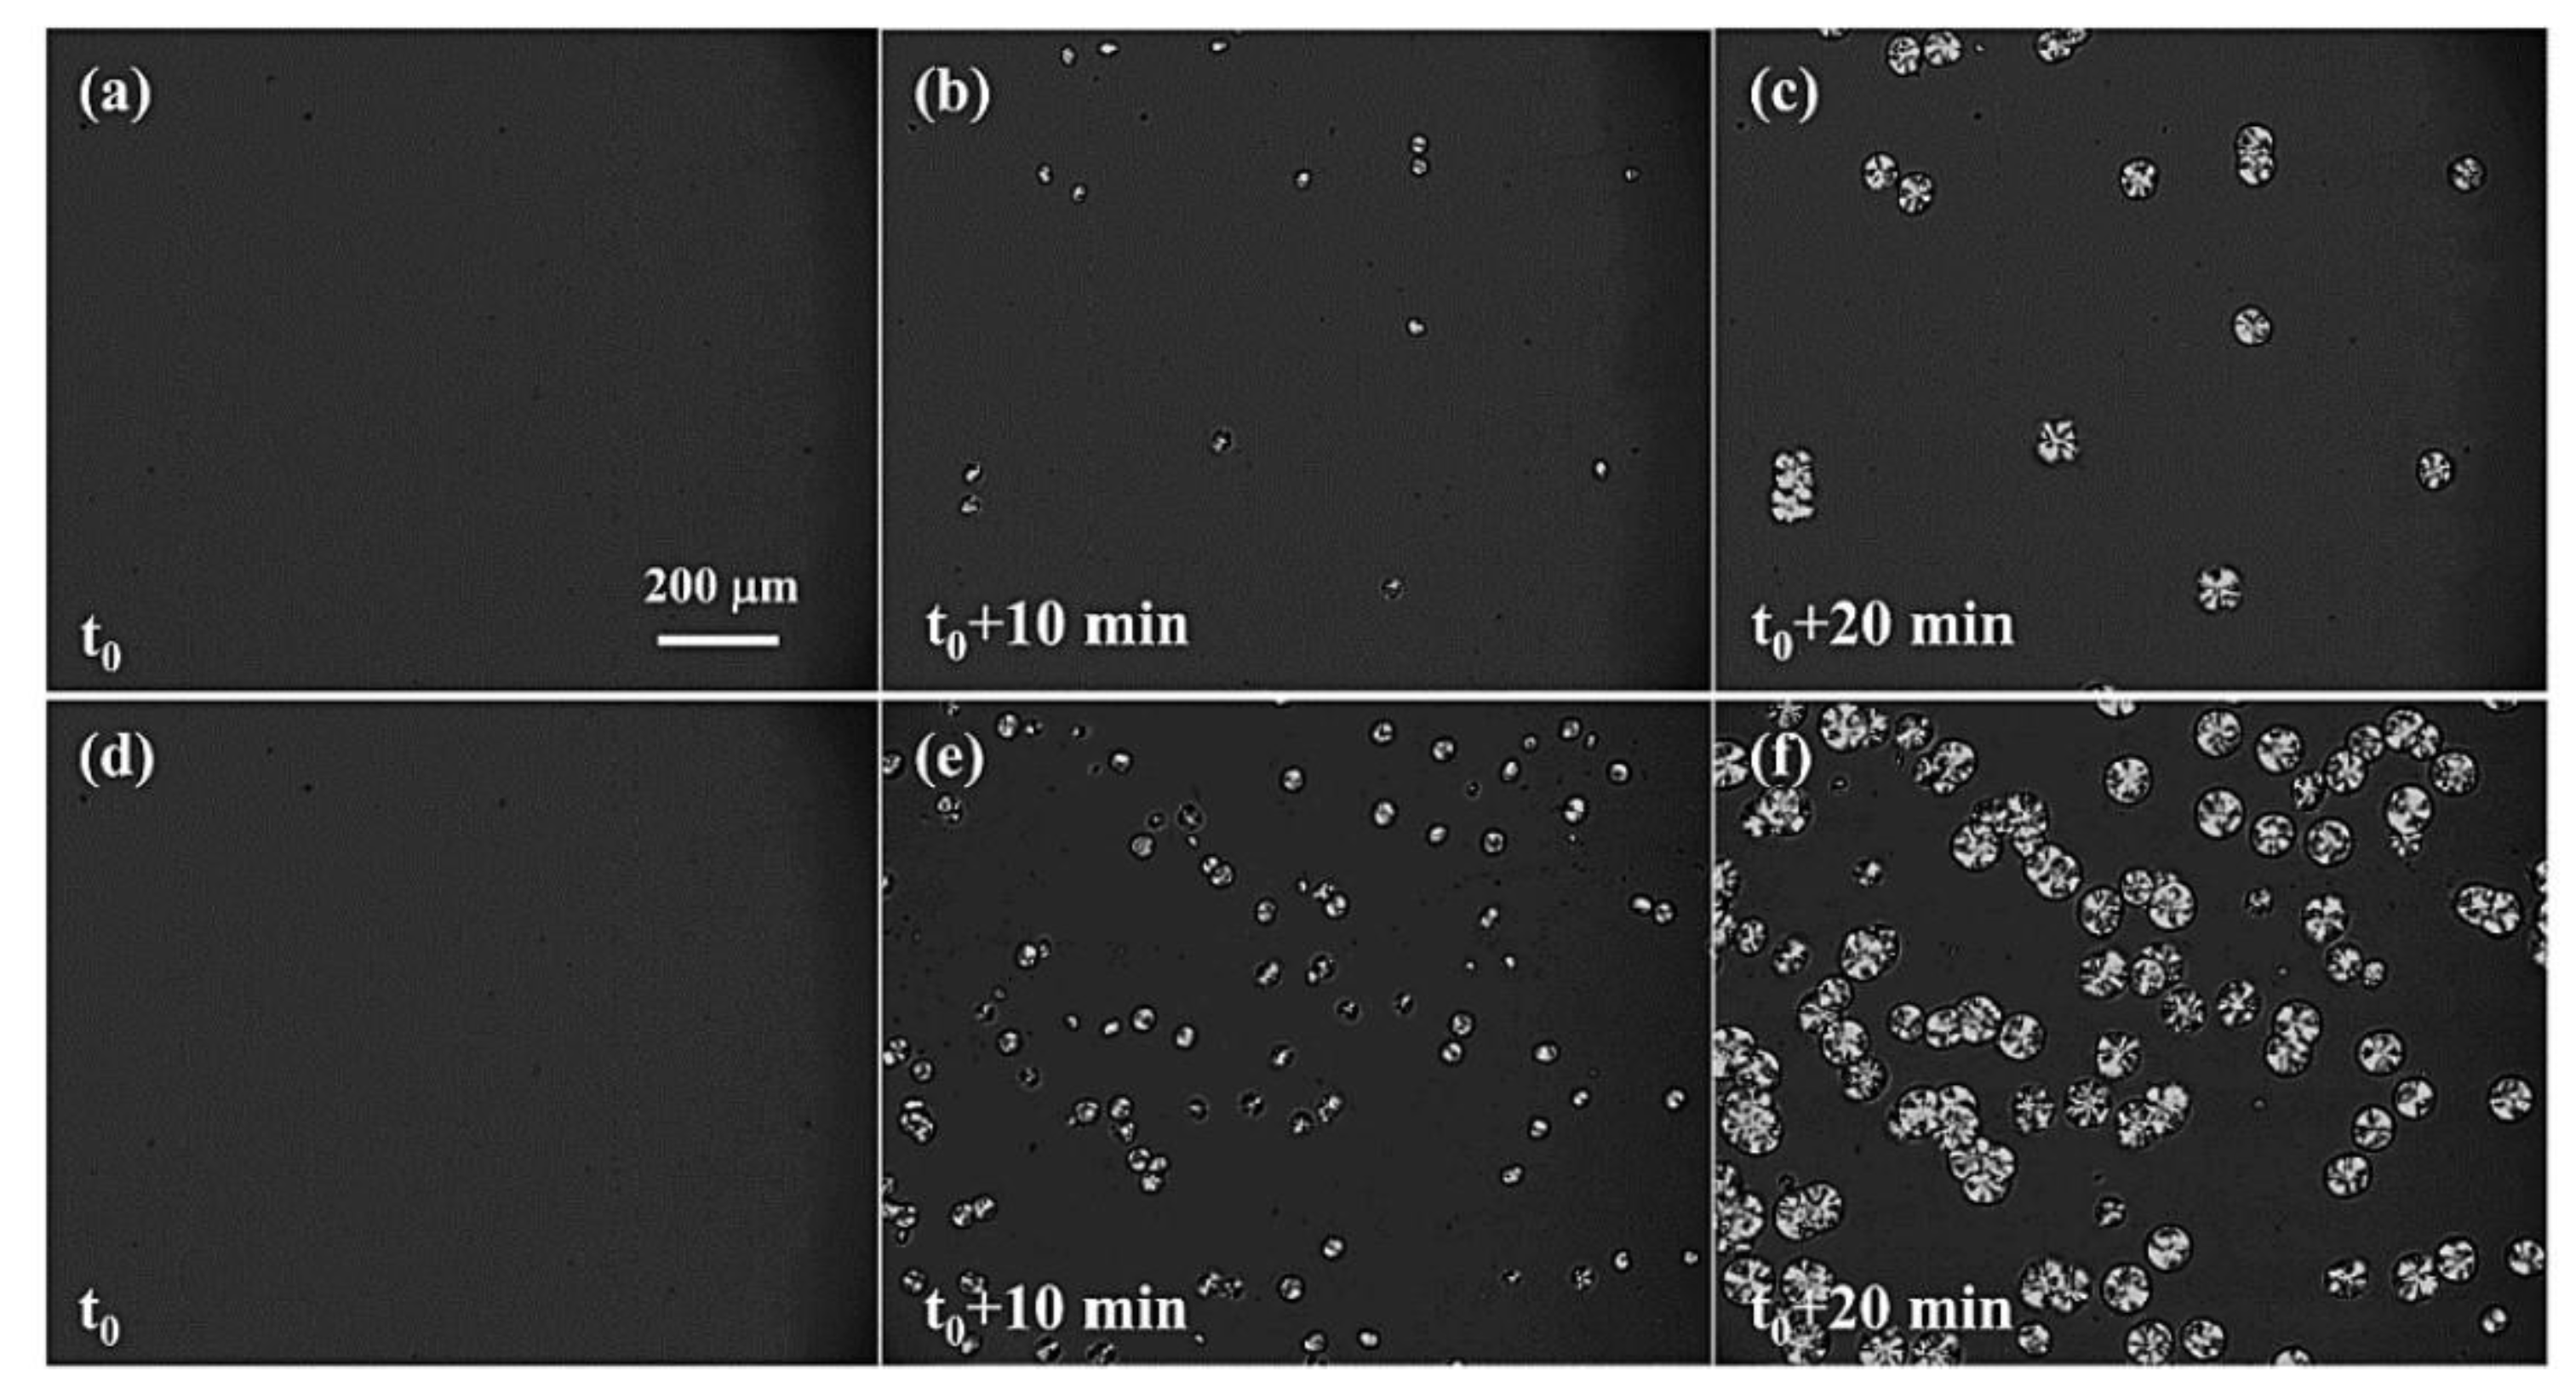
Figure 19.
Crystallization half-time of iPS as a function of crystallization temperature: ■ bulk iPS, ● polymer from 1 × 10⁻¹ wt.% solution, ▲ polymer from 1 × 10⁻² wt.% solution [32]. Reproduced with permission: 1998, American Chemical Society.
Figure 19.
Crystallization half-time of iPS as a function of crystallization temperature: ■ bulk iPS, ● polymer from 1 × 10⁻¹ wt.% solution, ▲ polymer from 1 × 10⁻² wt.% solution [32]. Reproduced with permission: 1998, American Chemical Society.
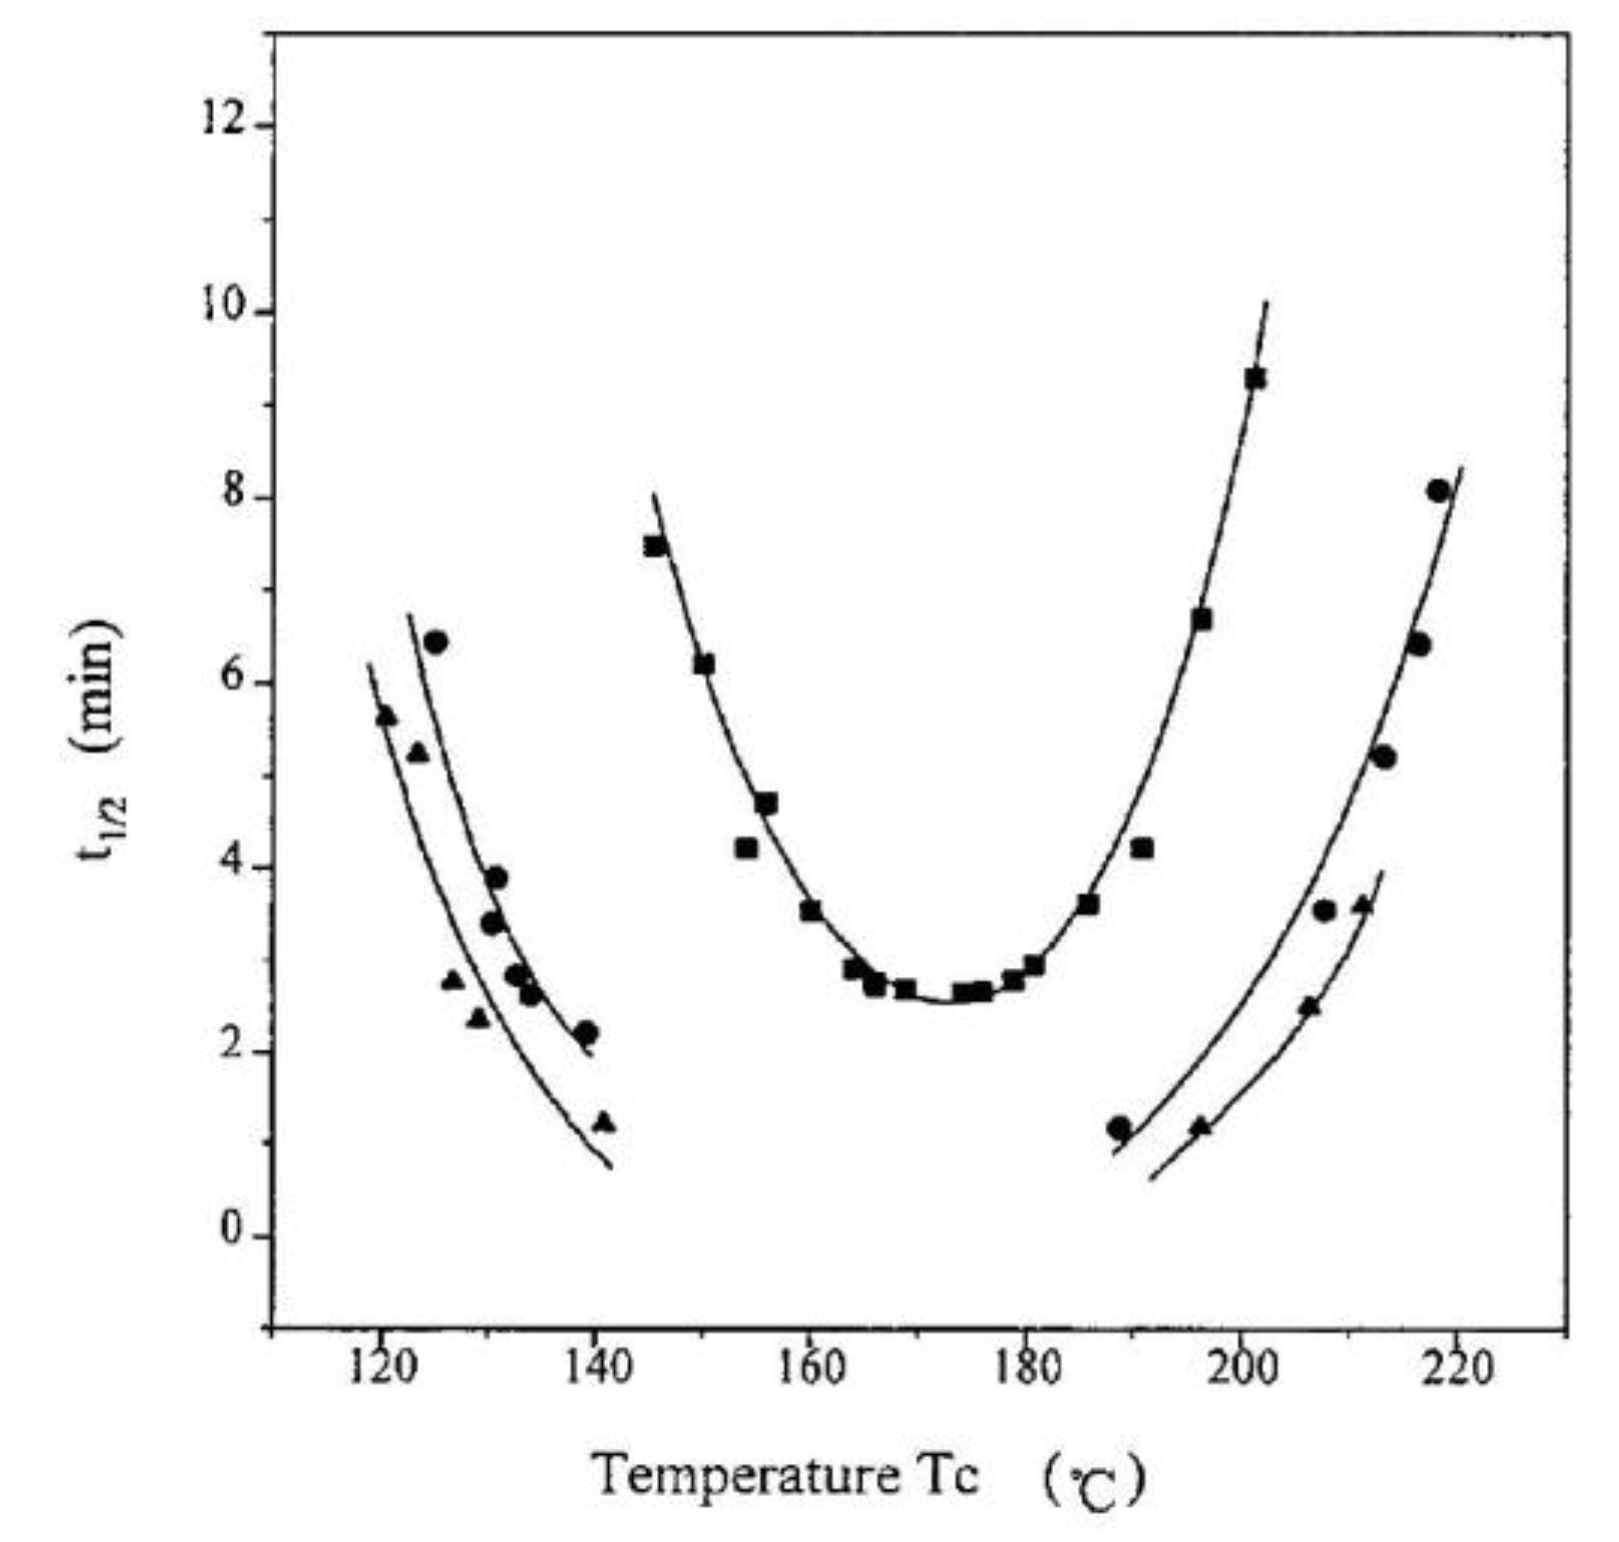
Figure 20.
Half-time of isothermal crystallization of form II of PB at 90 °C [124]. Reproduced with permission: 2022, American Chemical Society.
Figure 20.
Half-time of isothermal crystallization of form II of PB at 90 °C [124]. Reproduced with permission: 2022, American Chemical Society.

Figure 21.
Growth rates of iPP spherulites crystallized isothermally at temperatures of 132–139 °C [30]. Reproduced with permission: 2009, Elsevier.
Figure 21.
Growth rates of iPP spherulites crystallized isothermally at temperatures of 132–139 °C [30]. Reproduced with permission: 2009, Elsevier.
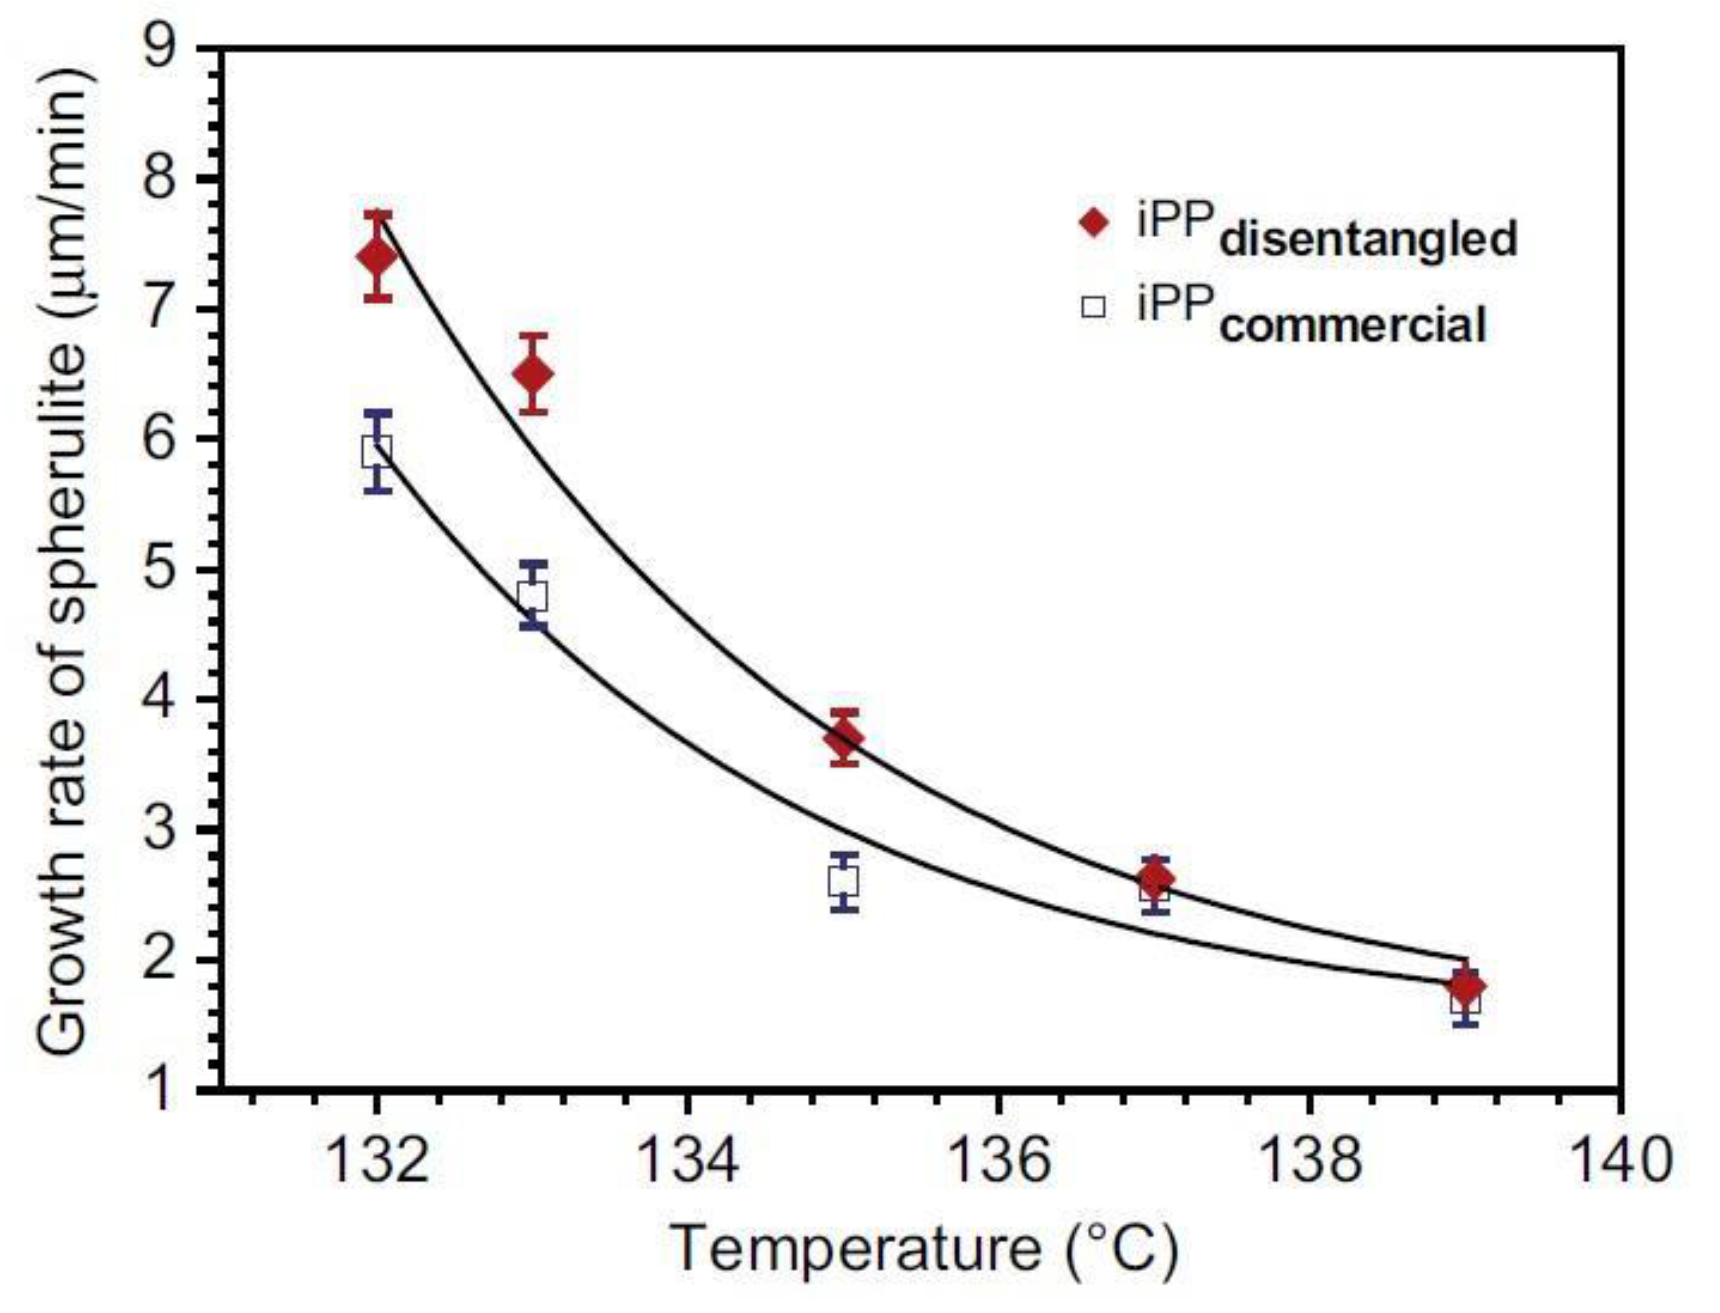
Figure 22.
PLM images collected after crystallization of a PLLA/PDLA blend at 180 °C for 10 min (scale bar: 50 μm). The number indicates the concentration of solution (in wt.%) from which disentangled polylactide was obtained [106]. Reproduced with permission: 2021, American Chemical Society.
Figure 22.
PLM images collected after crystallization of a PLLA/PDLA blend at 180 °C for 10 min (scale bar: 50 μm). The number indicates the concentration of solution (in wt.%) from which disentangled polylactide was obtained [106]. Reproduced with permission: 2021, American Chemical Society.
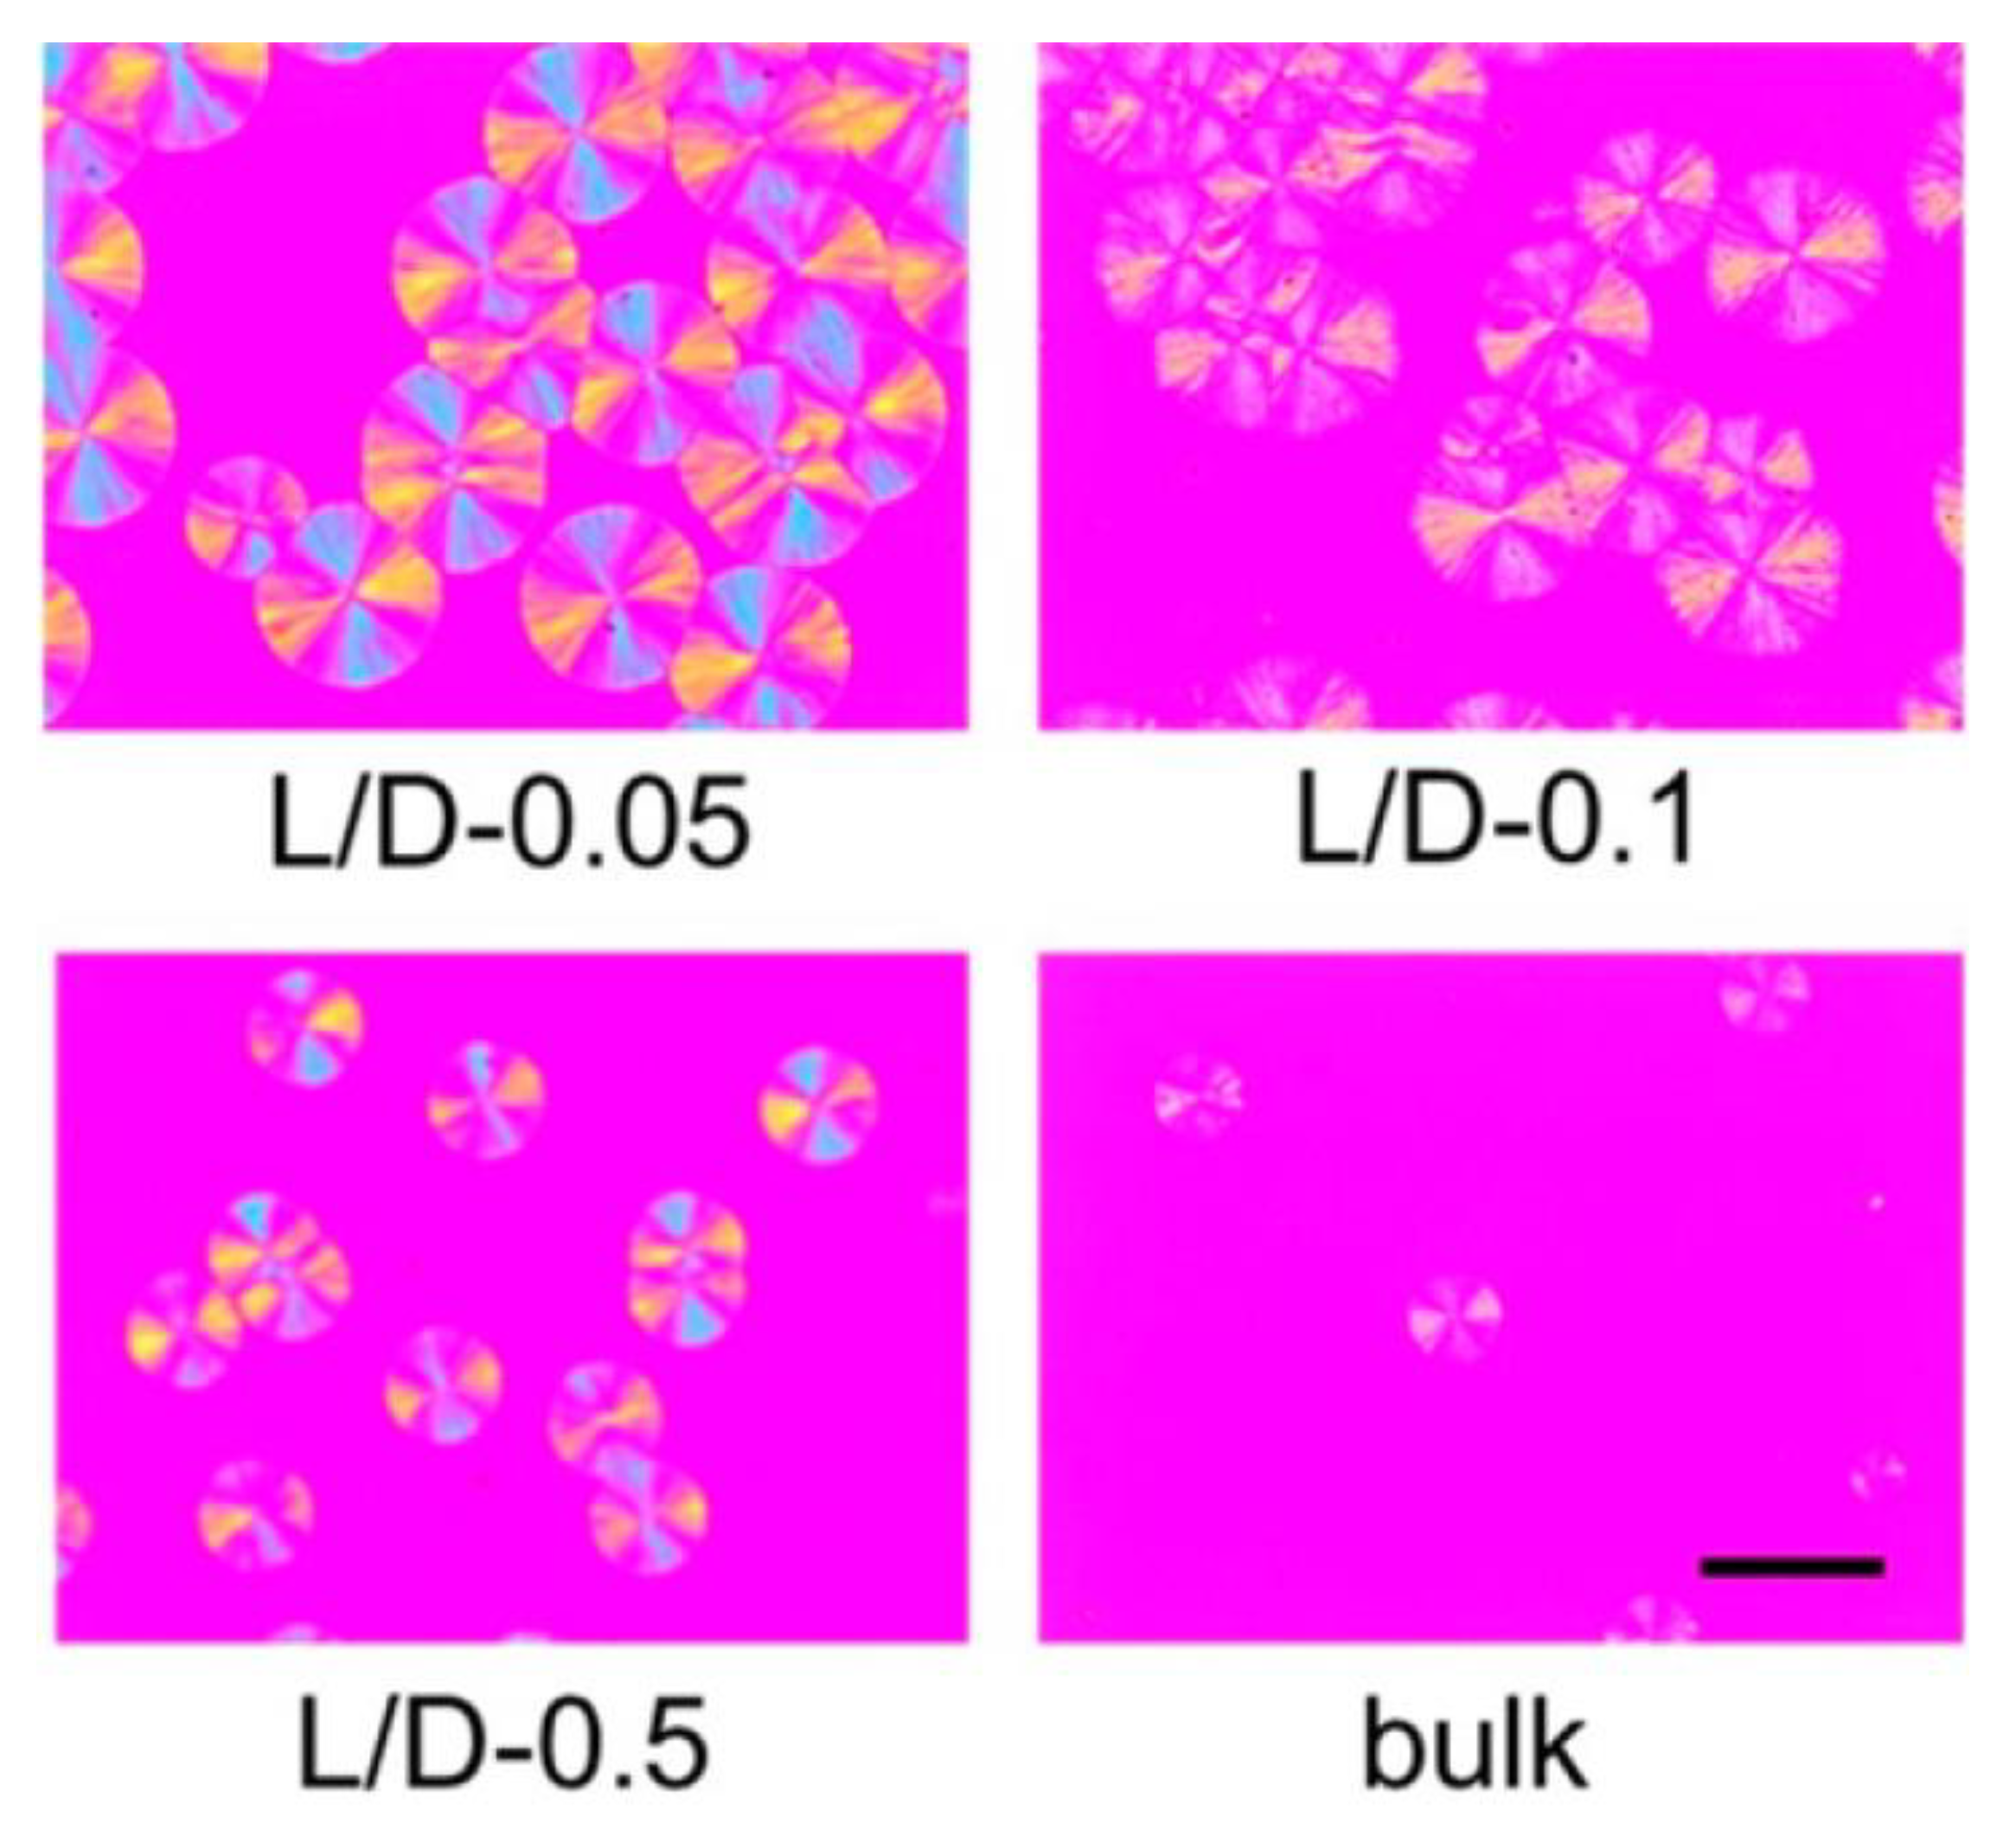
Figure 23.
(a) The dependence log G + ΔE/[2.3 R(Tc − T∞)] versus 1/(TcΔT) drawn for PPi, PPo, and PPx, where PPi means the initial, entangled polymer, PPo and PPx means partially disentangled polymers, prepared from 2 wt% solution in hot mineral oil or xylene, respectively. The curves were shifted vertically for clarity. The temperatures of transition between regime II (on right side) and regime III (on left side) are determined [119]. Reproduced with permission: 2017, Wiley & Sons; (b) The location of the transition temperature from regime I to regime II for PEO. PEOi—entangled polymer, PEO 1%—disentangled polymer obtained from a solution with a concentration of 1% by weight, PEO 0.5%—more-disentangled polymer obtained from a solution with a concentration of 0.5% by weight [67]. Reproduced with permission: 2020, Elsevier.
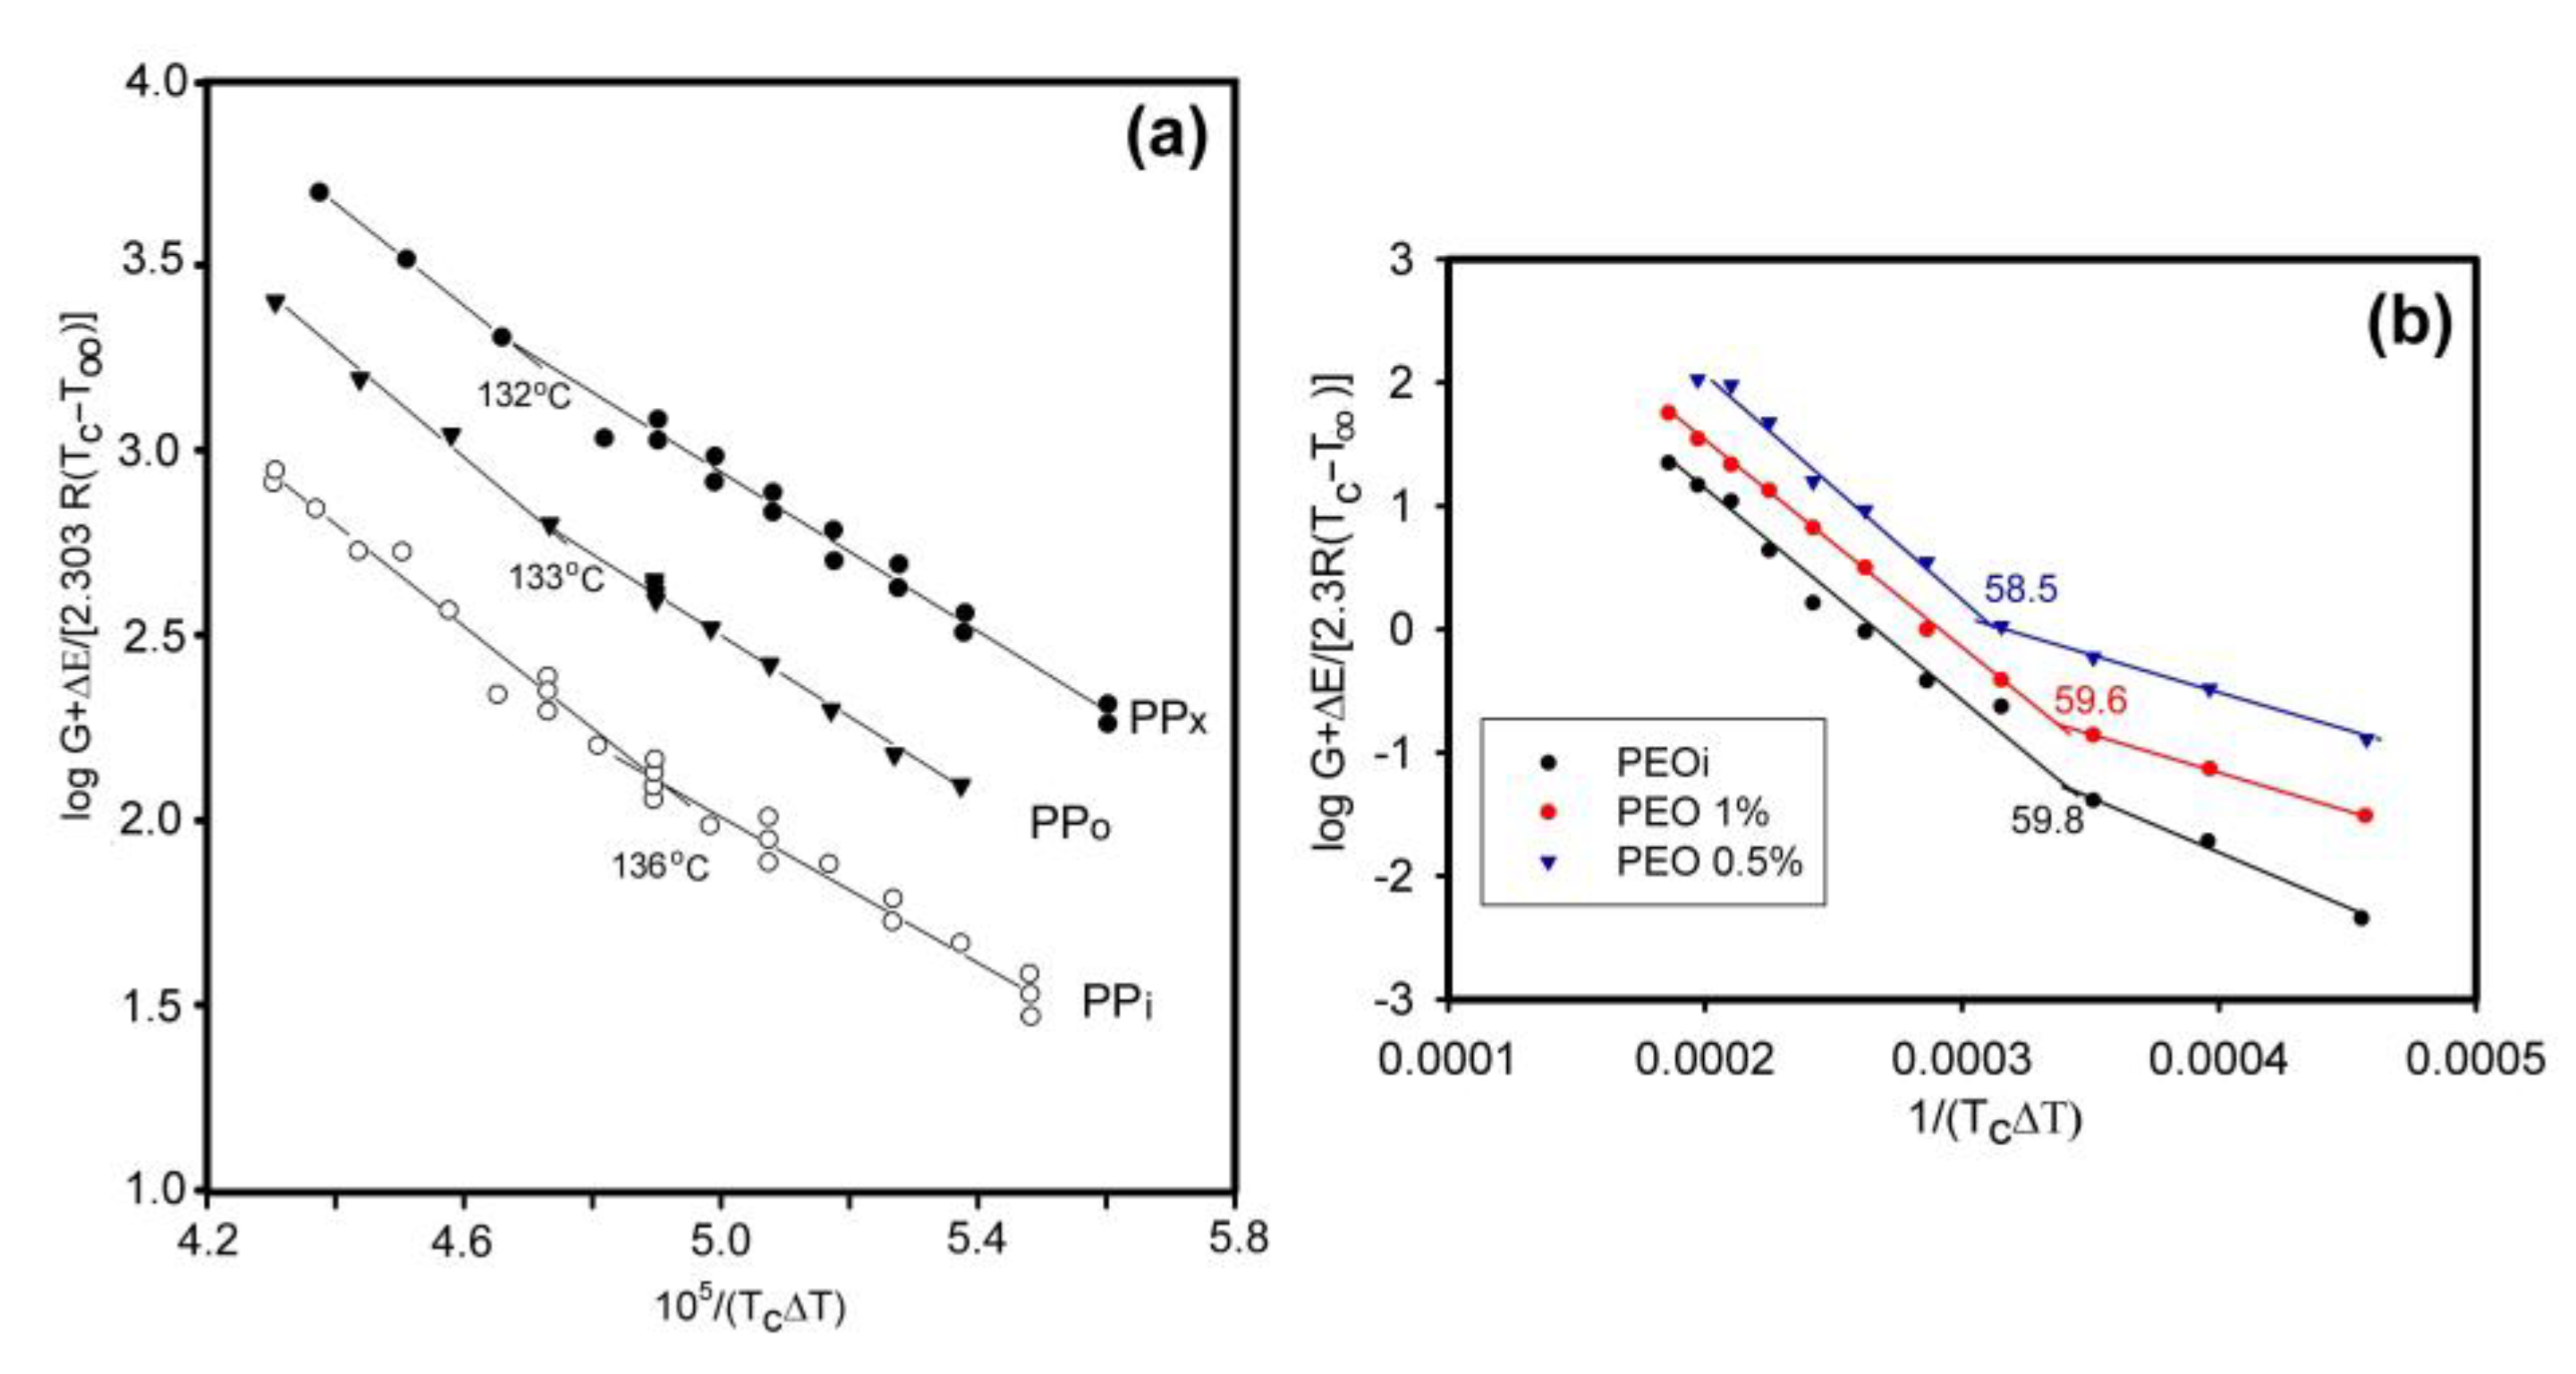
Figure 24.
The isothermal crystallization of entangled and partially disentangled iPP at 138 °C: (a) entangled iPP at the moment of closing the weak-spot; (b) the final structure formed in the entangled polymer; (c) the final structure of the disentangled iPP [119]. Reproduced with permission: 2017, Wiley & Sons.
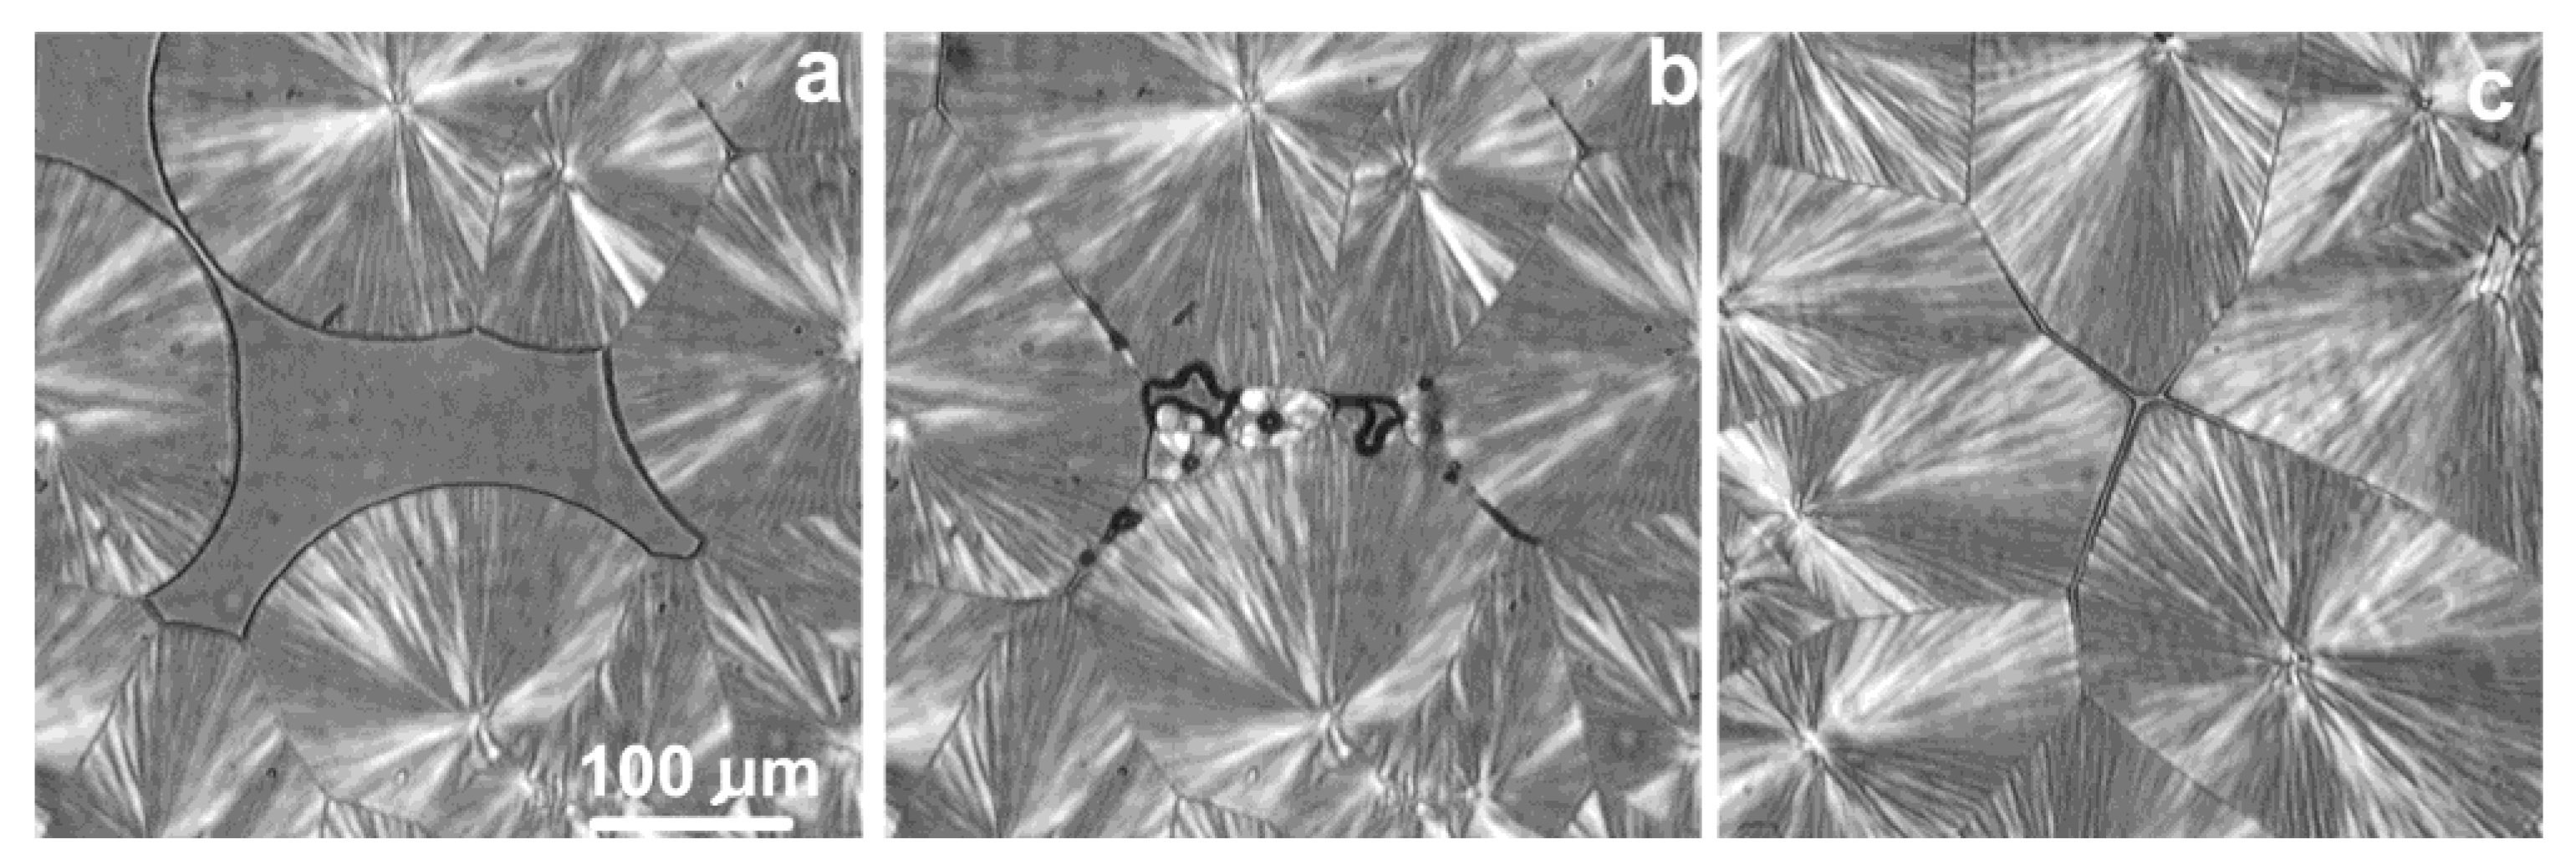
Figure 25.
Determination of the equilibrium melting temperature for PEO. PEOi—entangled polymer, PEO 1%—disentangled polymer obtained from a solution with a concentration of 1% by weight, PEO 0.5%—more-disentangled polymer obtained from a solution with a concentration of 0.5% by weight [67]. Reproduced with permission: 2020, Elsevier.
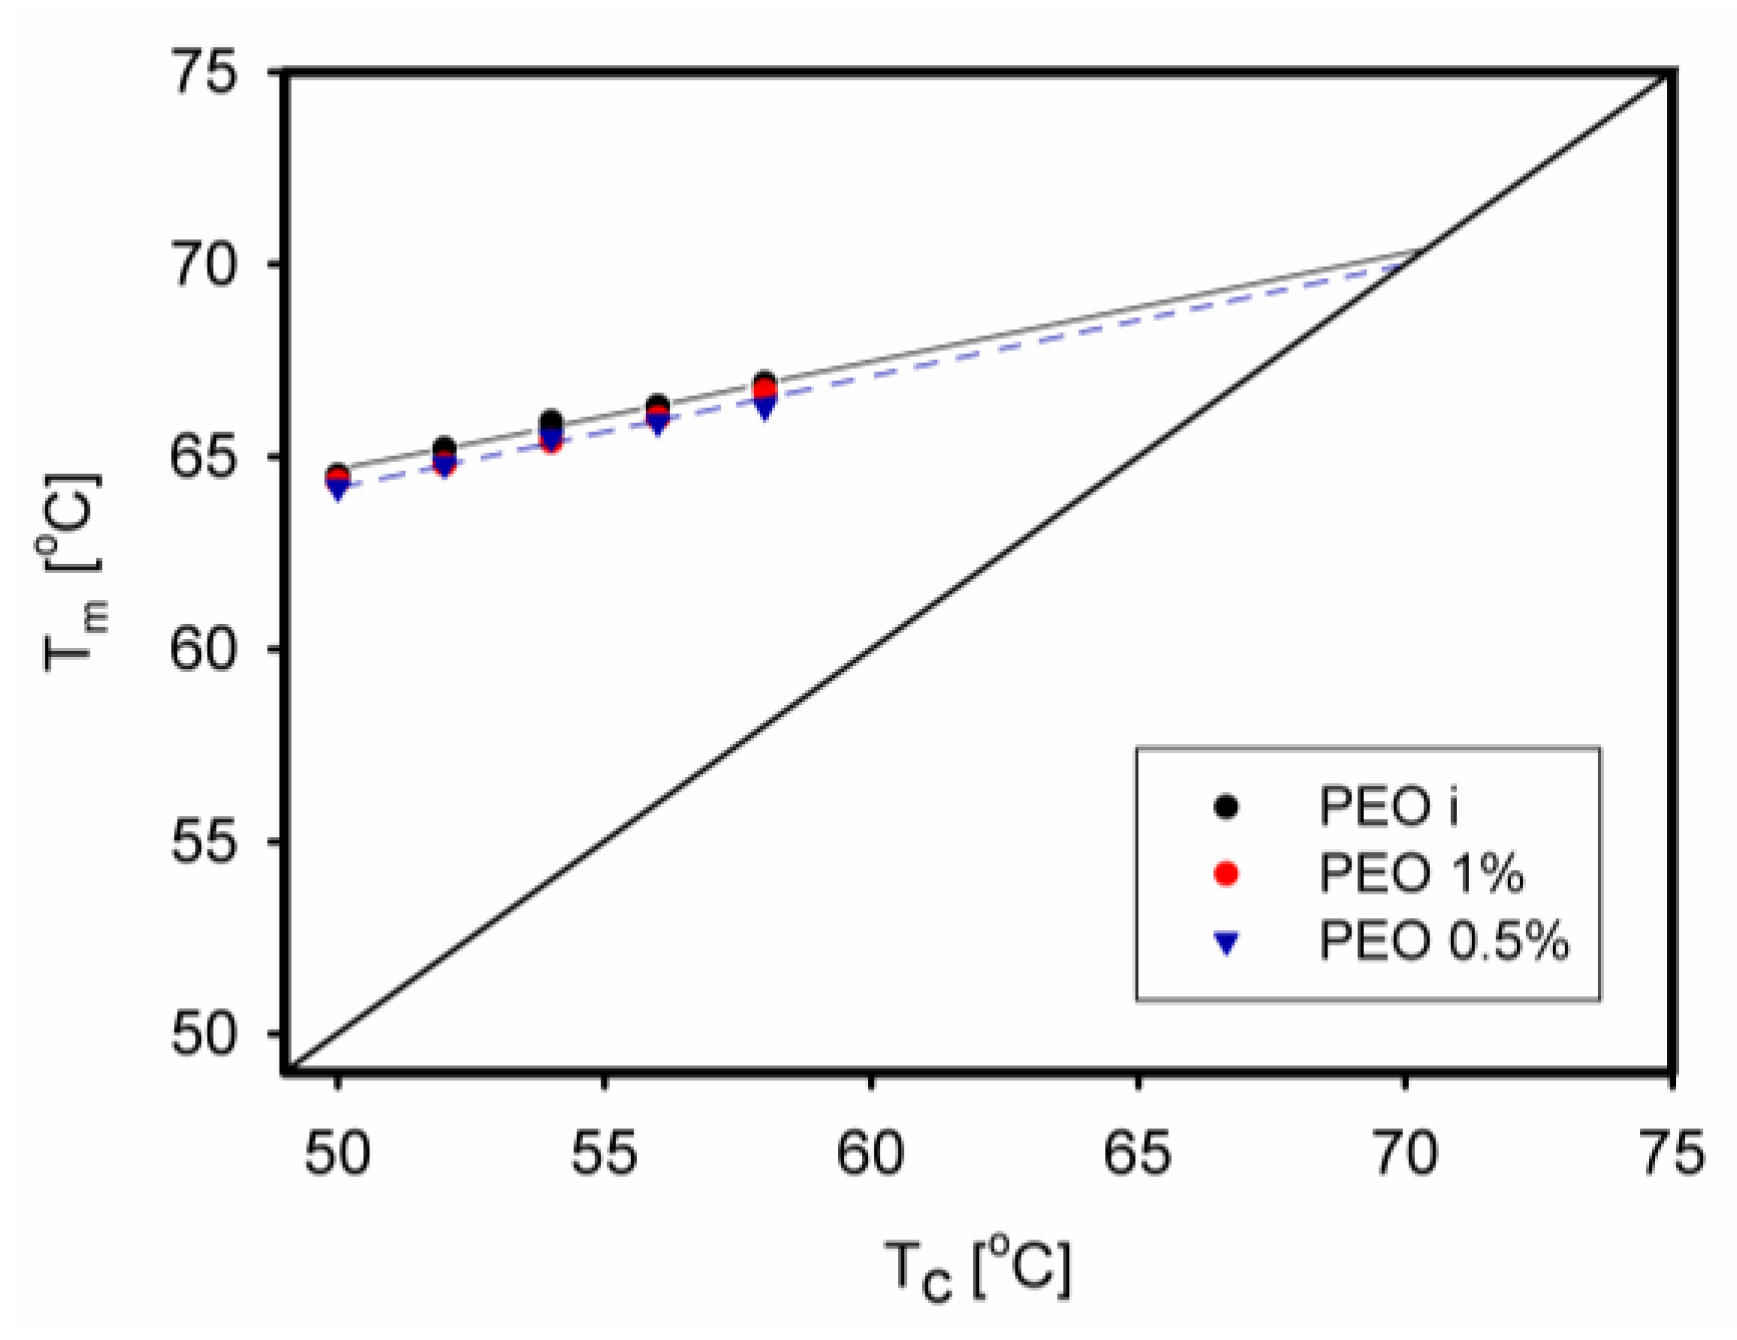
Figure 26.
Dependence of crystallinity on concentration in solution for iPMMA freeze-extracted from dioxane (left) and iPMMA freeze-extracted from PEG (right). Measurements were performed for unannealed samples and for samples after annealing at 120 °C for 10 h [29]. Reproduced with permission: 2004, American Chemical Society.
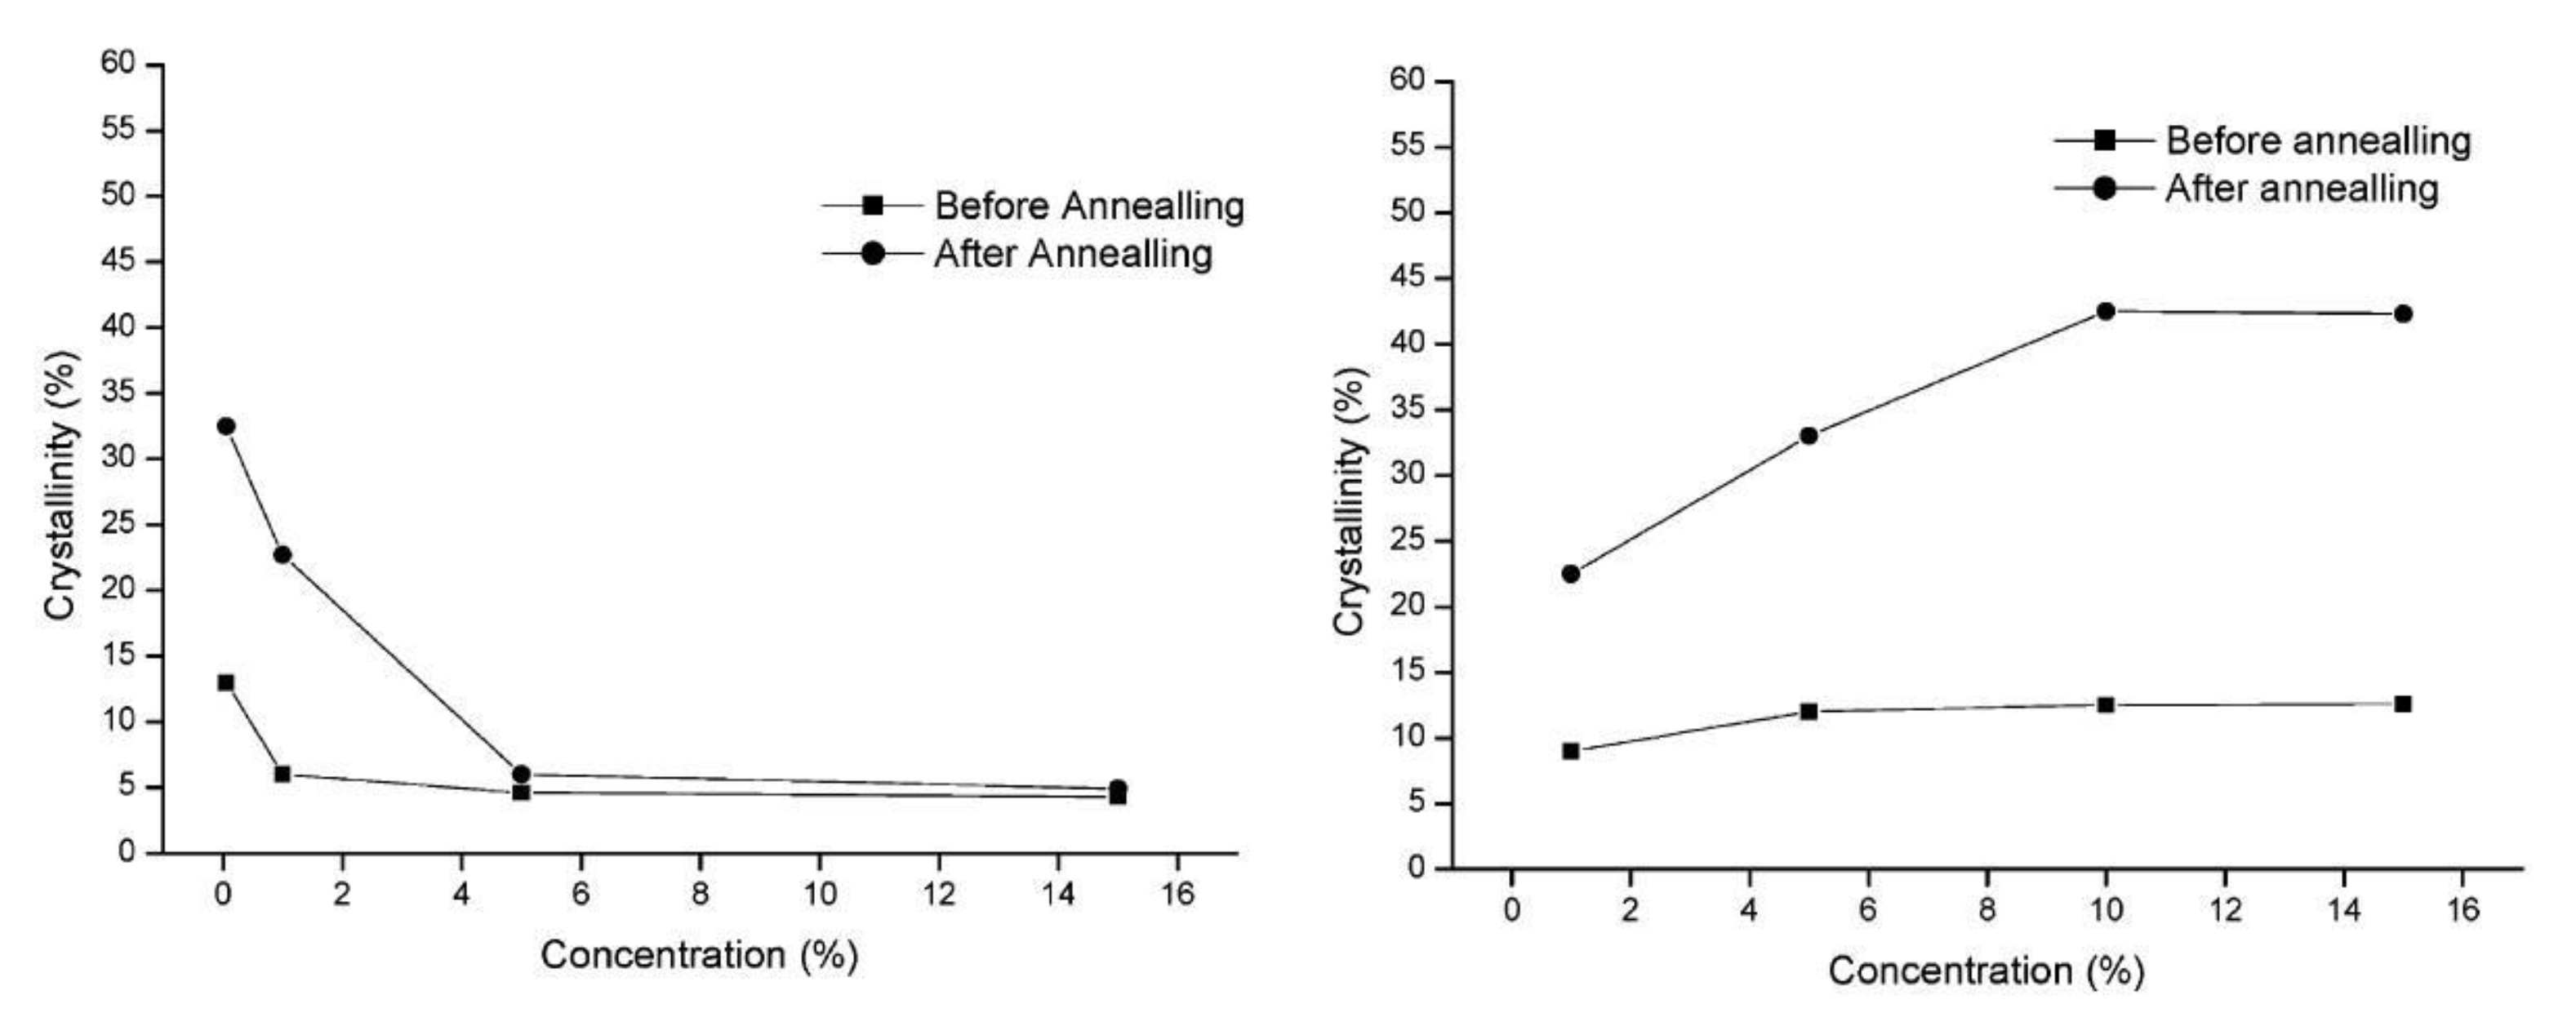
Figure 27.
Primary nucleation of PE spherulites at T = 128 °C, in function of time of annealing disentangled sample at 150 °C. The experimental data can be divided into two regions that arose from fast and slow entanglements [142]. Reproduced with permission: 2006, Elsevier.
Figure 27.
Primary nucleation of PE spherulites at T = 128 °C, in function of time of annealing disentangled sample at 150 °C. The experimental data can be divided into two regions that arose from fast and slow entanglements [142]. Reproduced with permission: 2006, Elsevier.
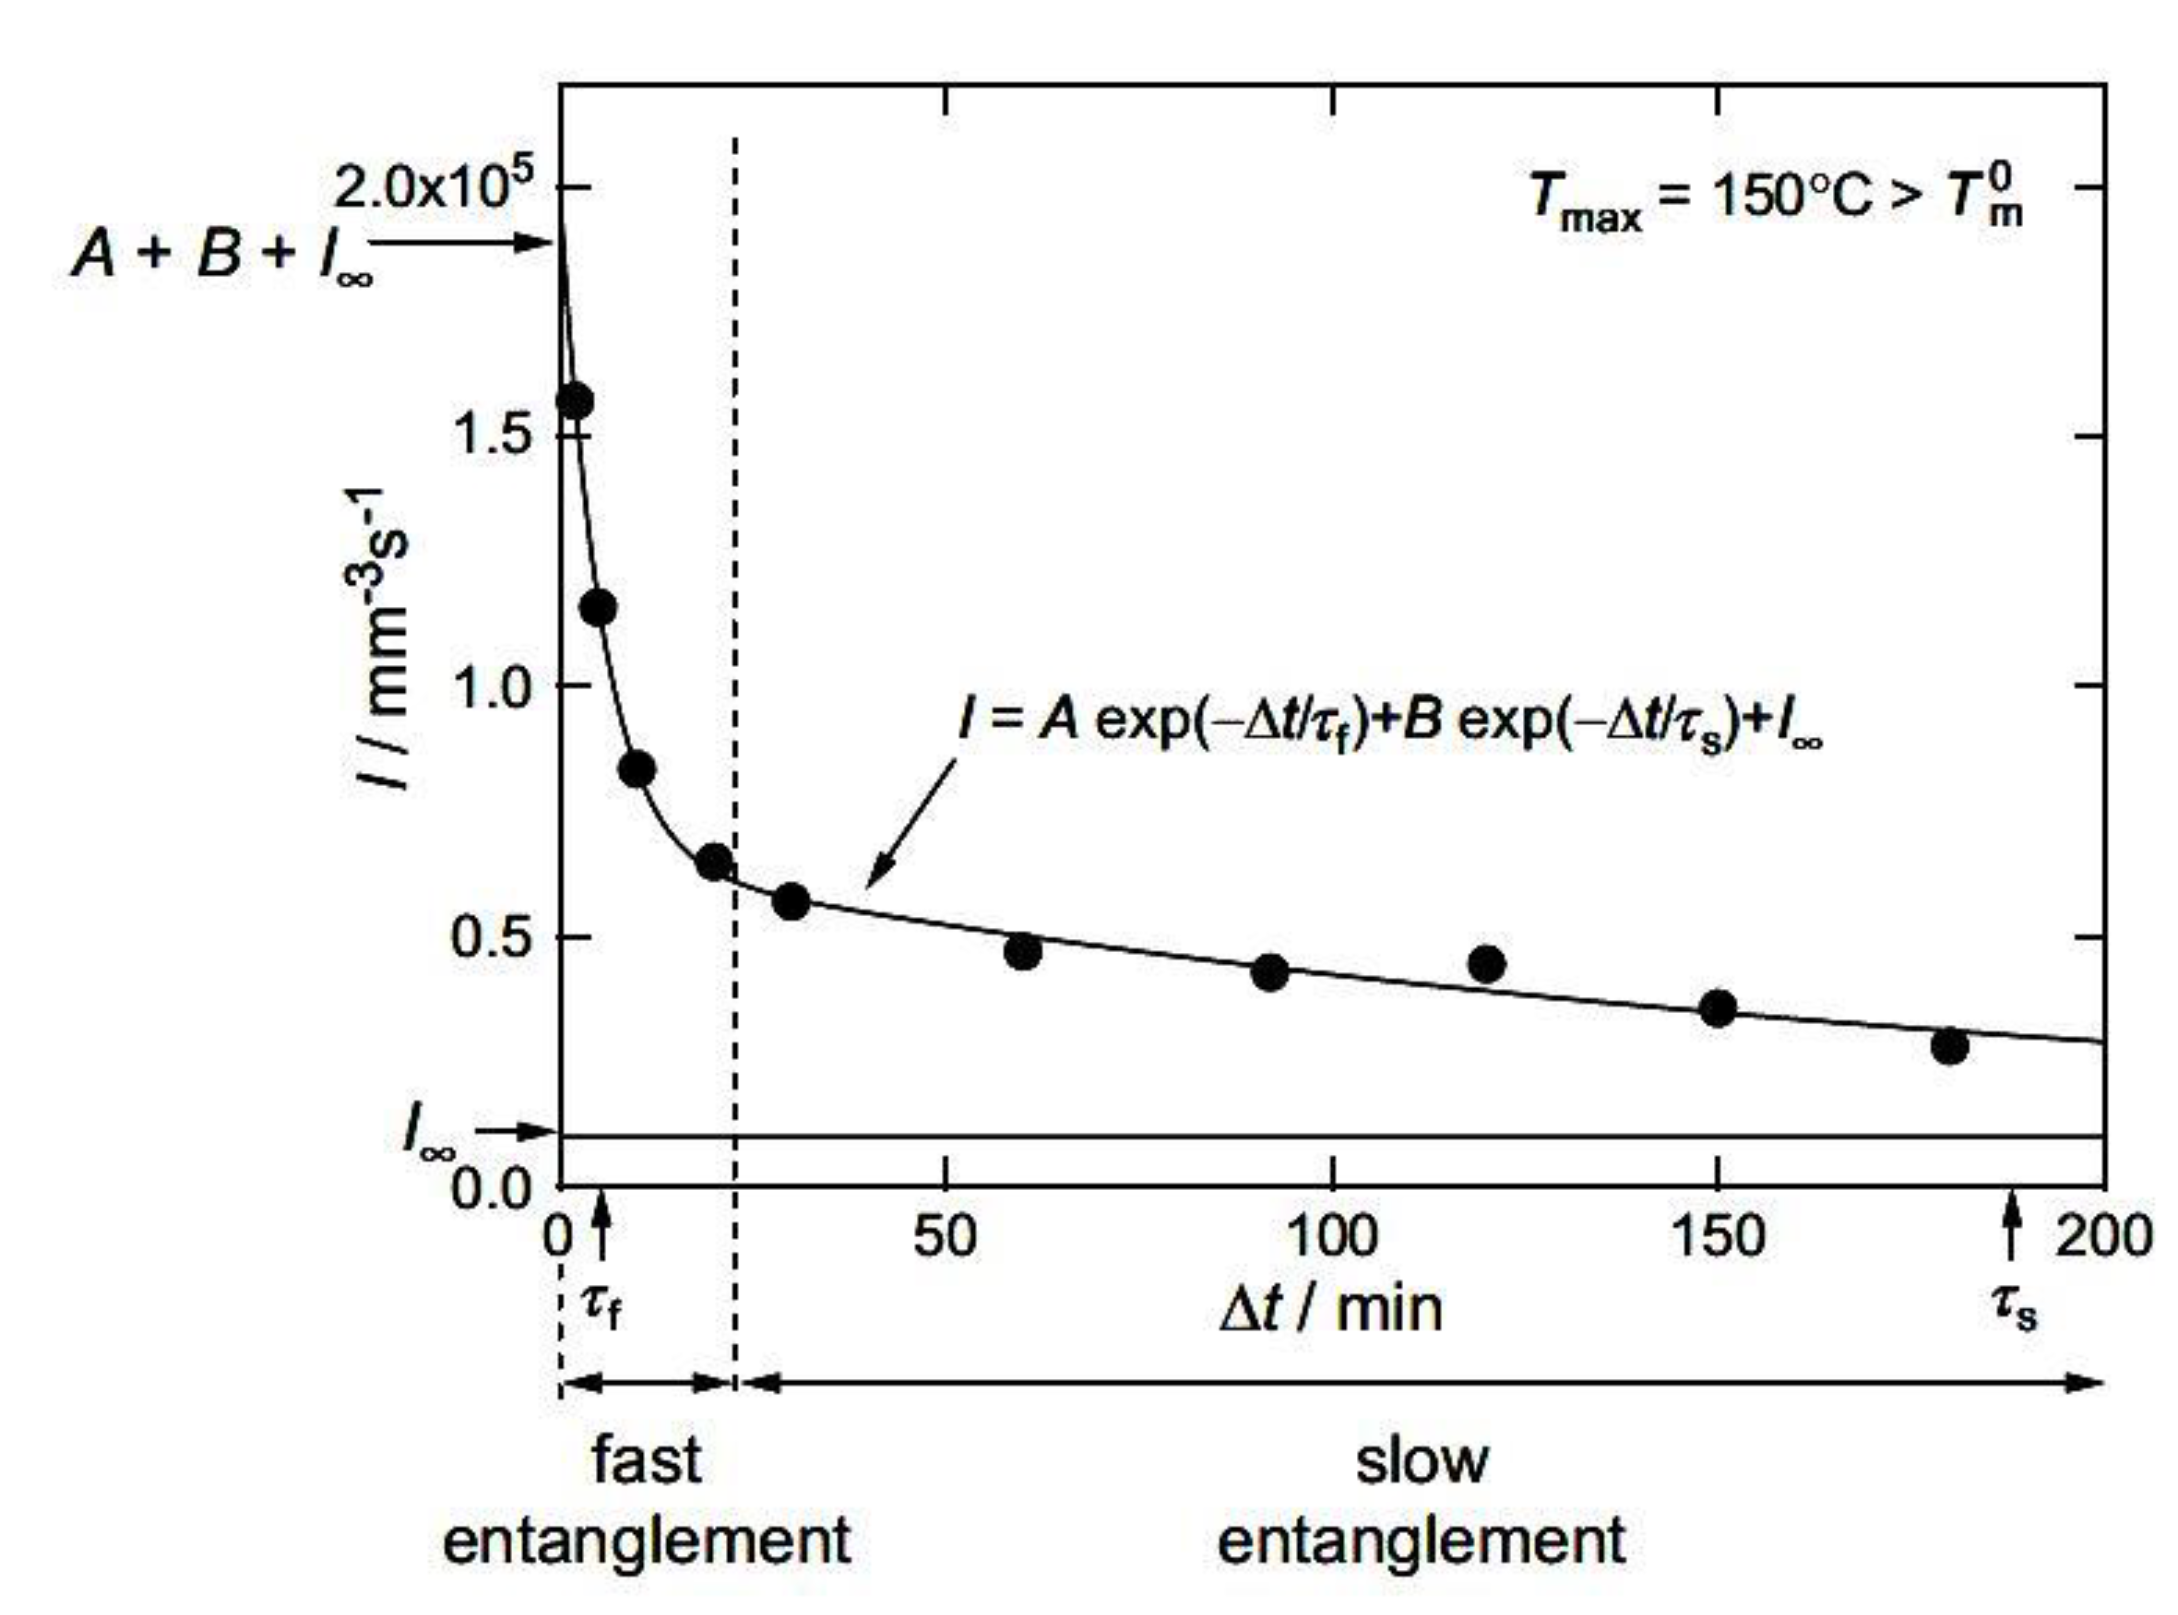
Figure 28.
(a) Changes in the growth rate of iPP spherulites during crystallization at 135 °C after annealing in various times (tann) at 180 °C [30]. Reproduced with permission: 2009, Elsevier; (b) The growth rate of spherulites in disentangled iPP as a function of annealing time, normalized to the initial growth rate of the entangled polymer [130]. Reproduced with permission: 2020, Elsevier.
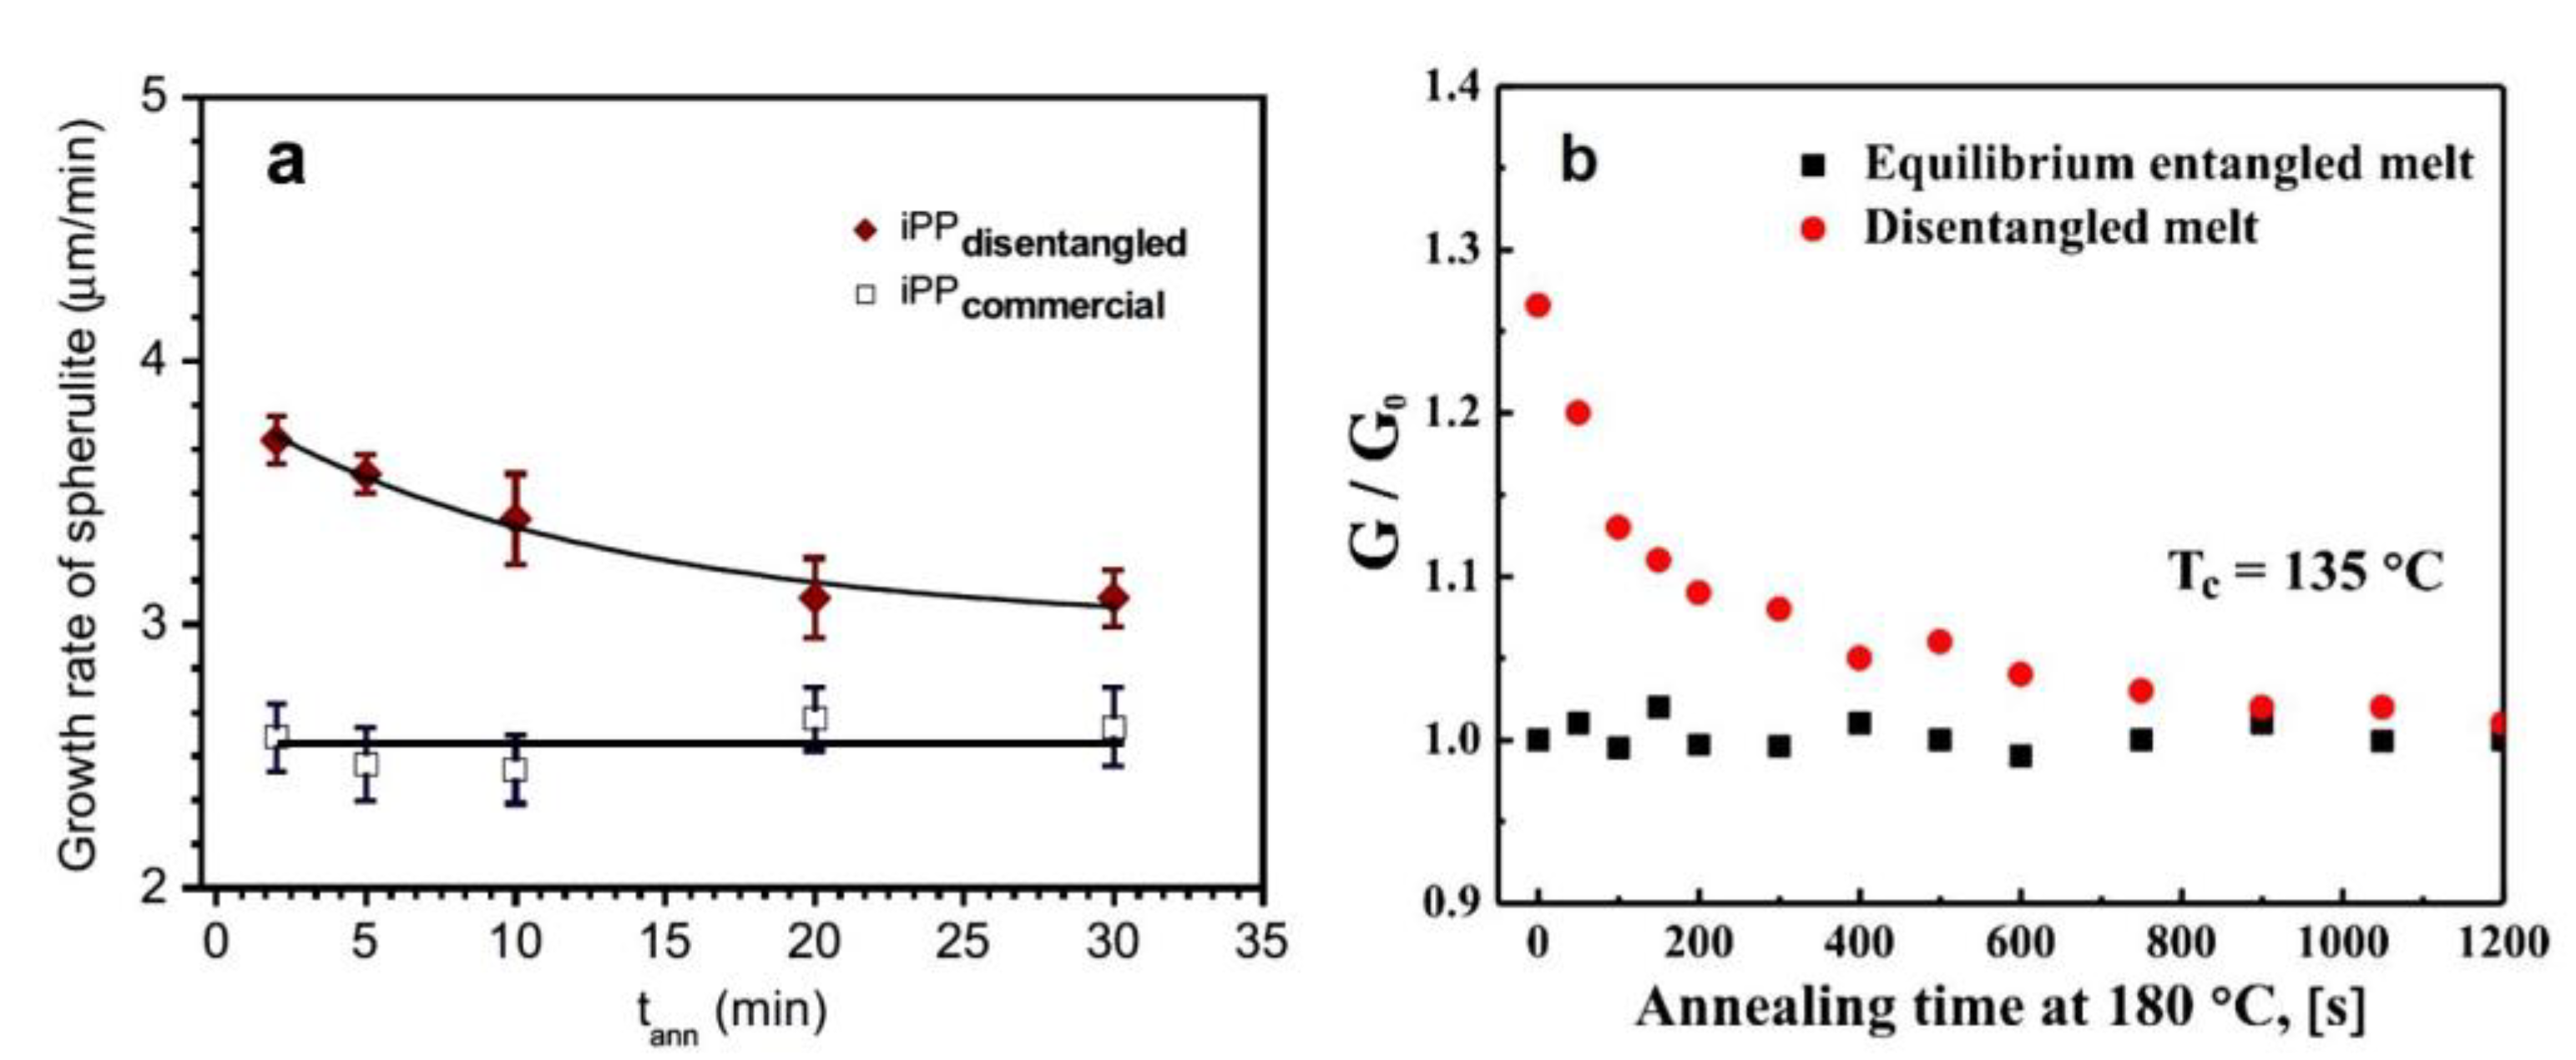

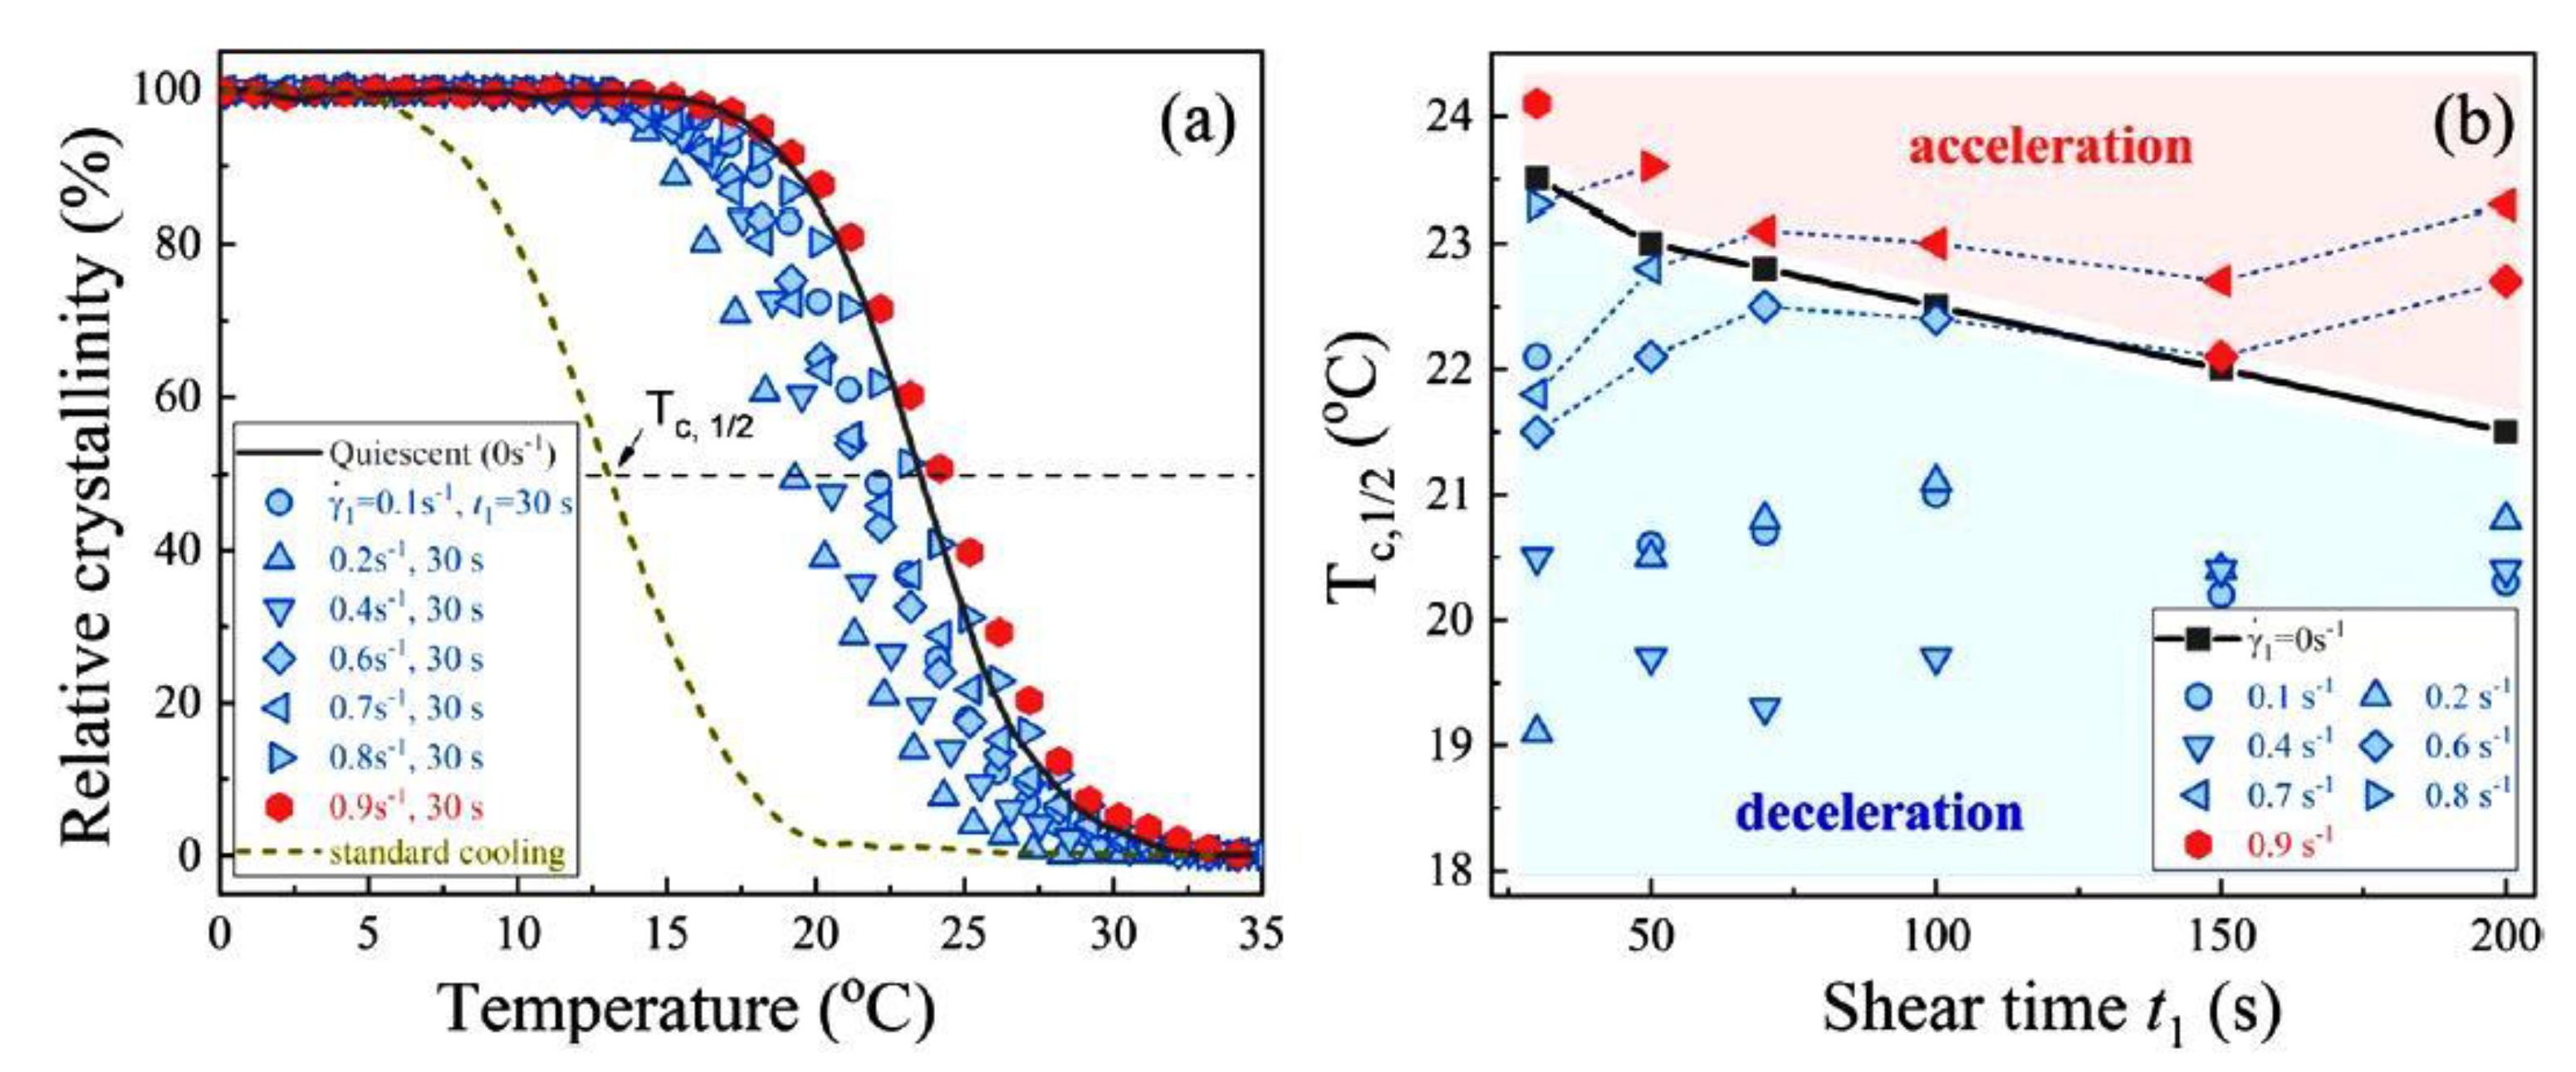
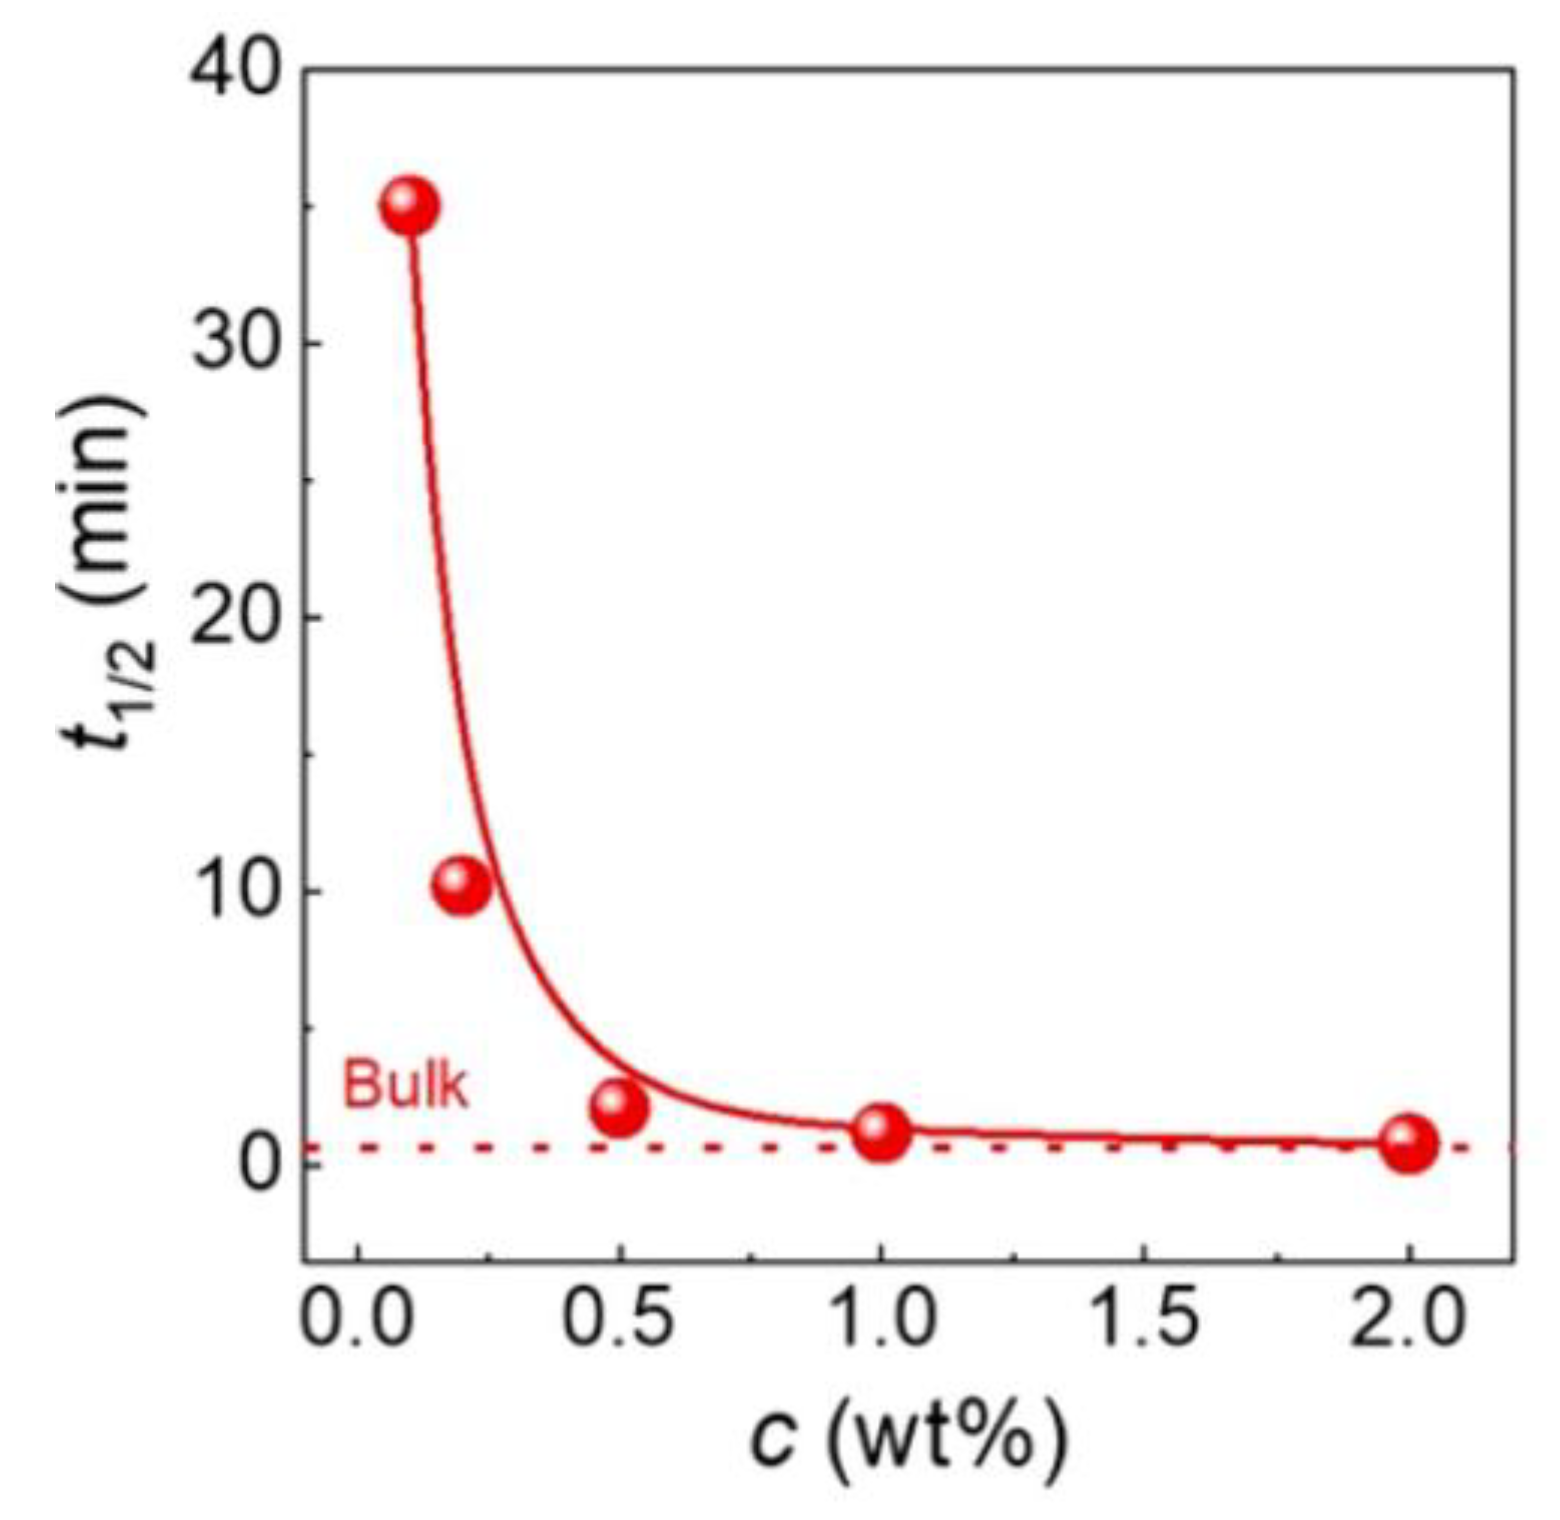
| Polymer | Me [g/mol] |
|---|---|
| Polyethylene, PE | 830–2600 |
| Isotactic polypropylene, iPP | 5500–8100 |
| Polylactide, PLA | 4000–10,500 |
| Isotactic polystyrene, iPS | 17,500–28,800 |
| Polyethylene terephthalate, PET | 1170–1450 |
| Polycarbonate, PC | 1330–1660 |
| 1,4- polybutdiene, PB | 1850 |
Table 2.
The most important observations on the crystallinity of polymers after their disentangling.
Table 2.
The most important observations on the crystallinity of polymers after their disentangling.
| Polymer | Disentangling Procedure | Remarks about Influence of Disentangling on Crystallization and Obtained Crystallinity | Reference |
|---|---|---|---|
| PET | Freeze-drying | Max. crystallinity was obtained from intermediate concentration | [26,28,95] |
| PVDF | Freeze-drying | Max. crystallinity was obtained from intermediate concentration | [96] |
| iPS | Freeze-drying | Only dilute solution enhanced crystallization. The easier cold crystallization from disentangled iPS | [32,94,97] |
| PC | Freeze-drying | Higher crystallinity of disentangled PC, more effective cold crystallization | [98,99] |
| PPS | Freeze-drying and polymerization | Extended chain crystals grew from polymerized PPS | [101] |
| PP | Freeze-drying | Higher crystallinity, higher Tm | [102] |
| Dissolving with crystallization | No effect on crystallinity, lower Tm | [107] | |
| Shear | No effect on crystallinity, higher Tm, thicker lamellae | [57] | |
| PEO | Freeze-drying | No effect on crystallinity, lower Tm | [67] |
| PCL | Freeze-drying | Higher crystallinity, higher Tm | [39] |
| PLLA | Freeze drying | Cold crystallization initiated at lower temperature | [104,105] |
| Shear during extrusion | Higher crystallinity, higher Tm | [110] | |
| PLLA/PDLA | Freeze-drying | Decreased crystallinity of disentangled complex | [106] |
| HDPE | High pressure crystallization | Higher crystallinity, thicker crystals | [44] |
| UHMWPE | Polymerization | Lower Tm, different way of crystal melting | [108,109] |
Table 3.
A list of literature references regarding polymer crystallization studies using various methods.
Table 3.
A list of literature references regarding polymer crystallization studies using various methods.
| Polymer | Studies of Crystalline Structure after Disentangling | Non-Isothermal Crystallization | Isothermal Crystallization | Re-Entangling Effect |
|---|---|---|---|---|
| PET | [26,28,95] | [133] | ||
| PVDF | [96] | |||
| iPS | [32,94,97] | [32] | [32] | |
| PC | [98,99] | |||
| iPP | [57,102,107] | [57,107,119,120] | [30,57,107,119,129,130,134] | [30,119,120,130] |
| sPP | [128] | |||
| PPS | [101] | [101] | ||
| PEO | [67] | [67] | [67,136,137] | [67] |
| PCL | [39] | [126] | ||
| PLA | [104,105,110] | [120,122,123,125] | [31,105,122,123,125,131] | [31,131] |
| PLLA/PDLA | [106] | [106] | [106] | |
| PE | [44] | [143] | [44,132] | [44,142] |
| UHMWPE | [108,109] | [127] | [127] | |
| PB | [124] | [124] | ||
| PMMA | [29] |
Table 4.
The effect of entanglement reduction on homopolymer properties.
| Property | Non-Isothermal Crystallization | Isothermal Crystallization |
|---|---|---|
| Melt–crystal conversion | Faster [107,119,120,125,126] | Faster [32,44,57,67,106,107,119, 122,125,126,128] Slower [124] |
| Crystallization temperature | Higher [57,67,101,106,107,119,121,122,125,126] Lower [124,127] | -- |
| Melting temperature | Higher [57] Lower [124] | -- |
| Equilibrium melting temperature | -- | Higher [133] Lower [67] |
| Crystallinity degree | Higher [57,67,106,119,121,125] Lower [124] | Higher [122] |
| Growth rate of spherulites | -- | Faster [30,31,44,67,106,107,119,123,130,131] Slower [124] |
| Regimes of crystallization | -- | Shift of temperature [67,119,131,133] |
| Lamellae thickness | Increased [57,143] | Increased [57] |
| Nucleation density | -- | Increased [30,31,67,106,130] Decreased [44,107,124,131] |
| Cold-crystallization rate | -- | Faster [105,106] |
| Avrami’s k coefficient | Increased [122,125] Decreased [57] |
Disclaimer/Publisher’s Note: The statements, opinions and data contained in all publications are solely those of the individual author(s) and contributor(s) and not of MDPI and/or the editor(s). MDPI and/or the editor(s) disclaim responsibility for any injury to people or property resulting from any ideas, methods, instructions or products referred to in the content. |
© 2024 by the author. Licensee MDPI, Basel, Switzerland. This article is an open access article distributed under the terms and conditions of the Creative Commons Attribution (CC BY) license (https://creativecommons.org/licenses/by/4.0/).
Share and Cite
MDPI and ACS Style
Pawlak, A. Crystallization of Polymers with a Reduced Density of Entanglements. Crystals 2024, 14, 385. https://doi.org/10.3390/cryst14040385
AMA Style
Pawlak A. Crystallization of Polymers with a Reduced Density of Entanglements. Crystals. 2024; 14(4):385. https://doi.org/10.3390/cryst14040385
Chicago/Turabian StylePawlak, Andrzej. 2024. "Crystallization of Polymers with a Reduced Density of Entanglements" Crystals 14, no. 4: 385. https://doi.org/10.3390/cryst14040385
Note that from the first issue of 2016, this journal uses article numbers instead of page numbers. See further details here.