
CO2 Promoting Polymorphic Transformation of Clarithromycin: Polymorph Characterization, Pathway Design, and Mechanism Study


1
School of Chemical Engineering and Technology, Tianjin University, Tianjin 300072, China
2
Asymchem Life Science (Tianjin) Co., Ltd., Tianjin 300072, China
*
Author to whom correspondence should be addressed.
Crystals 2024, 14(5), 394; https://doi.org/10.3390/cryst14050394
Submission received: 3 April 2024
/
Revised: 17 April 2024
/
Accepted: 19 April 2024
/
Published: 24 April 2024
(This article belongs to the Special Issue Polycrystalline Materials – from Design to (Micro)Structural Characterization and Applications)
Abstract
:Carbon dioxide (CO2) has a wide range of uses such as food additives and raw materials for synthetic chemicals, while its application in the solid-state transformation of pharmaceutical crystals is rare. In this work, we report a case of using 1 atm CO2 as an accelerator to promote the polymorphic transformation of clarithromycin (CLA). Initially, crystal structures of Form 0′ and three solvates were successfully determined by single crystal X-ray diffraction (SCXRD) analysis for the first time and found to be isomorphous. Powder X-ray diffraction (PXRD) and thermal analysis indicated that the solvate desolvates and transforms into the structurally similar non-solvated Form 0′ at room temperature to ~50 °C. Form 0′ and Form II are monotropically related polymorphs with Form II being the most stable. Subsequently, the effect of CO2 on the transformation of CLA solvates to Form II was studied. The results show that CO2 can significantly facilitate the transformation of Form 0′ to Form II, despite no significant effect on the desolvation process. Finally, the molecular mechanism of CO2 promoting the polymorphic transformation was revealed by the combination of the measurement of adsorption capacity, theoretical calculations as well as crystal structure analysis. Based on the above results, a new pathway of preparing CLA Form II was designed: transform CLA solvates into Form 0′ in 1 atm air at 50 °C followed by the transformation of Form 0′ to Form II in 1 atm CO2 at 50 °C. This work provides a new idea for promoting the phase transformation of pharmaceutical crystals as well as a new scenario for the utilization of CO2.
1. Introduction
Polymorphism is a common phenomenon present in active pharmaceutical ingredients (APIs). To prevent the change in drug efficacy, bioavailability, and toxicity during a long period of storage, the most stable form is typically prioritized in the drug formulations on the market. Some APIs can only be produced by the desolvation of their solvates. Under non-solvent conditions, channel solvates may transform to either a structurally different stable polymorph after desolvation such as the solvated forms of azoxystrobin [1], Form 2, Form 5, Form 7, and Form 9, or a structurally similar metastable polymorph such as the solvates of methyl cholate [2]. In the latter case, further transformation to a stable polymorph is usually necessary for APIs. Polymorphic transformation under non-solvent conditions is often more difficult in comparison to solvent-mediated transformation because of the restricted molecular migration and high resistance when rearranging. As a result, some metastable polymorphs may remain a long period without transforming to a stable one such as the metastable Form II of isotactic polybutene-1, which cannot totally transform into the stable Form Ⅰ even after a remarkably long annealing time [3]. Transformation from a metastable polymorph to a stable one requires overcoming an energy barrier. Providing energy or lowering the energy barrier will facilitate the process. Heating, mechanical force, seeding, and high-pressure CO2 are commonly used to induce the transformation. For example, the gold(I) complex, C24H15AuF3N·2(CH4O), exhibits a reversible solid-state polymorphic transformation by mechanical stimulation [4]. Hanna et al. [5] reported a single-crystal-to-single-crystal phase transition of the 2D uranium MOF NU-1302 after supercritical CO2 activation. They hypothesized that CO2 pressure induced the adjacent sheets in the crystal structure to shift from their closed conformation to a more open stacking arrangement. Yu et al. [6] found that the plasticization effect of supercritical CO2 resulted in a decreased energy barrier of phase transition, which promoted the transformation from the α Form to β Form of syndiotactic polystyrene. Several green processes affected by CO2 are reported such as the CO2-solvated liquefaction of polyethylene glycol at low temperatures [7] and the CO2-induced glassification of sucrose octaacetate and its implications in the spontaneous release of the drug from drug-excipient composites [8]. Furthermore, it was found that by adjusting the annealing time in supercritical CO2, mixtures of polymorphs Form Ⅰ and Form Ⅰ′ of isotactic polybutene-1 can be obtained with different crystal phase ratios [9]. The solid-state transformation of APIs induced by external factors, especially atmospheric pressure CO2, has rarely been reported, and an in-depth understanding of its molecular mechanism is still lacking.
Clarithromycin (CLA, C38H69NO13, Figure 1) is a common macrolide antibiotic that is mainly used in the treatment of upper respiratory tract infections, lower respiratory tract infections, and skin and soft tissue infections caused by bacteria. CLA is known to exist in three polymorphs, termed Form 0′ [10], Form I [11], and Form II [12] as well as many solvates such as hydrate, methanol solvate, ethanol solvate (CLA-Eth solvate), acetonitrile solvate, isopropyl acetate solvate, and tetrahydrofuran solvate, etc. [12,13,14,15,16,17]. Drugs currently on the market are formulated from the thermodynamically more stable Form II. Form I is crystallized in orthorhombic space group P21212, while Form II is in orthorhombic space group P212121. The two polymorphs are monotropically related, with Form II the most stable [18]. Form I converts to Form II at 130 °C~132 °C [11,13,15]. Form II melts at 227 °C~233 °C [11,15,19,20]. Form II and the methanol solvate are isomorphic [12]. No reports in the literature have been found on the crystal structure of Form 0′ or the stability relationship between Form 0′ and Form II. It has been reported that under non-solvent conditions, Form II is obtained directly by the transformation of solvates or by undergoing an intermediate Form I [18,21]. Usually, the process takes about 18 h under vacuum and/or high temperature (70 °C~110 °C). Tian et al. [12] proposed that high pressure CO2 could promote the solid-state transformation of the CLA-Eth solvate at room temperature. Their experiments showed that complete transformation directly to Form II took about 6 days at 6.8 atm CO2 atmosphere but only 4 h at 23.8 atm. They speculated that CO2 molecules cause CLA molecules to slide over one another, resulting in the break of the intermolecular hydrogen bonds between ethanol and CLA, forcing the CLA molecules to move closer together to form Form II. Additionally, their experiments at 1 atm CO2 showed that the CLA-Eth solvate did not exhibit phase change, while Form Ⅰ occasionally displayed the onset of phase transformation over a period of ~24 h. They also pointed out that prior to reaching Form II, Form I first transformed to the isomorphic Form 0′ of the CLA-Eth solvate.
Currently reported methods of the preparation of Form II from CLA solvates require high temperature, high pressure, or vacuum, which means a large amount of energy consumption. Moreover, the mechanism of the phase transformation induced by CO2 is still not clear. On the basis of the experimental research in this work, we propose a method for the transformation of CLA solvates to Form II under 1 atm CO2. Through SCXRD and PXRD characterizations, thermal analysis, measurements of adsorption capacity, and theoretical calculations, the mechanism of the phase transformation promoted by CO2 is revealed. This work provides an energy-saving, time-saving, and environmentally friendly route for the preparation of CLA Form II, expands the perspective of promoting the polymorphic transformation of APIs, and opens up a new avenue for the resource utilization of CO2.
2. Experimental Section
2.1. Materials
CLA Form II (purity > 98%) was purchased from Heowns Technology Co. Ltd. (Tianjin, China). N-Propyl acetate (PAC), isopropyl acetate (IPA), ethyl butyrate (EB), and dimethyl carbonate (DMC) (purity > 99%) were purchased from Chemart Chemical Technology Co. Ltd. (Tianjin, China) and used without further purification. CO2 (purity > 99.999%) was purchased from Bolimin Technology Co. Ltd. (Tianjin, China).
2.2. Preparation of Solvates and Form 0′
A total of 3.0 g of CLA raw material was dissolved in 50 mL PAC, 40 mL IPA, and 30 mL EB, respectively, at 80 °C. The obtained solutions were cooled to 15 °C in 3 h, and the clarithromycin n-propyl acetate (CLA-PAC) solvate, clarithromycin isopropyl acetate (CLA-IPA) solvate, and clarithromycin ethyl butyrate (CLA-EB) were crystallized, respectively. The resulting slurry was processed in three ways. (1) Removing the crystals with a spoon and placing them on a piece of filter paper. After 5–10 min, there was no obvious solvent on the crystal surface. (2) Filtered under vacuum at 20 °C for 0.5 h. (3) The crystals obtained by process (2) was dried at 50 °C under vacuum or atmospheric pressure for 9~19 h. The obtained products were immediately sampled and characterized by PXRD and thermal analysis. The results showed that the products proceeded by the three methods were the corresponding CLA solvates, a mixture of the corresponding CLA solvate and Form 0′, and pure Form 0′, respectively.
2.3. Single Crystals Preparation of Solvates and Form 0′
Single crystals of CLA solvates were obtained through slowly cooling crystallization. A total of 3.0 g CLA raw material and 50 mL PAC were dissolved at 80 °C. Then, the solution was slowly cooled to 15 °C in 6 h to obtain large single crystals of the CLA-PAC solvate. Similarly, single crystals of the CLA-IPA and CLA-EB solvates were obtained by slowly cooling IPA and EB solutions of CLA, respectively. A saturated DMC solution of CLA was placed at room temperature and atmospheric pressure for slow evaporation. About three weeks later, high-quality single crystals of CLA Form 0′ were obtained. In order to avoid desolvation, the obtained solvate single crystals were immediately subjected to single crystal X-ray diffraction analysis after being removed from solution.
2.4. Phase Transformation Experiments
In this section, the CLA-PAC solvate was selected as a representative of the three CLA solvates to perform the experiments on the phase transformation of the solvates and was prepared by method (2) in Section 2.2.
2.4.1. Phase Transformation Experiments in Air and Vacuum
The phase transformation experiment of the solvate was performed under vacuum at 50 °C. Crystalline phases of the crystals as a function of time were monitored using DSC measurements by sampling at 2 h, 3 h, 4 h, 7 h, 8 h, and 9 h.
The phase transformation experiment of the solvate was also performed in 1 atm air at 50 °C. Crystalline phases of the crystals as a function of time were monitored through TGA measurements. Samples of the crystals were taken at a time interval of 2 h.
2.4.2. Phase Transformation Experiments in CO2 Atmosphere
The phase transformation experiment of the solvate was carried out in 1 atm CO2 at 50 °C. The CLA-PAC solvate was placed in a custom built micro-vacuum box. The micro-vacuum box was first vacuumed for 2 min using a vacuum line followed by the introduction of dry CO2 until the pressure reached 1 atm. Afterward, the micro-vacuum box was placed in a thermostat at 50 °C. Crystalline phases of the crystals as a function of time were monitored using TGA measurements by sampling at a time interval of 2 h. After each sampling, the micro-vacuum box was vacuumed and CO2 was introduced again to restore the CO2 atmosphere of 1 atm.
The phase transformation experiment of Form 0′ was also carried out in 1 atm CO2 at 50 °C. Crystalline phases of the crystals as a function of time were monitored using PXRD analysis by sampling at a time interval of 1 h. Form 0′ used in the experiment was prepared by method (2) in Section 2.2.
The custom built micro-vacuum box used in the experiment is shown in Figure S1. Its outer diameter, inner diameter, inner height, and outer height were 50 mm, 30 mm, 40 mm, and 100 mm, respectively. The micro-vacuum box was equipped with an intake valve, an outlet valve, a pressure gauge, an intake port, an outlet port, and a sample cell. The intake port was connected to the CO2 cylinder through a soft rubber tube. In the experiment, powdered samples were placed on a piece of plastic wrap and then put in the sample cell. Please note that the powder was lightly covered with plastic wrap to prevent the powder from splashing during decompression.
2.5. Characterization
2.5.1. Single Crystal X-ray Diffraction (SCXRD)
Suitable single crystals were selected and analyzed using a Rigaku mm007 Saturn70 diffractometer. The diffraction data of single crystals of the three solvates (CLA-PAC, CLA-IPA, and CLA-EB solvates) and Form 0′ were collected at −165 °C and 25 °C, respectively. The structures were resolved using Olex2 [22] and SHELXT [23], and refined by the least squares methods using SHELXT [24]. The absolute configuration of all structures were determined through comparison with the structure of clarithromycin Form II (deposited at the CCDC, deposition number 780856 [12]).
2.5.2. Powder X-ray Diffraction (PXRD)
All PXRD data were collected on a Rigaku D/max-2500 diffractometer using Cu Kα radiation (λ = 1.54056 Å, 40.0 kV, and 200 mA) with a scanning rate of 8°·min−1 between 2° and 35° (2θ). For the variable temperature PXRD (VT-PXRD) trials, the sample was heated from 30 °C to 120 °C with a heating rate of 10 °C·min−1 and stabilized for 5 min before the measurements were taken.
2.5.3. Thermal Analysis
Differential scanning calorimetry (DSC) analysis was performed using DSC 1/500 (Mettler Toledo, Greifensee, Switzerland). A quantity of 5~10 mg of powder was added to an aluminum pan and heated at a rate of 10 °C·min−1 with a nitrogen flux of 50 mL·min−1. Thermogravimetric analysis (TGA) was carried out under a nitrogen flow of 20 mL·min−1 using a TGA/DSC STARe (Mettler Toledo, Greifensee, Switzerland). Then, 5~10 mg of powder was placed in a ceramic crucible and heated at a rate of 10 °C·min−1.
2.5.4. Hot Stage Microscopy (HSM)
The thermal behaviors of the CLA-PAC solvate were observed on a Kofler hot stage microscope (Reichert Thermovar, Vienna, Austria) under an optical microscope mounted with a charge-coupled device (CCD) camera. The samples were placed on the sample stage and heated from room temperature to 190 °C at a rate of 5 °C·min−1. The temperature of the hot stage was monitored with a central processor (TMS 94, Linkam Scientific Instruments Ltd., Surrey, UK). Morphological changes during heating were recorded with the CCD camera.
2.5.5. Measurement of the Physical Adsorption Capacity
CO2 adsorption at 25 °C and 50 °C was conducted using an ASAP 2020 PLUS HD88 surface area analyzer (Micromeritics, Norcross, GA, USA) to obtain the adsorption capacity of Form 0′ and Form II. All samples were pretreated at 60 °C for 3 h.
2.5.6. Measurement of Chemical Adsorption Capacity
The temperature-programmed desorption (TPD) of CO2 was measured by using a Micromeritics AutoChem 2920 equipped with a thermal conductivity detector (TCD). The sample was pretreated in a helium flow for 3 h at 60 °C, then cooled to 50 °C to conduct CO2 adsorption. A mixture of CO2 and helium (40 mL/min, CO2 volume fraction 90%) was vented for 1 h until saturation. Afterward, the helium flow was switched (30–50 mL/min) to purge 1 h to remove the weakly physically adsorbed CO2 on the surface of the sample, then the temperature was increased to 200 °C at a rate of 10 °C·min−1 in a helium flow to desorb CO2. It should be noted that Form II was used in the TPD test since Form 0′ would undergo polymorphic transformation during the test temperature range of 50 °C~200 °C, causing unstable signals.
2.6. Computational Method
2.6.1. Molecular Electrostatic Potential Surface (MEPS)
Geometry optimization and the wave function computation of the CLA molecule were carried out using both density functional theory (DFT) and B3LYP/6-311G** methods using Gaussian 09 [25]. Furthermore, Multiwfn 3.7 [26] was used to calculate the MEPS to 0.001 Bohr−3 electron density equivalence surface for analysis. Finally, Visual Molecular Dynamics (VMD) 1.9.3 software [27] was used to visualize the results.
2.6.2. Adsorption Energy Calculation
In order to obtain an adsorption model of CO2 on Form 0′ and calculate the adsorption energy, the software package Gaussian 09 [25] was used for all calculations. The adsorption model consisted of two CLA molecules extracted from a ‘Z’ shape structure in Form 0′ (as shown in Figure 10a) and one CO2 molecule. The CO2 molecule was initially placed at O7 of the CLA molecule. The B3LYP [28,29] function and D3BJ [28] dispersion correction were used. Considering the calculation time due to a large number of atoms (245 atoms in all), the 6-31G* basis set was used to determine the optimized adsorption model and the vibration frequencies of the molecules [30]. Grid data generation was performed using Multiwfn Version 3.8 (development version) [26,31]. The adsorption energy was calculated by the following equation:
where Eadsorb is the adsorption energy of the CO2 on the CLA molecule, Etotal is the system’s total energy once adsorption is completed; ECLA and ECO2 are the energy of the CLA molecule and CO2 molecule before adsorption, respectively. A negative adsorption energy indicates that the adsorption process can take place.
Eadsorb = Etotal − ECLA − ECO2
2.6.3. Crystal Habit Prediction
Universal force field package COMPASS [32] in the Discover module was used as the initialization force field in Material Studio (MS) 8.0. Smart Minimizer was selected for cell configuration optimization. After optimization, cell parameters changed within 5% compared with those before optimization. The BFDH [33] method in the Morphology module was used in predicting the crystal habit of Form 0′.
3. Results and Discussion
3.1. Crystal Structure Analysis of Form 0′ and Solvates
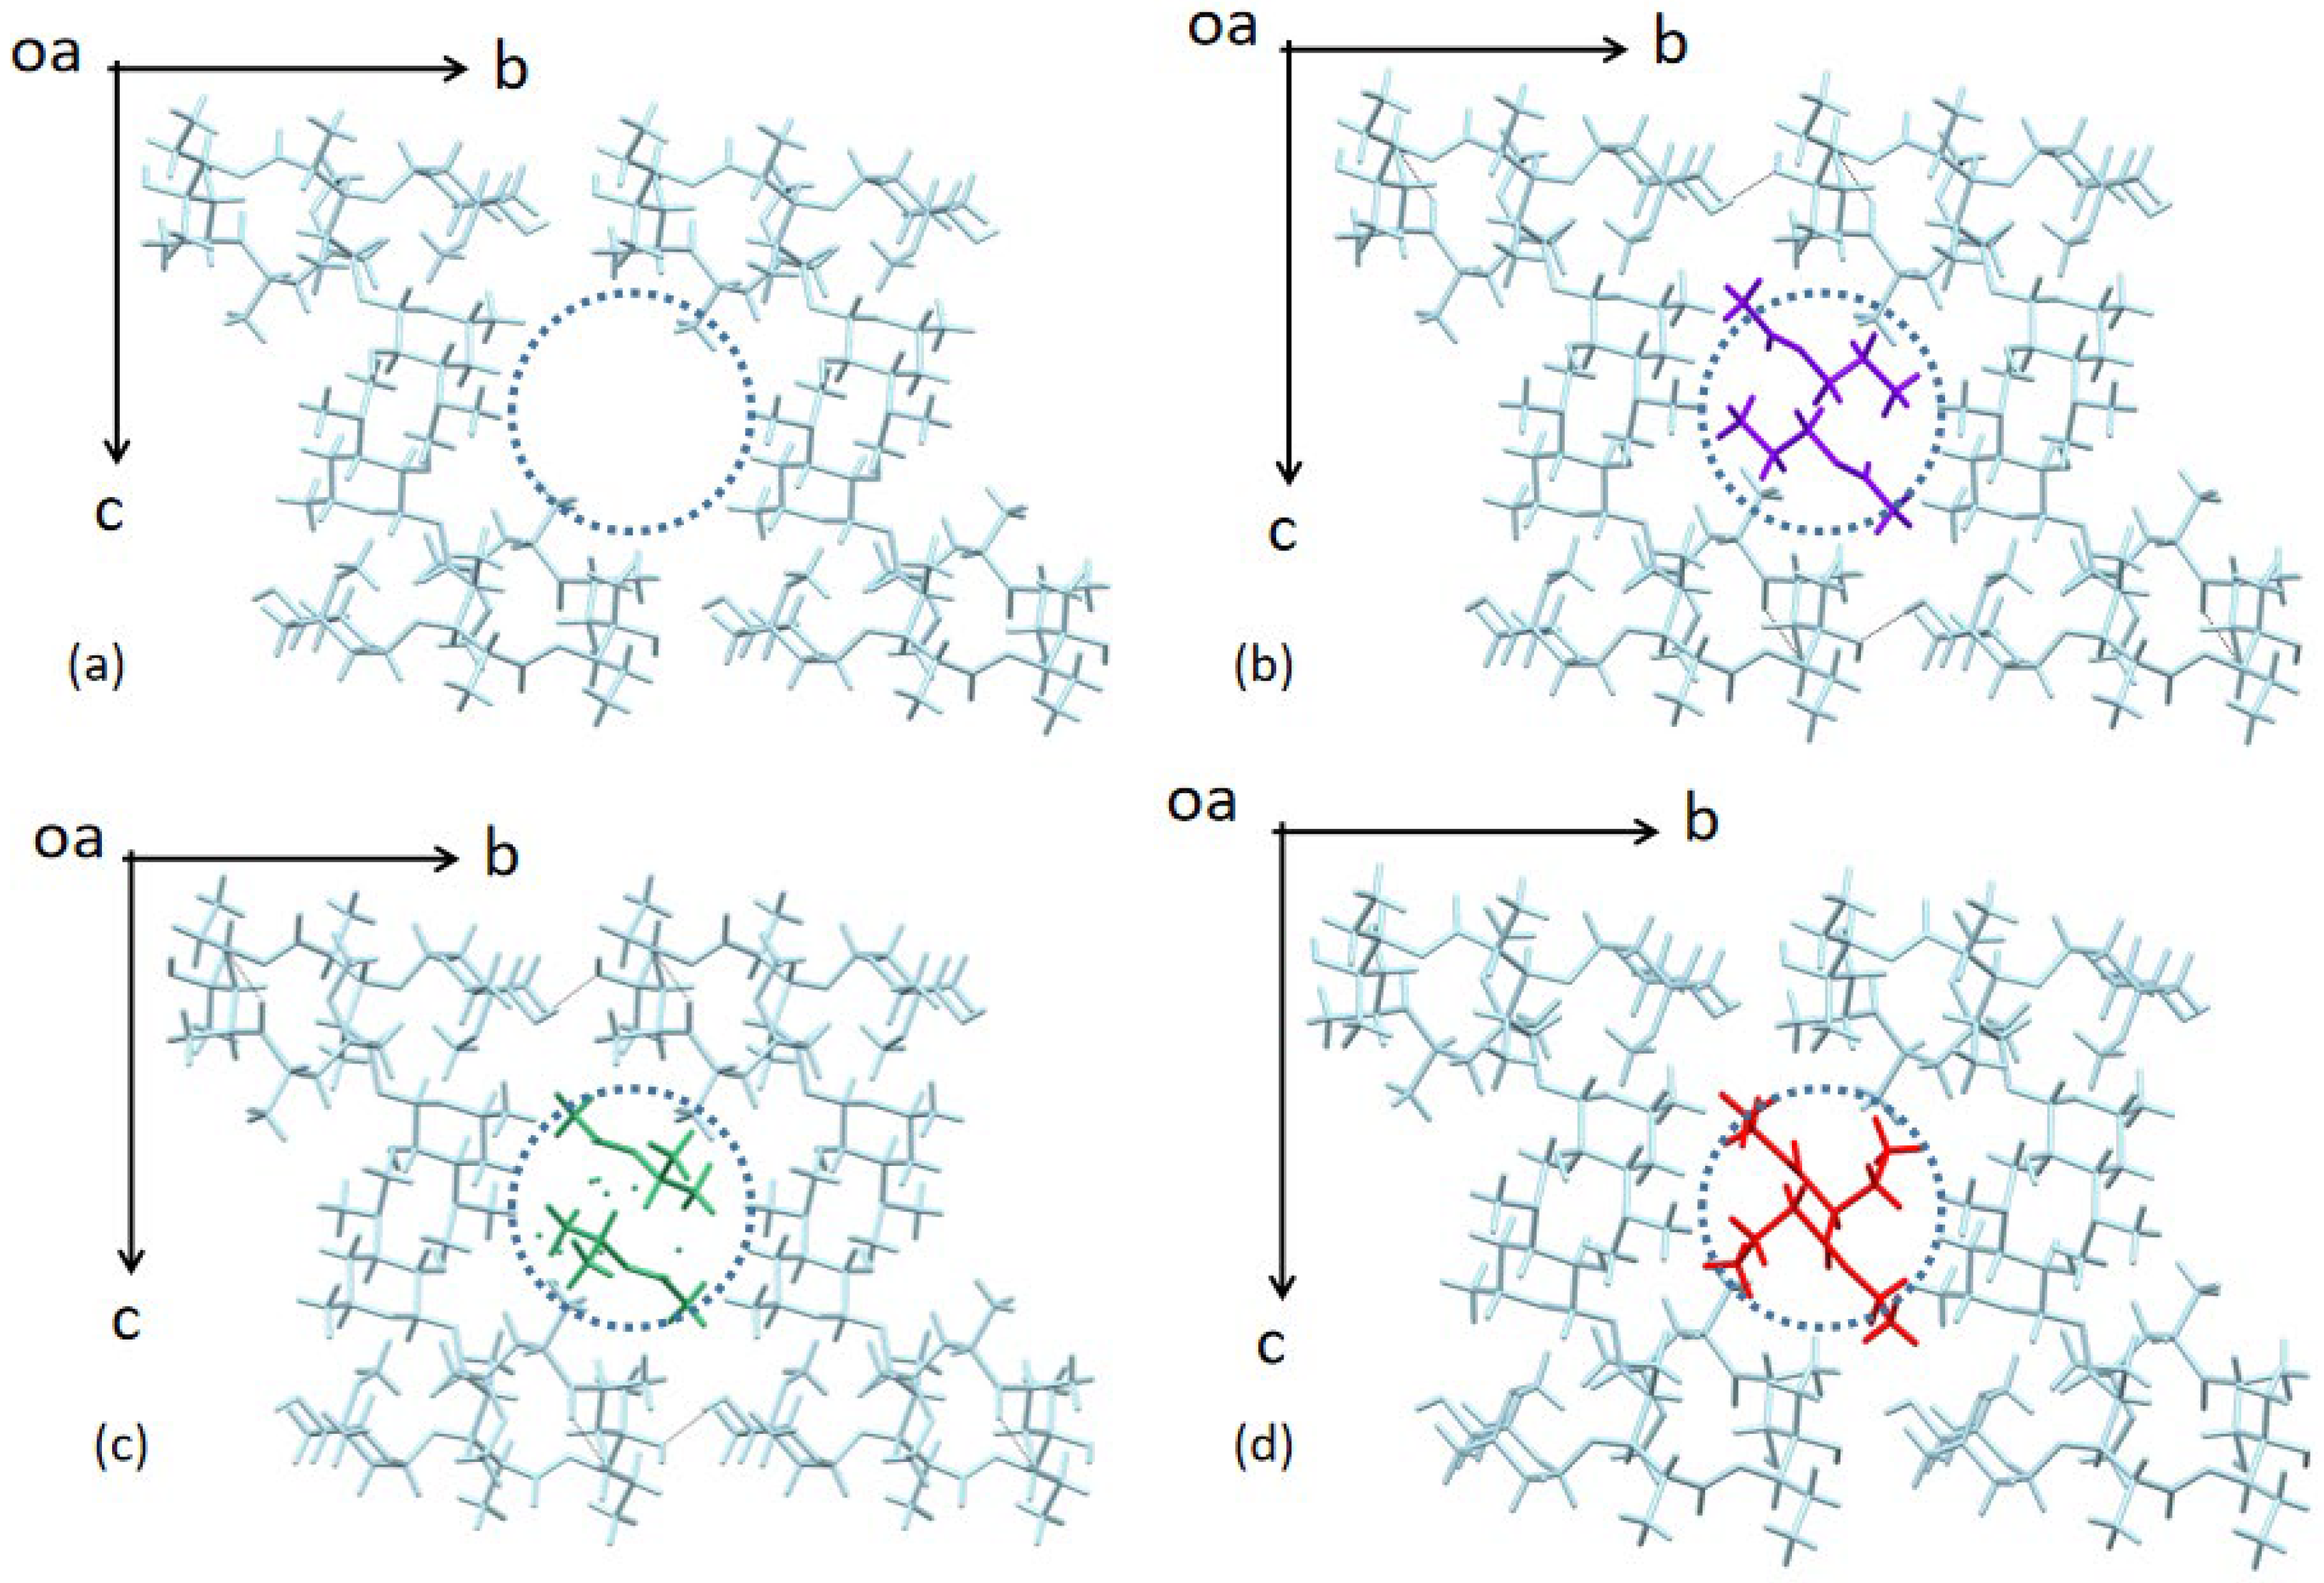
High-quality single crystals of a CLA non-solvated form and three CLA solvates, namely the CLA-PAC solvate, CLA-IPA solvate, and CLA-EB solvate, were prepared and their crystal structures were successfully resolved for the first time. The crystallographic data and structural refinement parameters are given in detail in Table 1. It can be seen that the non-solvated form and the three solvates were all in the orthorhombic system with a space group of P212121, possessed the same formula units per cell (Z = 4) as well as similar unit cell parameters. All of these properties indicate that they are isomorphic. In the crystal structures of the three CLA solvates, the stoichiometric ratios of CLA and solvent were all determined to be 1:1.
Comparing the non-solvated form with the CLA-Eth solvate (deposited at the CCDC, deposition number 700729, Table S1 [15]), it can be seen that the crystal system and space group of the two forms were the same, and the CLA molecular conformation (see Figure S2 cyan and orange) and molecular packing pattern (see Figure 2a and Figure S3) of the two forms were similar. Form 0′ has been reported as a desolvated isostructural form of the CLA-Eth solvate by Tian et al. [12]. Therefore, it is reasonable to infer that the non-solvated form crystallized in DMC was Form 0′. In addition, the molecular conformations of CLA in Form 0′ and Form II (deposited at the CCDC, deposition number 780856 [12], colored in red in Figure 2) were basically identical, suggesting that the two forms are packing polymorphs.
The molecular arrangements in the crystal structures of the three solvates are shown in Figure 2b–d. It shows that the stacking patterns of the molecules in the three solvates were the same as that in Form 0′. Solvent molecules, as a guest, enter the channels formed in the framework stacked by CLA molecules. The solvent molecules do not form hydrogen bonds with the CLA molecules, only weak van der Waals forces. This means that the solvent molecules can easily escape from the channel. In contrast, as shown in Figure S3, in the crystal structure of the CLA-Eth solvate, the ethanol molecules are connected not only with CLA molecules by O60-H60…O12, but are also connected to each other by hydrogen bonds, indicating a greater difficulty of solvent removal.
3.2. Thermal Analysis of Form 0′ and Solvates
DSC and TGA analyses were performed to gain information about the thermal behaviors of the crystals prepared in Experiment 2.2 via method (3). As shown in Figure 3a, the weight loss of the sample in the temperature range of 250 °C~350 °C on the TGA curve corresponded to the decomposition of CLA, which is basically in agreement with that (250 °C~340 °C) reported by Li Wei [34]. There was no weight loss before decomposition on the TGA curve, indicating that the crystal was a non-solvated form. Combined with the PXRD analysis in Section 3.3, it can be proven that the crystals prepared in Experiment 2.2 by method (3) are Form 0′. More discussion can be seen in Section 3.3. In the DSC curve of Form 0′ shown in Figure 3b, Form 0′ exhibited an exotherm at 114.5 °C, and an endotherm at 228.6 °C during heating. It has been reported that the melting point of Form II is between approximately 227 °C and 233 °C. The DSC curve of Form II was measured in this work and showed that Form II melted at 228.1 °C (see Figure S4). These indicate that the endothermic DSC signal of Form 0′ represents the melting process of Form II, while the exothermic event represents the transformation of Form 0′ to Form II. The exothermic transition demonstrates that Form 0′ and Form II bear a monotropic relationship, and that Form 0′ is less stable than Form II. Moreover, the density of Form 0′ (1.011 × 10³ kg·m−3) being smaller than that of Form II (1.164 × 10³ kg·m−3) also supports this conclusion.
The TGA and DSC profiles of the three crystals prepared in Experiment 2.2 via method (1) are shown in Figure 3c,d. All TGA profiles presented significant weight losses, which corresponded to wide endothermic peaks in the DSC profiles in the same temperature ranges (109.3 °C~134.9 °C, 109.7 °C~130.8 °C, and 99.3 °C~133.8 °C, respectively, for the three solvates), indicating solvent removal. The weight losses of the three samples were 11.88%, 12.10%, and 12.15%, respectively, which basically matched the solvent stoichiometries determined by SCXRD (12.01%, 12.01%, and 13.44%, respectively), indicating that the obtained crystals were the CLA-PAC solvate, CLA-IPA solvate, and CLA-EB solvate. The weight loss of the sample of CLA-EB solvate was slightly lower than the crystallographic data, which was due to the escape of the solvent molecules during the test. The CLA-IPA solvate has been published by Liang’s work [12]; here, we determined its crystal structure. At the same time, the solvates of CLA-PAC and CLA-EB obtained in this work were reported for the first time. This second endothermic peaks in the DSC curves of the three solvates appeared at approximate temperatures of 230.3 °C, 231.7 °C, and 231.7 °C, respectively. There were no weight losses at these temperature ranges in the TGA curves, thus we speculate that the endothermic peaks on the DSC curves should belong to the melting process of Form II.
To confirm the above speculation, the phase transformation process of the solvates was visualized by HSM using the CLA-PAC solvate as an example. A fresh block-shaped single crystal was used in the observation experiment, and its morphologies during heating are depicted in Figure S5. In the microscopic field of view, at the beginning, the crystal could be seen brightly, and the dark periphery was due to a certain thickness of the crystal. When heated to 110 °C, the middle of the crystal in the field of view gradually became dark, which corresponded to the first desolvation endothermic process observed in the DSC curve of the CLA-PAC solvate. When heated to 138 °C, the crystal in the field of vision became completely dark, while its boundary remained unchanged. After heated to 190 °C, the crystal was removed to perform the DSC measurement. The DSC curve (see Figure S6) showed an endothermic peak at 229.3 °C, corresponding to the melting point of Form II. Therefore, it can be concluded that the second endothermic peaks in the DSC curves of the three CLA solvates represent the melting process of Form II, and that the first endothermic peaks represent the desolvation and transformation to Form II of the solvates. Moreover, no melting behavior and distinct shape change of the single crystal were observed during the whole temperature range investigated. This means that the transition of the CLA solvate to Form II belongs to a solid-state transformation process.
The thermal behaviors of the crystals prepared in Experiment 2.2 by method (2) was characterized by DSC measurements. As shown in Figure 4a, all DSC curves showed exothermic peaks followed closely by endothermic peaks. Combined with the DSC curves of the three solvates and Form 0′ (Figure 3b,d), it can be speculated that the exothermic peak in Figure 4a represents the polymorphic transformation of Form 0′ to Form II, while the endothermic one shows the desolvation of the solvates. To confirm this speculation, a phase transformation experiment of the solvates was performed under vacuum using the CLA-PAC solvate as a representative sample. DSC measurements were conducted after the CLA-PAC solvate experienced different durations. As seen in Figure 4b, after 2 h, the DSC curve rose slightly near 91.0 °C, followed by an endothermic peak at 101.6 °C corresponding to the desolvation of the solvate. Four hours later, a clear exothermic peak appeared at 100.0 °C, followed by an endothermic peak at 106.63 °C. With the increase in duration, both the peak temperatures of the exotherm and the endotherm on the DSC curve increased. After 9 h, the DSC curve only had one sharp exothermic peak at 114.2 °C, corresponding to the transformation of Form 0′ to Form II. Figure 4c shows the correlation between the exothermic peak temperature and heating duration. It is obvious that the longer the duration, the higher the peak value, which can be attributed to the greater solvent removal and transformation of the solvate to Form 0′. When heated for up to 9 h, the solvate completely desolvated and transformed to Form 0′. The analysis above demonstrates that when the solvate is placed at a reduced pressure, solvent removal will occur, resulting in the formation of a mixture of Form 0′ and the solvate. This rationalizes the thermal events where the exothermic peaks are followed by the endothermic peaks in the DSC curves in Figure 4a.
3.3. PXRD Analysis of Form 0′ and Solvates
The PXRD of the solvent-free form prepared in Experiment 2.2 by method (3) as well as the PXRDs calculated from the single crystal structures of forms 0′, I, and II are shown in Figure 5a. The PXRD of the solvent-free form (red curve) was consistent with the calculated PXRD of Form 0′, confirming it was Form 0′. The experimental and calculated PXRDs of the CLA-PAC solvate, CLA-IPA solvate, and CLA-EB solvate are also depicted in Figure 5a. It is obvious that the PXRDs of the three solvates are identical and basically consistent with that of Form 0′. This indicates that the three solvates and Form 0′ are isomorphic, in agreement with the results determined by SCXRD.
The VT-PXRD of Form 0′ in the temperature range of 30 °C~120 °C is shown in Figure 5b. In comparison to the PXRD at 100 °C, three characteristic peaks of Form 0′ at 2θ = 4.601°, 6.492°, and 7.607° disappeared (marked as red circle) on equilibration at 114 °C. At the same time, two characteristic peaks (marked as yellow triangle) belonging to Form II at 10.748° and 11.356° formed. It can be seen that Form 0′ transforms into Form II at about 114 °C, which is consistent with that determined by the thermal analysis.
The VT-PXRD of the CLA-PAC solvate in the temperature range 30 °C~120 °C is shown in Figure 5c. On equilibration at 110 °C, characteristic peaks belonging to Form II emerged at 2θ = 8.445°, 9.363°, 10.748°, and 11.356° (marked as an yellow triangle). At the same time, the characteristic peaks of 2θ = 4.601° and 7.607° (green circle marks) belonging to the CLA-PAC solvate disappeared. Upon a further rise to 120 °C, the characteristic diffraction peaks of 2θ = 6.492° and 10.106° belonging to the CLA-PAC solvate disappeared (black circle marks). It can be seen that the CLA-PAC solvate begins to transform into Form II at about 110 °C, which is in agreement with the previous results of the thermal analysis. The VT-PXRDs of the CLA-IPA solvate and CLA-EB solvate could obtain similar results, as shown in Figures S7 and S8.
3.4. Phase Transformation of Solvates and Form 0′
From the analyses above, it can be seen that the three solvates, namely the CLA-PAC solvate, CLA-IPA solvate, and CLA-EB solvate, can transform directly to Form II at 100 °C~110 °C or first to Form 0′ at room temperature to ~50 °C, and then further to Form II at near 114 °C, as shown in Figure 6. The effects of atmospheric pressure CO2 on the desolvation of the solvates and polymorphic transformation of Form 0′ were investigated. Firstly, the solvate desolvation experiment in 1 atm CO2 was carried out with CLA-PAC as the representative, and the solvent residual in the solvate was monitored by TGA analysis (shown in Figure S9). As shown in Figure S11, it took about 19 h for the complete desolvation of the CLA-PAC solvate in 1 atm CO2 at 50 °C (marked as red circle). In an air atmosphere under the same temperature and pressure (marked as a black square in Figure S11, TGA curves shown in Figure S10), the solvent removal of CLA-PAC also took about 19 h. The result of the comparative experiment indicates that CO2 has no effect on the solvent removal of the CLA solvates.
Next, the effect of the 1 atm CO2 atmosphere on the polymorphic transformation of Form 0′ to Form II was investigated using crystalline phase monitoring by PXRD. The PXRDs of the samples at 1 h, 2 h, 3 h, and 4 h are shown in Figure 7a. After 3 h (green curve), the intensities of the characteristic peaks of Form 0′ at 2θ = 4.601°, 6.492°, and 10.106° decreased (marked as purple circle). At the same time, the characteristic peaks of Form II appeared at 2θ = 8.445°, 10.748°, and 11.356° (yellow triangle marks). At 4 h, the PXRD was in agreement with that of Form II, indicating that Form 0′ completely transforms into Form II at this time. The results of the comparative experiments in the air atmosphere at the same temperature and pressure are shown in Figure 7b. The PXRD pattern at 61 h indicates that the polymorph was Form 0′ at this time. At 88 h, the characteristic peaks of Form 0′ (2θ = 4.601°, 6.492°, and 10.106°) were still present, although their intensities became weak. Up to 108 h, no characteristic peaks of Form II were observed. The results show that CO2 can significantly promote the polymorphic transformation of CLA Form 0′ to Form II. Based on the above results, a new pathway was designed for the preparation of Form II with the CLA solvates, as shown in Figure 6c: the solvate (either the CLA-PAC solvate, the CLA-IPA solvate. or the CLA-EB solvate) desolvates to form Form 0′ in the temperature range of room temperature to ~50 °C, and then Form 0′ transforms into Form II in a 1 atm CO2 atmosphere at 50 °C. The crystals obtained by this method were characterized by DSC and PXRD. As shown in Figure S12, there was only one endothermic peak at 229.3 °C in the DSC curve, and the PXRD pattern was consistent with that of Form II with no characteristic peaks of Form 0′, indicating that the crystals prepared by the new method were pure Form II.
3.5. Mechanism of CO2 Promoting Polymorphic Transformation
The experiments show that it requires more than 108 h for the polymorphic transformation of Form 0′ into Form II in 1 atm air at 50 °C. However, at the same temperature and pressure, CO2 can dramatically shorten the transformation duration of CLA from Form 0′ to Form II. Tian et al. [15] have reported that neither air, N2, O2, H2, CH4, C2H6, nor C3H8 can accelerate the transformation. It is speculated that CO2 is likely to be chemically adsorbed on the CLA molecules, which promotes the polymorphic transformation. To confirm this hypothesis, the physical and chemical adsorption capacity of CLA for CO2 were measured. As shown in Table 2, the physical adsorption capacity of Form 0′ and Form II for CO2 was 0.31240 mmol·g−1 and 0.24877 mmol·g−1, respectively, at 25 °C, and 0.12914 mmol·g−1 and 0.11153 mmol·g−1, respectively, at 50 °C. The decrease in adsorption capacity with the increase in temperature reflects the character of physical adsorption. The adsorption capacity of Form 0′ being slightly larger than that of Form II may be related to the difference in the void structure of the two polymorphs.
The results of TPD measurement are shown in Figure 8. The results showed that two signals appeared at 63.81 °C and 196.53 °C, respectively, during the desorption process at higher temperature, indicating that there were two types of chemisorption sites (labeled L and R, respectively, in Figure 8). The desorption amounts of CO2 at peaks L and R were 0.04813 mmol·g−1 and 0.9487 mmol·g−1, respectively. The low desorption amount corresponded to the chemical adsorption of CO2 by the groups with weak electronegativity, while the high desorption amount corresponded to the chemical adsorption of CO2 by the groups with strong electronegativity. Considering the incomplete peak R caused by the sample melting when heated to 200 °C, the total capacity of chemisorption should be greater than 0.9968 mmol·g−1. Obviously, the capacity of the chemical adsorption is significantly greater than that of the physical adsorption. Therefore, the chemisorption of CO2 plays a major role in promoting the polymorphic transformation.
In order to identify the adsorption site of CO2, the MEPS of the CLA molecule in Form 0′ was calculated and is shown in Figure 9. Corresponding to the negative region displayed in the MEPS, the electronegativity of the groups in the molecular structure were ordered from strong to weak as: O7 (hydroxyl oxygen on the 14-membered lactone ring) > O1 (hydroxyl oxygen on the 6-membered desamine ring) > O9 (carbonyl oxygen on the 14-membered lactone ring) > O13 (oxygen on the 6-membered cladinose ring) > O6 (hydroxyl group on the 14-membered lactone ring) > O5 (carbonyl oxygen on the 14-membered lactone ring). Furthermore, the groups exposed on the crystal faces of Form 0′ were analyzed. There were four morphologically important crystal faces, (101), (002), (011), and (110) in the Form 0′ morphology predicted by the BFDH model (as shown in Figure S13). The groups exposed on the four crystal faces are shown in Figure S14. On faces (101) and (002), only the dimethylamino group was exposed. On face (011), O13 (EP = −42.51 kcal·mol−1, where EP denotes electrostatic potential) on the 6-membered cladinose ring was exposed. On face (110), all oxygens on the 14-membered lactone ring were exposed, among which O7, O9, O6, and O5 exhibited strong electronegativity with EP values of −47.63 kcal·mol−1, −42.99 kcal·mol−1, −40.68 kcal·mol−1, and −39.55 kcal·mol−1, respectively. It can be inferred that chemisorption may occur at O7, O9, O13, O6, and O5 when Form 0′ is exposed in a CO2 atmosphere. O7, which had the most negative EP value, was taken as the representative to construct the adsorption model (as shown in Figure S15), and the adsorption energy of CO2 on O7 was calculated to be −8.43 kcal·mol−1. The negative adsorption energy indicates that CO2 can be stably adsorbed at the site of O7.
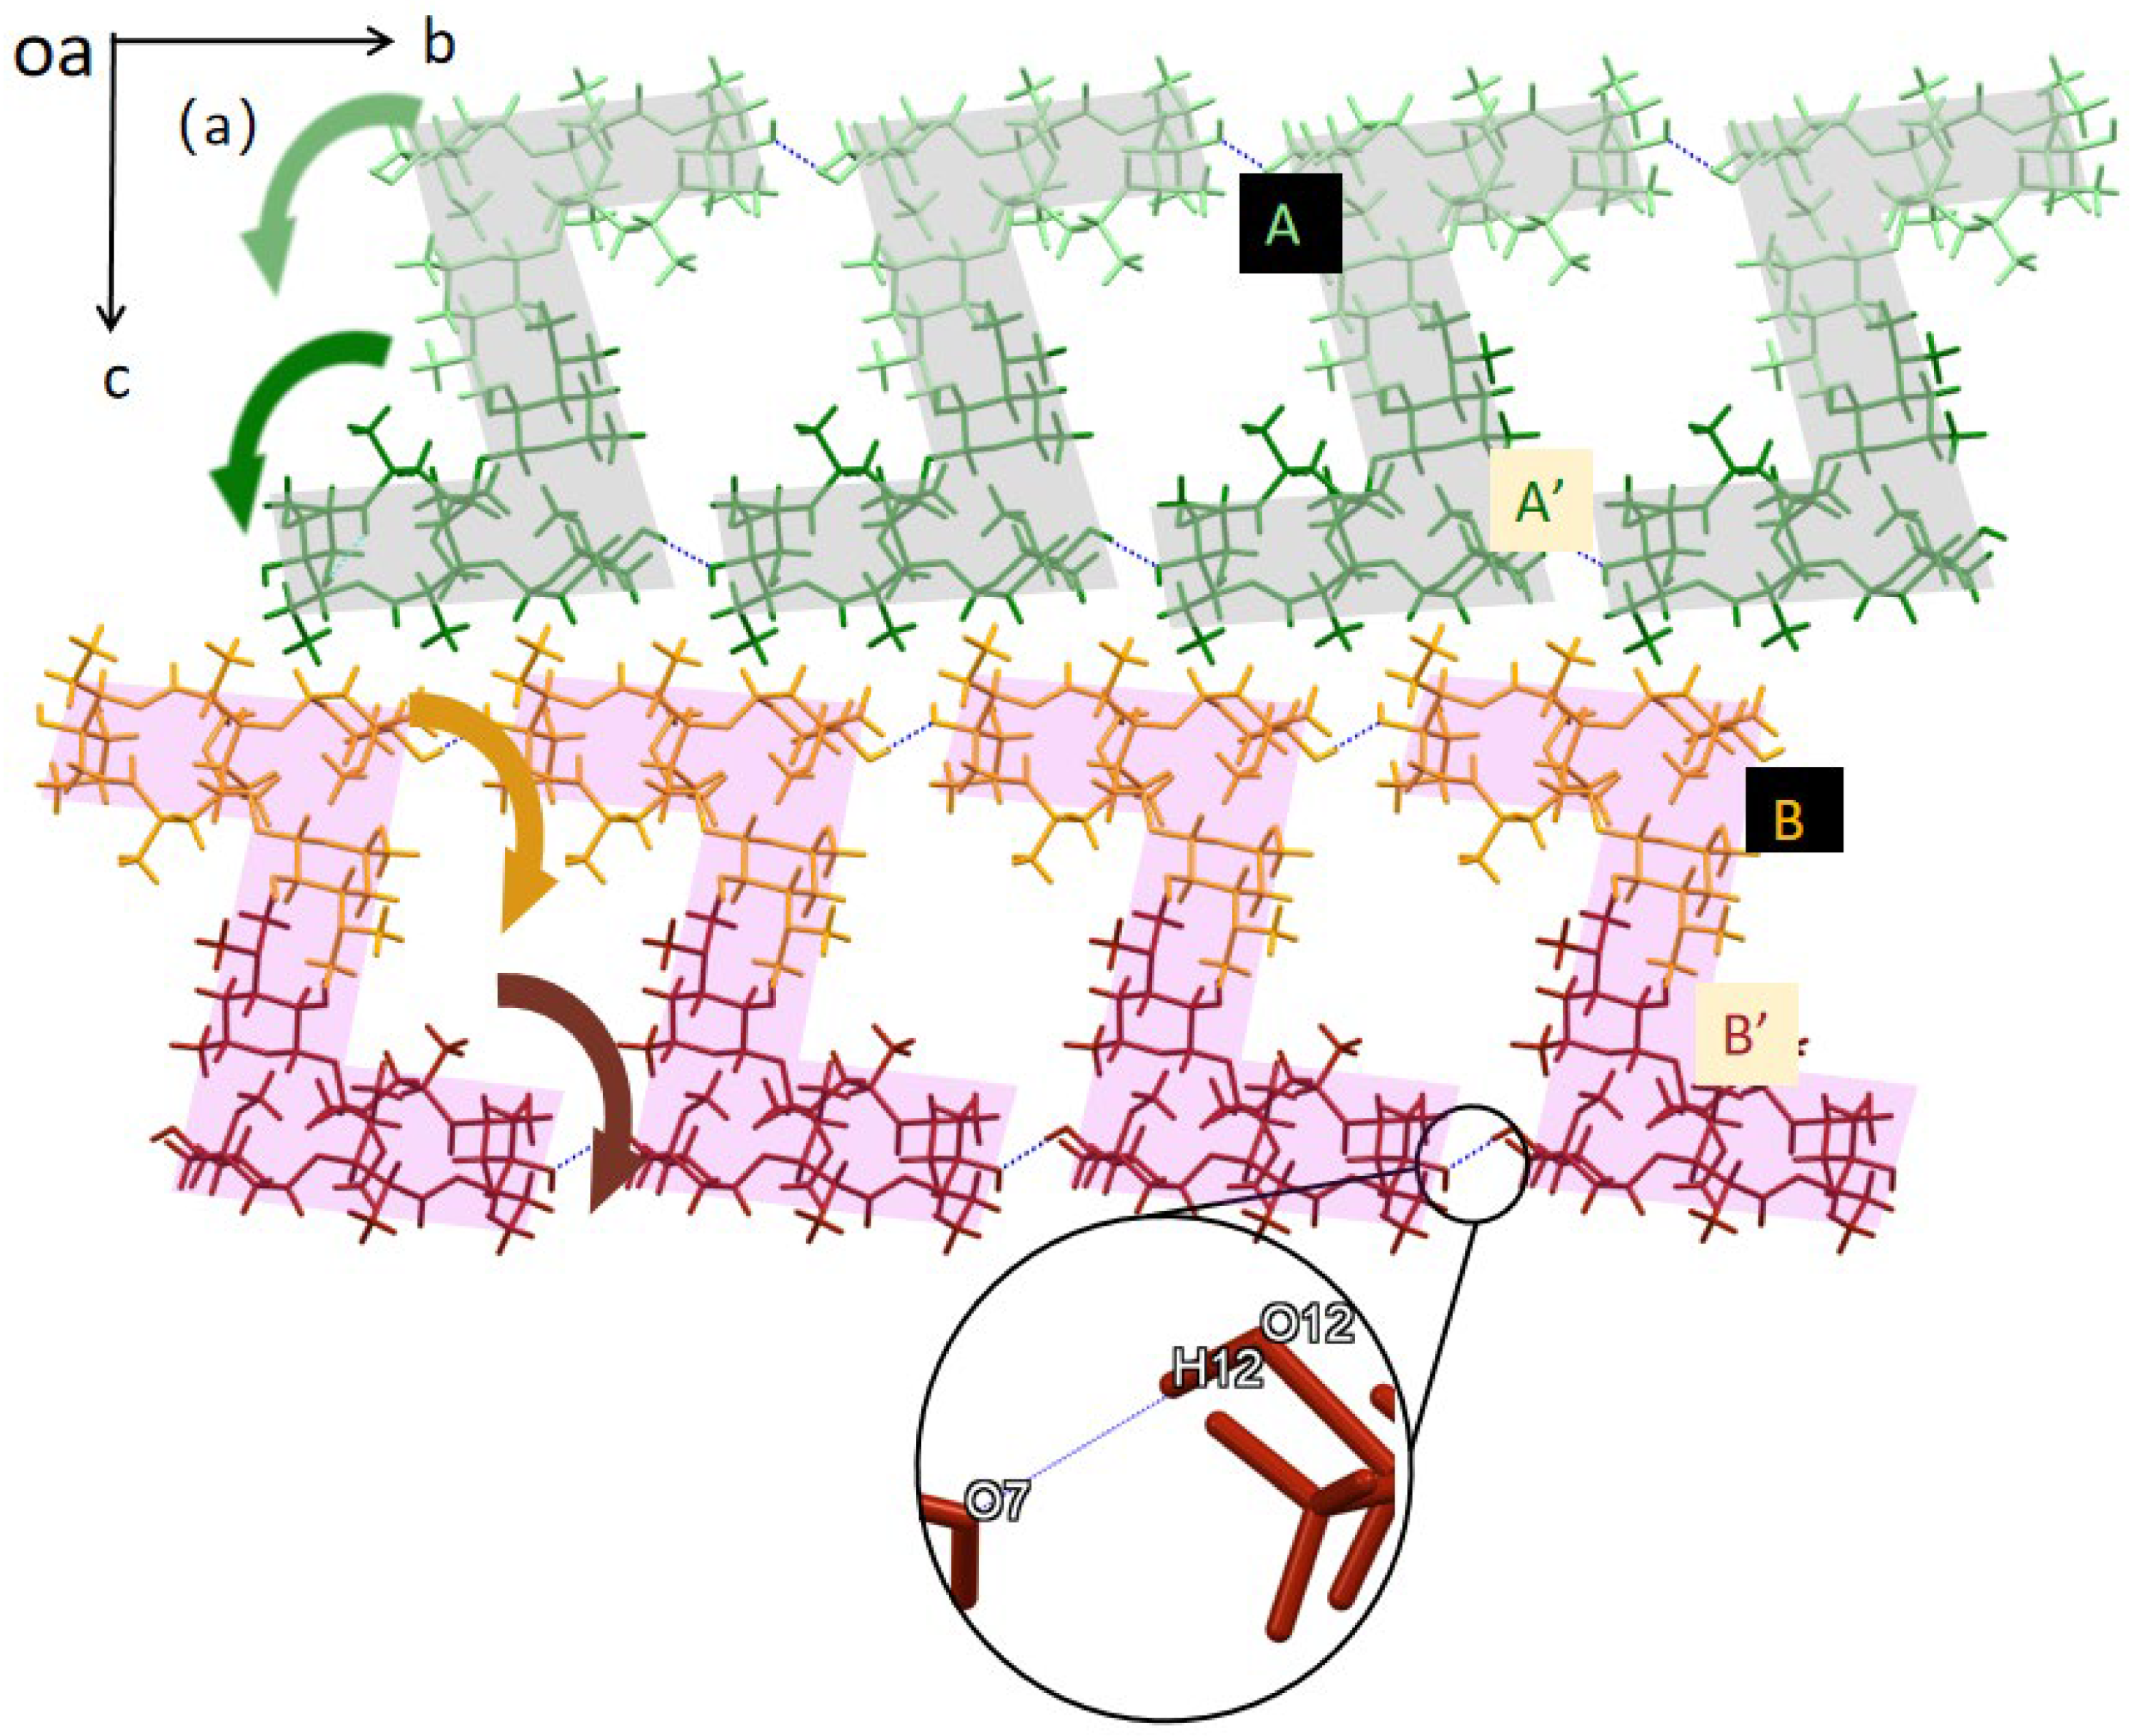
As shown in Figure 10a, in Form 0′, two adjacent CLA molecules along the c axis compose a Z-shaped structure by van der Waals forces. The adjacent Z-shaped structures along the b axis are connected by intermolecular hydrogen bond O12-H12…O7 to form a one-dimensional chain. O12-H12…O7 is the only type of intermolecular hydrogen bond in Form 0′, with O7 as the hydrogen bond acceptor and O12 on the 6-membered cladinose ring as the hydrogen bond donor. The two Z-shaped structures (e.g., gray ‘Z’ composed of molecules A (colored in light green) and A′ (colored in dark green), and pink ‘Z’ composed of molecules B (colored in orange) and B′ (colored in rose purple), respectively) in the up–down chains along the c axis orient oppositely and they are connected by van der Waals forces. As shown in Figure 10b, in Form II, two adjacent CLA molecules along the b axis form a Z-shaped structure in parallel through van der Waals forces. The adjacent Z-shaped structures along the b axis are connected to form a zigzag molecular chain by van der Waals forces. Along the c axis, the up–down molecular chains with opposite orientation are connected by intermolecular hydrogen bond O12…H7-O7, which is the only type of intermolecular hydrogen bond in Form II. Form 0′ is the metastable form with a void ratio of 21.6%, while Form II is the stable form with a void ratio of 5.4%. Molecular packing always tends to be closer and more stable. When Form 0′ is exposed in a CO2 atmosphere, CO2 will be adsorbed on O7, O9, O13, O6, and O5 of the CLA molecule. The adsorption of CO2 changes the electronegativity of the region around O7, resulting in the break of the hydrogen bond O12-H12…O7, which connects the two ‘Z’ structures in a molecular chain extending along the b axis. In the boc plane, the two molecules A and A′ (colored in light green and dark green, respectively) composing the ‘Z’ structure in the upper molecular chain (gray) rotate counterclockwise, while the two molecules B and B′ (colored in orange and reddish-brown, respectively) in the lower molecular chain (pink) rotate clockwise. Molecule A and its upper adjacent molecule B form an intermolecular hydrogen bond O7-H7…O12 through the OH on the 14-membered ring of molecule A and the O on the 6-membered cladinose ring of molecule B. At the same time, molecule A and its lower adjacent molecule B form another hydrogen bond O7-H7…O12. Similarly, molecule A′ connects to its upper and lower adjacent molecule B′ through two hydrogen bonds O7-H7…O12. The molecules reassemble into a densely packed zigzag arrangement structure (see Figure 10b). In this way, Form 0′ transforms into Form II after CO2 activation.
4. Conclusions
The currently reported methods of preparing Form II by CLA solvates require high temperature, high pressure, or vacuum, which means a large amount of energy cost. In this work, a new method for the conversion of CLA solvates to Form II promoted by 1 atm CO2 was proposed. The mechanism of the effect of CO2 was revealed through experiments and theoretical calculations.
First of all, three channel CLA solvates were prepared that are easy to remove solvents, namely the CLA-PAC solvate, CLA-IPA solvate, and CLA-EB solvate. The single crystal structures of the three solvates and Form 0′ were resolved for the first time by using SCXRD. The results showed that these are isomorphic. In the crystal structures of three solvates, the solvent molecules located in the channel did not form hydrogen bonds with the CLA molecules, only weak van der Waals forces. This is the reason why the solvent removal of the three solvates was easier than that of the CLA-Eth solvate. Thermal analysis and PXRD showed that the three solvates could desolvate in the temperature range of room temperature to 50 °C to form isostructural Form 0′. Form 0′ and Form II are monotropic, related to Form 0′ transforming into Form II at nearly 114 °C. Subsequently, the comparative experiment of the phase transformation in the air atmosphere and 1 atm CO2 atmosphere showed that CO2 had no obvious effect on the desolvation process of the solvates, while it could dramatically accelerate the polymorphic transformation of Form 0′ to Form II. In the 1 atm CO2 atmosphere, the conversion time was only 4 h, which was much less time than that in the air atmosphere. In addition, through the combination of the measurement of adsorption capacity, MEPS calculation, and crystal structure analysis, the mechanism of the CO2 effect on the polymorphic transformation was uncovered. The chemisorption of CO2 on O5, O6, O7, O9, and O13 of the CLA molecule with stronger electronegativity exposed on the crystal surfaces of Form 0′ changed the electronegativity of the region near O7, resulting in the break of the only type of hydrogen bond, O12-H12…O7, in Form 0′, and the formation of the hydrogen bond O7-H7…O12 to reassemble the molecules into Form II. Finally, a new pathway for the preparation of Form II from the CLA solvates was designed. Step 1: The solvates desolvate and transform into the structurally similar Form 0′ in 1 atm air. Step 2: Form 0′ transforms into the more stable Form II in 1 atm CO2. This work provides a successful case for the application of CO2 as an accelerator or alternative energy in the phase transformation of APIs, and also provides a new idea for the study of the mechanisms of polymorphic transformation.
Supplementary Materials
The following supporting information can be downloaded at: https://www.mdpi.com/article/10.3390/cryst14050394/s1, Figure S1: The custom built micro-vacuum box; Figure S2: The conformation overlays diagram of CLA Form 0′ (cyan), Form Ⅱ (red) and CLA-Eth solvate (orange); Figure S3: Molecular arrangement of CLA-Eth solvate crystal structure; Figure S4: DSC curve of CLA raw material; Figure S5: HSM snapshots of CLA-PAC solvate; Figure S6: DSC curve of the sample after the observation experiment by HSM; Figure S7: VT-PXRD of CLA-IPA solvate; Figure S8: VT-PXRD of CLA-EB solvate; Figure S9: The solvent residual in the sample after heating at 50 °C and 1atm CO2 for different duration; Figure S10: The solvent residual in the sample after heating at 50 °C and 1atm air for different duration; Figure S11: The change of solvent residual in CLA-PAC solvate with time; Figure S12: (a) DSC curve, (b) PXRD of the sample prepared by pathway; Figure S13: The morphology of CLA Form 0′ predicted by BFDH model; Figure S14: Molecular arrangements on crystal faces (101), (002), (011) and (110) of Form 0′; Figure S15: The model of the adsorption of CO2 on Form 0′ (Purple represents for N atoms, red for oxygen atoms, light pink for hydrogen atoms, and brown for carbon atoms); Table S1: Crystallographic data of CLA-Eth solvate.
Author Contributions
Data curation, L.H.; Formal analysis, Y.W.; Methodology, L.H.; Resources, D.J.; Software, L.H.; Writing—original draft, L.H., Y.W. and Y.B.; Writing—review and editing, L.H. and Y.B. All authors have read and agreed to the published version of the manuscript.
Funding
This research received no external funding.
Data Availability Statement
Crystallographic information files are available from the Cambridge Crystallographic Data Center (CCDC) upon request (http://www.ccdc.cam.ac.uk, CCDC deposition numbers 2339163−2339166).
Conflicts of Interest
D.J. is employed by the company Asymchem Life Science (Tianjin) Co., Ltd., and remaining authors declare that no conflicts of interest.
References
- Du, D.; Shi, Z.P.; Ren, G.B.; Qi, M.H.; Li, Z.; Xu, X.Y. Preparation and characterization of several azoxystrobin channel solvates. J. Mol. Struct. 2019, 1189, 40–50. [Google Scholar] [CrossRef]
- Bērziņš, A.; Trimdale, A.; Kons, A.; Zvanina, D. On the Formation and Desolvation Mechanism of Organic Molecule Solvates: A Structural Study of Methyl Cholate Solvates. Cryst. Growth Des. 2017, 17, 5712–5724. [Google Scholar] [CrossRef]
- Yuan, W.; Yu, C.; Xu, S.; Ni, L.; Xu, W.; Shan, G.; Bao, Y.; Pan, P. Self-evolving materials based on metastable-tostable crystal transition of a polymorphic. Mater. Horiz. 2022, 9, 756–763. [Google Scholar] [CrossRef]
- Jin, M. Mechanical-Stimulation-Triggered and Solvent-Vapor-Induced Reverse Single-Crystal-to-Single-Crystal Phase Transitions with Alterations of the Luminescence Color. J. Am. Chem. Soc. 2018, 140, 2875–2879. [Google Scholar] [CrossRef]
- Hanna, S.L.; Zhang, X.; Otake, K.I.; Drout, R.J.; Li, P.; Islamoglu, T.; Farha, O.K. Guest-Dependent Single-Crystal-to-Single-Crystal Phase Transitions in a Two-Dimensional Uranyl-Based Metal−Organic Framework. Cryst. Growth Des. 2019, 19, 506–512. [Google Scholar] [CrossRef]
- Liao, X.; He, J.; Yu, J. Process analysis of phase transformation of a to b-form crystal of syndiotactic polystyrene investigated in supercritical CO2. Polymer 2005, 46, 5789–5796. [Google Scholar] [CrossRef]
- Ramachandran, J.P.; Antony, A.; Ramakrishnan, R.M.; Wallen, S.L.; Raveendran, P. CO2-solvated liquefaction of polyethylene glycol (PEG): A novel, green process for the preparation of drug-excipient composites at low temperatures. J. CO2 Util. 2022, 59, 101971. [Google Scholar]
- Ramachandran, J.P.; Kottammal, A.P.; Antony, A.; Ramakrishnan, R.M.; Wallen, S.L.; Raveendran, P. Green processing: CO2-induced glassification of sucrose octaacetate and its implications in the spontaneous release of drug from drug-excipient composites. J. CO2 Util. 2021, 47, 101472. [Google Scholar] [CrossRef]
- Hu, D.; Li, W.; Wu, K.; Cui, L.; Xu, Z.; Zhao, L. Utilization of supercritical CO2 for controlling the crystal phase transition and cell morphology of isotactic polybutene-1 foams. J. CO2 Util. 2022, 66, 102265. [Google Scholar] [CrossRef]
- Tian, J.; Thallapally, P.K.; Dalgarno, S.J.; Atwood, J.L. Free Transport of Water and CO2 in Nonporous Hydrophobic Clarithromycin Form II Crystals. J. Am. Chem. Soc. 2009, 131, 13216–13217. [Google Scholar] [CrossRef]
- Sohn, Y.-T.; Rhee, J.-K.; Im, W.-B. Polymorphism of Clarithromycin. Pharmacol. Toxicol. Pharm. 2000, 4, 381–384. [Google Scholar] [CrossRef] [PubMed]
- Liang, J.H.; Yao, G.W. A New Crystal Structure of Clarithromycin. J. Chem. Crystallogr. 2008, 38, 61–64. [Google Scholar] [CrossRef]
- Ito, M.; Shiba, R.; Watanabe, M.; Iwao, Y.; Itai, S.; Noguchi, S. Phase transitions of antibiotic clarithromycin forms I, IV and new form VII crystals. Int. J. Pharm. 2018, 547, 258–264. [Google Scholar] [CrossRef] [PubMed]
- Iwasaki, H.; Sugawara, Y.; Adachi, T.; Morimoto, S.; Watanabe, Y. Structure of 6-O-methylerythromycin A (clarithromycin). Acta Crystallogr. Sect. C Cryst. Struct. Commun. 1993, 49, 1227–1230. [Google Scholar] [CrossRef]
- Tian, J.; Dalgarno, S.J.; Atwood, J.L. A New Strategy of Transforming Pharmaceutical Crystal Forms. J. Am. Chem. Soc. 2011, 133, 1399–1404. [Google Scholar] [CrossRef] [PubMed]
- Henry, R.; Zhang, G.G. Crystallographic characterization of several erythromycin A solvates: The environment of the solvent molecules in the crystal lattice. J. Pharm. Sci. 2007, 96, 1251–1257. [Google Scholar] [CrossRef] [PubMed]
- Baronsky, J.; Preu, M.; Traeubel, M.; Urbanetz, N.A. Perfusion calorimetry in the characterization of solvates forming isomorphic desolvates. Eur. J. Pharm. Sci. 2011, 44, 74–82. [Google Scholar] [CrossRef] [PubMed]
- Kuncham, S.; Shete, G.; Bansal, A.K. Quantification of clarithromycin polymorphs in presence of tablet excipients. J. Excip. Food Chem. 2000, 5, 65–78. [Google Scholar]
- Miñambres, G.G.; Aiassa, V.; Longhi, M.R.; Chattah, A.K.; Garnero, C. Insights into the ethanol solvate form of clarithromycin. J. Mol. Struct. 2022, 1264, 133170. [Google Scholar] [CrossRef]
- Rajbhar, P.; Sahu, A.K.; Gautam, S.S.; Prasad, R.K.; Singh, V.; Nair, S.K. Formulation and Evaluation of Clarithromycin CoCrystals Tablets Dosage Forms to Enhance the Bioavailability. Pharma Innov. J. 2016, 5, 5–13. [Google Scholar]
- Liu, J.-H.; Riley, D.A. Herstellung von Kristallinen Form II von Clarithromycin. WO1998004574A1, 5 February 1998. [Google Scholar]
- Gildea, R.J.; Bourhis, L.J.; Dolomanov, O.V.; Grosse-Kunstleve, R.W.; Puschmann, H.; Adams, P.D.; Howard, J.A. iotbx.cif: A comprehensive CIF toolbox. J. Appl. Crystallogr. 2011, 44 Pt 6, 1259–1263. [Google Scholar] [CrossRef] [PubMed]
- Sheldrick, G.M. Crystal structure refinement with SHELXL. Acta Crystallogr. C Struct. Chem. 2015, 71 Pt 1, 3–8. [Google Scholar] [CrossRef] [PubMed]
- Sheldrick, G.M. SHELXT—Integrated space-group and crystal-structure determination. Acta Crystallogr. A Found. Adv. 2015, 71 Pt 1, 3–8. [Google Scholar] [CrossRef] [PubMed]
- Scalmani, G.; Frisch, M.J. Comment on “A smooth, nonsingular, and faithful discretization scheme for polarizable continuum models: The switching/gaussian approach” [J. Chem. Phys. 133, 244111 (2010)]. J. Chem. Phys. 2011, 134, 117101. [Google Scholar] [CrossRef] [PubMed]
- Lu, T.; Chen, F. Multiwfn: A multifunctional wavefunction analyzer. J. Comput. Chem. 2012, 33, 580–592. [Google Scholar] [CrossRef]
- Humphrey, W.; Dalke, A.; Schulten, K. VMD: Visual molecular dynamics. J. Mol. Graph. 1996, 14, 33–38. [Google Scholar] [CrossRef] [PubMed]
- Grimme, S.; Antony, J.; Ehrlich, S.; Krieg, H. A consistent and accurate ab initio parametrization of density functional dispersion correction (DFT-D) for the 94 elements H-Pu. J. Chem. Phys. 2010, 132, 154104. [Google Scholar] [CrossRef]
- Grimme, S.; Ehrlich, S.; Goerigk, L. Effect of the damping function in dispersion corrected density functional theory. J. Comput. Chem. 2011, 32, 1456–1465. [Google Scholar] [CrossRef] [PubMed]
- Hehre, W.J.; Ditchfield, R.; Pople, J.A. Self—Consistent molecular orbital methods. XII. Further extensions of Gaussian—Type basis sets for use in molecular orbital studies of organic molecules. J. Chem. Phys. 1972, 5, 2257–2261. [Google Scholar] [CrossRef]
- Zhang, J.; Lu, T. Efficient evaluation of electrostatic potential with computerized optimized code. Phys. Chem. Chem. Phys. 2021, 23, 20323–20328. [Google Scholar] [CrossRef]
- Sun, H. COMPASS: An ab initio force-field optimized for condensed-phase applications overview with details on alkane and benzene compounds. J. Phys. Chem. B 1998, 38, 7338–7364. [Google Scholar] [CrossRef]
- Hartman, P.; Bennema, P. The attachment energy as a habit controlling factor: I. Theoretical considerations. J. Cryst. Growth 1980, 1, 145–156. [Google Scholar] [CrossRef]
- Li, W. Studies on thermal decomposition mechanism of clarithromycin and determination of the kinetic parameters. Chin. J. Antibiot. 2009, 34, 419–421. [Google Scholar]
Figure 1.
Molecular structure of CLA.Oxygen at 13 different locations in CLA was labeled in red.
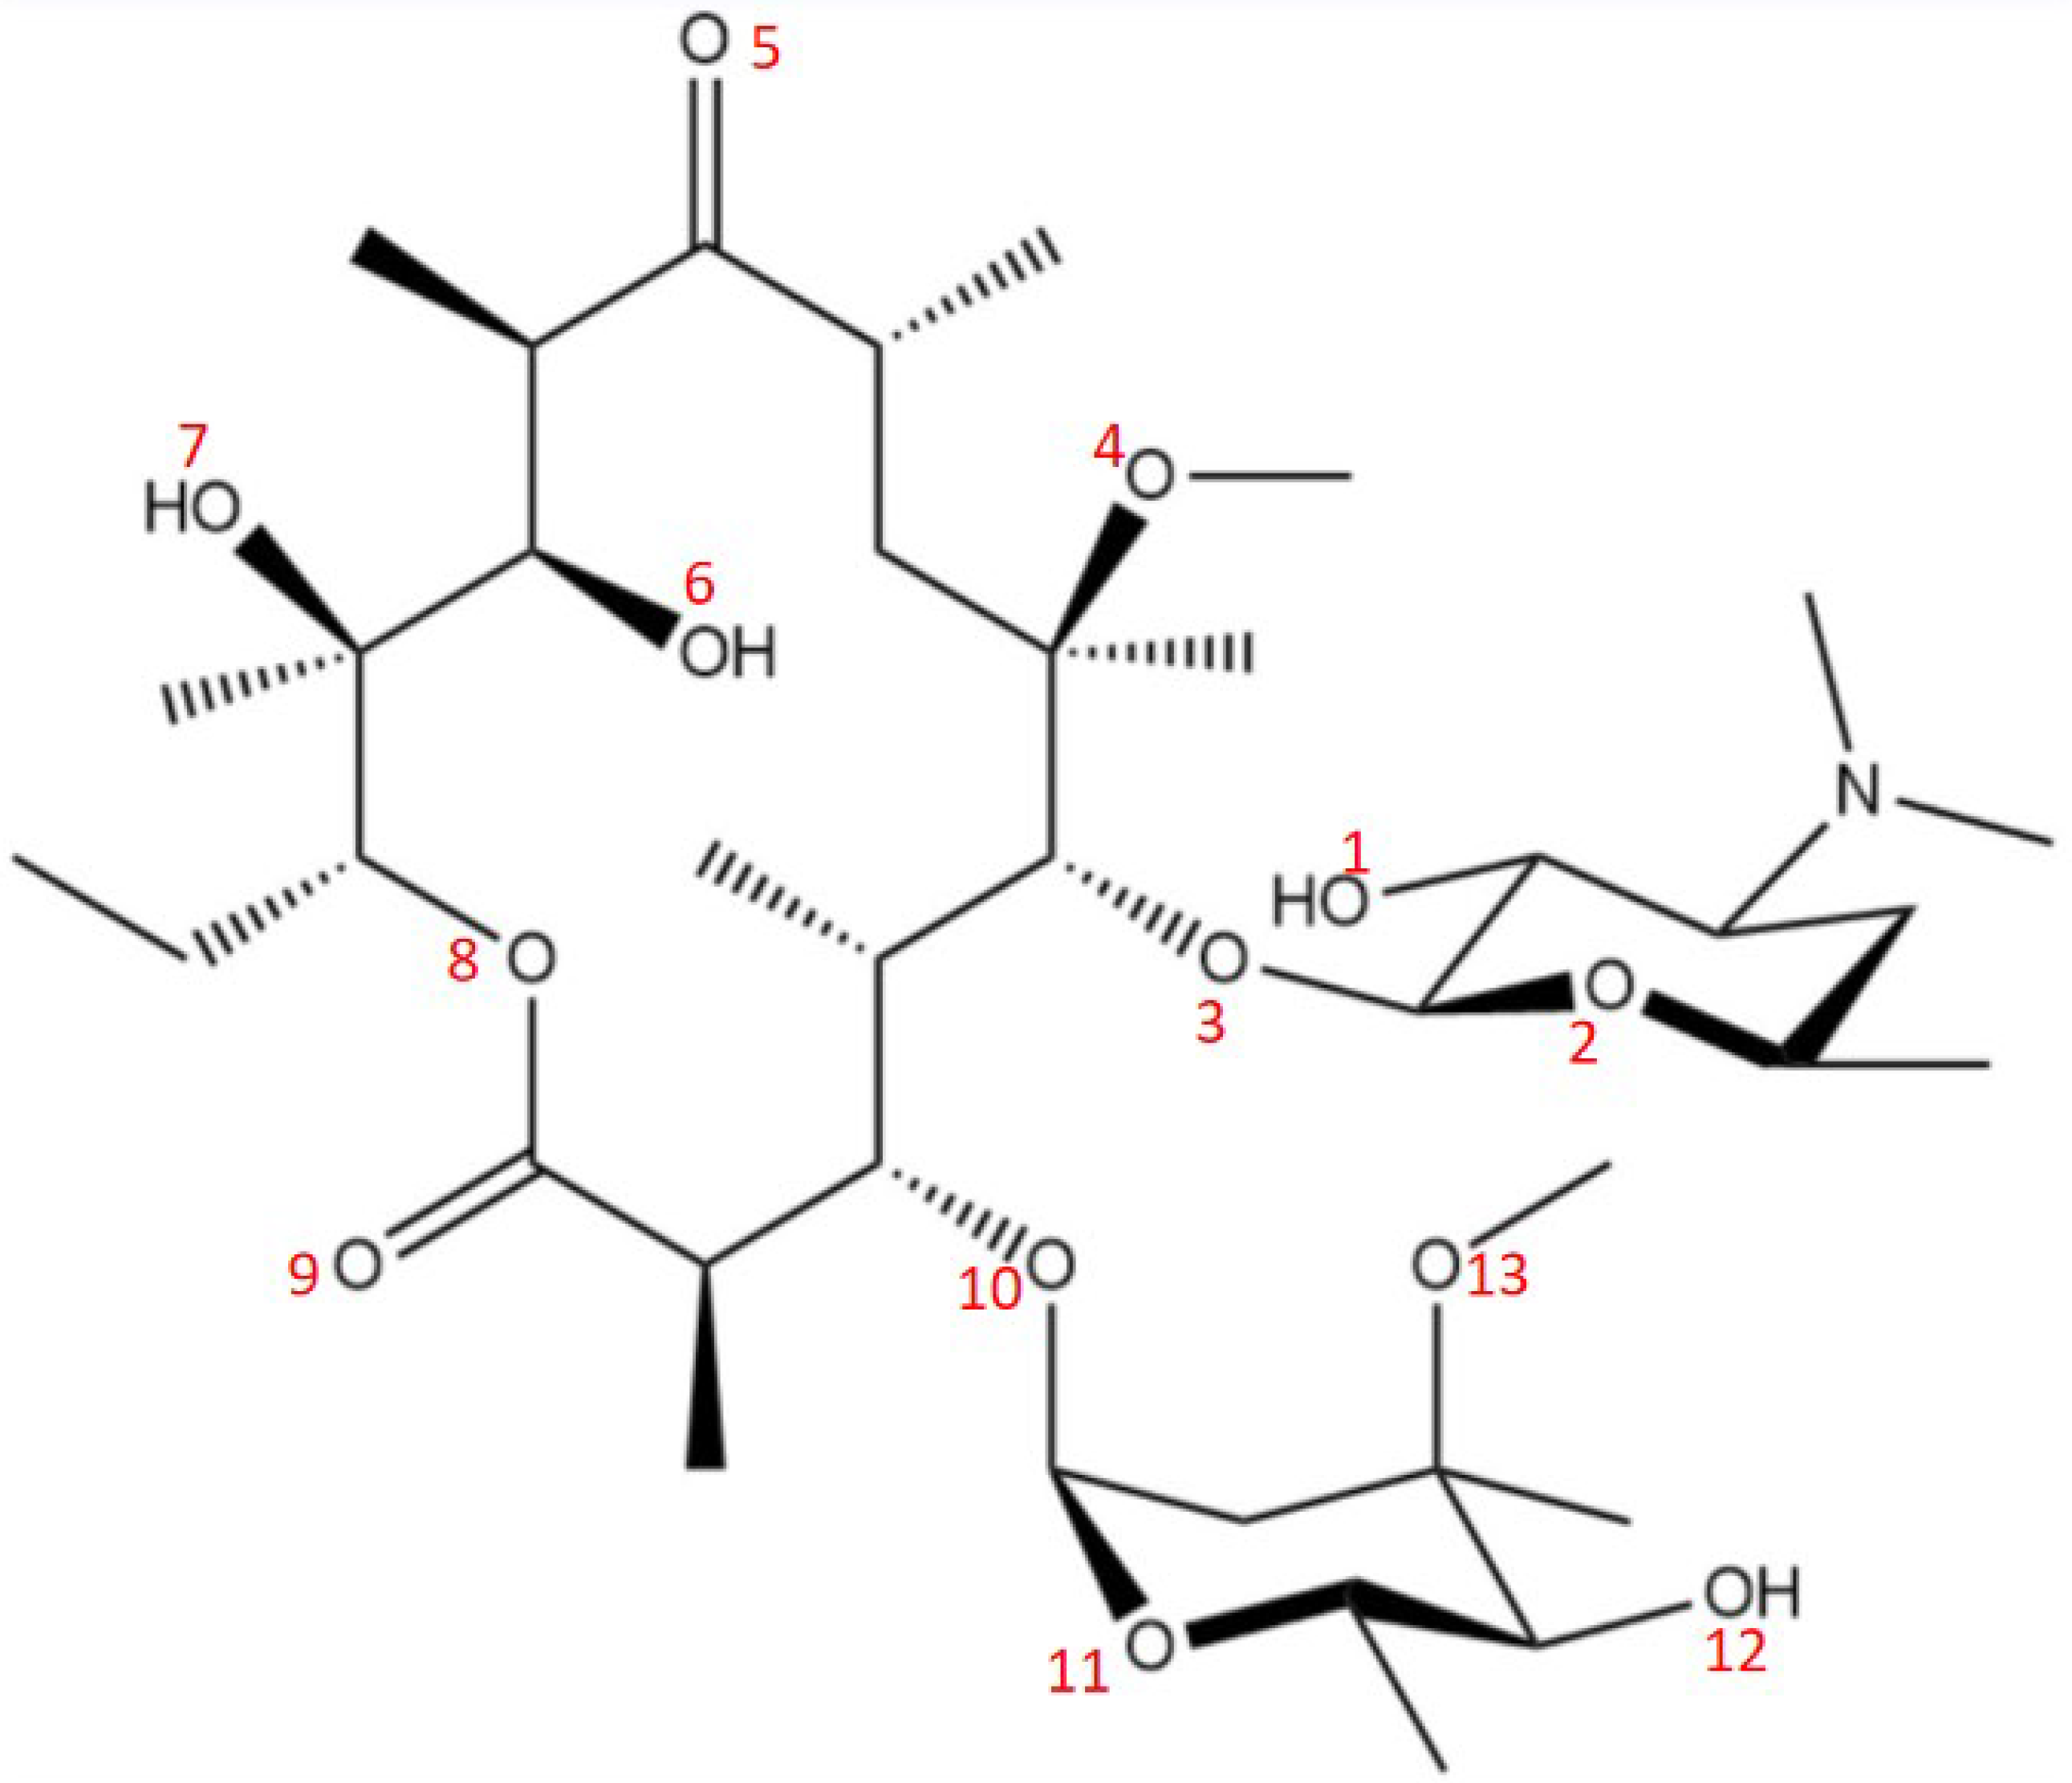
Figure 2.
Molecular arrangements of Form 0′ and three solvates. (a) Form 0′, (b) CLA-PAC solvate, (c) CLA-IPA solvate, (d) CLA-EB solvate, where the blue dashed circles represent the channel structure; CLA, PAC, IPA, and EB molecules are colored in light blue, purple, green, and red, respectively.
Figure 2.
Molecular arrangements of Form 0′ and three solvates. (a) Form 0′, (b) CLA-PAC solvate, (c) CLA-IPA solvate, (d) CLA-EB solvate, where the blue dashed circles represent the channel structure; CLA, PAC, IPA, and EB molecules are colored in light blue, purple, green, and red, respectively.

Figure 3.
(a) TGA curve. (b) DSC curve of Form 0′. (c) TGA curve. (d) DSC curve of the three solvates.
Figure 3.
(a) TGA curve. (b) DSC curve of Form 0′. (c) TGA curve. (d) DSC curve of the three solvates.
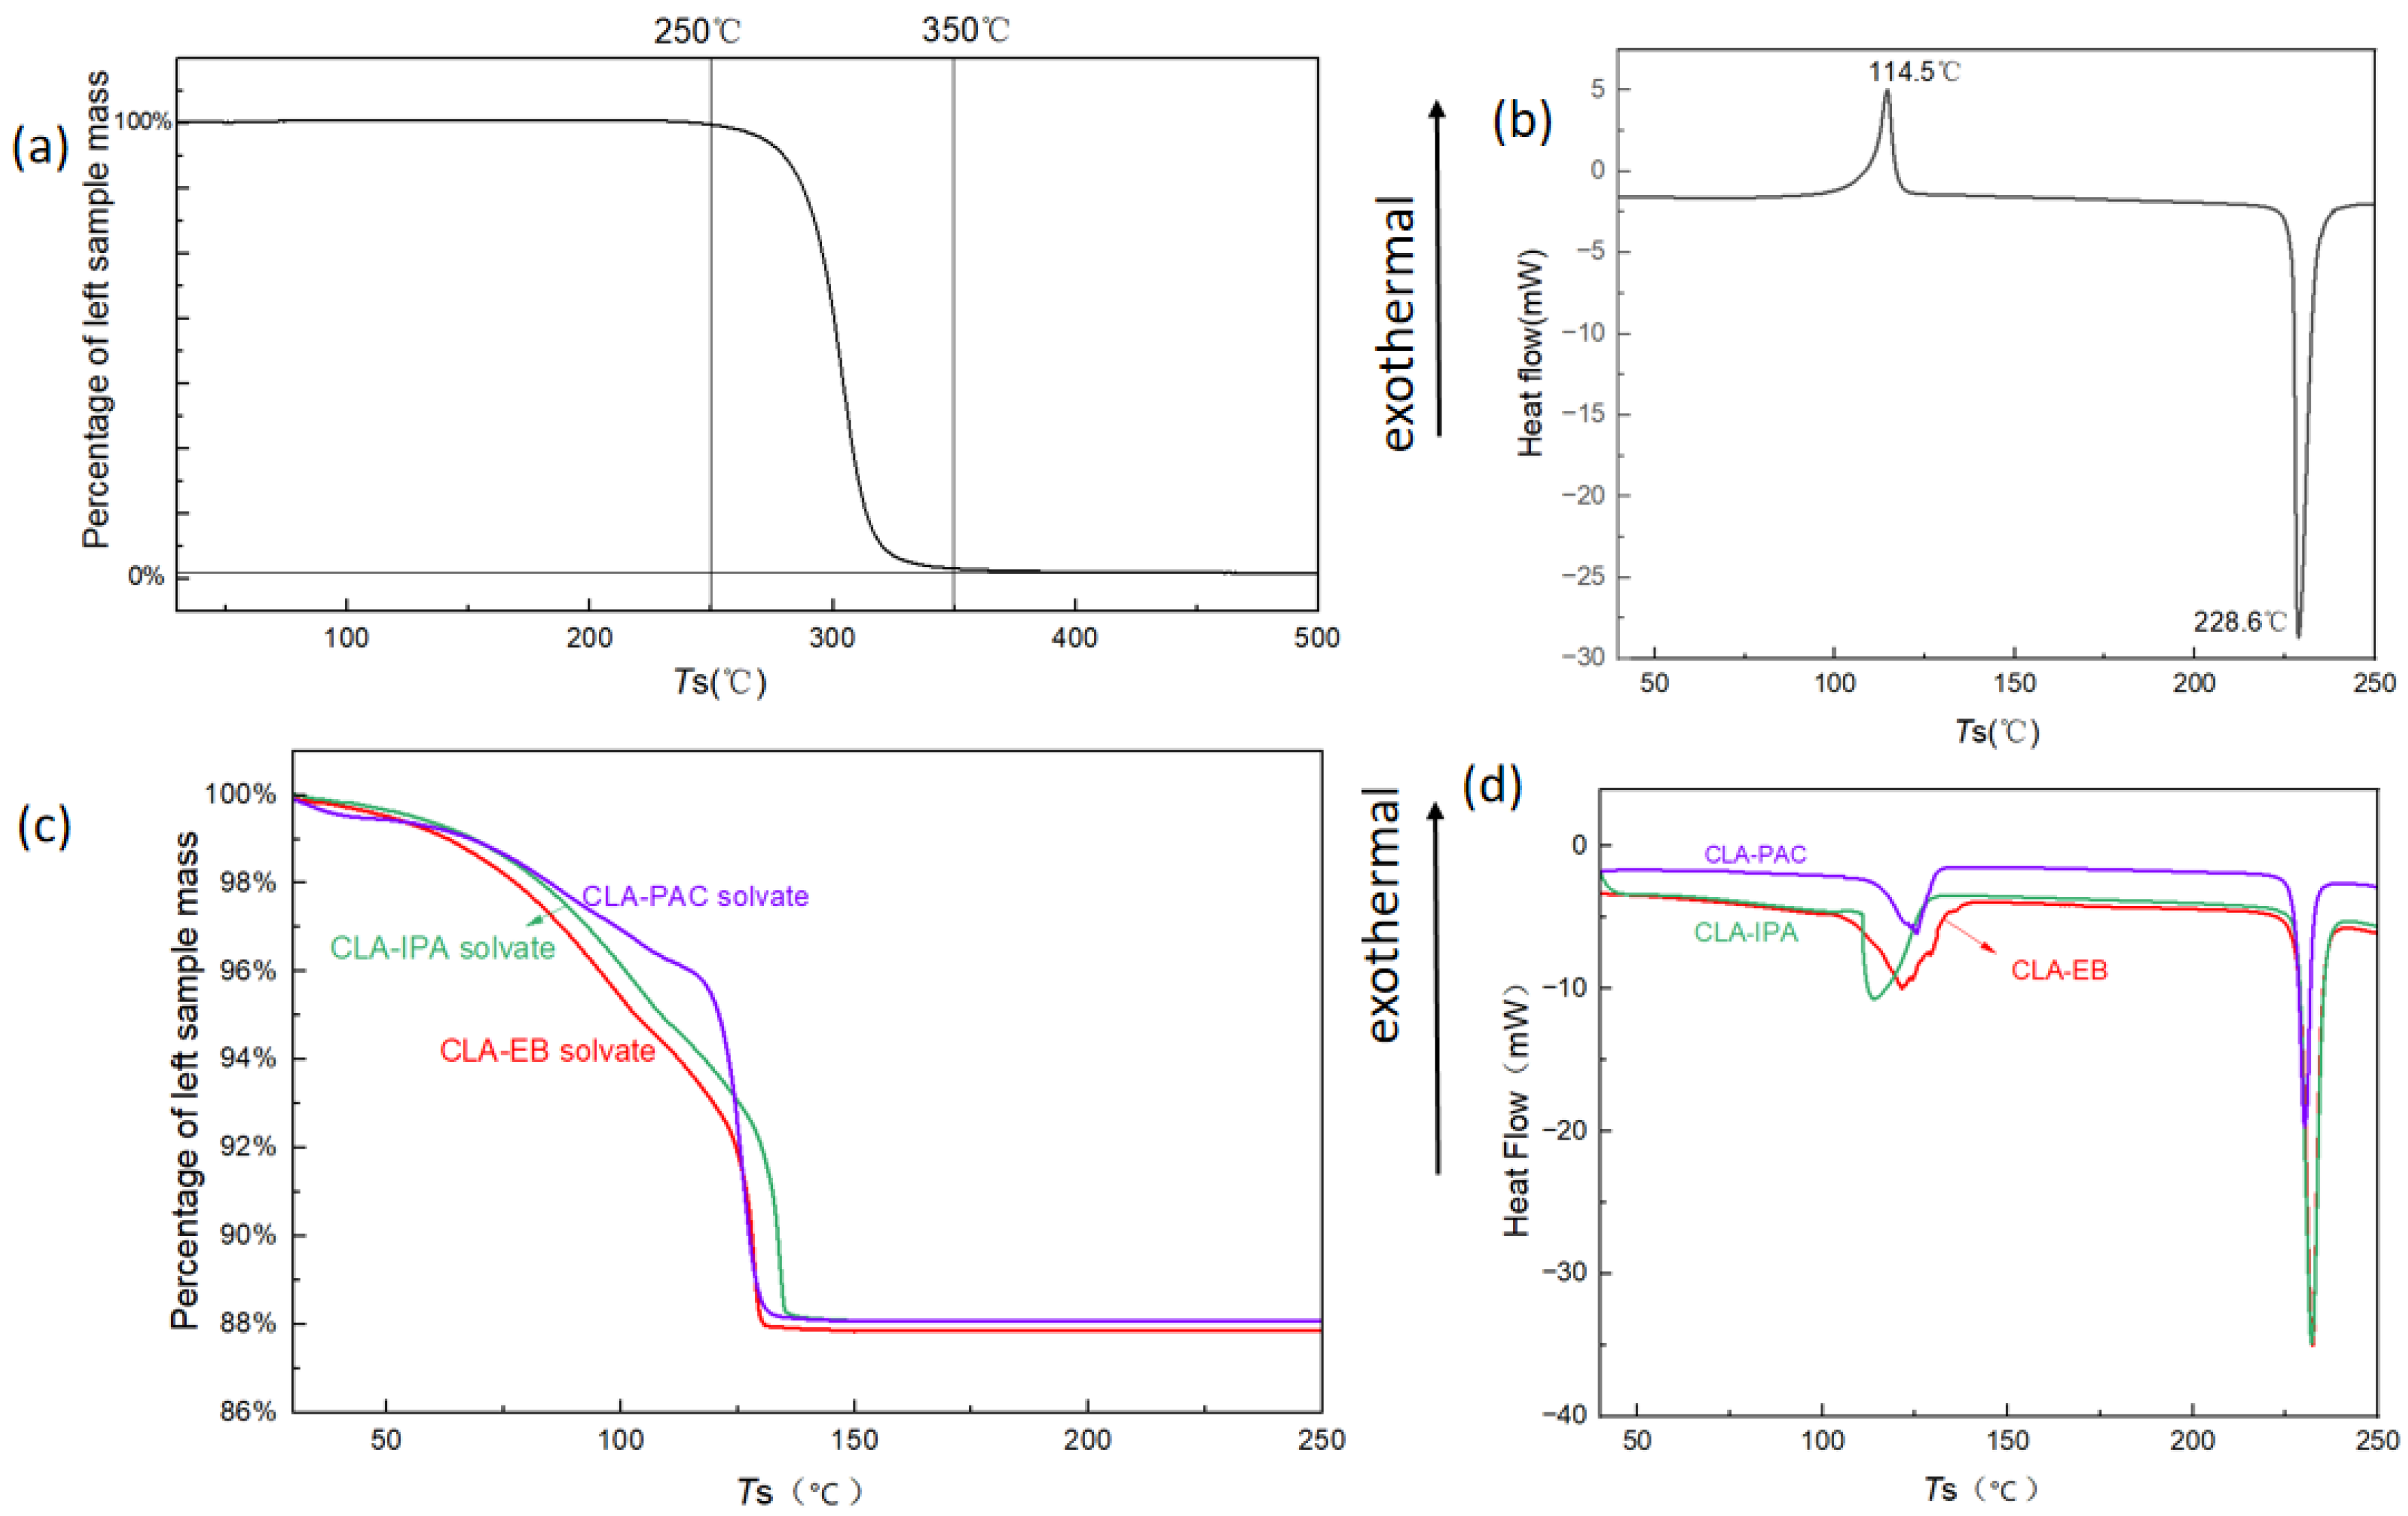
Figure 4.
(a) DSC of the mixture obtained after the solvate was processed by method (2). (b) DSC of heating the CLA-PAC solvate processed by method (1) for different hours. (c) Temperature of the exothermic peak changing with the heating duration.
Figure 4.
(a) DSC of the mixture obtained after the solvate was processed by method (2). (b) DSC of heating the CLA-PAC solvate processed by method (1) for different hours. (c) Temperature of the exothermic peak changing with the heating duration.
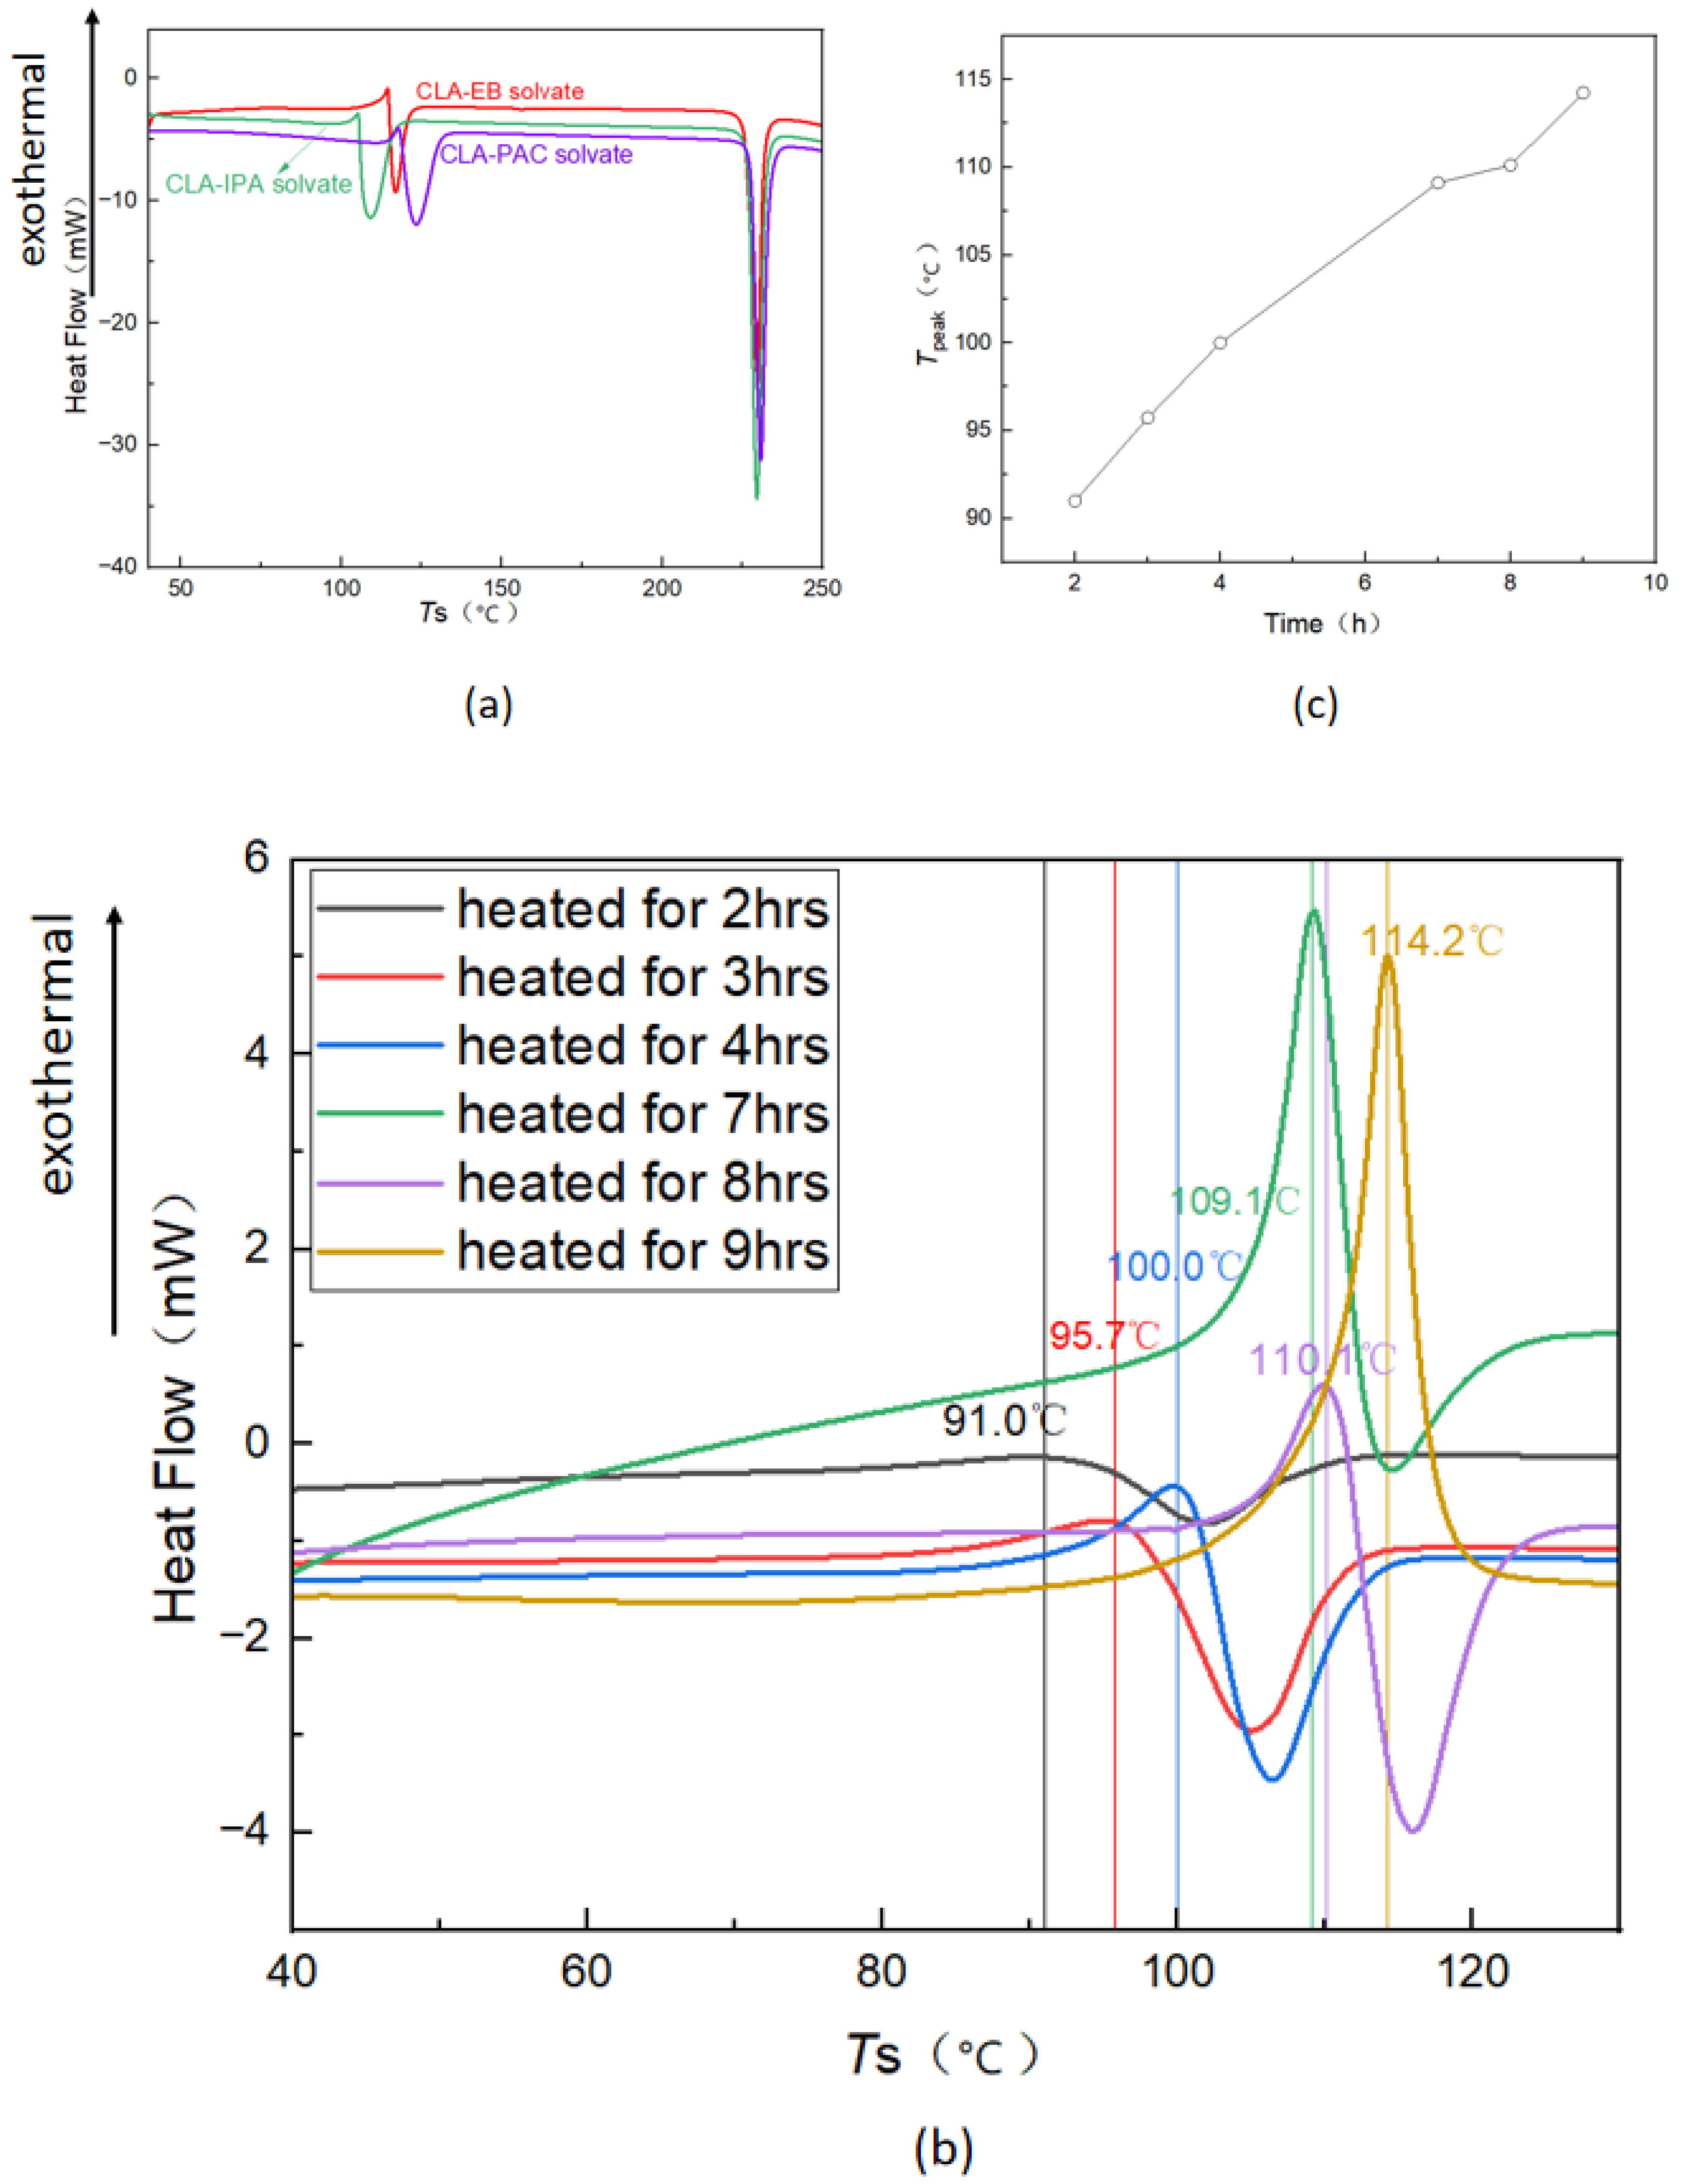
Figure 5.
(a) Experimental and calculated PXRD patterns of the solvates and Form 0′. (b) VT-PXRD patterns of CLA Form 0′ (In (b), the red circle represents the disappeared peaks, while the yellow triangle marks represent the peaks belong to the formed crystal). (c) VT-PXRD patterns of the CLA-PAC solvate (In (c), the yellow triangle marks represent the peaks belong to the formed crystal, while the green and the black circle marks represent the disappeared peaks).
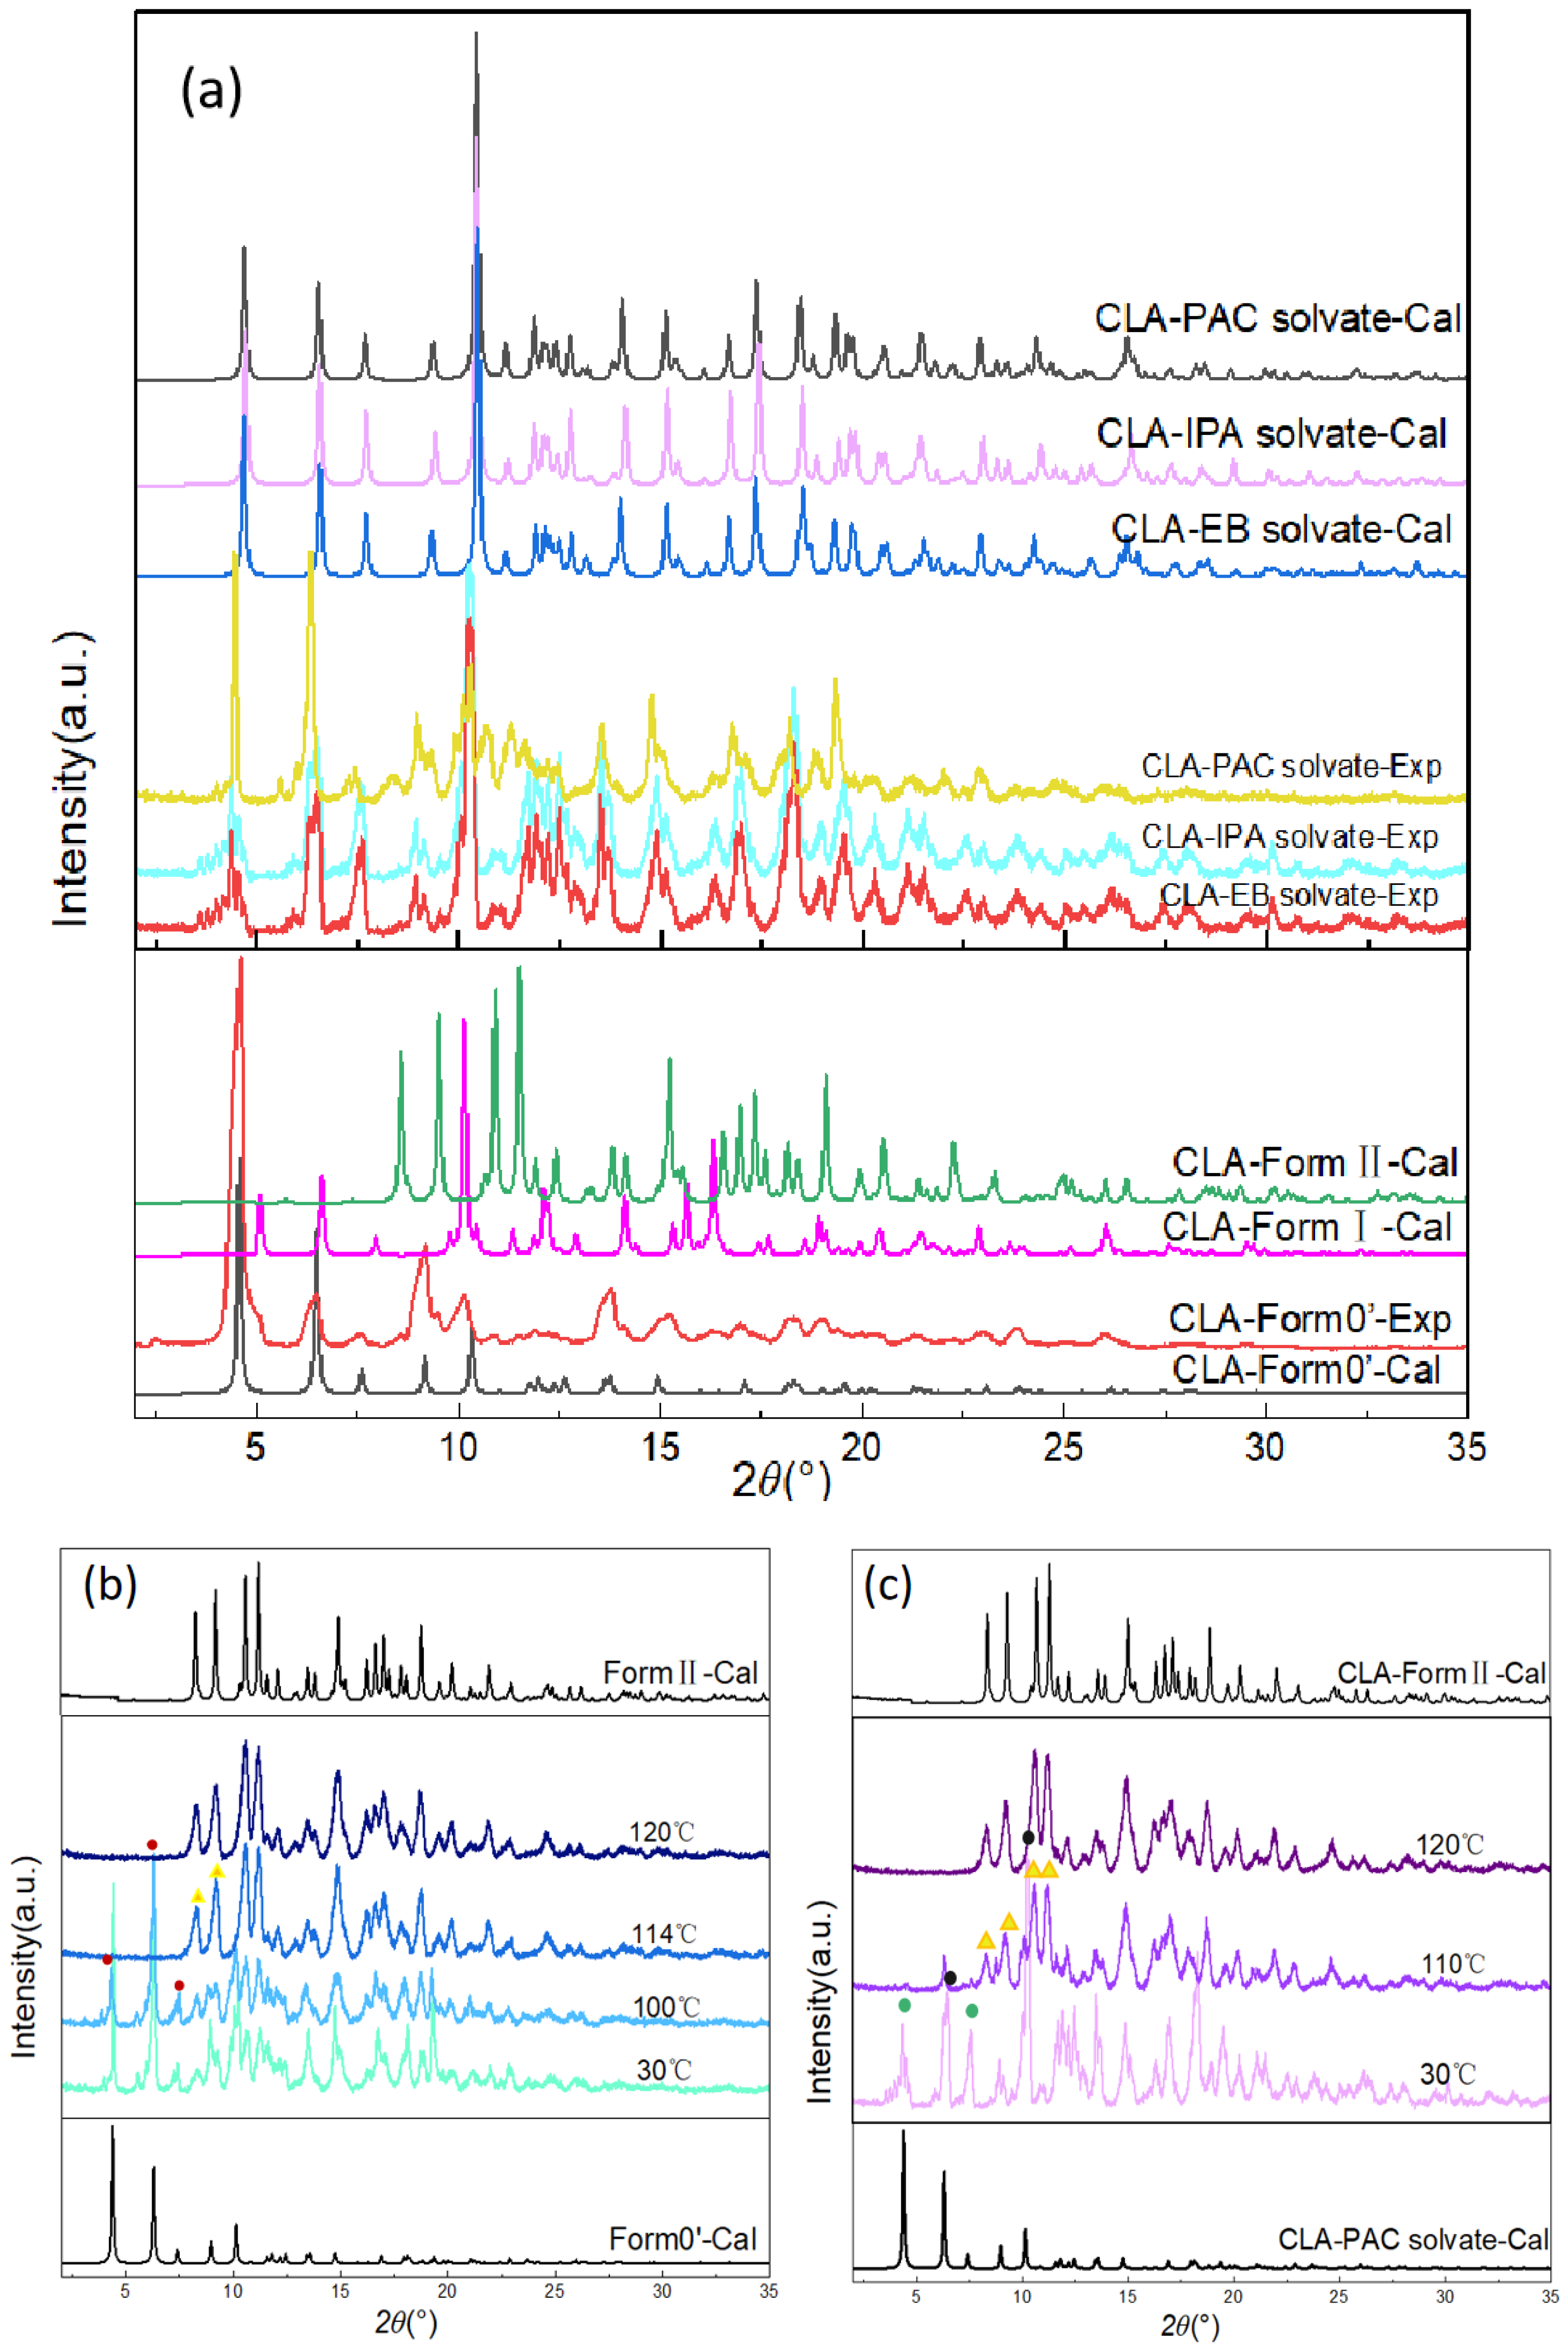
Figure 6.
Three pathways of transforming the solvates to Form II (For pathway a: the solvates are directly transformed to Form II by heated in 100~110 °C; for pathway b: the solvates have the chance to desolvate at room temperature~50 °C, forming Form 0′. And then by being heated in 114 °C, Form 0′ transform to Form II; for pathway c: the solvates have the chance to desolvate at room temperature~50 °C, forming Form 0′. With Form 0′ being heated in 50 °C under 1 atm CO2, Form II is formed).

Figure 7.
Polymorphic transformation of Form 0′ in (a) 1 atm CO2; (b) 1 atm air.
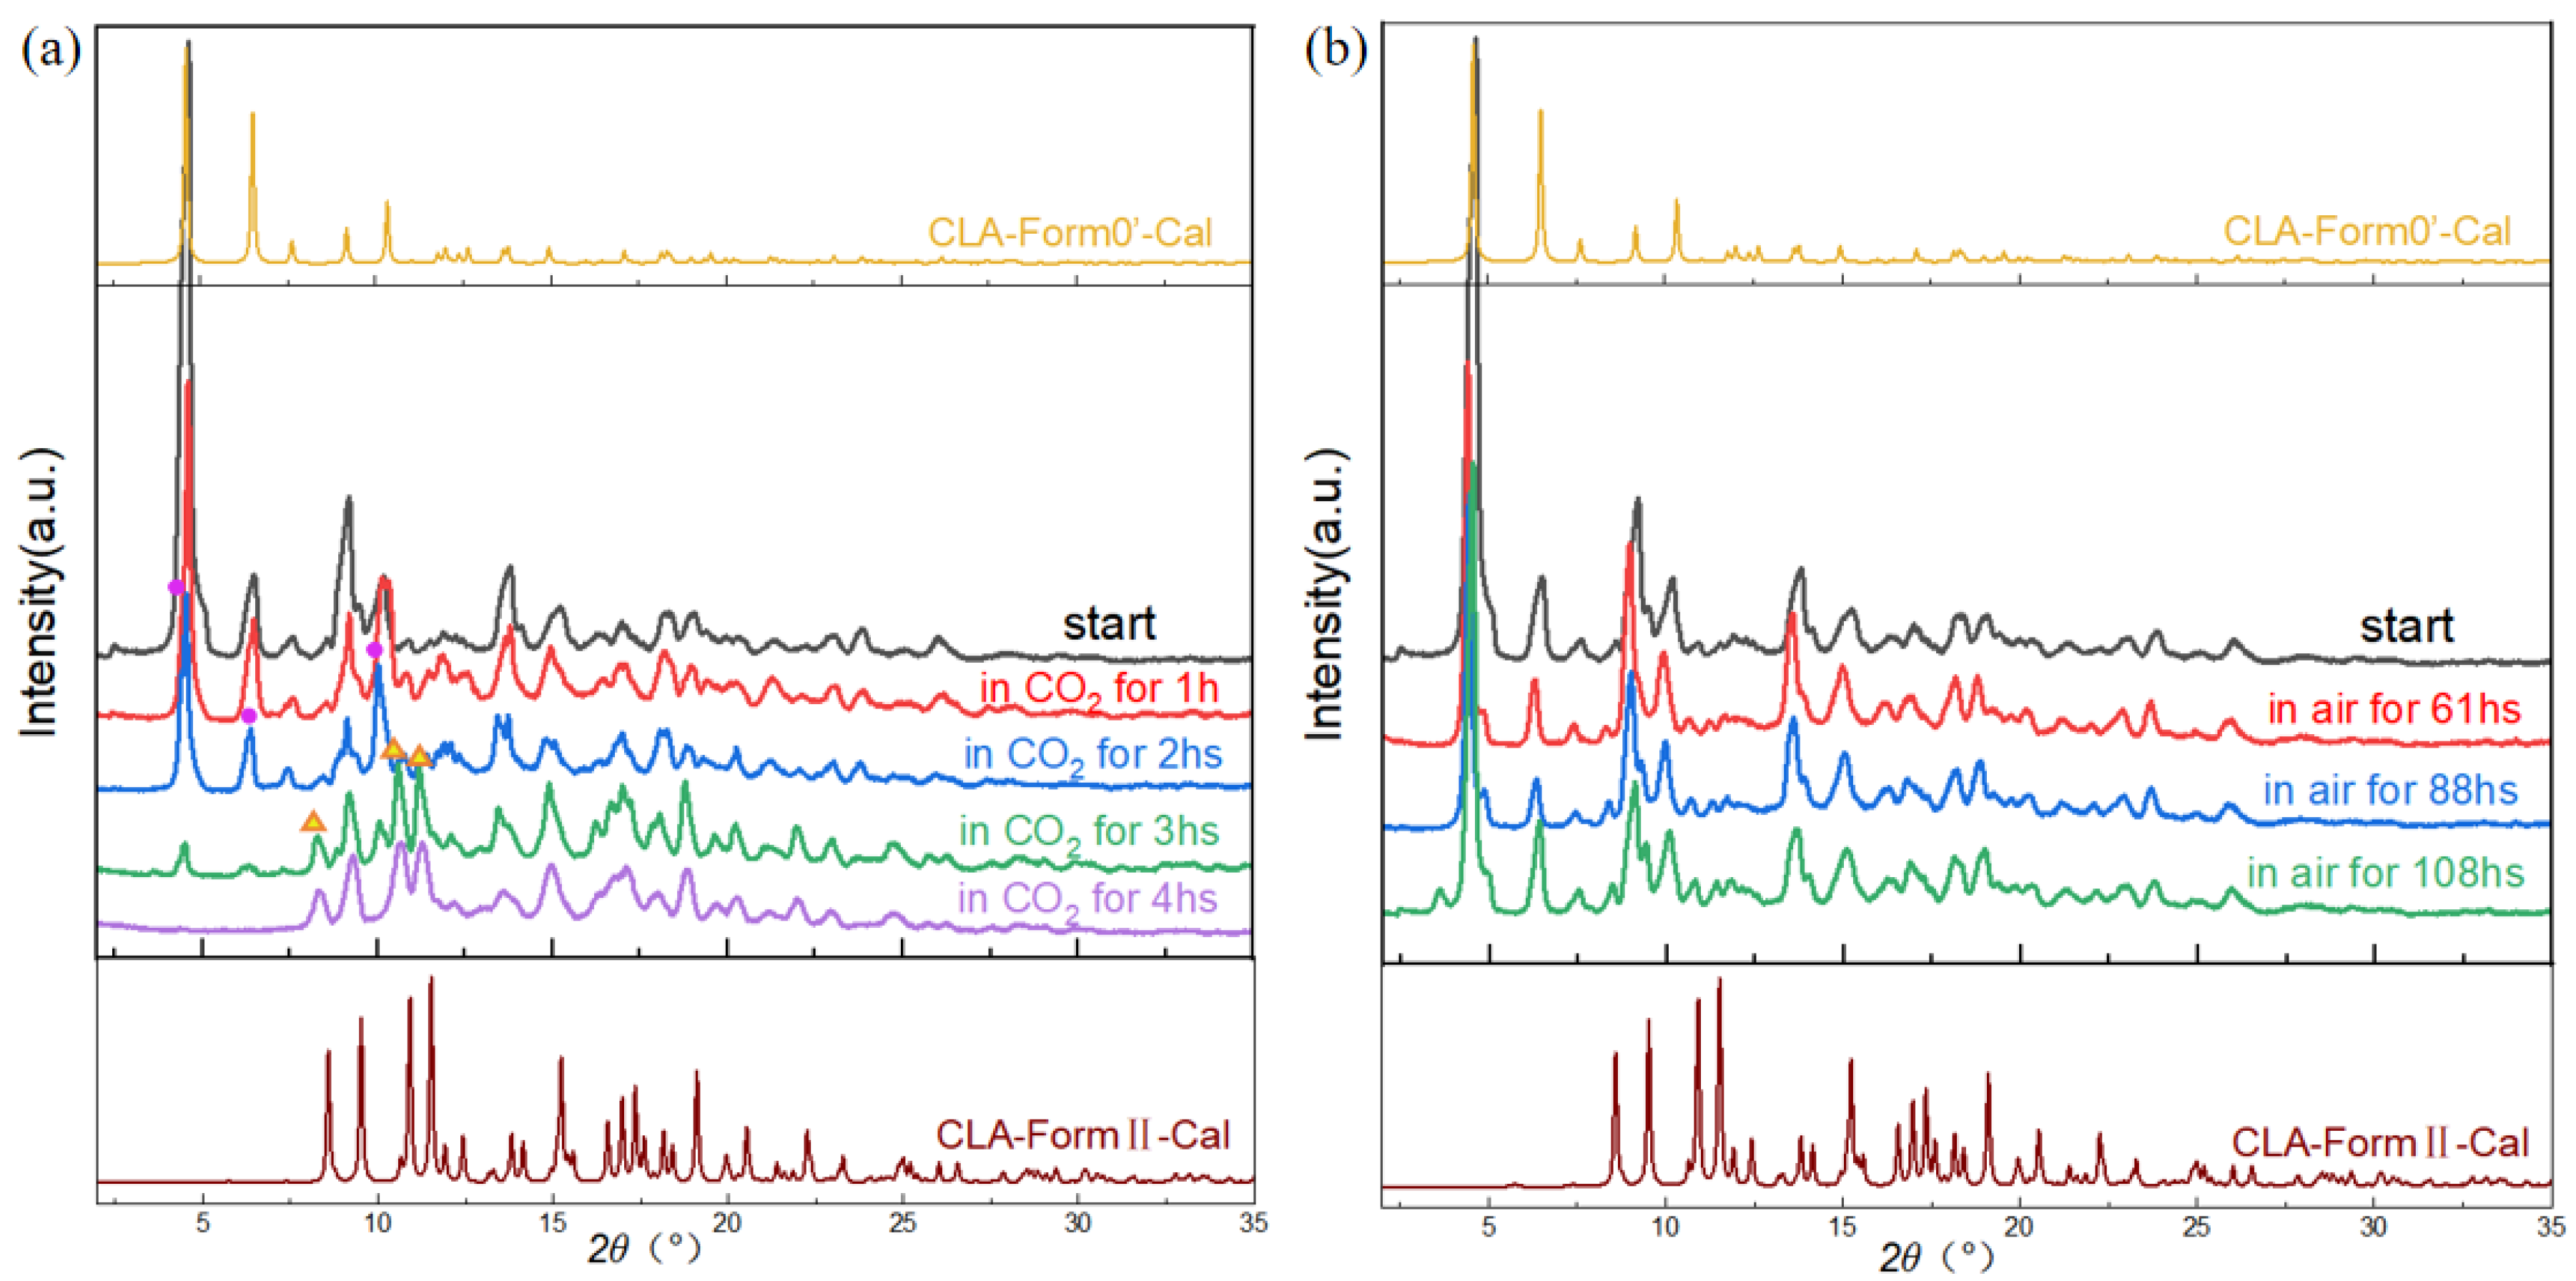
Figure 8.
TPD results of CLA Form II.
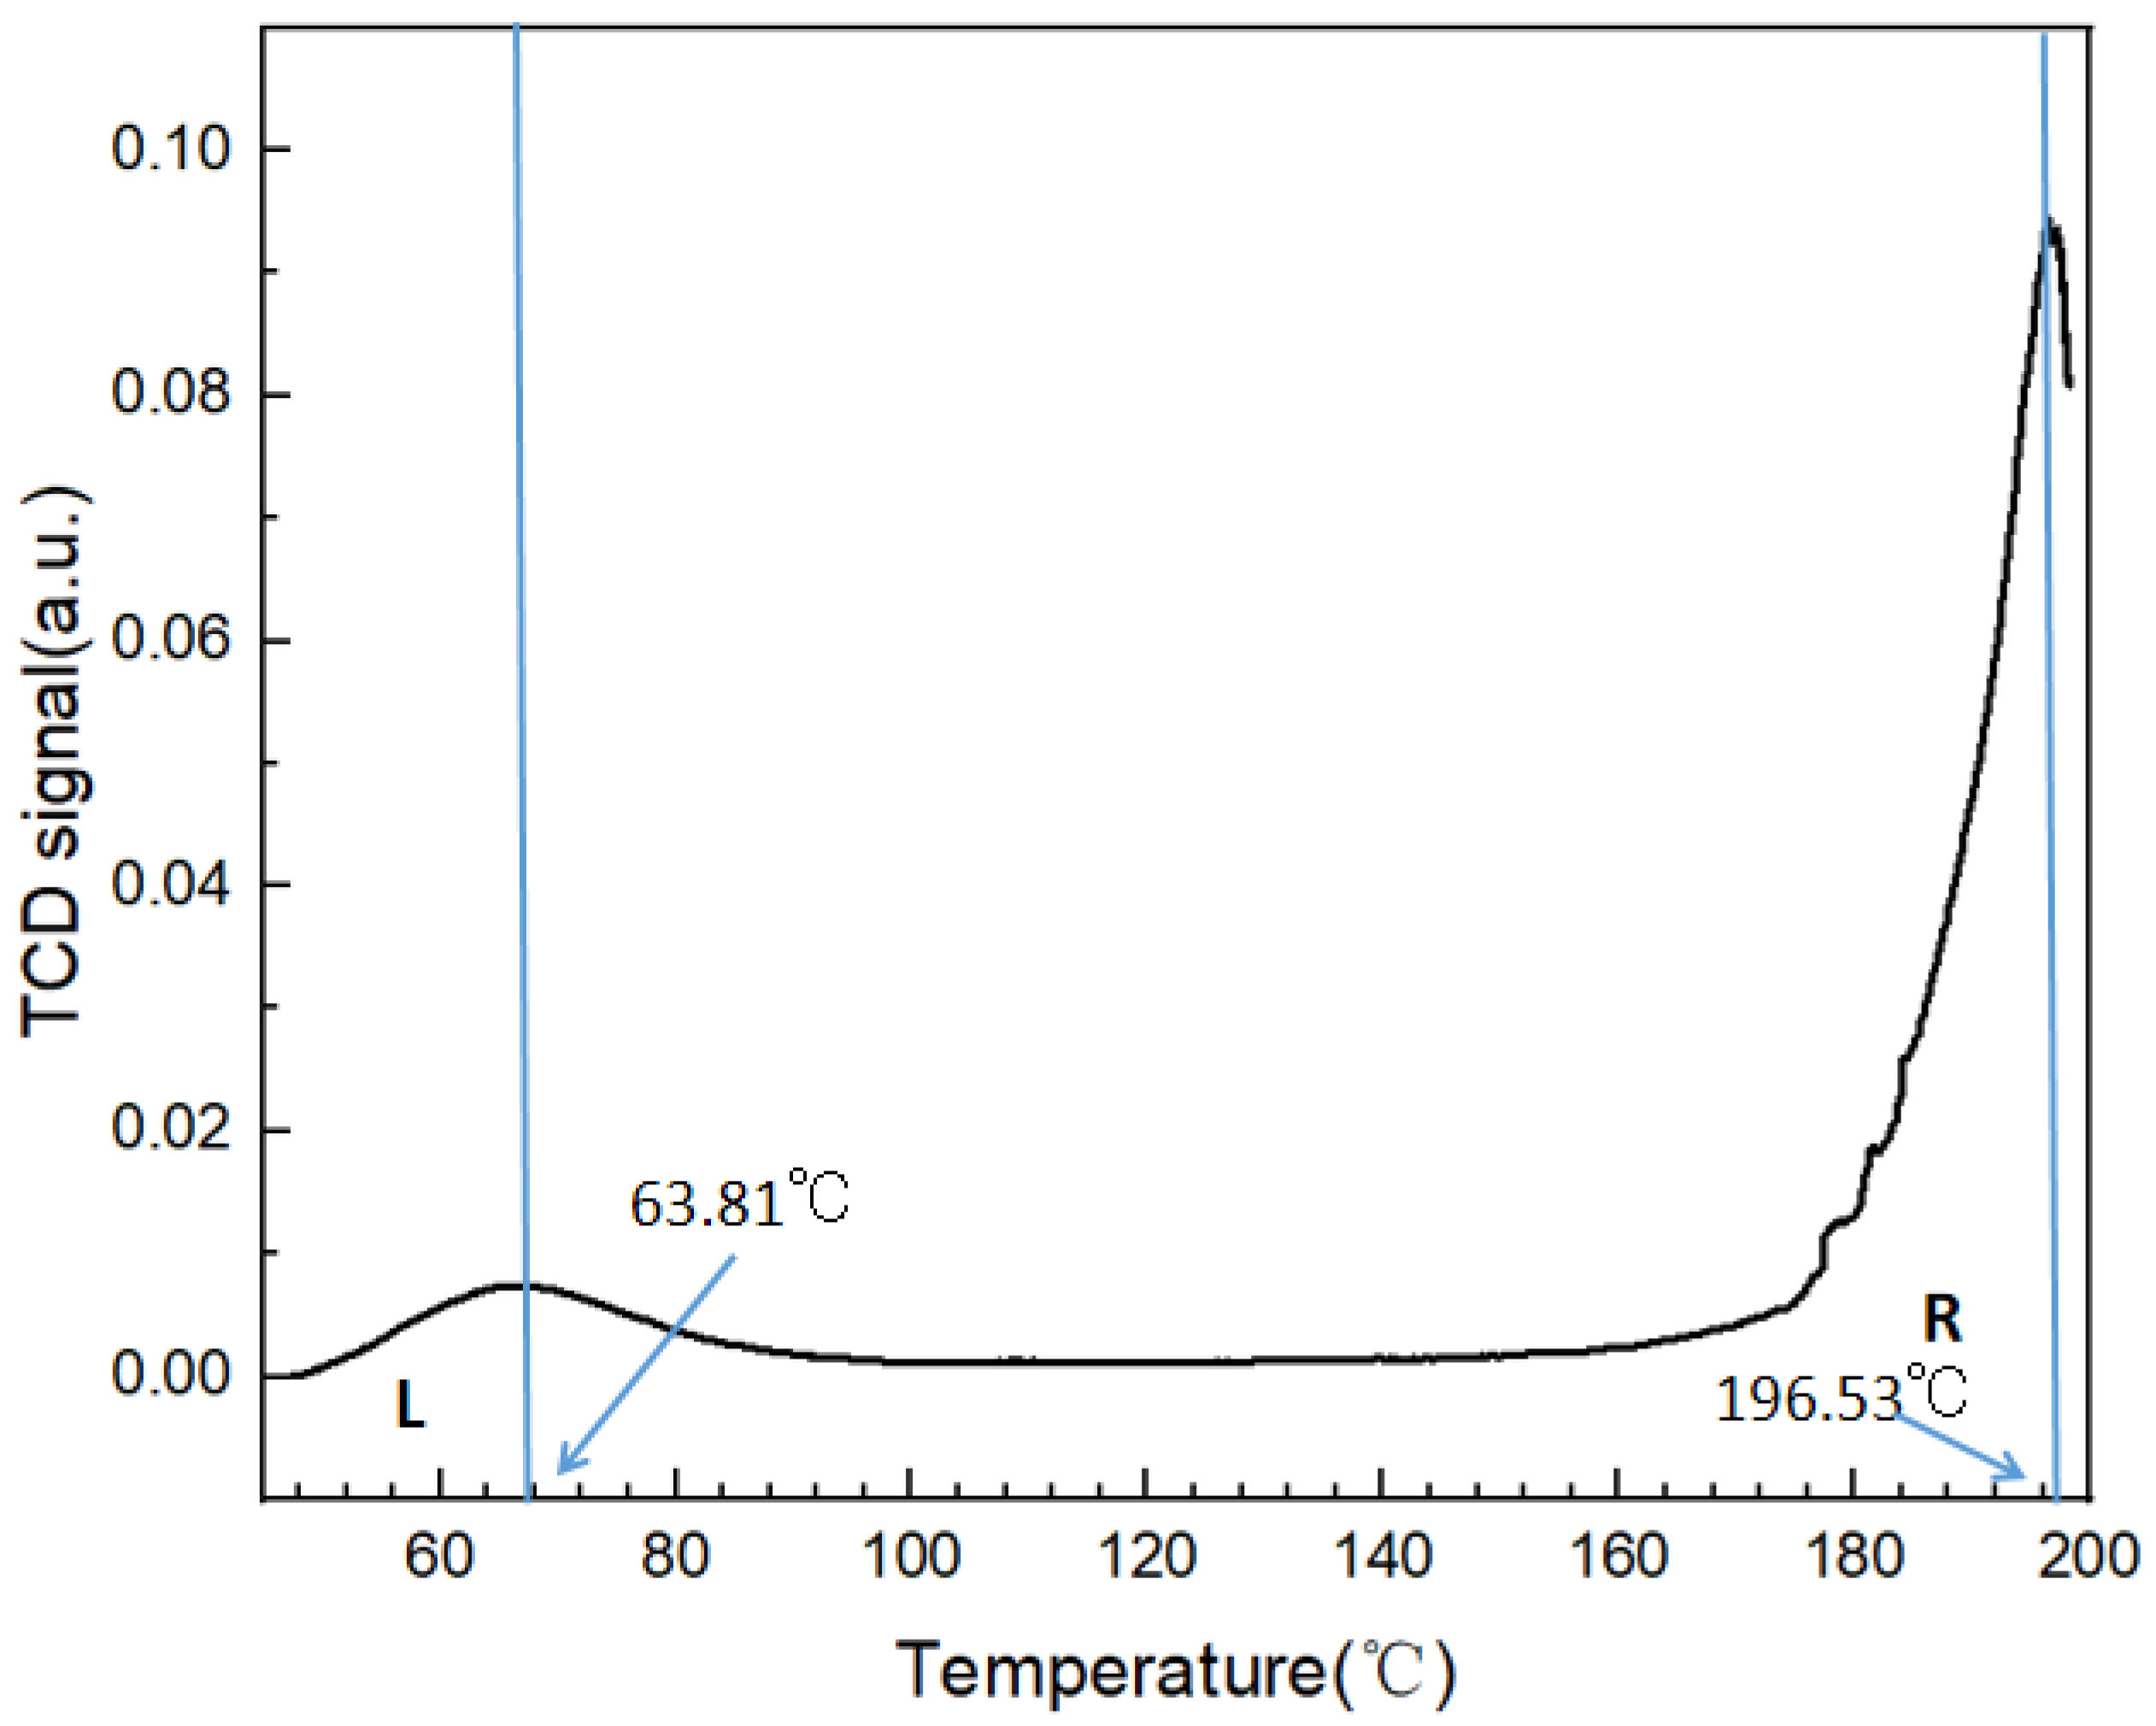
Figure 9.
MEPS of the CLA molecule in Form 0′.
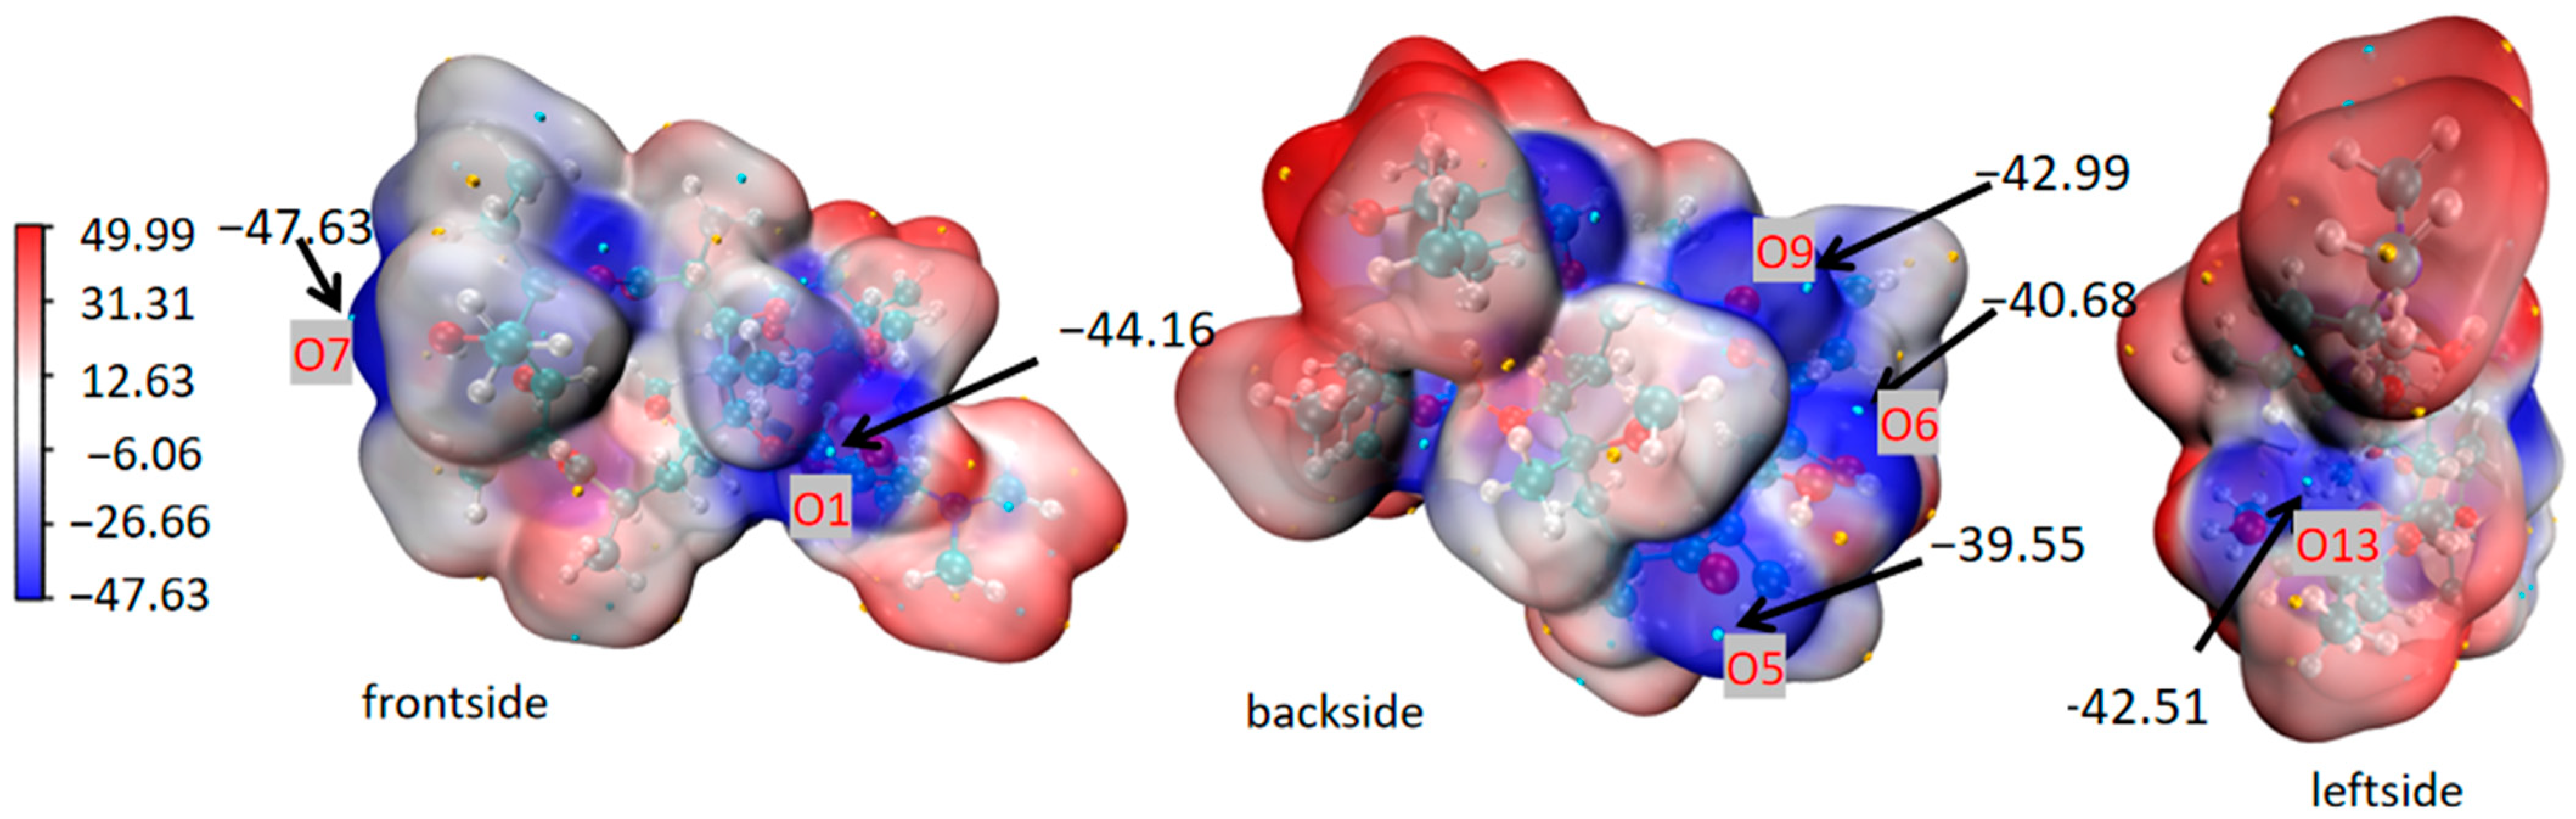
Figure 10.
Molecular arrangements in Form 0′ (a) and Form II (b).


Table 1.
Crystallographic data of CLA Form 0′ and three solvates.
| Phase | CLA-Form 0′ | CLA-PAC Solvate | CLA-IPA Solvate | CLA-EB Solvate |
|---|---|---|---|---|
| Empirical formula | C38H69NO13 | C38H69NO13·C5H10O2 | C38H69NO13·C5H10O2 | C38H69NO13·C6H12O2 |
| Formula weight | 747.94 | 850.07 | 850.07 | 864.09 |
| Crystal system | orthorhombic | orthorhombic | orthorhombic | orthorhombic |
| Space group | P212121 | P212121 | P212121 | P212121 |
| Temperature (°C) | 25 | −165 | −165 | −165 |
| a (Å) | 8.7700 (4) | 8.7114 (2) | 8.6827 (2) | 8.7063 (3) |
| b (Å) | 14.5393 (6) | 14.5078 (3) | 14.4474 (3) | 14.5448 (5) |
| c (Å) | 38.5455 (16) | 37.6484 (12) | 37.9694 (8) | 37.8502 (11) |
| α (°) | 90 | 90 | 90 | 90 |
| β (°) | 90 | 90 | 90 | 90 |
| γ (°) | 90 | 90 | 90 | 90 |
| Cell volume (Å3) | 4914.90 | 4758.10 | 4762.97 | 4793.02 |
| ρ, kg·m3 | 1.011 × 10³ | 1.187 × 10³ | 1.185 × 10³ | 1.197 × 10³ |
| Z | 4 | 4 | 4 | 4 |
| Rint | 0.0801 | 0.0683 | 0.0566 | 0.0853 |
| R1 (I > 2σ(I)) | 0.0671 | 0.0526 | 0.0490 | 0.0614 |
| wR2 | 0.1640 | 0.1035 | 0.1040 | 0.1326 |
| CCDC NO. | 2,339,166 | 2,339,163 | 2,339,164 | 2,339,165 |
Table 2.
Physical adsorption capacity at 25 °C and 50 °C.
| Adsorption Capacity (mol·g−1) | 25 (°C) | 50 (°C) |
|---|---|---|
| Form 0′ | 0.31240 | 0.12914 |
| Form II | 0.24877 | 0.11153 |
Disclaimer/Publisher’s Note: The statements, opinions and data contained in all publications are solely those of the individual author(s) and contributor(s) and not of MDPI and/or the editor(s). MDPI and/or the editor(s) disclaim responsibility for any injury to people or property resulting from any ideas, methods, instructions or products referred to in the content. |
© 2024 by the authors. Licensee MDPI, Basel, Switzerland. This article is an open access article distributed under the terms and conditions of the Creative Commons Attribution (CC BY) license (https://creativecommons.org/licenses/by/4.0/).
Share and Cite
MDPI and ACS Style
Hou, L.; Jing, D.; Wang, Y.; Bao, Y. CO2 Promoting Polymorphic Transformation of Clarithromycin: Polymorph Characterization, Pathway Design, and Mechanism Study. Crystals 2024, 14, 394. https://doi.org/10.3390/cryst14050394
AMA Style
Hou L, Jing D, Wang Y, Bao Y. CO2 Promoting Polymorphic Transformation of Clarithromycin: Polymorph Characterization, Pathway Design, and Mechanism Study. Crystals. 2024; 14(5):394. https://doi.org/10.3390/cryst14050394
Chicago/Turabian StyleHou, Lixin, Dingding Jing, Yanfeng Wang, and Ying Bao. 2024. "CO2 Promoting Polymorphic Transformation of Clarithromycin: Polymorph Characterization, Pathway Design, and Mechanism Study" Crystals 14, no. 5: 394. https://doi.org/10.3390/cryst14050394
Note that from the first issue of 2016, this journal uses article numbers instead of page numbers. See further details here.