
Distinct Crystallization Pathways of Polyoxymethylene in Methanol System
by
 ,
,
Haowen Du
1,
Xiaomeng Zhou
1,
Yaru Zhang
1,
Yang Ye
1,
Shutian Xuanyuan
1,
Sen Yang
1,
Guorui Lao
2 and
Chuang Xie
1,3,* 1
School of Chemical Engineering and Technology, Tianjin University, Tianjin 300072, China
2
China Kunlun Contracting & Engineering Corporation, Beijing 100037, China
3
National Engineering Research Center of Industrial Crystallization Technology, Tianjin University, Tianjin 300072, China
*
Author to whom correspondence should be addressed.
Crystals 2024, 14(5), 401; https://doi.org/10.3390/cryst14050401
Submission received: 1 April 2024
/
Revised: 18 April 2024
/
Accepted: 22 April 2024
/
Published: 25 April 2024
(This article belongs to the Section Industrial Crystallization)
Abstract
:Recrystallization of polyoxymethylene (POM) in solvent is an effective post-treatment method for manufacturing a better POM product. Herein, the crystallization process of POM in methanol was investigated with the use of a series of equipment. The results reveal that POM crystallization in methanol yields two kinds of particle morphologies, including small particles with lamellar structures branching and growing in all directions and large particles resulting from melt agglomeration. The mechanism of POM crystallization in methanol with two distinct pathways was proposed, in which solution cooling crystallization of POM at higher temperature yields small particles while melt crystallization yields large particles. Furthermore, both non-isothermal and isothermal crystallization kinetics of POM were determined. The Avrami equation was employed to derive the crystallization rate constant via data fitting. The activation energy of crystallization was then obtained using the Arrhenius formula. The kinetics suggest that recrystallization of POM in methanol may dissolve and remove substances hindering raw material crystallization, achieving a faster crystallization rate for products.

1. Introduction
Polyoxymethylene (POM), also known as polyacetal [1], is a linear polymer with a predominantly (CH2O)n backbone. As a thermoplastic engineering plastic [2], it has a regular molecular structure, high density, almost no side chains, and high crystallinity, which makes the resin products produced from POM have excellent mechanical properties and good wear resistance [3]. Consequently, it can be widely used in automotive, electrical and electronic, industrial machinery and other industries [4,5,6]. However, the presence of an unstable hemiacetal structure at the end of its molecular chain, along with the residual initiator after polymerization, monomers and other substances, renders POM susceptible to chain-breaking degradation on exposure to heat during processing. This degradation results in the generation of formaldehyde, thus hindering its application in industry [7,8]. To mitigate the depolymerization and improve the thermal stability, post-treatment inactivation is necessary to remove the unstable components in the POM product. Post-treatment methods are categorized as melt, homogeneous solution treatment, and non-homogeneous solution treatment. Among them, the melting method is to add stabilizers, inactivators and other additives to the molten POM to inactivate the unstable components in the POM, but the inactivated impurities are still present in the POM, thus affecting the purity of the POM and its subsequent processing. The non-homogeneous solution method is to soak the POM in solution, but this method can only remove the unstable components on the surface and cannot work for the internal unstable components, resulting in the incomplete elimination of unstable components. The homogeneous solution method is to let POM form a homogeneous phase in solution so that the internal encapsulated impurities can enter the solution. After a slow recrystallization process, the unstable components contained in POM can be effectively reduced. This also means that the homogeneous solution method could be an effective way. Therefore, it is necessary to study the crystallization process and crystallization kinetics of POM.
While the dissolution process of polymers differs from that of small molecules, as they undergo a swelling process followed by dissolution [9], the crystallization process of polymers in solution remains similar to that of small molecules, involving nucleation and growth. The literature extensively covers the crystallization process of polymers in solution [10,11], wherein polymer chains fold into a lamellar structure that branches randomly to form a spherical crystal morphology [12,13]. However, the crystallization of POM poses unique challenges due to its good solvent resistance and stability [14]. Apart from hexafluoroisopropanol [15], there are few solvents capable of dissolving POM, even at high temperatures and pressures. This limitation has resulted in relatively inadequate studies on the crystallization of POM solutions, particularly in poor solvents.
Previous studies of the crystallization kinetics of POM often involved additives such as inorganics [16,17], metals [18,19], polymers [14,20], and nanomaterials [21]. These modest additives act as new nucleation sites, initiating the inhomogeneous nucleation process, reducing the nucleation activation energy and folding the surface-free energy of POM. Consequently, they accelerate the crystallization rate, promote completion of the crystallization process, improve crystallinity [22], and enhance thermal stability [19]. In addition, the presence of a suitable amount of nucleating agent can lead to smaller, more perfect spherulite [23], thus effectively improving notched impact toughness.
In this study, in order to ensure that the recrystallization process does not introduce new impurities, we chose methanol produced by the degradation and oxidation of POM to investigate the recrystallization process of POM and evaluate the effect of poor solvents on this process, aiming to reveal the mechanism of the crystallization process. Isothermal/non-isothermal kinetic studies were conducted on the recrystallized products, helping to understand and further optimize the post-treatment process of POM.
2. Materials and Methods
2.1. Materials
The polyoxymethylene (POM) used in this work was provided by CNOOC Tianye Chemical Co., Ltd., Inner Mongolia, China. It has a crystallinity of about 50%, a melting point of about 160 °C, a number average molecular weight of about 56,000 and a melt flow index of 9.0 g/10 min. Methanol (≥99.5%) was purchased from Kermel Chemical Reagent Co., Ltd., Tianjin, China. The solvent was used without further purification.
2.2. Experimental
2.2.1. Solubility and Cloud Point of POM in Methanol
The solubility and cloud point of POM in methanol were tested using the dynamic method. Two processes of POM were monitored through a crystallizer equipped with the window with professional fill light equipment from the other side of the window. Each set of data was subjected to multiple repetitions of the experiment.
2.2.2. Dissolution-Crystallization Process
The dissolution and crystallization of POM were carried out in a high-pressure crystallizer (Anhui CHEMN Instrument Co., Ltd., Hefei China). The specific experimental procedure was as follows: 20 g of solid was mixed with 60 g of methanol at a stirring rate of 600 rpm. The temperature was raised to 160 °C at a rate of 2 °C/min and held for 60 min. Afterward, the temperature was reduced to 110 °C at a rate of 0.25 °C/min, and then to ambient temperature at a rate of 1 °C/min.
2.3. Characterizations
2.3.1. Differential Scanning Calorimetry (DSC)
Differential scanning calorimetry was performed on a METTLER DSC 1 System (METTLER TOLEDO, Zurich, Switzerland). The crystallization behavior of raw materials and large particles was studied by both isothermal and non-isothermal crystallization processes. All operations were performed under a nitrogen atmosphere at 50 mL/min with a sample weight of approximately 5–10 mg. Both processes require the samples to be heated from 25 °C to 200 °C and held at this temperature for 5 min to eliminate thermal history. Next, the isothermal crystallization process was conducted by cooling the sample to a suitable crystallization temperature (Tc) at a cooling rate of 10 °C/min, followed by keeping this temperature until the crystallization process was completed. The crystallization temperatures of the isothermal crystallization processes of raw materials and large particles are shown in Figure 1a,b, respectively.
The non-isothermal crystallization process was performed by cooling the samples to 25 °C at a given cooling rate. In this study, the specified cooling rates were 2 °C/min, 5 °C/min, 8 °C/min, 10 °C/min, and 20 °C/min. The cooling process is shown in detail in Figure 1c.
The POM crystallinity (Xc) was calculated according to Equation (1).
where Xc is the crystallinity of POM, ΔHm is the enthalpy of melting determined by reheating the sample to 200 °C after the first non-isothermal crystallization process (The heating rate is the same as the cooling rate of the previous crystallization process), and Δ is the enthalpy of fusion of POM at 100% crystallization [13].
2.3.2. Powder X-ray Diffraction (PXRD)
Crystal structure was monitored by using PXRD performed on a MiniFlex 600 (Rigaku, Akishima City, Tokyo, Japan) to determine the crystalline form of POM during the re-crystallization process. The sample is placed on a glass tray and scanned from 5° to 60° with a step size of 0.01° and a scan rate of 10°/min.
2.3.3. Scanning Electron Microscopy (SEM)
The morphology of POM raw materials and products was recorded on a Hitachi TM3000 (Hitachi, Tokyo, Japan) scanning electron microscope. After the samples were treated by gold spraying equipment, the samples were subjected to a 20 kV SEM voltage.
2.3.4. Stereo Microscope
Photographic characterization of the products obtained by solution crystallization was conducted using a stereo microscope (WY-630MS, VIYEE, Tianjin, China).
2.3.5. Gel Permeation Chromatography (GPC)
The molecular weight of the products obtained by recrystallization was determined by using an Agilent GPC 50 (Santa Clara, CA, USA). The solvent used is hexafluoroisopropanol, and the procedure is as follows: 35 mg of the weighed sample (which includes raw materials and two products) is dissolved in 10 mL of hexafluoroisopropanol, then filtered through a 0.45 μm organic filter membrane, and then examined and analyzed.
3. Results and Discussion
3.1. Products Characterization
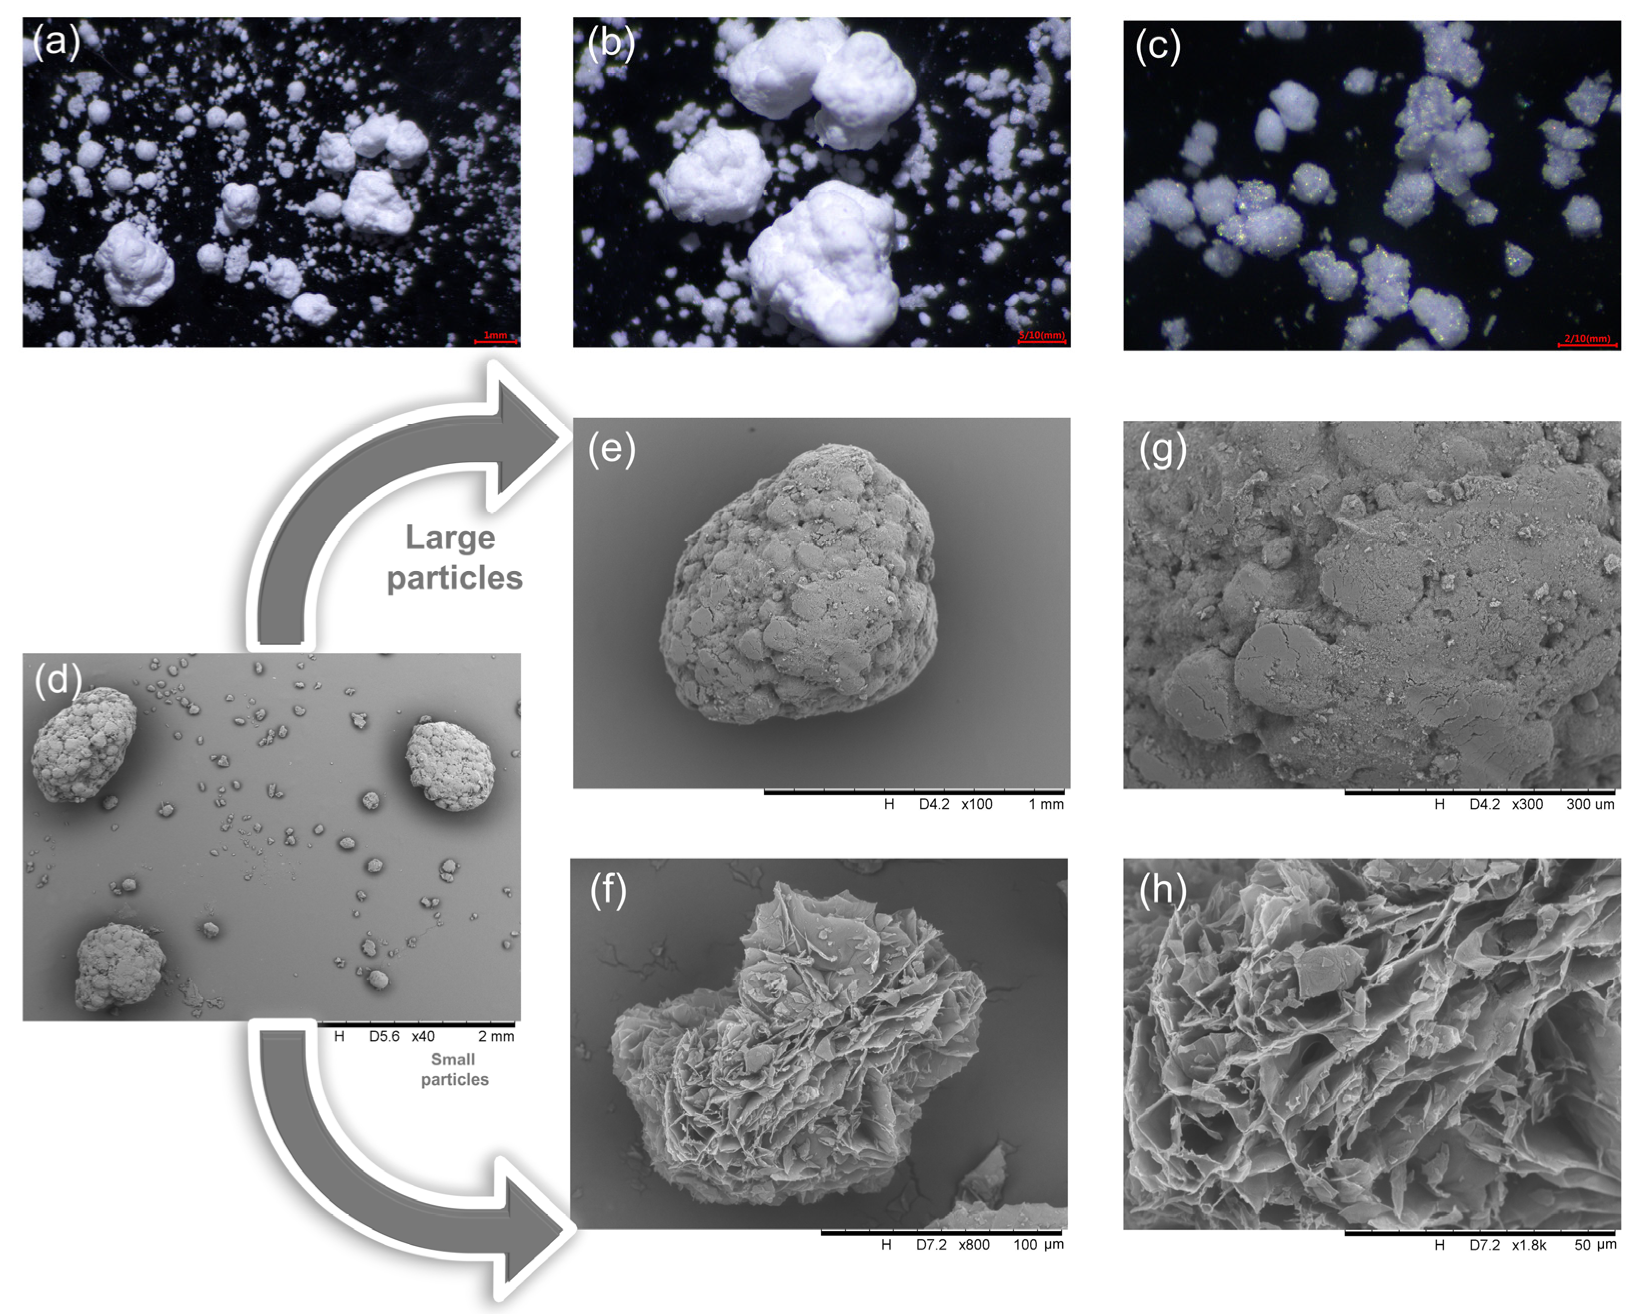
The crystallization process of POM in solution was carried out according to the experimental procedure described in Section 2.2.2. The experimental setup is depicted in Figure 2a, with the resulting particles after filtration and drying at room temperature shown in Figure 2b. Observation under a stereo microscope revealed particles of varying sizes, with small particles (<0.2 mm diameter) exhibiting a bright surface and large particles (>0.5 mm diameter) displaying an uneven surface. This suggests differences not only in size but also in morphology. Particles with different sizes and morphologies are shown in the Figure 3a–c.
SEM was used for observations to determine the difference between particle morphologies in the products. The results are shown in Figure 3d–h, where Figure 3e and Figure 3f show the morphology of large and small particles, and Figure 3g and Figure 3h exhibit the partial enlargements of Figure 3e and Figure 3f, respectively. It is obvious that the large particles in Figure 3e are agglomerates from smaller melt particles, whereas the small particles in Figure 3f result from the random growth of lamellar structure in all directions [12,13].
To further determine the distinction between the small and large particles in Figure 3e, the products underwent GPC after particle size sieving. The results in Figure 2d,e indicate that small particles in Figure 3f correspond to POM products with relatively low molecular weights, whereas large particles in Figure 3e are POM products with relatively high molecular weights. This suggests that the small spherical area within the large particles is different from those in Figure 3f, indicating they were produced via different crystallization pathways.
To monitor the crystallization, solid particles were sampled at the cloudy point (the early stage of the crystallization process). The SEM images of the filtered and dried samples (Figure S1a,b) demonstrate that the sample morphology was the same as the small particles shown in Figure 3f. As the temperature further decreased, the melt in the crystallizer solidified into particles, which, after being filtered and dried, were also characterized by SEM (Figure S1c,d). It reveals that the morphology of the sample was the same as the large particles shown in Figure 3e. This suggests the existence of two POM crystallization processes in methanol: solution crystallization and melt crystallization.
To verify this hypothesis, the solubility and cloud points of POM in methanol were determined using the dynamic method [24,25]. The result shown in Figure 2c and the specific dissolution and crystallization data shown in Table S1 indicate minimal POM dissolution in methanol even at high temperatures and pressures. After careful sieving and weighing, the mass of the small particles was found to match the solubility, supporting the occurrence of solution crystallization of POM in methanol.
Observation during the experiments reveals that most of the POM remained in solution as a melt (Figure S2a) until the temperature dropped to about 125 °C and quickly solidified into particles (Figure S2b). Thus, another crystallization pathway is melt crystallization in methanol solution.
Finally, to ensure that the POM substance had not changed after recrystallization, both the raw materials and two products were characterized by PXRD. Figure S2c shows that the XRD peak positions of the three samples remain consistent, with the characteristic peak positions at 23.25°, 34.75°, 40.55°, 48.50° and 54.30°. This indicates that the POM crystal structure remained unchanged regardless of different crystallization pathways and distinct molecular weights.
3.2. POM Crystallization Pathways and Mechanism in Methanol
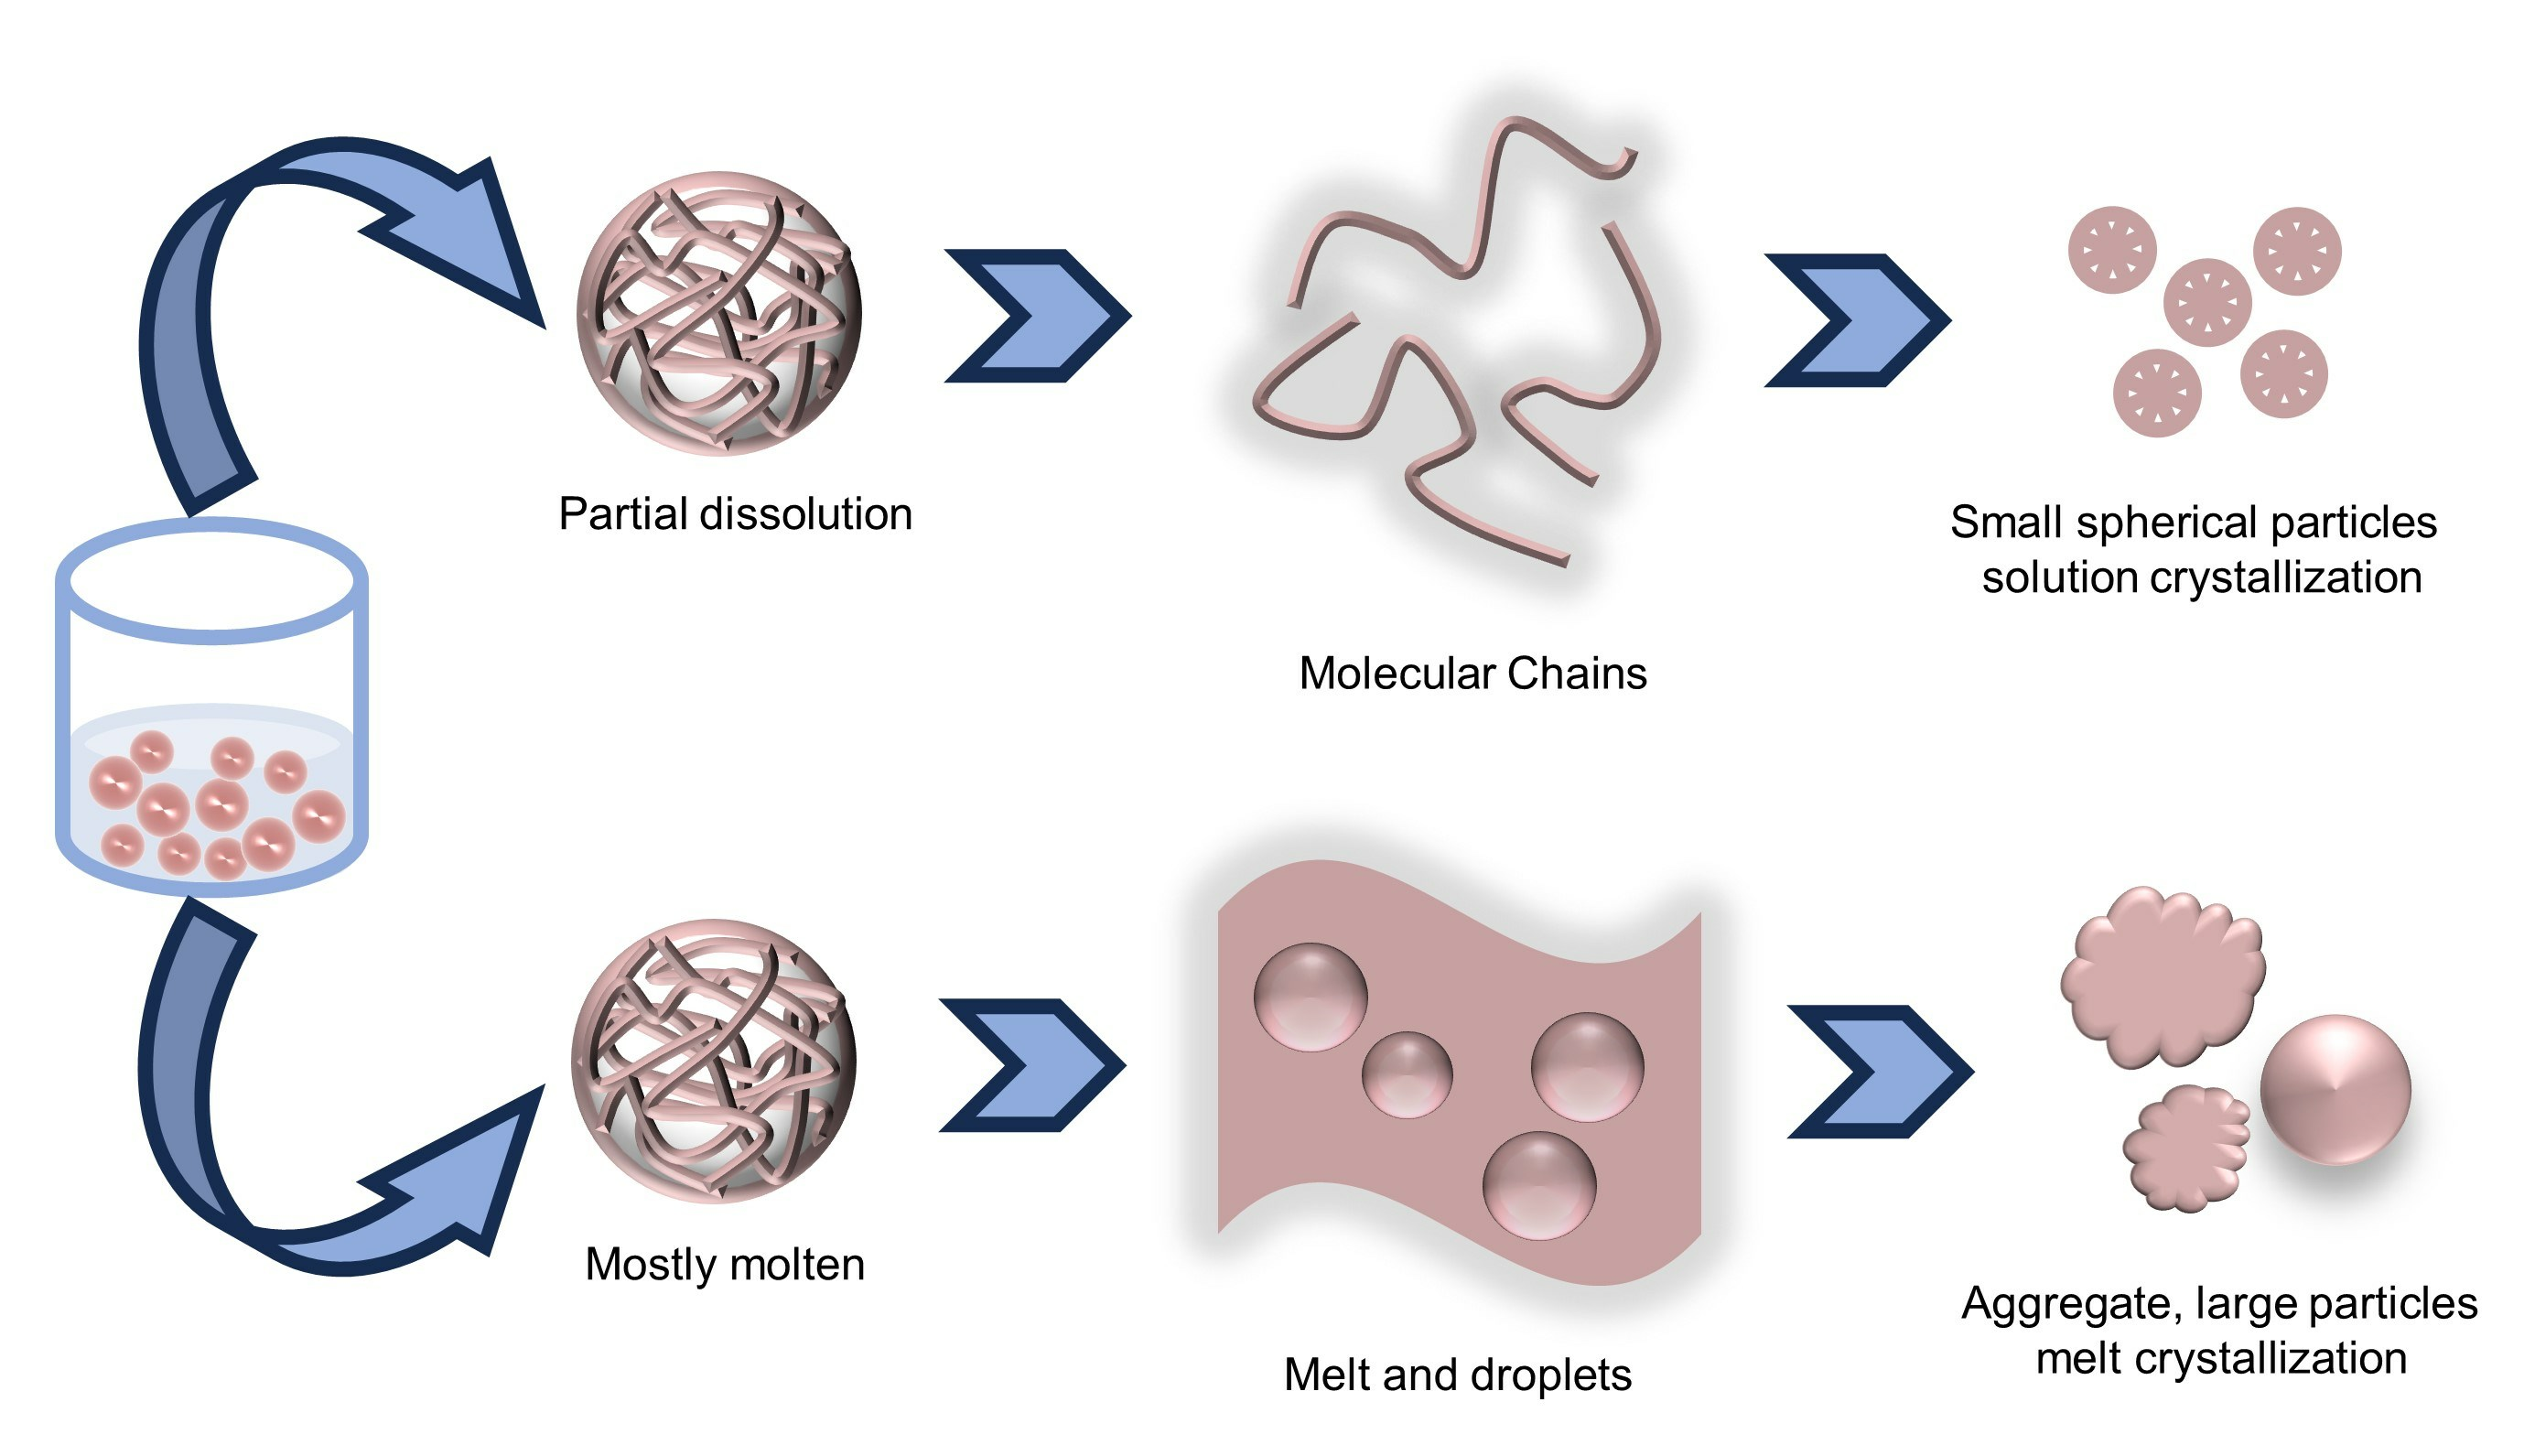
According to the above analysis, it can be concluded that POM recrystallization in methanol yields two types of particle morphologies via different crystallization pathways. In the dissolution process, POM undergoes a process of swelling, causing the coiled and folded long chain to stretch and unfold. Shorter chains prefer to enter the solution to reach equilibrium, while longer chains remain in the POM melt phase. Upon lowering the temperature near the cloudy point, cooling solution crystallization occurs, where shorter chains in the solution reassemble into a lamellar structure, resulting in the random growth of lamellae in all directions and forming globular or near-globular small particles [12,13]. At this stage, the POM melt phase becomes melt droplets under stirring and shearing [26].
Subsequently, as the temperature decreases to the melting point of POM, the POM melt droplets solidify instantly into solid spherical particles. Due to the collision effect, agglomeration among the small melt droplets occurs, resulting in inconsistent particle sizes and the formation of large particles. The specific processes of the two crystallization pathways are shown in Figure 4.
3.3. Non-Isothermal Crystallization Behavior
Considering both the main POM products (large particles) and the raw materials are produced via melt crystallization, non-isothermal crystallization processes were performed on the raw materials and the large particle products to investigate similarities and differences in the crystallization behavior. The temperature profiles are shown in Section 2.3.1.
Figure 5a,b shows the thermodynamic diagrams of non-isothermal crystallization of the raw materials and large particle products at different cooling rates, and the relevant data are summarized in Table 1. It demonstrates that both raw materials and large particle products exhibit a single exothermic peak during the cooling process, with the peak crystallization temperature (Tp) shifting toward a lower temperature with an increased cooling rate. It could be attributed to the fact that macromolecular chain segments do not have enough time to coil and fold into an ordered structure at a higher cooling rate, making a higher degree of subcooling necessary to start the crystallization process [27].
Table 1 shows the differences in crystallization kinetics between large particles and raw materials. Suggesting the influence of recrystallization on POM properties. Notably, recrystallized large particles exhibit higher crystallinity compared to the raw materials, indicating that slower recrystallization allows more time for molecular chain arrangement and thus results in improved crystallinity. Moreover, the crystallization temperature of large particles was lower than that of raw materials. It could be attributed to the slower diffusion and arrangement of longer chain molecules in the nucleus, resulting in a slower crystallization rate and a lower temperature [28]. Combined with the experimental GPC results in Figure 2d,e, it suggests that the crystallization temperature discrepancy arises from POM’s varying molecular weight composition, with higher relative molecular weight portions undergoing melt crystallization, leading to lower crystallization temperatures in large particle products.
To validate this assumption, GPC tests were performed on the raw materials, and the molecular weight distributions are shown in Figure 5c. Compared to that of two types of particles (Figure 2d,e), it could be confirmed that solution crystallization produces POM products with a lower relative molecular weight, while melt crystallization produces POM products with a higher relative molecular weight. This observation supports the idea that dissolution processes are independent of molecular weight, whereas crystallization processes are molecular weight-dependent.
3.4. Isothermal Crystallization Behavior
Isothermal crystallization operation according to the temperature control program in Section 2.3.1. Heat flow rate versus crystallization time for POM raw materials and large particle products under isothermal crystallization is shown in Figure S3. The required crystallization time increased with increasing crystallization temperature. This is because the lower subcooling occurs at a higher crystallization temperature.
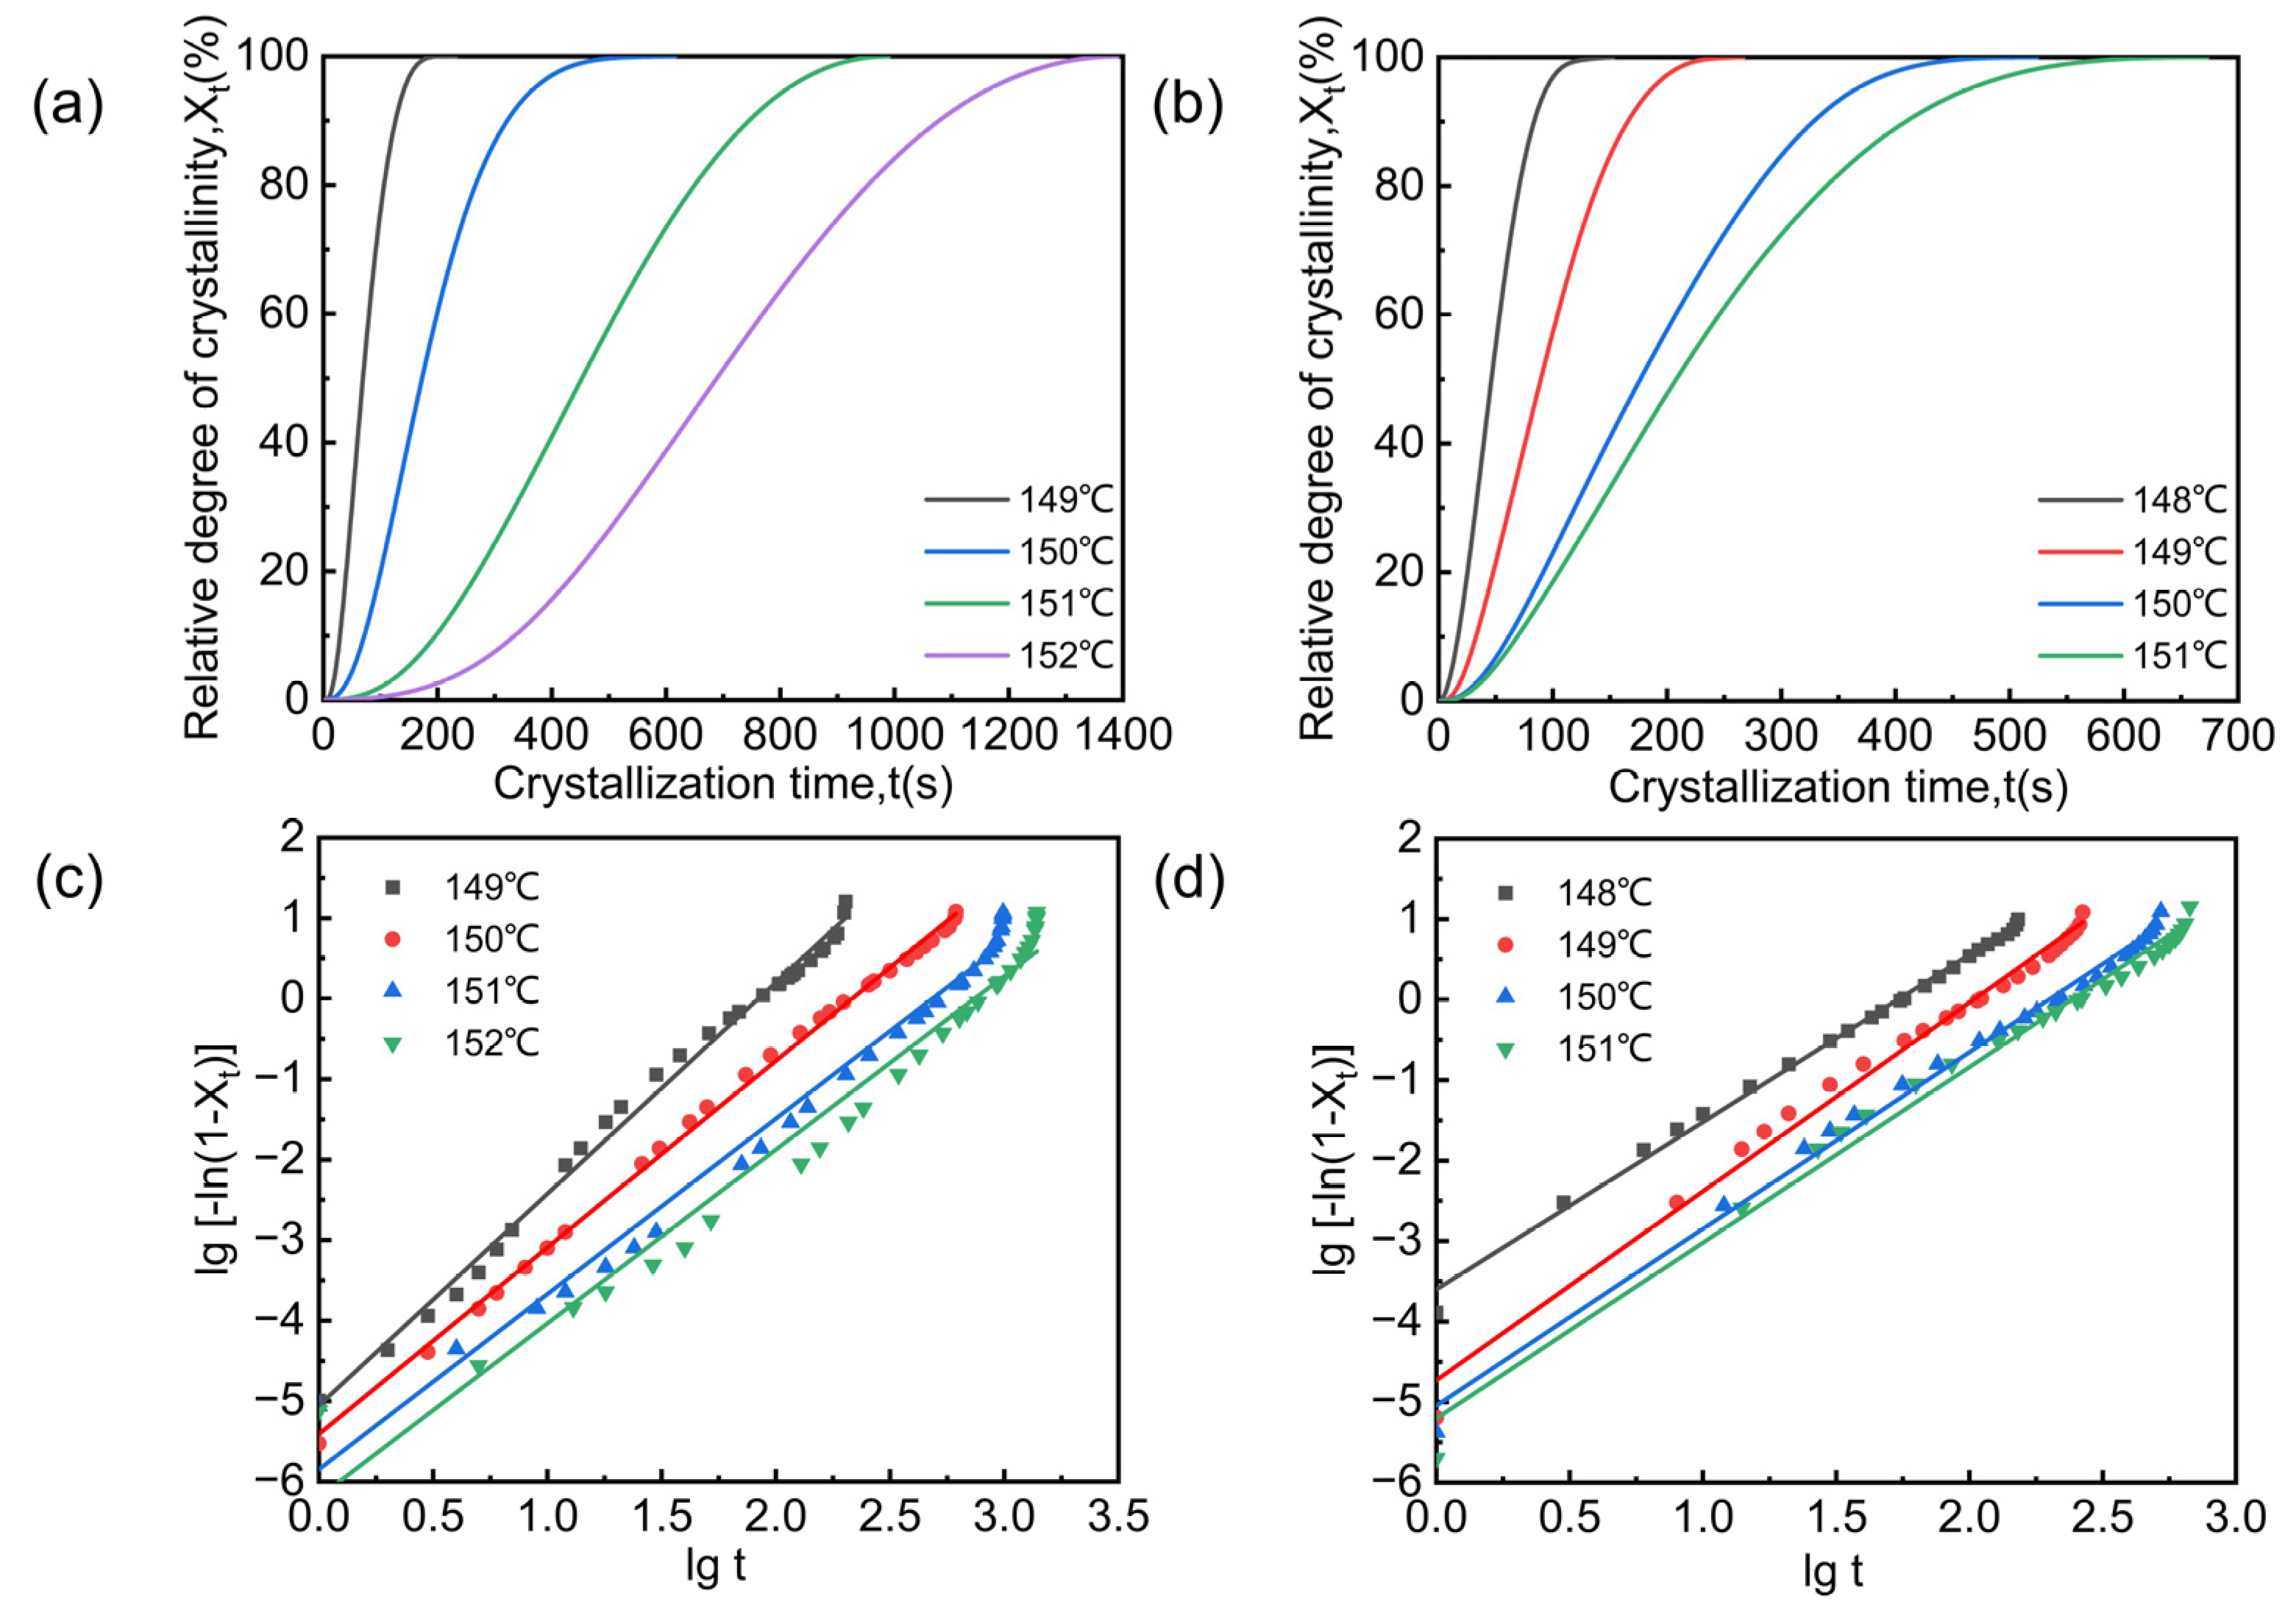
Figure 6a,b presents plots of relative crystallinity versus crystallization time for POM raw materials and large particle products during isothermal crystallization. Notably, a higher crystallization temperature is associated with a longer crystallization time, resulting in a slower crystallization rate.
The Avrami equation, a commonly used tool to describe isothermal crystallization kinetics, provides a relationship between the relative degree of crystallinity and crystallization time as follows [27]:
where Xt is the relative crystallinity at crystallization time t, n is the Avrami index, and k is a crystallization rate constant related to the nucleation and growth rates. Taking logarithms on both sides gives the following equation:
Double logarithmic plots for both POM raw materials and large particle products were generated from Equation (3) and are shown in Figure 6c,d. Essentially, linear relationships are observed, with correlation coefficients R2 exceeding 0.95, indicating the reliability of the data. The slopes and intercepts of the fitted equations can be used to find the Avrami index and the crystallization rate constant k for the POM raw materials and large particle products. The relevant data are summarized in Table 2, indicating that the Avrami index of the raw material ranges from 2.16 to 2.63, slightly higher than that of the large particle product (2.08–2.35) at the same temperature. Considering that the Avrami index is related to the type of nucleation and the geometry of the grown crystals, this suggests athermal nucleation and three-dimensional growth for both POM raw materials and large particle products.
To compare crystallization rates between raw materials and large particle products, the half crystallization time (t0.5), defined as the time required for a sample to achieve 50% relative crystallinity, was used for evaluation, as shown in the following equation:
Table 2 presents the half crystallization time (t0.5) of raw materials and large particle products at different crystallization temperatures. It shows that the t0.5 of the large particle products is shorter than that of the raw materials, indicating that the recrystallization process carried out in the methanol can effectively increase the crystallization rate of the large particle products. This enhancement may be due to the dissolution and removal of substances that hinder POM crystallization, allowing a faster crystallization rate.
The crystallization activation energy, a very important parameter of the crystallization kinetics, was investigated using the Arrhenius formula. The specific values of the crystallization activation energy were obtained from Equation (5), and the results are shown in Table S2 and Figure S4.
where k0 is the prefactor, ΔEa is the activation energy of crystallization, Tc is the crystallization temperature, and R is the ideal gas constant.
4. Conclusions
POM crystallization in methanol was investigated. Two different particle morphologies, including small white particles and large, even particles, were observed. SEM analysis revealed that small particles involve lamellar structures, branching and growing in all directions, whereas large particles result from agglomeration. GPC results demonstrate that small particles are comprised lower molecular weights compared to large particles. Combining the solubility, cloudy points, and crystallization temperature, two crystallization pathways of POM in methanol were discovered. One is a solution cooling crystallization process at higher temperatures due to the poor solubility of POM in methanol, yielding small particles, while the other is a melt crystallization process, yielding large particles. XRD confirmed that both products maintain the same structure of the raw materials despite differing morphologies and molecular weight distributions.
Analysis of the isothermal crystallization process revealed that the crystallization rate of products was larger than that of raw materials at the same crystallinity levels, with a shorter time required to reach the crystallization half-life. It suggests that the recrystallization process may dissolve and wash out substances hindering raw material crystallization, achieving a faster crystallization rate for products. Furthermore, fitting experimental data to the Arrhenius equation indicated lower activation energy for large particles compared to raw materials.
Studying the recrystallization process of POM and its isothermal/non-isothermal crystallization behavior enhances understanding of POM properties, helping improve thermal stability and accelerate crystallization rate.
Supplementary Materials
The following supporting information can be downloaded at: https://www.mdpi.com/article/10.3390/cryst14050401/s1, Figure S1: (a,b) SEM morphology of the product removed at 130 °C and (c,d) SEM morphology of the product removed at 25 °C; Table S1: Solubility and cloud point of the POM-methanol system; Figure S2: (a) Melting point of POM at 160 °C. (b) Molten POM at 127 °C from the crystal. and (c) PXRD patterns of POM raw materials and two products; Figure S3: Heat flow rate versus time plot for raw materials and products (a) raw materials. and (b) large particles; Figure S4: Fitted Arrhenius equation for POM raw materials and large particle products; Table S2: Relevant data from the Arrhenius equation.
Author Contributions
Conceptualization, H.D. and Y.Z.; methodology, H.D. and X.Z.; formal analysis, S.X.; investigation, H.D.; data curation, H.D. and S.Y.; writing—original draft preparation, H.D.; writing—review and editing, C.X. and Y.Y.; supervision, C.X. and G.L. All authors have read and agreed to the published version of the manuscript.
Funding
CNPC Forward-looking Basic Technology Projects (grant number CNPC 2022DJ6110).
Data Availability Statement
The original contributions presented in the study are included in the article and supplementary materials, further inquiries can be directed to the corresponding author.
Conflicts of Interest
Guorui Lao is employed by the company China Kunlun Contracting & Engineering Corporation. The remaining authors declare that the research was conducted in the absence of any commercial or financial relationships that could be construed as a potential conflict of interest.
References
- Kawaguchi, K.; Nakao, H.; Masuda, E.; Tajima, Y. Morphology and Nonisothermal Crystallization of a Polyacetal/Poly(Ε-caprolactone) Reactive Blend Prepared via a Chain-transfer Reaction. J. Appl. Polym. Sci. 2008, 107, 1269–1279. [Google Scholar] [CrossRef]
- Pielichowska, K.; Szuba, P.; Maciocha, J.; Macherzyńska, B.; Nowicka, K.; Szatkowski, P. Preparation, Characterization, and Bioactivity Evaluation of Polyoxymethylene Copolymer/Nanohydroxyapatite-g-Poly(ε-Caprolactone) Composites. Nanomaterials 2022, 12, 858. [Google Scholar] [CrossRef] [PubMed]
- Gao, Y.; Sun, S.; He, Y.; Wang, X.; Wu, D. Effect of Poly(Ethylene Oxide) on Tribological Performance and Impact Fracture Behavior of Polyoxymethylene/Polytetrafluoroethylene Fiber Composites. Compos. Part B Eng. 2011, 42, 1945–1955. [Google Scholar] [CrossRef]
- Kuciel, S.; Bazan, P.; Liber-Kneć, A.; Gądek-Moszczak, A. Physico-Mechanical Properties of the Poly(Oxymethylene) Composites Reinforced with Glass Fibers under Dynamical Loading. Polymers 2019, 11, 2064. [Google Scholar] [CrossRef] [PubMed]
- Yang, J.; Yang, W.; Wang, X.; Dong, M.; Liu, H.; Wujcik, E.K.; Shao, Q.; Wu, S.; Ding, T.; Guo, Z. Synergistically Toughening Polyoxymethylene by Methyl Methacrylate–Butadiene–Styrene Copolymer and Thermoplastic Polyurethane. Macro Chem. Phys. 2019, 220, 1800567. [Google Scholar] [CrossRef]
- Zhang, W.; Xu, X.; Wang, H.; Wei, F.; Zhang, Y. Experimental and Numerical Analysis of Interfacial Bonding Strength of Polyoxymethylene Reinforced Cement Composites. Constr. Build. Mater. 2019, 207, 1–9. [Google Scholar] [CrossRef]
- Pielichowska, K. The Influence of Polyoxymethylene Molar Mass on the Oxidative Thermal Degradation of Its Nanocomposites with Hydroxyapatite. J. Therm. Anal. Calorim. 2016, 124, 751–765. [Google Scholar] [CrossRef]
- Nguyen, T.C.; Tran, T.M.; Trinh, A.T.; Nguyen, A.H.; Dam, X.T.; Vu, Q.T.; Tran, D.L.; Nguyen, D.T.; Le, T.G.; Thai, H. Polyoxymethylene/Silica/Polylactic Acid-Grafted Polyethylene Glycol Nanocomposites: Structure, Morphology, and Mechanical Properties and Ozone and UV Durability. RSC Adv. 2020, 10, 2691–2702. [Google Scholar] [CrossRef] [PubMed]
- Wang, S.; Shu, Z.; Ye, Z.; Zhu, S.; Zhang, L. Simulation and Optimization of Working Parameters of the Rapid-Dissolution Device of Hydrophobically Associating Polymer. AIP Adv. 2021, 11, 015003. [Google Scholar] [CrossRef]
- Grünig, L.E.; Meyer, A.; Emmler, T.; Abetz, V.; Handge, U.A. Solvent-Induced Crystallization of Poly(Phenylene Sulfone). Macromolecules 2021, 54, 4816–4826. [Google Scholar] [CrossRef]
- Samitsu, S. Fabrication of Mesoporous Crystalline Microparticles of Poly(Ether Sulfone) via Solvent-Induced Crystallization. Polymer 2022, 248, 124744. [Google Scholar] [CrossRef]
- Crist, B.; Schultz, J.M. Polymer Spherulites: A Critical Review. Prog. Polym. Sci. 2016, 56, 1–63. [Google Scholar] [CrossRef]
- Dechet, M.A.; Baumeister, I.; Schmidt, J. Development of Polyoxymethylene Particles via the Solution-Dissolution Process and Application to the Powder Bed Fusion of Polymers. Materials 2020, 13, 1535. [Google Scholar] [CrossRef] [PubMed]
- Li, J.; Wang, Y.; Wang, X.; Wu, D. Development of Polyoxymethylene/Polylactide Blends for a Potentially Biodegradable Material: Crystallization Kinetics, Lifespan Prediction, and Enzymatic Degradation Behavior. Polymers 2019, 11, 1516. [Google Scholar] [CrossRef]
- Zhang, C.Q.; Wang, Y.M.; Li, S.Z.; Feng, X.D.; Liu, L.H.; Wang, Y.; Zhao, L.P. Electrospinning and Catalytic Properties of Cyclodextrin Functionalized Polyoxymethylene (POM) Nanofibers Supported by Silver Nanoparticles. Adv. Polym. Technol. 2021, 2021, 8272626. [Google Scholar] [CrossRef]
- Sun, A.; Luo, F.; Chen, R.; Guo, J.; Guo, S.; Zhang, S. Effects of Sepiolite on Crystallization Behaviors and Properties of Sepiolite/Polyoxymethylene Composites. J. Polym. Res. 2020, 27, 67. [Google Scholar] [CrossRef]
- Yu, N.; He, L.; Ren, Y.; Xu, Q. High-Crystallization Polyoxymethylene Modification on Carbon Nanotubes with Assistance of Supercritical Carbon Dioxide: Molecular Interactions and Their Thermal Stability. Polymer 2011, 52, 472–480. [Google Scholar] [CrossRef]
- Zeng, Y.; Liu, Y.; Zhang, X.; Wang, L.; Huang, H.; Liu, Y.; Qi, G.; Min, M.; Li, Y. Effect of Silver Nanoparticles on the Melting Behavior, Isothermal Crystallization Kinetics and Morphology of Polyoxymethylene. Crystals 2020, 10, 594. [Google Scholar] [CrossRef]
- Liu, Y.; Zhang, X.; Gao, Q.; Huang, H.; Liu, Y.; Min, M.; Wang, L. Structure and Properties of Polyoxymethylene/Silver/Maleic Anhydride-Grafted Polyolefin Elastomer Ternary Nanocomposites. Polymers 2021, 13, 1954. [Google Scholar] [CrossRef]
- Jiao, Q.; Shen, J.; Ye, L.; Li, Y.; Chen, H. Poly(Oxymethylene)/Poly(Butylene Succinate) Blends: Miscibility, Crystallization Behaviors and Mechanical Properties. Polymer 2019, 167, 40–47. [Google Scholar] [CrossRef]
- Pielichowska, K.; Dryzek, E.; Olejniczak, Z.; Pamuła, E.; Pagacz, J. A Study on the Melting and Crystallization of Polyoxymethylene-copolymer/Hydroxyapatite Nanocomposites. Polym. Adv. Techs 2013, 24, 318–330. [Google Scholar] [CrossRef]
- Tao, Z.; Wang, Y.; Li, J.; Wang, X.; Wu, D. Fabrication of Long Glass Fiber Reinforced Polyacetal Composites: Mechanical Performance, Microstructures, and Isothermal Crystallization Kinetics. Polym. Compos. 2015, 36, 1826–1839. [Google Scholar] [CrossRef]
- Zeng, Y.; Liu, Y.; Wang, L.; Huang, H.; Zhang, X.; Liu, Y.; Min, M.; Li, Y. Effect of Silver Nanoparticles on the Microstructure, Non-Isothermal Crystallization Behavior and Antibacterial Activity of Polyoxymethylene. Polymers 2020, 12, 424. [Google Scholar] [CrossRef] [PubMed]
- Hu, G.; Cui, L.; Zhang, S.; Xie, B. Solubility of Prednisone Acetate in Different Mixed Solvents at Different Temperatures. J. Mol. Liq. 2012, 173, 13–17. [Google Scholar] [CrossRef]
- Li, H.; Liu, J.; Chen, X.; Ren, T. Solubility of KF in Tributyl Phosphate, Dimethyl Sulfoxide, N,N-Dimethylacetamide and 1,4-Dioxane from 300.87 to 359.50K. J. Mol. Liq. 2012, 166, 67–69. [Google Scholar] [CrossRef]
- Kim, M.R.; Lee, S.; Park, J.-K.; Cho, K.Y. Golf Ball-Shaped PLGA Microparticles with Internal Pores Fabricated by Simple O/W Emulsion. Chem. Commun. 2010, 46, 7433–7435. [Google Scholar] [CrossRef] [PubMed]
- Qian, Z.; Wang, Y.; Li, J.; Wang, X.; Wu, D. Development of Sustainable Polyoxymethylene-Based Composites with Recycled Carbon Fibre: Mechanical Enhancement, Morphology, and Crystallization Kinetics. J. Reinf. Plast. Compos. 2014, 33, 294–309. [Google Scholar] [CrossRef]
- Chen, X.; Hou, G.; Chen, Y.; Yang, K.; Dong, Y.; Zhou, H. Effect of Molecular Weight on Crystallization, Melting Behavior and Morphology of Poly(Trimethylene Terephalate). Polym. Test. 2007, 26, 144–153. [Google Scholar] [CrossRef]
- Lozada-Flores, O.; Figueroa, I.A.; Lara, G.A.; Gonzalez, G.; Borja-Soto, C.; Verduzco, J.A. Crystallization Kinetics of Cu55Hf45 Glassy Alloy. J. Non-Cryst. Solids 2017, 460, 1–5. [Google Scholar] [CrossRef]
Figure 1.
(a,b) A temperature profile for raw materials and large particles during the isothermal crystallization experiments. and (c) Temperature profiles for raw materials and large particles during the non-isothermal crystallization experiments.
Figure 1.
(a,b) A temperature profile for raw materials and large particles during the isothermal crystallization experiments. and (c) Temperature profiles for raw materials and large particles during the non-isothermal crystallization experiments.
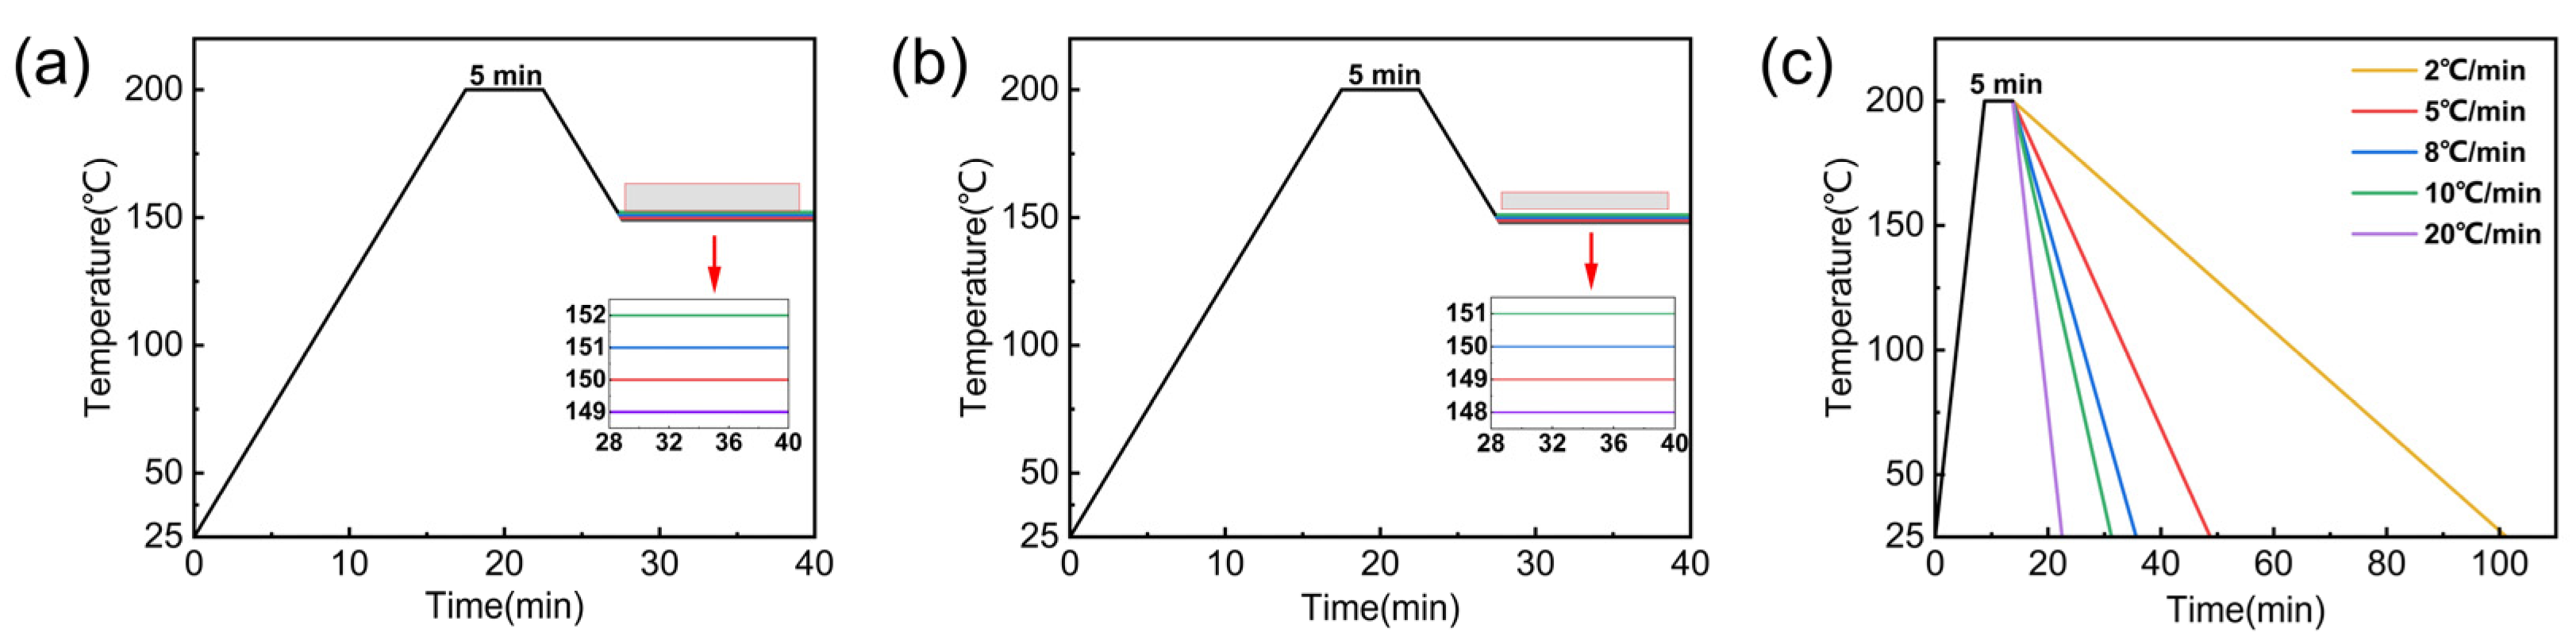
Figure 2.
(a) Crystallizer experimental setup diagram. (b) Product appearance. (c) solubility and cloud points of polyoxymethylene (POM) in methanol. (d) Molecular weight distribution of small particles. and (e) that of large particles.
Figure 2.
(a) Crystallizer experimental setup diagram. (b) Product appearance. (c) solubility and cloud points of polyoxymethylene (POM) in methanol. (d) Molecular weight distribution of small particles. and (e) that of large particles.
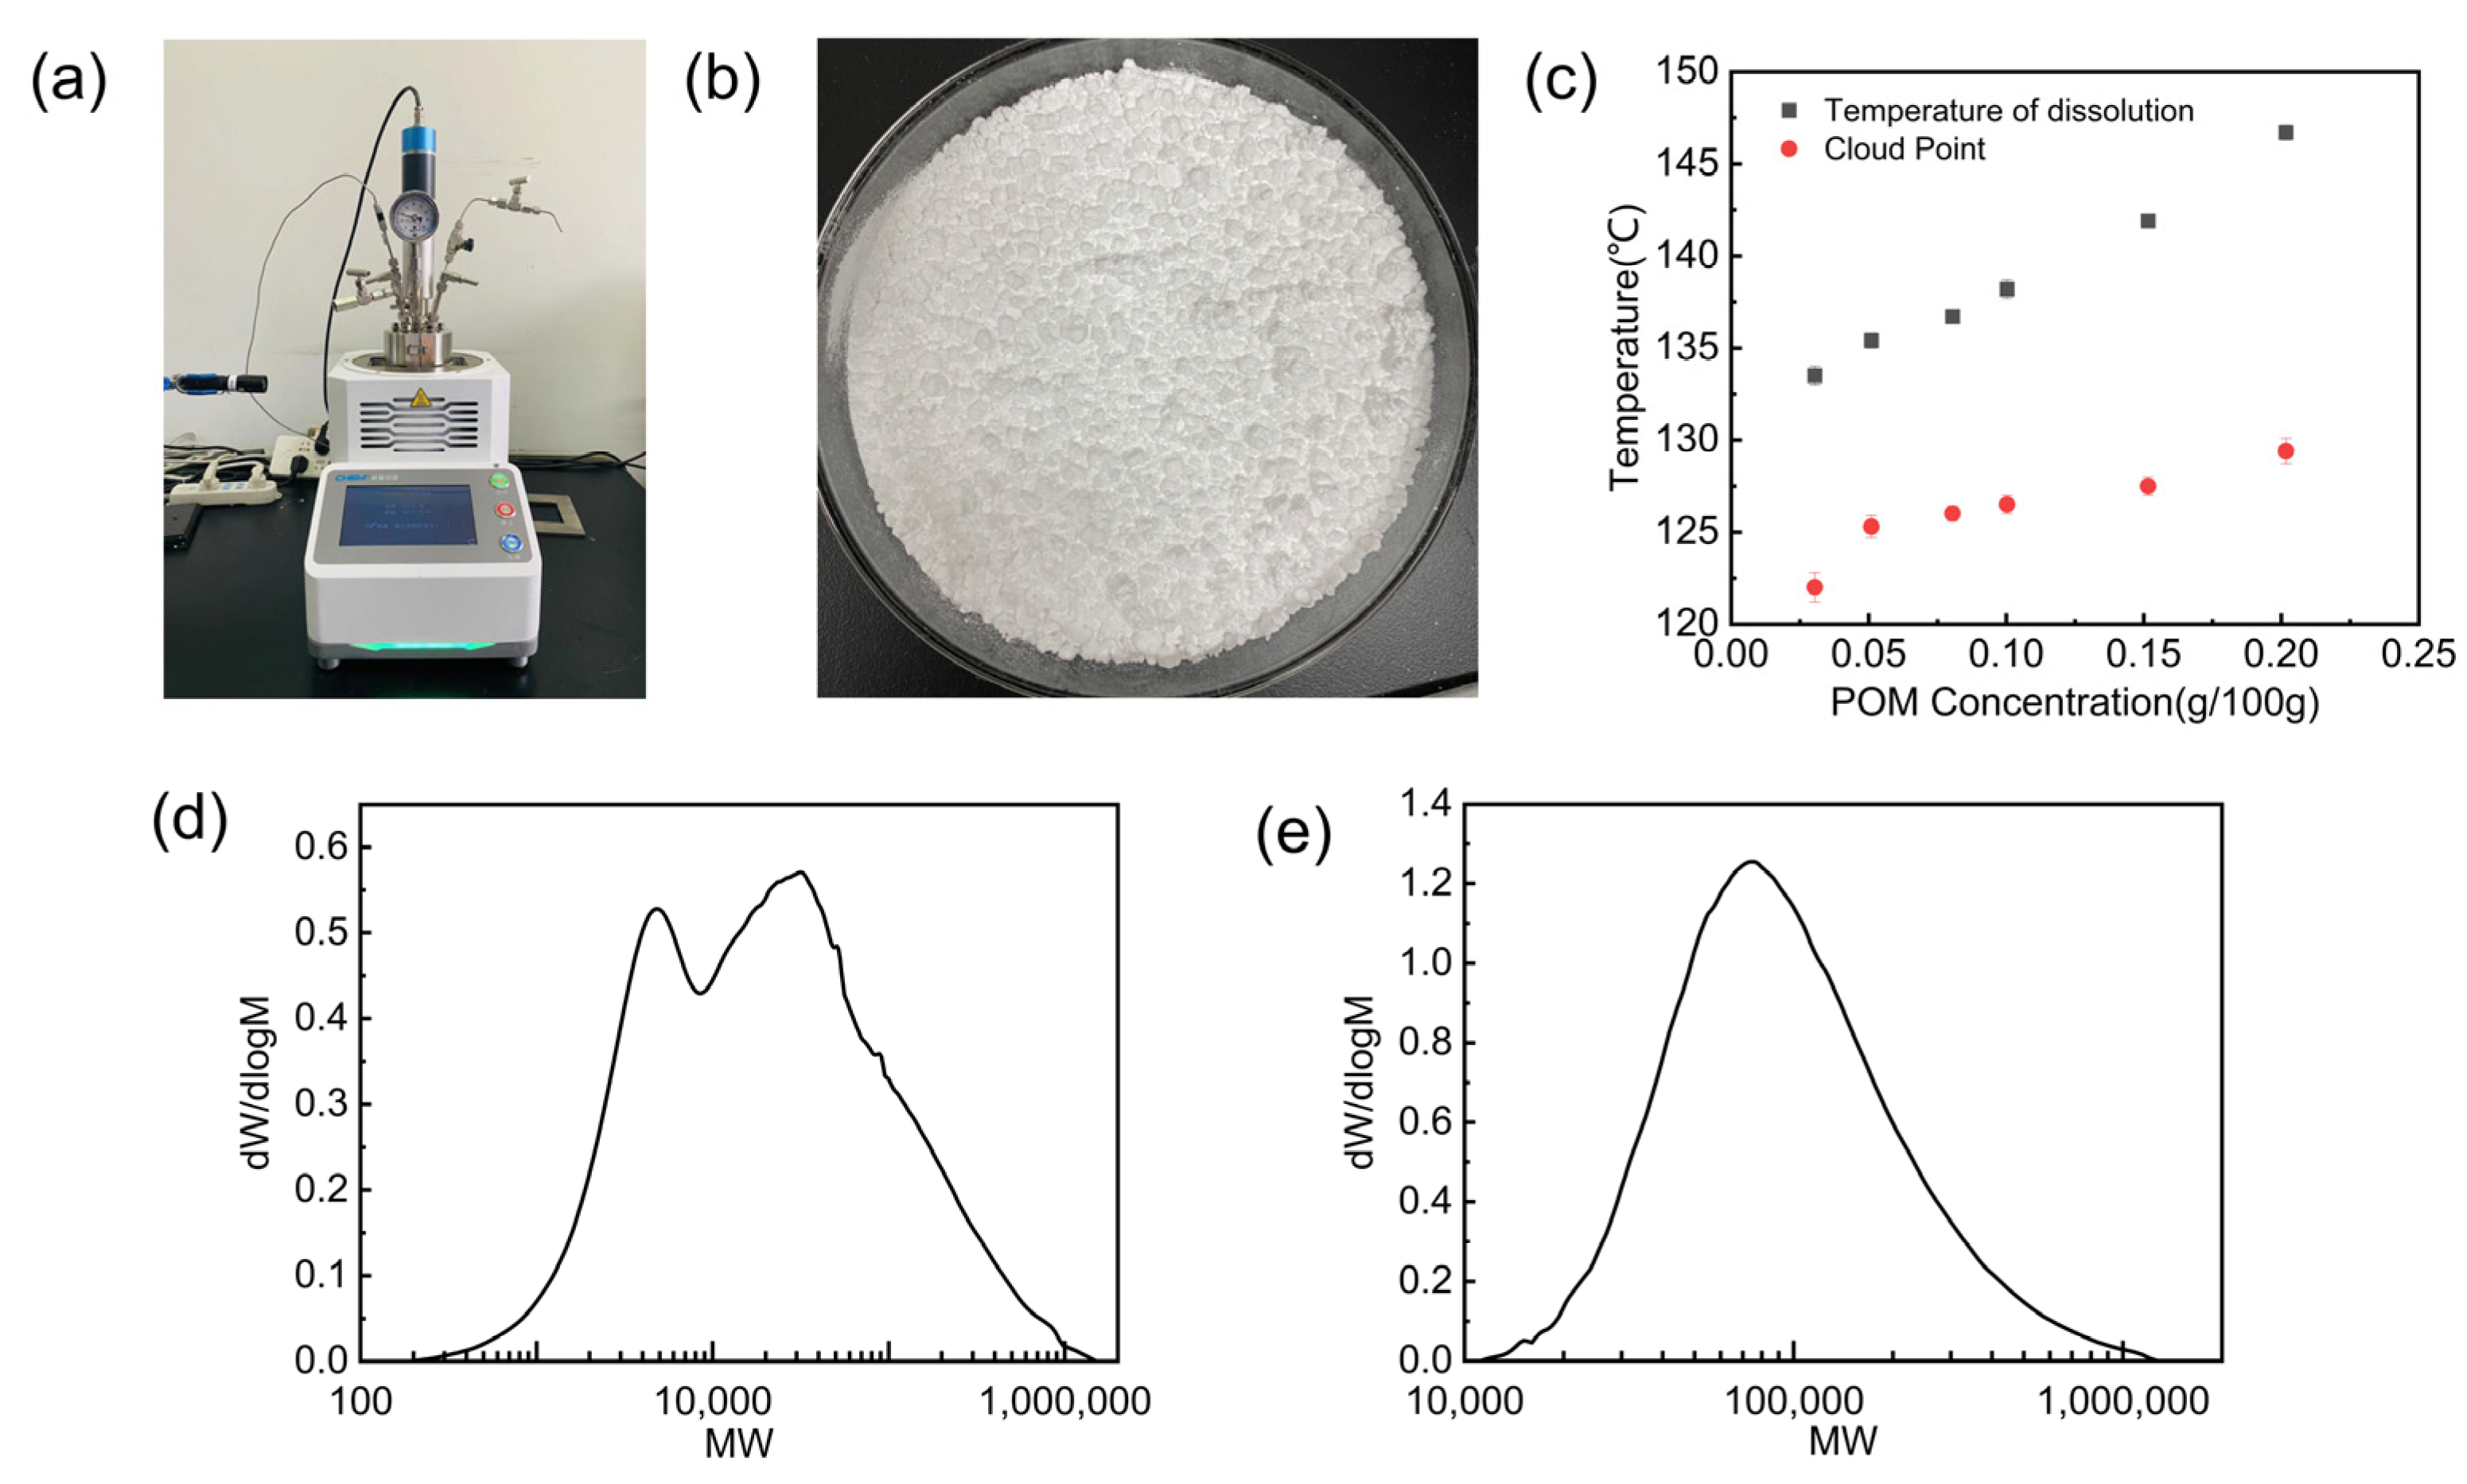
Figure 3.
(a–c) POM products under a stereo microscope; (d) SEM images of mixed products, (e) large particles, (f) small particles, (g) enlargement surface of large particles, and (h) that of small particles.
Figure 3.
(a–c) POM products under a stereo microscope; (d) SEM images of mixed products, (e) large particles, (f) small particles, (g) enlargement surface of large particles, and (h) that of small particles.

Figure 4.
Mechanism of the two crystallization pathways of POM in methanol.

Figure 5.
Non-isothermal crystallization kinetics of raw materials (a) and large particles (b) at different cooling rates. Molecular weight distribution of raw materials (c).
Figure 5.
Non-isothermal crystallization kinetics of raw materials (a) and large particles (b) at different cooling rates. Molecular weight distribution of raw materials (c).

Figure 6.
(a,b) Relative crystallinity of raw materials and large particles versus crystallization time. and (c,d) Avrami plot of lg[−ln(1 − Xt)] versus lg t for isothermal crystallization of raw materials and large particles.
Figure 6.
(a,b) Relative crystallinity of raw materials and large particles versus crystallization time. and (c,d) Avrami plot of lg[−ln(1 − Xt)] versus lg t for isothermal crystallization of raw materials and large particles.

Table 1.
Non-isothermal crystallization kinetic data for raw materials and large particle products at different cooling rates.
Table 1.
Non-isothermal crystallization kinetic data for raw materials and large particle products at different cooling rates.
| Sample | Cooling Rate (°C/min) | Tp (°C) | ΔHc (J/g) | ΔHm (J/g) | Xc (%) |
|---|---|---|---|---|---|
| Raw materials | 2 | 148.42 | 123.66 | −133.31 | 41.93 |
| 5 | 147 | 125.55 | −133.63 | 42.03 | |
| 8 | 145.63 | 131.15 | −141.80 | 44.60 | |
| 10 | 145.73 | 134.38 | −155.64 | 48.95 | |
| 20 | 143.27 | 139.13 | −156.31 | 49.17 | |
| Large particles | 2 | 153.68 | 156.89 | −142.48 | 44.82 |
| 5 | 152.62 | 165.20 | −161.43 | 50.78 | |
| 8 | 151.45 | 175.95 | −189.05 | 59.46 | |
| 10 | 150.77 | 176.14 | −196.46 | 61.79 | |
| 20 | 149.01 | 176.78 | −201.14 | 63.27 |
Table 2.
Kinetic parameters obtained by fitting the Avrami equation for polyoxymethylene (POM) raw materials and large particle products.
Table 2.
Kinetic parameters obtained by fitting the Avrami equation for polyoxymethylene (POM) raw materials and large particle products.
| Sample | Tc (°C) | n | k (1/minn) | t0.5 (min) | R2 |
|---|---|---|---|---|---|
| Raw materials | 149 | 2.627 | 0.415 | 1.216 | 0.994 |
| 150 | 2.318 | 0.0515 | 3.068 | 0.998 | |
| 151 | 2.179 | 0.0106 | 6.818 | 0.983 | |
| 152 | 2.157 | 0.00441 | 10.433 | 0.969 | |
| Large particles | 148 | 2.080 | 1.249 | 0.754 | 0.996 |
| 149 | 2.346 | 0.277 | 1.478 | 0.989 | |
| 150 | 2.194 | 0.0722 | 2.803 | 0.993 | |
| 151 | 2.182 | 0.0476 | 3.412 | 0.987 |
Disclaimer/Publisher’s Note: The statements, opinions and data contained in all publications are solely those of the individual author(s) and contributor(s) and not of MDPI and/or the editor(s). MDPI and/or the editor(s) disclaim responsibility for any injury to people or property resulting from any ideas, methods, instructions or products referred to in the content. |
© 2024 by the authors. Licensee MDPI, Basel, Switzerland. This article is an open access article distributed under the terms and conditions of the Creative Commons Attribution (CC BY) license (https://creativecommons.org/licenses/by/4.0/).
Share and Cite
MDPI and ACS Style
Du, H.; Zhou, X.; Zhang, Y.; Ye, Y.; Xuanyuan, S.; Yang, S.; Lao, G.; Xie, C. Distinct Crystallization Pathways of Polyoxymethylene in Methanol System. Crystals 2024, 14, 401. https://doi.org/10.3390/cryst14050401
AMA Style
Du H, Zhou X, Zhang Y, Ye Y, Xuanyuan S, Yang S, Lao G, Xie C. Distinct Crystallization Pathways of Polyoxymethylene in Methanol System. Crystals. 2024; 14(5):401. https://doi.org/10.3390/cryst14050401
Chicago/Turabian StyleDu, Haowen, Xiaomeng Zhou, Yaru Zhang, Yang Ye, Shutian Xuanyuan, Sen Yang, Guorui Lao, and Chuang Xie. 2024. "Distinct Crystallization Pathways of Polyoxymethylene in Methanol System" Crystals 14, no. 5: 401. https://doi.org/10.3390/cryst14050401
Note that from the first issue of 2016, this journal uses article numbers instead of page numbers. See further details here.