Article

Research on Fe Removal, Regeneration Process, and Mechanical Properties of Mg Alloy AM50A

1
Chongqing CEPREI Industrial Technology Research Institute Co., Ltd., Chongqing 401332, China
2
CEPREI Innovation (Chongqing) Technology Co., Ltd., Chongqing 401332, China
3
Chongqing Changan Automobile Co., Ltd., Chongqing 400044, China
4
College of Materials Science and Engineering, Chongqing University, Chongqing 400044, China
*
Authors to whom correspondence should be addressed.
These authors contributed equally to this work.
Crystals 2024, 14(5), 407; https://doi.org/10.3390/cryst14050407
Submission received: 3 April 2024 / Revised: 19 April 2024 / Accepted: 23 April 2024 / Published: 26 April 2024

Abstract

:
In recent years, the widespread application of Mg alloy casting and Mg alloy products has generated a large amount of Mg alloy waste. This experiment used a single factor experimental analysis method to study the optimal process for removing Fe from Mg alloy AM50A waste, and developed an efficient Fe removal and regeneration process for Mg alloy AM50A. It was found that the optimal refining temperature for removing Fe ions was 670 °C, the optimal refining (RJ-2) agent mass ratio was 1.5%, and the optimal refining time was 40 min. Regenerated J40-1.5-AM50A Mg alloy was prepared using the best refining process, and its composition and mechanical properties were tested and analyzed. The experimental results show that the composition of the regenerated J40-1.5-AM50A Mg alloy prepared by this method is consistent with AM50A, with an Fe removal rate of 96.2%. The mechanical properties were improved compared to the original AM50A sample, with a maximum tensile strength increase of 1.611 KN and a tensile strength increase of 26.333 MPa. The elongation after fracture is 2.25 times that of the original sample. Research has shown that the RJ-2 refining agent can provide mechanical properties of magnesium alloys during the refining process. By analyzing the composition, XRD, SEM, and EDS of AM50A (Fe) and J40-1.5-AM50A, it was found that the refining process accelerates the removal of Fe in the form of Fe deposition.

1. Introduction

Mg is a light metal with a low melting point and a silver white metallic luster. Alloy materials related to Mg have high strength ratio, low density, good casting performance and ductility, and are widely used in the material industry [1,2,3,4,5,6]. It is known as a green engineering material in the 21st century [7]. With the rapid development of industries such as rail transportation, automobile manufacturing, shipbuilding, and aerospace, the demand for lightweight materials is increasing significantly. Additionally, there is a pressing need to conserve energy and reduce pollution [8,9]. Mg alloy materials are gaining increasing attention in fields such as automotive manufacturing and the 3C industry due to their low density, lightweight, excellent vibration absorption, and good casting performance [10,11,12,13,14,15]. Currently, Mg alloys are primarily used in various components of automobiles, including interior panels, seat frames, radiator supports, and bumpers, as well as in the construction of floors, interior panels, and bodies of rail vehicles. Compared to traditional steel, Mg alloys can achieve a weight reduction of 55% to 60%. The characteristic provides great potential for improving fuel efficiency, reducing exhaust emissions, enhancing driving performance, and increasing comfort in the automotive industry. The use of Mg alloy materials in automobile manufacturing effectively reduces the overall weight of vehicles, thereby lowering fuel consumption and reducing exhaust emissions. Furthermore, Mg alloys exhibit excellent vibration absorption, which enhances vehicle safety and passenger comfort. In the 3C industry, the lightweight properties of Mg alloys offer more compact and portable solutions for electronic devices. Continual innovation and research are gradually improving the strength and corrosion resistance of Mg alloys, further expanding their application range. In the future, with increased emphasis on environmental friendliness and sustainable development, the prospects for Mg alloy materials in various industries will be even more extensive. They will actively contribute to driving industrial progress and improving the quality of life.
As the application scope and demand for Mg alloys continue to increase, the generation of Mg alloy waste and discarded Mg alloy components during the production process is also growing. Therefore, domestic and international scholars have paid extensive attention to the recycling and utilization of Mg alloys, which are of significant importance for energy conservation, carbon reduction, pollution reduction, and extending the lifecycle of Mg alloys [16,17,18,19,20,21,22,23,24]. Mg alloy recycling technologies not only play a positive role in the rational utilization of Mg alloys, but also effectively reduce the energy consumption and carbon emissions of primary production [25,26,27]. Additionally, these recycling technologies can enable the reuse of waste heat, thereby reducing environmental pollution and enhancing the core competitiveness of enterprises, with significant practical significance. Mg alloy waste often contains a large amount of impurities such as Fe, Cu, and oxides. These impurities can reduce the mechanical performance and corrosion resistance of Mg alloys, making the development of effective Mg alloy recycling technologies urgent. Therefore, in the field of Mg alloy recycling and utilization, the development of efficient Mg alloy recycling technologies is crucial. These technologies can effectively remove impurities, improve the quality and performance of Mg alloys, and enable the circular utilization of resources. By promoting the recycling of Mg alloy waste, we can further drive sustainable development, reduce resource consumption, decrease environmental impact, and contribute to the sustainable development of the Mg alloy industry.
The chemical properties of Mg are highly reactive, which is why Mg alloy waste typically contains a significant amount of metal oxides and impurities, with Fe being a major component. Therefore, the removal of impurities and oxides is a crucial consideration in the Mg alloy recycling process. Distillation or smelting methods are commonly used for the recycling of Mg waste. Distillation is primarily suitable for the recovery of pure Mg and is not applicable to Mg alloys. On the other hand, smelting is the preferred method for recycling Mg alloy waste. Smelting can be divided into flux-based and fluxless methods. For clean Mg alloy waste with no surface oils, refining through the solventless method is generally employed. This method is suitable for in-house recycling of waste, as it yields higher purity without the need for additional solvents. In contrast, for waste materials with surface oils, powders, corrosion, or contamination, the flux-based method is more appropriate for recycling. The flux-based method helps separate impurities and pollutants from the waste, thereby improving the purity of the recycled alloy. This method involves adding appropriate flux, which reacts with the impurities in the waste to form slag, allowing the recovery of pure Mg alloy. Therefore, in the recycling process of Mg alloy waste, it is essential to select the appropriate method based on the nature and condition of the waste. The solventless method is suitable for clean waste, while the flux-based method is more suitable for dealing with waste containing surface oils, powders, corrosion, or contamination. Choosing the appropriate recycling method can enhance recycling efficiency and ensure that the recovered Mg alloy has high purity and good quality.
The raw material for this study is AM50A die cast Mg alloy waste with a relatively clean, oil-free, and corrosion-free circulating surface in the factory. However, to explore an effective method for removing Fe and significantly improve the mechanical properties of recycled Mg alloys (compared to the original unrefined waste), an Fe doping method was used to simulate AM50A(Fe) Mg alloy waste with a high proportion of Fe composition. This experiment used a high-temperature refining method to study the regeneration technology of AM50A (Fe) Mg alloy waste, and explored a regeneration technology that has a good effect on removing Fe from waste. It characterized and analyzed the AM50A magnesium alloy before and after Fe removal by XRD, SEM, mechanical performance testing, etc., and studied the mechanism of Fe removal and the effect of Fe removal on the mechanical properties of AM50A magnesium alloy. It was found that the optimal refining temperature for removing Fe ions was 670 °C, the optimal refining agent mass ratio was 1.5%, and the optimal refining time was 40 min.

2. Experimental Section

2.1. Instrument and Reagent

Main instruments: optima 7000 DV inductively coupled plasma emission spectrometer, high temperature box furnace, X-ray powder diffractometer, electronic universal testing machine, scanning electron microscope.
Main reagents: AM50A Mg alloy waste, Fe powder, RJ-2 refining agent (MgCl: 38–46%, KCl: 32–40%, BaCl: 5–8%, NaCl < 8%).
Protective gas: 99.99% N2.

2.2. Melting Experiment Steps

  • Check the cleanliness of the low-carbon steel crucible for cracks. After cleaning the crucible, brush it with BN coating mixed with alcohol. Open the constant temperature oven and set the temperature to 100 °C, with a heating rate of 5 °C/min. Place the crucible in the constant temperature oven for drying, then put it in a muffle furnace for preheating, with a preheating temperature of 500 °C.
  • Preheat the Mg alloy material used in the experiment in a constant temperature oven at a preheating temperature of 100 °C.
  • Put the prepared Mg alloy material into the crucible of the muffle furnace and heat it up to 720 °C for melting.
  • After the Mg alloy material is melted, a refining agent is added and kept at a constant temperature for a period of time before being taken out for air cooling.

2.3. Exploration Experiment on Fe Removal Process of AM50A Mg Alloy Waste

2.3.1. Blank Experimental Group

  • Blank experimental group: Weigh 200 g of AM50A recycled waste, used N2 as the protective gas, and control the gas flow rate at 2–2.5 L/min. Set the melting temperature to 720 °C, the melting time to 30 min, and the heating rate of the muffle furnace to 5 °C/min. After the melting is completed, remove the air cooling.
  • Blank control group for Fe doping experiment [AM50A (Fe)]: Weigh 199 g of AM50A recycled waste, 1 g of Fe powder, with a preliminary setting of Fe powder to material ratio of 0.5%. N2 is used as the protective gas, and the gas flow rate is controlled at 2–2.5 L/min. The joint protection alloy is melted, with a melting temperature of 720 °C and a melting time of 30 min. The heating rate of the muffle furnace is set to 5 °C/min. After the melting is completed, it is taken out for air cooling.

2.3.2. Refining Temperature Single Factor Experiment

According to the blank control group of Fe doping experiment, 199 g of AM50A waste and 1 g of Fe powder were weighed. The melting temperature was set at 720 °C and the melting time was 30 min. The heating rate of the muffle furnace was set at 5 °C/min. After the melting experiment was completed, the refining experiment was carried out. The refining temperatures were set at 630 °C, 650 °C, 670 °C, 690 °C, and 720 °C, respectively. Three parallel groups were set for each temperature group, The initial refining time was set at 30 min (keeping the heating rate, rest time, refining agent addition, and other conditions unchanged), and the cooling rate of the muffle furnace was set at 5 °C/min. After the refining was completed, the air cooling was taken out to obtain the experimental sample.

2.3.3. Refining Time Single Factor Experiment

According to the blank control group of Fe doping experiment, 199 g of AM50A waste and 1 g of Fe powder were weighed. The melting temperature was set at 720 °C and the melting time was 30 min. The heating rate of the muffle furnace was set at 5 °C/min. After the melting experiment was completed, the refining experiment was carried out. At the optimal refining temperature, the refining time was set at 10, 20, 30, 40, and 50 min (keeping the heating rate, constant temperature, and refining agent addition unchanged). Three parallel groups were set for each time group, and the cooling rate of the muffle furnace was set at 5 °C/min. After refining, air cooling was taken out to obtain experimental samples.

2.3.4. Refining Agent Single Factor Experiment

According to the blank control group of Fe doping experiment, 199 g of AM50A waste and 1 g of Fe powder were weighed. The melting temperature was set at 720 °C and the melting time was 30 min. The heating rate of the muffle furnace was set at 5 °C/min. After the melting experiment was completed, the refining experiment was carried out. At the optimal refining temperature and time, the mass ratio of the refining agent was set to 1%, 1.5%, 2%, 2.5%, and 3% (keeping the heating rate, constant temperature, refining time, and other conditions unchanged). Three parallel groups were set for each refining agent mass ratio, and the cooling rate of the muffle furnace was set at 5 °C/min. After refining, air cooling was taken out to obtain experimental samples.

2.4. Component Analysis and Characterization

The Optima 7000 DV inductively coupled plasma emission spectrometer was used to conduct composition testing on each experimental group sample. Three parallel test samples were prepared for each experimental sample, and the average value of the parallel samples was calculated as the final result for comparison with the standard composition of AM50A Mg alloy. The composition of AM50A (Fe) Mg alloy and AM50A Mg alloy prepared by the best refining process were tested and analyzed using X-ray powder diffraction. The state of Fe in AM50A Mg alloy and the mechanism of Fe removal in the refining process were analyzed. Using a mechanical tester, the AM50A Mg alloy prepared under different factors was subjected to tensile testing and other characterization analysis to analyze the mechanism of Fe removal and the effect of Fe content on the mechanical properties of recycled Mg alloy.

3. Result

3.1. Component Analysis

3.1.1. Analysis of Fe Doping Composition

The composition of the experimental samples from the AM50A and the AM50A (Fe) was tested by ICP, and the results are shown in Table 1. The study showed that Fe ions in the AM50A (Fe) experimental group were successfully doped into the AM50A, and the proportion of Fe increased significantly to 0.079%, which was the expected achieved range and far exceeded the required value of Fe ion composition in AM50A by 0.0011%. At the same time, the remaining ions did not change much and were within the required range of AM50A composition. This indicates that the Fe doping process will not affect the proportion of other ions, and this value will be used for subsequent Fe impurity content.

3.1.2. Analysis of Single Factor Experimental Components at Refining Temperature

The study set a refining time of 30 min, a refining agent addition ratio of 0, and a refining temperature as a single variable of 630 °C, 650 °C, 670 °C, 690 °C, and 720 °C. The experimental results were analyzed for composition as shown in Table 2, and the Fe removal rate was analyzed as shown in Table 3 and Figure 1. The results showed that with the increase of refining temperature, the removal rate of Fe ions showed a trend of first increasing and then decreasing. When the refining temperature was 670 °C, the highest removal rate of Fe reached 96.2%, and the remaining ions remained within the required range of AM50A composition, indicating that the refining temperature would not affect the proportion of other ions. Therefore, 670 °C was chosen as the refining temperature for subsequent experiments.

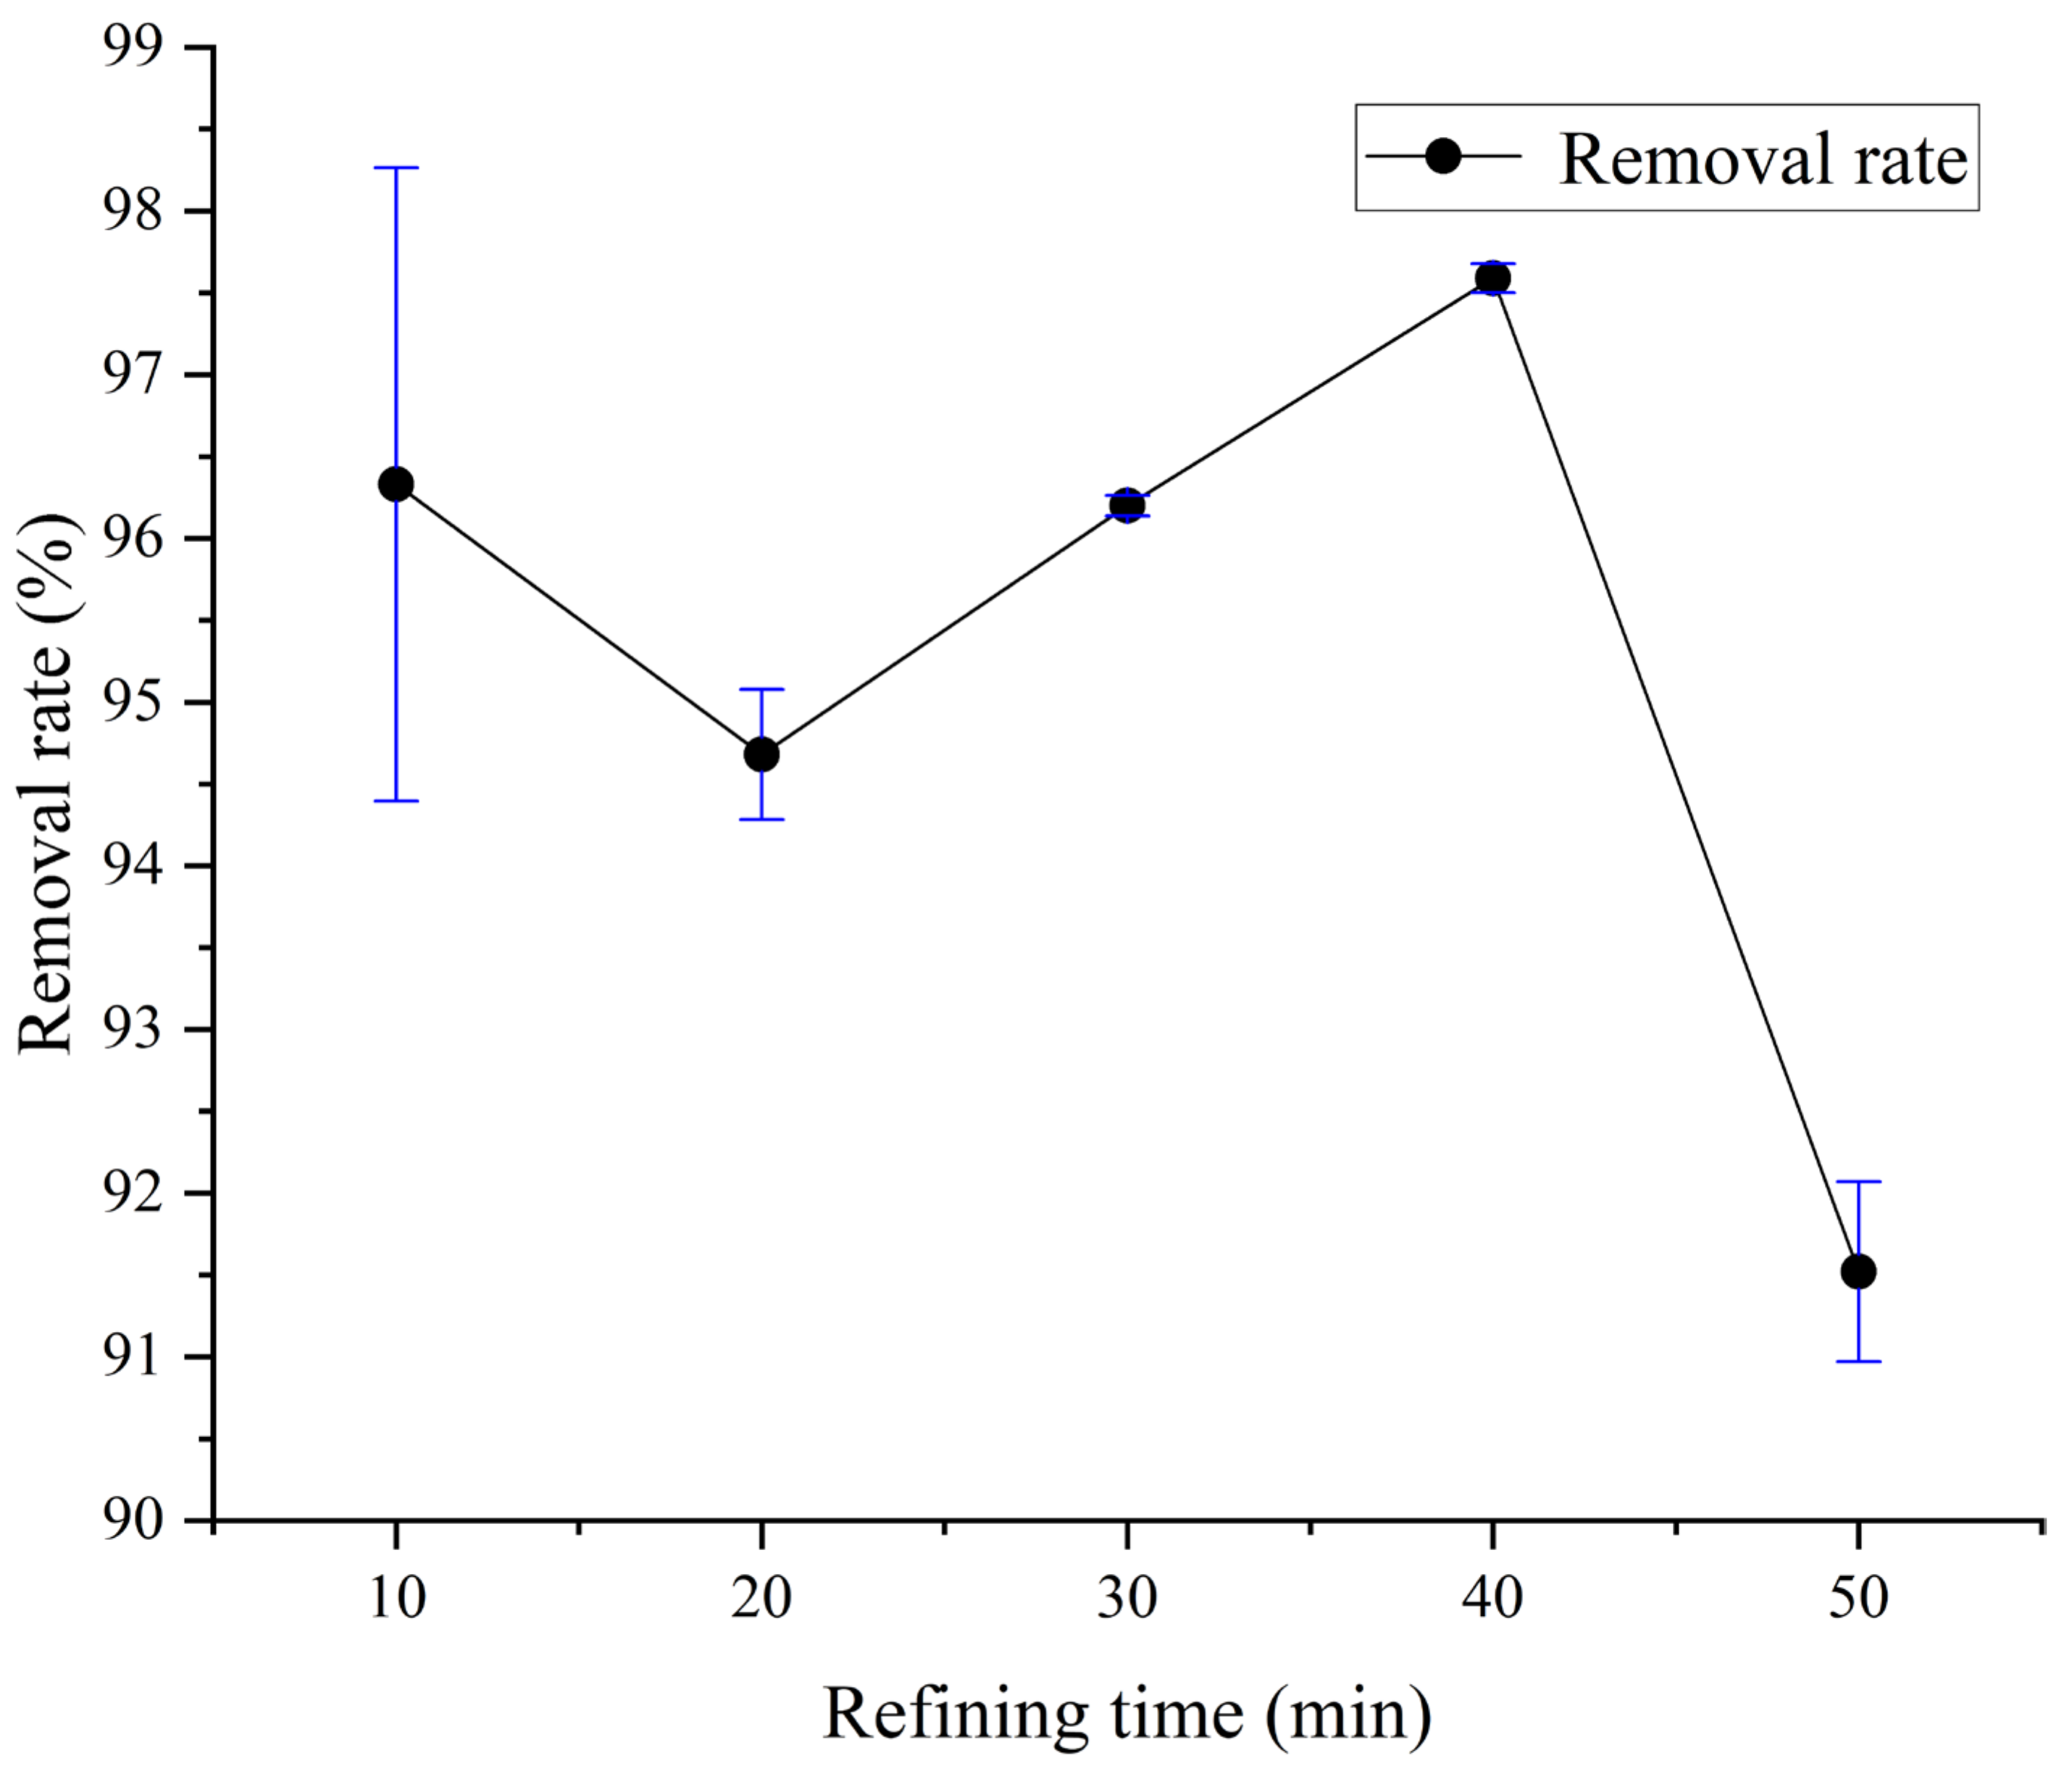
3.1.3. Analysis of Single Factor Experimental Components for Refining Time

Setting the refining temperature at 670 °C, the proportion of refining agent added was 0, and the refining time was a single variable, with 10, 20, 30, 40, and 50 min, respectively. The experimental results were analyzed for composition as shown in Table 4, and the Fe removal rate was analyzed, as shown in Table 5 and Figure 2. The results showed that with the increase of refining time, the removal rate of Fe ions showed a trend of first decreasing, then increasing, and then decreasing. There were two optimal refining times, 10 min and 40 min, respectively. When the refining time was 10 min, the removal rate of Fe was 96.33%, and when the refining time was 40 min, the removal rate of Fe was 97.59%. At the same time, in the single factor experiment of refining time, the remaining ions did not change much and were all within the required range of AM50A composition, indicating that changes in refining time will not affect the proportion of other ions; therefore, in subsequent experiments, 10 min and 40 min were selected for comparative research in refining time selection.

3.1.4. Analysis of Single Factor Experimental Components of Refining Agents

Set the refining temperature at 670 °C, and the refining time was set at 10 min and 40 min, respectively. The refining agent ratio was a single variable, which was 1%, 1.5%, 2%, 2.5%, and 3%. The experimental results were analyzed for composition as shown in Table 6 and Table 7, and the Fe removal rate was analyzed. The results are shown in Table 8 and Table 9, Figure 3 and Figure 4. The results of two sets of experiments showed that as the mass ratio of refining agents increased, the removal rate of Fe ions showed a trend of first increasing and then decreasing. When the mass ratio of refining agents was 1.5%, the removal rate of Fe ions was the highest. When the refining time was 10 min, the maximum removal rate of Fe was 94.94%. When the refining time was 40 min, the maximum removal rate of Fe was 96.20%. At the same time, in the single factor experiment of refining agents, the remaining ions did not change significantly and were within the required range of AM50A composition, indicating that changes in refining agents would not affect the proportion of other ions, and indicating that the optimal mass ratio of refining agents was 1.5%.

3.2. Characterization Analysis

3.2.1. Mechanical Performance Analysis

By analyzing the composition of the experimental results of refining temperature, refining time, and refining agent mass ratio, seven groups of samples were selected for mechanical performance testing, including the blank experimental group, AM50A (Fe), C-670-AM50A, T-10-AM50A, T-40-AM50A, J10-1.5-AM50A, and J40-1.5-AM50A, by comparing the components of the AM50A standard sample. The results are shown in Table 10. Research has shown that doping Fe can reduce the mechanical properties of AM50A. Compared to AM50A, the maximum tensile strength of AM50A (Fe) is reduced by 2.246 KN, reducing 27.84%. And the tensile strength is reduced by 34 MPa, reducing 26.84%. With the change of refining temperature and refining time, the mechanical properties of Mg alloy AM50A have changed. Under the single condition of optimal refining temperature and refining time, the mechanical properties of the C-670-AM50A, T-10-AM50A, and T-40-AM50A experimental groups have been improved compared to AM50A (Fe). Under the same optimal refining temperature and time, the mechanical properties of J40-1.5-AM50A prepared with an optimal refining time of 40 min are much better than those of J10-1.5-AM50A prepared with a refining time of 10 min. At the same time, the mechanical properties of J40-1.5-AM50A were superior to other experimental groups, and the mechanical properties of AM50A Mg alloy were also improved. The maximum tensile strength increased by 1.611 KN, increasing 19.97%. And the tensile strength increased by 26.333 MPa, increasing 20.79%. The elongation after fracture was 2.25 times that of the original sample. Compared to AM50A (Fe), the maximum tensile strength increased by 3.857 KN, increasing 66.25%. And the tensile strength increased by 60.333 MPa, increasing 65.11%. The elongation increased 68.75%. Research has shown that the optimal refining temperature for removing Fe ions in AM50A (Fe) Mg alloy is 670 °C, the optimal refining agent mass ratio is 1.5%, and the optimal refining time is 40 min.

3.2.2. XRD Characterization Analysis

The X-ray powder diffraction patterns of AM50A (Fe) and J40-1.5-AM50A were shown in Figure 5. From the XRD analysis graph, it can be seen that the peaks of AM50A (Fe) and J40-1.5-AM50A materials are regular, and the main characteristic peaks have not been destroyed, indicating that the material structure has not been damaged during the Fe removal process. Through the calculation and analysis of XRD data using Jade 6.5.26 software, and comparing PDF cards 21-1227, it was found that Fe in AM50A (Fe) exists in the form of FeO and Fe2O3, the proportion of quality was 2.41% and 35.97%. By comparing the PDF cards, no Fe phase was found in the XRD data of J40-1.5-AM50A, indicating that Fe has been removed after refinement.

3.2.3. SEM Image and EDS Energy Spectrum Analysis

By characterizing the surface morphology of AM50A (Fe) and J40-1.5-AM50A through SEM images, it can be concluded that J40-1.5-AM50A has a smoother surface with fewer impurities. The SEM image characterization is shown in Figure 6, and the EDS energy spectrum analysis is shown in Figure 7. Comparing the EDS spectrum data analysis of AM50A (Fe) and J40-1.5-AM50A, the relevant data is shown in Table 11. The mass proportion of Fe in AM50A (Fe) is 0.1%, and after refining treatment, the mass proportion of Fe in J40-1.5-AM50A is 0.00%, indicating that the refining process can remove Fe impurities.

4. Conclusions

(1)
The study used temperature single factor experiments to select the optimal refining temperature of 670 °C. The study used time single factor time screening to determine the optimal refining time of 10 min and 40 min. Using the single factor experiment of refining agent input ratio, the optimal refining agent input ratio of 1.5% was selected. And the study conducted mechanical performance testing and analysis on AM50A magnesium alloy under each single optimal condition to select the optimal refining conditions. The optimal refining temperature for AM50A waste Fe removal is 670 °C, the optimal refining time is 40 min, and the optimal refining agent ratio is 1.5%. The Fe ion removal rate of AM50A Mg alloy refined by the optimal refining process can reach up to 96.20%.
(2)
Through the testing and analysis of the mechanical properties of AM50A during the experimental process, it has been shown that as the impure Fe increases, the mechanical properties of AM50A decrease, while the mechanical properties of AM50A increase after Fe is removed. J40-1.5-AM50A prepared by the best refining process in this study showed an increase in mechanical properties compared to the original AM50A sample. The maximum tensile strength increased by 1.611 KN, the tensile strength increased by 26.333 MPa, and the elongation after fracture was 2.25 times that of the original sample.
(3)
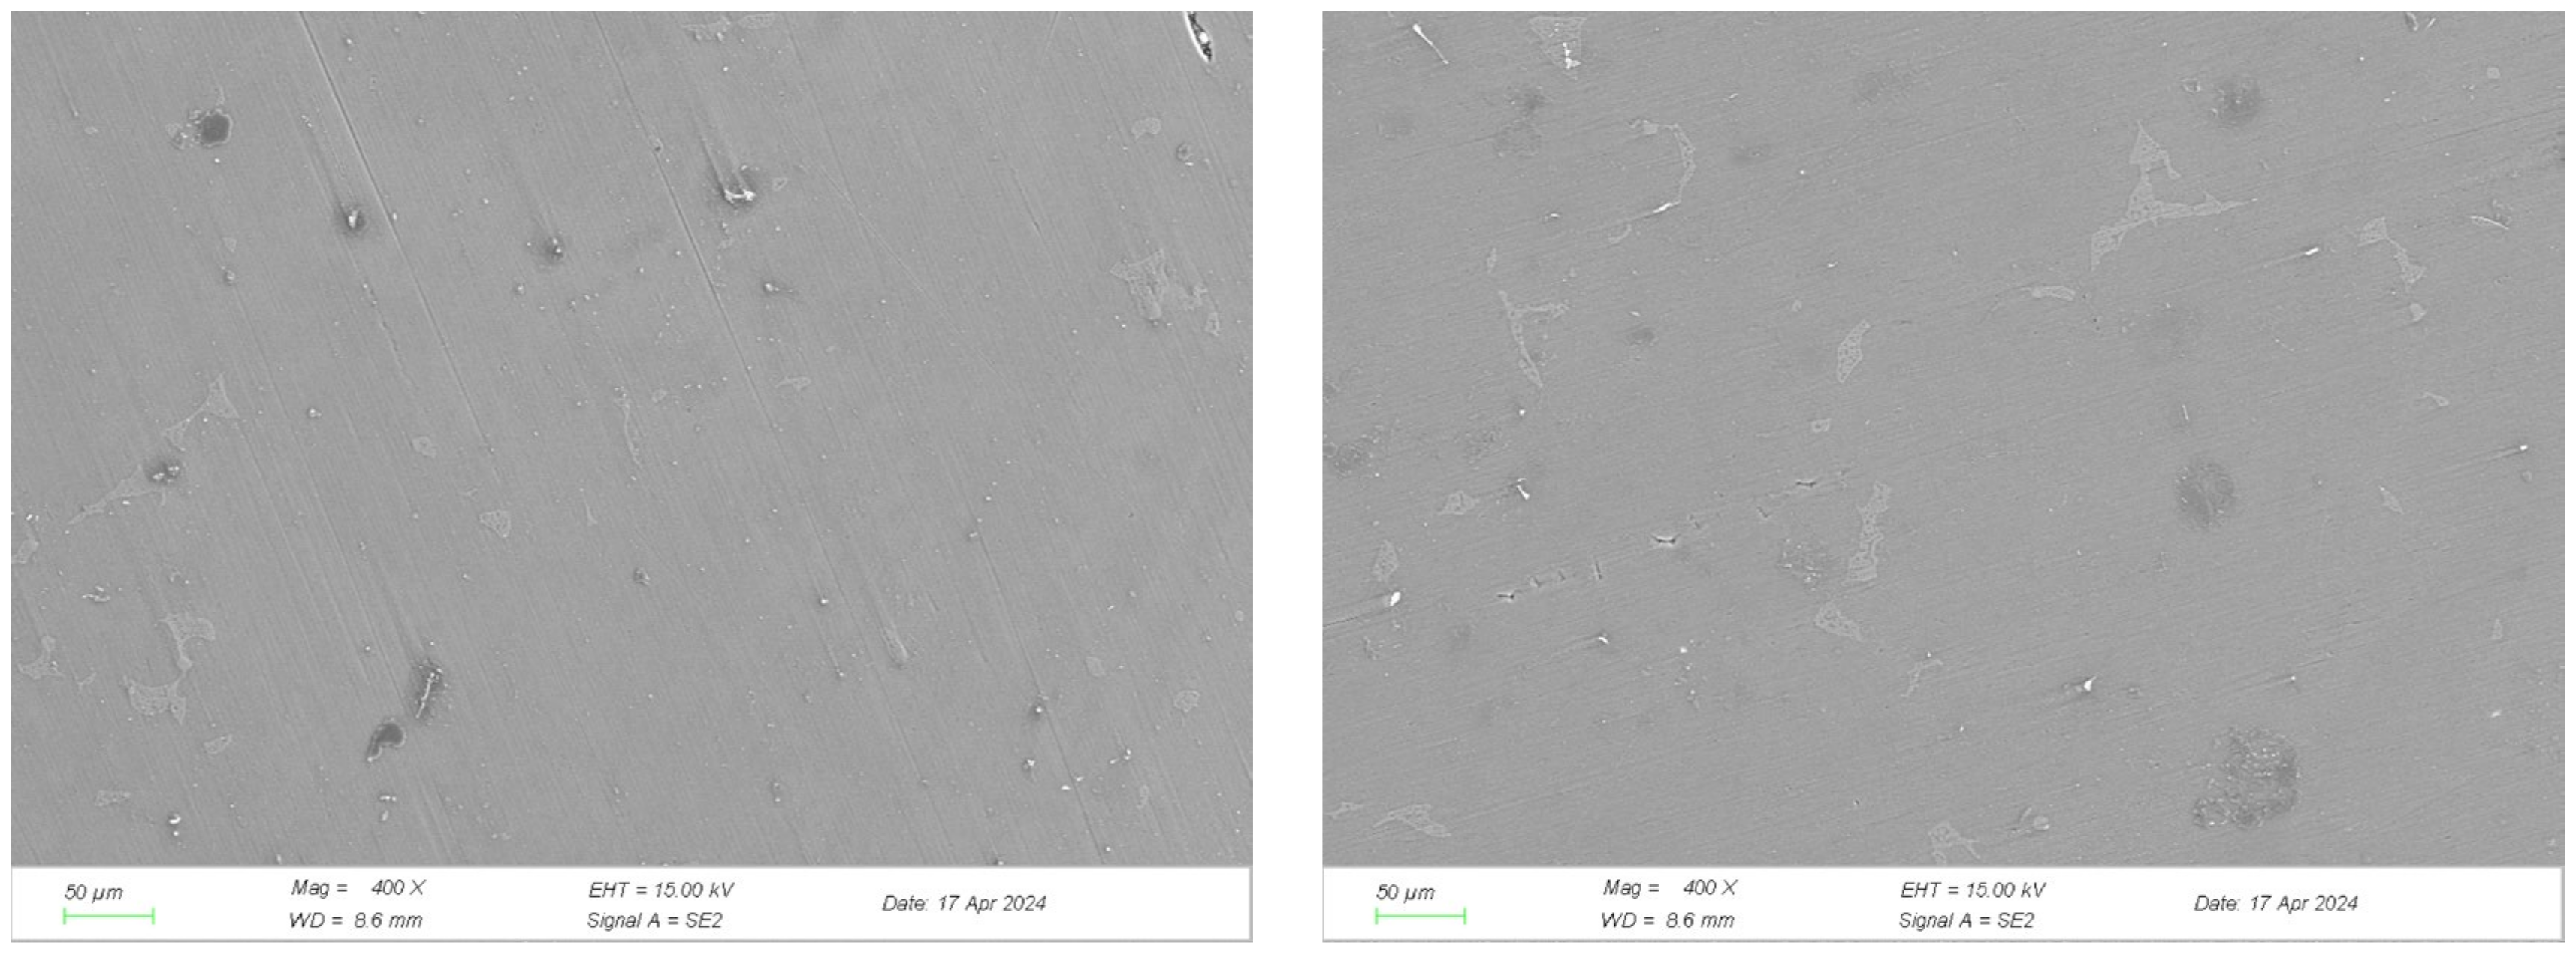
Through XRD characterization analysis of AM50A (Fe) and J40-1.5-AM50A after iron removal, the main characteristic peaks of the material before and after ion removal were not destroyed. Only the phase of Fe was retrieved in AM50A (Fe), and no phase of Fe was found in J40-1.5-AM50A, indicating that Fe was removed after the refining process, and the main structure of the material was not damaged during the ion removal process. By analyzing the SEM and EDS spectra of AM50A (Fe) and J40-1.5-AM50A, it was found that the surface of J40-1.5-AM50A was smoother, and the proportion of Fe mass fraction decreased from 0.1% of AM50A (Fe) to 0, confirming once again that Fe was removed after refining treatment.

Author Contributions

Conceptualization, Z.C., X.Y. and W.Z.; methodology, Z.C. and C.Z.; software, S.C. and W.L.; validation, X.Y. and W.Z.; formal analysis, Z.C., B.L., Q.Z. and C.Z.; investigation, C.G.; resources, S.J.; data curation, Z.C. and C.Z.; writing—original draft preparation, Z.C. and C.Z.; writing—review and editing, X.Y. and W.Z.; visualization, Z.C.; supervision, C.G.; project administration, X.Y; funding acquisition, W.Z. All authors have read and agreed to the published version of the manuscript.

Funding

This research was funded by Chongqing Technical Innovation and Application Development Special Project (grant no. cstc2021jscx-dxwtBX0022).

Data Availability Statement

The original contributions presented in the study are included in the article. Further inquiries can be directed to the corresponding authors.

Acknowledgments

Thank you for the support from Chongqing Technical Innovation and Application Development.

Conflicts of Interest

Zhao Chen, Changfa Zhou, and Bolin Luo are employed by the companies CEPREI Innovation (Chongqing) Technology Co., Ltd. and Chongqing CEPREI Industrial Technology Research Institute Co., Ltd. Wenbo Liu, Sanxing Chen, Xiaowen Yu, Wang Zhou, and Qingshuang Zhang are employed by the company Chongqing CEPREI Industrial Technology Research Institute Co., Ltd. Cong Gao and Shaowei Jia are employed by the company Chongqing Changan Automobile Co., Ltd. All authors declare that the research was conducted in the absence of any commercial or financial relationships that could be construed as a potential conflict of interest.

References

  1. Powell, B.R.; Krajewski, P.E.; Luo, A.A. Chapter 4—Magnesium alloys for lightweight powertrains and automotive structures. In Materials, Design and Manufacturing for Lightweight Vehicles, 2nd ed.; Mallick, P.K., Ed.; Woodhead Publishing: Sawston, UK, 2021; pp. 125–186. [Google Scholar]
  2. Liu, Y.; Zhang, J.; Tan, Q.; Yin, Y.; Li, M.; Zhang, M.-X. Mechanical performance of simple cubic architected titanium alloys fabricated via selective laser melting. Opt. Laser Technol. 2021, 134, 106649. [Google Scholar] [CrossRef]
  3. Dziubinska, A.; Gontarz, A. A new technology for producing AZ31 Mg alloy aircraft brackets with a triangular outline. Aircr. Eng. Aerosp. Technol. 2016, 88, 452–457. [Google Scholar] [CrossRef]
  4. Abbasi, S.; Aliofkhazraei, M.; Mojiri, H.; Amini, M.; Ahmadzadeh, M.; Shourgeshty, M. Corrosion behavior of pure Mg and AZ31 Mg alloy. Prot. Met. Phys. Chem. Surf. 2017, 53, 573–578. [Google Scholar] [CrossRef]
  5. Chen, L.; Zhao, Y.; Jing, J.; Hou, H. Microstructural evolution in graphene nanoplatelets reinforced magnesium matrix composites fabricated through thixomolding process. J. Alloys Compd. 2023, 940, 168824. [Google Scholar] [CrossRef]
  6. Li, X.; Xue, Z.; Sun, W.; Chu, J.; Wang, Q.; Tong, L.; Wang, K. Bio-inspired self-healing MXene/polyurethane coating with superior active/passive anticorrosion performance for Mg alloy. Chem. Eng. J. 2023, 454, 140187. [Google Scholar] [CrossRef]
  7. Prasad, S.S.; Prasad, S.B.; Verma, K.; Mishra, R.K.; Kumar, V.; Singh, S. The role and significance of Magnesium in modern day research-A review. J. Magnes. Alloys 2022, 10, 1–61. [Google Scholar] [CrossRef]
  8. You, S.; Huang, Y.; Kainer, K.U.; Hort, N. Recent research and developments on wrought Mg alloys. J. Magnes. Alloy. 2017, 5, 239–253. [Google Scholar] [CrossRef]
  9. Luo, A. Recent Mg alloy development for elevated temperature applications. Int. Mater. Rev. 2004, 49, 13–30. [Google Scholar] [CrossRef]
  10. Wan, L.; Luo, Y.; Xue, L.; Tian, J.; Hu, Y.; Qi, H.; Shen, X.; Huang, F.; Du, L.; Chen, X. Preparation and properties of a novel polytriazole resin. J. Appl. Polym. Sci. 2007, 104, 1038–1042. [Google Scholar] [CrossRef]
  11. Winny, W.; Akbar, R.; Brian, M. Mg: Current and alternative production routes. In Proceedings of the Chemeca: Australasian Conference on Chemical Engineering, Adelaide, Australia, 26–29 September 2010. [Google Scholar]
  12. İnci, M.; Büyük, M.; Demir, M.H.; İlbey, G. A review and research on fuel cell electric vehicles: Topologies, power electronic converters, energy management methods, technical challenges, marketing and future aspects. Renew. Sustain. Energy Rev. 2021, 137, 110648. [Google Scholar] [CrossRef]
  13. Wang, J.; Shi, C.; Yang, N.; Sun, H.; Liu, Y.; Song, B. Strength, stiffness, and panel peeling strength of carbon fiber-reinforced composite sandwich structures with aluminum honeycomb cores for vehicle body. Compos. Struct. 2018, 184, 1189–1196. [Google Scholar] [CrossRef]
  14. Zhang, W.; Xu, J. Advanced lightweight materials for Automobiles: A review. Mater. Des. 2022, 221, 110994. [Google Scholar] [CrossRef]
  15. Wang, G.G.; Weiler, J.P. Recent developments in high-pressure die-cast magnesium alloys for automotive and future applications. J. Magnes. Alloys 2023, 11, 78–87. [Google Scholar] [CrossRef]
  16. Zhao, D.; Jiang, C.; Zhao, K. Ultrasonic welding of AZ31B magnesium alloy and pure copper: Microstructure, mechanical properties and finite element analysis. J. Mater. Res. Technol. 2023, 23, 1273–1284. [Google Scholar] [CrossRef]
  17. Buffa, G.; Campanella, D.; Fratini, L.; Micari, F. AZ31 Mg alloy recycling through friction stir extrusion process. Int. J. Mater. Form. 2016, 9, 613–618. [Google Scholar] [CrossRef]
  18. Pan, F.; Yang, M.; Chen, X. A Review on Casting Mg Alloys: Modification of Commercial Alloys and Development of New Alloys. J. Mater. Sci. Technol. 2016, 32, 1211–1221. [Google Scholar] [CrossRef]
  19. Lucci, R.; Padilla, R.L.; Cantero, S.; Bariles, R.; Oldani, C. Refining of AZ91 Mg Alloy Obtained in Machining Chips Recycling. Procedia Mater. Sci. 2015, 8, 886–893. [Google Scholar] [CrossRef]
  20. Han, Q. Ablation casting: Solidification characteristics, microstructure formation, and mechanical propertie. Int. J. Metalcast. 2021, 15, 1213–1222. [Google Scholar] [CrossRef]
  21. Deepati, A.K.; Alhazmi, W.; Benjeer, I. Mechanical characterization of AA5083 aluminum alloy welded using resistance spot welding for the lightweight automobile body fabrication. Mater. Today Proc. 2021, 45, 5139–5148. [Google Scholar] [CrossRef]
  22. Tu, Q.; Hertwich, E.G. A mechanistic model to link technical specifications of vehicle end-of-life treatment with the potential of closed-loop recycling of post-consumer scrap alloys. J. Ind. Ecol. 2022, 26, 704–717. [Google Scholar] [CrossRef]
  23. Tillová, E.; Chalupová, M.; Borko, K.; Kuchariková, L. Changes of fracture surface in recycled A356 cast alloy. Mater. Today Proc. 2016, 3, 1183–1188. [Google Scholar] [CrossRef]
  24. Deng, J.; Huang, G.; Zhao, Y.; Wang, B. Electrochemical Performance of AZ31 Mg Alloy under Different Processing Conditions. Rare Met. Mater. Eng. 2014, 43, 316–321. [Google Scholar]
  25. Zhao, J.; Wang, Z.J. Thermomechanical processing of advanced high strength steels. Prog. Mater. Sci. 2018, 94, 174–242. [Google Scholar] [CrossRef]
  26. Dai, Z.; Chen, H.; Ding, R.; Lu, Q.; Zhang, C.; Yang, Z.; van der Zwaag, S. Fundamentals and application of solid-state phase transformations for advanced high strength steels containing metastable retained austenite. Mater. Sci. Eng. R Rep. 2021, 143, 100590. [Google Scholar] [CrossRef]
  27. Cheng, J.-J.; Cao, J.-G.; Zhao, Q.-F.; Liu, J.; Yu, N.; Zhao, R.-G. A novel approach to springback control of high-strength steel in cold roll forming. Int. J. Adv. Manuf. Technol. 2020, 107, 1793–1804. [Google Scholar]
Figure 1. Effect of Refining Temperature on Fe Removal.
Crystals 14 00407 g001
Figure 2. Effect of Refining Time on Fe Removal.
Crystals 14 00407 g002
Figure 3. Effect of Refining Agent Dosage on Fe Removal (Refining Time 10 min).
Crystals 14 00407 g003
Figure 4. Effect of Refining Agent Dosage on Fe Removal (Refining Time 40 min).
Crystals 14 00407 g004
Figure 5. XRD characterization of left AM50A (Fe) and right J40-1.5-AM50A.
Crystals 14 00407 g005
Figure 6. SEM image of left AM50A (Fe) and right J40-1.5-AM50A.
Crystals 14 00407 g006
Figure 7. EDS energy spectrum of left AM50A (Fe) and right J40-1.5-AM50A.
Crystals 14 00407 g007
Table 1. Composition Requirements (%) (N represents undetected).
AlMnZnSiFeCuNiMg
AM50A4.5–5.30.28–0.5≤0.2≤0.05≤0.004≤0.008≤0.001Remaining proportion
Blank experimental group4.440.300.0400.00370.00110.0006N
AM50A (Fe)4.400.240.0500.0300.0790.0002N
Table 2. Single factor experimental composition analysis of refining temperature (mean proportion %) (N represents undetected).
Refining TemperatureAlMnZnSiFeCuNiMg
AM50A (Fe)4.400.240.0500.0300.0790.0002NRemaining proportion
C-630-AM50A4.620.200.0600.0190.0140.0006N
C-650-AM50A4.650.210.0560.0190.010.0007N
C-670-AM50A4.390.210.0530.0190.0030.008N
C-690-AM50A4.460.200.0560.0240.00490.0006N
C-720-AM50A4.260.210.0510.0170.0420.0004N
Table 3. Analysis of Fe removal rate in single factor experiment of refining temperature.
Refining TemperatureTest 1 (%)Test 2 (%)Test 3 (%)Mean Proportion (%)Standard Deviation
C-630-AM50A83.1781.0882.5982.281.08
C-650-AM50A86.5488.1487.3487.340.8
C-670-AM50A97.296.794.796.21.32
C-690-AM50A92.8292.9795.6193.81.57
C-720-AM50A45.8448.2346.4546.841.24
Table 4. Refining Time Single Factor Experimental Composition (mean proportion %) (N represents undetected).
Refining TimeAlMnZnSiFeCuNiMg
AM50A (Fe)4.400.240.0500.0300.0790.0002NRemaining proportion
T-10-AM50A4.490.230.036N0.00290.00050.0004
T-20-AM50A 4.680.250.038N0.00420.00050.0004
T-30-AM50A 4.390.210.0530.0190.0030.008N
T-40-AM50A 4.720.230.039N0.00190.00050.0004
T-50-AM50A 4.710.240.039N0.00670.00050.0004
Table 5. Analysis of Iron Removal Rate in Single Factor Experiment of Refining Time.
Refining TimeTest 1 (%)Test 2 (%)Test 3 (%)Mean Proportion (%)Standard Deviation
T-10-AM50A97.3397.5694.196.331.93
T-20-AM50A 94.3894.5395.1394.680.40
T-30-AM50A 96.2296.1396.2596.20.06
T-40-AM50A 97.4997.6297.6697.590.09
T-50-AM50A 91.5290.9792.07 91.520.55
Table 6. Single factor experimental composition of refining agent (mean proportion %), refining time 10 min (N represents undetected).
Refining Agent RatioAlMnZnSiFeCuNiMg
AM50A (Fe)4.400.240.0500.0300.0790.0002NRemaining proportion
J10-1-AM50A4.7680.230.0360.0270.0070.006N
J10-1.5-AM50A4.1760.240.0340.0150.0040.004N
J10-2-AM50A4.3680.220.0370.0140.0130.005N
J10-2.5-AM50A4.0460.210.0330.0180.0240.004N
J10-3-AM50A4.170.200.0340.0170.0380.005N
Table 7. Single factor experimental composition of refining agent (mean proportion %), refining time 40 min (N represents undetected).
Refining Agent RatioAlMnZnSiFeCuNiMg
AM50A (Fe)4.400.240.0500.0300.0790.0002NRemaining proportion
J40-1-AM50A5.3310.210.0470.0190.0060.0006N
J40-1.5-AM50A4.9790.240.0460.0130.0030.0005N
J40-2-AM50A4.6730.190.0380.0150.0070.0005N
J40-2.5-AM50A4.9450.210.0430.0160.0130.004N
J40-3-AM50A4.6060.210.0440.0170.0150.004N
Table 8. Analysis of ion removal rate in single factor experiments with refining agent input ratio (refining time 10 min).
Refining Agent RatioTest 1 (%)Test 2 (%)Test 3 (%)Mean Proportion (%)Standard Deviation
J10-1-AM50A91.2491.3290.86 91.14 0.25
J10-1.5-AM50A94.2795.0195.53 94.94 0.63
J10-2-AM50A84.0785.1981.37 83.54 1.96
J10-2.5-AM50A69.0869.8769.91 69.62 0.47
J10-3-AM50A51.8651.7352.11 51.90 0.19
Table 9. Analysis of ion removal rate in single factor experiments with refining agent input ratio (refining time 40 min).
Refining Agent RatioTest 1 (%)Test 2 (%)Test 3 (%)Mean Proportion (%)Standard Deviation
J40-1-AM50A92.3492.1892.70 92.41 0.27
J40-1.5-AM50A97.2396.3495.04 96.20 1.10
J40-2-AM50A91.1590.7991.48 91.14 0.35
J40-2.5-AM50A84.5483.7882.31 83.54 1.13
J40-3-AM50A80.7980.8581.40 81.01 0.34
Table 10. Mechanical Performance Analysis.
CategoryMaximum Tensile Force/KNTensile Strength/MPaElongation after Fracture/%
Blank experimental group8.068126.6673
AM50A (Fe)5.822 92.6674
C-670-AM50A6.698105.6673.333
T-10-AM50A6.691054.08
T-40-AM50A6.11596.3335
J10-1.5-AM50A3.512562.5
J40-1.5-AM50A9.6791536.75
Table 11. Linear total spectrum analysis of AM50A (Fe) and J40-1.5-AM50A.
CategoryElementLine TypeWt%Wt% SigmaAt%
AM50A (Fe)MgK 77.700.1379.63
AlK21.800.1120.14
SiK0.070.030.06
MnK0.000.060.00
FeK0.100.070.04
ZnL0.330.060.13
total100 100.00
J40-1.5-AM50AMgK 77.070.1079.05
AlK22.430.1020.73
SiK0.050.030.05
MnK0.000.050.00
FeK0.000.060.00
ZnL0.450.050.17
total100 100.00
Disclaimer/Publisher’s Note: The statements, opinions and data contained in all publications are solely those of the individual author(s) and contributor(s) and not of MDPI and/or the editor(s). MDPI and/or the editor(s) disclaim responsibility for any injury to people or property resulting from any ideas, methods, instructions or products referred to in the content.

