
Crystal Plasticity Finite Element Modeling of the Influences of Ultrafine-Grained Austenite on the Mechanical Response of a Medium-Mn Steel

1
Mechanical Engineering, University of Wyoming, Laramie, WY 82071, USA
2
School of Engineering, University of Leicester, Leicester LE1 7RH, UK
*
Author to whom correspondence should be addressed.
Crystals 2024, 14(5), 405; https://doi.org/10.3390/cryst14050405
Submission received: 2 March 2024
/
Revised: 9 April 2024
/
Accepted: 17 April 2024
/
Published: 26 April 2024
(This article belongs to the Special Issue Characterization and Modelling of the Deformation and Failure of Engineering Metallic Materials)
Abstract
:Medium manganese (medium-Mn) steel, one of the third-generation advanced high-strength steels (AHSS), delivers impressive mechanical properties such as high yield strength, ultimate tensile strength, and uniform elongation. One notable feature of medium-Mn steels is the presence of ultrafine-grained (UFG) austenite, achieved through phase transformation from the parent martensite phase during intercritical annealing. While, in general, UFG is considered a strengthening mechanism, the impact of UFG austenites in medium-Mn steel has not been fully studied. In this manuscript, we advance our previous work on crystal plasticity simulation based on the Taylor model to consider fully resolved high-fidelity microstructures and systematically study the influence of the UFG austenites. The original microstructure with UFG is reconstructed from a set of serial electron backscatter diffraction (EBSD) scans, where the exact grain morphology, orientation, and phase composition are preserved. This microstructure was further analyzed to identify the UFG austenites and recover them to their parent martensite before the intercritical annealing. These two high-fidelity microstructures are used for a comparative study using dislocation density-based crystal plasticity finite modeling to understand the impact of UFG austenites on both the local and overall mechanical responses.
1. Introduction
Advanced high-strength steels (AHSS) deliver impressive mechanical properties such as high yield strengths, ultimate tensile strengths, and uniform elongations, hence playing a crucial role in various engineering applications, especially the automotive industry. AHSS recently started the commercialization of this third-generation product, including medium manganese steels (medium-Mn), designed to combine the economic advantages of the first-generation AHSS with the superior mechanical characteristics of the second-generation [1,2,3]. Medium-Mn steels are notably characterized by ultrafine-grained (UFG) austenite in their microstructure, produced in the intercritical annealing process at a certain temperature range [4,5]. This temperature range allows the formation of UFG austenite and ferrite within the phase and is also critical for the recrystallization of -martensite. The size, quantity, composition, and stacking fault energy of the UFG austenite, therefore, are influenced not just by the partitioning of Mn and C but also by the temperature and duration of intercritical annealing [3,4,6,7].
Among various methods of strengthening, grain refinement is widely acknowledged as an efficient way to enhance strength and toughness simultaneously [8]. For medium-Mn steels, there exists a strong interest in understanding the effects of the UFG phases, which could be used to guide the manufacturing process to improve the properties of medium-Mn steels further. Utilizing approaches like Mileiko’s composite model to study the phase fractions of austenite and -martensite, Matlock et al. and Gibbs et al. have identified promising enhancements in the mechanical properties of third-generation AHSS [1]. Various experimental studies have identified the contributions to combined strength-ductility from the UFG austenite [9,10], and motivated the manufacturing process design to achieve the desired UFG austenite in the microstructure [11,12,13]. Crystal Plasticity Finite Element (CPFE) modeling has long been used to establish the microstructure-property relationship for metals and alloys and help guide the analysis and design of better alloys for different applications. A growing trend in AHSS development is the application of CPFE, focusing on studying the deformation and failure mechanisms in multi-phase steels [6,14,15,16] by incorporating microstructural data, adopting dislocation density-based flow rules and hardening rules for dislocation slip consideration, and accounting for additional deformation mechanisms.
Many medium-Mn steels demonstrate both the twinning induced plasticity (TWIP) effect and the transformation induced plasticity (TRIP) effect, influenced by stacking fault energy [17,18], with strong grain orientation and morphology dependency [19,20]. In our previous work [6], a CPFE modeling framework based on the Taylor model for medium-Mn is developed, which fully incorporates dislocation slip, TWIP, and TRIP but only considers the volume fraction of the individual phases but not the fully resolved microstructures. The impact of UFG is studied by controlling the volume fraction and its evolution in the microstructure in the context of the Taylor model, where each grain/phase is subjected to the same macroscopic loading and the volume fraction weighted average response is used as the macroscopic response. The TRIP effect in medium-Mn involves the transformation of retained austenite into martensite during plastic deformation [21]. This transformation is associated with a significant transformation strain, which can lead to plastic strains of up to 35% without compromising strength. Mechanical twinning, a common phenomenon in many metallic materials, including medium-Mn, facilitates material deformation through the simultaneous cooperative shear of numerous planes, enabling large shear strains. Both TRIP and TWIP significantly increase the work hardening rate and strengthen the material [4,21,22,23]. Previous studies on medium-Mn indicate that mechanical twinning was observed at an early age of 8% in engineering strains, and it is assumed that austenite did not transform before this strain [6]. In addition, seeing the increasing trend in using medium-Mn in cases where the deformation is expected to be lower than the threshold for TRIP and TWIP and the promising potential achieved by dislocation slip alone [24], we consider dislocation slip as the sole deformation mechanism in our current study but adopt fully resolved microstructures that explicitly represent different phases and individual grains, including the UFG, to study the effect of the UFG on the mechanical response of medium-Mn systematically.
The remainder of this manuscript is organized as follows: Section 2 introduces the flow and hardening rules used in the CPFE model, followed by the details on microstructure reconstruction, meshing, and phase identification of medium-Mn steel in Section 3. A comparative study between two microstructures with or without UFG austenites to investigate the effects of the UFG austenite on the mechanical response is discussed in Section 4. Section 5 summarizes and concludes the manuscript.
2. CPFE Modeling of Medium-Mn: Dislocation Density-Based Flow and Hardening Rules
CPFE relies on fully resolved polycrystalline microstructures and relevant deformation mechanisms, enabling a detailed study of the microscale response [25]. While medium-Mn alloys feature TWIP and TRIP, as studied in our previous study, where a Taylor-based homogenization scheme is used [6], we consider fully resolved microstructure but only deformation slip as the deformation mechanism, relevant to the increasing interest in using medium-Mn under small deformation as described above. To describe the dynamics of dislocation slip under varying stress and thermal conditions, we consider the flow rule of [26,27]
where represents the shear strain rate associated with dislocation slip in the slip system. The shearing becomes active when the resolved shear stress (RSS) surpasses its critical value, the critical resolved shear stress (CRSS) . Otherwise, the slip rate is zero. represents the average mobile dislocation density, and denotes the Helmholtz free energy, which acts as the effective activation energy barrier for dislocation glide. The magnitude of the Burgers vector is represented by b, and signifies the dislocation vibration frequency. denotes the temperature. Additionally, is the Boltzmann constant, and represents the thermal activation volume.
The slip resistance has its contributions from four distinct sources: the initial temperature associated [28,29], Hall-Petch associated [30], forest dislocation density related [31], and substructure related [32], described by [6,33]
where,
In the above, acts as the dislocation interaction constant, and is the elastic shear modulus. The forest dislocation density within an individual grain is represented by . This study sets a material-independent constant, , to 0.1 for the three phases, highlighting a standardized approach to handling different crystallographic structures [34]. Furthermore, signifies the total debris dislocation density for a single grain, a crucial factor in determining the shear resistance. The Hall-Petch associated coefficient, , is another key element in the equation, and it interplays with , the grain size of each corresponding phase. This approach allows for a nuanced and detailed analysis of shear resistance, considering a variety of factors that influence it in different phases and under various conditions. The hardening is captured through the evolution of and by a set of evolution equations following Refs. [6,32,35]. The evolution of forest dislocation is described by
where represents an adjustable coefficient related to the generation of statistically stored dislocations due to forest trapping of mobile dislocations; is the rate-sensitive coefficient for dynamic recovery. denotes the normalized stress-independent activation energy, is the reference strain rate, and is the drag stress [32,36].
The debris dislocation density evolution captures the hardening due to substructure and is defined as the accumulative effects from multiple slip systems for one grain [32]
in which is a recovery rate coefficient, and the initial dislocation debris densities in all slip systems are defined to be the same value of m−2 [37,38].
Equations (1)–(8) complete the constitutive law description of medium Mn, considering the plastic deformation accumulation via dislocation slip and hardening behavior through the evolution of different types of dislocation densities. This set of constitutive equations, together with a finite strain kinematics description using the multiplicative decomposition [39,40], allows the implementation as a user material subroutine (UMAT) in the finite element software Abaqus 2019.
3. Microstructure Reconstruction and Phase Identification
The medium-Mn alloy studied in this work is manufactured from a Fe-based alloy with mass fractions of 12 wt% Mn, 3 wt% Al, and 0.05 wt% C after going through hot rolling at 900 °C, cold rolling, and intercritical annealing at 585 °C for 8 h [3,6]. Serial Electronic Backscatter Diffraction (EBSD) scanning is conducted to characterize the microstructure at a step size of 50 nm, following the detailed procedure reported in [3,6]. All the EBSD data, together with the experimental tensile stress-strain response of the same materials from these prior studies, are adopted in the current work.
The open-source software DREAM.3D [41] (version 6.5) is adopted to process the EBSD data and reconstruct the microstructure. DREAM.3D can either process the EBSD data to extract the statistical information (e.g., grain size and orientation distribution) and synthesize statistically equivalent microstructures of different sizes [42,43], or reconstruct exact microstructures using single (2D) or multiple EBSD scans [44]. We adopted the second method and used the EBSD data from the previous study in Ref. [3]. In this process, as shown in Figure 1, the individual EBSD scan is first cleaned and analyzed to identify different phases based on the lattice structure and individual grains based on different orientations using a misorientation angle threshold of 5°. The neighboring scans are then aligned and stacked together to reconstruct voxel-based 3D microstructures, which can be further meshed with hexagonal elements by changing each voxel into one element.
In medium-Mn steels, austenite is characterized by a face-centered cubic (FCC) crystal structure. At the same time, ferrite is of body-centered cubic (BCC) structure, and -martensite typically has a body-centered tetragonal (BCT) structure referred to as BCT-martensite. EBSD differentiates phases based on their crystal lattice structures, making it straightforward to identify austenite. However, identifying low-carbon -martensite in the presence of ferrite is challenging with EBSD. This difficulty arises because the martensite’s low tetragonality makes its lattice structure very similar to that of BCC ferrite, which is below EBSD’s indexing capability. As a result, both ferrite (BCC) and -martensite (BCT) are often detected as the same BCC phase in EBSD and analyzed together [3,45,46].
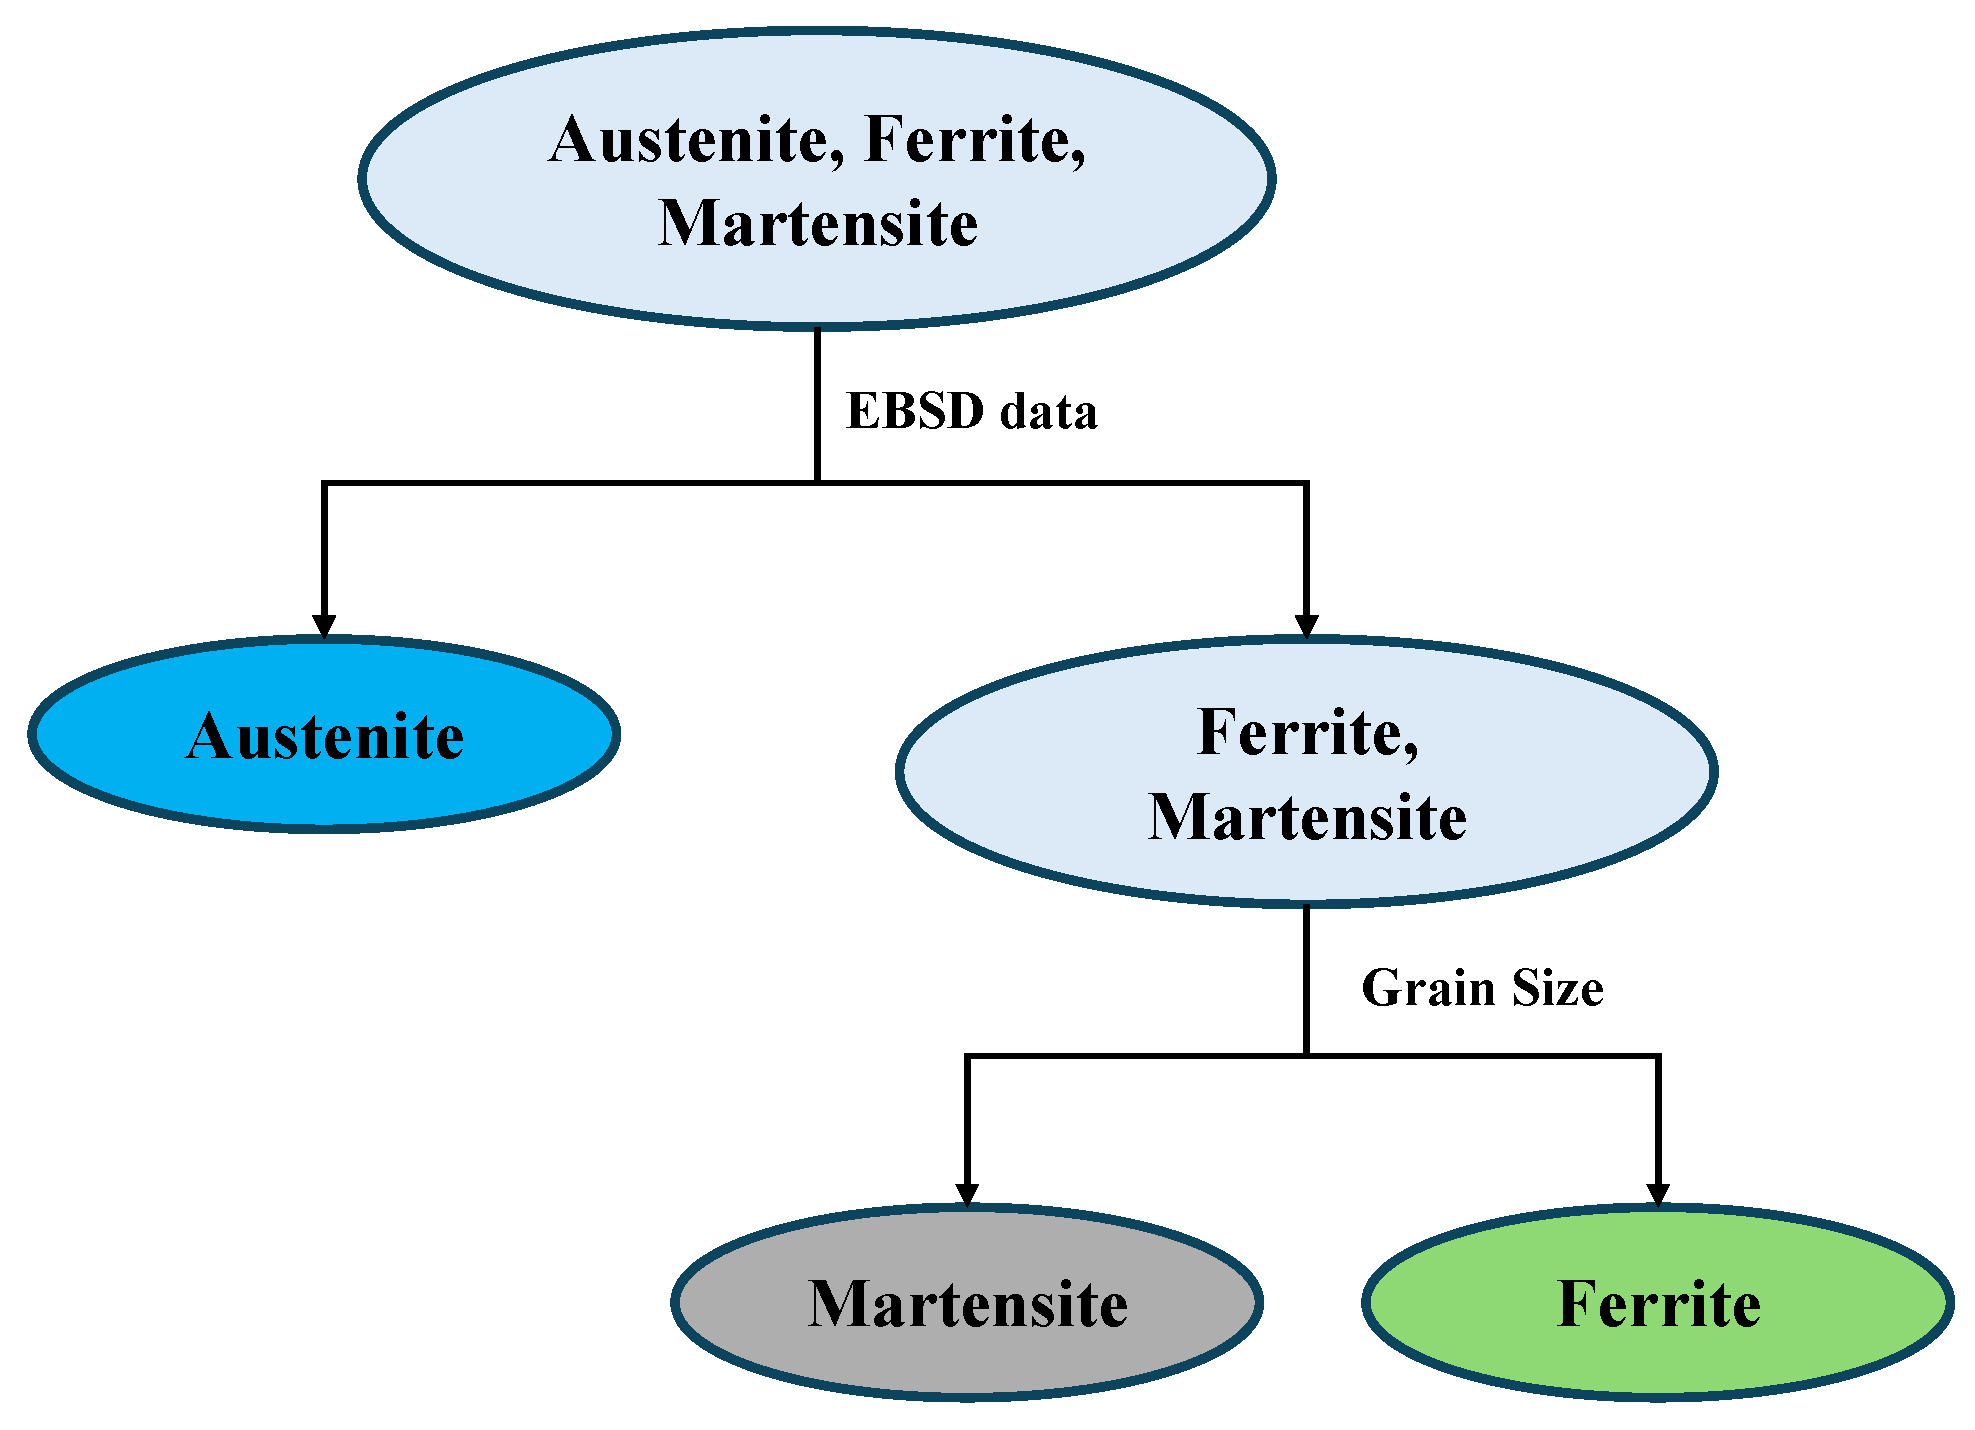
To precisely distinguish ferrite and martensite phases in medium-Mn steels, both the scanning transmission electron microscopy via energy-dispersive spectroscopy (STEM-EDS) and X-ray diffraction (XRD) analysis have been used in the literature [47,48]. However, it remains a great challenge to combine these techniques with serial EBSD so that a fully resolved polycrystalline microstructure with precise phase information can be reconstructed. Alternatively, leveraging the reported grain size difference between ferrite and austenite, one could separate the two phases in an approximated fashion following the procedures in Figure 2.
In a recent study on the same material as in this work, by examining the grain size distribution (in terms of grain area) of the combined ferrite and martensite phases in a single EBSD scan, a bimodal distribution was observed [3]. This distribution features a sharp peak in grain area at 79.1 μm2 and a smaller peak at 3.58 μm2, respectively, representing the martensite and ferrite phases. The corresponding grain size distribution, converted from the grain area distribution, under the equiaxed grain shape assumption, is plotted in Figure 3a. It should be noted that the actual grains do not follow an equiaxed grain shape, but this is a necessary approximation to separate the two phases by size and is sufficient for the qualitative study in the current work. The grain size distribution shows a high area fraction between the two peaks, making it difficult to accurately separate the two phases by size. We further assume 2.90 μm as a shart threshold to separate the two different phases. This is done by computing the sizes of all the grains in the microstructure except the austenites and setting all grains with grain sizes smaller than an equiaxed grain with size 2.90 μm as ferrite, while setting those larger than this as martensite. Using this phase size threshold, the phase distribution of the fully resolved microstructure is shown in Figure 3b.
3.1. Mesh Size Convergence Study and Model Calibration
When reconstructing the microstructure in DREAM.3D, as described in Section 3, the user can specify the reconstruction resolution to be used. The smallest resolution one can use is the EBSD resolution of 50 nm (i.e., EBSD step size), which will identify 1473 grains in the reconstructed microstructure (size 9.0 × 6.45 × 5.45 μm), with a total of 2,530,980 elements and 2,482,194 nodes by meshing each voxel into one 8-node hexahedral element (C3D8) as shown in Figure 3b. However, the large number of elements and nodes in this model make it computationally expensive; hence, a mesh size sensitivity study is carried out to identify the proper mesh size to better balance the computational cost and accuracy.
A series of gradually coarsened meshes is reconstructed using the reconstruction resolutions between 0.05 and 1.0 μm and meshing each pixel into one element (i.e., mesh size is equal to the reconstruction resolution). The corresponding mesh information is reported in Table 1. The reconstructed microstructures are illustrated in Figure 4a, while the stress-strain responses (using the parameters from Ref. [6]) are plotted in Figure 4b. For the martensite, BCC slip systems are used to approximate the BCT slip systems due to the low carbon content, which is expected to have a negligible change in the lattice parameters [49].
It is clearly shown that when a large reconstruction resolution is used, small grains are lost in the reconstruction process, leading to a significant difference compared to the finest model. As the reconstruction resolution decreases, the small grains are better preserved. When a resolution of 0.08 μm is used, the stress-strain response is almost identical to that from the 0.05 μm reconstruction resolution but with a much smaller number of elements and nodes. Hence, 0.08 μm is considered an optimal mesh size to use for balanced computational cost and accuracy.
While the material parameters start from our previous work [6], additional fine-tuning is conducted to match the experimental stress-strain curve from previous work [3,6]. This fine-tuning is needed since the current study uses a fully resolved microstructure, while the previous work considered the phase volume fraction only when using the Taylor model. Specifically, three different strain rates are considered, including a low strain rate (LS, /s), a medium strain rate (MS, ), and a high strain rate (HS, /s), using the mesh size of 0.08 μm. The calibration process yields a good match between the experiments and simulations across the three different strain rates as shown in Figure 5. The slightly adjusted material parameters are provided in the Appendix A for simplicity.
3.2. Establish a Microstructure without Austenite
To specifically assess the influence of austenite, a comparative analysis between two microstructures with and without austenite is essential. This necessitates the creation of an alternative microstructure that excludes UFG austenites. Since austenites are typically derived from martensite during the heat treatment process when the alloy is produced, we develop a strategy to identify the parent martensite of each UFG austenite and convert those austenites to their parent martensite before the intercritical annealing. By converting these identified austenite grains back into martensite, we can develop a comparative model that effectively excludes austenite, allowing for a more focused study on the influence of the austenite on the mechanical response of the medium-Mn steel.
Given that austenite originates from a parent martensite, each austenite grain is typically encompassed by martensite grains. Therefore, the approach is to identify the neighboring martensite (parent martensite) for each UFG austenite and change each austenite to its parent martensite. The neighboring information is obtained by searching the shared grain boundary nodes between two grains. When an austenite grain is neighboring multiple martensite grains, the martensite that shares the maximum number of grain boundary nodes is deemed the parent martensite of that specific austenite. If an austenite grain has the same number of neighboring nodes with more than one martensite grain, it will be randomly changed to one of the martensite grains. Figure 6 illustrates the procedure, where the initial four steps in (a)–(d) outline the microstructure reconstruction process and the identification of three distinct phases. Steps (e) and (f) illustrate the process of determining the parent martensite of the austenite and recovering the austenite to its parent martensite.
Utilizing this methodology, it becomes possible to create two distinct microstructural models: one that includes austenite and another that represents the microstructure before the intercritical annealing and free to austenites, enabling a comprehensive comparison and analysis. However, due to the large number of elements in the generated finite element model, which would result in a time-consuming simulation process, we, therefore, select a subdomain extracted from the entire model for more efficient analysis, as shown in Figure 7, and further use an element size of 1.0 μm since it provides close enough results compared to the 0.08 μm mesh size, but with a significantly smaller number of elements and nodes (e.g., see Table 1). This particular subdomain is chosen because it contains a cluster of UFG austenites (9% volume fraction of austenite), and its location in the whole microstructure is shown in Figure 3a. The two models are shown in Figure 8, and we will call these two models the model with austenite and the model without austenite.
4. CPFE Simulation Results and Discussion
We now focus on understanding the impact of the UFG austenite by running simulations on the microstructures with and without austenite in Figure 8. We consider uniaxial tensile loading in the X direction up to 10% strain. The boundary conditions are shown in Figure 9a, where all nodes on the , , and faces are fixed in their normal directions, while nodes on the faces are displaced in the direction. Figure 9b shows the engineering stress-strain curves simulated from the original and modified microstructures. The stress-strain curve is different from that in Figure 5, mainly because the two big austenites span over the entire microstructure in the X direction, carrying a large amount of the applied strain. The model incorporating austenite displays a curve that is slightly elevated compared to the model devoid of austenite. This suggests that the presence of austenite contributes to an increase in both the yield stress and strength. A prior study using the Taylor model [6] suggested that by increasing the UFG austenite’s volume fraction from 35% to 70%, the ultimate tensile strength changes from 700 to 900 MPa, a 22% increase. In the current study, the volume fraction of UFG austenite for this example is 9%, and the stress at 6% strain has a 3% increase.
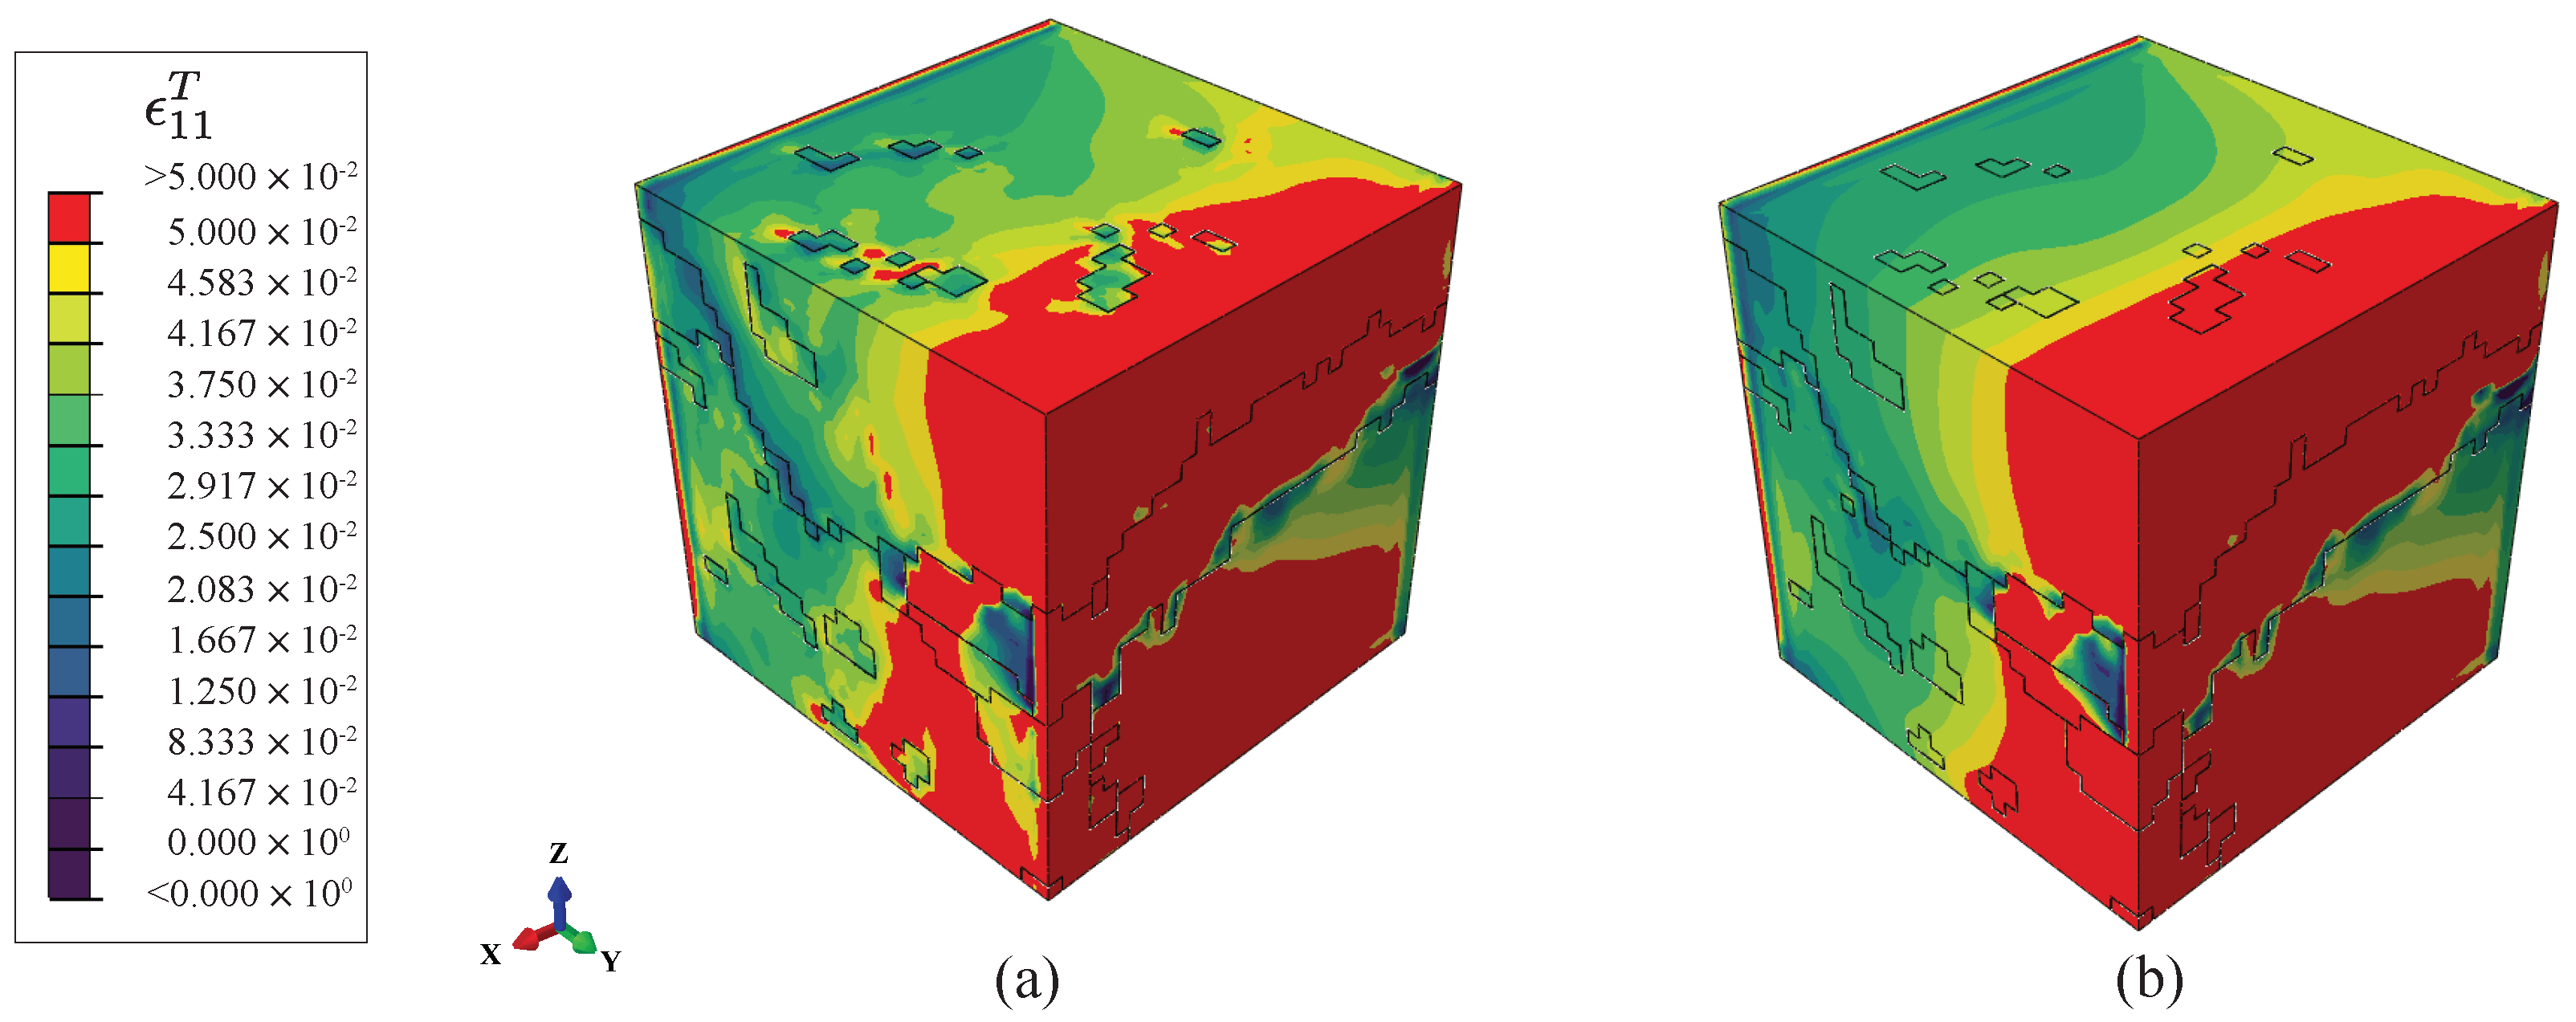
Figure 10 shows the contour of stress component in the models with or without austenite at 50% of the applied load. It should be noted that while the stress distributions on the face might be influenced by the boundary conditions, ferrite generally exhibits a lower stress level. When comparing models with and without austenite, an apparent high stress level is observed in the austenite region, suggesting austenite’s contribution to the increased strength.
The distributions of true strain component and equivalent plastic strain are shown in Figure 11 and Figure 12, respectively. The equivalent plastic strain is defined as [50,51]
where is the plastic strain using index notation, obtained by time integration of the plastic strain rate [52,53]. Similarly, while the boundary conditions may impact the strain distribution on the face, higher plastic strain levels are observed in the austenite areas, suggesting its contribution to the ductility. In addition, high true strain is also observed in the martensite neighboring some of the austenite grains, indicating a strong interaction between the austenite and its neighboring martensite. Overall, ferrite exhibits significantly higher levels of both true and plastic strains compared to austenite and martensite, with martensite showing the lowest level of plastic strain. This observation aligns with experimental findings [6].
Figure 13b–d illustrate the values of stress component , true strain component , and equivalent plastic strain , respectively, along a specific path in the microstructure. This path was created at the same position in both models, as shown in Figure 13a, starting from a martensite and crossing an austenite and a ferrite. The figures demonstrate that the responses for models with and without austenites are largely similar, with the notable exception of the austenite regions. In these regions, the curve representing the model with austenite exhibits much higher stress (about 25% higher) and plastic strain (about 50% higher) values compared to the model without austenite but only marginally lower true strain. These observations from the inside of the microstructure are consistent with the observations from the surface of the microstructure shown in the contour plots of Figure 10, Figure 11 and Figure 12. This again confirms that austenite carries much greater plastic deformation and higher stresses, which could significantly contribute to ductility and high strength, making it a valuable component in the material’s overall performance.
To understand the statistical aspects of the response, Figure 14 shows the histograms of stress component , true strain component , and equivalent plastic strain . The left column in Figure 14 shows the results of the model with austenite, while the right column shows the model without austenite. The X axis refers to the value of local responses, while the Y axis represents the number of integration points that have the corresponding response value. The histogram for reveals that most ferrite grains exhibit lower stress values than those of the other two phases, consistent with the contour and path plots. In results without austenite, where all austenite grains were reverted to their respective martensites, the distributions of the original martensite and recovered martensite (from austenite) follow a similar trend as expected, but the stress in austenite is higher than that in martensite. A comparison of and the equivalent plastic strain in the presence of austenites shows that both martensite and austenite experience similar levels of true strain, while austenite displays a higher plastic strain level. These observations confirm that the prior observation of higher stress and plastic strain in austenite is true for the entire microstructure, and the contribution to the ductility and high strength of medium-Mn steel is true for all austenite grains, not just the particular grains we analyzed previously. Furthermore, the distribution of and equivalent plastic strain in ferrite spans a much broader range and especially very high plastic strain levels. These high plastic strains are much higher than the applied strain, indicating a very strong interaction between ferrite and surrounding grains and its contribution to the ductility of medium-Mn steel.
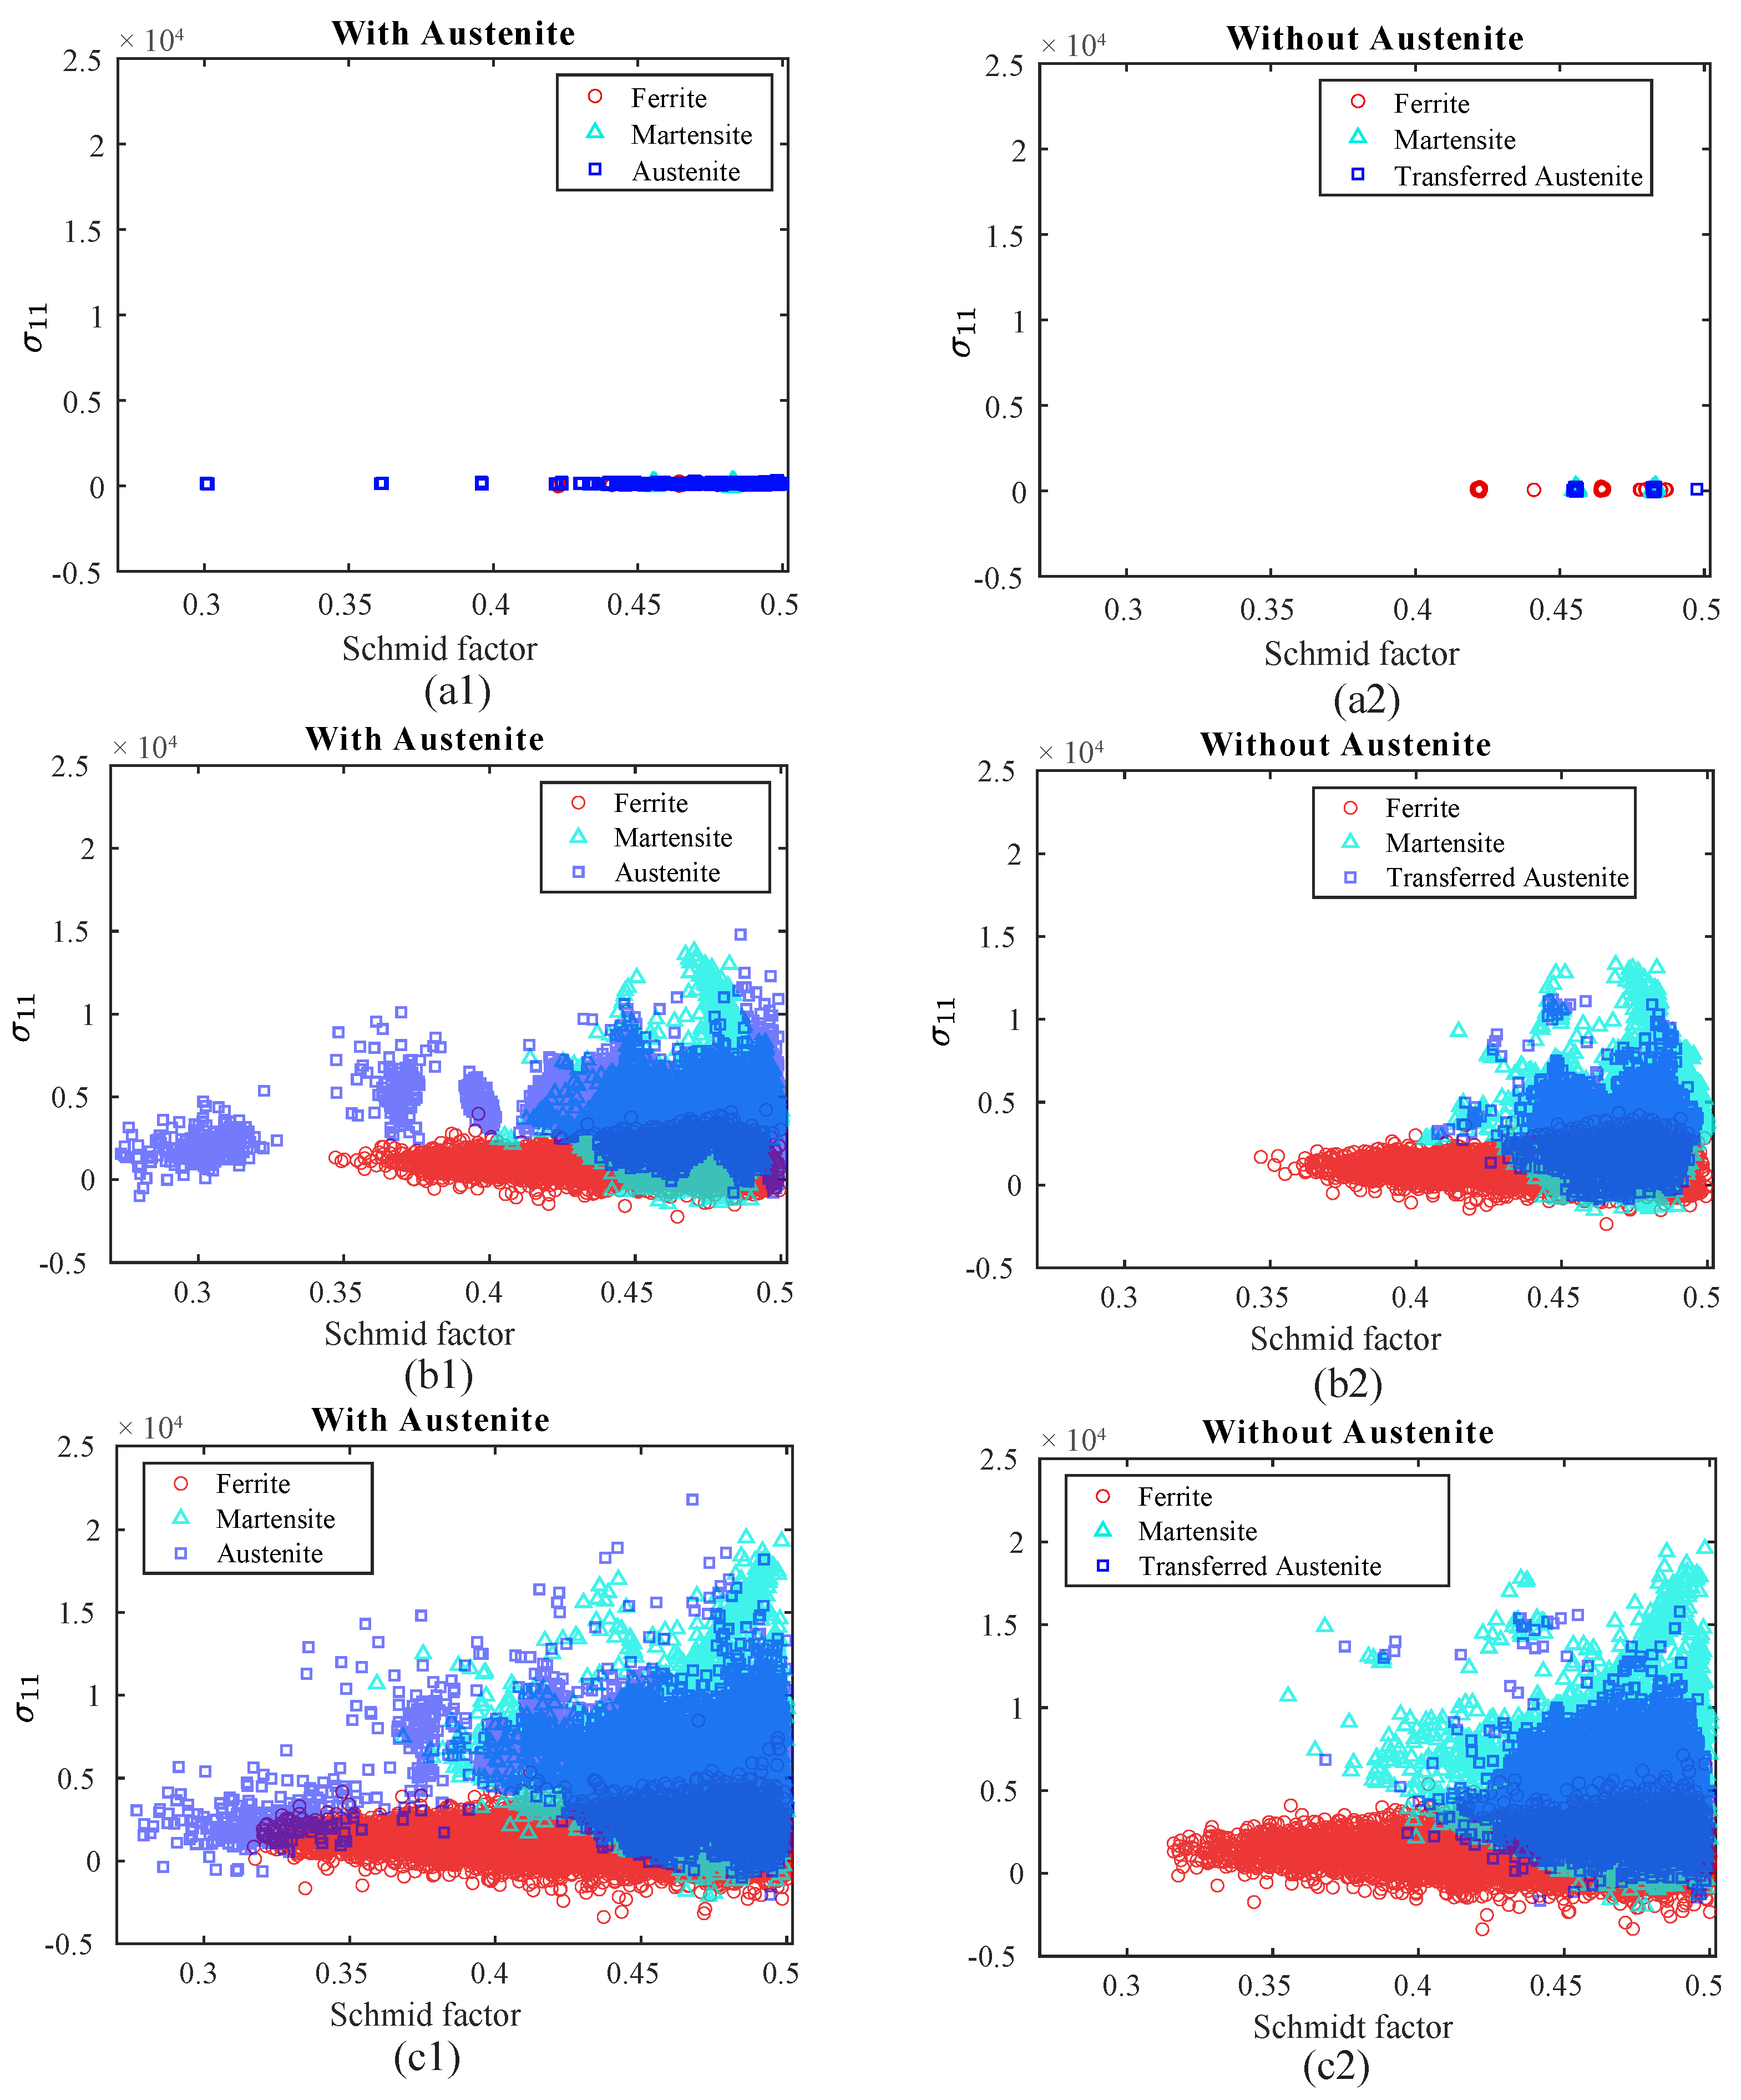
Figure 15 demonstrates the relationship between the Schmid factor and . Similar to Figure 14, the left column of the figure represents the model that includes austenite, while the right column depicts the model without austenite. It should be noted that the range of the Schmid factor before loading is mainly determined by the number of grains in each phase, and the spreading as loading continues reflects the re-orientation (i.e., texture evolution) during the loading process. Overall, texture evolution is observed for all three phases, but ferrite has the most texture evolution at a relatively low stress level. This further confirms ferrite’s strong interactions with neighboring grains and its contribution to medium-Mn’s ductility. It is also observed that the presence of austenite does not seem to change the response of ferrite and martensite much.
5. Conclusions
We conducted a comparative CPFE study with the microstructures with and without austenite to investigate the influences of UFG austenite on the mechanical response of a medium-Mn steel. The microstructure of austenite is constructed by stacking serial EBSD scans together in DREAM.3D. The microstructure without austenite is obtained by transforming all austenites to the corresponding parent martensites before the intercritical annealing. We systematically studied the response in terms of the histogram and distribution of , true strain and equivalent plastic strain at the surface of the microstructure, along a patch inside the microstructure, and their statistical distribution over the entire microstructure. The comparison indicates that austenite carries much higher plastic strain and a higher stress level than the other two phases, contributing to the ductility and high strength of medium-Mn steel.
Author Contributions
Conceptualization, Y.L. and X.Z.; methodology, P.S., Y.L. and X.Z.; software, P.S. and Y.L.; validation, P.S. and Y.L.; formal analysis, P.S.; investigation, P.S., Y.L. and X.Z.; resources, X.Z.; data curation, P.S. and Y.L.; writing—original draft preparation, P.S.; writing—review and editing, P.S., Y.L. and X.Z.; visualization, P.S.; supervision, Y.L. and X.Z.; project administration, X.Z.; funding acquisition, X.Z. All authors have read and agreed to the published version of the manuscript.
Funding
This research received no external funding and has been supported by the faculty startup funding at the University of Wyoming.
Data Availability Statement
Data in this work can be available upon reasonable request due to privacy.
Acknowledgments
The authors greatly acknowledge the experimental data and helpful discussions provided by Jake Benzing from the National Institute of Standards and Technology.
Conflicts of Interest
The authors declare no conflict of interest.
Appendix A
The material properties appear in Section 2 builds on our prior study using Taylor model [3], and was further calibrated using the CPFE model in conjunction with the fully resolved microstructure as described in Section 3. The material parameters are provided in Table A1.

Table A1.
Material parameters in the CPFE model.
| Parameters | Phase | |||
|---|---|---|---|---|
| Symbol | Unit | Martensite | Ferrite | Austenite |
| GPa | 169 | 175 | 174 | |
| GPa | 82 | 82 | 85 | |
| GPa | 96 | 97 | 99 | |
| m−2 | ||||
| Hz | ||||
| μm | ||||
| J | ||||
| m3 | ||||
| MPa | 1036.4 | 272.7 | 163.4 | |
| GPa | 320 | 320 | 207 | |
| 1 | 130 | 130 | 134 | |
| m−1 | ||||
| m−2 | ||||
References
- Matlock, D.K.; Speer, J.G. Processing Opportunities for New Advanced High-Strength Sheet Steels. Mater. Manuf. Process. 2010, 25, 7–13. [Google Scholar] [CrossRef]
- Hu, B.; Luo, H.; Yang, F.; Dong, H. Recent progress in medium-Mn steels made with new designing strategies, a review. J. Mater. Sci. Technol. 2017, 33, 1457–1464. [Google Scholar] [CrossRef]
- Benzing, J.T.; Kwiatkowski da Silva, A.; Morsdorf, L.; Bentley, J.; Ponge, D.; Dutta, A.; Han, J.; McBride, J.R.; Van Leer, B.; Gault, B.; et al. Multi-scale characterization of austenite reversion and martensite recovery in a cold-rolled medium-Mn steel. Acta Mater. 2019, 166, 512–530. [Google Scholar] [CrossRef]
- Lee, S.; De Cooman, B.C. Annealing Temperature Dependence of the Tensile Behavior of 10 pct Mn Multi-phase TWIP-TRIP Steel. Metall. Mater. Trans. A 2014, 45, 6039–6052. [Google Scholar] [CrossRef]
- Benzing, J.T.; Bentley, J.; McBride, J.R.; Ponge, D.; Han, J.; Raabe, D.; Wittig, J.E. Characterization of Partitioning in a Medium-Mn Third-Generation AHSS. Microsc. Microanal. 2017, 23, 402–403. [Google Scholar] [CrossRef]
- Benzing, J.T.; Liu, Y.; Zhang, X.; Luecke, W.E.; Ponge, D.; Dutta, A.; Oskay, C.; Raabe, D.; Wittig, J.E. Experimental and numerical study of mechanical properties of multi-phase medium-Mn TWIP-TRIP steel: Influences of strain rate and phase constituents. Acta Mater. 2019, 177, 250–265. [Google Scholar] [CrossRef] [PubMed]
- Han, J.; da Silva, A.K.; Ponge, D.; Raabe, D.; Lee, S.M.; Lee, Y.K.; Lee, S.I.; Hwang, B. The effects of prior austenite grain boundaries and microstructural morphology on the impact toughness of intercritically annealed medium Mn steel. Acta Mater. 2017, 122, 199–206. [Google Scholar] [CrossRef]
- Wang, T.; Hu, J.; Misra, R.D.K. Microstructure evolution and strain behavior of a medium Mn TRIP/TWIP steel for excellent combination of strength and ductility. Mater. Sci. Eng. A 2019, 753, 99–108. [Google Scholar] [CrossRef]
- Hu, J.; Zhang, J.M.; Sun, G.S.; Du, L.X.; Liu, Y.; Dong, Y.; Misra, R.D.K. High strength and ductility combination in nano-/ultrafine-grained medium-Mn steel by tuning the stability of reverted austenite involving intercritical annealing. J. Mater. Sci. 2019, 54, 6565–6578. [Google Scholar] [CrossRef]
- Hu, B.; Rong, X.; Tian, C.; Yu, Y.; Guo, H.; Misra, R.D.K.; Shang, C. Nanoscale precipitation and ultrafine retained austenite induced high strength-ductility combination in a newly designed low carbon Cu-bearing medium-Mn steel. Mater. Sci. Eng. A 2021, 822, 141685. [Google Scholar] [CrossRef]
- Sadeghpour, S.; Somani, M.C.; Kömi, J.; Karjalainen, L.P. A new combinatorial processing route to achieve an ultrafine-grained, multiphase microstructure in a medium Mn steel. J. Mater. Res. Technol. 2021, 15, 3426–3446. [Google Scholar] [CrossRef]
- Jia, Q.; Chen, L.; Xing, Z.; Wang, H.; Jin, M.; Chen, X.; Choi, H.; Han, H.N. Tailoring hetero-grained austenite via a cyclic thermomechanical process for achieving ultrahigh strength-ductility in medium-Mn steel. Scr. Mater. 2022, 217, 114767. [Google Scholar] [CrossRef]
- Li, J.; Xu, Y.; Lu, B.; Yu, Y.; Jing, Y.; Sun, W. Improvement of strength-ductility combination in ultra-high-strength medium-Mn Q&P steel by tailoring the characteristics of martensite/retained austenite constituents. J. Mater. Res. Technol. 2022, 18, 352–369. [Google Scholar] [CrossRef]
- Mohammed, B.; Park, T.; Pourboghrat, F.; Hu, J.; Esmaeilpour, R.; Abu-Farha, F. Multiscale crystal plasticity modeling of multiphase advanced high strength steel. Int. J. Solids Struct. 2018, 151, 57–75. [Google Scholar] [CrossRef]
- Park, T.; Kim, H.; Ryu, I.; Pourboghrat, F.; Esmaeilpour, R. A multi-scale modelling of 3rd generation advanced high strength steels to account for anisotropic evolution of yield surface and plastic potential. J. Phys. Conf. Ser. 2018, 1063, 012019. [Google Scholar] [CrossRef]
- Park, T.; Hector, L.G.; Hu, X.; Abu-Farha, F.; Fellinger, M.R.; Kim, H.; Esmaeilpour, R.; Pourboghrat, F. Crystal plasticity modeling of 3rd generation multi-phase AHSS with martensitic transformation. Int. J. Plast. 2019, 120, 1–46. [Google Scholar] [CrossRef]
- He, B.B.; Luo, H.W.; Huang, M.X. Experimental investigation on a novel medium Mn steel combining transformation-induced plasticity and twinning-induced plasticity effects. Int. J. Plast. 2016, 78, 173–186. [Google Scholar] [CrossRef]
- Kalsar, R.; Sanamar, S.; Schell, N.; Brokmeier, H.G.; Saha, R.; Ghosh, P.; Suwas, S. In-situ study of tensile deformation behaviour of medium Mn TWIP/TRIP steel using synchrotron radiation. Mater. Sci. Eng. A 2022, 857, 144013. [Google Scholar] [CrossRef]
- Nimaga, O.G.; He, B.B.; Cheng, G.J.; Yen, H.W.; Huang, M.X. Revealing orientation-dependent martensitic transformation in a medium Mn steel by micropillar compression. Int. J. Plast. 2019, 123, 165–177. [Google Scholar] [CrossRef]
- Zhang, M.; Chen, H.; Wang, Y.; Wang, S.; Li, R.; Li, S.; Wang, Y.D. Deformation-induced martensitic transformation kinetics and correlative micromechanical behavior of medium-Mn transformation-induced plasticity steel. J. Mater. Sci. Technol. 2019, 35, 1779–1786. [Google Scholar] [CrossRef]
- Soleimani, M.; Kalhor, A.; Mirzadeh, H. Transformation-induced plasticity (TRIP) in advanced steels: A review. Mater. Sci. Eng. A 2020, 795, 140023. [Google Scholar] [CrossRef]
- Lee, Y.K.; Han, J. Current opinion in medium manganese steel. Mater. Sci. Technol. 2015, 31, 843–856. [Google Scholar] [CrossRef]
- Kwok, T.W.J.; Dye, D. A review of the processing, microstructure and property relationships in medium Mn steels. Int. Mater. Rev. 2023, 68, 1098–1134. [Google Scholar] [CrossRef]
- Liu, M.; Zhou, J.; Zhang, J.; Song, C.; Zhai, Q. Ultra-high strength medium-Mn lightweight steel by dislocation slip band refinement and suppressed intergranular κ-carbide with Cr addition. Mater. Charact. 2022, 190, 112042. [Google Scholar] [CrossRef]
- Roters, F.; Eisenlohr, P.; Hantcherli, L.; Tjahjanto, D.D.; Bieler, T.R.; Raabe, D. Overview of constitutive laws, kinematics, homogenization and multiscale methods in crystal plasticity finite-element modeling: Theory, experiments, applications. Acta Mater. 2010, 58, 1152–1211. [Google Scholar] [CrossRef]
- Hu, P.; Liu, Y.; Zhu, Y.; Ying, L. Crystal plasticity extended models based on thermal mechanism and damage functions: Application to multiscale modeling of aluminum alloy tensile behavior. Int. J. Plast. 2016, 86, 1–25. [Google Scholar] [CrossRef]
- Zhang, X.; Liu, Y.; Oskay, C. Multiscale Reduced-Order Modeling of a Titanium Skin Panel Subjected to Thermomechanical Loading. arXiv 2021. [Google Scholar] [CrossRef]
- Williams, J.C.; Baggerly, R.G.; Paton, N.E. Deformation behavior of HCP Ti-Al alloy single crystals. Metall. Mater. Trans. A 2002, 33, 837–850. [Google Scholar] [CrossRef]
- Ozturk, D.; Shahba, A.; Ghosh, S. Crystal plasticity FE study of the effect of thermo-mechanical loading on fatigue crack nucleation in titanium alloys. Fatigue Fract. Eng. Mater. Struct. 2016, 39, 752–769. [Google Scholar] [CrossRef]
- Venkataramani, G.; Kirane, K.; Ghosh, S. Microstructural parameters affecting creep induced load shedding in Ti-6242 by a size dependent crystal plasticity FE model. Int. J. Plast. 2008, 24, 428–454. [Google Scholar] [CrossRef]
- Oppedal, A.L.; El Kadiri, H.; Tomé, C.N.; Kaschner, G.C.; Vogel, S.C.; Baird, J.C.; Horstemeyer, M.F. Effect of dislocation transmutation on modeling hardening mechanisms by twinning in magnesium. Int. J. Plast. 2012, 30–31, 41–61. [Google Scholar] [CrossRef]
- Beyerlein, I.J.; Tomé, C.N. A dislocation-based constitutive law for pure Zr including temperature effects. Int. J. Plast. 2008, 24, 867–895. [Google Scholar] [CrossRef]
- Xia, D.; Oskay, C. Reduced order mathematical homogenization method for polycrystalline microstructure with microstructurally small cracks. Int. J. Numer. Methods Eng. 2023, 124, 3166–3190. [Google Scholar] [CrossRef]
- Madec, R.; Devincre, B.; Kubin, L.P. From Dislocation Junctions to Forest Hardening. Phys. Rev. Lett. 2002, 89, 255508. [Google Scholar] [CrossRef] [PubMed]
- Liu, Y.; Zhang, X.; Oskay, C. A comparative study on fatigue indicator parameters for near-α titanium alloys. Fatigue Fract. Eng. Mater. Struct. 2023, 46, 271–294. [Google Scholar] [CrossRef]
- Kocks, U.F.; As, A.; Mf, A. Thermodynamics and Kinetics of Slip; Pergamon Press: Oxford, UK, 1975. [Google Scholar]
- Williams, W.S.; Schaal, R.D. Elastic deformation, plastic flow, and dislocations in single crystals of titanium carbide. J. Appl. Phys. 1962, 33, 955–962. [Google Scholar] [CrossRef]
- Appel, F.; Lorenz, U.; Oehring, M.; Sparka, U.; Wagner, R. Thermally activated deformation mechanisms in micro-alloyed two-phase titanium amminide alloys. Mater. Sci. Eng. A 1997, 233, 1–14. [Google Scholar] [CrossRef]
- Cuitino, A.M.; Ortiz, M. Computational modelling of single crystals. Model. Simul. Mater. Sci. Eng. 1993, 1, 225. [Google Scholar] [CrossRef]
- Kalidindi, S.R.; Bronkhorst, C.A.; Anand, L. Crystallographic texture evolution in bulk deformation processing of FCC metals. J. Mech. Phys. Solids 1992, 40, 537–569. [Google Scholar] [CrossRef]
- Groeber, M.A.; Jackson, M.A. DREAM.3D: A Digital Representation Environment for the Analysis of Microstructure in 3D. Integr. Mater. Manuf. Innov. 2014, 3, 56–72. [Google Scholar] [CrossRef]
- Zhang, X.; Oskay, C. Eigenstrain based reduced order homogenization for polycrystalline materials. Comput. Methods Appl. Mech. Eng. 2015, 297, 408–436. [Google Scholar] [CrossRef]
- Zhang, X.; Oskay, C. Polycrystal plasticity modeling of nickel-based superalloy IN 617 subjected to cyclic loading at high temperature. Model. Simul. Mater. Sci. Eng. 2016, 24, 055009. [Google Scholar] [CrossRef]
- Nasirov, A.; Zhang, X.; Wagner, D.; Yeratapally, S.R.; Oskay, C. Achieving high efficiency in reduced order modeling for large scale polycrystal plasticity simulations. Finite Elem. Anal. Des. 2024, 228, 104053. [Google Scholar] [CrossRef]
- Tian, Y.; Lin, S.; Ko, J.Y.P.; Lienert, U.; Borgenstam, A.; Hedström, P. Micromechanics and microstructure evolution during in situ uniaxial tensile loading of TRIP-assisted duplex stainless steels. Mater. Sci. Eng. A 2018, 734, 281–290. [Google Scholar] [CrossRef]
- Baghdadchi, A.; Hosseini, V.A.; Karlsson, L. Identification and quantification of martensite in ferritic-austenitic stainless steels and welds. J. Mater. Res. Technol. 2021, 15, 3610–3621. [Google Scholar] [CrossRef]
- Cai, Z.H.; Zhang, D.L.; Ma, L.F.; Ding, H.; Feng, Y.; Hu, J.; Misra, R.D.K. Competing deformation mechanisms in an austenite-ferrite medium-Mn steel at different strain rates. Mater. Sci. Eng. A 2021, 818, 141357. [Google Scholar] [CrossRef]
- Benzing, J.T.; Luecke, W.E.; Mates, S.P.; Ponge, D.; Raabe, D.; Wittig, J.E. Intercritical annealing to achieve a positive strain-rate sensitivity of mechanical properties and suppression of macroscopic plastic instabilities in multi-phase medium-Mn steels. Mater. Sci. Eng. A 2021, 803, 140469. [Google Scholar] [CrossRef] [PubMed]
- Lu, Y.; Yu, H.; Sisson, R.D. The effect of carbon content on the c/a ratio of as-quenched martensite in Fe-C alloys. Mater. Sci. Eng. A 2017, 700, 592–597. [Google Scholar] [CrossRef]
- Cheong, K.S.; Busso, E.P. Effects of lattice misorientations on strain heterogeneities in FCC polycrystals. J. Mech. Phys. Solids 2006, 54, 671–689. [Google Scholar] [CrossRef]
- Chen, W.F.; Han, D.J.; Han, D.J. Plasticity for Structural Engineers; J. Ross Publishing: Plantation, FL, USA, 2007. [Google Scholar]
- McDowell, D.L.; Dunne, F.P.E. Microstructure-sensitive computational modeling of fatigue crack formation. Int. J. Fatigue 2010, 32, 1521–1542. [Google Scholar] [CrossRef]
- Dunne, F.P.E.; Wilkinson, A.J.; Allen, R. Experimental and computational studies of low cycle fatigue crack nucleation in a polycrystal. Int. J. Plast. 2007, 23, 273–295. [Google Scholar] [CrossRef]
Figure 1.
The process of microstructure reconstruction involves: (a) processing individual layers; (b) stacking all layers and synthesizing an exact microstructure; and (c) generating a finite element model.
Figure 1.
The process of microstructure reconstruction involves: (a) processing individual layers; (b) stacking all layers and synthesizing an exact microstructure; and (c) generating a finite element model.
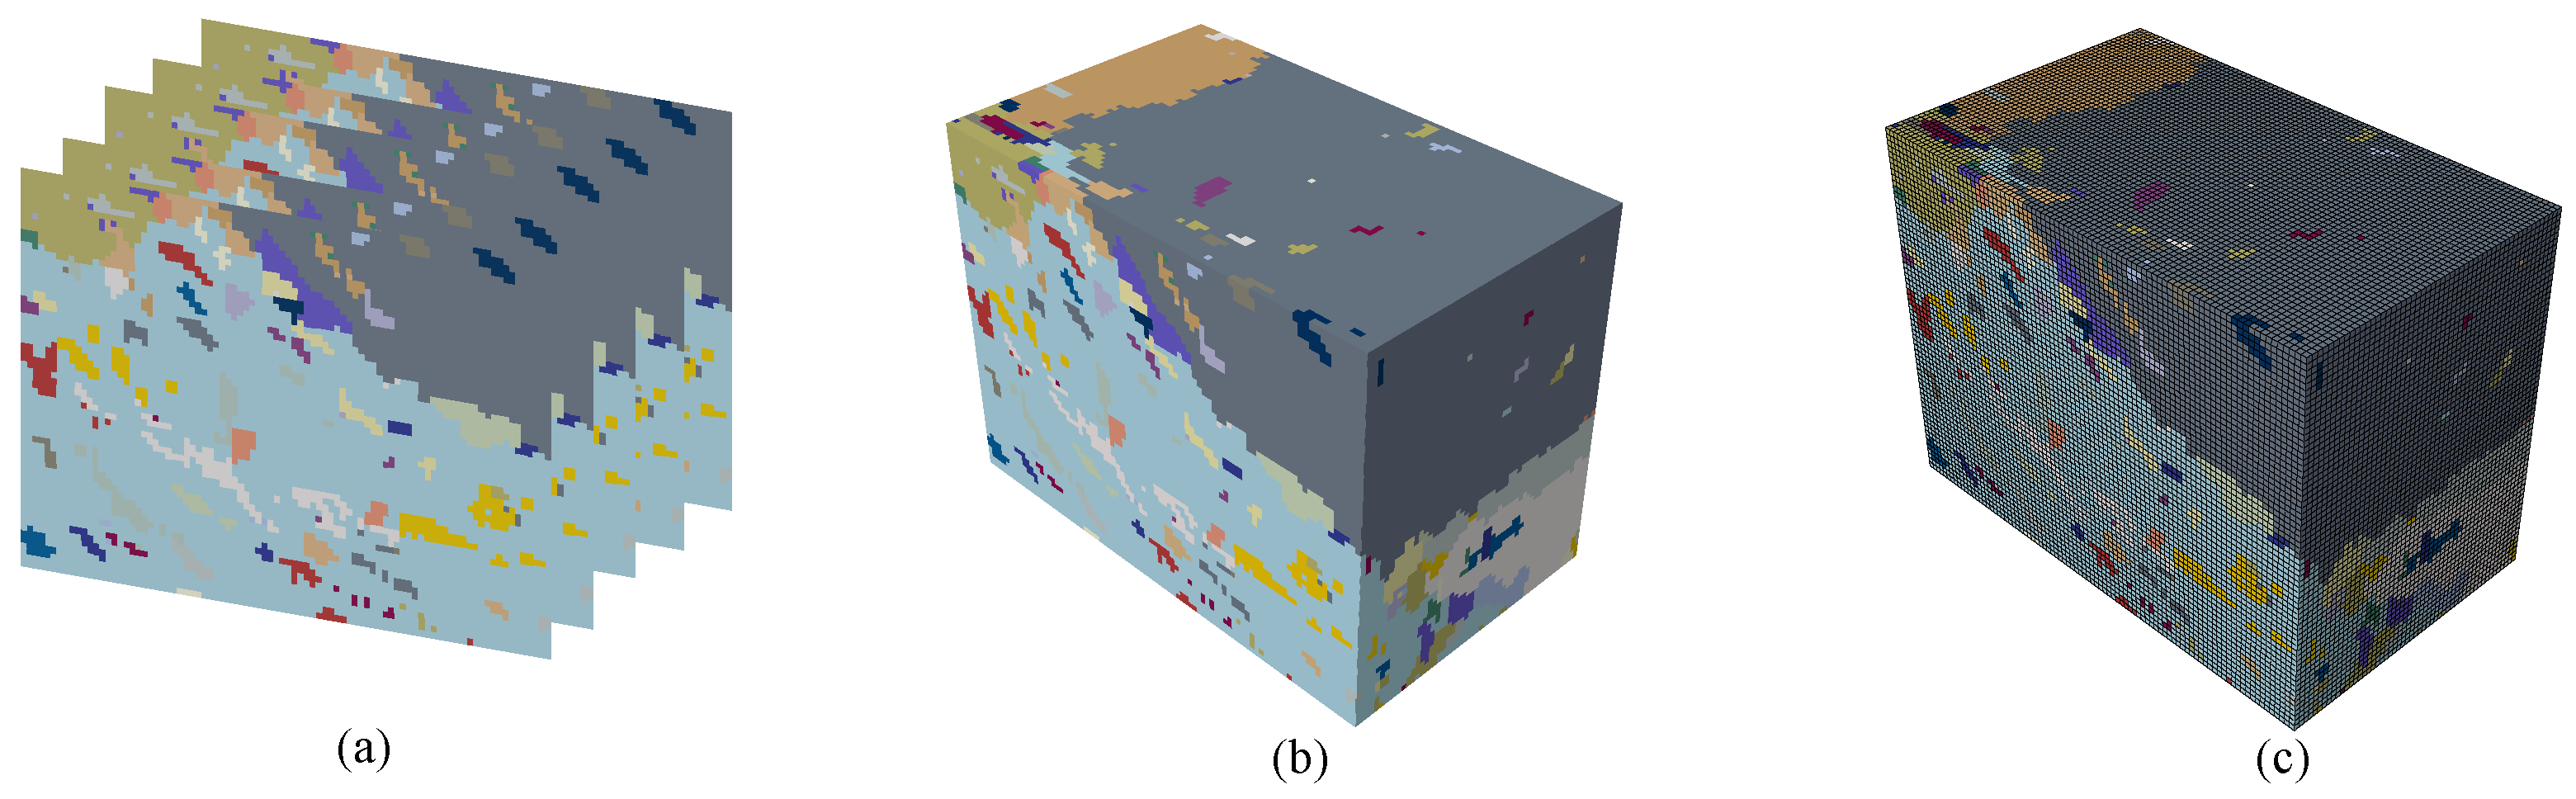
Figure 2.
Phase identification procedure: austenite is distinguished directly by EBSD data, while martensite and ferrite are then recognized according to grain size distribution.
Figure 2.
Phase identification procedure: austenite is distinguished directly by EBSD data, while martensite and ferrite are then recognized according to grain size distribution.
Figure 3.
(a) Grain size distribution of martensite and ferrite computed from the grain area distribution in Ref. [3]; (b) separated austenite, ferrite, and martensite phases in the microstructure. The white block demonstrates the subdomain that will be used later.
Figure 3.
(a) Grain size distribution of martensite and ferrite computed from the grain area distribution in Ref. [3]; (b) separated austenite, ferrite, and martensite phases in the microstructure. The white block demonstrates the subdomain that will be used later.
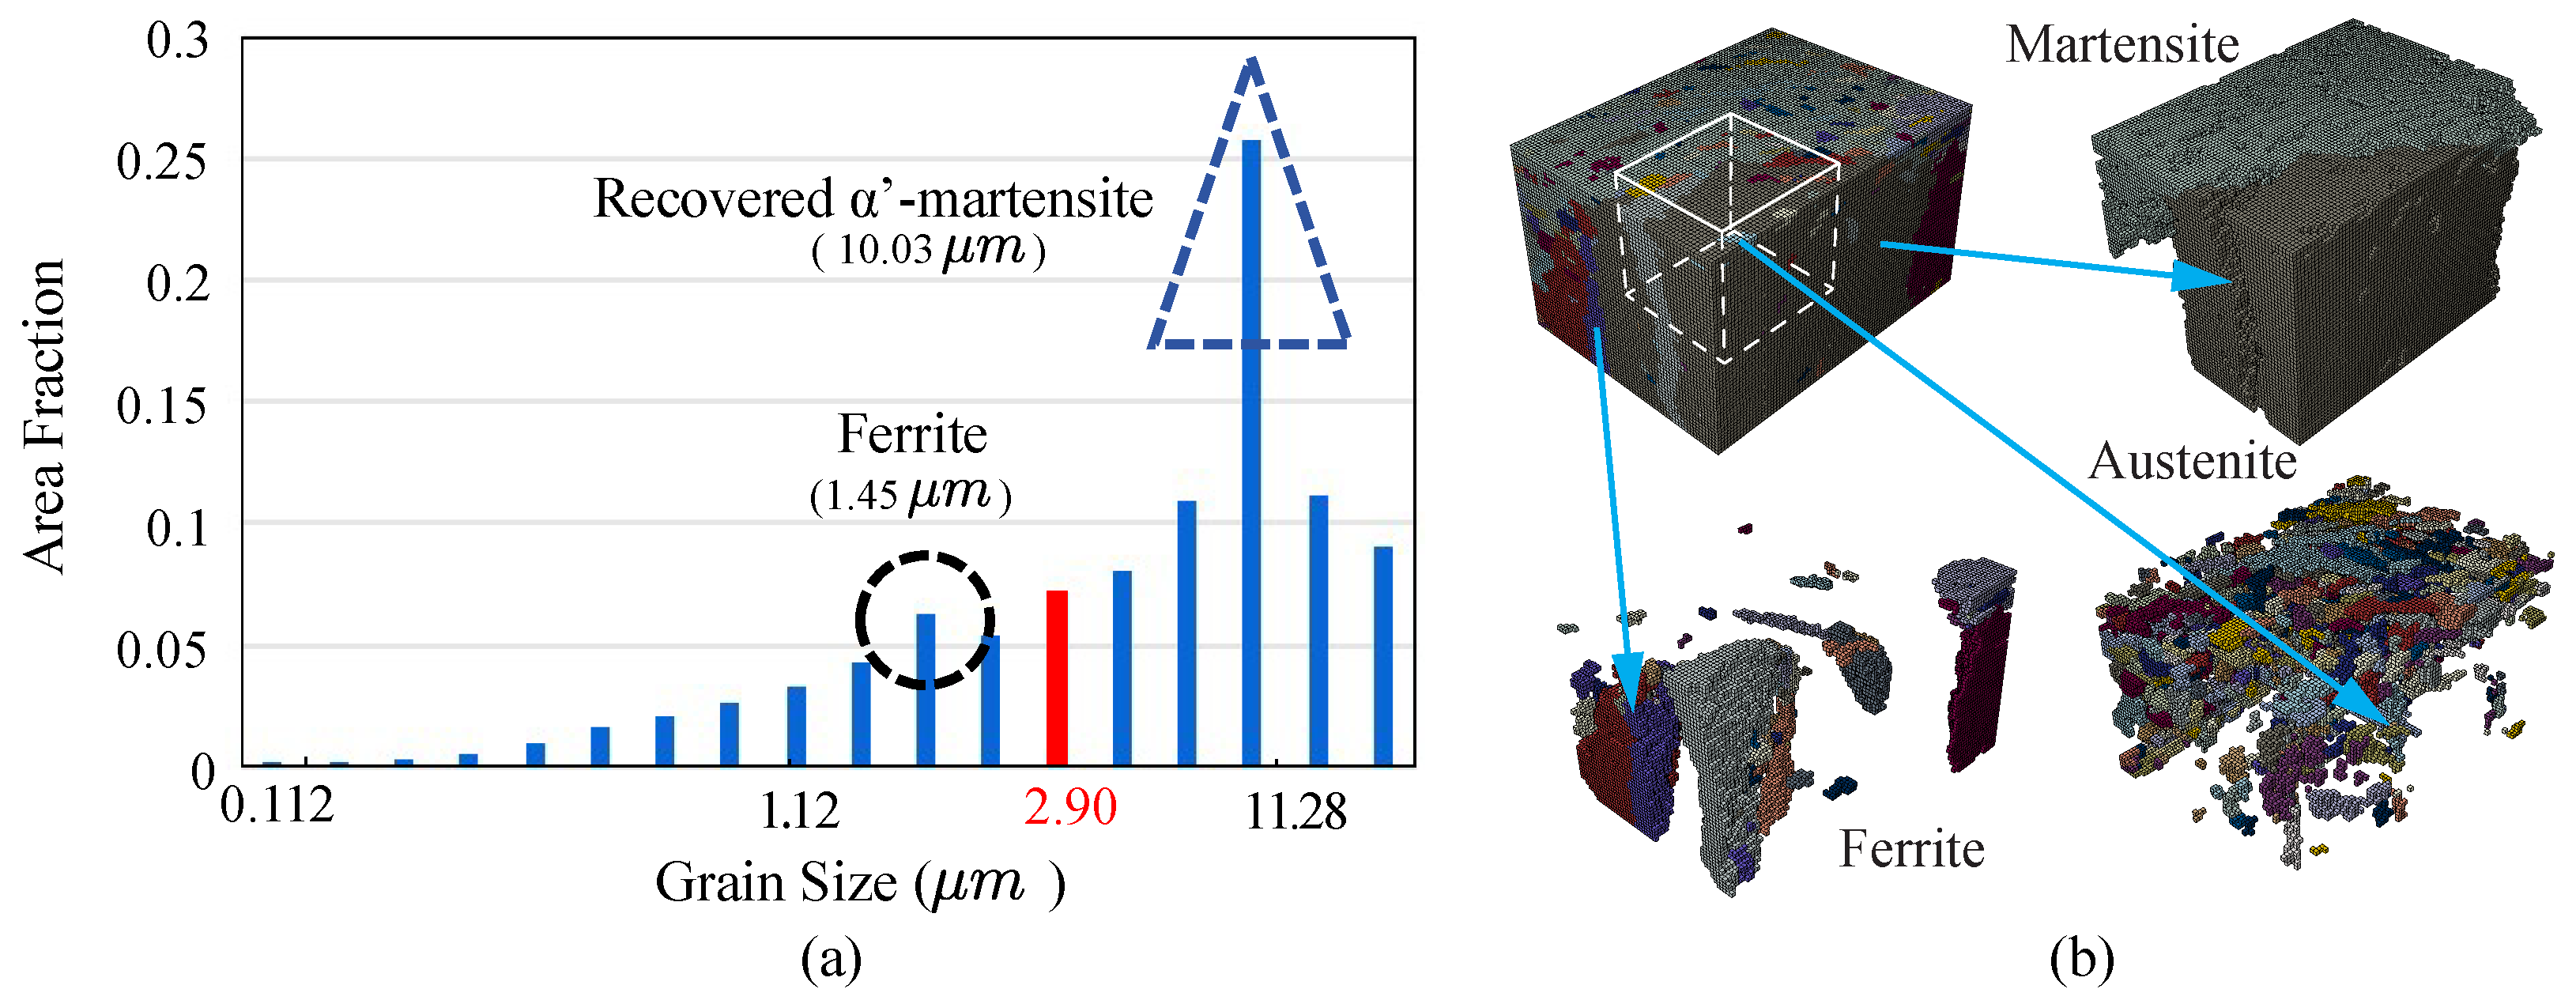
Figure 4.
Mesh size convergence study: (a) reconstructed microstructures using a resolution of 1.0, 0.5, 0.25, 0.1, 0.08, and 0.05 μm; (b) stress-strain responses from different mesh sizes.
Figure 4.
Mesh size convergence study: (a) reconstructed microstructures using a resolution of 1.0, 0.5, 0.25, 0.1, 0.08, and 0.05 μm; (b) stress-strain responses from different mesh sizes.

Figure 5.
Stress-strain curve of the simulation compared to the experimental data.
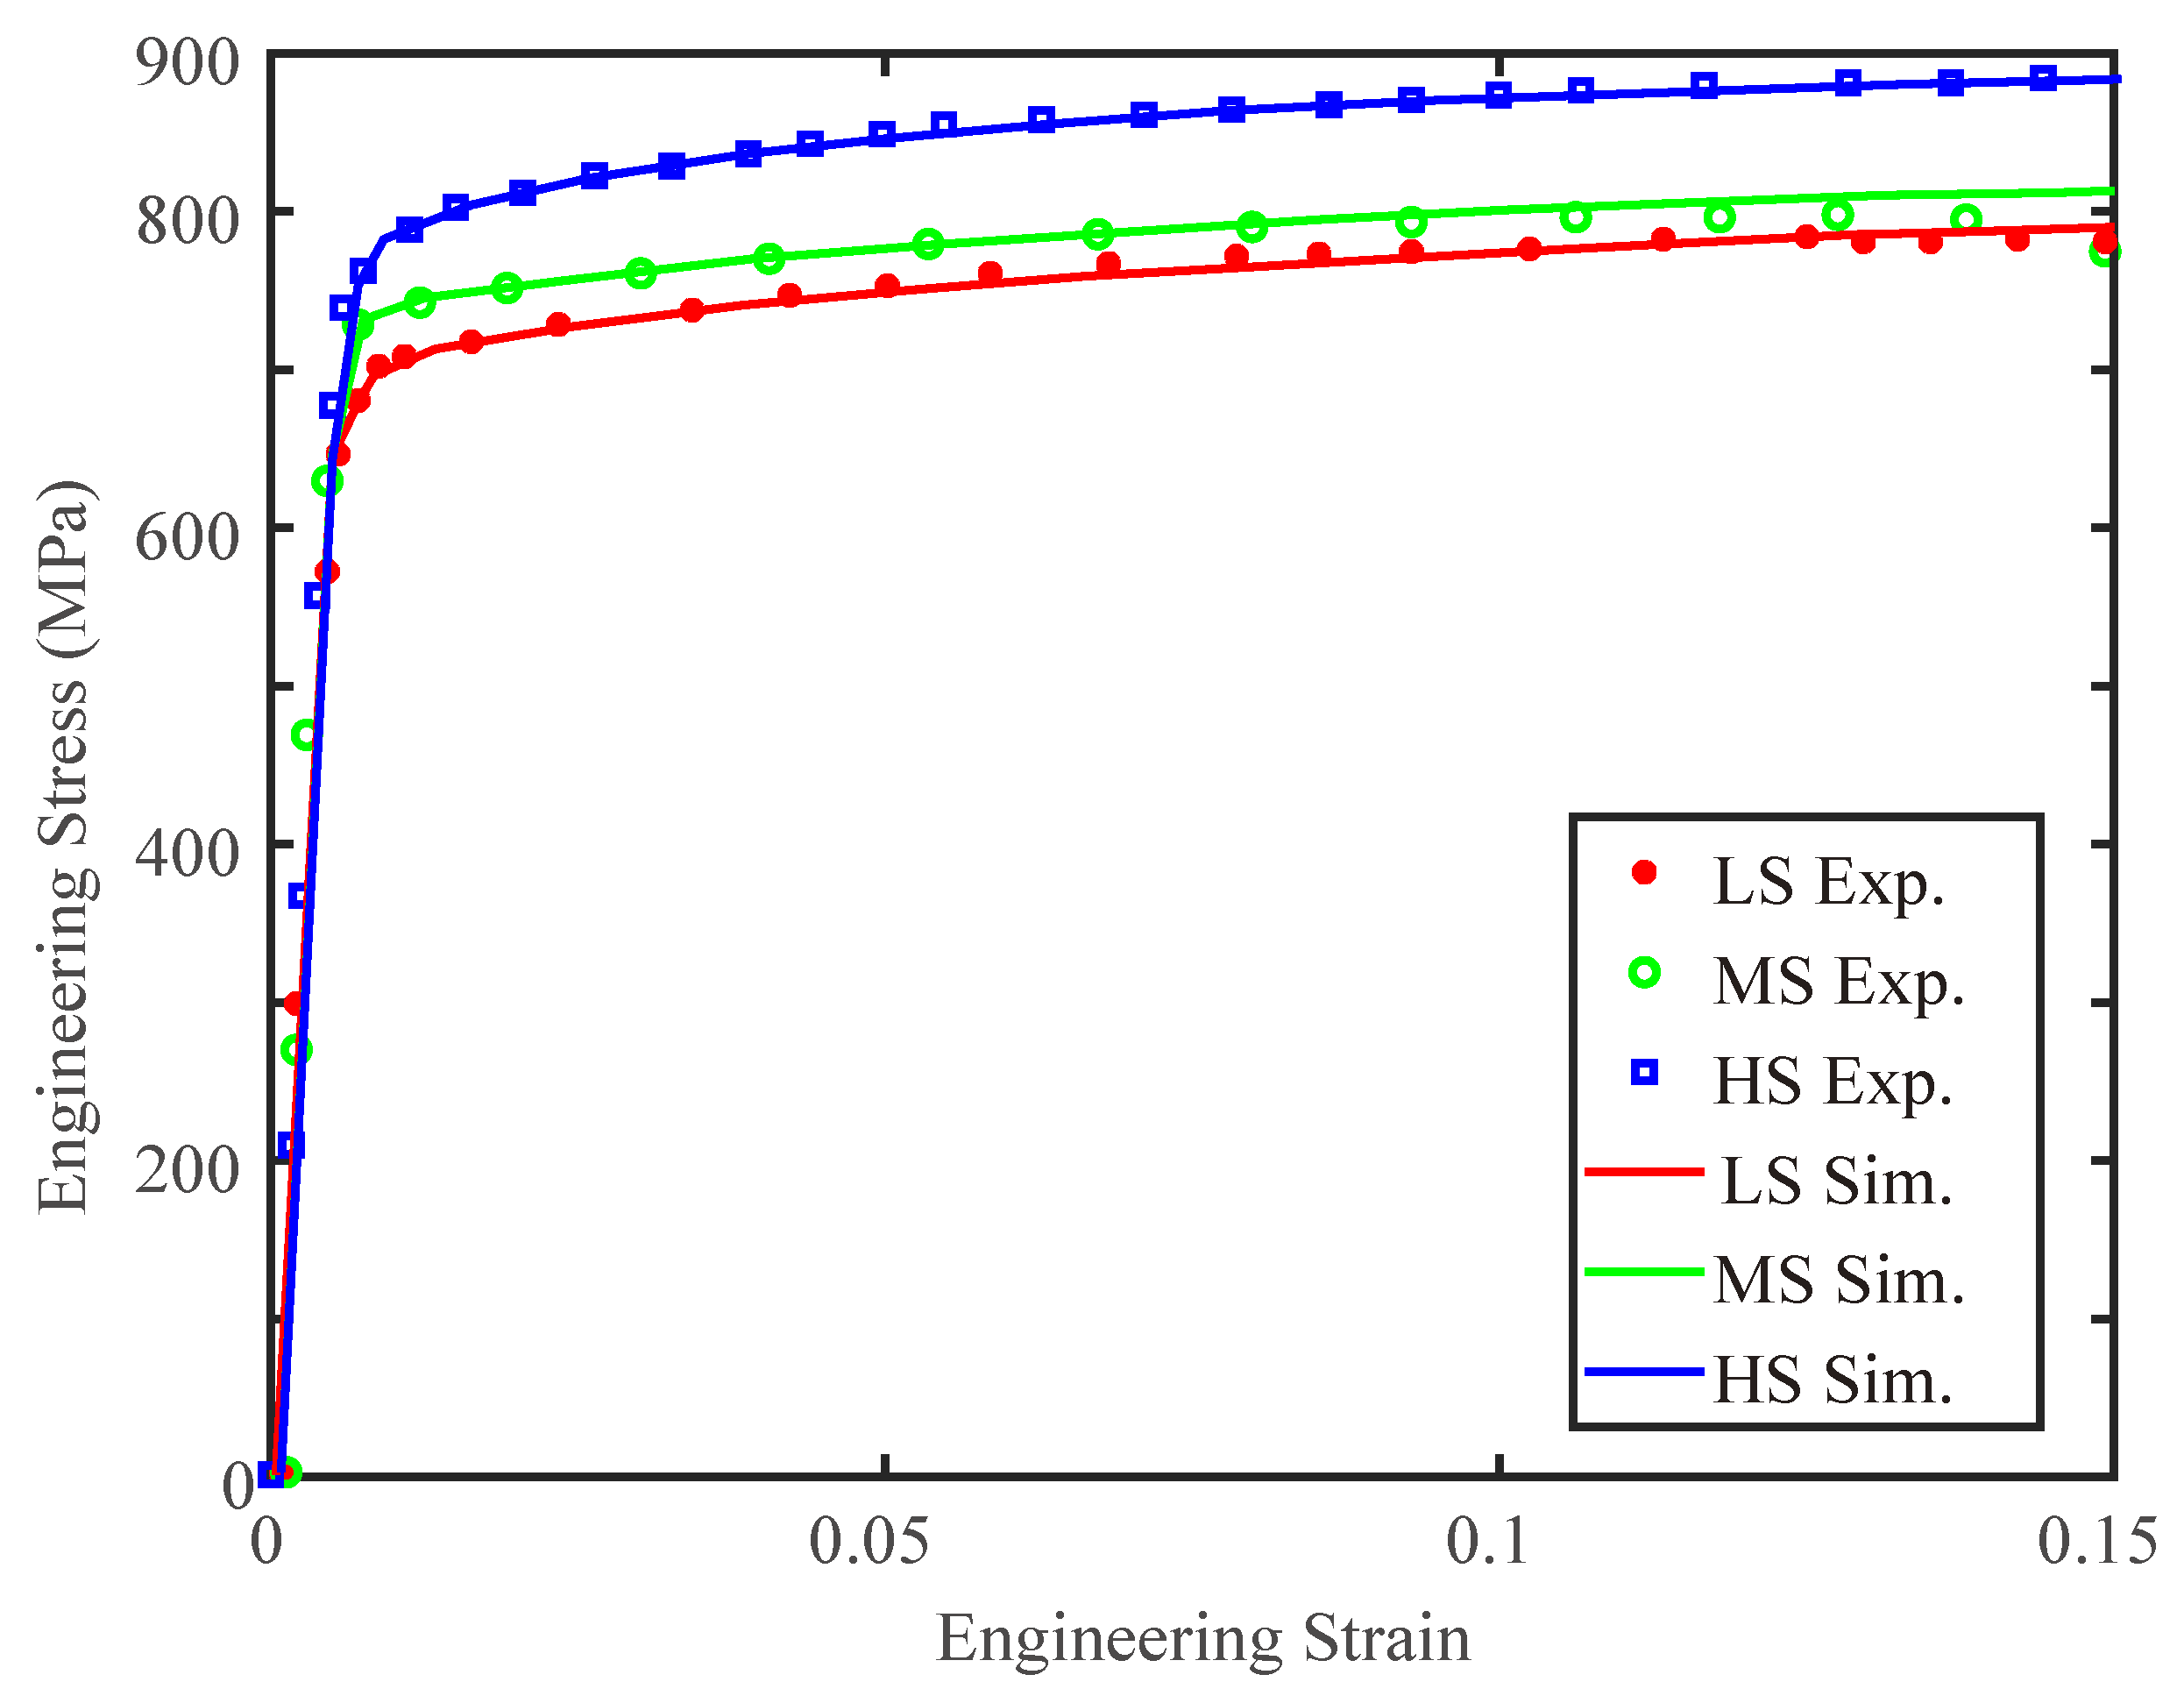
Figure 6.
Process of recognizing austenite, ferrite, and martensite phases and recovering austenites to their parent martensite phase: (a) grain, (b) austenite identification, and (c) meshing in DREAM3D; (d) separating ferrite from martensite by grain size; (e) searching for the shared nodes between each austenite and its surrounding martensite; (f) transforming the austenite to the parent martensite, which has the largest number of neighboring nodes with the austenite. Thick black lines indicate grain boundary, thin black lines indicate element boundary, and dots indicate nodes; red dots are the shared nodes between austenite and its parent martensite.
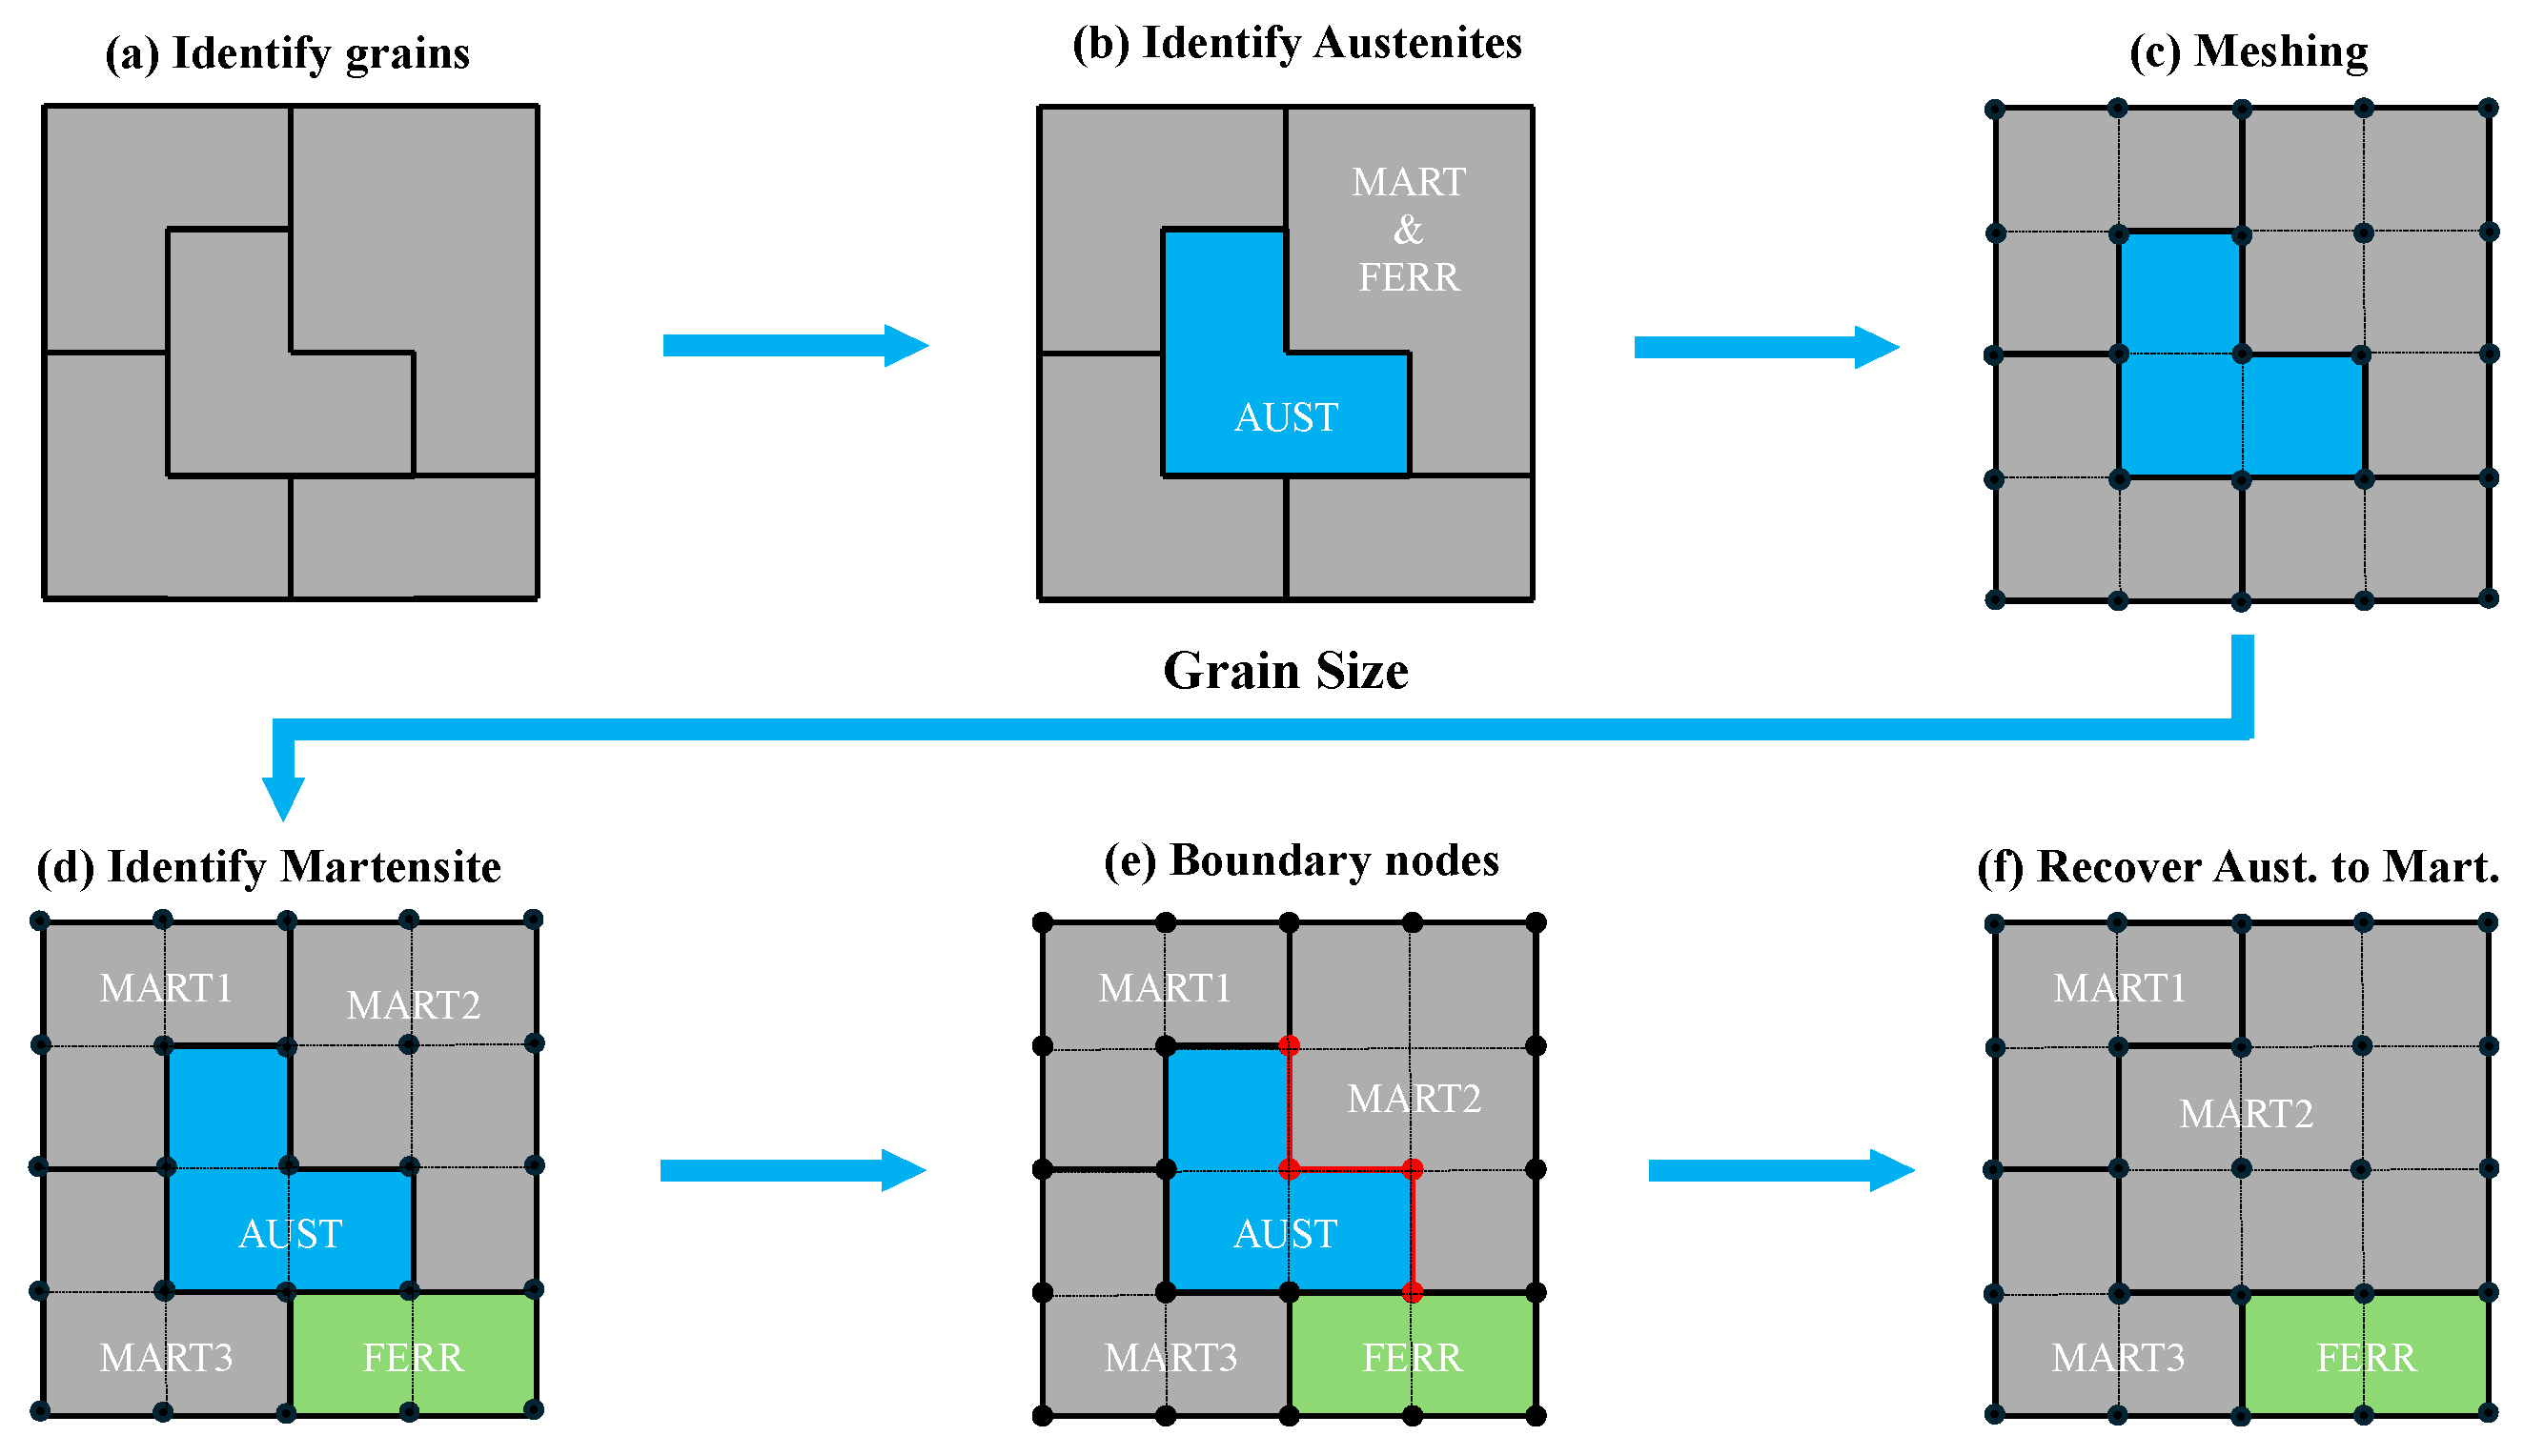
Figure 7.
Subdomain chosen from the entire microstructure.

Figure 8.
Finite element models for the chosen subdomain: (a) the model with austenite, ferrite, and martensite; (b) the comparative model with all austenites transformed back to corresponding parent martensite.
Figure 8.
Finite element models for the chosen subdomain: (a) the model with austenite, ferrite, and martensite; (b) the comparative model with all austenites transformed back to corresponding parent martensite.
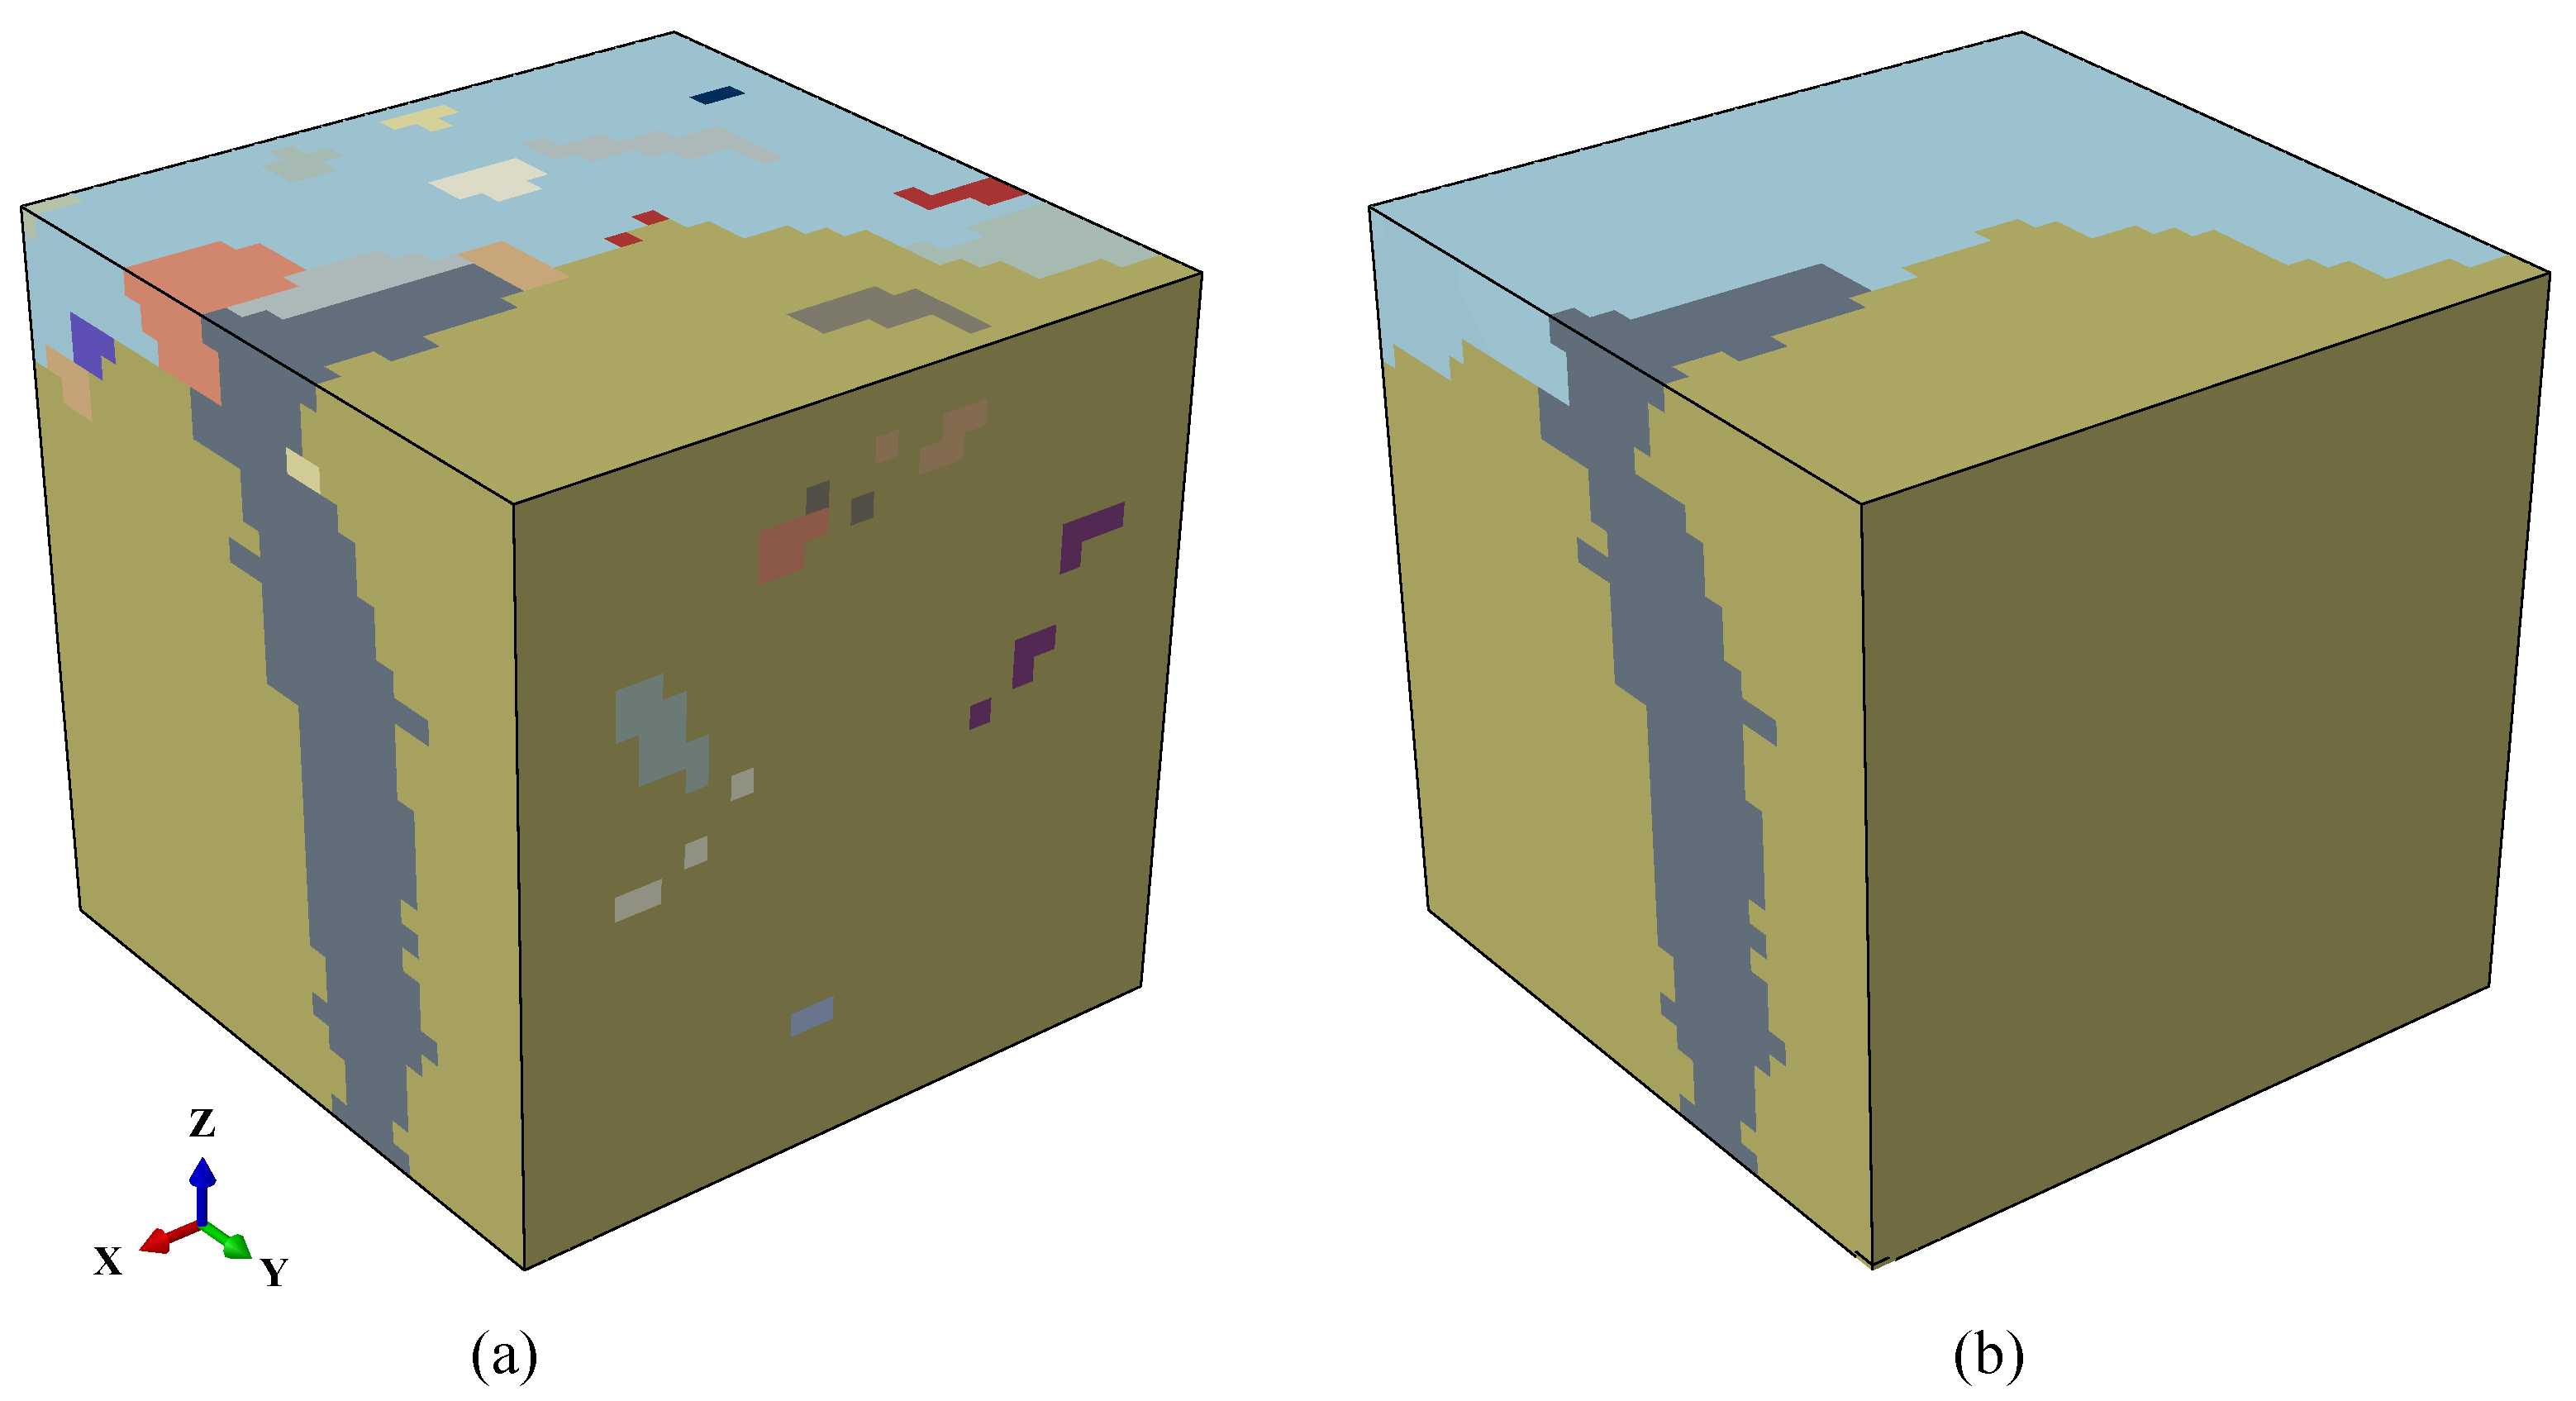
Figure 9.
(a) Boundary conditions of the finite element model; (b) Stress-strain curves of the model with and without austenites.
Figure 9.
(a) Boundary conditions of the finite element model; (b) Stress-strain curves of the model with and without austenites.
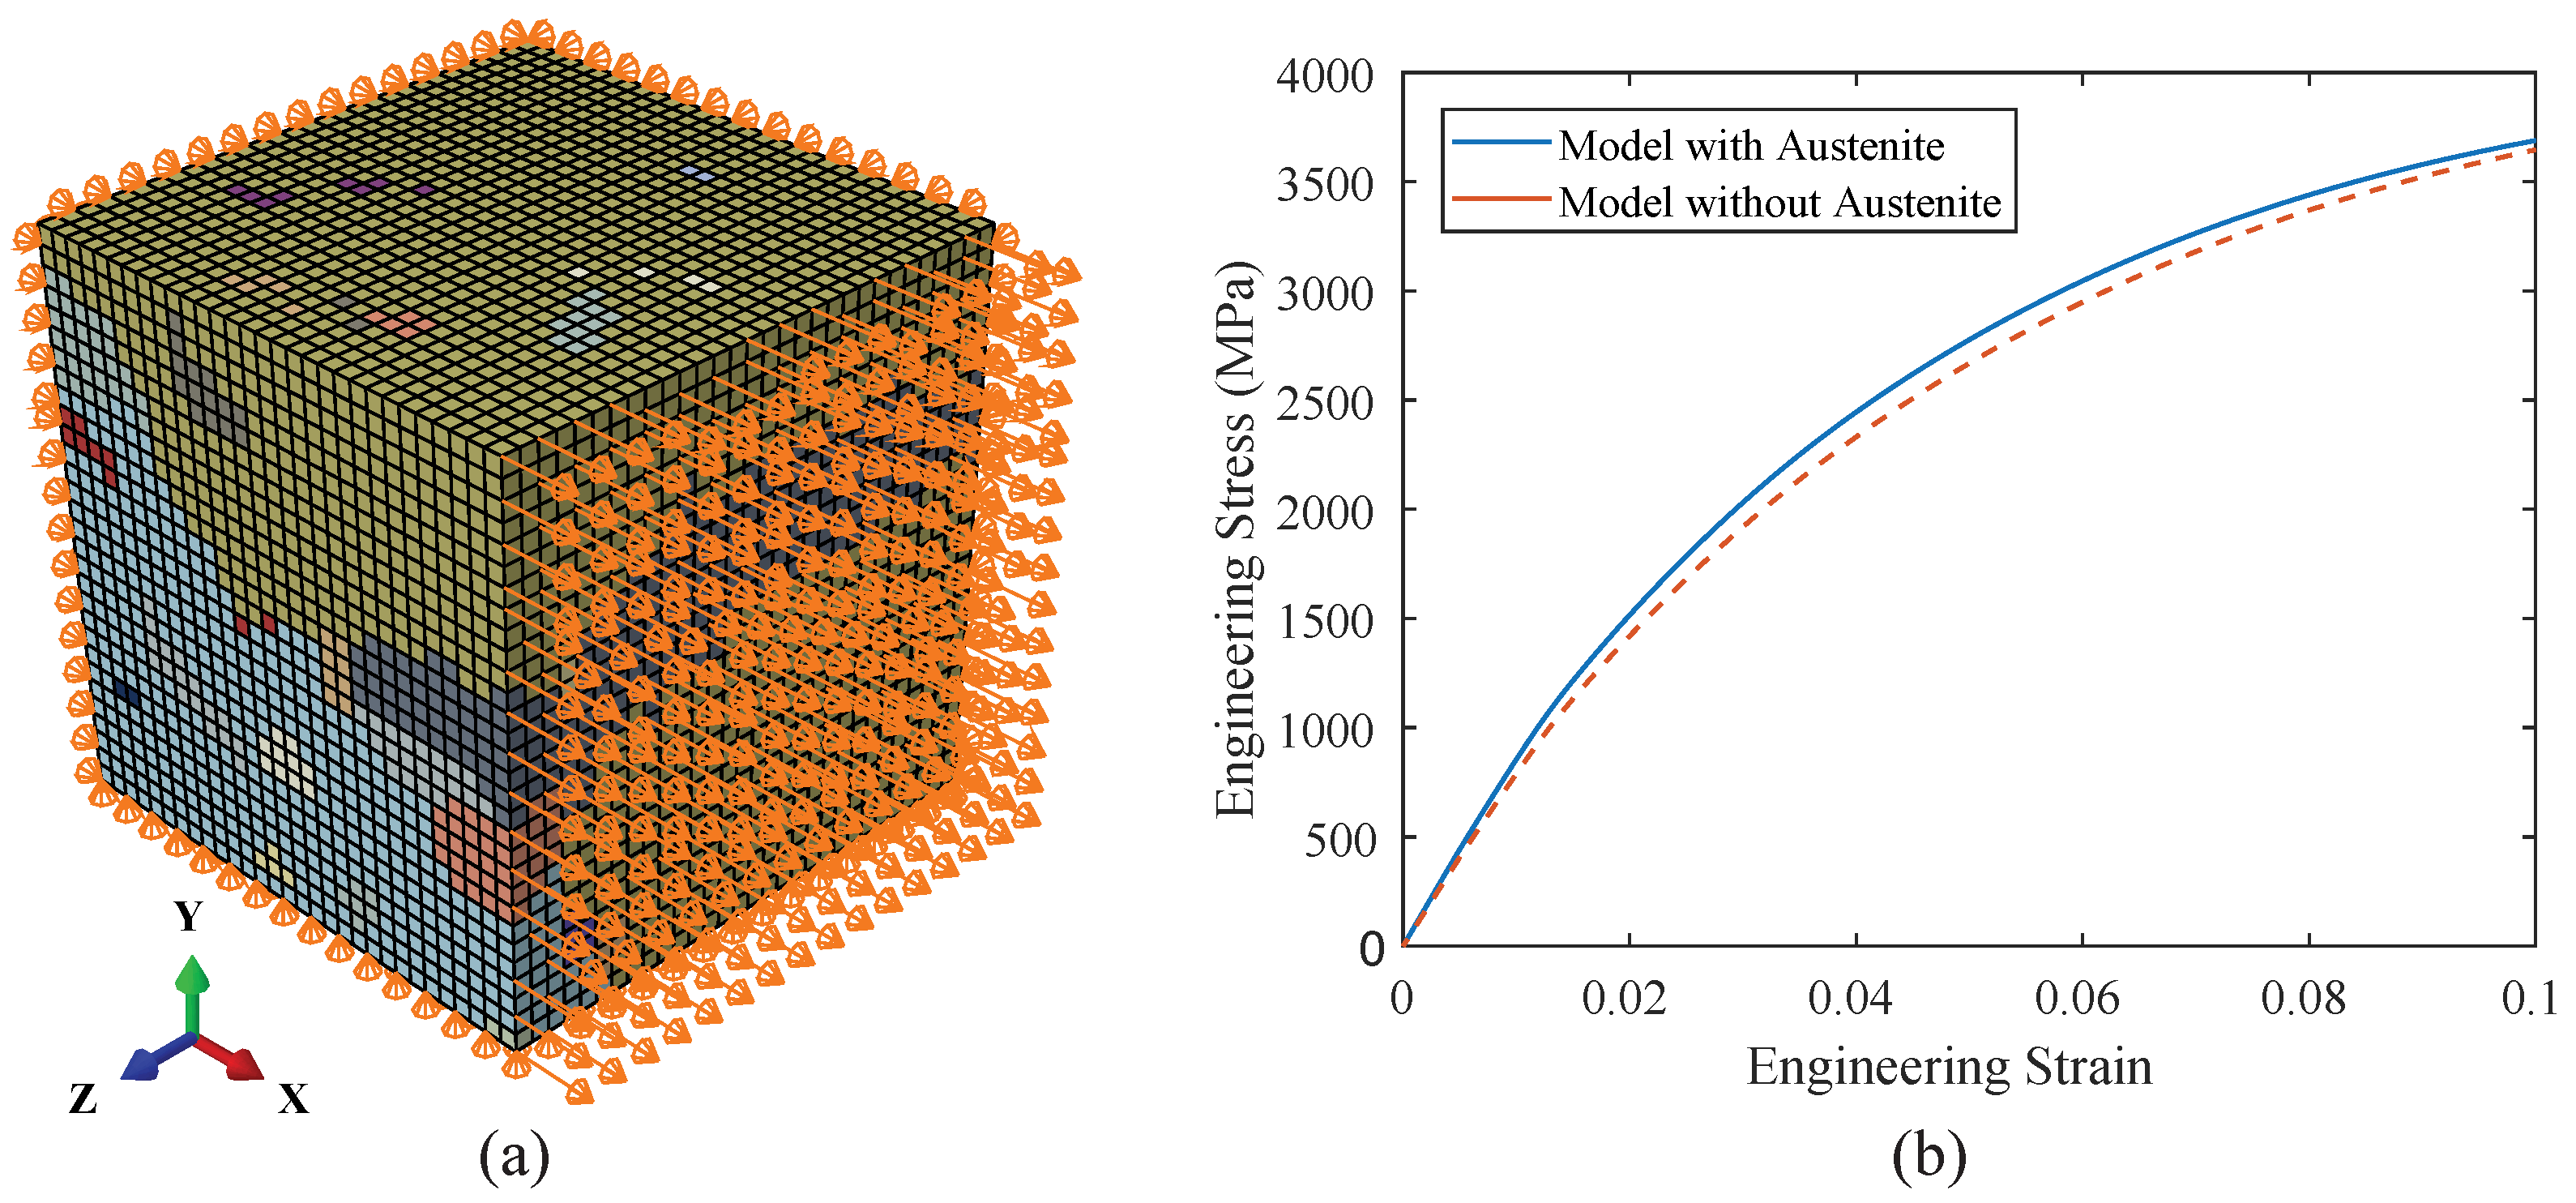
Figure 10.
Distribution of stress at 50% of the applied loading for (a) the model with austenite and (b) the model without austenite.
Figure 10.
Distribution of stress at 50% of the applied loading for (a) the model with austenite and (b) the model without austenite.
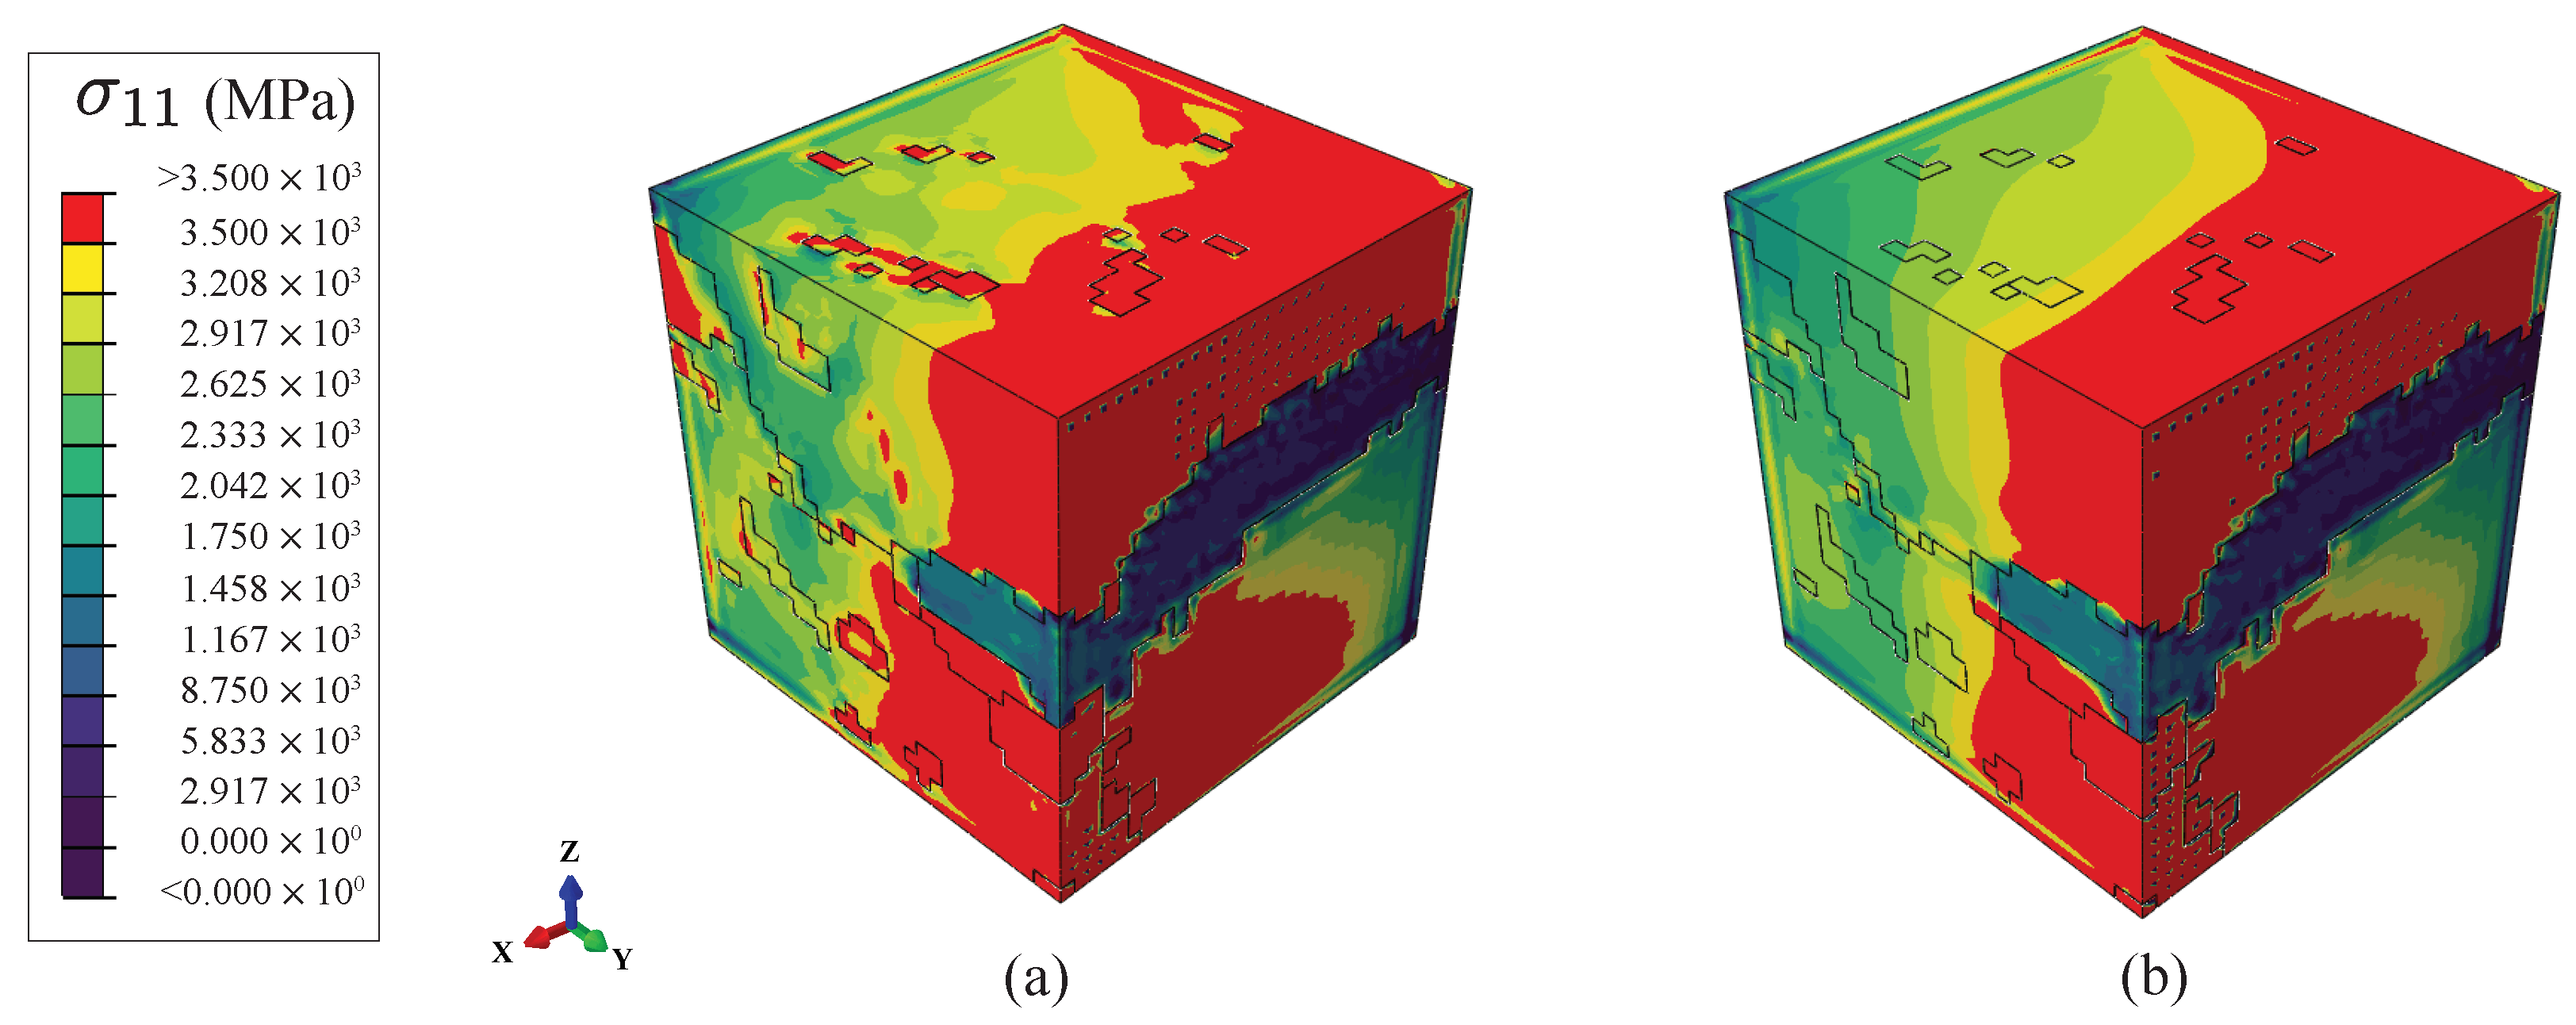
Figure 11.
Distribution of true strain at 50% of the applied loading for (a) the model with austenites and (b) the model without austenites.
Figure 11.
Distribution of true strain at 50% of the applied loading for (a) the model with austenites and (b) the model without austenites.
Figure 12.
Distribution of equivalent plastic strain at 50% of the applied loading for (a) the model with austenites and (b) the model without austenites.
Figure 12.
Distribution of equivalent plastic strain at 50% of the applied loading for (a) the model with austenites and (b) the model without austenites.
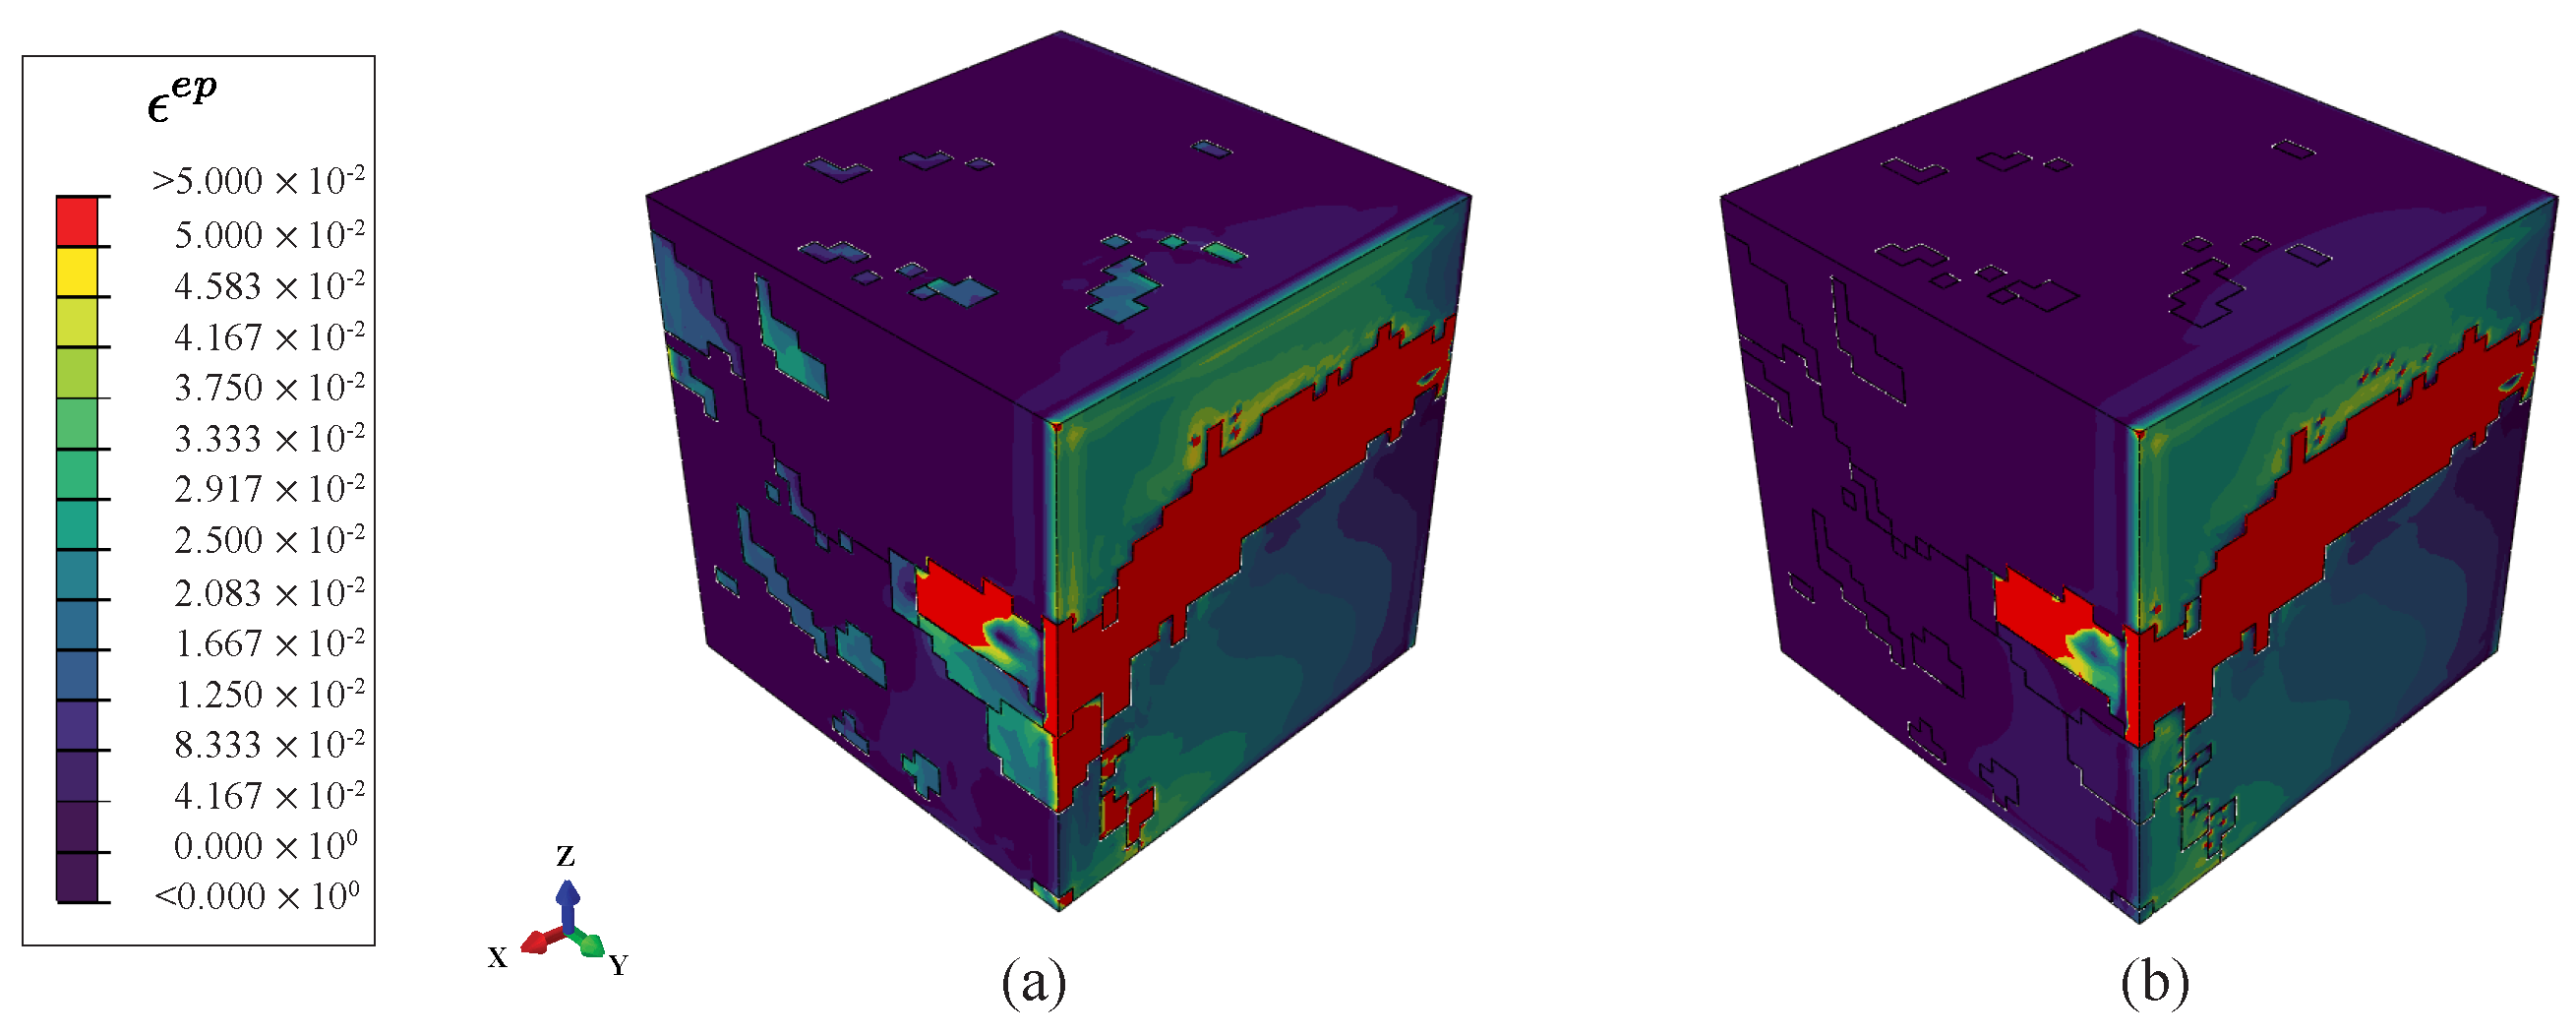
Figure 13.
Local responses over the path across martensite, austenite, and ferrite at the end of the loading: (a) the path passing the martensite (yellow area), austenite (red area), and ferrite (orange area). Response along the path includes (b) stress component , (c) true strain component , and (d) equivalent plastic strain . The narrower shaded region in (b–d) indicates the austenite, while the wider shaded region indicates the location of the ferrite.
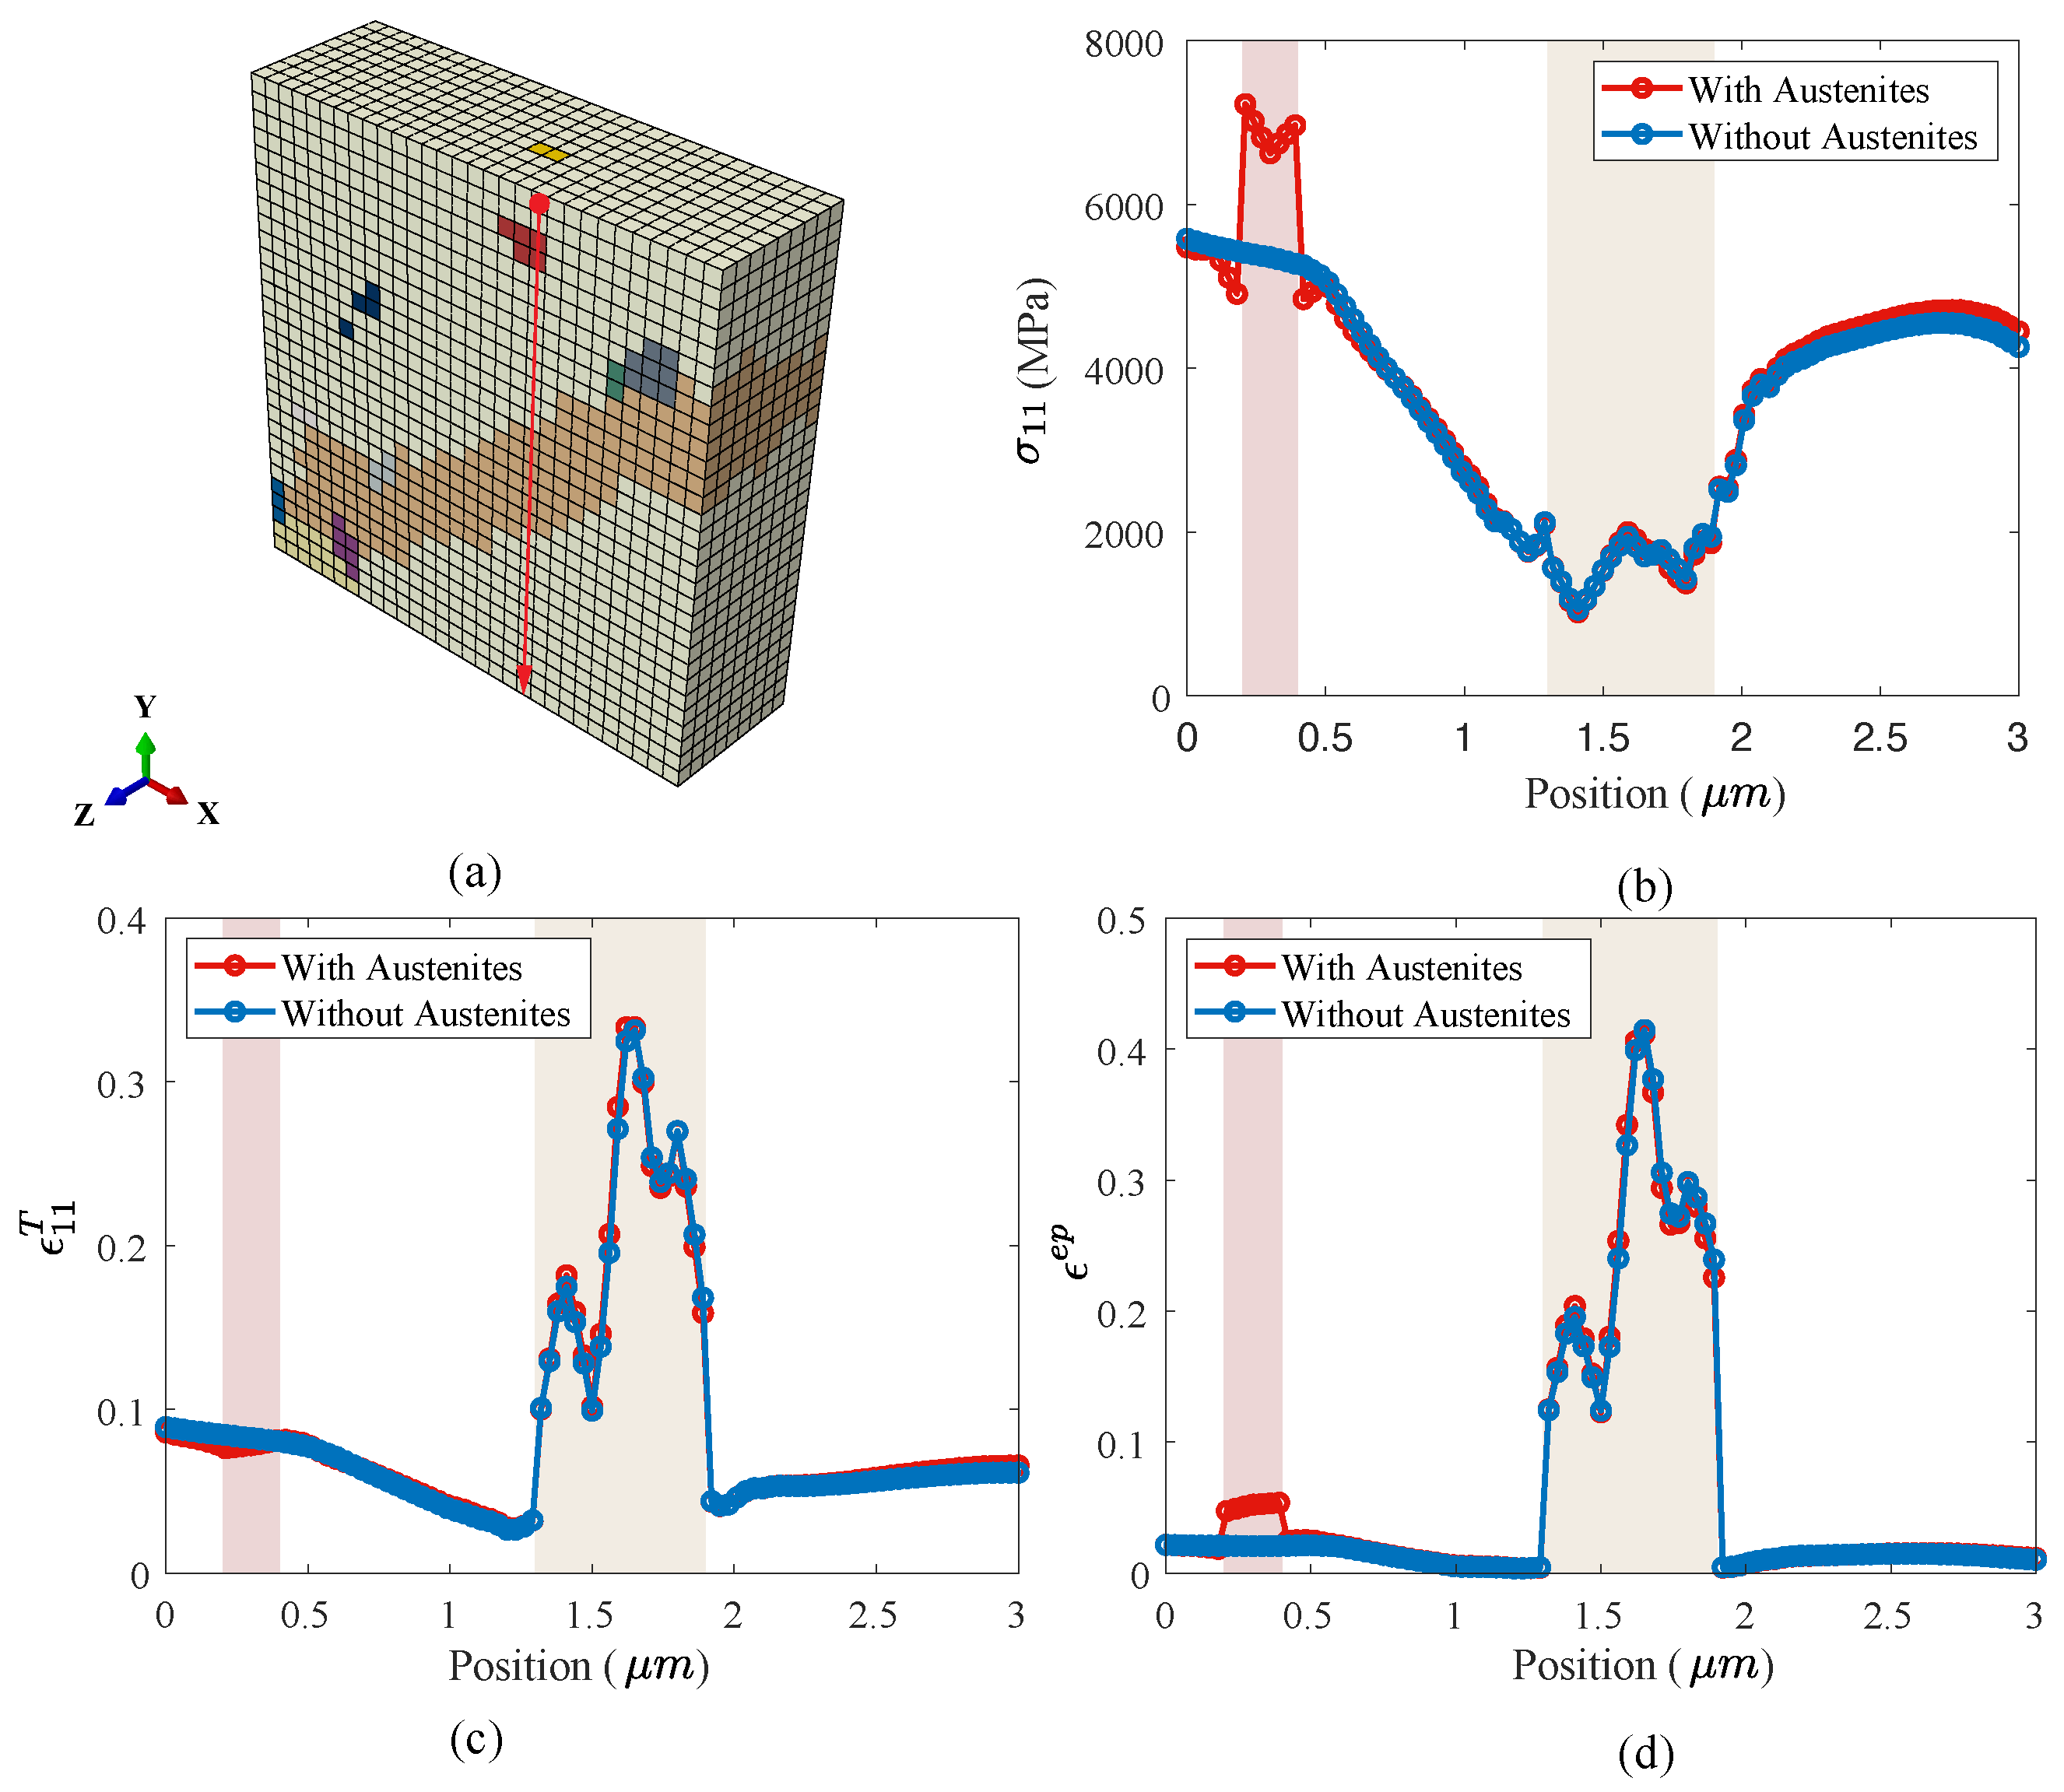
Figure 14.
Histogram of stress component , true strain , and equivalent plastic strain at the end of applied loading: (a1,b1,c1) are results of the model without austenite; (a2,b2,c2) are results of the model without austenite.
Figure 14.
Histogram of stress component , true strain , and equivalent plastic strain at the end of applied loading: (a1,b1,c1) are results of the model without austenite; (a2,b2,c2) are results of the model without austenite.
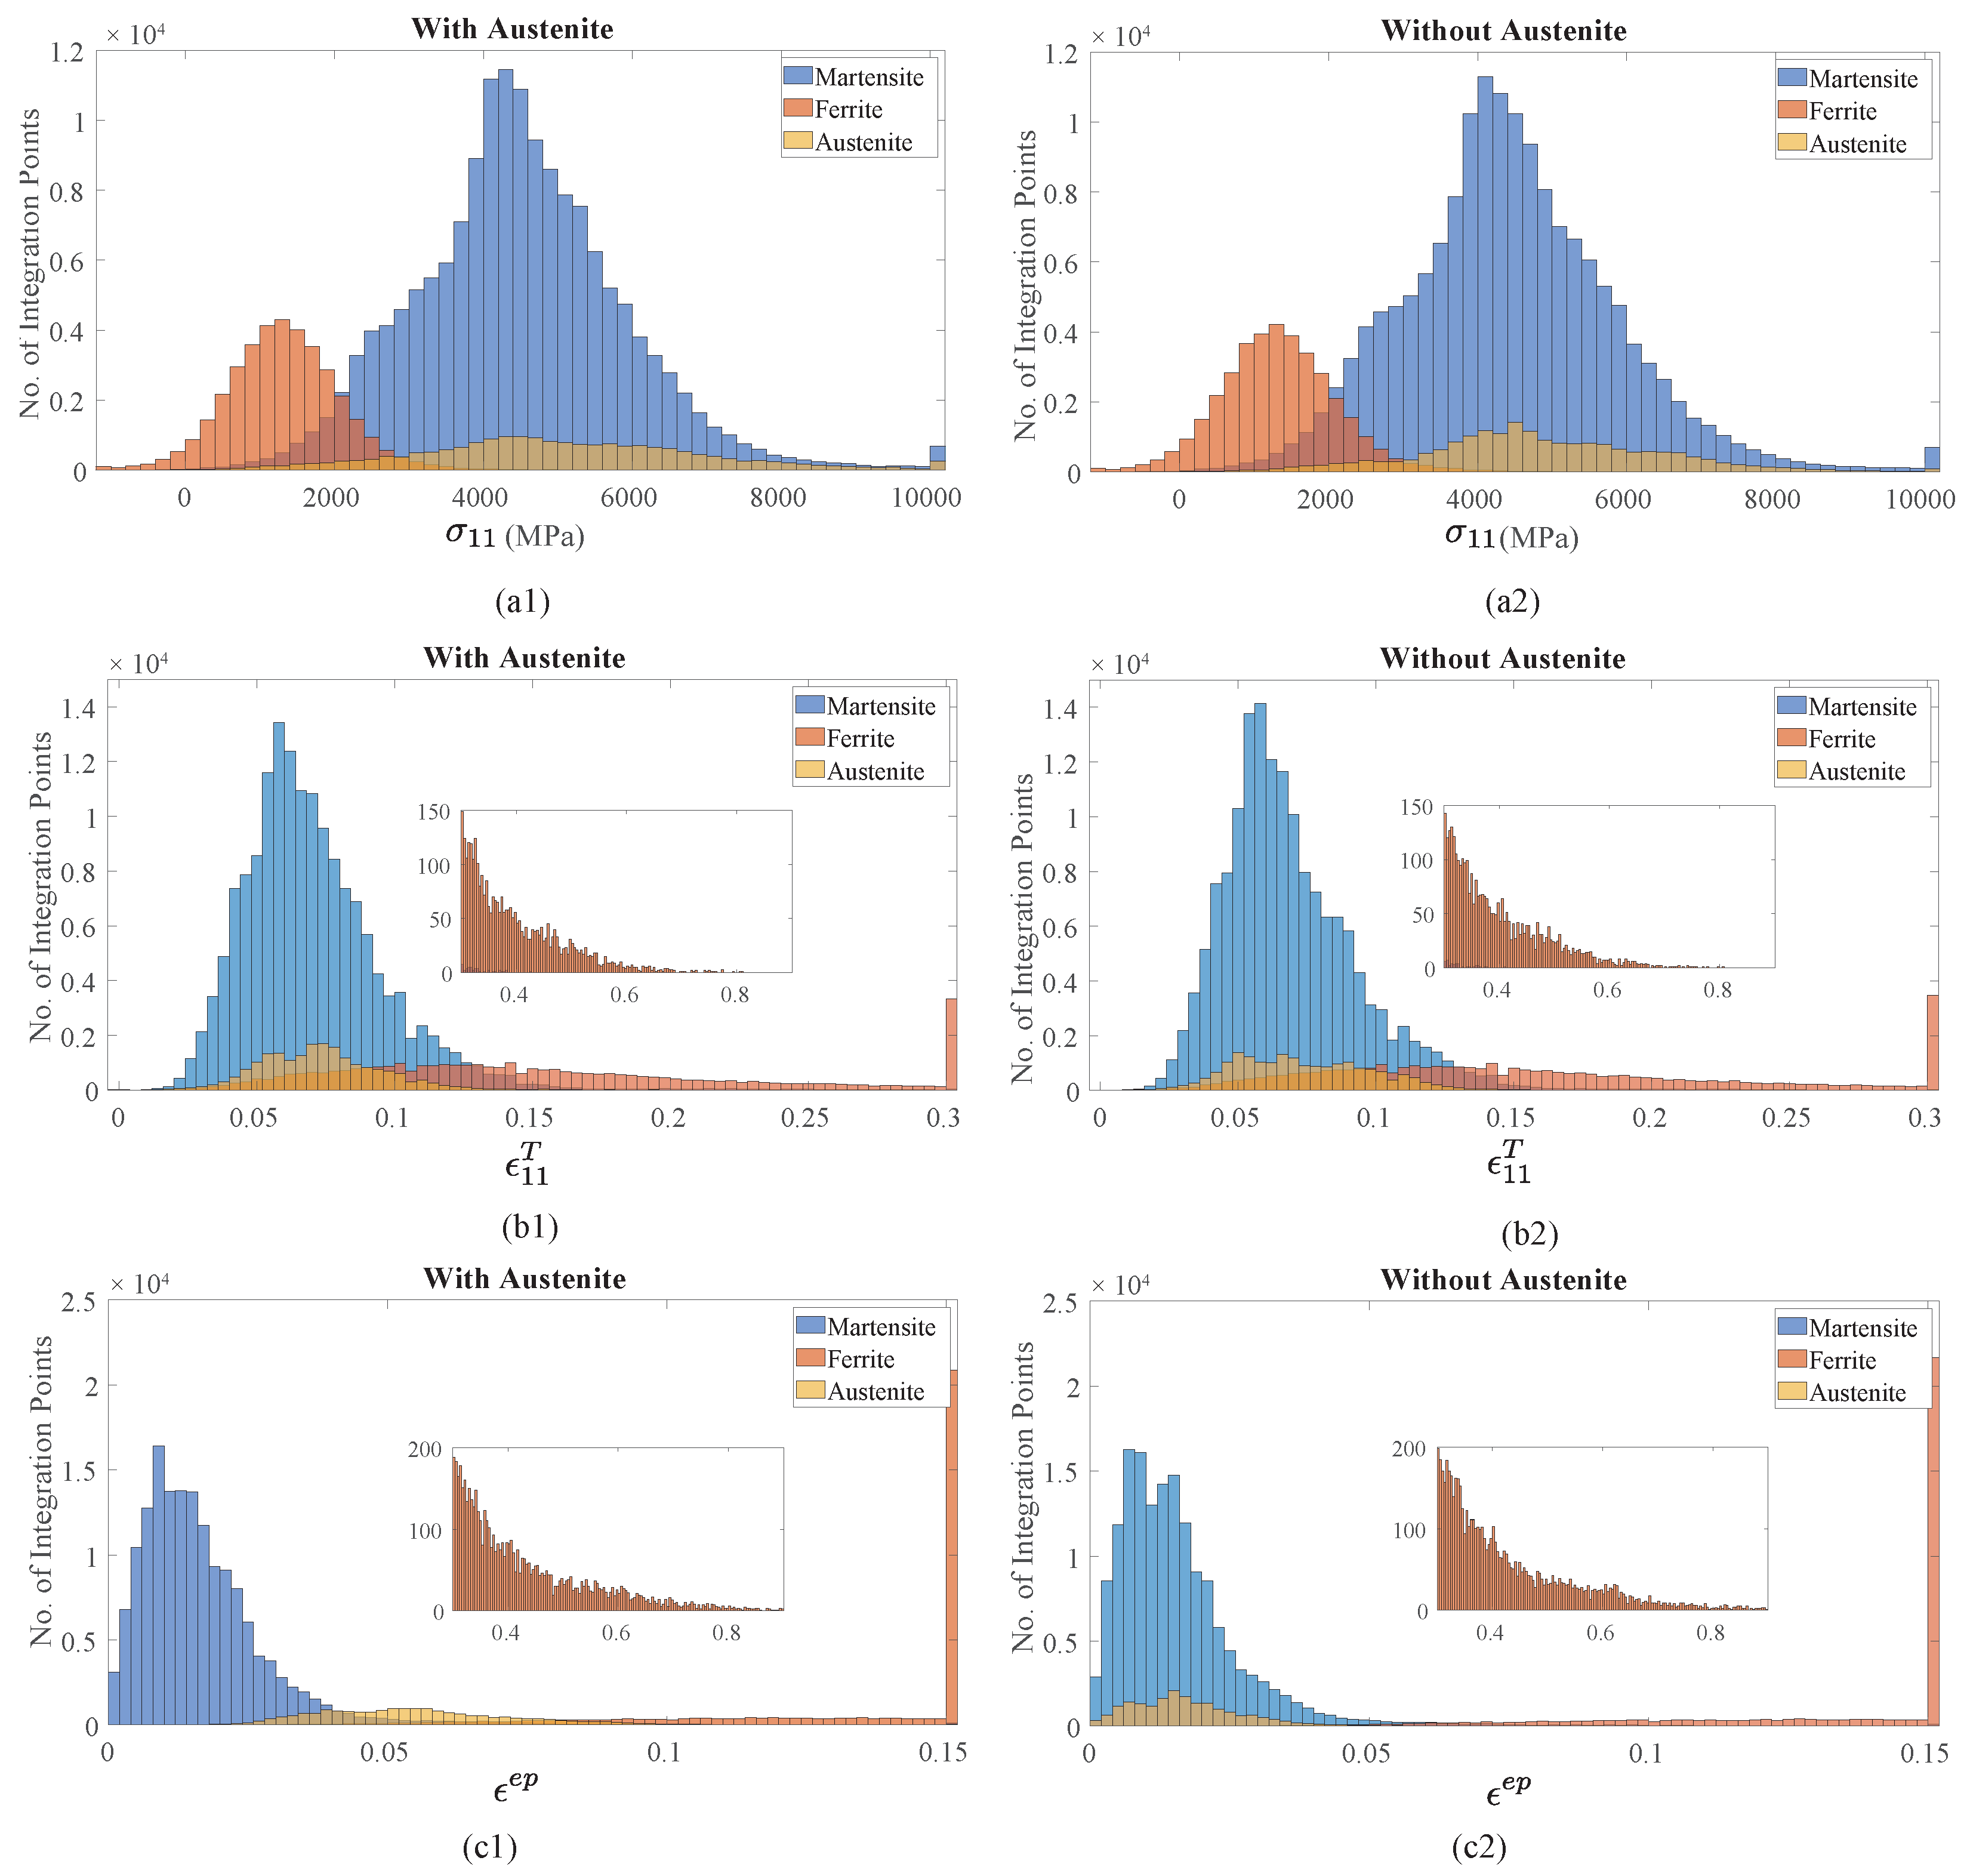
Figure 15.
Correlation between Schmid factor and stress component at (a1,a2) 0% of loading, (b1,b2) 50% of loading, and (c1,c2) 100% of loading.
Figure 15.
Correlation between Schmid factor and stress component at (a1,a2) 0% of loading, (b1,b2) 50% of loading, and (c1,c2) 100% of loading.

Table 1.
Model size comparison when using different reconstruction resolutions.
| Recon. resolution (μm) | 1 | 0.5 | 0.25 | 0.1 | 0.08 | 0.05 |
| Mesh size (μm) | 1.0 | 0.5 | 0.25 | 0.1 | 0.08 | 0.05 |
| No. of grains | 26 | 184 | 491 | 1170 | 1248 | 1473 |
| No. of C3D8 elements | 270 | 2160 | 18,900 | 311,040 | 609,280 | 2,530,980 |
| No. of nodes | 601 | 4067 | 29,131 | 381,803 | 696,857 | 2,482,194 |
Disclaimer/Publisher’s Note: The statements, opinions and data contained in all publications are solely those of the individual author(s) and contributor(s) and not of MDPI and/or the editor(s). MDPI and/or the editor(s) disclaim responsibility for any injury to people or property resulting from any ideas, methods, instructions or products referred to in the content. |
© 2024 by the authors. Licensee MDPI, Basel, Switzerland. This article is an open access article distributed under the terms and conditions of the Creative Commons Attribution (CC BY) license (https://creativecommons.org/licenses/by/4.0/).
Share and Cite
MDPI and ACS Style
Shen, P.; Liu, Y.; Zhang, X. Crystal Plasticity Finite Element Modeling of the Influences of Ultrafine-Grained Austenite on the Mechanical Response of a Medium-Mn Steel. Crystals 2024, 14, 405. https://doi.org/10.3390/cryst14050405
AMA Style
Shen P, Liu Y, Zhang X. Crystal Plasticity Finite Element Modeling of the Influences of Ultrafine-Grained Austenite on the Mechanical Response of a Medium-Mn Steel. Crystals. 2024; 14(5):405. https://doi.org/10.3390/cryst14050405
Chicago/Turabian StyleShen, Pengfei, Yang Liu, and Xiang Zhang. 2024. "Crystal Plasticity Finite Element Modeling of the Influences of Ultrafine-Grained Austenite on the Mechanical Response of a Medium-Mn Steel" Crystals 14, no. 5: 405. https://doi.org/10.3390/cryst14050405
Note that from the first issue of 2016, this journal uses article numbers instead of page numbers. See further details here.