1. Introduction
The remarkable hydrogen capacity of magnesium has fostered intense research efforts in the last years in view of its future applications where light and safe hydrogen-storage media are needed. Magnesium can reversibly store about 7.6 wt% hydrogen, has light weight and is a low-cost material. However, further research is needed since Mg has a high operation temperature and slow absorption kinetics that prevent for the moment the use in practical applications. Two separate reasons could explain this problem: (a) hydrogen molecules do not readily dissociate on Mg surfaces; and (b) magnesium hydride is very stable up to high temperatures. Improvements on H
2 absorption and desorption kinetics can be obtained by mechanically milling MgH
2 and adding catalysts to magnesium and magnesium hydrides. The addition of small amounts of catalytic metals such as Pd or Ni to Mg hydride has been indicated as a promoting factor in the surface dissociation of the H
2 molecule (the clean Mg surface alone being unable to catalyse the dissociation). Moreover, other metallic additives, such as Al, Li, Mn, Ti
etc., have been suggested to improve the hydriding properties of metallic Mg [
1,
2,
3,
4,
5,
6]. However a full understanding of the desorption mechanism at the interface Mg-MgH
2 is still lacking. From an experimental point of view there is not a clear evidence of which interfaces are involved in the hydrogen diffusion, and which is the atomic dynamics at the interfaces [
7].
For these reasons a detailed study of the interface between Mg and MgH
2 is needed to characterize the dynamics of hydrogen at the interface. Further insights are gained by characterizing Mg–MgH
2 interfaces which are supposed to play a major role in the hydrogen diffusion during absorption and desorption cycles. By means of accurate
ab initio molecular dynamics simulations based on the density-functional theory with norm-conserving pseudopotentials and plane-wave expansion (CPMD code [
8,
9]), an interface is selected, studied and characterized. Extensive electronic structure calculations are used to determine the equilibrium properties and the behaviour of the surfaces in terms of structural deformations and total energy considerations. Furthermore, the interface is studied at several values of the temperature, thereby characterizing the hydrogen atomic displacement and desorption.
In the next section the computational details are reported and the numerical model is verified on simple atomic system. In the third section free surfaces are both studied and characterized, while in the fourth section an interface is built and geometrically and energetically optimized. In the fifth section the influence of the temperature is studied on the hydrogen diffusion through the interface. In the last section we analyze the reconstitution of the interface after hydrogen diffusion.
2. Computational Details
We employed for all the calculations the CPMD (Car–Parrinello Molecular Dynamics) code based on Density Functional Theory and plane wave basis pseudopotential method [
10,
11]. Goedecker–Teter–Hutter pseudopotentials for magnesium and hydrogen together with Padé approximant LDA exchange-correlation potentials were used [
12,
13,
14]. The LDA functional has well-known drawbacks as discussed in Ref. [
15], especially for energy calculations, but it can reliably simulate structural properties (lattice size, equilibrium positions, elastic constants). Despite the high accuracy of Mg pseudopotentials which include semicore states, as required for example in studies like Ref. [
16], the structural characterization of an interface requires large atomic systems to mimic bulk behavior on both sides. Thus in view of large-scale simulations, the pseudopotential with fewer valence electrons has been chosen, in order to save computational time and simulate the largest system. The electronic wave functions are expanded in a plane-wave basis set with a kinetic energy cut-off equal to 80 Ry. To check the agreement with experimental results, the latter value was optimized by preliminary calculations both on simple molecules (Mg
2, MgH and H
2) and on the crystalline structures of metallic Mg and magnesium hydride. All the calculations are performed in the supercell approximation, in view of the large-scale molecular dynamics simulation of the interface, with periodic boundary conditions meant to mimic an infinitely extended system.
The calculations for the diatomic molecules Mg2, MgH and H2 yield the following interatomic distances in good agreement with experimental values: DMg2 = 3.4056 Å (exp. DMg2 = 3.890 Å), DMgH = 1.7362 Å (exp. DMgH = 1.7297 Å) and DH2 = 0.7681 Å (exp. DH2 = 0.7414 Å).
The crystal structure of Mg is the hexagonal close-packed with experimental lattice parameter aMg = 3.2094 Å and cMg = 1.6327 × aMg with bonding energy of 1.53 eV/at. Geometry optimization of crystal structure gives aMg = 3.15 Å and cMg = 1.62 × aMg with a bonding energy of 1.59 eV/at.
Crystal MgH
2 is considered in the
β-MgH
2 atomic structure, TiO
2-rutile type, that is observed at the atmospheric pressure and low temperatures [
17]. The crystal structure is relaxed over a range of possible cell volumes, varying by hand the cell parameters and minimizing the total energy. The computed values for the cell parameters are in good agreement with experimental ones within 3%. In the case of MgH
2 we find
aMgH2 =
bMgH2 = 4
.39 Å,
cMgH2 = 2
.96 Å and
u = 0
.304 (experimental values:
aMgH2 =
bMgH2 = 4
.501 Å ,
cMgH2 = 3.02 Å) [
18].
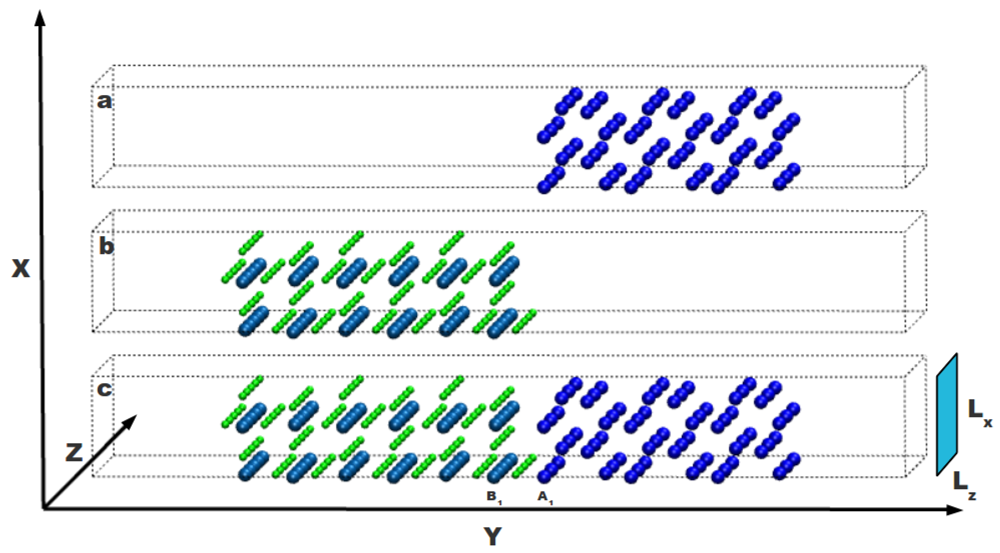
A supercell approach is used to simulate the atomic system with the interface. As shown in
Figure 1, the Mg-MgH
2 interface is built by putting nearby two free surfaces obtained cutting both the Mg and MgH
2 crystals. The Mg part is sketched in
Figure 1a and the MgH
2 one in
Figure 1b: these systems can interact through their internal free surfaces forming an interface as shown in
Figure 1c. Each internal free surface, selected according to periodic boundary conditions, is severally relaxed without taking into account any possible reconstruction upon changing the temperature (two layers of both external surfaces are kept fixed). Both sides of the whole system are long enough to take into account the structural modifications induced by the interface. Results reported in Ref. [
19], on a similar system, confirm that the effects of relaxation propagate to the bulk atoms up to the third or fourth neighbor and that six neighbors are enough to attain bulk behavior on both sides.
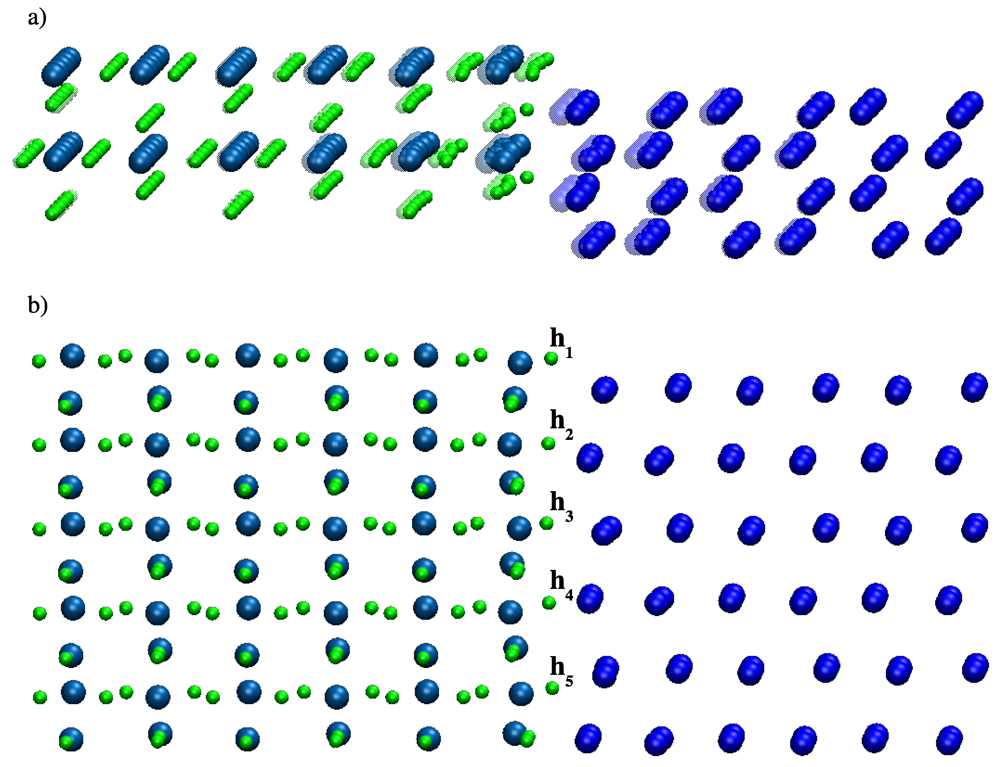
Figure 1.
Mg and MgH2 crystalline systems with free surfaces on both sides in the y direction are reported in part (a) and (b) of the figure, respectively; In part (c) both systems are together to define an interface between them. External surfaces are separated by a void region and do not interact with each other. H atoms are in green, Mg atoms in the magnesium hydride side are in light blue and Mg atoms in the magnesium side are in dark blue.
The total length of the system is Ly = 50.3009 Å, while in the x and z direction the system has Lx= 6.2115 Å and Lz= 15.0939 Å, respectively. On both sides of the system, a void region of length 2 × Lx is considered to suppress the interaction, due to periodic boundary conditions, between the external surfaces of Mg and MgH2.
Zero-temperature total energy calculations are used to evaluate interface stability. Subsequently, MD simulations at constant volume and constant temperature are performed by using Nose–Hoover thermostats [
20,
21]. One key quantity to predict the mechanical properties of the interface and to verify the reliability of our model is the work of adhesion. The latter quantity is defined as the bonding energy per unit area needed to reversibly separate an interface into two free surfaces, neglecting plastic and diffusional degrees of freedom. Through the paper all errors on the work of adhesion are taken as low as possible performing accurate fitting of energy data and a careful application of ab-initio methods for the computation of energies. This procedure ensures that errors are at the level of accuracy allowed by DFT-based calculations [
15],
i.e.,
<2% error for the work of adhesion and
<10% error for the formation enthalpies.
4. Mg-MgH2 Interface
We consider the supercell shown in
Figure 1c in which the free surfaces of magnesium and magnesium hydride are facing each other at the distance 0.5×
Lx. In this configuration the Mg atom (magnesium side) named
A1 is in front of the Mg atom (magnesium hydride side) named
B1. These Mg atoms have the same
x and
z coordinates and their
y coordinates differs by 0
.5×
Lx. The
B1 atom has the coordinates (
xB, yB, zB), instead the
A1 atom has the coordinates (
xA, yA, zA) where
xA =
xB,
yA =
yB + 0
.5×
Lx and
zA =
zB. To find the interface configuration corresponding to the lowest total energy, we perform a geometry optimization moving rigidly by hand the Mg part and keeping fixed the MgH
2 one. The Mg part is moved in such a way that the coordinates
xA,
yA and
zA of the Mg atom, labelled
A1 in
Figure 1c, are on a tridimensional grid
xA =
xB +
dx,
yA =
yB +
dy and
zA =
zB +
dz, where the increments
dx,
dy and
dz depend upon the integer index
i,
j,
k:
![Crystals 02 00845 i003]()
Total energy calculations are performed to minimize the energy of the whole system by varying the distance between the internal surfaces. The total energy of the system is minimized for k = 0, i = 2 and j = 8. The Mg atoms A1 and B1 are in the same plane xy (atoms of the Mg part are not shifted in z direction; dzk=0 = 0), shifted from each other by dxi=2 = 0.5 × aMg in x direction at the distance dyj=8 = 0.4 × Lx in y direction. A good indicator of the reliability of this interface is the calculation of the work of adhesion W. W can be defined either in terms of the surface and interfacial energies (relative to the respective bulk materials), or by the difference in total energy between the interface and its isolated slabs:
Here σslabi is the surface energy of slab i, γinter is the interface energy, Eslabi is the total energy of the slab i, and Einter is the total energy of the interface system. The total interface area is fixed by A = Lx ×Lz.
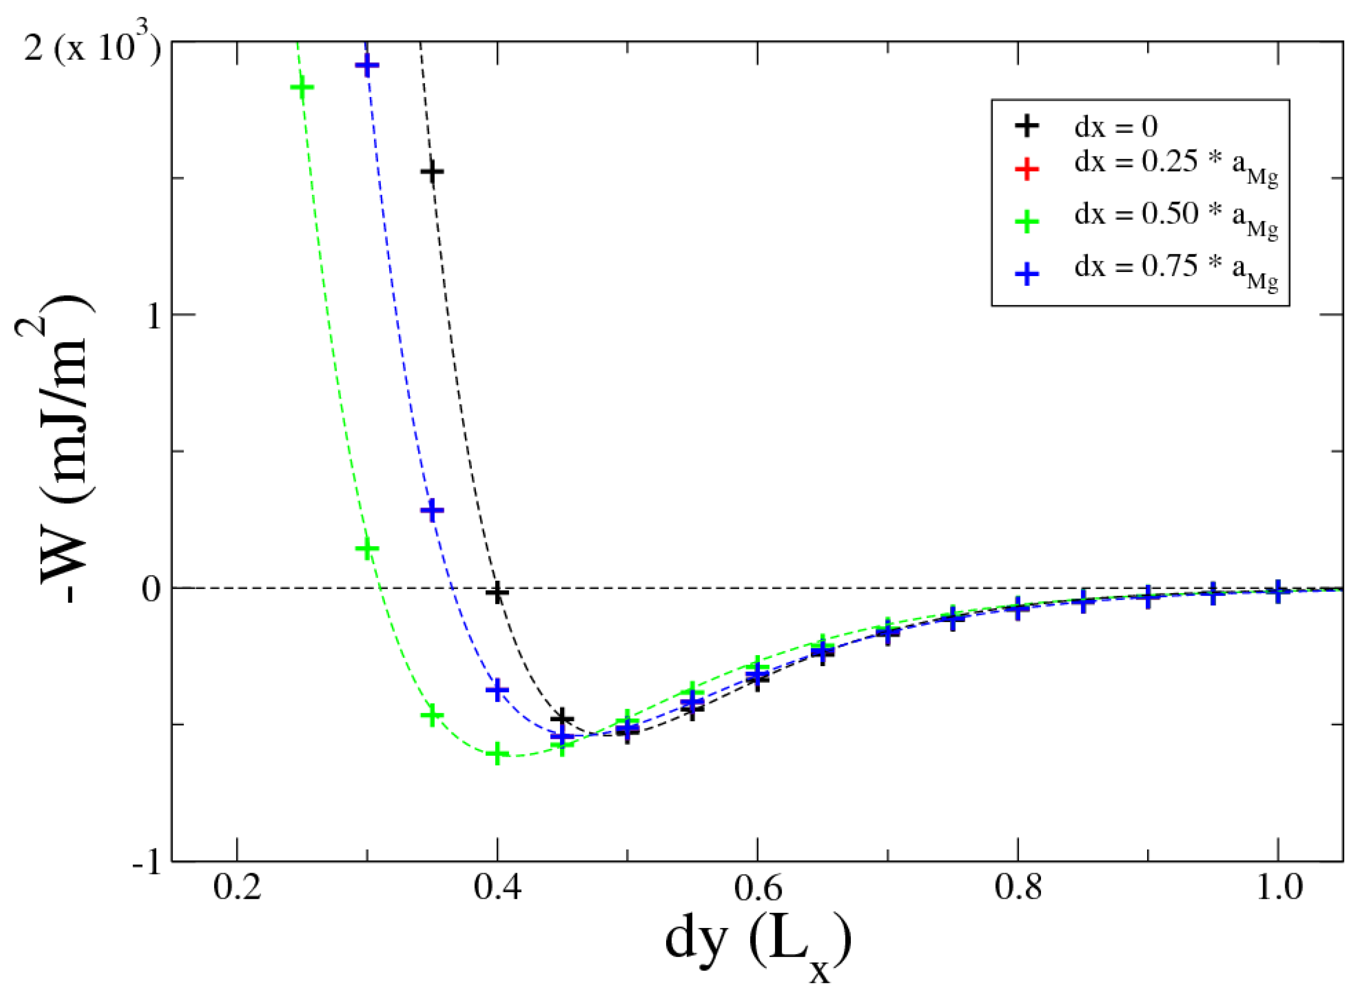
Figure 4 shows the opposite of work of adhesion (
−W), for
k = 0 (no shift in z direction between the Mg and MgH
2 slabs,
dz = 0), varying
i and
j. These values of work of adhesion are calculated using Equation 1: the difference in total energy between the interfaces and the corresponding isolated slabs. Values for
dx = 0
.25 ×
aMg and
dx = 0
.75 ×
aMg are overlapped due to symmetry. The final configuration is characterized by a work of adhesion of
Wow = 605 mJ/m
2.
In
Figure 4 calculated values of work of adhesion are fitted by the Rydberg function
where
d* = (
dy − dy0)
/l is the scaled separation,
dy measures the separation between Mg and MgH
2 slabs,
W0 is the minimum at the equilibrium separation
dy0 and
l is a scaling length. Fitting with the function in Equation 2 the calculated values of work of adhesion by Equation 1, we found the values shown in
Table 2. The very good agreement between calculated values of work of adhesion with the Rydberg function make us confident that the interfacial energy follows the universal binding energy relation (UBER) [
22,
23]. In the configuration with
dz = 0 and
dx = 0
.50 ×
aMg, regression yields values for
W0 and
dy0 (see third row in
Table 2) that are very close to our values
Wow = 605 mJ/m
2 and
dy = 0
.4 ×
Lx.
Figure 4.
Work of adhesion for Mg-MgH2 interface with dz = 0 varying both dy and dx, dy is expressed in unit of Lx. Dotted lines are plots of the Rydberg function (2).
Figure 4.
Work of adhesion for Mg-MgH2 interface with dz = 0 varying both dy and dx, dy is expressed in unit of Lx. Dotted lines are plots of the Rydberg function (2).
Table 2.
Values yielded by regression fitting with Rydberg function of calculated values of work of adhesion (see
Figure 4);
dy0 and
l are expressed in unit of
Lx.
Table 2.
Values yielded by regression fitting with Rydberg function of calculated values of work of adhesion (see Figure 4); dy0 and l are expressed in unit of Lx.
| | W0 (mJ/m2) | dy0 (Lx) | l (Lx) |
| dx = 0 × aMg | 534 | 0.487 | 0.086 |
| dx = 0.25 × aMg | 540 | 0.463 | 0.098 |
| dx = 0.50 × aMg | 615 | 0.410 | 0.100 |
| dx = 0.75 × aMg | 540 | 0.463 | 0.098 |
Regarding the optimal interface stacking sequences, we find that the Mg atoms prefer sites which continue the hexagonal sequence of the magnesium hcp bulk across the interface. In fact the magnesium atoms on the interface that are on the plane z = 0, i.e., the atoms B1 and its imagine in x direction on hydride side, and the atoms A1 and its neighbor on magnesium side, take shape of half hexagon with A1 and B1 at distance of 0.94 × aMg.
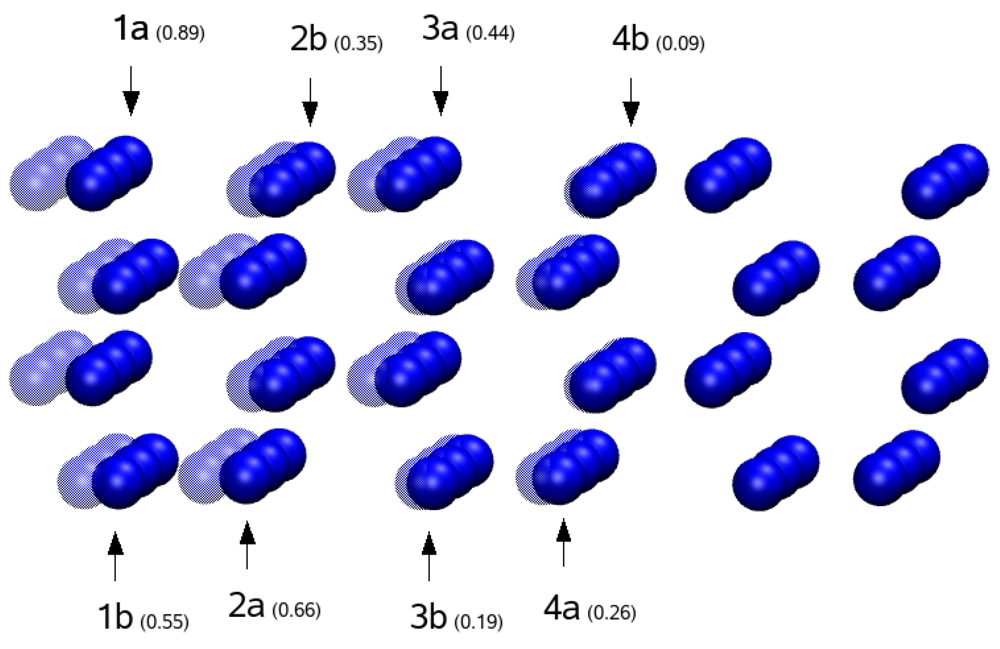
Subsequently, we perform an ionic relaxation to further optimize the atomic geometry (residual force on each atom less than 10
-2 eV/Å), with reduction of the total energy of the system of 1.92 eV. This optimization has been performed by keeping fixed two layers of Mg atoms on both sides of the system to limit the influence of the external surfaces on the internal atoms near the interface. During the ionic relaxation, the internal surfaces are free to adapt to each other (see
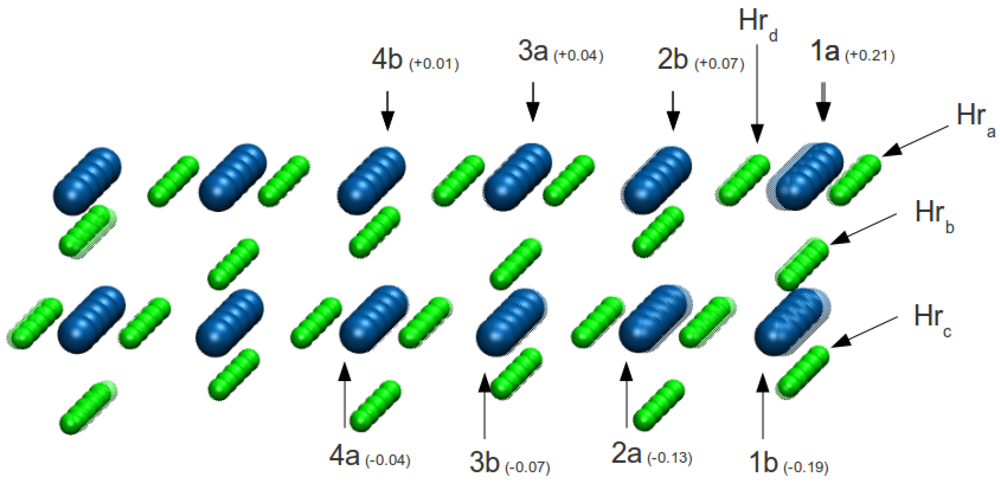
Figure 5). Analysing the displacements of the atoms, for the magnesium side, we observed the displacements of the Mg atoms inward to reduce the thickness of the Mg slab, as it is generally expected for a metal. In this case, the displacements are almost halved with respect to the Mg free surface case. Instead, for the magnesium hydride side, the Mg and H atoms move forward the interface with consequent widening of MgH
2 slab, and with respect to MgH
2 free surface, the displacements are increased. Atoms near the interface have a larger displacements with respect to bulk atoms. The displacements of the atoms in proximity of the interface are in the order of half angstrom. In particular we emphasize the tendency of the outer layer of Mg atoms on the hydride side to adapt to the saw-tooth shape of the magnesium free surface (see
Figure 5b). This causes loss of z symmetry in the displacements of Mg and H atoms. Atoms belonging to the same row do not execute the same displacement (see
Figure 5a). We resumed these results in
Table 1. After geometry optimization the work of adhesion, computed by using Equation 1, is
Wog = 395 mJ/m
2.
Figure 5.
Two views of the Mg-MgH
2 interface after ionic relaxation. The shadowed atoms represent initial positions of atoms before relaxation. Displacements of the atoms are resumed in
Table 1.
Figure 5.
Two views of the Mg-MgH
2 interface after ionic relaxation. The shadowed atoms represent initial positions of atoms before relaxation. Displacements of the atoms are resumed in
Table 1.
To determine which H atoms near the interface are more unstable, we removed in turn each of the five H atoms (
h1,
h2,
h3,
h4 and,
h5) on the outer row (
Hra in
Figure 3) and performed total energy calculations for the interfaces and corresponding hydride free surfaces. The values of the work of adhesion calculated by Equation 1 are lined up on second row of the
Table 3.
Table 3.
Work of adhesion and formation energy for the interfaces without one atom of hydrogen.
Table 3.
Work of adhesion and formation energy for the interfaces without one atom of hydrogen.
| | h1 | h2 | h3 | h4 | h5 |
|---|
| W (mJ/m2 | 1120 | 1160 | 1100 | 1160 | 1120 |
| ΔH (eV) | 0.71 | 0.53 | 0.88 | 0.53 | 0.71 |
Moreover, to establish the preferred desorption site of the H atoms, energy cost for the various positions were calculated from the total energies according to the following Equation:
where
Einter-H is total energy for the Mg-MgH
2 interface without one atom of hydrogen,
![Crystals 02 00845 i007]()
is half total energy for the hydrogen molecule and
Einter is total energy for the Mg-MgH
2 interface after geometry optimization. The calculated values of Δ
H are shown on third row of the
Table 3. From these data we observe the inverse relation between the work of adhesion (
W) and the formation energy (Δ
H). The central position is the most energetically favourable for the desorption (the biggest Δ
H and the lowest
W) and moreover there is symmetry with respect to that central position.
5. Hydrogen Diffusion
To understand the atomic level dynamics of hydrogen displacement at the interface, MD simulations are performed at constant volume and constant temperature. Starting from a temperature of
T= 300 K the system with interface is analyzed and characterized up to the temperature
T = 900 K. Firstly the temperature is gradually raised (in steps of 100 K) till 600 K. Experimentally it is known that there is no hydrogen diffusion till 600 K. At each temperature the system reaches the equilibrium and no diffusion is observed. From this point on, the
T = 600 K configuration is used as the starting configuration for higher temperature simulations at 700 K, 750 K, 800 K and 900 K. It is interesting to note that in this system, the hydrogen diffusion is clearly already started at the temperature
T = 750 K, which is in very good agreement with experimental observations for unmilled MgH
2 without catalyst where hydrogen diffusion starts at
T = 670 K [
24]. This result makes us confident on the reliability of the numerical system. Hydrogen diffusion is complex phenomena that can be studied from analyzing the atomic dynamics in the temperature range
T = 700–800 K.
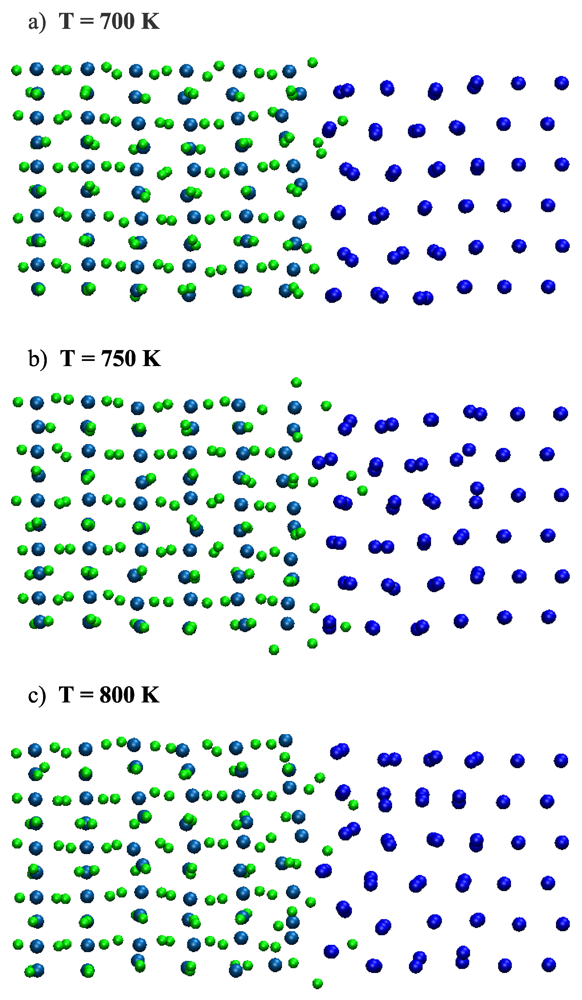
Figure 6 depicts three atomic configurations, from which the influence of the temperature on the displacement of hydrogen atoms is clear. Diffusion of hydrogen atoms starts at
T = 700 K (
Figure 6a). At this temperature there is a tendency of hydrogen atoms to move towards the interface. This movement involves only the outer row of hydrogens. The internal hydrogen atoms move around their positions of equilibrium with a decreasing average width as the distance from the interface increases. At higher temperature,
T = 750 K (
Figure 6b), the tendency of hydrogens to move toward interface involves also internal rows of atoms. Moreover, the hydrogen atoms belonging to these rows diffuse by jumping from one lattice site to the nearest lattice site. At even higher temperature,
T = 800 K (
Figure 6c), the movement of the rows of hydrogens toward the interface is still present but the diffusion by jumping between lattice sites is replaced by hydrogen diffusion toward the interface. To quantify these observations, we report in
Figure 7 the displacements
di (
t) =|
ri(
t)-
ri(0)| of the hydrogen atoms from their initial positions during the molecular dynamics simulation, whereas
ri (0) and
ri (
t) are the initial position of the
i-th hydrogen atom and its position at time
t, respectively.
Figure 6.
Snapshots of Mg-MgH2 interface during molecular dynamics for (a) T = 700 K; (b) T = 750 K; and (c) T = 800 K. H atoms are in green, Mg atoms in the magnesium hydride side are in light blue and Mg atoms in the magnesium side are in dark blue.
Figure 6.
Snapshots of Mg-MgH2 interface during molecular dynamics for (a) T = 700 K; (b) T = 750 K; and (c) T = 800 K. H atoms are in green, Mg atoms in the magnesium hydride side are in light blue and Mg atoms in the magnesium side are in dark blue.
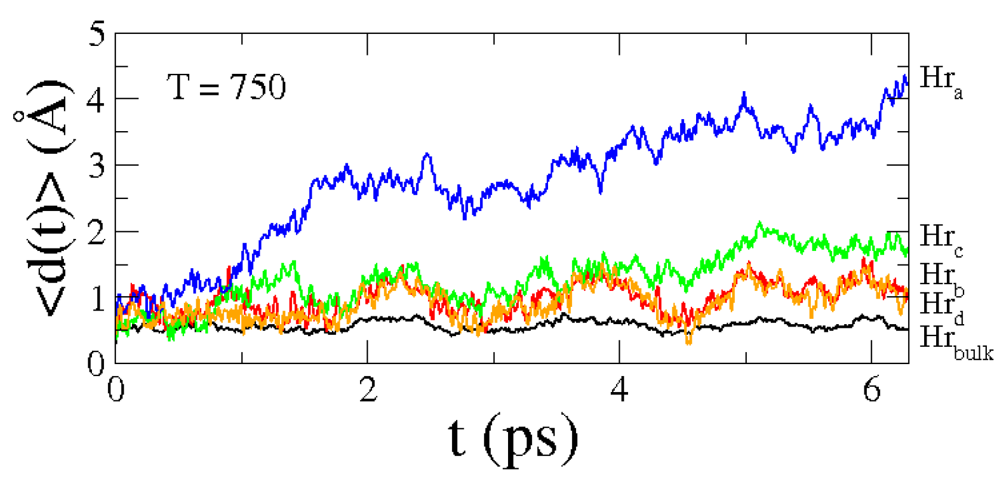
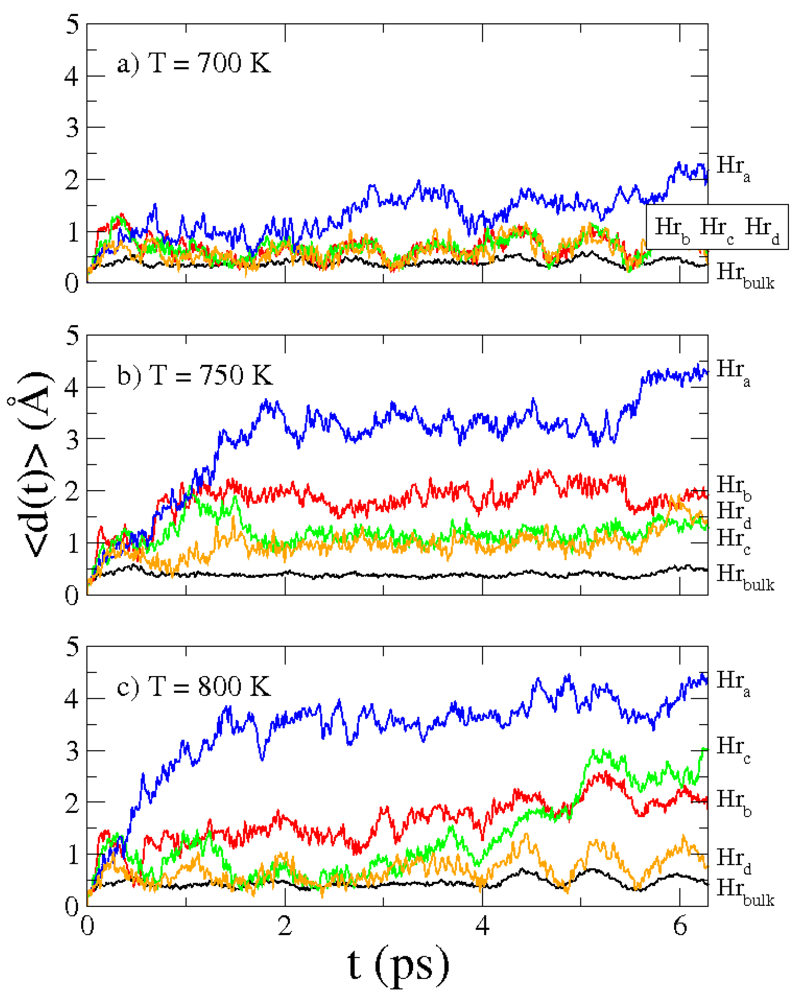
Figure 7.
Average displacements ⟨d(t)⟩ of the group of H atoms Hra (blue line), Hrb (red line), Hrc (green line), Hrd (orange line) and, Hrbulk (black line) for MD simulations at (a) T= 700 K; (b) T = 750 K; and (c) T = 800 K.
Figure 7.
Average displacements ⟨d(t)⟩ of the group of H atoms Hra (blue line), Hrb (red line), Hrc (green line), Hrd (orange line) and, Hrbulk (black line) for MD simulations at (a) T= 700 K; (b) T = 750 K; and (c) T = 800 K.
To better characterize the hydrogen dynamics at the interface, as shown in
Figure 3, five groups of atoms are considered: hydrogen atoms belonging to the outer row
Hra, those that belong to the
Hrb Hrc and
Hrd rows respectively, and all the others
Hrbulk. Averaging the displacements over these group of atoms, the quantities ⟨
d(
t)⟩
Hra, ⟨
d(
t)⟩
Hrb, ⟨
d(
t)⟩
Hrc, ⟨
d(
t)⟩
Hrd and ⟨
d(
t)⟩
Hrbulk are drawn in
Figure 7 in blue line, red line, green line, orange line and black line, respectively. In panels (a), (b) and (c) of
Figure 7 are reported these quantities for
T= 700 K,
T = 750 K and
T = 800 K. For all temperatures the main contribution for hydrogen diffusion is due to the outer atoms (row
Hra) and ⟨
d(
t)⟩
Hra increases with time. Instead, displacements of the "bulk" hydrogens ⟨
d(
t)⟩
Hrbulk are approximately constant (are about 0.5 Å). At
T = 700 K displacements ⟨
d(
t)⟩
Hrb, ⟨
d(
t)⟩
Hrc and ⟨
d(
t)⟩
Hrd are oscillating but do not increase with time. They start to improve with time at higher temperature, and at
T = 750 K the growth is faster and greater with respect to
T = 800 K. We associate this behaviour to the pronounced feature of hydrogen atoms to jump from one lattice site to the nearest lattice site at
T = 750 K. At these temperatures, diffusion of hydrogen atoms in the interface is clearly visible in the MD simulations. It is worth noting that no H atoms diffuse into the Mg lattice, which is in agreement with experimental evidence [
6].
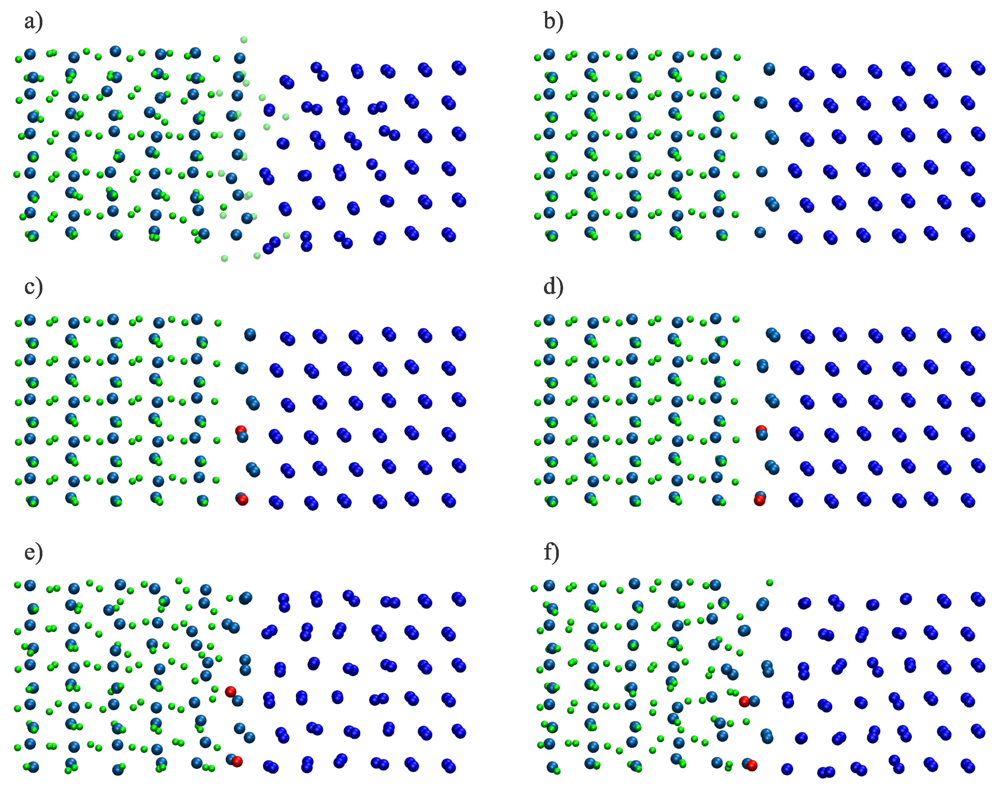
6. Evolution of the Desorption
To understand the behaviour of the system after the desorption of the outer hydrogen atoms, starting from the last configuration of MD simulation of the interface at
T= 750 K, shown in
Figure 8a, we removed by hand the hydrogens belonging to the rows
Hra,
Hrb Hrc and
Hrd (see
Figure 3). These atoms are shadowed in panel (a) of
Figure 8. Then, from this new system, a new ionic relaxation is performed as shown in
Figure 8b. The ionic relaxation picks out how the magnesium atoms of the hydride deprived of hydrogens adapt to hcp magnesium bulk of the right side of the system. It is worth remarking that two Mg atoms are missing for a complete hcp magnesium free surface. To restore the good stoichiometry of the system, from the former configuration (
Figure 8b) we added by hand two Mg atoms (
Figure 8c) and performed a geometry optimization again, with the complete reconstruction of the hcp magnesium free surface and the creation of a "new" interface (
Figure 8d).
Figure 8.
Snapshots for the interface reconstitution. (a) Final configuration of MD simulation of the interface at T = 750 K. H atoms removed are shadowed; (b) configuration after geometry optimization without outer hydrogens; (c) configuration with two Mg atoms added (in red); (d) configuration after geometry optimization with two Mg atoms added and reconstruction of the "new" interface; (e) and (f) two snapshots of the MD simulation at T = 750 K.
Subsequently we performed MD simulation at
T= 750 K. In panels (e) and (f) of
Figure 8 are shown two snapshots of the MD simulation. These snapshots display the diffusion of hydrogen atoms in the "new" interface, with the "old" magnesium atoms of the hydride moving around the lattice position of hcp magnesium slab. Finally, to investigate the hydrogen dynamics at the new interface, in
Figure 9 we presented similar graphs of those that are shown in
Figure 7. Like previously, displacements of the "bulk" hydrogens (black line) are approximately constant and the main contribution for hydrogen diffusion is still due to the outer atoms (blue line, red line, green line and orange line). In conclusion, it is evident that the two interfaces produce the same results.
Figure 9.
Average displacements ⟨d(t)⟩ of the group of H atoms Hra (blue line), Hrb (red line), Hrc (green line), Hrd (orange line) and, Hrbulk (black line) for MD simulations at T = 750 K, for the "new" interface.
Figure 9.
Average displacements ⟨d(t)⟩ of the group of H atoms Hra (blue line), Hrb (red line), Hrc (green line), Hrd (orange line) and, Hrbulk (black line) for MD simulations at T = 750 K, for the "new" interface.


 and
and  . Keeping fixed the aMgH2 lattice constant, a small distortion in the Mg and MgH2 cell parameters is needed to obtain fully commensurable surfaces: the aMg and cMg parameters are thus scaled of about 1% and 2% respectively.


 is half total energy for the hydrogen molecule and Einter is total energy for the Mg-MgH2 interface after geometry optimization. The calculated values of ΔH are shown on third row of the Table 3. From these data we observe the inverse relation between the work of adhesion (W) and the formation energy (ΔH). The central position is the most energetically favourable for the desorption (the biggest ΔH and the lowest W) and moreover there is symmetry with respect to that central position.