Article

Molecular Dynamics Simulations of Hydroxyapatite Nanopores in Contact with Electrolyte Solutions: The Effect of Nanoconfinement and Solvated Ions on the Surface Reactivity and the Structural, Dynamical, and Vibrational Properties of Water

1
Queen Mary University of London, School of Biological and Chemical Sciences, Mile End Road, E1 4NS London, UK
2
Université Paris-Est, Laboratoire Modélisation et Simulation Multi Echelle, MSME UMR 8208 CNRS, 94010 Créteil cedex, France
3
Sri Ramaswamy Memorial University, SRM Research Institute and Department of Chemistry, Kattankulathur 603203, Tamil Nadu, India
4
Université Paris-Est, Laboratoire Modélisation et Simulation Multi Echelle, MSME UMR 8208 CNRS, 77454 Marne-la-Vallée cedex 2, France
5
Cardiff University, School of Chemistry, Main Building, Park Place, Cardiff CF10 3AT, UK
*
Authors to whom correspondence should be addressed.
Crystals 2017, 7(2), 57; https://doi.org/10.3390/cryst7020057
Submission received: 23 October 2016 / Revised: 23 January 2017 / Accepted: 10 February 2017 / Published: 18 February 2017
(This article belongs to the Special Issue Effects of Confinement and Topography on Crystallization)

Abstract

:
Hydroxyapatite, the main mineral phase of mammalian tooth enamel and bone, grows within nanoconfined environments and in contact with aqueous solutions that are rich in ions. Hydroxyapatite nanopores of different pore sizes (20 Å ≤ H ≤ 110 Å, where H is the size of the nanopore) in contact with liquid water and aqueous electrolyte solutions (CaCl2 (aq) and CaF2 (aq)) were investigated using molecular dynamics simulations to quantify the effect of nanoconfinement and solvated ions on the surface reactivity and the structural and dynamical properties of water. The combined effect of solution composition and nanoconfinement significantly slows the self-diffusion coefficient of water molecules compared with bulk liquid. Analysis of the pair and angular distribution functions, distribution of hydrogen bonds, velocity autocorrelation functions, and power spectra of water shows that solution composition and nanoconfinement in particular enhance the rigidity of the water hydrogen bonding network. Calculation of the water exchange events in the coordination of calcium ions reveals that the dynamics of water molecules at the HAP–solution interface decreases substantially with the degree of confinement. Ions in solution also reduce the water dynamics at the surface calcium sites. Together, these changes in the properties of water impart an overall rigidifying effect on the solvent network and reduce the reactivity at the hydroxyapatite-solution interface. Since the process of surface-cation-dehydration governs the kinetics of the reactions occurring at mineral surfaces, such as adsorption and crystal growth, this work shows how nanoconfinement and solvation environment influence the molecular-level events surrounding the crystallization of hydroxyapatite.

1. Introduction

Crystallization is a phenomenon that is strongly dependent on the environment in which it occurs. Specifically, it is well-recognized that many features of crystal growth are affected by confinement [1,2,3,4,5,6,7] and solution composition [2,8,9,10,11,12]. Confinement can enable control over size, polymorphism and orientation, single crystal/polycrystalline structure, and morphology [13]. At the same time, modification of the solvation environment through the addition to the solution of organics [14], peptides [15], polymers [16], or simple ionic salts [17,18,19,20], can influence the kinetics and thermodynamics of crystal nucleation and growth. A perfect example of a crystallization process that occurs within a confined environment and in multicomponent aqueous solutions is biomineralization [2,21]. In particular, hydroxyapatite (HAP), molecular unit formula (Ca10(PO4)6(OH)2), is arguably the most important biomineral as it represents the main constituent of bone [22].
It is commonly accepted that bone can be described by three main levels of porosity [23], which are nested hierarchically one inside another as a set of Russian dolls in microcirculatory pathways [24]. The macroscopic porous network corresponds to the vascular (or Haversian) porosity, which consists of the Havers and Volkmann canals (typical diameter of 50 µm). The mesoscale is the lacunar-canalicular porosity made of the osteocytic lacunae and canaliculi channels. This porosity contains the osteocytes’ stellar network of bone (typical pore size of 100 nm) and the smallest porosity level in bone corresponds to the spaces inside the collagen-apatite structure (typical pore size of 5 nm). At this nanoconfined environment, water strongly interacts with the ionic crystal [25,26] and plays a key role in structuring the apatite mineral [27,28] and during mineralization [29] by acting as a prominent charge carrier, maintaining the pH of the medium, and transporting ions [26].
Determining the structure, dynamics, and reactivity of fluids in HAP nanopores is therefore of great interest to improve our understanding of bone. Molecular dynamics (MD) simulations of mineral-water interfaces can provide a unique probe of the processes controlling crystallization [27], such as the water exchange around the constituent cations (Ca2+ in hydroxyapatite), which is generally accepted to be the rate limiting step to crystal growth from aqueous solution of ionic crystals [28,29,30].
Previous computational investigations of HAP focused on its bulk and surface properties [31,32,33] as well as on the early stages of homogeneous nucleation from solution [34,35], but the collective effect of nanoconfinement and solution chemistry on the molecular-level processes controlling the surface reactivity of HAP has been entirely overlooked by molecular modelling. This aspect is particularly relevant to further our understanding of bone formation, which begins with the growth of ultrathin HAP platelets within confined volumes in the collagen fibrils [36,37] and in aqueous environments that are far from pure water but rich in ions.
This study reports MD simulations of HAP nanopores of different pore sizes (20 Å ≤ H ≤ 110 Å) in contact with liquid water and aqueous electrolyte solutions (CaCl2 (aq) and CaF2 (aq)). The aim is to quantify the effect of confinement and solution chemistry on the frequency of hydration–dehydration around the calcium surface sites as well as on the structural, dynamical, and vibrational properties of water. The realism of this simulation set-up represents a significant improvement over previous computational work on hydrated HAP.

2. Computational Methods

2.1. Simulation Details

MD simulations were performed using version 4.03.3 of the DL_POLY computational chemistry package [38]. The velocity Verlet algorithm with a time step of 0.1 fs was used to integrate the equations of motion. The Melchionna modification of the Nosé-Hoover algorithm [39] was used to maintain a temperature of 300 K and a pressure of 105 Pa (1 bar) with 0.5 ps for the thermostat (NPT ensemble) and barostat relaxation times. The electrostatic forces were calculated by means of the Smooth Particle Mesh Ewald method [40]. A 9.0 Å cut-off was used for the real-space part of the Ewald sum and the Van der Waals forces. Periodic boundary conditions were applied in all three directions of the unit cell.

2.2. Interatomic Potential Model

A combination of potential models was employed to describe the interatomic interactions in this multi-component system. The interatomic potential model developed by de Leeuw for modelling apatite crystals [41] was used for HAP. In this forcefield, phosphate and hydroxyl group bonds are described as the sum of a Morse and a Coulombic potential, phosphate bond angles by a harmonic potential, and non-bonded interactions by Buckingham potentials. This forcefield makes use of a shell model in which each oxygen anion in the phosphate and hydroxyl groups consists of both a core and a massless shell connected by a spring, in order to model the atom’s electronic polarizability. The water molecules were described using the simple point charge (SPC/E) model [42] because it gives a density, radial distribution functions, self-diffusion coefficient for water, and hydrogen-bond dynamics in good agreement with the experiment [42,43]. HAP–water interactions were described using non-bonded potentials derived in previous MD studies [44,45], which are compatible with the current HAP shell model. The interactions between Ca2+–X and X–X pairs in solution (where X designates Cl or F), and between the ions in solution and the phosphate and hydroxyl groups of HAP were described using the Buckingham potentials developed by Rabone and de Leeuw for modeling natural apatite crystals [46]. Finally, the halide–water interactions were described using the force field parameters derived by Dang [47], because it provides an accurate description of the diffusion coefficients of halide ions, and of the dynamical and structural properties of the hydrogen bonding network [48,49,50,51,52]. The list of parameters and an assessment of the forcefield used in this work are reported in the Supplementary Materials, Sections S1 and S2.

2.3. Simulation Protocol

Hydroxyapatite, (Ca10(PO4)6(OH)2), is viewed as a hexagonal primitive cell with P63/m space group. The initial coordinates and crystal cell parameters were taken from Sudarsanan and Young [53] and a 3 × 3 × 4 supercell was then generated to conduct the simulations. HAP nanopores with initial pore sizes, denoted by H, equal to 20, 40, 60, and 110 Å were generated by varying the c-axis of the crystal, with the resulting surface which corresponds to the (0001) basal plane. This model corresponds, to a good approximation, to a pore because at the atomic scale the pore surface will be relatively flat. More complex surfaces will be considered in future work. The vacuum was filled with water corresponding to the experimental density of 1 g·mol−1. All generated systems were equilibrated for 50 ps in the microcanonical (NVE) ensemble, followed by 100 ps in the NPT ensemble, where the volume of the HAP nanopores was monitored to verify its convergence and confirm that the system was at equilibrium. Finally, the production phase in the NPT ensemble lasted for 3 to 4 ns. Starting from the last configuration of the HAP (H = 60 Å)–water system, aqueous CaX2 (X = F and Cl) solutions with concentrations ranging from 0 to 1 mol·kg−1 were generated by randomly replacing N water molecules with N/3 calcium ions and 2N/3 anions. For each HAP-solution system, 0.5 ns of equilibration were followed by 3 to 4 ns of production (NPT ensemble). Figure 1 displays the equilibrated structure of the HAP (H = 60 Å)–water system. SPC/E bulk water and aqueous CaCl2 solutions were also considered. The number of atoms and concentrations of the systems considered in the present study are listed in Table 1.

2.4. Analysis of the Simulation Data

Interatomic bonding pairs were analyzed through the generation of radial distribution functions (RDF), gαβ(r), which represent the probability, relative to a random distribution, of finding atoms of types α and β separated by a distance r [54].
The number of hydrogen bonds (HBs) between water molecules in bulk solutions and within HAP nanopores was extracted from the MD trajectories. In particular, in order to determine the existence of an HB between two water molecules, the following three geometrical criteria were applied [55]: (i) the oxygen distance is less than 3.5 Å; (ii) the intermolecular hydrogen–oxygen distance is less than 2.45 Å; (iii) the oxygen–oxygen–hydrogen angle is less than 30°.
The self-diffusion scalar coefficient of water molecules (DW) was calculated using the mean square displacement (MSD) utility of the DL_POLY code, which accurately determines diffusion coefficients by processing the trajectory file generated and computing the mean square displacement for the different atomic species in the simulation using multiple time origins [38,54].
Vibrational properties of the water molecules relied on the calculation of the velocity-autocorrelation function (VACF) of oxygen and hydrogen atoms. VACF is defined as follows:
V A C F ( t ) = 1 N O N a t m j = 1 N O i = 1 N a t m v i ( t j ) × v i ( t j + t )
where v i is the velocity vector of O or H atoms in the water molecule i , N O is the number of time origins spaced by t, and N a t m is the number of O or H atoms. From the Fourier transform of the VACF of each atom, the vibrational density of states (VDOS) of each atom was then calculated [54].
The dynamics of the first hydration shell of calcium ions in solution and in the HAP surface were characterized using the “direct” method proposed by Hofer and co-workers [56]. This method was successfully applied for, among other purposes, the characterization of the dynamics of the coordination shell of hydrated alkaline earth metal ions and their carbonate and bicarbonate complexes [57], as well as the quantification of the water exchange frequency at structurally distinct calcium sites on the calcite surface [58]. The MD trajectories were analyzed for water molecule movements and whenever a water molecule crossed the boundary of the calcium coordination shell, its path was followed; if its new position outside or inside this shell lasted for more than 0.5 ps, the event was counted as a real exchange event [56]. For calcium ions, the first shell was defined to fall within the first minimum of the calcium versus water oxygen (Ca–OW) RDF (3.3 Å).
The speciation of Ca2+ and X in solution was determined using the following ion-pairing criteria: (i) a contact ion pair (CIP) when Ca2+ and X are in direct physical contact (rCa-Cl < 3.5 Å and rCa-F < 3.0 Å); (ii) a solvent-shared ion pair (SSHIP) when Ca2+ and X (X = Cl or F) are separated by one water molecule; (iii) a solvent separated ion pair (SSIP) when Ca2+ and X are separated by two water molecules; and (iv) free ions (FIP) when the above conditions are not met and the cation and anion are fully hydrated beyond the second hydration shell.

3. Results and Discussion

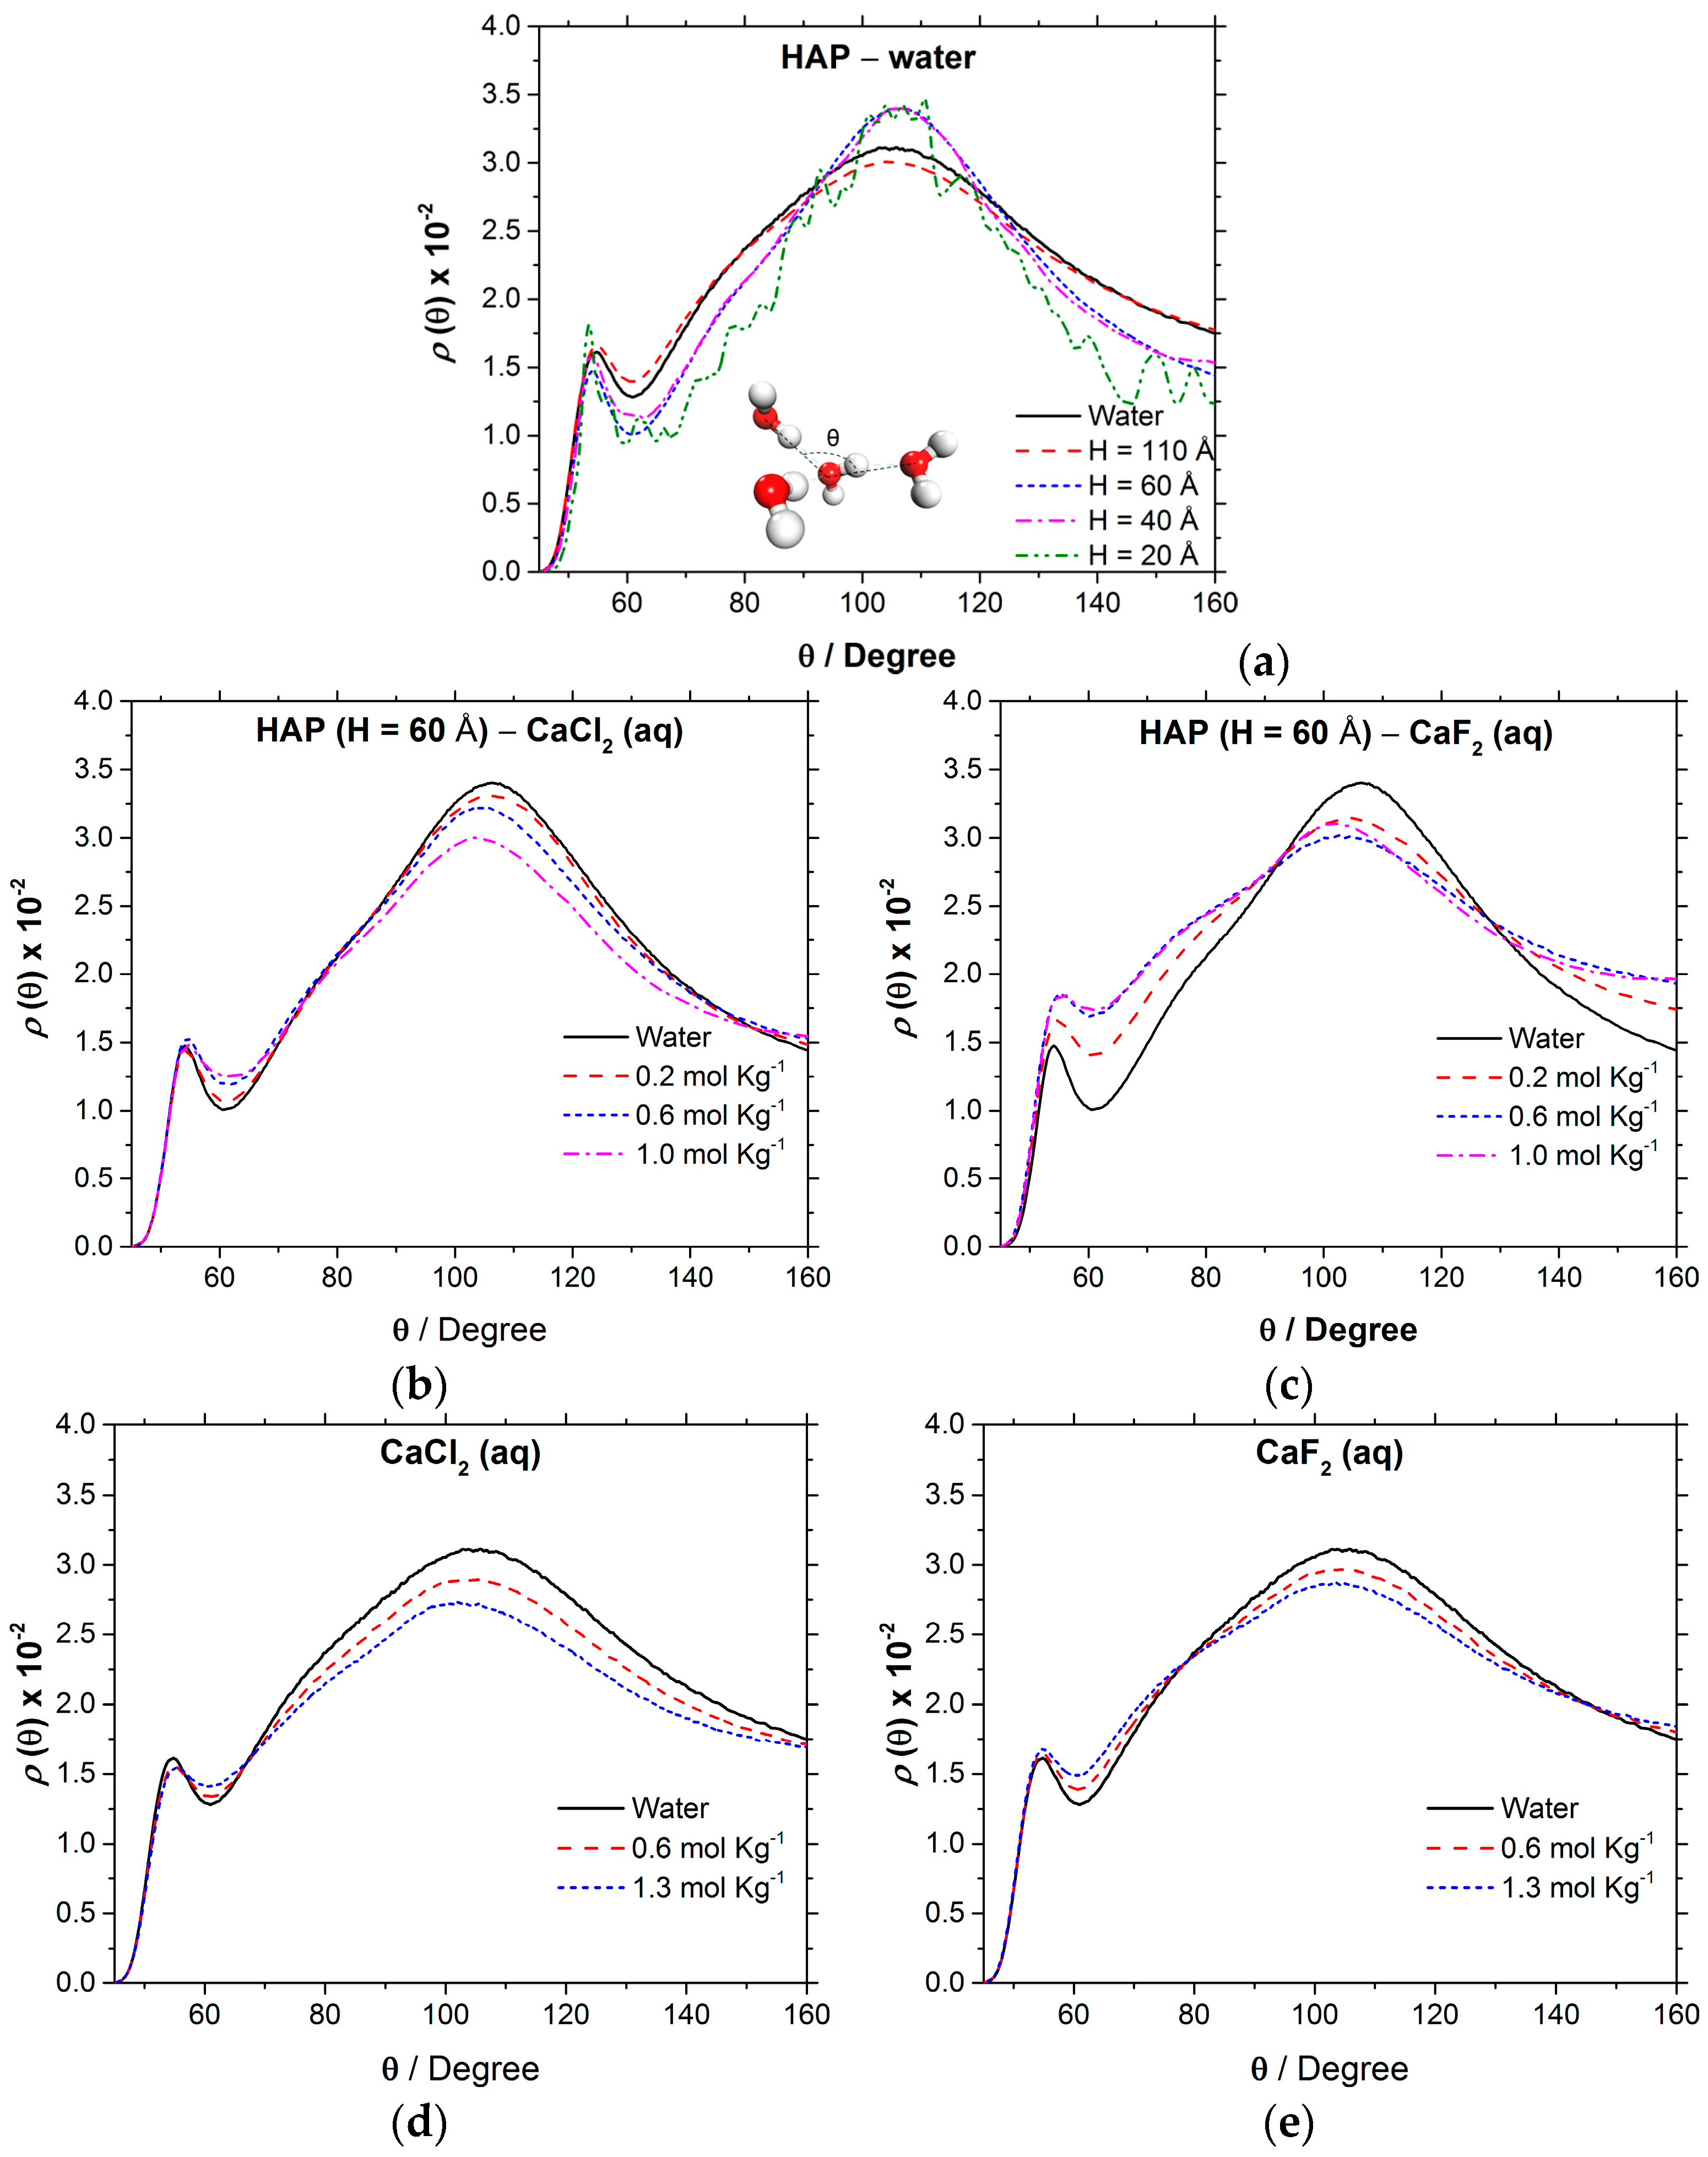
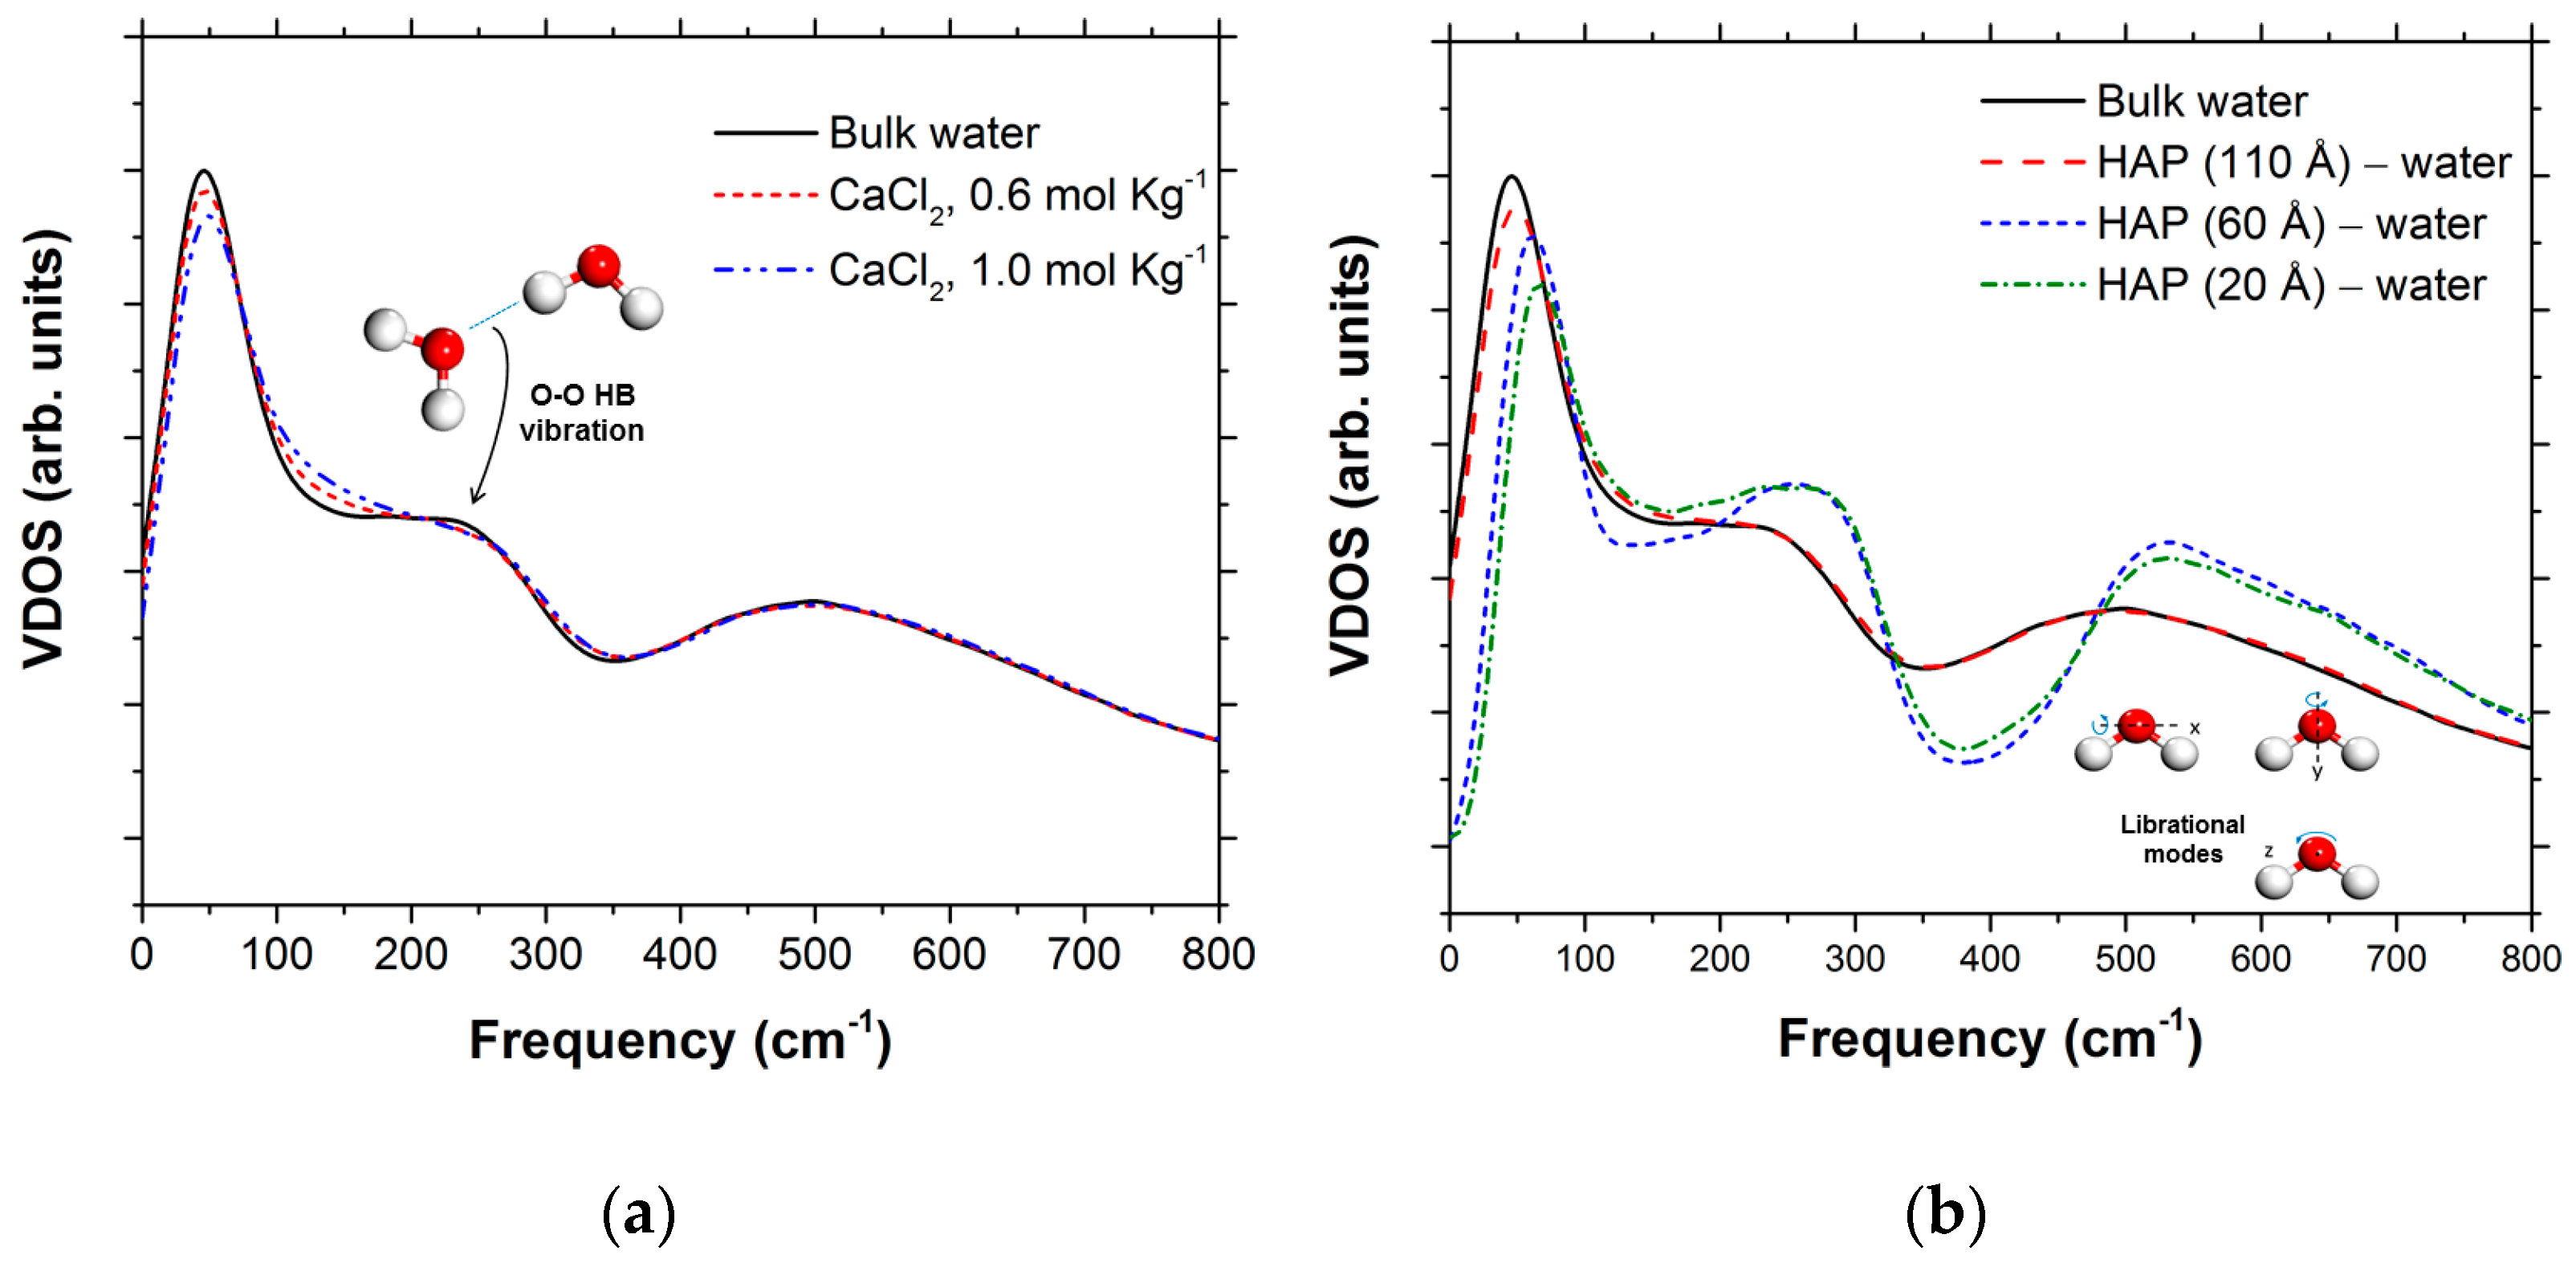
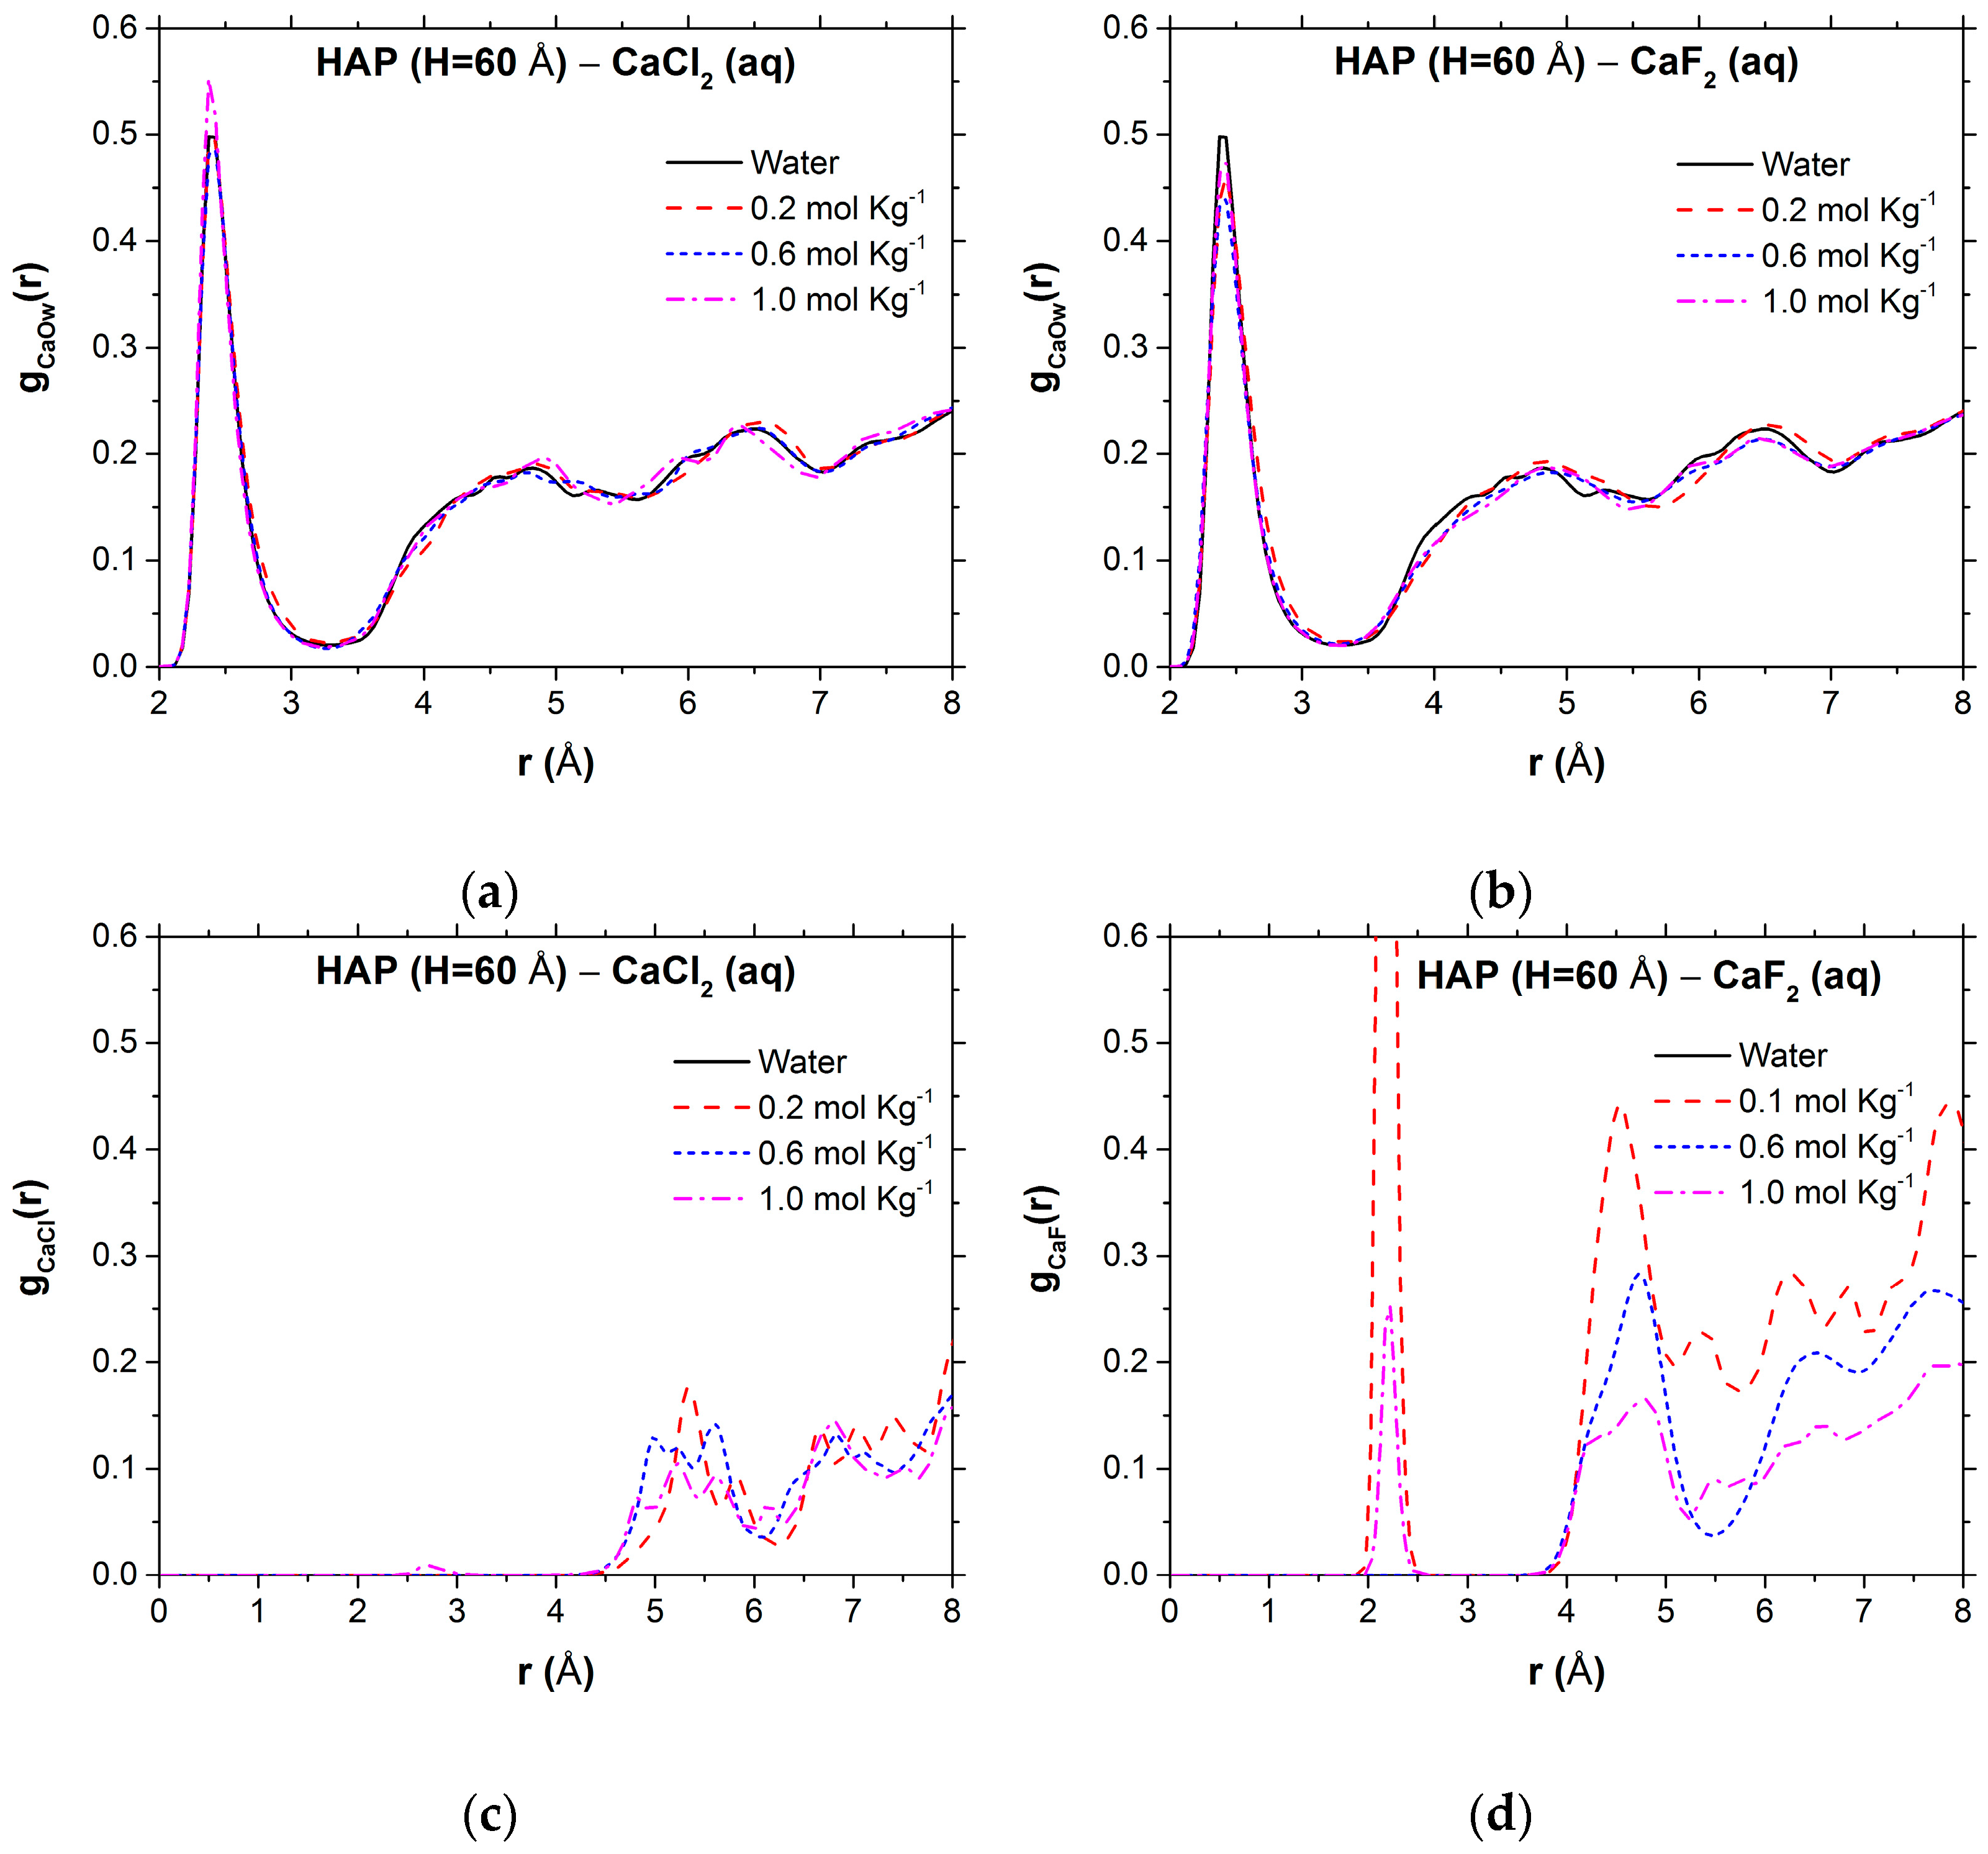
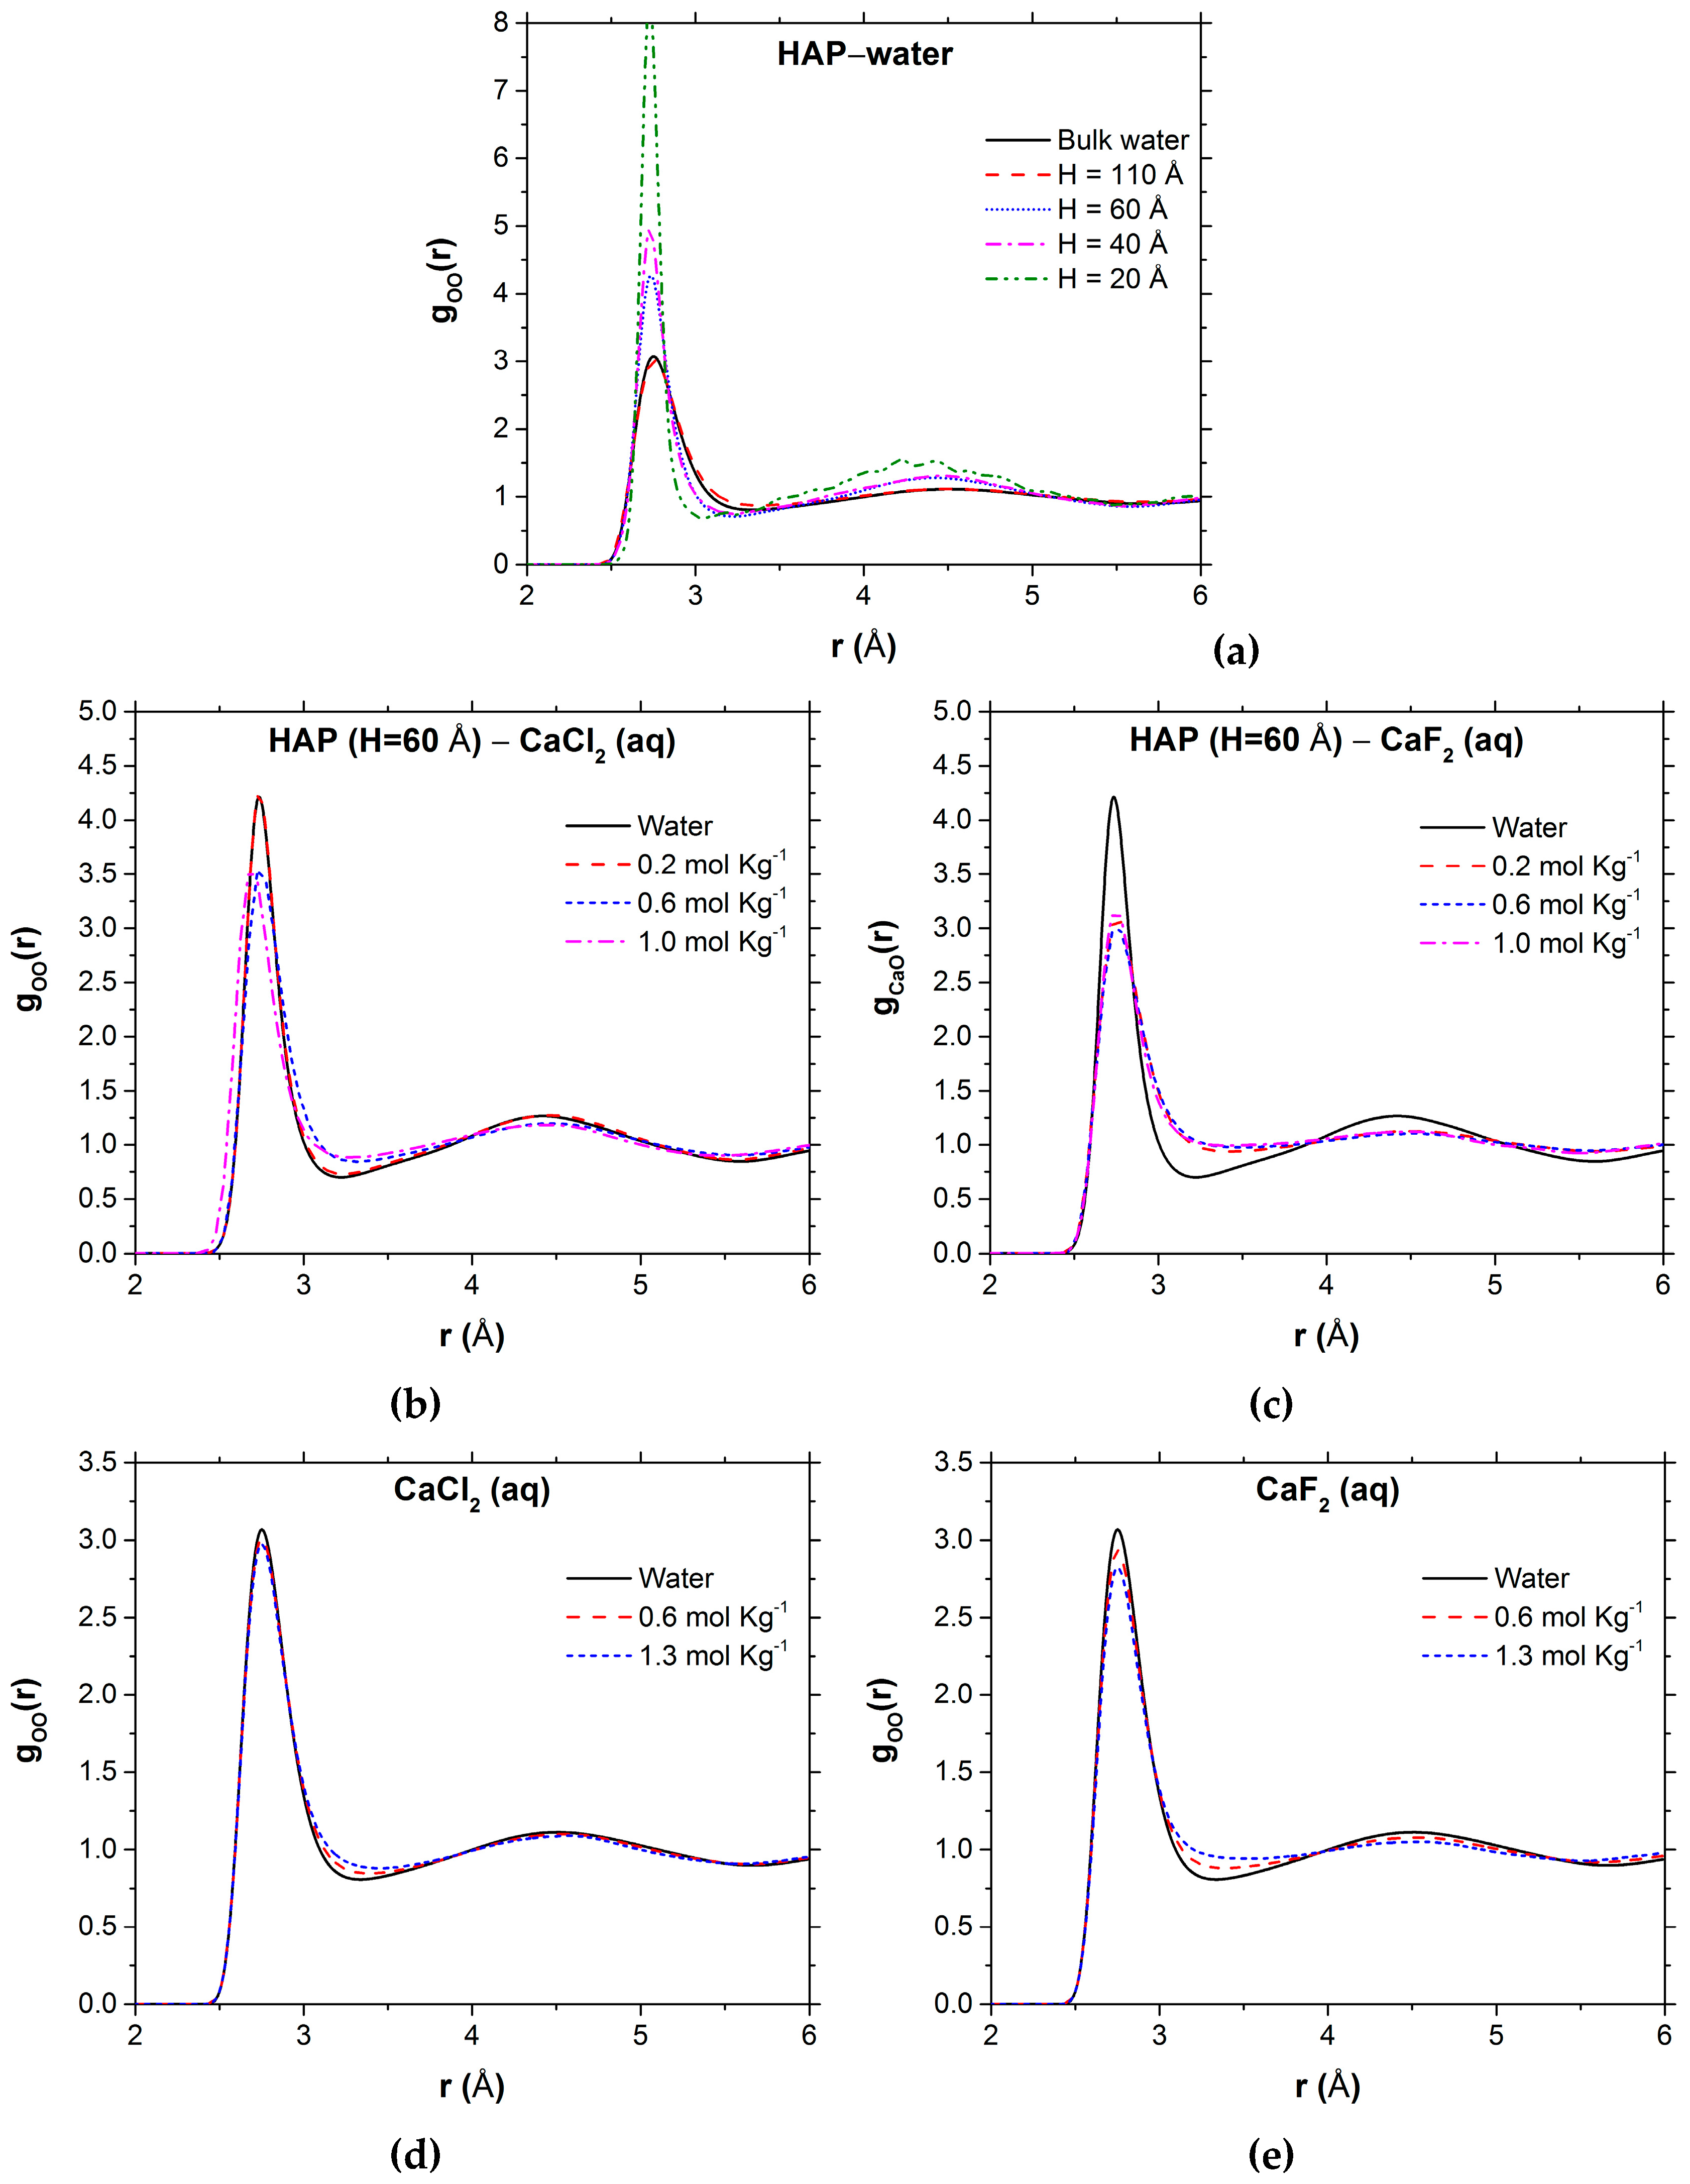
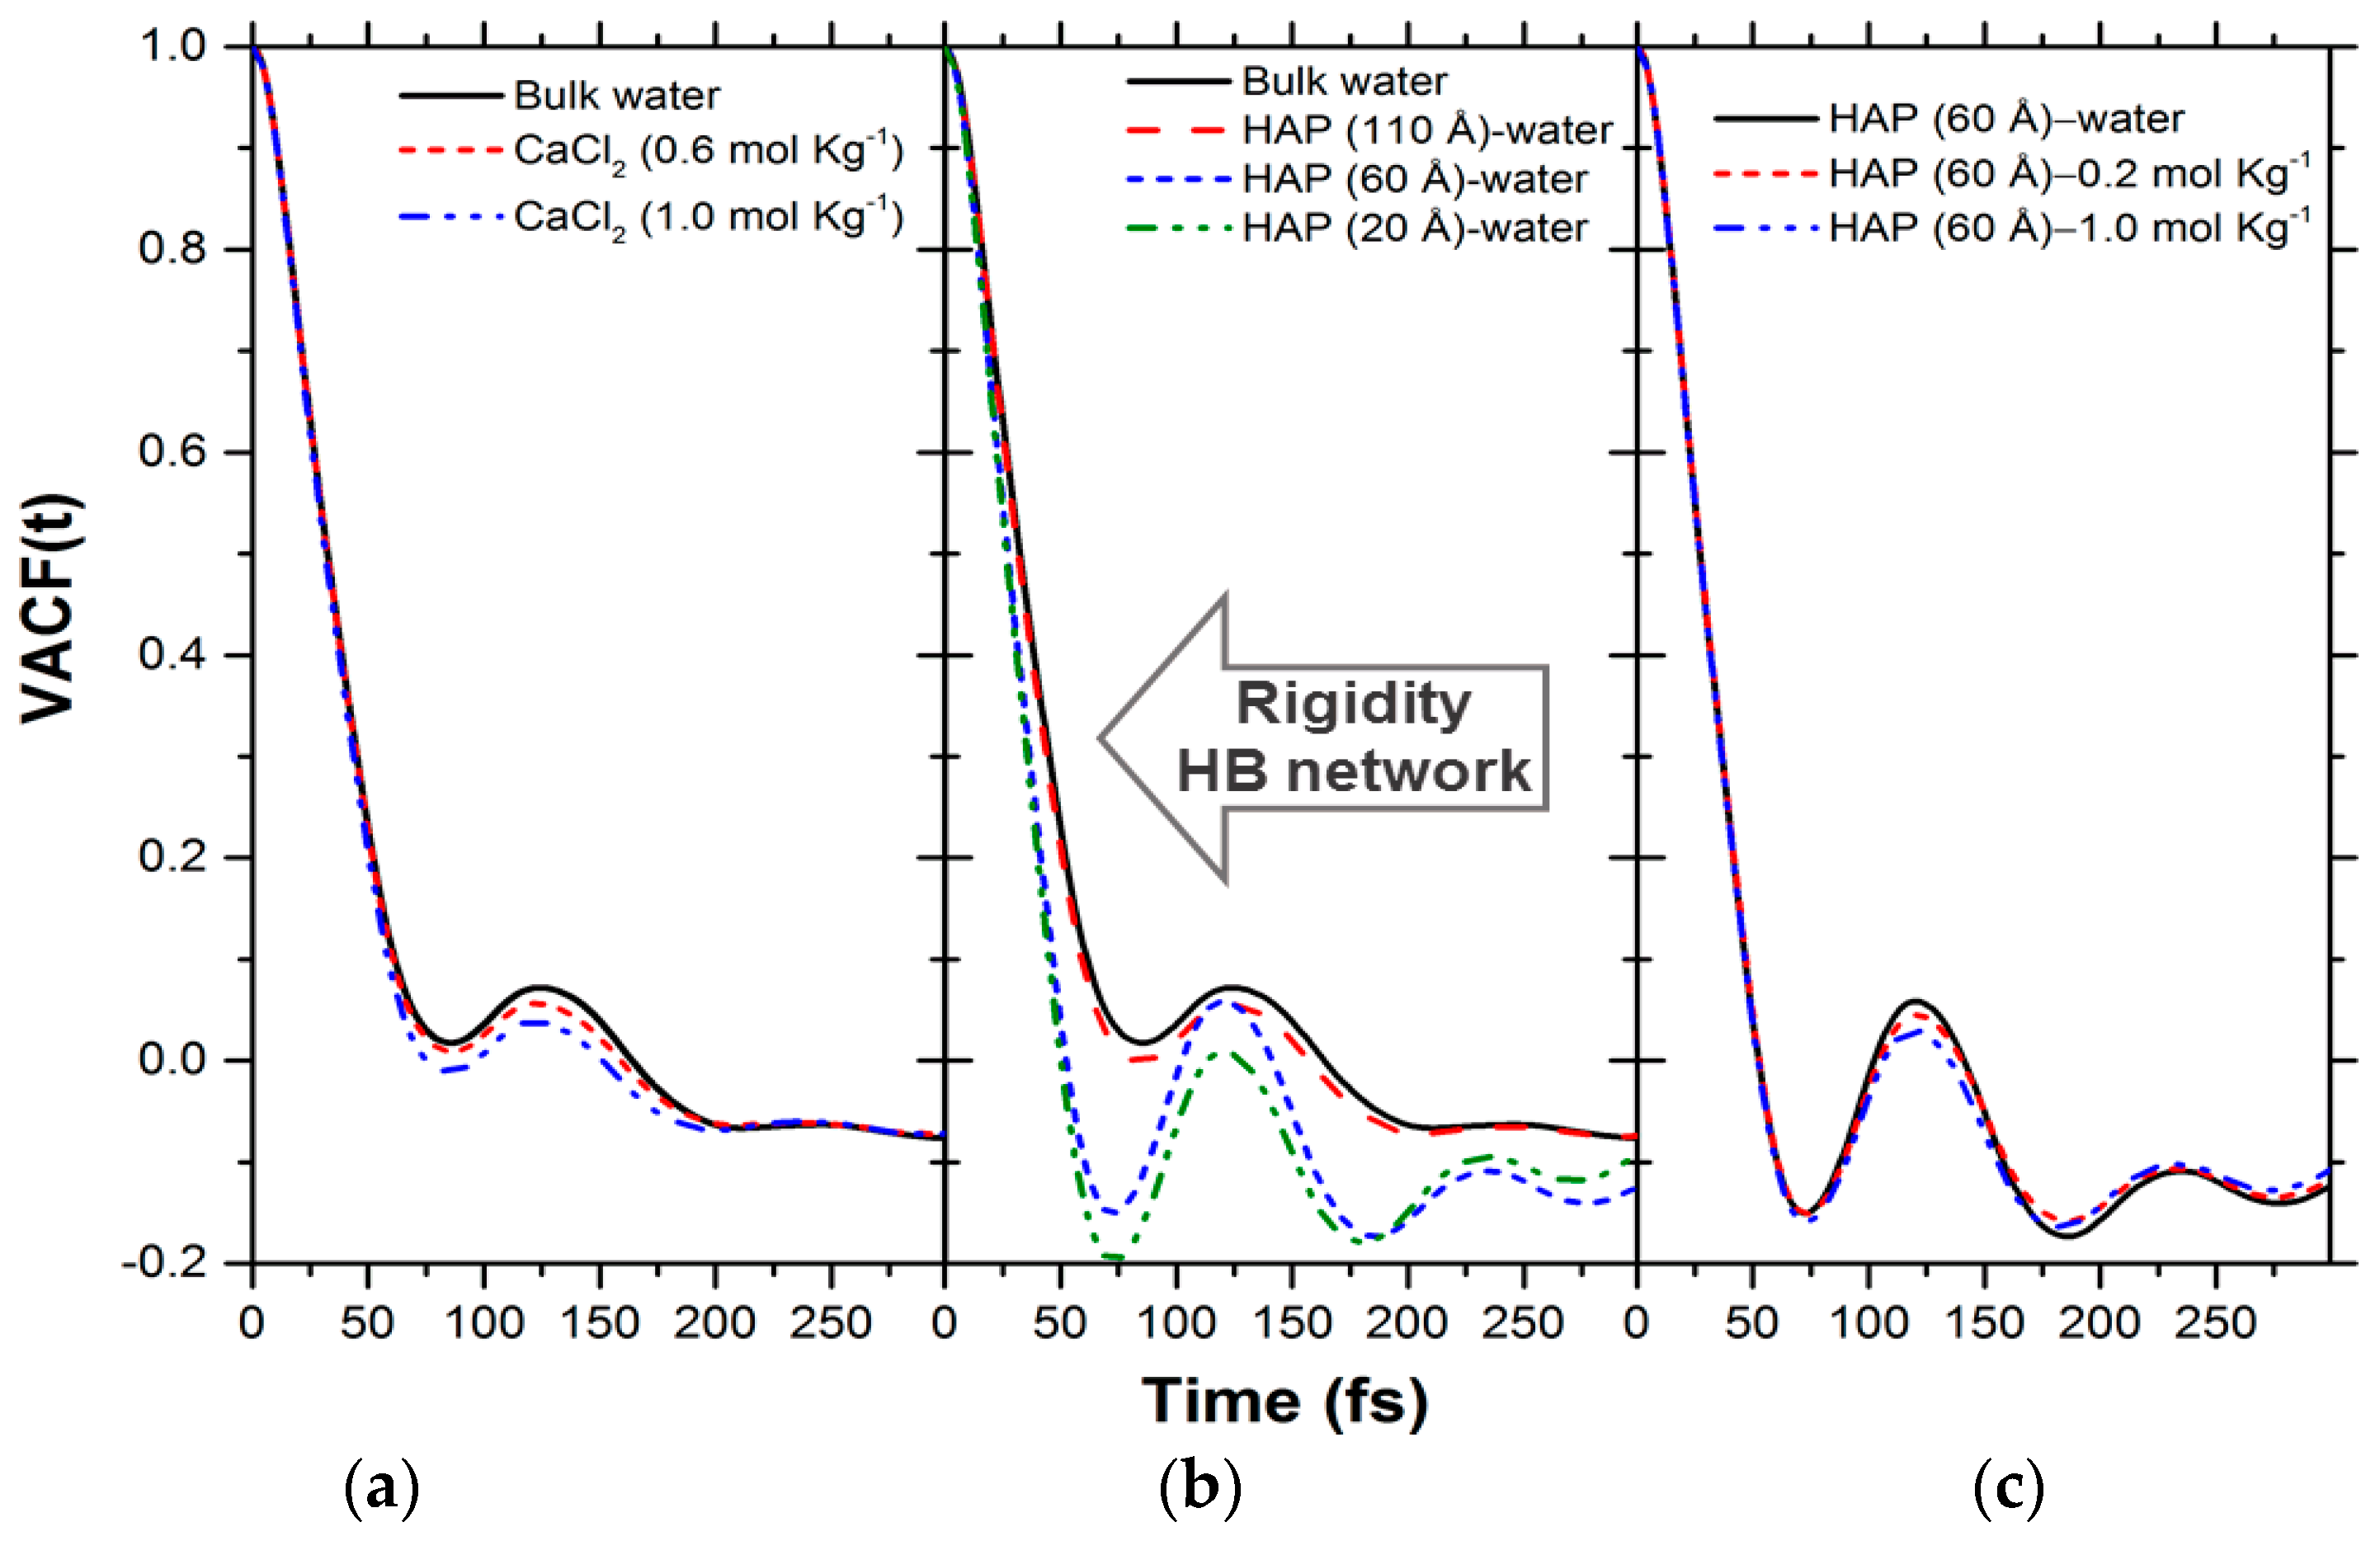
3.1. Structural, Dynamical, and Vibrational Properties of Water

Figure 2 reports the effect of confinement and salt concentration on the structure of water, which was quantified in terms of the water oxygen–oxygen (O–O) radial distribution function (RDF). In Figure 2a, the location of the first peak, which corresponds to the average position of two H-bonded water molecules, is not significantly affected by the level of water confinement in the HAP nanopores. However, as the size of the nanopore decreases, the intensity of the first peak becomes more pronounced and the position of the second maximum moves to lower distances. This behavior indicates structuring of water in the nanopores compared with bulk liquid. On the other hand, the presence of electrolytes in the solutions in contact with HAP nanopores (Figure 2b,c) and in bulk solutions (Figure 2d,e) decrease the first minima and increase the first and second maxima in the O–O RDFs. CaCl2 and CaF2 salts therefore disrupt the structure of water. In particular, the effect on the O–O structure is more pronounced in CaF2 (aq), where for the 1.0 mol·kg−1 solution the second shell has collapsed into the first one (Figure 2c). A similar behavior in the interatomic distances of water was observed from MD simulations of NaCl and NaF aqueous solutions [45]. The stronger electrostatic field of F compared with Cl can be used to explain the more pronounced effect of fluorine ions on the structure of water.
Further insights into the combined effect of confinement and solution composition can be determined in Figure 3 from the angular distribution functions (ADF), denoted by ρ(θ), of the O–O–O trios between three water molecules connected by hydrogen bonding. Each water molecule can form two HBs involving their own hydrogen atoms and two further HBs by utilizing the hydrogen atoms attached to neighboring water molecules (Figure 3). These four HBs optimally arrange themselves tetrahedrally (O–O–O angle of 109.5°) around each water molecule as found in ordinary ice. In pure water, the function ρ(θ) is centered at 109.5°, which is an indication of the local tetrahedral clustering. Another indication of water structuring in HAP nanopores is the narrowing of the angular distribution around 109.5°, especially for H = 20 Å and 40 Å. The presence in solution of calcium and chloride ions disrupts the orientational order in the hydrogen-bonding network and shifts the distribution of the O–O–O angle to lower values.
In order to rationalize the impact of nanopore confinement and salt concentration on the arrangement of the water molecules, the MD trajectories were analyzed to determine the distribution of the number of HBs. Table 2 shows that in bulk SPC/E water, the average number of HBs per water molecule is 3.53. This result is in very good agreement with the experimental value of 3.58 obtained from neutron diffraction data [59]. Confinement of water and, in particular, the presence of electrolytes reduce the average HBs per water molecule. The percentage of molecules that form four HBs decreases from 51% in pure water to 44% in the 0.6 mol·kg−1 CaCl2 solution, and to 38% in the 1.3 mol·kg−1 CaCl2 solution. Moreover, the number of molecules that form only two HBs is double of that in pure water (see Table 2). Similar behavior is observed for the CaF2 solutions.
Nanoconfinement also affects the water H-bonding network. In the aqueous solutions within the HAP nanopores, water molecules forming three HBs decrease, and those involved in only two HBs substantially increase compared with bulk water (see Table 2), which explains the deviation from ideal tetrahedrality (109.5°) in the O–O–O ADF profiles reported in Figure 3. In particular, the average number of HBs decreases to only 3.3 per water molecule in the HAP (H = 20 Å) nanopores. Notice also the average value of 3.10 in the 1.9 mol·kg−1 CaF2 solutions within the HAP (H = 60 Å) nanopore, which is due to a substantial decrease of water molecules forming four HBs (40.8% compared with 51.3% in bulk water) and an increase of molecules forming only two (17.2%) and three (27.3%) HBs. This explains the broadening in CaF2 solutions of the O–O–O ADF in CaF2 (Figure 3c).
The self-diffusion coeffiecients of oxygen water, denoted by DW, were used to quantify the effect of salt composition and nanoconfinement on the dynamics of water (Table 3). The value of DW for bulk SPC/E water is 25.8 × 10⁻¹⁰ m2·s−1, in good agreement with previous work [60]. In bulk CaCl2 and CaF2 solutions there is a marked decrease in water diffusivity, which is substantially higher than in aqueous alkali halide solutions [61]. For example, in 1.9 mol·kg−1 NaCl (aq) the value of DW is 22.0 × 10⁻¹⁰ m2·s−1, which is higher than the value of DW (16.3 × 10⁻¹⁰ m2·s−1) in the 1.3 mol·kg−1 CaCl2 (aq). This result can be rationalized in terms of the stronger coordination of water molecules to Ca2+ compared with Na+. In fact, the mean residence time (MRT) of water molecules in the first hydration shell of Ca2+ is in the range of 23–105 ps (depending on the interatomic potential model used to describe the calcium-water interaction [57,62,63]), whereas the MRT of Na+ is only 8 ps [61]. This implies that the hydration shell of the sodium ion is more labile than that of calcium ions. Previous computational studies showed that in nanoconfined environments the diffusion of water is considerably slower than in the bulk [63,64]. However, compared with simulations of graphene oxide layers [63], where the water diffusion in a layer spacing of 15 Å converged to that of bulk water, in the HAP (H = 110 Å)–water system the value of DW (19.3 × 10⁻¹⁰ m2·s−1) is still 15% lower than in the bulk water (see Table 3). In the HAP (H = 40 Å) and HAP (60 Å) systems, which have sizes more relevant to the nanopores found in the osteocytes’ stellar network of bone and in the spaces inside the collagen-apatite [25], the self-diffusion coefficients are 5.4 × 10⁻¹⁰ and 2.9 × 10⁻¹⁰ m2·s−1, respectively, which are about 80% lower than in bulk water. The combined effect of electrolytes and nanoconfinement in the HAP (H = 60 Å)–aqueous CaX2 solutions (X = Cl and F) systems further decreases the dynamics of water (see Table 3).
Further insights into the dynamics of water are obtained from the analysis of the velocity-autocorrelation function (VACF) of the water oxygen atoms. The occurrence of a minimum in the VACF profile results from the so-called “cage effect” for the tagged particle—i.e., it takes some time for the particle to escape from the cage formed by its surrounding neighbors [65]. The oscillatory behavior and position of the first minimum in the VACF profile can therefore be used to probe the interaction of the tagged particle with the surrounding cage [66,67]. In the VACF profile of bulk water (Figure 4a), the first minimum located at 85 fs is followed by an oscillation attributed to the intermolecular O–O stretch vibration of two water molecules linked by H-bonding [68]. Changes in the profiles of the VACF of water with solution composition and nanoconfinement can be used as descriptors of water mobility. Nanoconfinement in particular leads to a marked oscillatory behavior of the VACF (Figure 4b), which is indicative of strengthening of the HB water network on going from H = 110 Å to H = 20 Å. The presence in solution of calcium and chloride ions causes a similar but less pronounced effect on the VACF profiles (Figure 4c).
Figure 5 reports the simulated total vibrational density of states (VDOS) of water, which was computed as the sum of the Fourier transform of the VACF of the oxygen and hydrogen atoms. At low frequencies, the spectrum of liquid water has two characteristic peaks resulting from the H-bonding network, one centered at 50 cm−1, corresponding to the O–O–O bonding intermolecular motion, and the other at ~250 cm−1, associated with the O–O intermolecular stretching. The effect of salt concentration on the vibrational spectrum of water is small and only noticeable in the 1.0 mol·kg−1 CaCl2 solution, where the two H-bonding modes are shifted to higher frequencies. On the other hand, nanoconfinement substantially modifies the VDOS of water. The intermolecular O–O–O bending and O–O stretching peaks are both blue-shifted, which could be related to changes in the distribution of HBs from a certain tetrahedral order in pure liquid water to a network containing a higher population of two and three HBs per water molecule (Table 2). In Figure 5b, the intermolecular librational (rotational) modes—which occur in the 300–1000 cm−1 region—also display a pronounced spectroscopic shift to higher frequencies as the level of water confinement increases.
Librational modes can be described in terms of motion about the three principal axes of water: wagging, twisting, and rocking. These modes are highly dependent on the local environment and ordering of water [69,70] and sharp librational features have been observed for crystal water in hydrated solids [71]. Therefore, the variations in librational mode frequencies in Figure 5b can be attributed to localized H-bonding and steric restrictions caused by nanoscale confinement.

3.2. Kinetics of Water Exchange at the HAP-Solution Interface

Table 4 reports the number of water exchange events (Nex) in the first coordination shell of the calcium ions, together with the number of water exchange frequency (log kw)—i.e., the number of exchange events per second—which represents a measure of the ‘lability’ of the hydration shell of the metal [56,58]. Compared with the hydrated calcium ion, the presence of other ions in solution stabilizes the first hydration shell of Ca2+ and the number of water exchanges, normalized to 100 ps, reduces from 19.2 in pure liquid water to 2.5–5 exchanges in CaCl2 (aq) and CaF2 (aq), depending on the concentration of the salt. The dynamics of water at the HAP–water interface decreases with the degree of confinement. For example, in the HAP nanopore with pore size H = 20 Å, the water exchange frequency (log kw = 10.4 s−1 ) is one order of magnitude lower than for the hydrated calcium (11.3 s−1). The combined effect of electrolytes in solution (CaCl2 and CaF) and nanoconfinement was investigated for the HAP (H = 60 Å) nanopore, and the results in Table 4 indicate that the water exchange dynamics at the interface decreases as the concentration of electrolytes in solution increases.
Chloride and fluoride ions impact on the reactivity of calcium by directly coordinating to the metal ion [72] but also when they are in the second coordination shell of Ca2+ [61]. In Figure 6, the Ca–O(water), Ca–Cl, and Ca–F RDFs in the HAP (H = 60 Å) nanopores show that surface calcium ions are tightly coordinated to water molecules whereas chloride and fluoride ions are mainly located in the second or higher hydration layers. The only exception are the CaF2 0.2 mol·kg−1 and 1.0 mol·kg−1 solutions, where the Ca–F RDFs have a maximum at 2.1 Å, which corresponds to the adsorption of fluoride ions on the surface. In fact, calculation of the HAP surface coverage with respect to the halide ions shows that approximately 1.5% of the calcium ions are coordinated fluoride. On the other hand, the coverage with respect to chloride ions is zero.
The speciation of the calcium–chloride and calcium–fluoride species is also presented in Table 5. Fluoride ions are in a more hydrated state than chloride ions and, on average, they are closer to the surface and therefore can have a greater influence on the dynamics of water molecules at the HAP-solution interface. In fact, the number of water exchanges is generally slower when the HAP surface is in contact with CaF2 solutions (see Table 4). The number of water molecules coordinated to calcium ions ( CN avg H 2 O ) are also reported in Table 5. On average, approximately two water molecules are coordinated to each surface calcium ion.

4. Conclusions

Molecular dynamics simulations of hydroxyapatite nanopores of different sizes (20 Å ≤ H ≤ 110 Å) in contact with water and aqueous electrolyte solutions (CaCl2 and CaF2) were conducted in order to determine the role of nanoconfinement and ions in solution on the properties of water and the reactivity of hydroxyapatite surfaces. Analysis of the properties of water has been done via the calculation of pair and angular distribution functions, H-bonding statistics, water self-diffusion coefficients, velocity autocorrelation functions, and power spectra of water. The results have shown that the combined effects of solution composition and nanoconfinement significantly slow the dynamics of water molecules compared with bulk liquid and enhance the rigidity of the H-bonding network. Nanoconfinement, in particular, leads to a strengthening of the H-bonding water network.
The reactivity of hydroxyapatite surfaces was characterized in terms of the dynamics of hydration–dehydration around the calcium sites, which is generally accepted to be the rate-limiting step to crystal growth from aqueous solution of ionic crystals. The dynamics of water at the HAP–water interface decreases substantially with the degree of confinement, and in the HAP (H = 20 Å) nanopore the water exchange frequency is one order of magnitude lower than for the hydrated calcium. Electrolytes in solution also decrease the frequency of water exchange around the calcium ions at the surface, an effect that is dependent upon the specific ion-water interaction.
Together, these changes in the properties of water and surfaces impart an overall rigidifying effect on the water network and reduce the reactivity of the hydroxyapatite-solution interface. Since one of the key indicators of the chemical reactivity of mineral surfaces is the kinetics of water-exchange around the metal cation [28,29,30], atomic-scale information regarding the hydration–dehydration dynamics around the cation can be ‘scaled-up’ to predict the effect on the growth from solution of ionic crystals [58]. This work therefore indicates that nanoconfinement of water within HAP nanopores significantly affects the water exchange reactivity, and the consequent growth kinetics, of the hydroxyapatite surface.

Supplementary Materials

The following are available online at www.mdpi.com/2073-4352/7/2/57/s1: S.1 Interatomic potential parameters. FIELD files used in DL_POLY containing the partial charges and potential parameters used to model hydroxyapatite–water, hydroxyapatite–CaCl2 aqueous solutions and hydroxyapatite–CaF2 aqueous solutions (Tables S.1.1–S.1.3). S.1 Forcefield validation. Arrhenius plots of the average diffusion coefficient of water versus the inverse of the temperature for the HAP-water systems with pore sizes equal to 60 Å and 110 Å (Figure S.2.1). Oxygen–oxygen radial distribution functions (Figure S.2.2), self-diffusion coefficients of oxygen water (Table S.2.1), distribution of the number of hydrogen bonds (Table S.2.2 and S.2.3), and number of accounted water exchange events in the hydration shell of the calcium ions (Table S.2.4) obtained from molecular dynamics simulations of bulk water, aqueous CaCl2 solutions and aqueous CaF2 solutions using the SPC/E–Dang–de Leeuw and the SPC/E–Rabone–de Leeuw forcefields.

Acknowledgments

The authors are grateful to the “Institut des sciences de l’Ingénierie et des systèmes” (INSIS) of the “Centre national de la recherche scientifique” (CNRS) for financial support through the “HAP-W Nanopores” PEPS grant. The authors are also grateful to “Université Paris-Est Créteil” (UPEC) for the support of the French-English consortium. Dr Muthuramalingam Prakash thanks UPEC for the funding of his post-doctoral research grant. Dr Devis Di Tommaso thanks UPEC for funding his invited research grant. This research utilized Queen Mary’s MidPlus computational facilities, supported by QMUL Research-IT and funded by EPSRC grant EP/K000128/1. Via our membership of the UK’s HEC Materials Chemistry Consortium, which is funded by EPSRC (EP/L000202), this work used the ARCHER UK National Supercomputing Service (http://www.archer.ac.uk).

Author Contributions

Devis Di Tommaso, Thibault Lemaire, Nora H. de Leeuw and Salah Naili have conceived and designed the experiments; Devis Di Tommaso and Muthuramalingam Prakash performed the experiments; Devis Di Tommaso analyzed the data; Nora H. de Leeuw and Marius Lewerenz contributed to analysis tools; Devis Di Tommaso, Thibault Lemaire and Salah Naili wrote the paper.

Conflicts of Interest

The authors declare no conflict of interest.

References

  1. Loste, E.; Park, R.J.; Warren, J.; Meldrum, F.C. Precipitation of calcium carbonate in confinement. Adv. Funct. Mater. 2004, 14, 1211–1220. [Google Scholar] [CrossRef]
  2. Meldrum, F.C.; Cölfen, H. Controlling mineral morphologies and structures in biological and synthetic systems. Chem. Rev. 2003, 108, 4332–4432. [Google Scholar] [CrossRef] [PubMed]
  3. Wang, Y.; Christenson, H.K.; Meldrum, F.C. Confinement Increases the Lifetimes of Hydroxyapatite Precursors. Chem. Mater. 2014, 26, 5830–5838. [Google Scholar] [CrossRef]
  4. Schenk, A.S.; Albarracin, E.; Kim, Y.-Y.; Ihli, J.; Meldrum, F.C. Confinement stabilises single crystal vaterite rods. Chem. Commun. 2014, 50, 4729–4732. [Google Scholar] [CrossRef] [PubMed]
  5. Verch, A.; Côté, A.S.; Darkins, R.; Kim, Y.-Y.; van de Locht, R.; Meldrum, F.C.; Duffy, D.; Kröger, R. Correlation between Anisotropy and Lattice Distortions in Single Crystal Calcite Nanowires Grown in Confinement. Small 2014, 10, 2697–2702. [Google Scholar] [CrossRef] [PubMed]
  6. Lee, S.; Feldman, J.; Lee, S.S. Nanoconfined Crystallization of MAPbI3 to Probe Crystal Evolution and Stability. Cryst. Growth Des. 2016, 16, 4744–4751. [Google Scholar] [CrossRef]
  7. Jiang, Q.; Ward, M.D. Crystallization under nanoscale confinement. Chem. Soc. Rev. 2014, 43, 2066–2079. [Google Scholar] [CrossRef] [PubMed]
  8. Reeves, N.J.; Mann, S. Photoelectron spectroscopic studies of the silicon pseudohalides: Relationship between geometrical and electronic structure. J. Chem. Soc. Faraday Trans. 1991, 87, 3875–3880. [Google Scholar] [CrossRef]
  9. Didymus, J.M.; Oliver, P.; Mann, S.; de Vries, A.L.; Hauschka, P.V.; Westbroek, P. Influence of Low-Molecular-Weight and Macromolecular Organic Additives on the Morphology of Calcium Carbonate. J. Chem. Soc. Faraday Trans. 1993, 89, 2891–2900. [Google Scholar] [CrossRef]
  10. Lahav, M.; Leiserowitz, L. The effect of solvent on crystal growth and morphology. Chem. Eng. Sci. 2001, 56, 2245–2253. [Google Scholar] [CrossRef]
  11. De Yoreo, J.J.; Vekilov, P.G. Principles of crystal nucleation and grow. Rev. Mineral. Geochem. 2003, 54, 57–93. [Google Scholar] [CrossRef]
  12. Rodriguez-Navarro, C.; Benning, L.G. Control of Crystal Nucleation and Growth by Additives. Elements 2013, 9, 203–209. [Google Scholar] [CrossRef]
  13. Hamilton, B.D.; Ha, J.M.; Hillmyer, M.A.; Ward, M.D. Manipulating crystal growth and polymorphism by confinement in nanoscale crystallization chambers. Acc. Chem. Res. 2012, 45, 414–423. [Google Scholar] [CrossRef]
  14. Mann, S.; Archibald, D.D.; Didymus, J.M.; Douglas, T.; Heywood, B.R.; Meldrum, F.C.; Reeves, N.J. Crystallization at Inorganic-organic Interfaces: Biominerals and Biomimetic Synthesis. Science 1993, 261, 1286–1292. [Google Scholar] [CrossRef] [PubMed]
  15. Elhadj, S.; de Yoreo, J.J.; Hoyer, J.R.; Dove, P.M. Role of molecular charge and hydrophilicity in regulating the kinetics of crystal growth. Proc. Natl. Acad. Sci. USA 2006, 103, 19237–19242. [Google Scholar] [CrossRef] [PubMed]
  16. Chun-Long, C.; Jiahui, Q.; Zuckermann, R.N.; de Yoreo, J.J. Engineered Biomimetic Polymers as Tunable Agents for Controlling CaCO3 Mineralization. J. Am. Chem. Soc. 2011, 133, 5214–5217. [Google Scholar]
  17. Kowacz, M.; Putnis, A. The effect of specific background electrolytes on water structure and solute hydration: Consequences for crystal dissolution and growth. Geochim. Cosmochim. Acta 2008, 72, 4476–4487. [Google Scholar] [CrossRef]
  18. Ruiz-Agudo, E.; Kowacz, M.; Putnis, C.V.; Putnis, A. The role of background electrolytes on the kinetics and mechanism of calcite dissolution. Geochim. Cosmochim. Acta 2010, 74, 1256–1267. [Google Scholar] [CrossRef]
  19. Ruiz-Agudo, E.; Urosevic, M.; Putnis, C.V.; Rodriguez-Navarro, C.; Cardell, C.; Putnis, A. Ion-specific effects on the kinetics of mineral dissolution. Chem. Geol. 2011, 281, 364–371. [Google Scholar] [CrossRef]
  20. Weaver, M.L.; Qiu, S.R.; Hoyer, J.R.; Casey, W.H.; Nancollas, G.H.; de Yoreo, J.J. Inhibition of calcium oxalate monohydrate growth by citrate and the effect of the background electrolyte. J. Cryst. Growth 2007, 306, 135–145. [Google Scholar] [CrossRef]
  21. Lowenstam, H.A.; Weiner, S. On Biomineralization; Oxford University Press: New York, NY, USA, 1989. [Google Scholar]
  22. Narasaraju, T.S.B.; Phebe, D.E. Some physico-chemical aspects of hydroxylapatite. J. Mater. Sci. 1996, 31, 1. [Google Scholar] [CrossRef]
  23. Knothe Tate, M.L. “Whither flows the fluid in bone?” An osteocyte’s perspective. J. Biomech. 2003, 36, 1409–1424. [Google Scholar] [CrossRef]
  24. Cowin, S.C.; Gailani, G.; Benalla, M. Hierarchical poroelasticity: Movement of interstitial fluid between porosity levels in bones. Philos. Trans. R. Soc. Lond. Ser. A Math. Phys. Eng. Sci. 2009, 367, 3401–3444. [Google Scholar] [CrossRef] [PubMed]
  25. Wehrli, F.W.; Fernandez-Seara, M.A. Nuclear Magnetic Resonance Studies of Bone Water. Ann. Biomed. Eng. 2005, 33, 79–86. [Google Scholar] [CrossRef] [PubMed]
  26. Cardoso, L.; Fritton, S.P.; Gailani, G.; Benalla, M.; Cowin, S.C. Advances in assessment of bone porosity, permeability and interstitial fluid flow. J. Biomech. 2013, 46, 253–265. [Google Scholar] [CrossRef] [PubMed]
  27. Myerson, A.S.; Trout, B.L. Nucleation from Solution. Science 2013, 341, 855–856. [Google Scholar] [CrossRef] [PubMed]
  28. Nielsen, A.E. Electrolyte crystal growth mechanisms. J. Cryst. Growth 1984, 67, 289–310. [Google Scholar] [CrossRef]
  29. Piana, S.; Jones, F.; Gale, J.D. Assisted desolvation as a key kinetic step for crystal growth. J. Am. Chem. Soc. 2006, 128, 13568–13574. [Google Scholar] [CrossRef] [PubMed]
  30. Pokrovsky, O.S.; Schott, J. Surface Chemistry and Dissolution Kinetics of Divalent Metal Carbonates. Environ. Sci. Technol. 2002, 36, 426–432. [Google Scholar] [CrossRef] [PubMed]
  31. Mostafa, N.Y.; Brown, P.W. Computer simulation of stoichiometric hydroxyapatite: Structure and substitutions. J. Phys. Chem. Solids 2007, 68, 431–437. [Google Scholar] [CrossRef]
  32. De Leeuw, N.H. Computer simulations of structures and properties of the biomaterial hydroxyapatite. J. Mater. Chem. 2010, 20, 5376–5389. [Google Scholar] [CrossRef]
  33. Zahn, D.; Hochrein, O. Computational study of interfaces between hydroxyapatite and water. Phys. Chem. Chem. Phys. 2003, 5, 4004–4007. [Google Scholar] [CrossRef]
  34. Habraken, W.J.E.M.; Tao, J.; Brylka, L.J.; Friedrich, H.; Bertinetti, L.; Schenk, A.S.; Verch, A.; Dmitrovic, V.; Bomans, P.H.H.; Frederik, P.M.; et al. Ion-association complexes unite classical and non-classical theories for the biomimetic nucleation of calcium phosphate. Nat. Commun. 2013, 4, 1507–1519. [Google Scholar] [CrossRef] [PubMed]
  35. Mancardi, G.; Terranova, U.; de Leeuw, N.H. Calcium Phosphate Prenucleation Complexes in Water by Means of ab Initio Molecular Dynamics Simulations. Cryst. Growth Des. 2016, 16, 3353–3358. [Google Scholar] [CrossRef]
  36. Orgel, J.P.R.O.; Irving, T.C.; Miller, A.; Wess, T.J. Microfibrillar structure of type I collagen in situ. Proc. Natl. Acad. Sci. USA 2006, 103, 9001–9005. [Google Scholar] [CrossRef] [PubMed]
  37. Cantaert, B.; Beniash, E.; Meldrum, F.C. Nanoscale Confinement Controls the Crystallization of Calcium Phosphate: Relevance to Bone Formation. Chem. Eur. J. 2013, 19, 14918–14924. [Google Scholar] [CrossRef] [PubMed]
  38. Todorov, I.T.; Smith, W.; Trachenko, K.; Dove, M.T. DL_POLY_3: New dimensions in molecular dynamics simulations via massive parallelism. J. Mater. Chem. 2006, 16, 1911–1918. [Google Scholar] [CrossRef]
  39. Melchionna, S.; Ciccotti, G.; Holian, B.L. Hoover NPT dynamics for systems varying in shape and size. Mol. Phys. 1993, 78, 533–544. [Google Scholar] [CrossRef]
  40. Essmann, U.; Perera, L.; Berkowitz, M.L.; Darden, T.; Lee, H.; Pedersen, L.G. A smooth particle mesh Ewald method. J. Chem. Phys. 1995, 103, 8577. [Google Scholar] [CrossRef]
  41. De Leeuw, N.H. Resisting the Onset of Hydroxyapatite Dissolution through the Incorporation of Fluoride. J. Phys. Chem. B 2004, 108, 1809–1811. [Google Scholar] [CrossRef]
  42. Berendsen, H.J.C.; Grigera, J.R.; Straatsma, T.P. The missing term in effective pair potentials. J. Phys. Chem. 1987, 91, 6269–6271. [Google Scholar] [CrossRef]
  43. Kropman, M.F.; Bakker, H.J. Femtosecond mid-infrared spectroscopy of aqueous solvation shells. J. Chem. Phys. 2001, 115, 8942–8948. [Google Scholar] [CrossRef]
  44. Almora-Barrios, N.; de Leeuw, N.H. Modelling the interaction of a Hyp-Pro-Gly peptide with hydroxyapatite surfaces in aqueous environment. CrystEngComm 2010, 12, 960–967. [Google Scholar] [CrossRef]
  45. Ruiz-Hernandez, S.; Streeter, I.; de Leeuw, N.H. The effect of water on the binding of glycosaminoglycan saccharides to hydroxyapatite surfaces: A molecular dynamics study. Phys. Chem. Chem. Phys. 2015, 17, 22377–22388. [Google Scholar] [CrossRef] [PubMed]
  46. Rabone, J.A.L.; de Leeuw, N.H. Interatomic potential models for natural apatite crystals: Incorporating strontium and the lanthanides. J. Comput. Chem. 2006, 27, 253–266. [Google Scholar] [CrossRef] [PubMed]
  47. Dang, L.X. Mechanism and Thermodynamics of Ion Selectivity in Aqueous Solutions of 18-Crown-6 Ether: A Molecular Dynamics Study. J. Am. Chem. Soc. 1995, 117, 6954–6960. [Google Scholar] [CrossRef]
  48. Chandra, A. Dynamical Behavior of Anion−Water and Water−Water Hydrogen Bonds in Aqueous Electrolyte Solutions: A Molecular Dynamics Study. J. Phys. Chem. B 2003, 107, 3899–3906. [Google Scholar] [CrossRef]
  49. Fennell, C.J.; Bizjak, A.; Vlachy, V.; Dill, K.A.; Sarupria, S.; Rajamani, S.; Garde, S. Ion Pairing in Molecular Simulations of Aqueous Alkali Halide Solutions. J. Phys. Chem. B 2009, 113, 14837–14838. [Google Scholar] [CrossRef]
  50. Gujt, J.; Bešter-Rogač, M.; Hribar-Lee, B. An Investigation of Ion-Pairing of Alkali Metal Halides in Aqueous Solutions Using the Electrical Conductivity and the Monte Carlo Computer Simulation Methods. J. Mol. Liq. 2014, 190, 34–41. [Google Scholar] [CrossRef] [PubMed]
  51. Lee, S.H.; Rasaiah, J.C. Molecular dynamics simulation of ion mobility. 2. Alkali metal and halide ions using the SPC/E model for water at 25 °C. J. Phys. Chem. 1996, 100, 1420–1425. [Google Scholar] [CrossRef]
  52. Nahtigal, I.G.; Zasetsky, A.Y.; Svishchev, I.M. Nucleation of NaCl Nanoparticles in Supercritical Water: Molecular Dynamics Simulations. J. Phys. Chem. B 2008, 112, 7537–7543. [Google Scholar] [CrossRef] [PubMed]
  53. Sudarsanan, K.T.; Young, R. Significant precision in crystal structure details. Holly Springs hydroxyapatite. Acta Crystallogr. Sect. B 1969, 25, 1534–1543. [Google Scholar] [CrossRef]
  54. Allen, M.P.; Tildesley, D.J. Computer Simulations of Liquids; Oxford Science Publications: Oxford, UK, 1987. [Google Scholar]
  55. Chandra, A. Effects of Ion Atmosphere on Hydrogen-Bond Dynamics in Aqueous Electrolyte Solutions. Phys. Rev. Lett. 2000, 85, 768–771. [Google Scholar] [CrossRef] [PubMed]
  56. Hofer, T.S.; Tran, H.T.; Schwenk, C.F.; Rode, B.M. Characterization of dynamics and reactivities of solvated ions by ab initio simulations. J. Comput. Chem. 2004, 25, 211–217. [Google Scholar] [CrossRef] [PubMed]
  57. Di Tommaso, D.; de Leeuw, N.H. First principles simulations of the structural and dynamical properties of hydrated metal ions Me2+ and solvated metal carbonates (Me = Ca, Mg and Sr). Cryst. Growth Des. 2010, 10, 4292–4302. [Google Scholar] [CrossRef]
  58. Wolthers, M.; Di Tommaso, D.; Du, Z.; de Leeuw, N.H. Variations in calcite growth kinetics with surface topography: Molecular dynamics simulations and process-based growth kinetics modelling. CrystEngComm 2013, 15, 5506–5514. [Google Scholar] [CrossRef]
  59. Soper, A.K.; Bruni, F.; Ricci, M.A. Site-site pair correlation functions of water from 25 to 400 °C: Revised analysis of new and old diffraction data. J. Chem. Phys. 1997, 106, 247–254. [Google Scholar] [CrossRef]
  60. Mahoney, M.W.; Jorgensen, W.L. Diffusion constant of the TIP5P model liquid water. J. Chem. Phys. 2001, 114, 363–366. [Google Scholar] [CrossRef]
  61. Di Tommaso, D.; Ruiz-Agudo, E.; de Leeuw, N.H.; Putnis, A.; Putnis, C.V. Modelling the effects of salt solutions on the hydration of calcium ions. Phys. Chem. Chem. Phys. 2014, 16, 7772–7785. [Google Scholar] [CrossRef] [PubMed]
  62. Raiteri, P.; Gale, J.D.; Quigley, D.; Rodger, P.M. Derivation of an accurate force-field for simulating the growth of calcium carbonate from aqueous solution: A new model for the calcite—Water interface. J. Phys. Chem. C 2010, 114, 5997–6010. [Google Scholar] [CrossRef]
  63. Hirunsit, P.; Balbuena, P.B. The effects of confinement on water structure and dynamics: A molecular simulation study. J. Phys. Chem. C 2007, 111, 1709–1715. [Google Scholar] [CrossRef]
  64. Mosaddeghi, H.; Alavi, S.; Kowsari, M.H.; Najafi, B. Simulations of structural and dynamic anisotropy in nano-confined water between parallel graphite plates. J. Chem. Phys. 2012, 137, 184703. [Google Scholar] [CrossRef] [PubMed]
  65. Boon, J.P.; Yip, S. Molecular Hydrodynamics; McGraw-Hill International Book Co.: New York, NY, USA, 1980. [Google Scholar]
  66. Demontis, P.; Suffritti, G.B.; Tilocca, A. Diffusion and vibrational relaxation of a diatomic molecule in the pore network of a pure silica zeolite: A molecular dynamics study. J. Chem. Phys. 1996, 105, 5586. [Google Scholar] [CrossRef]
  67. Tian, K.V.; Chass, G.; Di Tommaso, D. Simulations reveal the role of composition into the atomic-level flexibility of bioactive glass cements. Phys. Chem. Chem. Phys. 2016, 18, 837–845. [Google Scholar] [CrossRef] [PubMed]
  68. Stillinger, F.H.; Raman, A. Improved Simulation of Liquid Water by Molecular Dynamics. J. Chem. Phys. 1974, 60, 1545. [Google Scholar] [CrossRef]
  69. Ockwig, N.W.; Cygan, R.T.; Criscenti, L.J.; Nenoff, T.M. Incoherent inelastic neutron scattering studies of nanoconfined water in clinoptilolite and heulandite zeolites. J. Phys. Chem. C. 2008, 112, 13629–13634. [Google Scholar] [CrossRef]
  70. Corsaro, C.; Crupi, V.; Majolino, D.; Parker, S.F.; Venuti, V.; Wanderlinght, U. Inelastic Neutron Scattering Study of Water in Hydrated LTA-Type Zeolites. J. Phys. Chem. A. 2006, 110, 1190–1195. [Google Scholar] [CrossRef] [PubMed]
  71. Tayal, V.P.; Srivastava, B.K.; Khandelwal, D.P. Librational Modes of Crystal Water in Hydrated Solids. Appl. Spectrosc. Rev. 1980, 16, 43–134. [Google Scholar] [CrossRef]
  72. Schwenk, C.F.; Hofer, T.S.; Randolf, B.R.; Rode, B.M. The influence of heteroligands on the reactivity of Ni2+ in solution. Phys. Chem. Chem. Phys. 2005, 7, 1669–1673. [Google Scholar] [CrossRef] [PubMed]
Figure 1. (a) HAP-water system (Ca = green, phosphate = pink, O = red, H = white) with a pore size of 110 Å. (b) Parallel view of the HAP–water interface. (c) Detailed view of the surface local environment.
Crystals 07 00057 g001
Figure 2. Oxygen–oxygen (O–O) radial distribution functions (gOO(r)) of water molecules. (a) Bulk water and HAP nanopores–water (20 Å ≤ H ≤ 110 Å). (b) HAP nanopore (H = 60 Å)–CaCl2 solutions. (c) HAP nanopore (H = 60 Å)–CaF2 solutions. (d) Bulk water and aqueous CaCl2 solutions. (e) Bulk water and aqueous CaF2 solutions.
Crystals 07 00057 g002
Figure 3. Angular distribution functions of the O–O–O (ρ(θ)) of water molecules. (a) Bulk water and HAP nanopores–water (20 Å ≤ H ≤ 110 Å). (b) HAP nanopore (H = 60 Å)–CaCl2 solutions. (c) HAP nanopore (H = 60 Å)–CaF2 solutions. (d) Bulk water and aqueous CaCl2 solutions. (e) Bulk water and aqueous CaF2 solutions.
Crystals 07 00057 g003
Figure 4. Velocity autocorrelation function (VACF) of the oxygen atoms of water. (a) Bulk water and aqueous CaCl2 solutions. (b) Bulk water and water within HAP nanopores (H = 110 Å, H = 60 Å, and H = 20 Å). (c) CaCl2 solutions within the HAP nanopore (H = 60 Å).
Crystals 07 00057 g004
Figure 5. Total vibrational density of states for the water molecules obtained from the sum of the Fourier transform of the velocity autocorrelation function of the oxygen and hydrogen atoms. (a) Bulk water and aqueous CaCl2 solutions. (b) Bulk water and water within HAP nanopores (H = 60 Å and H = 20 Å).
Crystals 07 00057 g005
Figure 6. Radial distribution functions between calcium and water oxygen (gCaO(r)) in the (a) HAP nanopore (H = 60 Å)–CaCl2 solutions and (b) HAP nanopore (H = 60 Å)–CaF2 solutions. (c) Ca–Cl radial distribution functions (gCaCl(r)) in the HAP nanopore (H = 60 Å)–CaCl2 solutions. (d) Ca–F radial distribution functions (gCaF(r)) in the HAP nanopore (H = 60 Å)–CaF2 solutions.
Crystals 07 00057 g006
Table 1. Bulk solutions and hydroxyapatatite nanopores considered in this study. Concentration of calcium chloride and calcium fluoride in mol·kg−1 (b).
Number of Ca10(PO4)6(OH)2 UnitsNumber of CaX2Number of H2Ob
Solution
Water7290.0
CaCl287050.6
166811.3
CaF287050.6
166811.3
HAP, H = 110 Å
Water3625050.0
HAP, H = 60 Å
Water3613630.0
CaCl236413510.2
361113300.5
362312941.0
CaF236413510.2
361113300.5
362312941.0
HAP, H = 40 Å
Water369100.0
HAP, H = 20 Å
Water364550.0
Table 2. The distribution of the number of hydrogen bonds per water molecule. Results obtained from MD simulations of bulk water, aqueous CaCl2 solutions, water within HAP nanopores of different sizes (20 Å ≤ H ≤ 110 Å), and CaCl2 and CaF2 solutions within the HAP nanopores with H = 60 Å. The values given are percentages of molecules with the given number of hydrogen bonds. Concentration in mol·kg−1 (b).
Number of Hydrogen Bonds (%)
b012345Average
Bulk solution
Water0.00.98.833.051.35.93.53
CaCl20.60.22.714.534.043.74.83.30
1.30.44.719.234.037.64.03.16
CaF20.60.22.813.533.444.75.33.36
1.30.54.717.133.139.64.83.21
HAP, H = 110 Å
Water0.42.811.132.847.45.53.41
HAP, H = 60 Å
Water0.53.98.420.661.94.73.54
CaCl20.20.74.510.022.058.44.53.46
0.50.65.013.324.852.14.03.35
1.00.96.816.826.945.23.43.19
CaF20.20.95.311.127.150.45.13.36
0.51.16.115.230.641.95.03.22
1.01.78.617.227.340.84.23.10
HAP, H = 40 Å
Water0.96.78.519.460.04.33.44
HAP, H = 20 Å
Water0.811.212.412.459.73.53.29
Table 3. The self-diffusion coefficient (DW) for bulk and confined water. Concentration of CaCl2 and CaF2 in mol·kg−1 (b).
bD W × 10−10 (m2·s−1)
Solution
Water25.8
CaCl20.621.1
1.316.3
CaF20.622.3
1.317.1
HAP, H = 110 Å
Water21.9
HAP, H = 60 Å
Water5.4
CaCl20.23.9
0.53.5
1.02.9
CaF20.26.6
0.55.3
1.03.9
HAP, H = 40 Å
Water2.9
HAP, H = 20 Å
Water0.2
Table 4. Number of accounted water exchange events (Nex) in the coordination shell of the calcium ions with a duration of more than 0.5 ps. For the HAP-solution systems, the values of Nex have been normalized with respect to the number of calcium atoms at the surface. Concentration (b) in mol·kg−1.
btsim (ps)NexNex/100 pslog kw (s−1 ) a
Solution
Ca2+8000153219.211.3
CaCl20.68000396.85.010.7
1.38000225.12.810.4
CaF20.68000308.13.910.6
1.38000202.52.510.4
HAP, H = 110 Å
Water2000317.315.911.2
HAP, H = 60 Å b
Water4000337.68.410.9
CaCl20.24000374.49.411.0
0.54000312.47.810.9
1.04000248.66.210.8
CaF20.23000336.911.211.1
0.53000296.79.911.0
1.03000278.49.311.0
HAP, H = 40 Å
Water4000367.49.211.0
HAP, H = 20 Å
Water4000111.92.810.4
a Water exchange frequency, i.e., the number of exchange events per second. b For the HAP nanopores in contact with CaCl2 and CaF2 solutions, only water exchanges around surface calcium ions were taken into account.
Table 5. Average coordination number of the surface calcium ions with the water molecules, CN avg H 2 O . Hydroxyapatite surface coverage with respect to the halide ions (X = Cl or F). Speciation of calcium halide ion pairs in solution: contact ion pairs (CIP), solvent-shared ion pairs (SSHIP), solvent-separated ion pairs (SSIP), and free ion pairs (FIP). Concentration (b) in mol·kg−1.
HAP, H = 60 Åb C N a v g H 2 O Ca-X Surface Coverage (%)Speciation of MX Pairs
CIPSSHIPSSIPFIP
CaCl20.21.90.011.521.524.442.6
0.51.80.018.929.436.715.0
1.01.70.163.219.915.41.5
CaF20.22.01.521.627.623.227.6
0.51.80.028.948.719.72.8
1.01.81.328.660.110.21.1

