
Synthesis, Crystal Structure, Spectroscopic Properties, and DFT Studies of 7,9-Dibromobenzo[h]quinolin-10-ol

Abstract
:
1. Introduction
2. Results
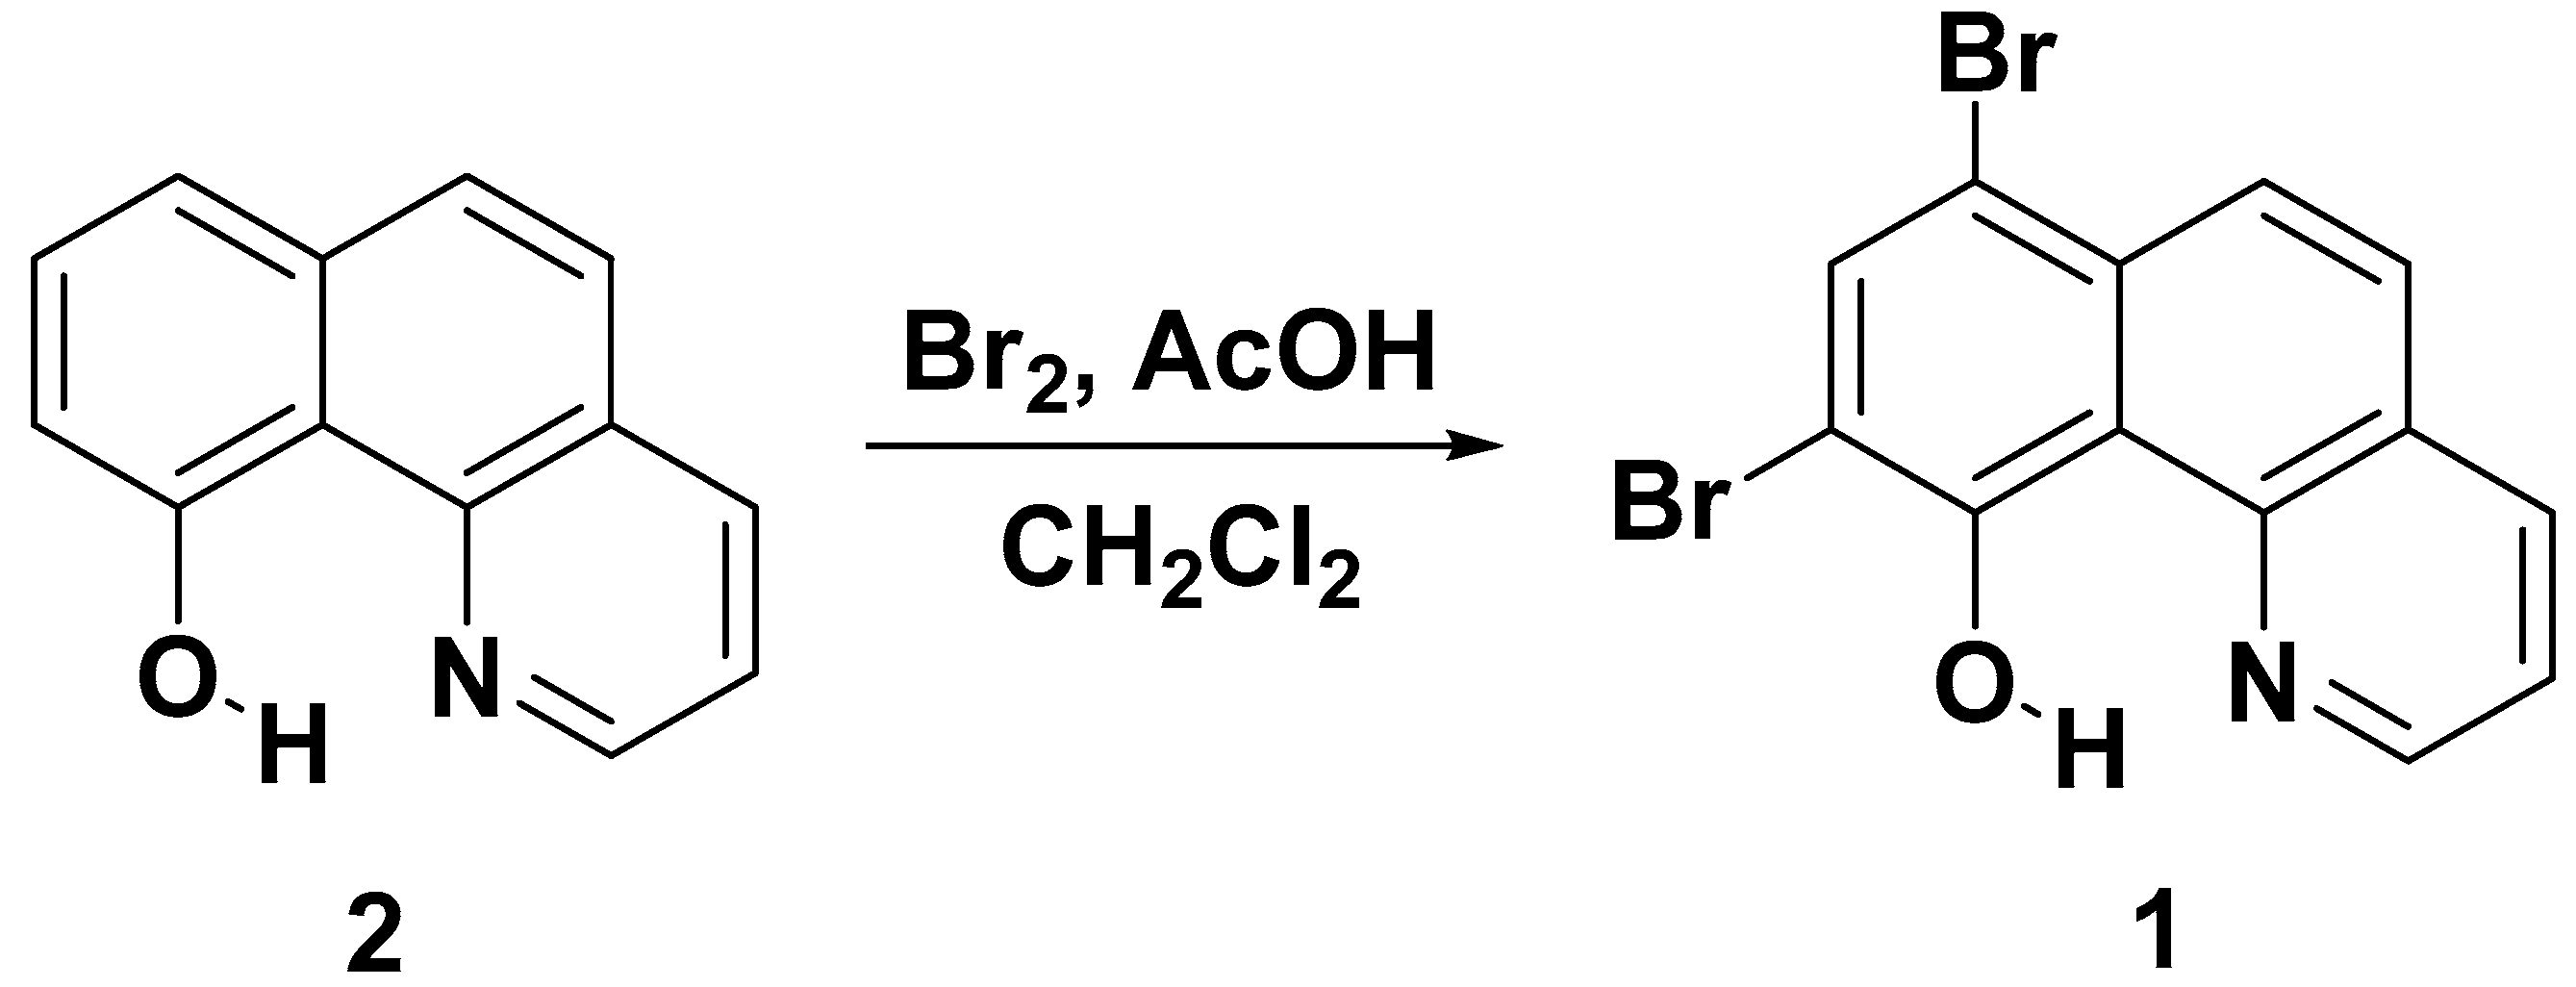
Synthesis and Characterization
3. Discussion
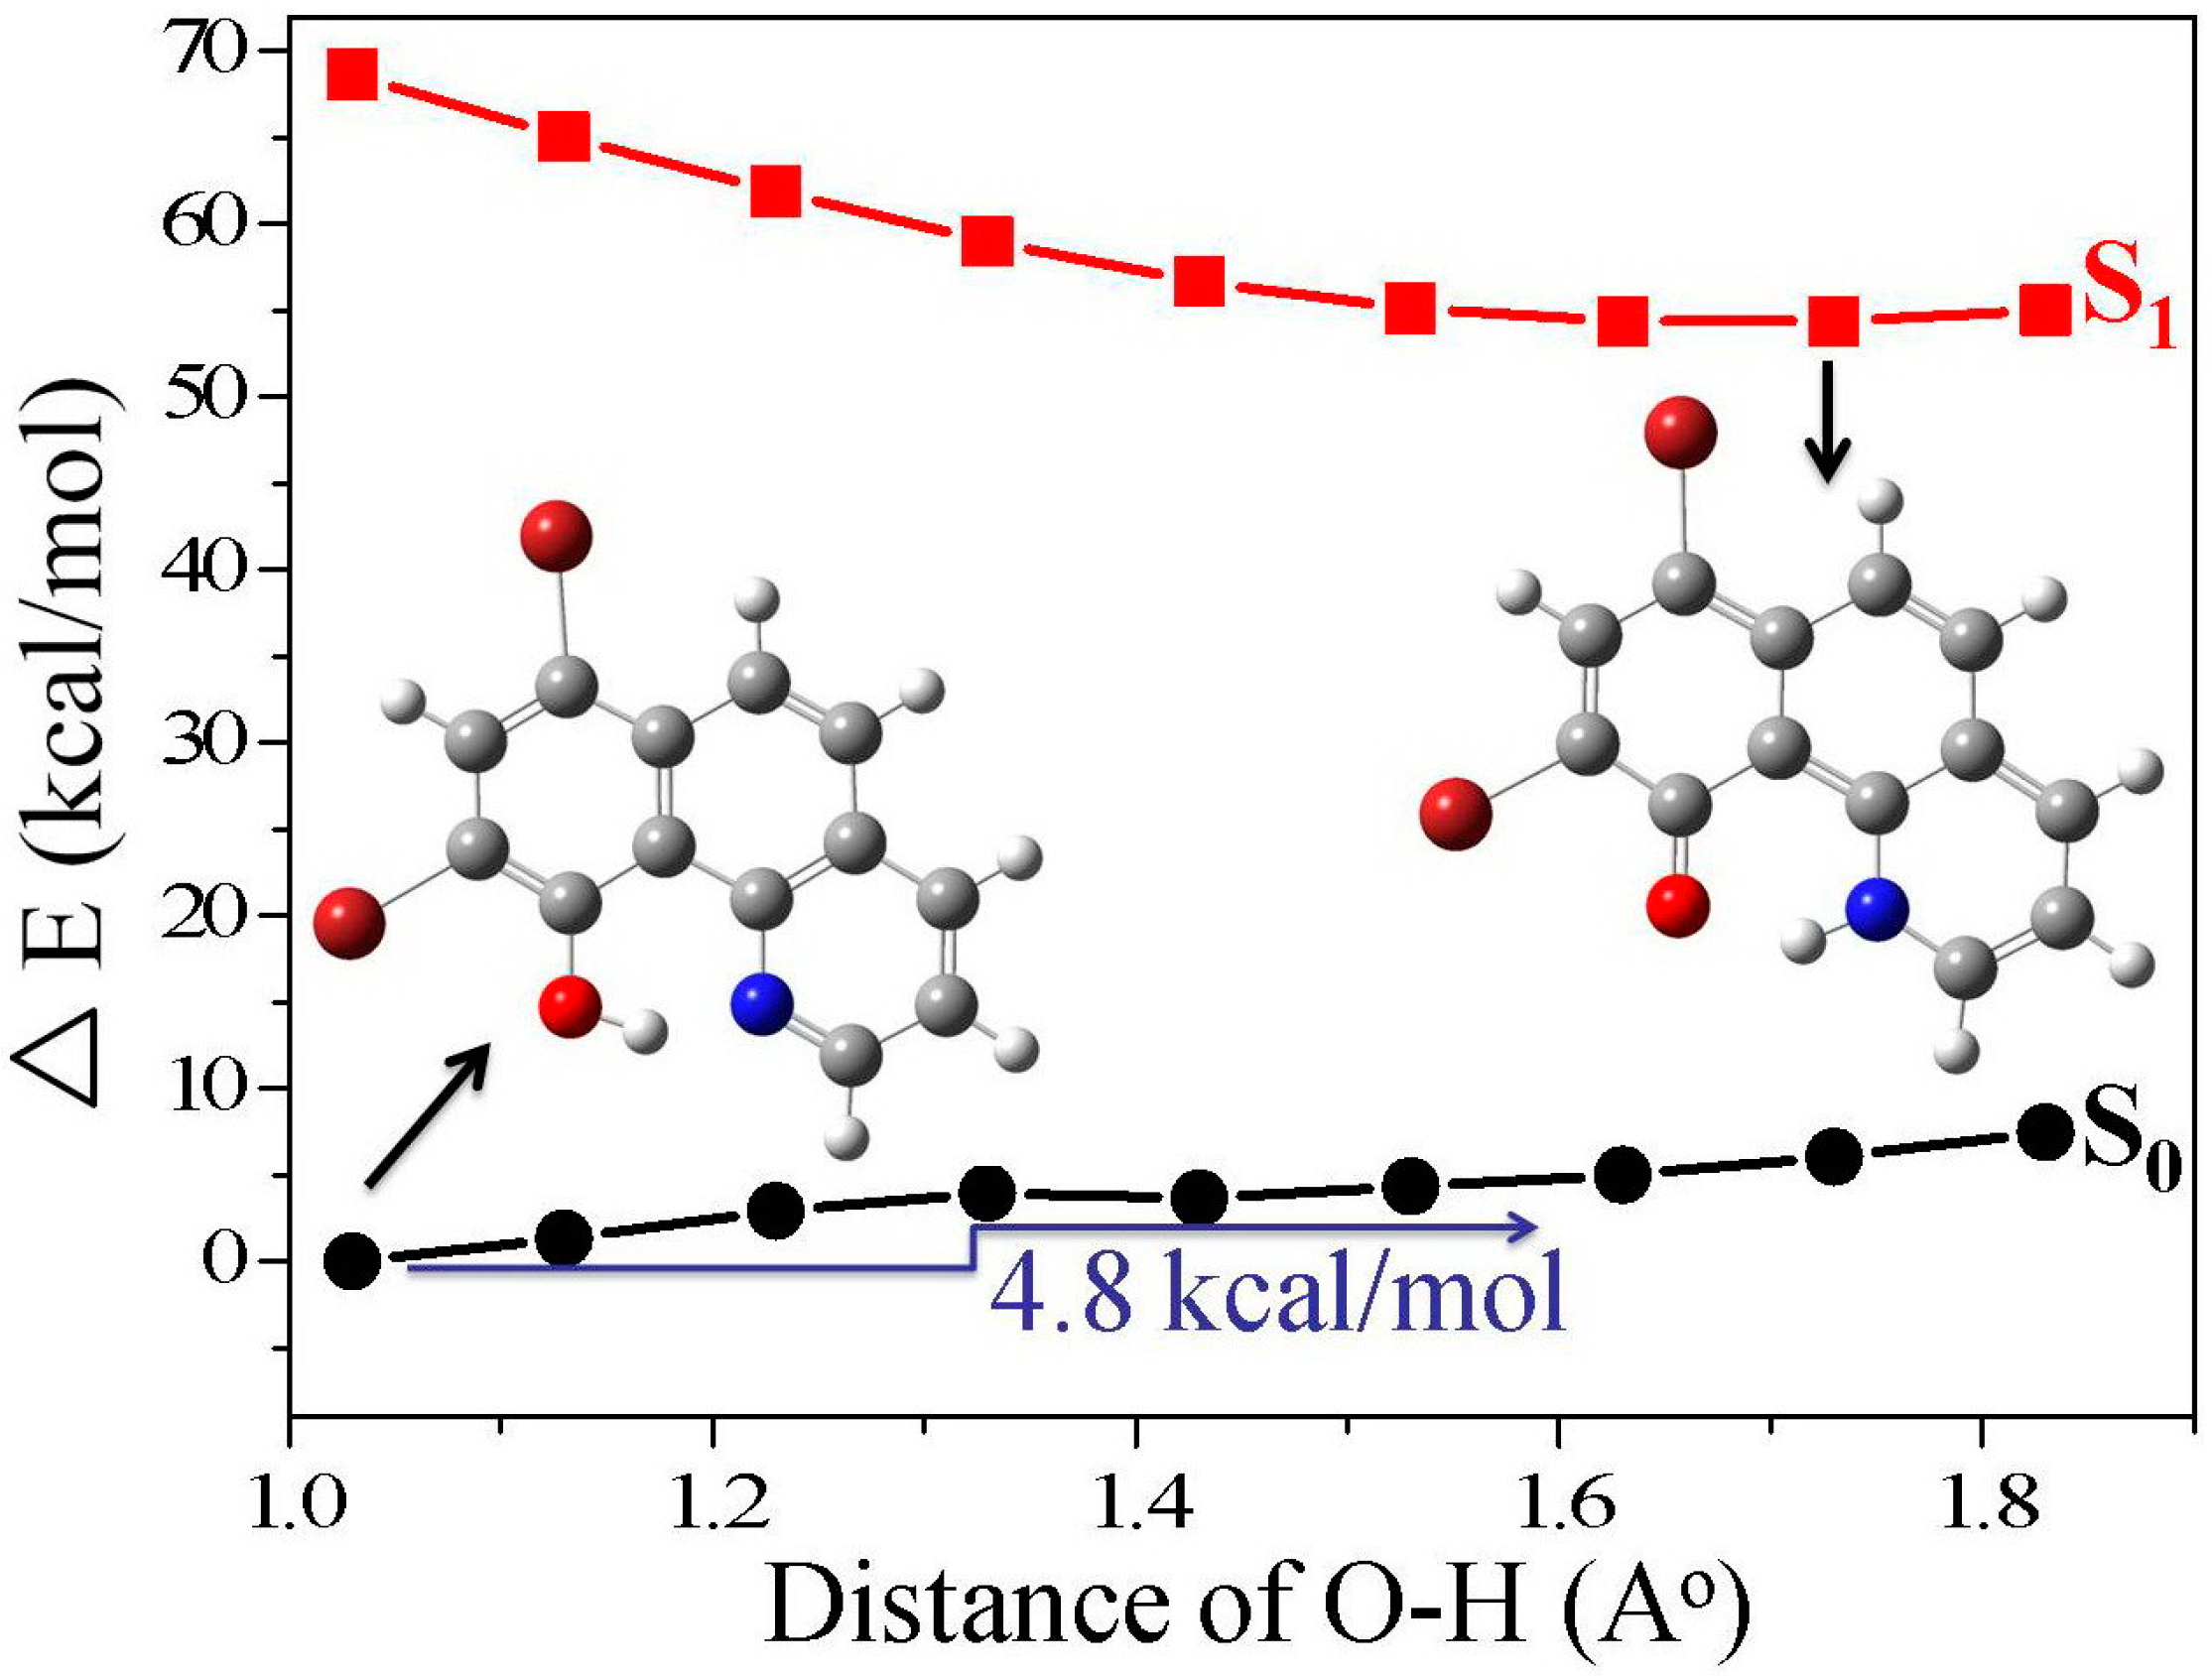
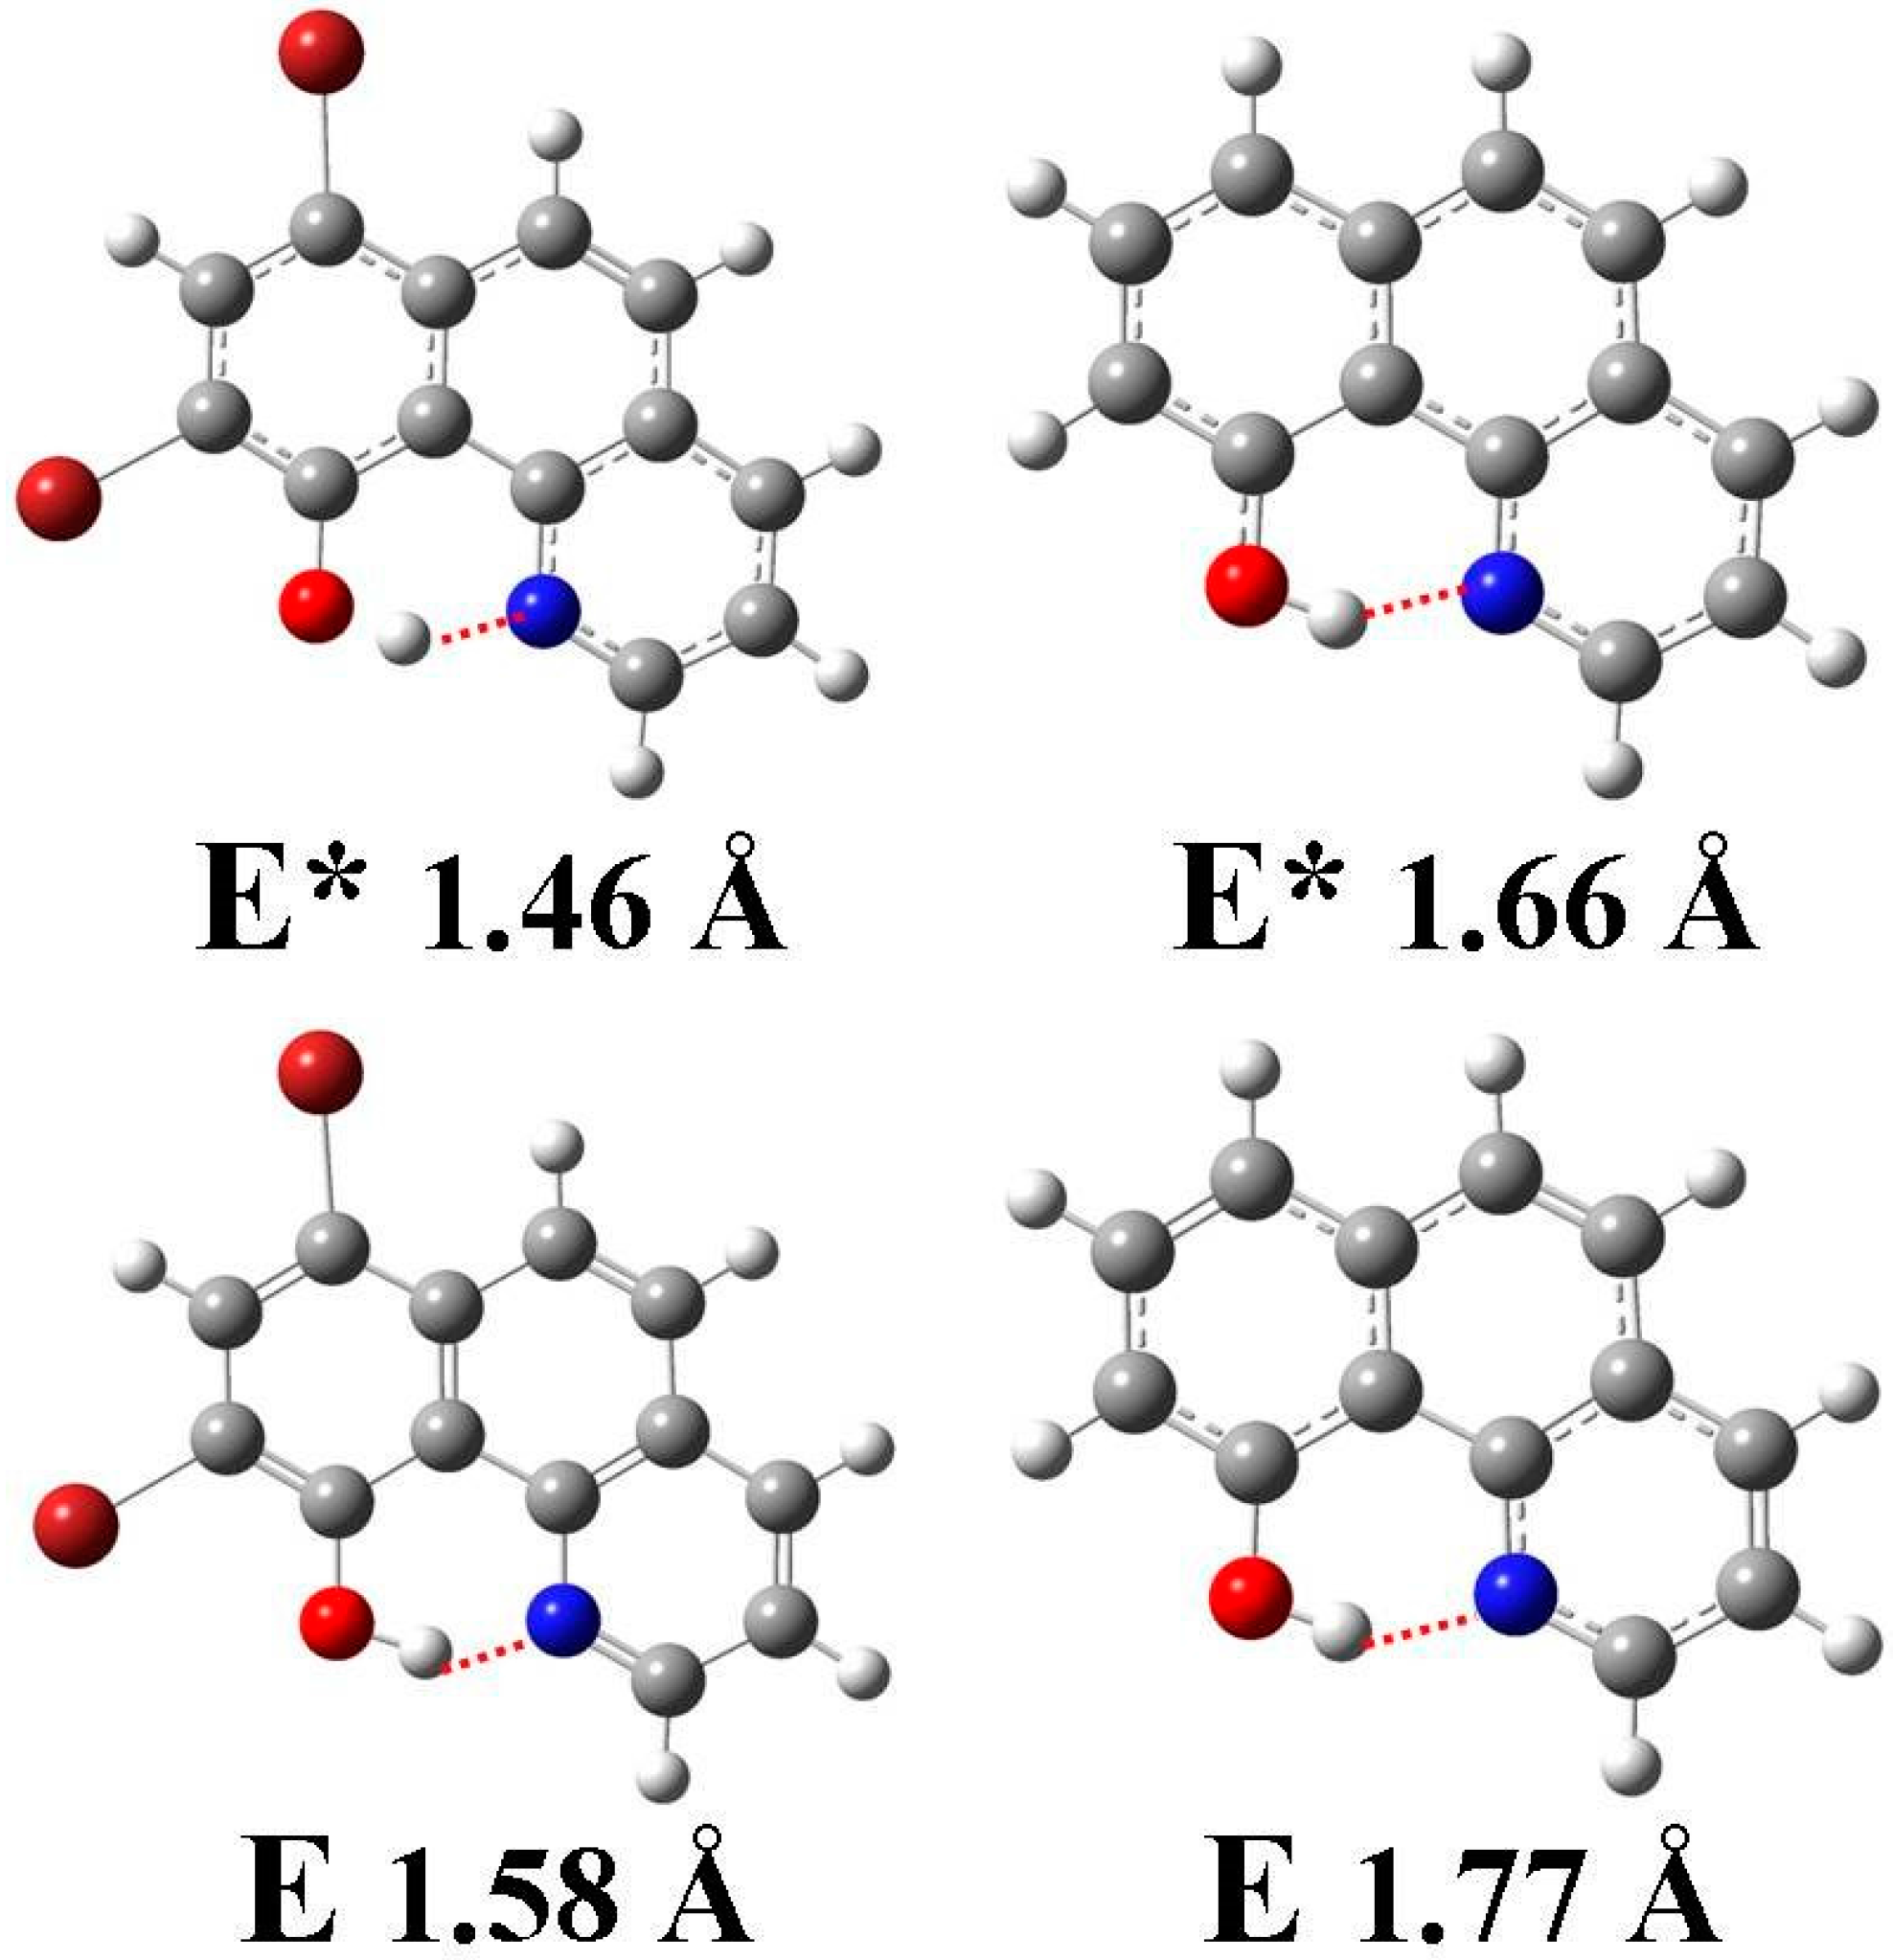
3.1. Hydrogen Bond Studies
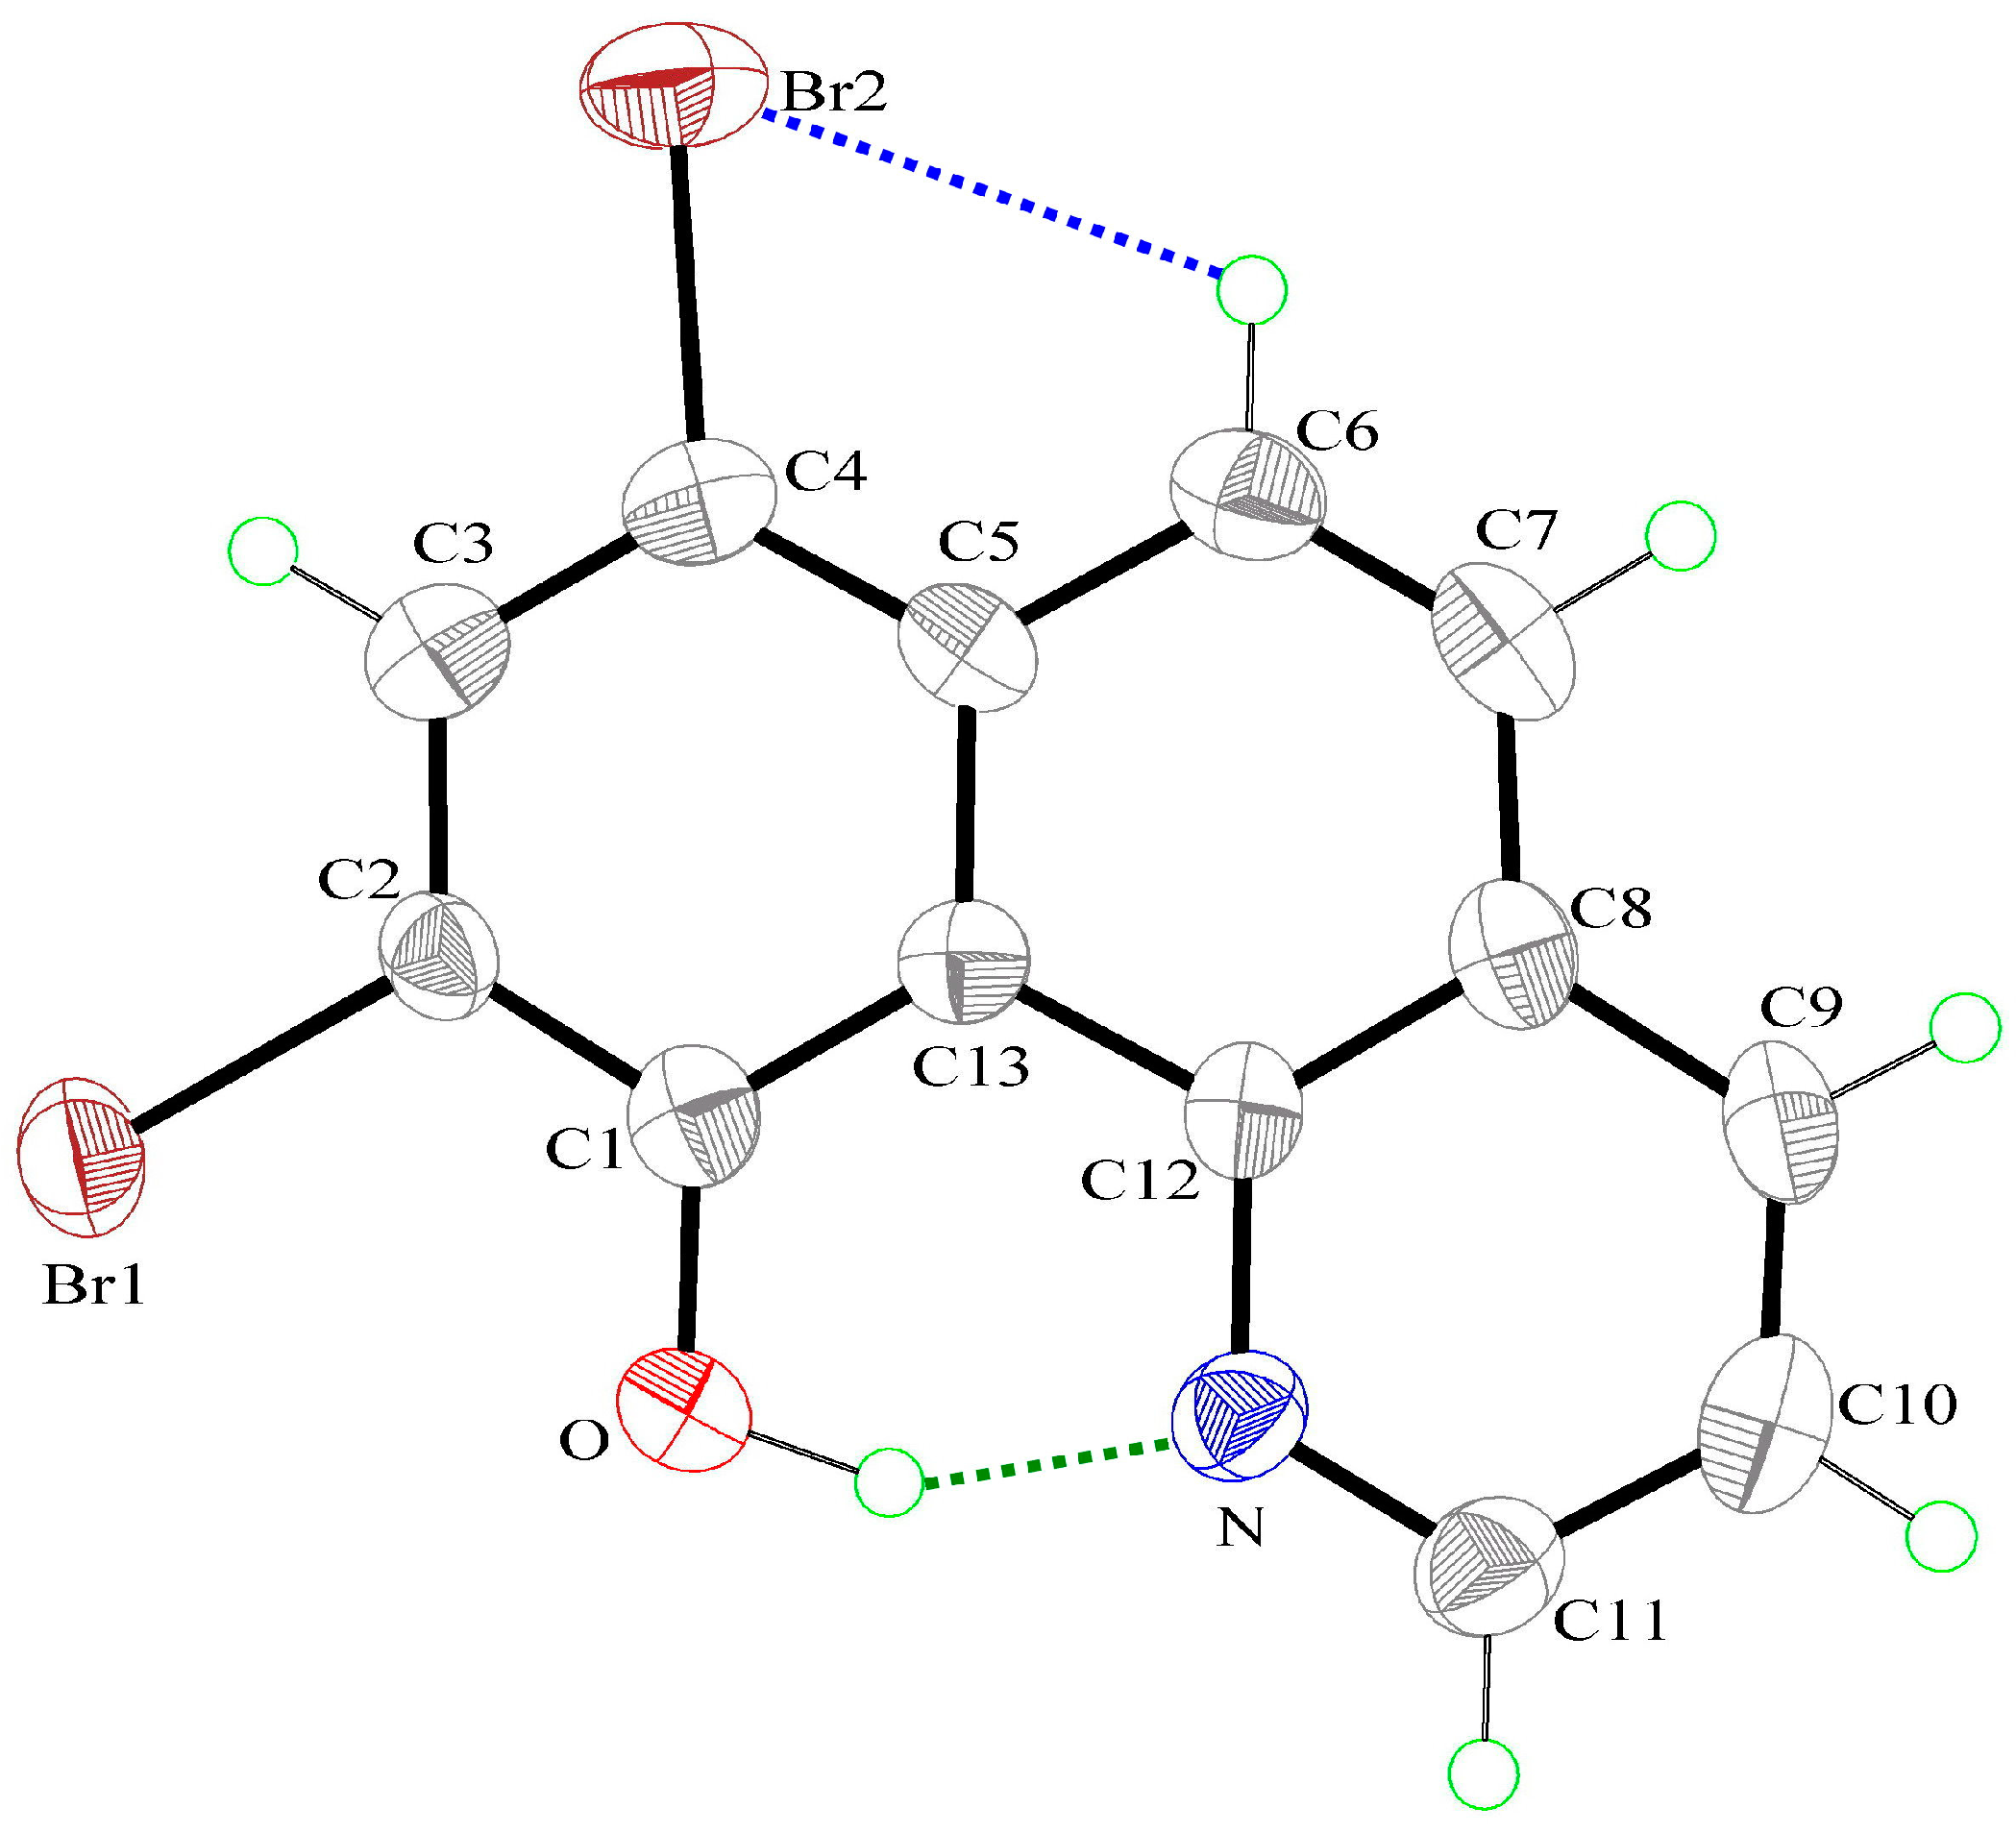
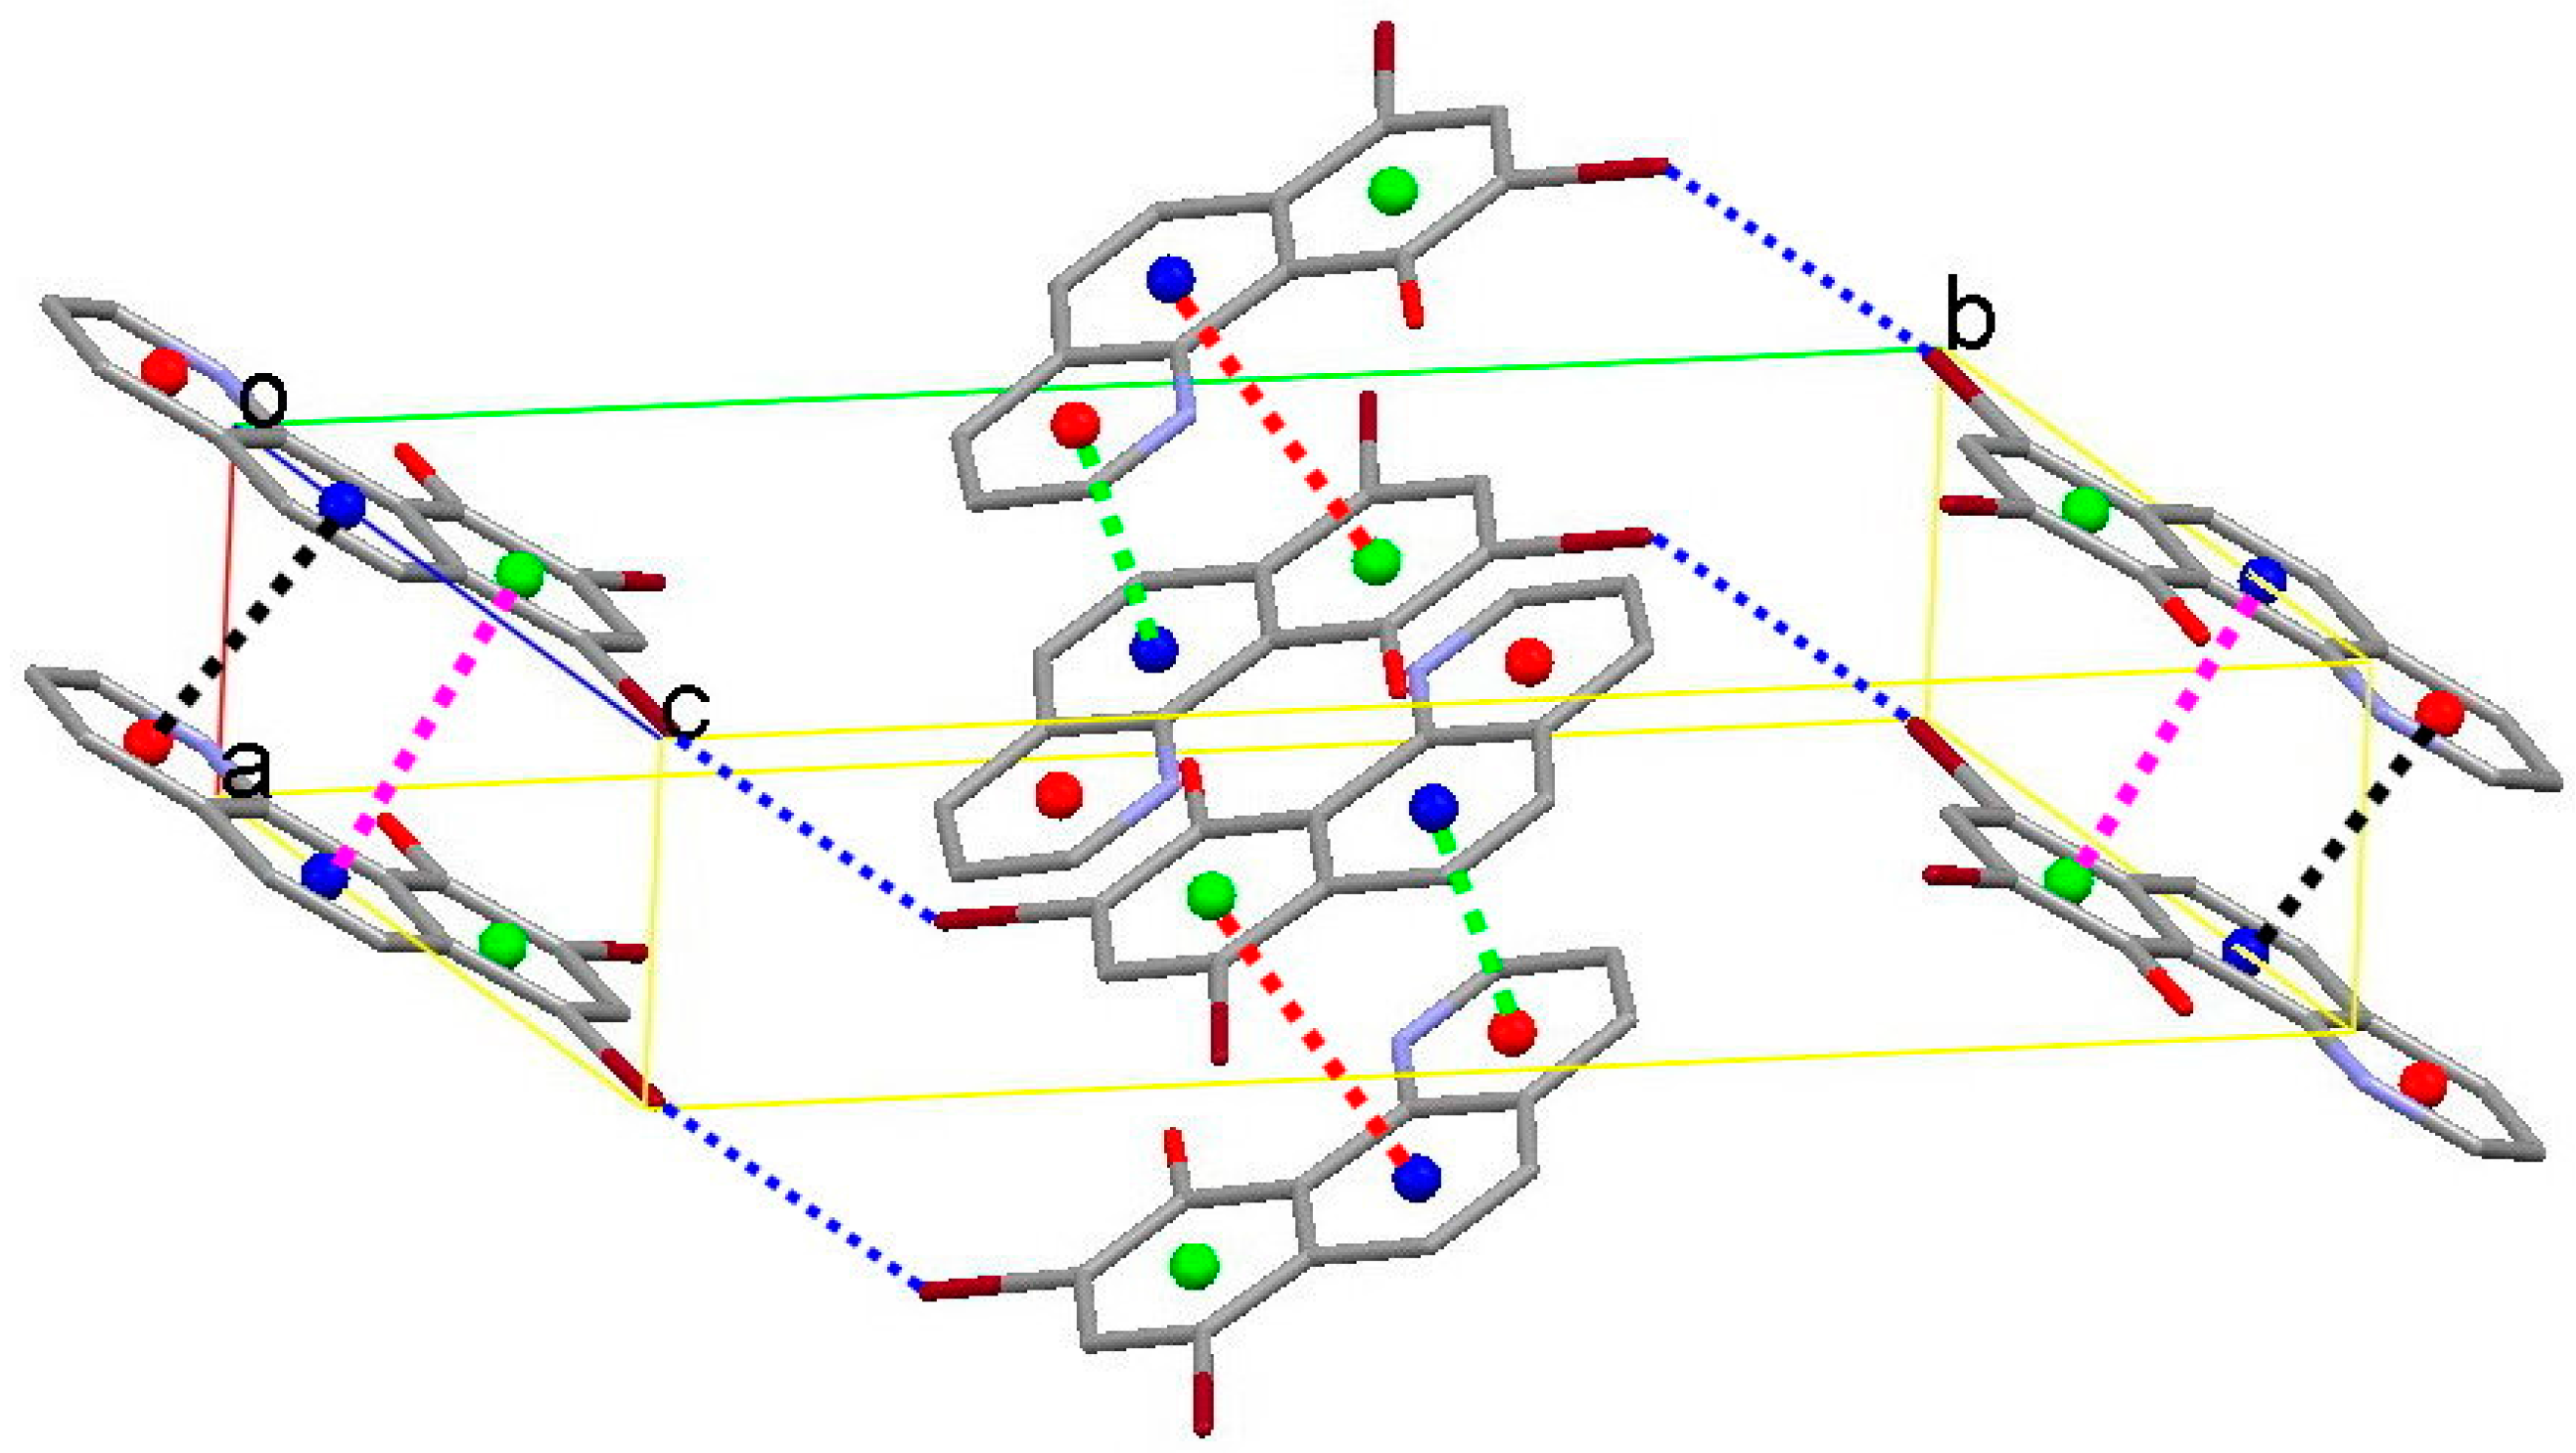
3.2. X-Ray Structures
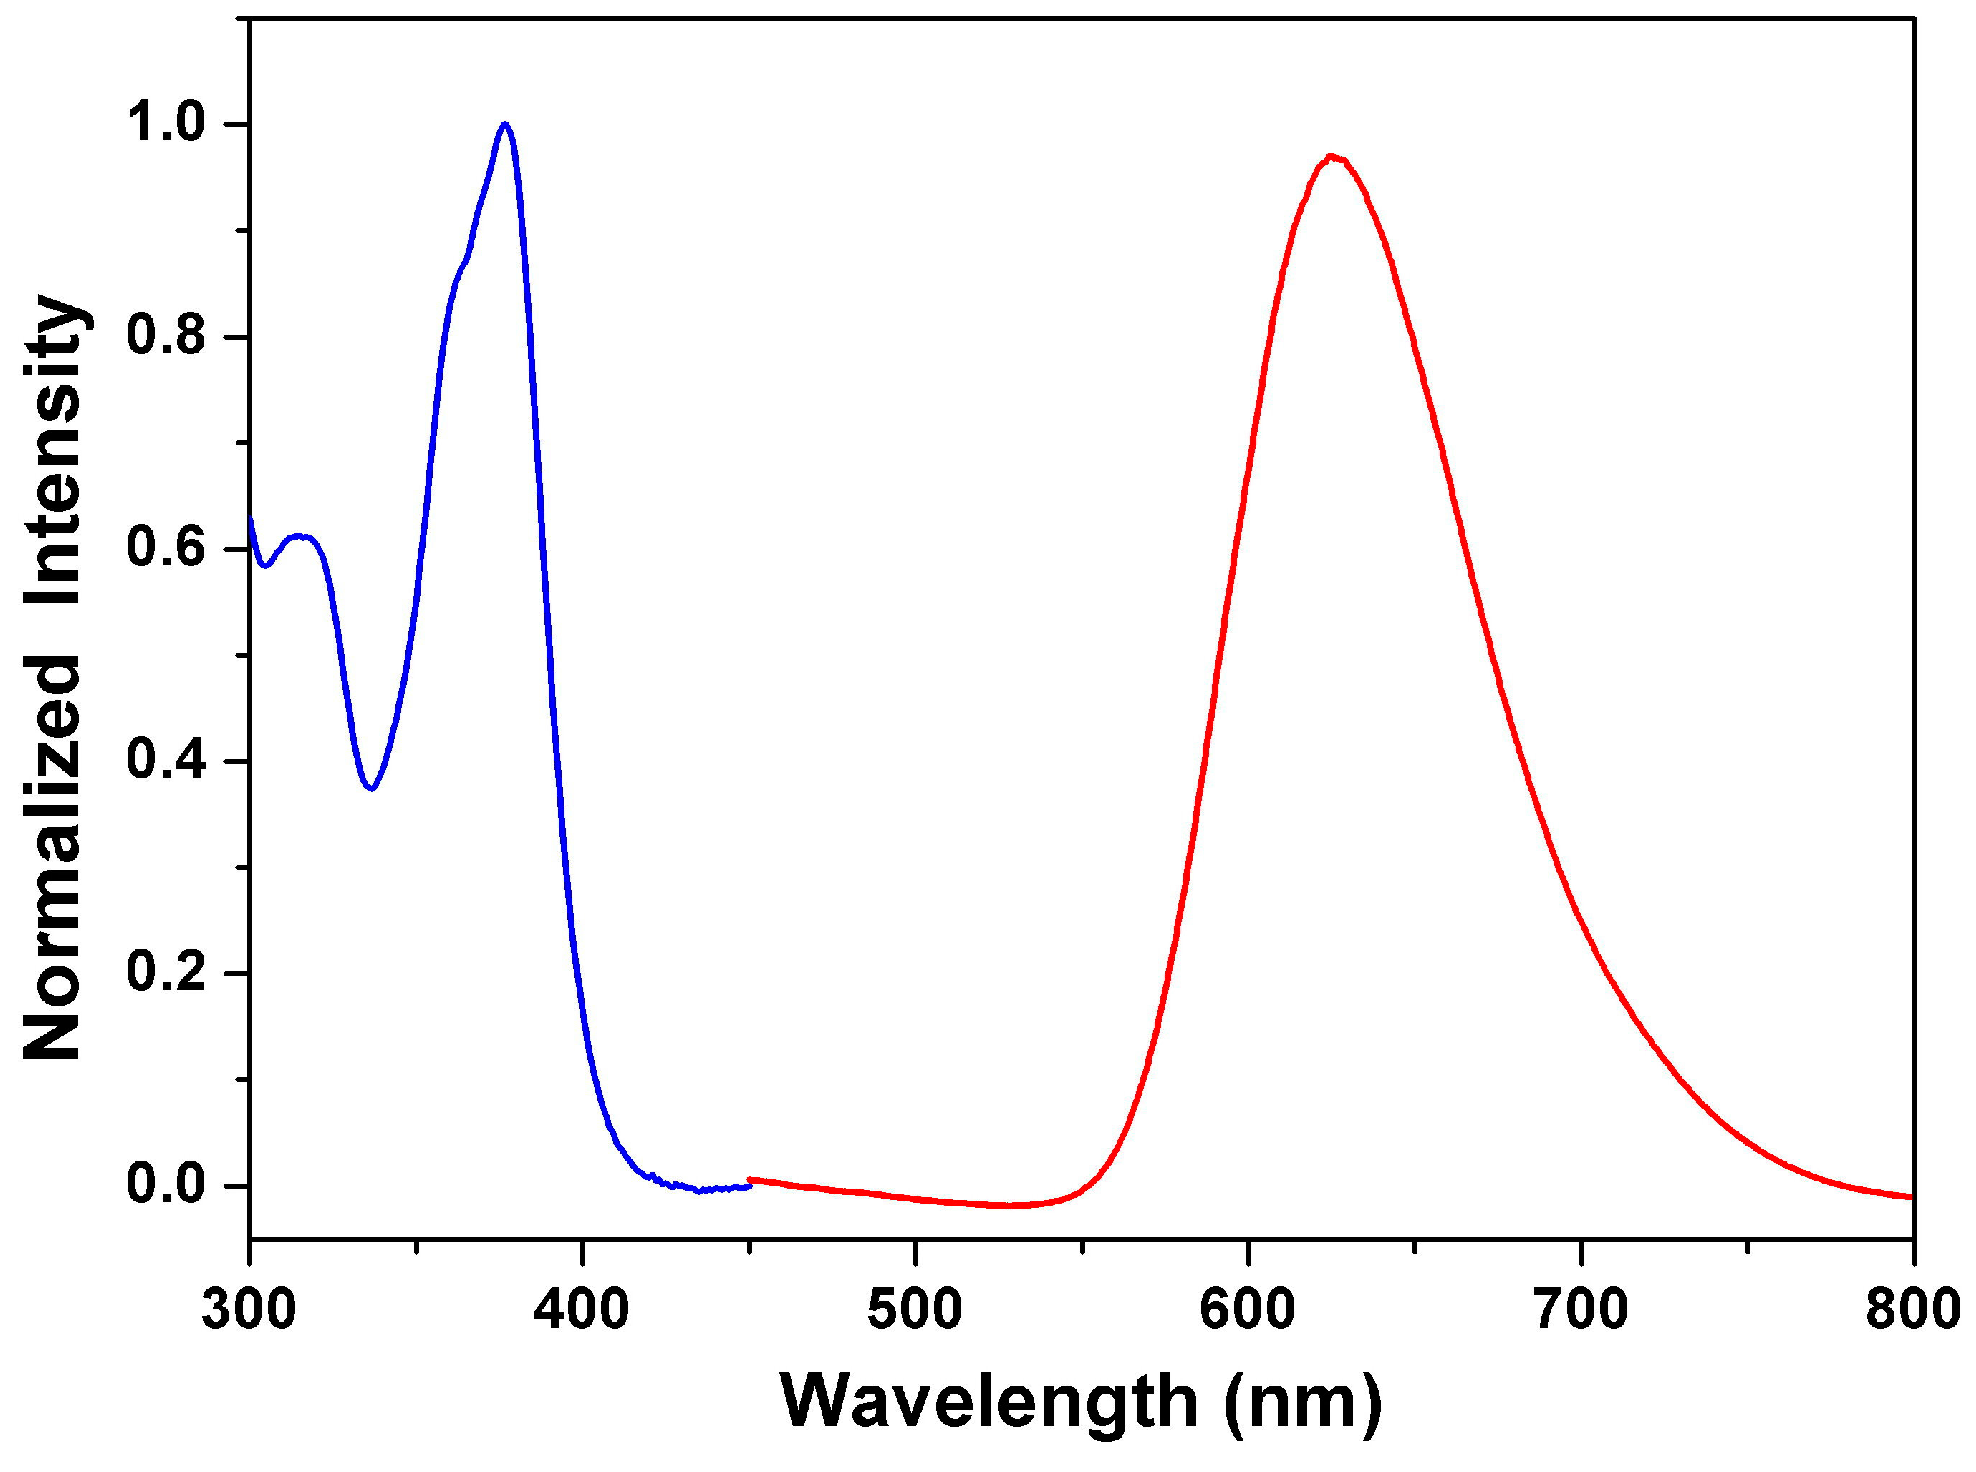
3.3. Optical Properties
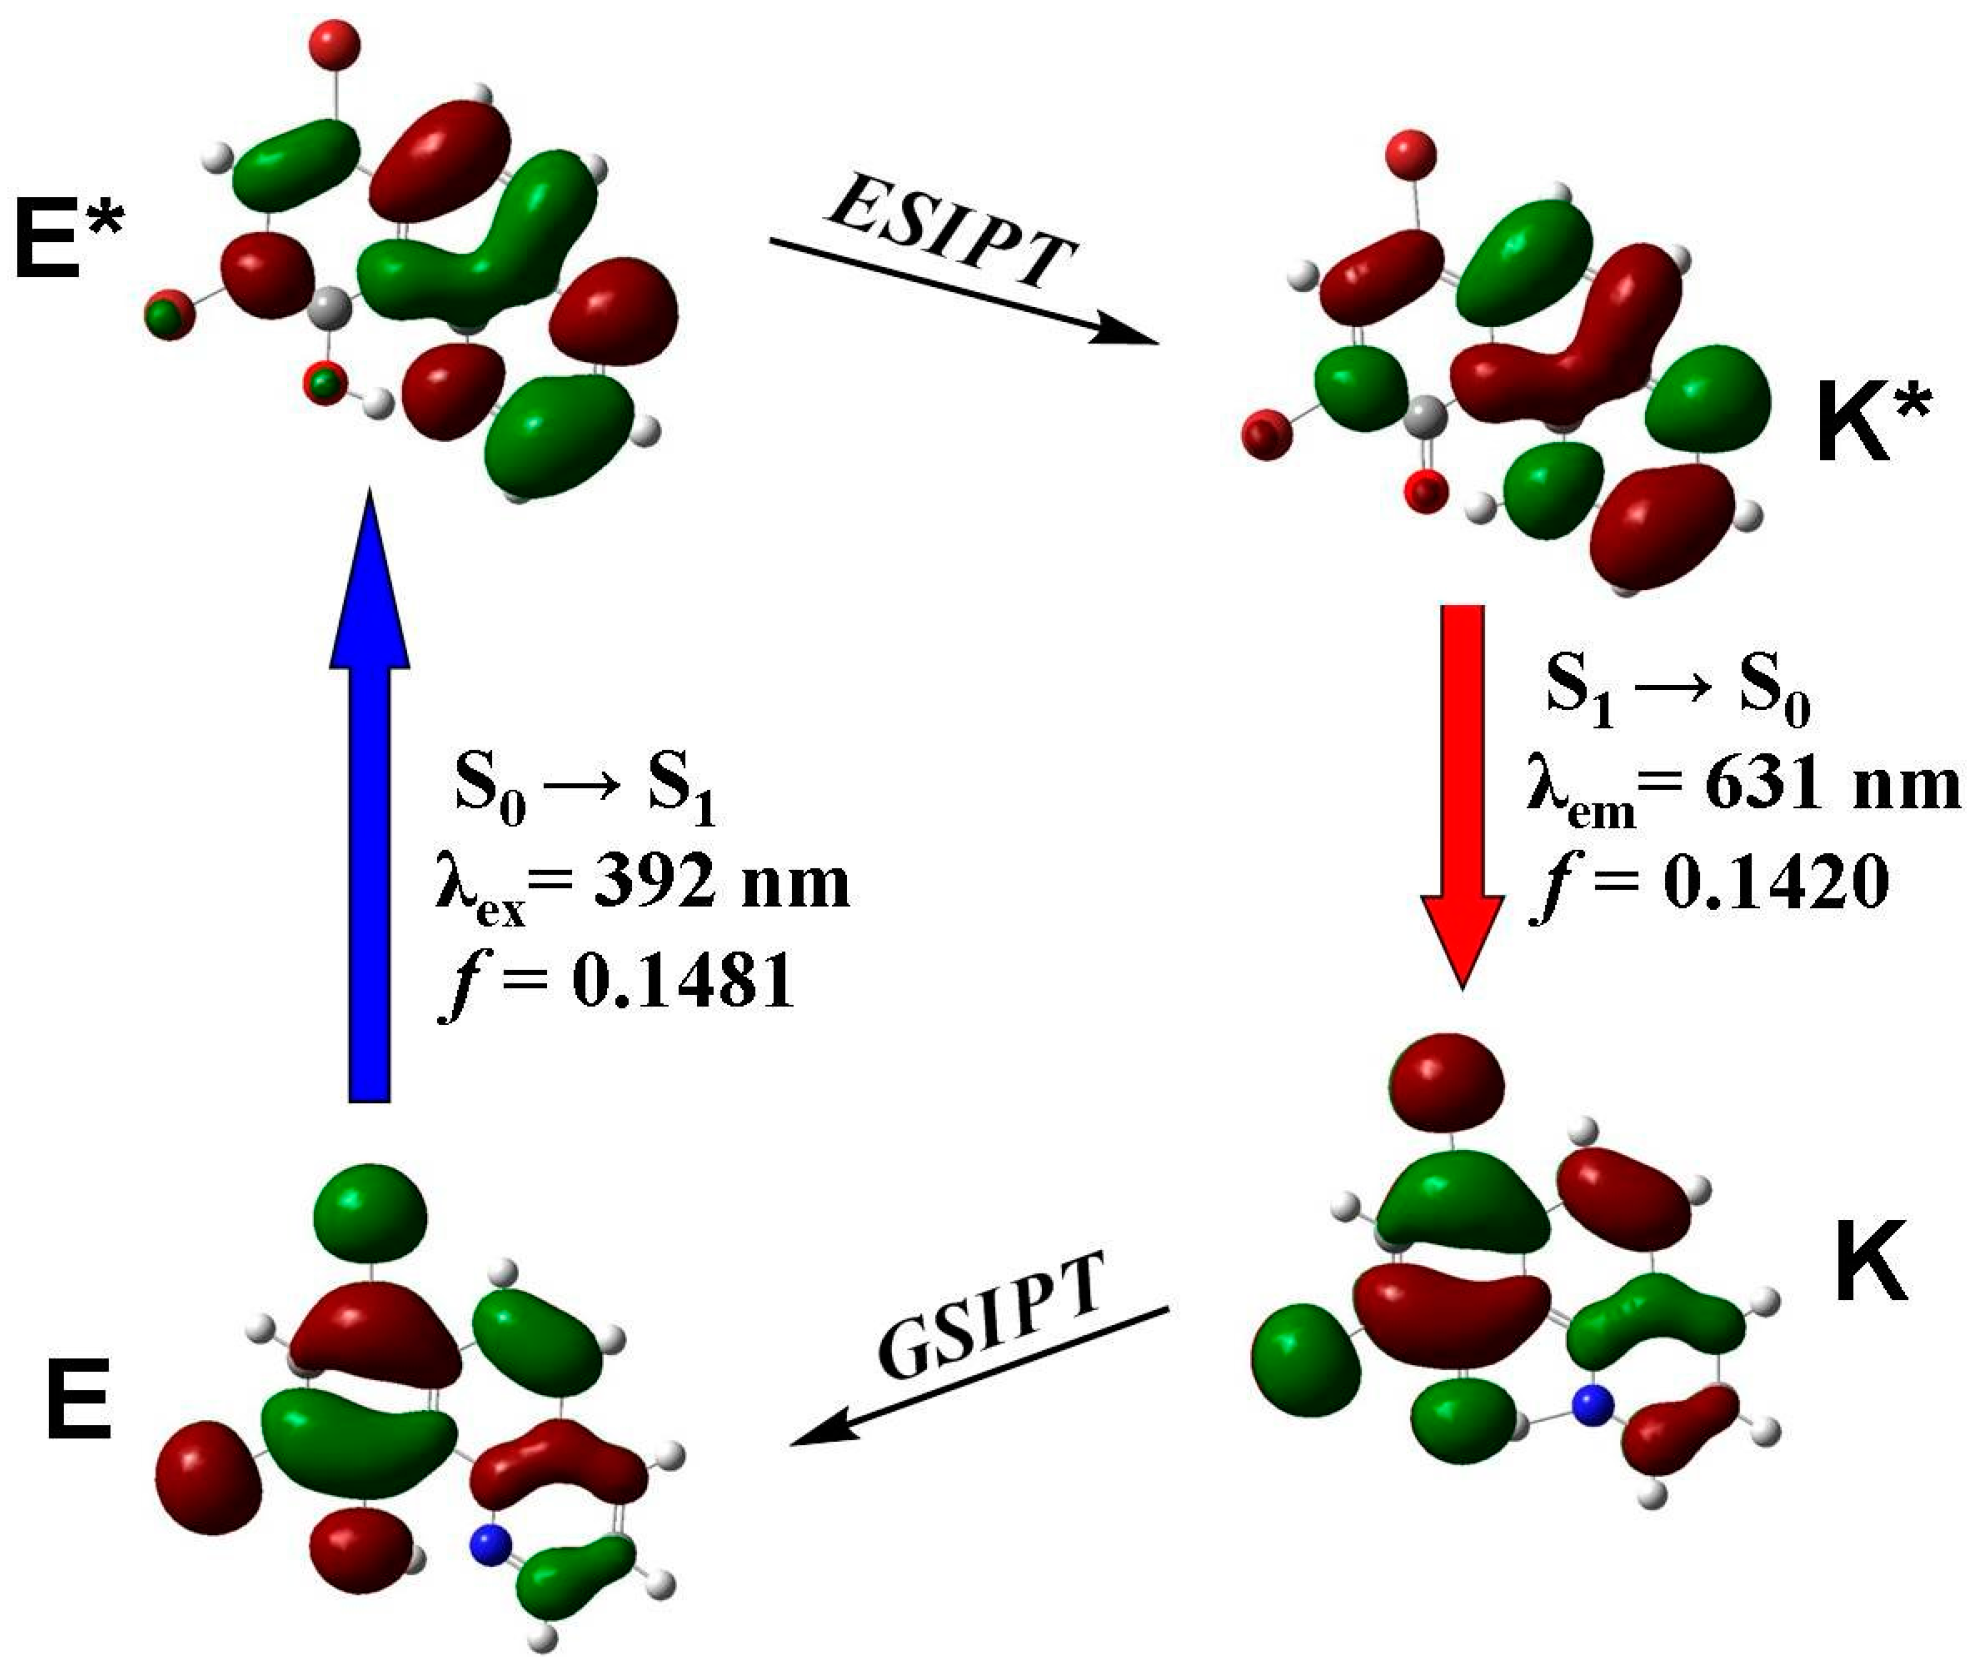
3.4. Quantum Chemistry Computation
4. Materials and Methods
4.1. Chemicals and Instruments
4.2. Synthesis and Characterization
4.3. Crystal Structural Determination
4.4. Computational Methods
5. Conclusions
Supplementary Materials
Acknowledgments
Author Contributions
Conflicts of Interest
References
- Chou, P.T.; Wei, C.Y. Photophysics of 10-hydroxybenzo[h]quinoline in aqueous solution. J. Phys. Chem. 1996, 100, 17059–17066. [Google Scholar] [CrossRef]
- Chen, K.Y.; Hsieh, C.C.; Cheng, Y.M.; Lai, C.H.; Chou, P.T. Extensive spectral tuning of the proton transfer emission from 550 to 675 nm via a rational derivatization of 10-hydroxybenzo[h]quinoline. Chem. Commun. 2006, 42, 4395–4397. [Google Scholar] [CrossRef] [PubMed]
- Satam, M.A.; Raut, R.K.; Telore, R.D.; Sekar, N. Fluorescent acid azo dyes from 3-(1,3-benzothiazol-2-yl)naphthalen-2-ol and comparison with 2-naphthol analogs. Dyes Pigment. 2013, 97, 32–42. [Google Scholar] [CrossRef]
- Luo, M.H.; Tsai, H.Y.; Lin, H.Y.; Fang, S.K.; Chen, K.Y. Extensive spectral tuning of the proton transfer emission from green to red via a rational derivatization of salicylideneaniline. Chin. Chem. Lett. 2012, 23, 1279–1282. [Google Scholar] [CrossRef]
- Fang, T.C.; Tsai, H.Y.; Luo, M.H.; Chang, C.W.; Chen, K.Y. Excited-state charge coupled proton transfer reaction via the dipolar functionality of salicylideneaniline. Chin. Chem. Lett. 2013, 24, 145–148. [Google Scholar] [CrossRef]
- Satam, M.A.; Raut, R.K.; Sekar, N. Fluorescent azo disperse dyes from 3-(1,3-benzothiazol-2-yl)naphthalen-2-ol and comparison with 2-naphthol analogs. Dyes Pigment. 2013, 96, 92–103. [Google Scholar] [CrossRef]
- Chen, K.Y.; Tsai, H.Y. Synthesis, X-ray structure, spectroscopic properties and DFT studies of a novel Schiff base. Int. J. Mol. Sci. 2014, 15, 18706–18724. [Google Scholar] [CrossRef] [PubMed]
- Xie, L.; Chen, Y.; Wu, W.; Guo, H.; Zhao, J.; Yu, X. Fluorescent coumarin derivatives with large stokes shift, dual emission and solid state luminescent properties: An experimental and theoretical study. Dyes Pigment. 2012, 92, 1361–1369. [Google Scholar] [CrossRef]
- Mahapatra, A.K.; Maiti, K.; Sahoo, P.; Nandi, P.K. A new colorimetric and fluorescent bis(coumarin)methylene probe for fluoride ion detection based on the proton transfer signaling mode. J. Lumin. 2013, 143, 349–354. [Google Scholar] [CrossRef]
- Lim, C.K.; Seo, J.; Kim, S.; Kwon, I.C.; Ahn, C.H.; Park, S.Y. Concentration and pH-modulated dual fluorescence in self-assembled nanoparticles of phototautomerizable biopolymeric amphiphile. Dyes Pigment. 2011, 90, 284–289. [Google Scholar] [CrossRef]
- Hong, W.H.; Lin, C.C.; Hsieh, T.S.; Chang, C.C. Preparation of fluoroionophores based on diamine-salicylaldehyde derivatives. Dyes Pigment. 2012, 94, 371–379. [Google Scholar] [CrossRef]
- Chen, K.Y.; Cheng, Y.M.; Lai, C.H.; Hsu, C.C.; Ho, M.L.; Lee, G.H.; Chou, P.T. Ortho green fluorescence protein synthetic chromophore; excited-state intramolecular proton transfer via a seven-membered-ring hydrogen-bonding system. J. Am. Chem. Soc. 2007, 129, 4534–4535. [Google Scholar] [CrossRef] [PubMed]
- Zhang, M.; Yang, D.; Ren, B.; Wang, D. A TDDFT study on the excited-state intramolecular proton transfer (ESIPT): Excited-state equilibrium induced by electron density swing. J. Fluoresc. 2013, 23, 761–766. [Google Scholar] [CrossRef] [PubMed]
- Ashraf, M.; Teshome, A.; Kay, A.J.; Gainsford, G.J.; Bhuiyan, M.D.H.; Asselberghs, I.; Clays, K. Synthesis and optical properties of NLO chromophores containing an indoline donor and azo linker. Dyes Pigment. 2012, 95, 455–464. [Google Scholar] [CrossRef]
- Lin, W.C.; Fang, S.K.; Hu, J.W.; Tsai, H.Y.; Chen, K.Y. Ratiometric fluorescent/colorimetric cyanide-selective sensor based on excited-state intramolecular charge transfer-excited-state intramolecular proton transfer switching. Anal. Chem. 2014, 86, 4648–4652. [Google Scholar] [CrossRef] [PubMed]
- Zhang, Y.J.; He, X.P.; Hu, M.; Li, Z.; Shi, X.X.; Chen, G.R. Highly optically selective and electrochemically active chemosensor for copper (II) based on triazole-linked glucosyl anthraquinone. Dyes Pigment. 2011, 88, 391–395. [Google Scholar] [CrossRef]
- Huang, Q.; Yang, X.F.; Li, H. A ratiometric fluorescent probe for hydrogen sulfide based on an excited-state intramolecular proton transfer mechanism. Dyes Pigm. 2013, 99, 871–877. [Google Scholar] [CrossRef]
- Prabhu, S.; Saravanamoorthy, S.; Ashok, M.; Velmathi, S. Colorimetric and fluorescent sensing of multi metal ions and anions by salicylaldimine based receptors. J. Lumin. 2012, 132, 979–986. [Google Scholar] [CrossRef]
- Patil, V.S.; Padalkar, V.S.; Tathe, A.B.; Sekar, N. ESIPT-inspired benzothiazole fluorescein: Photophysics of microenvironment pH and viscosity. Dyes Pigment. 2013, 98, 507–517. [Google Scholar] [CrossRef]
- Ito, Y.; Amimoto, K.; Kawato, T. Prototropic tautomerism and solid-state photochromism of N-phenyl-2-aminotropones. Dyes Pigment. 2011, 89, 319–323. [Google Scholar] [CrossRef]
- Li, Y.; Wang, D.; Wang, L.; Li, Z.; Cui, Q.; Zhang, H.; Yang, H. Novel asymmetrical pyrene derivatives as light emitting materials: Synthesis and photophysics. J. Lumin. 2012, 132, 1010–1014. [Google Scholar] [CrossRef]
- Chuang, W.T.; Hsieh, C.C.; Lai, C.H.; Lai, C.H.; Shih, C.W.; Chen, K.Y.; Hung, W.Y.; Hsu, Y.H.; Chou, P.T. Excited-state intramolecular proton transfer molecules bearing o-hydroxy analogues of green fluorescent protein chromophore. J. Org. Chem. 2011, 76, 8189–8202. [Google Scholar] [CrossRef] [PubMed]
- Xu, H.; Yue, Y.; Wang, H.; Chen, I.; Hao, Y.; Xu, B. Single-crystal structure, photophysical characteristics and electroluminescent properties of bis(2-(4-trifluoromethyl-2-hydroxyphenyl)benzothiazolate)zinc. J. Lumin. 2012, 132, 919–923. [Google Scholar] [CrossRef]
- Tang, K.C.; Chang, M.J.; Lin, T.Y.; Pan, H.A.; Fang, T.C.; Chen, K.Y.; Hung, W.Y.; Hsu, Y.H.; Chou, P.T. Fine tuning the energetics of excited-state intramolecular proton transfer (ESIPT): White light generation in a single ESIPT system. J. Am. Chem. Soc. 2011, 133, 17738–17745. [Google Scholar] [CrossRef] [PubMed]
- Fang, S.K.; Tsai, H.Y.; Hu, J.W.; Chen, K.Y. A white-light-emitting small molecule: Synthesis, crystal structure and optical properties. Int. J. Photoenergy 2014. [Google Scholar] [CrossRef]
- Hu, J.W.; Wu, Y.H.; Tsai, H.Y.; Chen, K.Y. Synthesis, X-ray structure, optical, and electrochemical properties of a white-light-emitting molecule. Materials 2016, 9, 48. [Google Scholar] [CrossRef]
- Kubicki, M.; Borowiak, T.; Antkowiak, W.Z. 10-Hydroxybenzo[h]quinoline. Acta Cryst. 1995, C51, 1173–1175. [Google Scholar] [CrossRef]
- Schaefer, T. Relation between hydroxyl proton chemical shifts and torsional frequencies in some ortho-substituted phenol derivatives. J. Phys. Chem. 1975, 79, 1888–1890. [Google Scholar] [CrossRef]
- Chen, K.Y.; Hu, J.W. Excited-state charge coupled proton transfer reaction in dipole-functionalized salicylideneaniline. J. Lumin. 2015, 159, 171–177. [Google Scholar] [CrossRef]
- Chen, K.Y. Crystal structure, hydrogen-bonding properties and DFT studies of 2-((2-(2-hydroxyphenyl)benzo[d]thiazol-6-yl)methylene)malononitrile. Mol. Cryst. Liq. Cryst. 2015, 623, 285–296. [Google Scholar] [CrossRef]
- Chen, K.Y.; Tsai, H.Y.; Lin, W.C.; Chu, H.H.; Weng, Y.C.; Chan, C.C. ESIPT fluorescent dyes with adjustable optical properties: Substituent and conjugation effects. J. Lumin. 2014, 154, 168–177. [Google Scholar] [CrossRef]
- Chen, K.Y.; Tsai, H.Y.; Lin, W.C.; Chu, H.H.; Weng, Y.C.; Chan, C.C. Synthesis, crystal structure, optical and electrochemical properties of 9,10-dihydroxybenzo[h]quinoline. J. Chem. Sci. 2014, 124, 955–966. [Google Scholar] [CrossRef]
- Nishigaki, S.; Yoshioka, H.; Nakatsu, K. The crystal and molecular structure of o-phenanthroline. Acta Cryst. 1978, B34, 875–879. [Google Scholar] [CrossRef]
- Sheldrick, G.M. SHELXS97, A Program for Automatic Solution of Crystal Structure; University of Göttingen: Göttingen, Germany, 1997. [Google Scholar]
- Sheldrick, G.M. SHELX97, A Program for Crystal Structure Refinement; University of Göttingen: Göttingen, Germany, 1997. [Google Scholar]
- Frisch, M.J.; Trucks, G.W.; Schlegel, H.B.; Scuseria, G.E.; Robb, M.A.; Cheeseman, J.R.; Montgomery, J.A.; Vreven, T., Jr.; Kudin, K.N.; Burant, J.C.; et al. Gaussian 03; Gaussian, Inc.: Pittsburgh, PA, USA, 2003. [Google Scholar]
- Capobianco, A.; Borrelli, R.; Landi, A.; Velardo, A.; Peluso, A. Absorption band shapes of a push–pull dye approaching the cyanine limit: A challenging case for first principle calculations. J. Phys. Chem. A 2016, 120, 5581–5589. [Google Scholar] [CrossRef] [PubMed]


| Compound | 1 | 2 |
|---|---|---|
| Chemical Formula | C13H7Br2NO | C13H9NO |
| Formula Weight | 353.02 | 195.21 |
| Crystal System | Monoclinic | Orthorhombic |
| Space Group | P21/n | Pbc21 |
| a (Å) | 3.9573(4) | 4.6530(4) |
| b (Å) | 18.0416(18) | 15.1910(10) |
| c (Å) | 15.8210(16) | 26.902(2) |
| α (°) | 90 | 90 |
| β (°) | 96.139(3) | 90 |
| γ (°) | 90 | 90 |
| Volume (Å3) | 1123.1(2) | 1901.5(2) |
| Z | 4 | 8 |
| Dcalc (g cm−3) | 2.088 | 1.364 |
| μ (mm−1) | 7.197 | 0.695 |
| F000 | 680 | 816 |
| Crystal Size (mm3) | 0.38 × 0.08 × 0.07 | 0.35 × 0.20 × 0.15 |
| θ range (°) | 3.43–26.38 | 19.35–37.54 |
| Index ranges | –4 ≤ h≤ 4 | 0 ≤ h ≤ 5 |
| 22 ≤ k ≤ 22 | 0 ≤ k ≤ 16 | |
| –19 ≤ l ≤ 19 | 0 ≤ l ≤ 29 | |
| Reflections Collected | 16148 | 1312 |
| Independent Reflections (Rint) | 2266 (0.0438) | 1312 (0.0000) |
| Refinement Method on F2 | Full-matrix least-squares | Full-matrix least-squares |
| GOF on F2 | 1.095 | 1.213 |
| R1 [I > 2σ (I)] | 0.0472 | 0.0383 |
| wR2 [I > 2σ (I)] | 0.1296 | 0.0767 |
| R1 (All Data) | 0.0729 | 0.0559 |
| wR2 (All Data) | 0.1620 | 0.1128 |
| Residual (e·Å−3) | 1.100 and −0.507 | 0.117 and −0.131 |
| Compound 1 | X-ray | DFT |
|---|---|---|
| Bond Lengths (Å) | ||
| O–C(1) | 1.337(8) | 1.361 |
| N–C(11) | 1.311(8) | 1.342 |
| N–C(12) | 1.377(8) | 1.380 |
| C(2)–C(3) | 1.386(9) | 1.408 |
| C(4)–C(5) | 1.393(9) | 1.421 |
| C(6)–C(7) | 1.333(10) | 1.372 |
| C(9)–C(10) | 1.352(11) | 1.396 |
| C(12)–C(13) | 1.440(8) | 1.451 |
| Br(1)–C(2) | 1.892(6) | 1.950 |
| Br(2)–C(4) | 1.901(6) | 1.974 |
| Bond Angles (°) | ||
| C(11)–N–C(12) | 120.0(5) | 120.1 |
| O–C(1)–C(2) | 120.3(5) | 120.2 |
| C(1)–C(2)–C(3) | 122.5(6) | 121.2 |
| C(4)–C(5)–C(6) | 122.9(6) | 123.2 |
| C(9)–C(10)–C(11) | 120.7(6) | 118.6 |
| C(8)–C(12)–C(13) | 121.6(6) | 120.7 |
| Torsion Angles (°) | ||
| C(12)–N–C(11)–C(10) | 0.2(10) | 0.1 |
| O–C(1)–C(2)–Br(1) | –1.2(8) | –0.1 |
| C(2)–C(3)–C(4)–C(5) | 0.7(10) | 0.1 |
| C(6)–C(7)–C(8)–C(9) | 179.5(7) | 179.9 |
| C(1)–C(13)–C(12)–C(8) | 178.0(6) | 179.9 |
| D–H⋯A | d(D–H) | d(H⋯A) | d(D⋯A) | ∠DHA |
|---|---|---|---|---|
| O–H(0A)⋯N | 1.00(9) | 1.65(9) | 2.529(8) | 144(8) |
| C(6)–H(6A)⋯Br(2) | 0.93 | 2.79 | 3.216(7) | 109 |
© 2017 by the authors. Licensee MDPI, Basel, Switzerland. This article is an open access article distributed under the terms and conditions of the Creative Commons Attribution (CC BY) license ( http://creativecommons.org/licenses/by/4.0/).
Share and Cite
Tsai, H.-Y.; Chang, Y.J.; Hu, J.-W.; Chen, K.-Y. Synthesis, Crystal Structure, Spectroscopic Properties, and DFT Studies of 7,9-Dibromobenzo[h]quinolin-10-ol. Crystals 2017, 7, 60. https://doi.org/10.3390/cryst7020060
Tsai H-Y, Chang YJ, Hu J-W, Chen K-Y. Synthesis, Crystal Structure, Spectroscopic Properties, and DFT Studies of 7,9-Dibromobenzo[h]quinolin-10-ol. Crystals. 2017; 7(2):60. https://doi.org/10.3390/cryst7020060
Chicago/Turabian StyleTsai, Hsing-Yang, Yuan Jay Chang, Jiun-Wei Hu, and Kew-Yu Chen. 2017. "Synthesis, Crystal Structure, Spectroscopic Properties, and DFT Studies of 7,9-Dibromobenzo[h]quinolin-10-ol" Crystals 7, no. 2: 60. https://doi.org/10.3390/cryst7020060