Article

Ultrasound Assisted Particle Size Control by Continuous Seed Generation and Batch Growth

1
Department of Chemical Engineering, KU Leuven, Celestijnenlaan 200F, 3001 Leuven, Belgium
2
Faculty of Engineering Technology, KU Leuven, Agoralaan Building B Box 8, 3590 Diepenbeek, Belgium
*
Author to whom correspondence should be addressed.
Crystals 2017, 7(7), 195; https://doi.org/10.3390/cryst7070195
Submission received: 10 April 2017 / Revised: 16 June 2017 / Accepted: 22 June 2017 / Published: 29 June 2017
(This article belongs to the Special Issue Advances in Ultrasound Stimulated Crystallization)

Abstract

:
Controlling particle size is essential for crystal quality in the chemical and pharmaceutical industry. Several articles illustrate the potential of ultrasound to tune this particle size during the crystallization process. This paper investigates how ultrasound can control the particle size distribution (PSD) of acetaminophen crystals by continuous seed generation in a tubular crystallizer followed by batch growth. It is demonstrated that the supersaturation ratio at which ultrasound starts seed generation has a substantial effect on the final PSD while the applied power is insignificant in the studied conditions. The higher the supersaturation ratio, the smaller the final crystals become up to a supersaturation ratio of 1.56. Furthermore, it was shown that ultrasound can also impact the final PSD when applied during the growth phase. Frequencies of 850 kHz or below reduce the final particle size; the lower the applied frequency, the smaller the crystals become. In conclusion, one could state that ultrasound is able to control the particle size during seed generation and subsequent growth until the final particle size.

1. Introduction

Particle size control is extremely important during crystallization processes in the chemical and pharmaceutical industry [1,2,3,4]. The particle size distribution (PSD) of the produced crystals affects downstream processes such as filtration, milling, and formulation [1,5]. Furthermore, the solubility, disintegration, and dissolution rate of medicines in the human body depend on this parameter [5,6]. The batch processes, often used in industry, suffer from batch-to-batch variabilities in particle size distributions, growth rates, and crystal habits [1,2,7,8]. In addition, scale up is not straight forward as large-scale systems create inhomogeneous conditions with a noticeable impact on the product quality.
Continuous crystallization processes, performed in tubular crystallizers, therefore receive more and more interest. The most important advantages are: more reproducible PSDs, smaller particle sizes, more robust scale-up, shorter downtimes, and easier control over the supersaturation ratio by better temperature control [1,2,7,8]. These continuous crystallizers suffer, nevertheless, from clogging and blocking of their channels by the attachment of crystals to the walls or agglomeration of these crystals [1,4,5,9]. Furthermore, the total residence time which can be achieved in these crystallizers is limited by the tube length and flow rate. Lower flow rates increase the residence time but increase the risk of clogging [1]. Longer tubes increase the pressure drop over the crystallization setup which has to be handled by the pump. This places a practical limit on the tube length because the pump will have a maximum pressure drop above which it is unable to operate. The maximum tube length was for example 27 m for a 2 mm diameter tube in the paper by Eder et al. [4].
Sonocrystallization, i.e., the application of ultrasound during crystallization, provides possible solutions to these problems. Multiple papers report that blocking and clogging of a tubular crystallizer was avoided by the use of ultrasound [4,9,10,11]. It is hypothesized that ultrasound removes particles from the walls by using the vibrations and avoids the agglomeration of particles. Furthermore, lower induction times, smaller Metastable Zone Widths (MZW), the formation of smaller particles, reduced agglomeration, crystal breakage, and improved crystal habits are commonly reported during sonocrystallization [12,13,14,15,16,17,18]. These observations indicate that ultrasound has the potential to control the PSD during the crystallization process.
Nevertheless, only a few papers report on the combined use of ultrasound with a continuous tubular crystallization setup [4,9,11,19,20]. Most of these papers just report on the demonstration of the principle and the production of smaller crystals in the end. Kudo and Takiyama, for example, tested a millisegmented flow crystallizer submerged in an ultrasonic cleaning bath during anti-solvent crystallization of a taurine-water-ethanol system [19]. Significantly smaller crystals of 17.7 µm were obtained in comparison with the 39.2 µm particles produced by a batch crystallization without ultrasound irradiation. Furuta et al. used a tubular crystallizer placed in a tank with an ultrasound probe for a pH-swing crystallization of an active pharmaceutical ingredient (API) [9]. Similarly, small particle sizes of 1–7 µm were obtained by this method compared to considerable larger particles of 10–30 µm without sonication in the tubular crystallizer. Sonication was applied during both nucleation and growth in this setup. In contrast, nucleation, slug formation, and crystal growth were decoupled in the paper by Jiang et al. [11]. First, nucleation was triggered by sonication; next, the slugs were formed by the injection of air into the channel, and finally growth occurred in the 15.2 m tubing. An ultrasonic probe positioned against a tubular crystallizer was used in the nucleation section during the cooling crystallization of L-asparagine monohydrate. This allowed process control over the individual processes and generation of a larger amount of uniform-sized seed crystals compared to direct cooling or the use of micromixers. Nucleation was also decoupled from crystal growth in the paper by Eder et al. [4]. The authors demonstrated a continuously seeded flow-through crystallization system where an ultrasonic cleaning bath could generate a constant seed quantity and quality. The ultrasonic cleaning baths used in these studies generate, however, an inhomogeneous sound field, and are very inefficient and difficult to scale up to an industrial scale [21]. Rossi et al. investigated the droplet-based cooling crystallization of adipic acid in a microfluidic device under sonication [20]. Here, a 20 kHz probe was positioned slightly above the microfluidic channel to introduce acoustic cavitation. The effect of the supersaturation ratio on the PSD and crystal yield was tested. The supersaturation ratio had an insignificant effect on the PSD but impacted the crystal yield. The higher the supersaturation ratio, the higher the crystal yield.
These papers indicate that ultrasound is useful to control nucleation and hence tune the PSD of the final crystals. It is, however, not clear whether sonication during crystal growth makes sense, beyond the fact that it avoids clogging of the tubular crystallizer. The impact of ultrasound on crystal growth is believed to be less significant compared to its influence on nucleation [22]. However, Nii et al. claim that crystal growth can be enhanced by high frequency ultrasound [23]. An ultrasonic frequency of 1.6 MHz was applied during the batch anti-solvent crystallization of glycine in ethanol. Large glycine crystals of about 160 µm were obtained after 60 min sonication at 28 W ultrasound. Under silent conditions (i.e., without the application of ultrasound), crystals of only 110 µm were obtained in the same time frame. The incorporation of microcrystals into larger crystals is hypothesized to cause this enhancement of crystal growth at the high ultrasonic frequency. This enhanced crystal growth by the application of a high ultrasonic frequency, to the authors’ best knowledge, has never been tested for other crystallization reactions.
In this research, acetaminophen seeds were generated in the tubular crystallizer and were afterwards grown in a batch vessel. The goal was to investigate how ultrasound can influence the PSD when applied to a tubular crystallizer for seed generation and to a batch vessel for crystal growth. As acetaminophen is a slow growing crystal, long residence times are needed during crystal growth [24]. The batch vessel allowed us to achieve this long residence time in a practical manner. First, the potential for PSD control by seed generation in a tubular flow setup was investigated. The impact of the supersaturation ratio, ultrasonic power, and introduction of a 3-way valve on the final PSD were studied and discussed. Next, ultrasound was applied only during the growth phase and the influence of the ultrasonic frequency on the final PSD was examined.

2. Materials and Methods

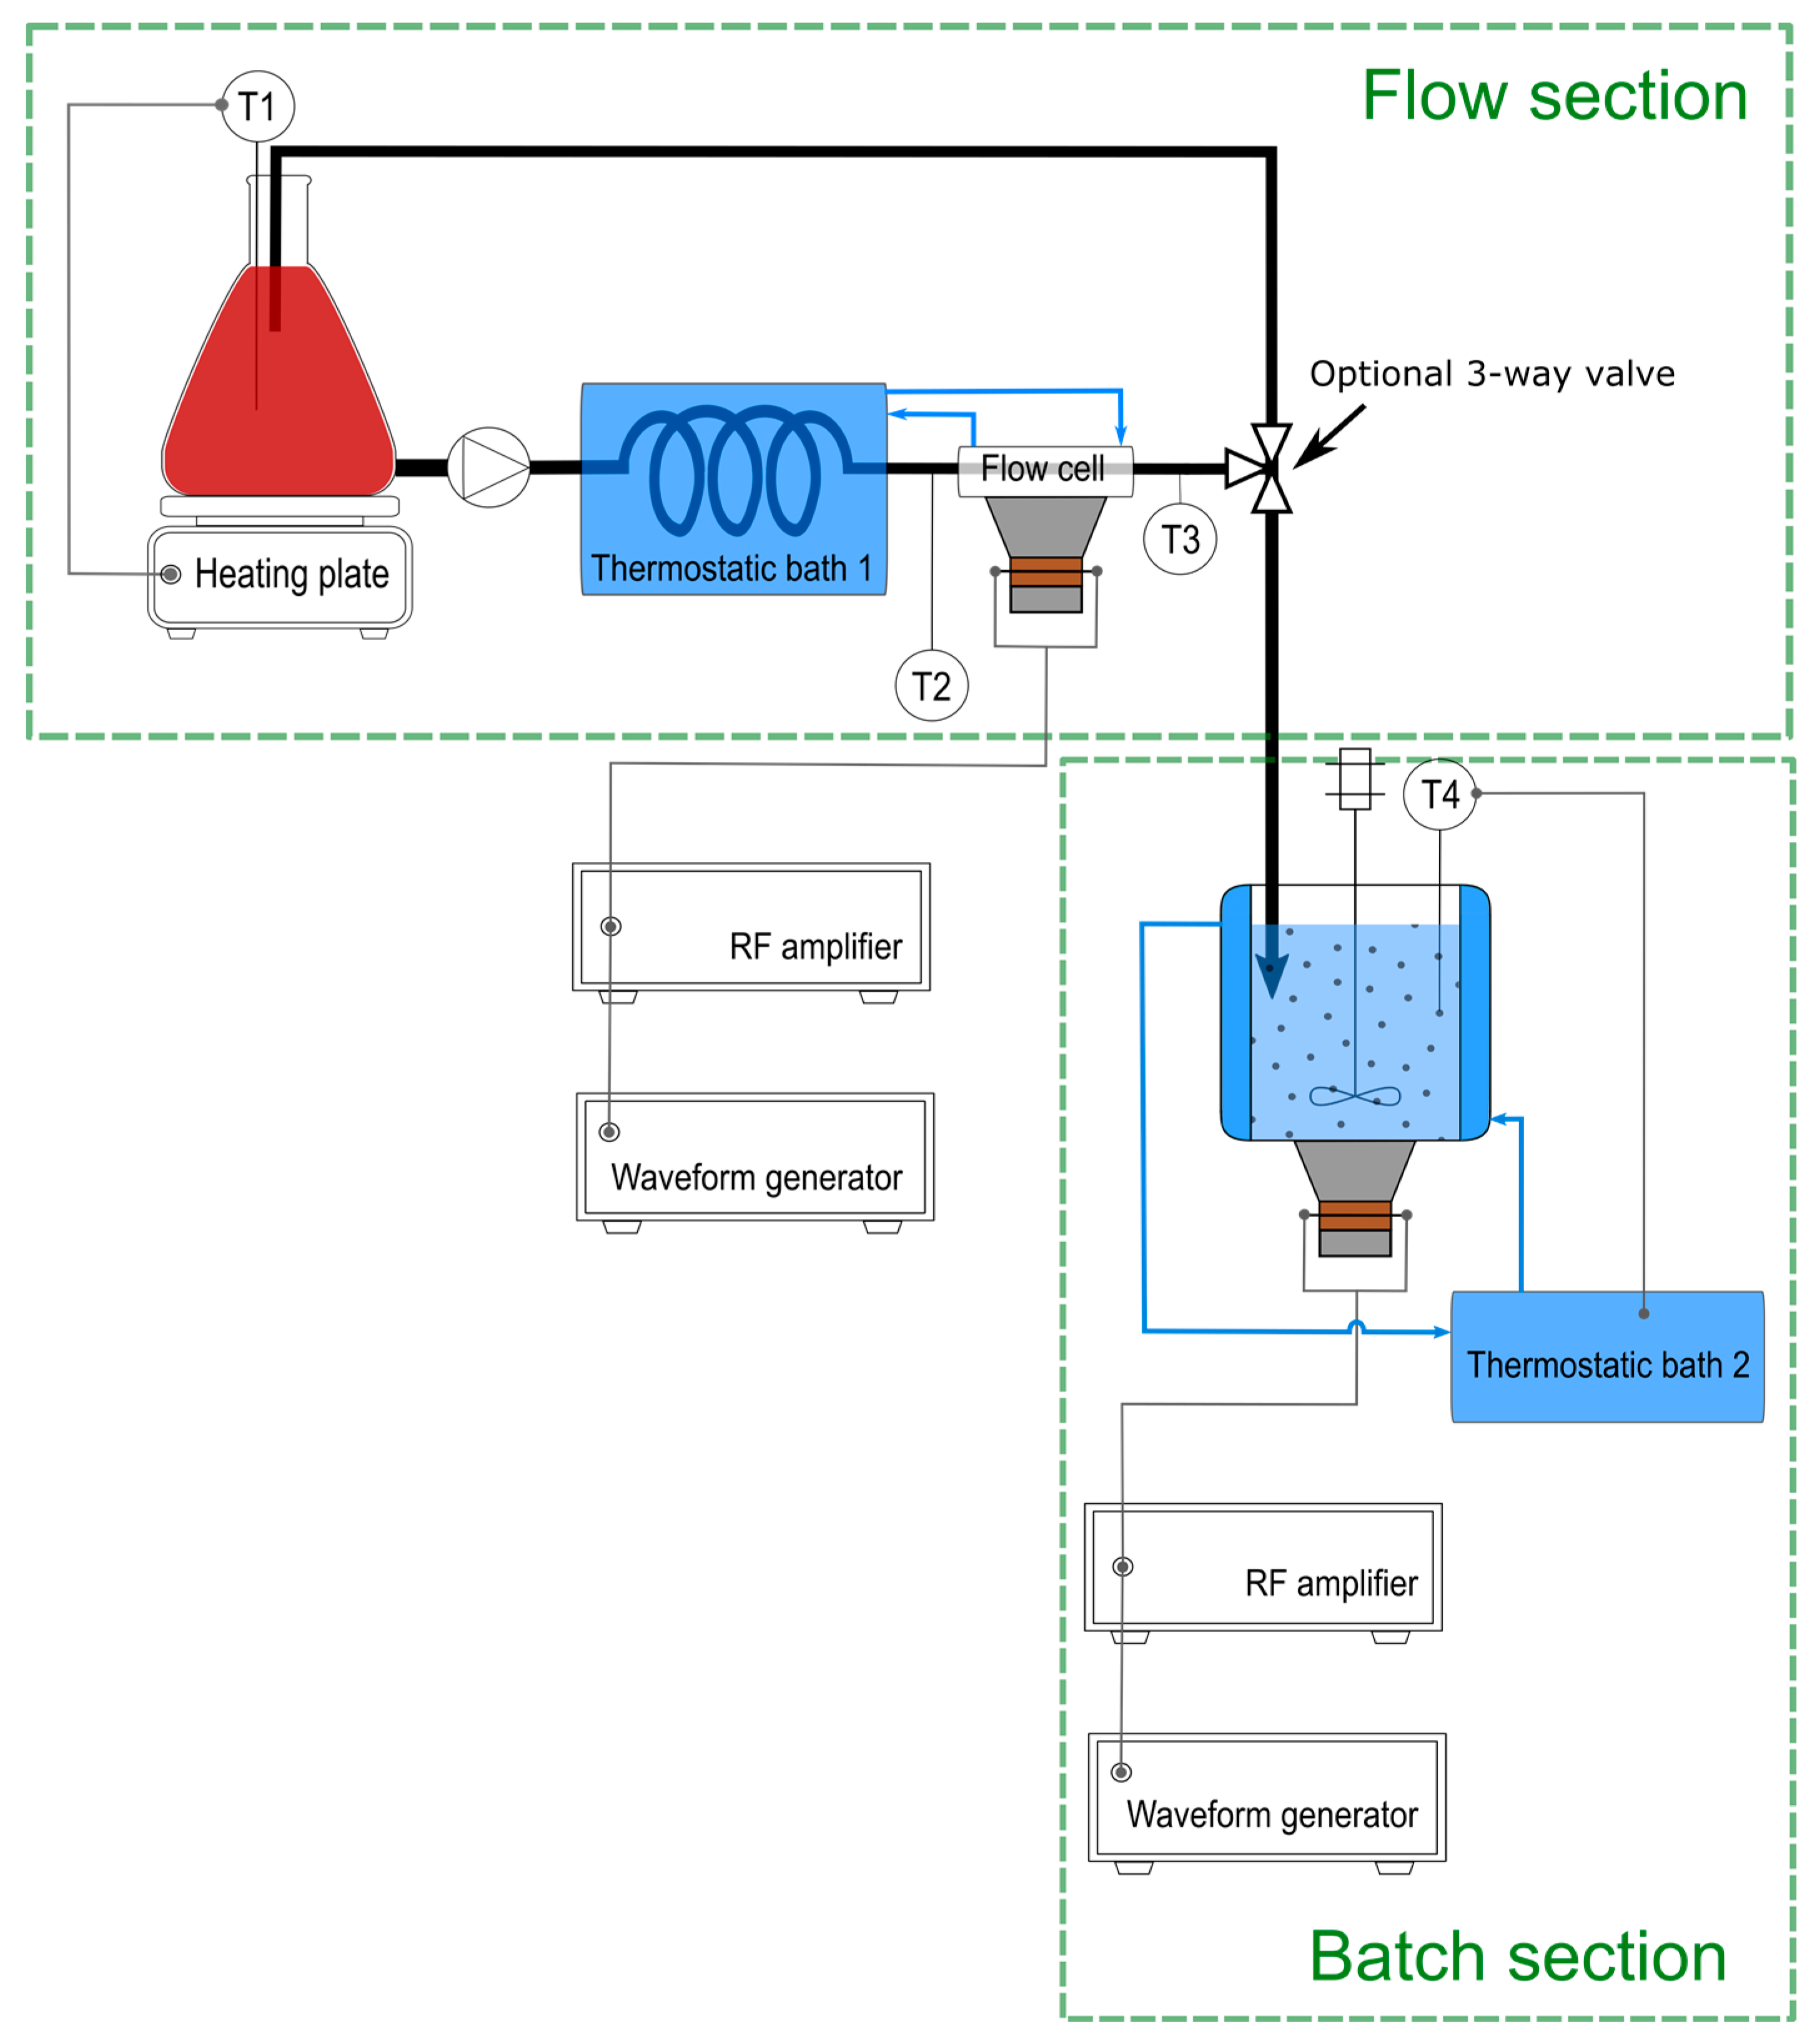
2.1. Experimental Setup

Figure 1 shows the experimental setup with a flow and batch section. The flow section comprises the upper left part of Figure 1 with a 3 L Erlenmeyer flask, a heating plate (IKA RCT Standard), a multi-piston pump (LaboCat HPLH 200 PF pump), thermostatic bath 1 (Lauda RE 620), PFA tubing of 5 mm diameter (thick black lines), and a flow cell. The temperature in the Erlenmeyer flask is kept constant at 60 °C by a Pt100 temperature sensor (T1) placed in the Erlenmeyer flask and connected to the heating plate. Magnetic stirring at 400 rpm is applied by the same heating plate to ensure that the solution is well mixed and no hot spots are present in the solution. The multi-piston pump is used to pump the solution through the flow section at a flow rate of 100 mL/min.
Seven meters of PFA tubing is wound in a spiral and placed in thermostatic bath 1 to act as a heat exchanger. The other parts of the PFA tubing are kept as short as possible to minimize heat losses to the environment. The flow cell is custom made by gluing a transducer (Ultrasonics World MPI-7850D-20_40_60H) to a glass block (80 mm × 80 mm × 16 mm). Figure 2 shows a picture of this flow cell which contains three channels of 5 mm diameter bored into a glass block. The two outer channels are used for temperature control and connected to thermostatic bath 1. This cooling water is circulated in a counter-current manner compared to the crystallization flow. The center channel is connected to the PFA tubing and is used for sonication of the solution. The temperature is also monitored directly before and after the flow cell by two K-type thermocouples (T2 and T3). These are connected to a temperature logger (Pico USB TC-08). A 3-way valve (Rotalibo® PP/PE with 4 mm internal diameter) was, during some experiments, placed in the flow section to drain crystals from this flow setup into the batch vessel.
The batch section of the experimental setup is visible at the bottom right part of Figure 1. It contains a cylindrical vessel, an ultrasound transducer, thermostatic bath 2 (Lauda RE415) with a Pt100 temperature sensor (T4), and an overhead stirrer (Cole Parmer ultra-compact mixer). The vessel is made of a jacketed glass cylinder with an internal diameter of 53 mm, outer diameter of 83 mm, and height of 97 mm. The experimental setup of the batch vessel was already described in a previous paper [25]. The temperature in the batch vessel was controlled by a Pt100 temperature sensor (T4) connected to thermostatic bath 2. This allowed us to compensate for the heat generated by the ultrasound field. The overhead stirrer with an axial blade impeller of 30 mm diameter was used to stir the solution at 400 rpm. This stirring speed of 400 rpm was selected based on experiments previously described in the literature, in order to avoid sedimentation and particle breakage [13]. The transducer is placed at the bottom of the vessel and clamped to the cylinder to allow proper sealing of the vessel. By clamping different transducers to the bottom, each operating at their own resonance frequency, it is possible to use the same vessel over a wide frequency range. Table 1 provides an overview of the different ultrasonic frequencies f (kHz), amplitudes A (kHz), and calorimetric powers Pcal (W) used during the experiments. A waveform generator (Picotest G5100A) and power amplifier (E&I 1020L RF) were used to drive the transducers. This generator and amplifier were subsequently connected to the flow cell for nucleation experiments and the batch vessel for growth experiments.

2.2. Calorimetric Power Calibration

The resonance frequencies (f) of the transducers were defined by an impedance analyzer (Sine Phase 16,777 K). Next, calorimetric power calibrations were performed to ensure that the power inside the flow cell and batch vessel was constant for the different ultrasonic sources. The same procedure as described before in the literature was used for the batch vessel [25,26]. A somewhat different approach was used to obtain the calorimetric powers in the flow cell. First, ultrapure water (18.2 MΩ·cm) was pumped at a flow rate of 100 mL/min through the channel in the center of the flow cell. The cooling bath was turned off so that the heat generated by the ultrasound field was not removed by the cooling water. Next, a certain amplitude A (mVpp) was applied by the waveform generator to the amplifier which was connected to the transducer. The temperature directly before and after the flow cell was measured by thermocouples T2 and T3 and the temperature difference ΔT (K) over the flow cell was calculated. The calorimetric power Pcal (W) was then calculated by Equation (1).
P cal = m ˙   c p   Δ T
with m ˙ as the flow rate (1.67 10−3 kg/s) and c p as the heat capacity (4.186 J/kgK). This calorimetric power calibration technique assumes that all power entering the solution is dissipated as heat [27]. It does not allow us to calibrate the number of cavitation events, but several papers in the literature state that it allows reliable control of the total amount of power entering the solution [27,28,29,30]. Hence, this technique was used to compensate for the differences in efficiency of the power transfer among the different ultrasound sources. Table 1 provides the calorimetric powers obtained by the same settings as used during the experiments.

2.3. Experimental Procedure Nucleation Temperature

The nucleation temperature (Tnucl) in the flow cell was investigated during a first set of experiments. Only the flow section of the experimental setup was used during these tests.
Prior to the experiments, 3 L of a 30 g/L N-(4-hydroxyphenyl) acetamide (acetaminophen) (98%, Acros Organics) solution in ultrapure water (18.2 MΩ·cm) was made at 60 °C. This solution was filtered over a 6 µm filter to remove impurities and introduced in the Erlenmeyer flask. Magnetic stirring was applied at 400 rpm and the temperature in the Erlenmeyer flask was set at 60 °C, well above the solubility temperature (46 °C) of the solution [31]. The solution was pumped from this Erlenmeyer flask to the 7 m long PFA coil, through the flow cell and back into the Erlenmeyer flask at a flow rate of 100 mL/min. Thermostatic bath 1 was also set at 60 °C and the solution was circulated for about 2 h at these settings to ensure that the temperature was above the solubility temperature within the whole loop.
At the start of the experiment, the ultrasound was switched on and thermostatic bath 1 was cooled at a cooling rate of 0.6 °C/min until nucleation was observed. First, a rough estimate of the nucleation temperature was obtained by the visual detection of nucleation inside the PFA tubing. Nucleation was considered when the first crystals were observed in the tubing. The temperature at the outlet of the flow cell (T3) was taken as the nucleation temperature during all experiments. The temperature before and after the flow cell can differ because of the heat generated by ultrasound inside the flow cell. This temperature difference reached a maximum of 1.63 °C at the maximum amplitude of 1200 mVpp as shown in Table 1. This heat could dissolve crystals which are generated before the flow cell. Therefore, the tubing directly before the flow cell was inspected thoroughly for the presence of crystals. Crystals were never detected before the flow cell when nucleation was observed after the flow cell. Next, a more precise nucleation temperature was defined. The solution was again heated to 60 °C and afterwards cooled at a cooling rate of 0.6 °C/min. The solution was cooled to 5 °C above the roughly estimated nucleation temperature. From this temperature on, samples of about 10 mL were drained in a small beaker (100 mL) every 0.2 °C. Visual detection in the beaker was now used to define the exact nucleation temperature. This allowed us to observe smaller crystals which could not be detected inside the tubing. The whole procedure was repeated three times to ensure reproducible results.
Additionally, the supersaturation ratio S (-) at which nucleation started was calculated with the following equation.
S = C C *
Here, C is the concentration used during the experiments (30 g/L) and C* is the solubility concentration at the nucleation temperature (g/L). This solubility concentration was obtained from the literature [31].

2.4. Experimental Procedure Seed Generation

The semi-continuous nucleation system consists of a continuous seed generation in flow, followed by crystal growth in batch. In this way, nucleation was triggered in a flow system, while the long residence time, needed for crystal growth, was obtained in the batch vessel. The 3-way valve was introduced in the experimental setup, during some experiments. Table 2 gives an overview of all of the experiments performed together with the experimental settings and main results.
The preparations are identical to the nucleation temperature experiments described in Section 2.3. The modes of operation correspond to Figures S1 and S2 in the supporting material. The experiment is started by cooling thermostatic bath 1 at a cooling rate of 0.6 °C/min until the desired supersaturation ratio. The temperature was fixed once this supersaturation ratio was reached and ultrasound was immediately applied to the flow cell. Nucleation was observed directly after the onset of the ultrasound field. Next, the solution was transferred to the batch vessel by switching the outlet tube of the flow cell from the Erlenmeyer flask to the batch vessel. This corresponds to the situation shown in Figures S3 and S4 in the supporting material. Then 200 mL of the solution was transferred into this batch vessel, after which the outlet tube was again connected to the Erlenmeyer flask and the ultrasound field of the flow cell was switched off. Subsequently, the crystals were grown for 2 h in the batch vessel at the same temperature at which the ultrasound was enabled. Overhead stirring was applied at 400 rpm during all experiments. At the end of the experiment, the crystals were recovered by vacuum filtration over a 6 µm filter and dried in an oven at 40 °C for 24 h.
Finally, the samples were analyzed for crystal size and shape according to the procedure described in the following section.

2.5. Analytical Measurements

Particle size measurements were performed on a Malvern 3000 Mastersizer laser diffractometer. First the equipment was switched on for 30 min before the first measurement to allow the laser to warm-up. Next, a solution of about 1% lecithin in hexane was prepared by dissolving approximately 3.5 g L-alpha-lecithin (>95%, Acros Organics) in 500 mL hexane (99%, Chem-Lab). Lecithin was added to prevent the adhesion of acetaminophen particles to the Mastersizer cell window [32]. Before the measurement was started, a background was measured for 10 s. The settings shown in Table 3 were used during all of the measurements. Then the acetaminophen crystals were added until the obscuration level was within 10–30%. Five consecutive measurements were performed with a Relative Standard Deviation (RSD) of less than 5% for D10 and D90 and less than 3% for D50. The average value of these five measurements is each time given in the results section of this paper. Finally, five cleaning cycles were performed and the background was checked before a new measurement was started.
The particle shape was studied by a Philips XL 30 FEG scanning electron microscope (SEM). The particles were first attached to a carbon adhesive tap (G3348N 25 mm Leit Tabs) which was placed on a SEM specimen stub (25 mm diameter, 3.2 mm × 8 mm pin). Next, compressed air was flushed over these adhesive taps to remove all loosely-attached particles. These stubs were then placed in a vacuum oven overnight to remove all gasses and oil from the compressed air stream from the surface. Subsequently, the SEM samples were sputtered with 5 nm thick platina and palladium layers to make them conducting. Images were taken based on the secondary electrons with a 50 µm platina diaphragm and 10 kV acceleration voltage.
The polymorph of the produced crystals was evaluated by a D2 Phaser X-ray diffractometer.

2.6. Experimental Procedure Batch Growth

The setup with the 3-way valve was used during these experiments. The preparations are identical to the nucleation temperature experiments described in Section 2.3. The experiment is started by cooling thermostatic bath 1 at a cooling rate of 0.6 °C/min and switching on the ultrasound at a calorimetric power of 8 W. This cooling rate of 0.6 °C/min was selected because the literature showed that ultrasound caused a significant reduction in MZW at cooling rates of 0.5–0.7 °C/min, while this effect was negligible for higher cooling rates of 2 °C/min [25,33]. The moment crystals were detected, the solution was transferred to the batch vessel by switching the 3-way valve towards the batch vessel. A detailed representation of this mode of operation can be found in the supporting material, Figure S3. Nucleation was detected within the temperature range from 42.5 to 43.1 °C. Then 200 mL of the solution was transferred into this batch vessel, after which the 3-way valve was again switched to the Erlenmeyer flask and the ultrasound field of the flow cell was switched off. This mode of operation corresponds to Figure S1 in the supporting material. Next, ultrasound was applied to the batch vessel at the desired frequency at a calorimetric power of 8 W. Subsequently, the crystals were grown for 2 h in the batch vessel at a temperature of 36 °C so that the crystals could grow to their final size. Overhead stirring was applied at 400 rpm during all experiments. At the end of the experiment, the crystals were recovered by vacuum filtration over a 6 µm filter and dried in an oven at 40 °C for 24 h. The same analysis techniques as described in Section 2.5 were applied to these crystals.

2.7. Experimental Procedure Complete Batch Crystallization

As a reference case, a complete batch crystallization with both nucleation and growth in the batch vessel of Figure 1 was performed. This setup is given in the supporting material, Figure S5. Ultrasound was not applied during these tests, which will be named as the “silent batch” experiments in this paper. Two hundred mL of the 30 g/L acetaminophen solution in ultrapure water was made at 60 °C. This solution was filtered over a 6 µm filter to remove impurities and was introduced in the batch vessel. Thermostatic bath 2 was set at 60 °C prior to the experiment and overhead stirring was applied at 400 rpm during the whole test. The experiment was started by cooling the batch vessel at a cooling rate of 0.6 °C/min until nucleation was detected visually. Next, the temperature was kept constant at this nucleation temperature and the solution was stirred for 2 h to let the crystals grow. Afterwards, the solution was vacuum filtered over a 6 µm filter and dried in an oven at 40 °C for 24 h. The same analyses as described in Section 2.5 were applied to these crystals.

3. Results and Discussion

The semi-continuous sonocrystallization setup was used to investigate different strategies to control the final particle size. First, it was investigated how the particle size distribution (PSD) could be impacted during seed generation in the flow section of the experimental setup. The effect of sonication at different supersaturation ratios and the introduction of a 3-way valve on the PSD was investigated. Next, the effect of the ultrasonic frequency during the growth phase in the batch section of the setup was tested.

3.1. Particle Size Control During Seed Generation

Seeds were generated in the tubular flow section of the setup and afterwards grown in the batch vessel. During seed generation, nucleation occurs followed by growth of the nuclei to a detectable size. The growth phase is, within this research, defined as the phase after seed generation.

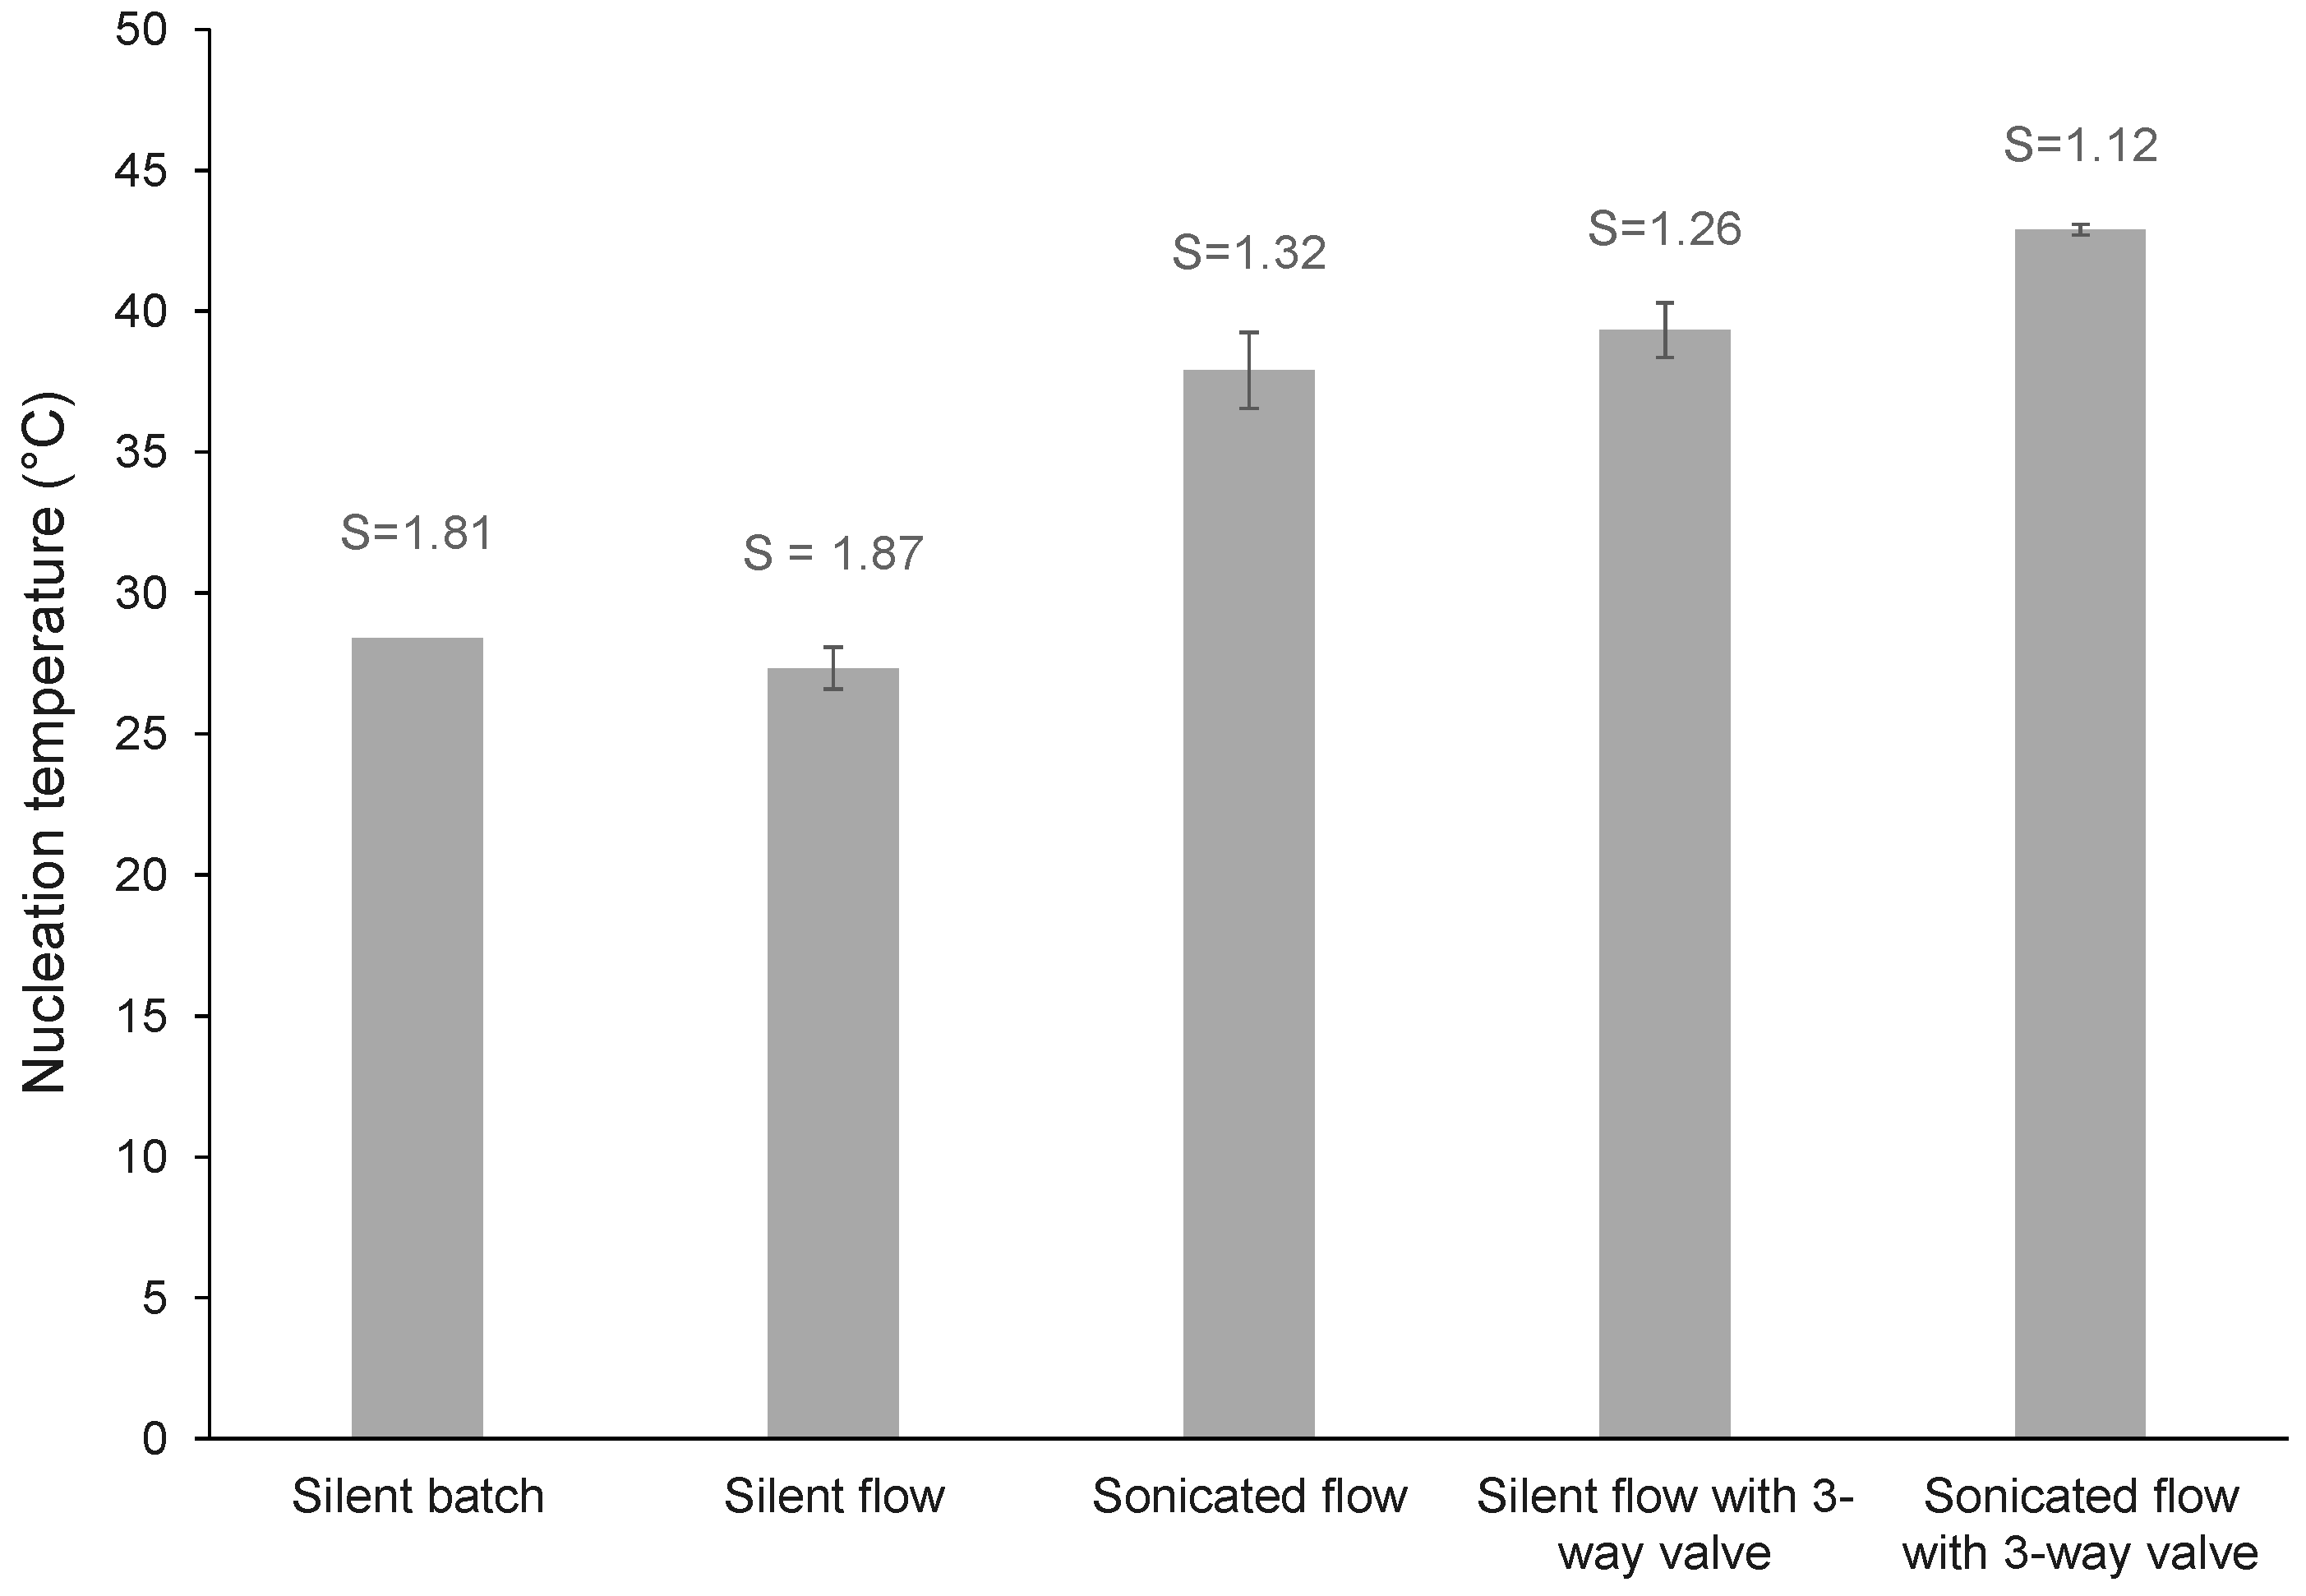
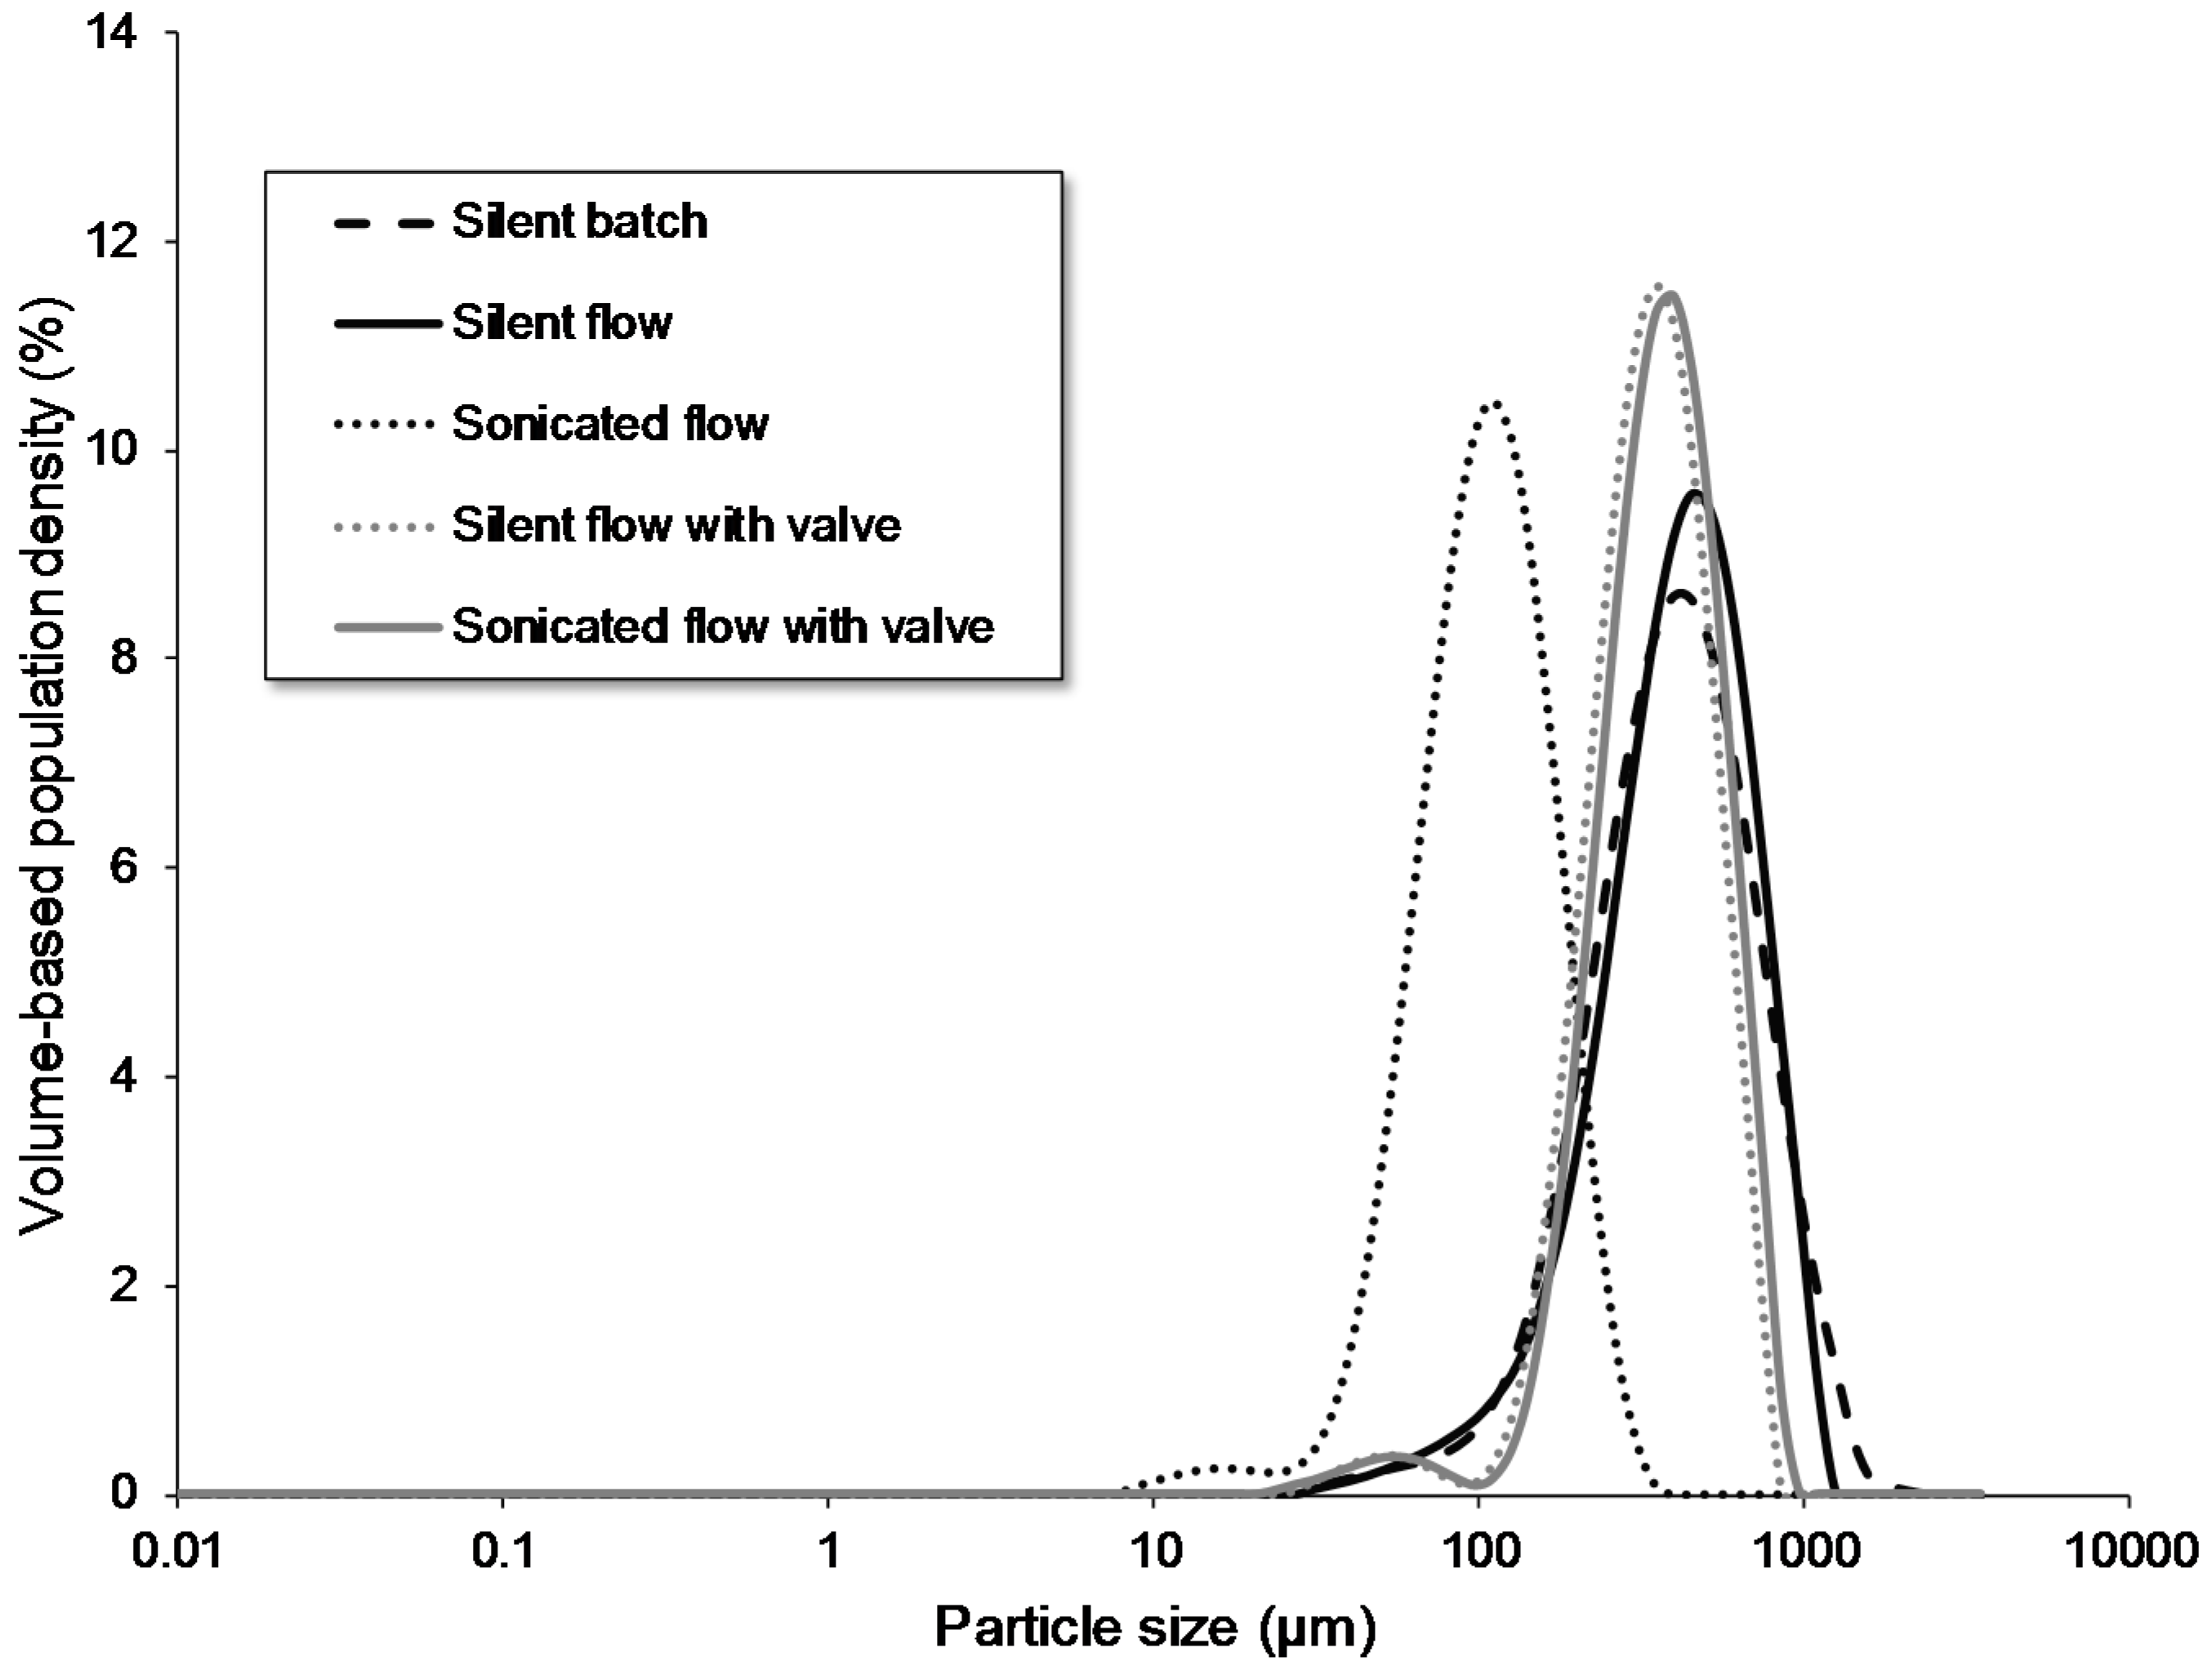
3.1.1. Nucleation in Batch versus Flow

Nucleation temperatures and PSDs were investigated for three setups; namely the setup as provided in Figure 1, the same setup without the 3-way valve, and a batch setup. The latter was conducted as a reference case and consists of the same cylindrical vessel as used in the batch section of Figure 1. Silent experiments, i.e., experiments without sonication, were performed in all setups. Sonicated tests were conducted, in addition to these silent experiments, in the flow setups. Figure 3 shows the nucleation temperatures and Figure 4 shows the PSD results of these different experiments. Nucleation was observed at similar temperatures around 28 °C in the silent batch and silent flow experiment. Additionally, the PSD curves of both setups overlap. This indicates that moving from batch to flow, under silent conditions, has no significant effect on nucleation. This is in contrast with previously reported results in the literature [3,19,34]. Smaller particle sizes with smaller distributions in tubular crystallizers compared to batch crystallizers are reported in these papers. Anti-solvent crystallization or precipitation was, however, used in these papers compared to cooling crystallization for the results obtained in Figure 4. The T-shaped mixer and tubular design used in these papers result in different mixing characteristics compared to a batch vessel and hence impact the supersaturation ratio locally [19,34,35]. These parameters are particularly important for an anti-solvent crystallization because very high ratios of supersaturation are generated suddenly when the anti-solvent is added. The degree of mixing, at the moment of addition, will therefore define the local supersaturation ratio and hence impact the final particle size distribution [34,36]. The change in supersaturation ratio is more gradual for cooling crystallization, so that mixing is less crucial during this crystallization process. Additionally, both nucleation and growth are performed in the tubular crystallizer in the papers in the literature. In Figure 4, however, only nucleation is obtained in the tubular section of the setup while growth is performed in the batch setup. The tubular design, at the small scales used in these papers, generates a more uniform temperature profile across the reactor compared to the batch setup. As a result, crystal growth will be more homogeneous so that more uniformly sized crystals with a smaller particle size distribution will be produced in the end.
A comparable setup as given in Figure 1 was used by Méndez del Río et al. during cooling crystallizations of acetaminophen in methanol and ethanol [37,38]. Smaller chord lengths were obtained by Focused Beam Reflectance Measurements (FBRM) in a tubular crystallization setup compared to a batch setup. Very high cooling rates between 0.9 °C/min and 666 °C/min, depending on the position in the tube, could be achieved in the tubular setup [38]. These cooling rates are significantly higher than the 0.15 °C/min to 0.50 °C/min achieved in the batch setup. The authors assume that the Metastable Zone Width (MZW) was widened because of these high cooling rates so that higher supersaturation ratios and smaller final crystals could be achieved. It was already observed before that higher cooling rates increase the MZW [36,39]. These high cooling rates and corresponding supersaturation ratios were not obtained in this research. The temperature was constantly lowered until nucleation was observed in the tubular section. From that moment on, the temperature was kept constant. As a result, the supersaturation ratio increased slowly until nucleation was observed. The supersaturation ratio was therefore comparable to the one obtained during batch crystallization. As a result, the driving force and consequently the amount of nuclei generated are comparable so that similar sized crystals are produced in the end. Furthermore, water was used as a solvent in the research presented here compared to methanol and ethanol in the paper of Méndez del Río et al. [37]. In the same paper, it was already shown, without further explanation, that the difference in the nucleation rate between the batch and tubular crystallization was significantly higher for the acetaminophen-methanol system compared to the acetaminophen-ethanol system [38]. The relative nucleation rates (nucleation rate in the tubular crystallizer divided by the nucleation rate in batch) were up to 1.8 for the acetaminophen-ethanol system compared to 2.0 to 7.6 for the acetaminophen-methanol system. It is therefore also possible that this relative nucleation rate will become even smaller for an acetaminophen-water system.
The introduction of ultrasound in the flow setup resulted in an increase in nucleation temperature of more than 10 °C and a significantly smaller particle size. This corresponds to the results previously published in the literature, where nucleation at higher temperatures, smaller metastable zone widths, and reduced particle sizes are commonly reported upon sonication [16,22,25,30]. The exact mechanism of these observations is unknown; only some hypotheses are formulated in the literature. Most of them agree that ultrasound enhances primary nucleation and therefore yields more nuclei which grow into smaller crystals in the end. The three most commonly reported hypotheses are the bubble as the nucleation center, the segregation theory, and the flow induced nucleation. The latter assumes that ultrasound generates flow streams in the solution which enhance the collisions of molecules and therefore increases the creation of clusters of molecules [40,41]. As a result, more nuclei are formed and the nucleation rate is increased. The hypothesis of the bubble as a nucleation center considers cavitation bubbles as heterogeneous particles which lower the work needed for nucleation and hence introduce heterogeneous nucleation [16,30,42]. Finally, the segregation theory states that when a cavitation bubble collapses, the inward motion of the liquid is stopped violently by the gas recompression in the bubble. Consequently, a huge outward acceleration of the liquid is created. Molecules with different densities will not be accelerated to the same extent. Compound clusters, denser than the surrounding solvent molecules, will accelerate slower and are therefore segregated from the solvent molecules. As a result, these clusters become supersaturated near the bubble wall for a very short time (ca. 1 ns) and their direct collisions are promoted and nucleation is enhanced [17,43]. In addition to these hypotheses which focus on primary nucleation, secondary nucleation was also observed in the literature upon sonication [44]. The fragmentation of crystals by sonication leads to the production of new nucleation sites which create secondary nucleation [44,45]. It therefore remains possible that some nuclei, which are not yet grown to a detectable size, enter the flow cell where they are fragmented by the shear forces or shockwaves induced by the ultrasonic cavitation. These fragments can induce secondary nucleation which can be detected visually.

3.1.2. Introduction of a 3-Way Valve

The introduction of a 3-way valve in the same flow setup resulted in a somewhat higher nucleation temperature of 39 °C and slightly smaller particle size as observed in Figure 4. These observations could indicate that nucleation occurs at a higher temperature because of the 3-way valve but that the amount of nuclei generated is not significantly higher compared to the flow setup without the 3-way valve. The reason for these observations is, however, unclear. It is hypothesized that the valve changes the flow pattern or introduces heterogeneous nucleation. The inner diameter of the valve is 1 mm smaller than the 5 mm diameter of the PFA tube which can create disturbances in the flow pattern. As a result, flow induced nucleation can occur as explained before. In addition, the surface roughness of the walls of the PP/PE valve can differ compared to that of the smooth PFA tubing. This difference in roughness can introduce heterogeneous nucleation which lowers the work needed for nucleation [36].
Application of ultrasound in the same setup resulted in a small increase in the nucleation temperature from 39 °C to 43 °C. This increase is, however, considerably smaller compared to the setup without the 3-way valve. The PSD curves of the flow setup with the 3-way valve under silent and sonicated conditions overlap. This is rather unexpected as sonication in the flow setup without the 3-way valve resulted in significantly smaller crystals. The reason for this observation is unknown and needs further investigation. These results indicate that the PSD and nucleation temperature can predominantly be impacted by sonication in a flow setup without the 3-way valve. Introduction of the 3-way valve initiates nucleation already at a rather low supersaturation ratio which impedes the possibility for further particle size control.

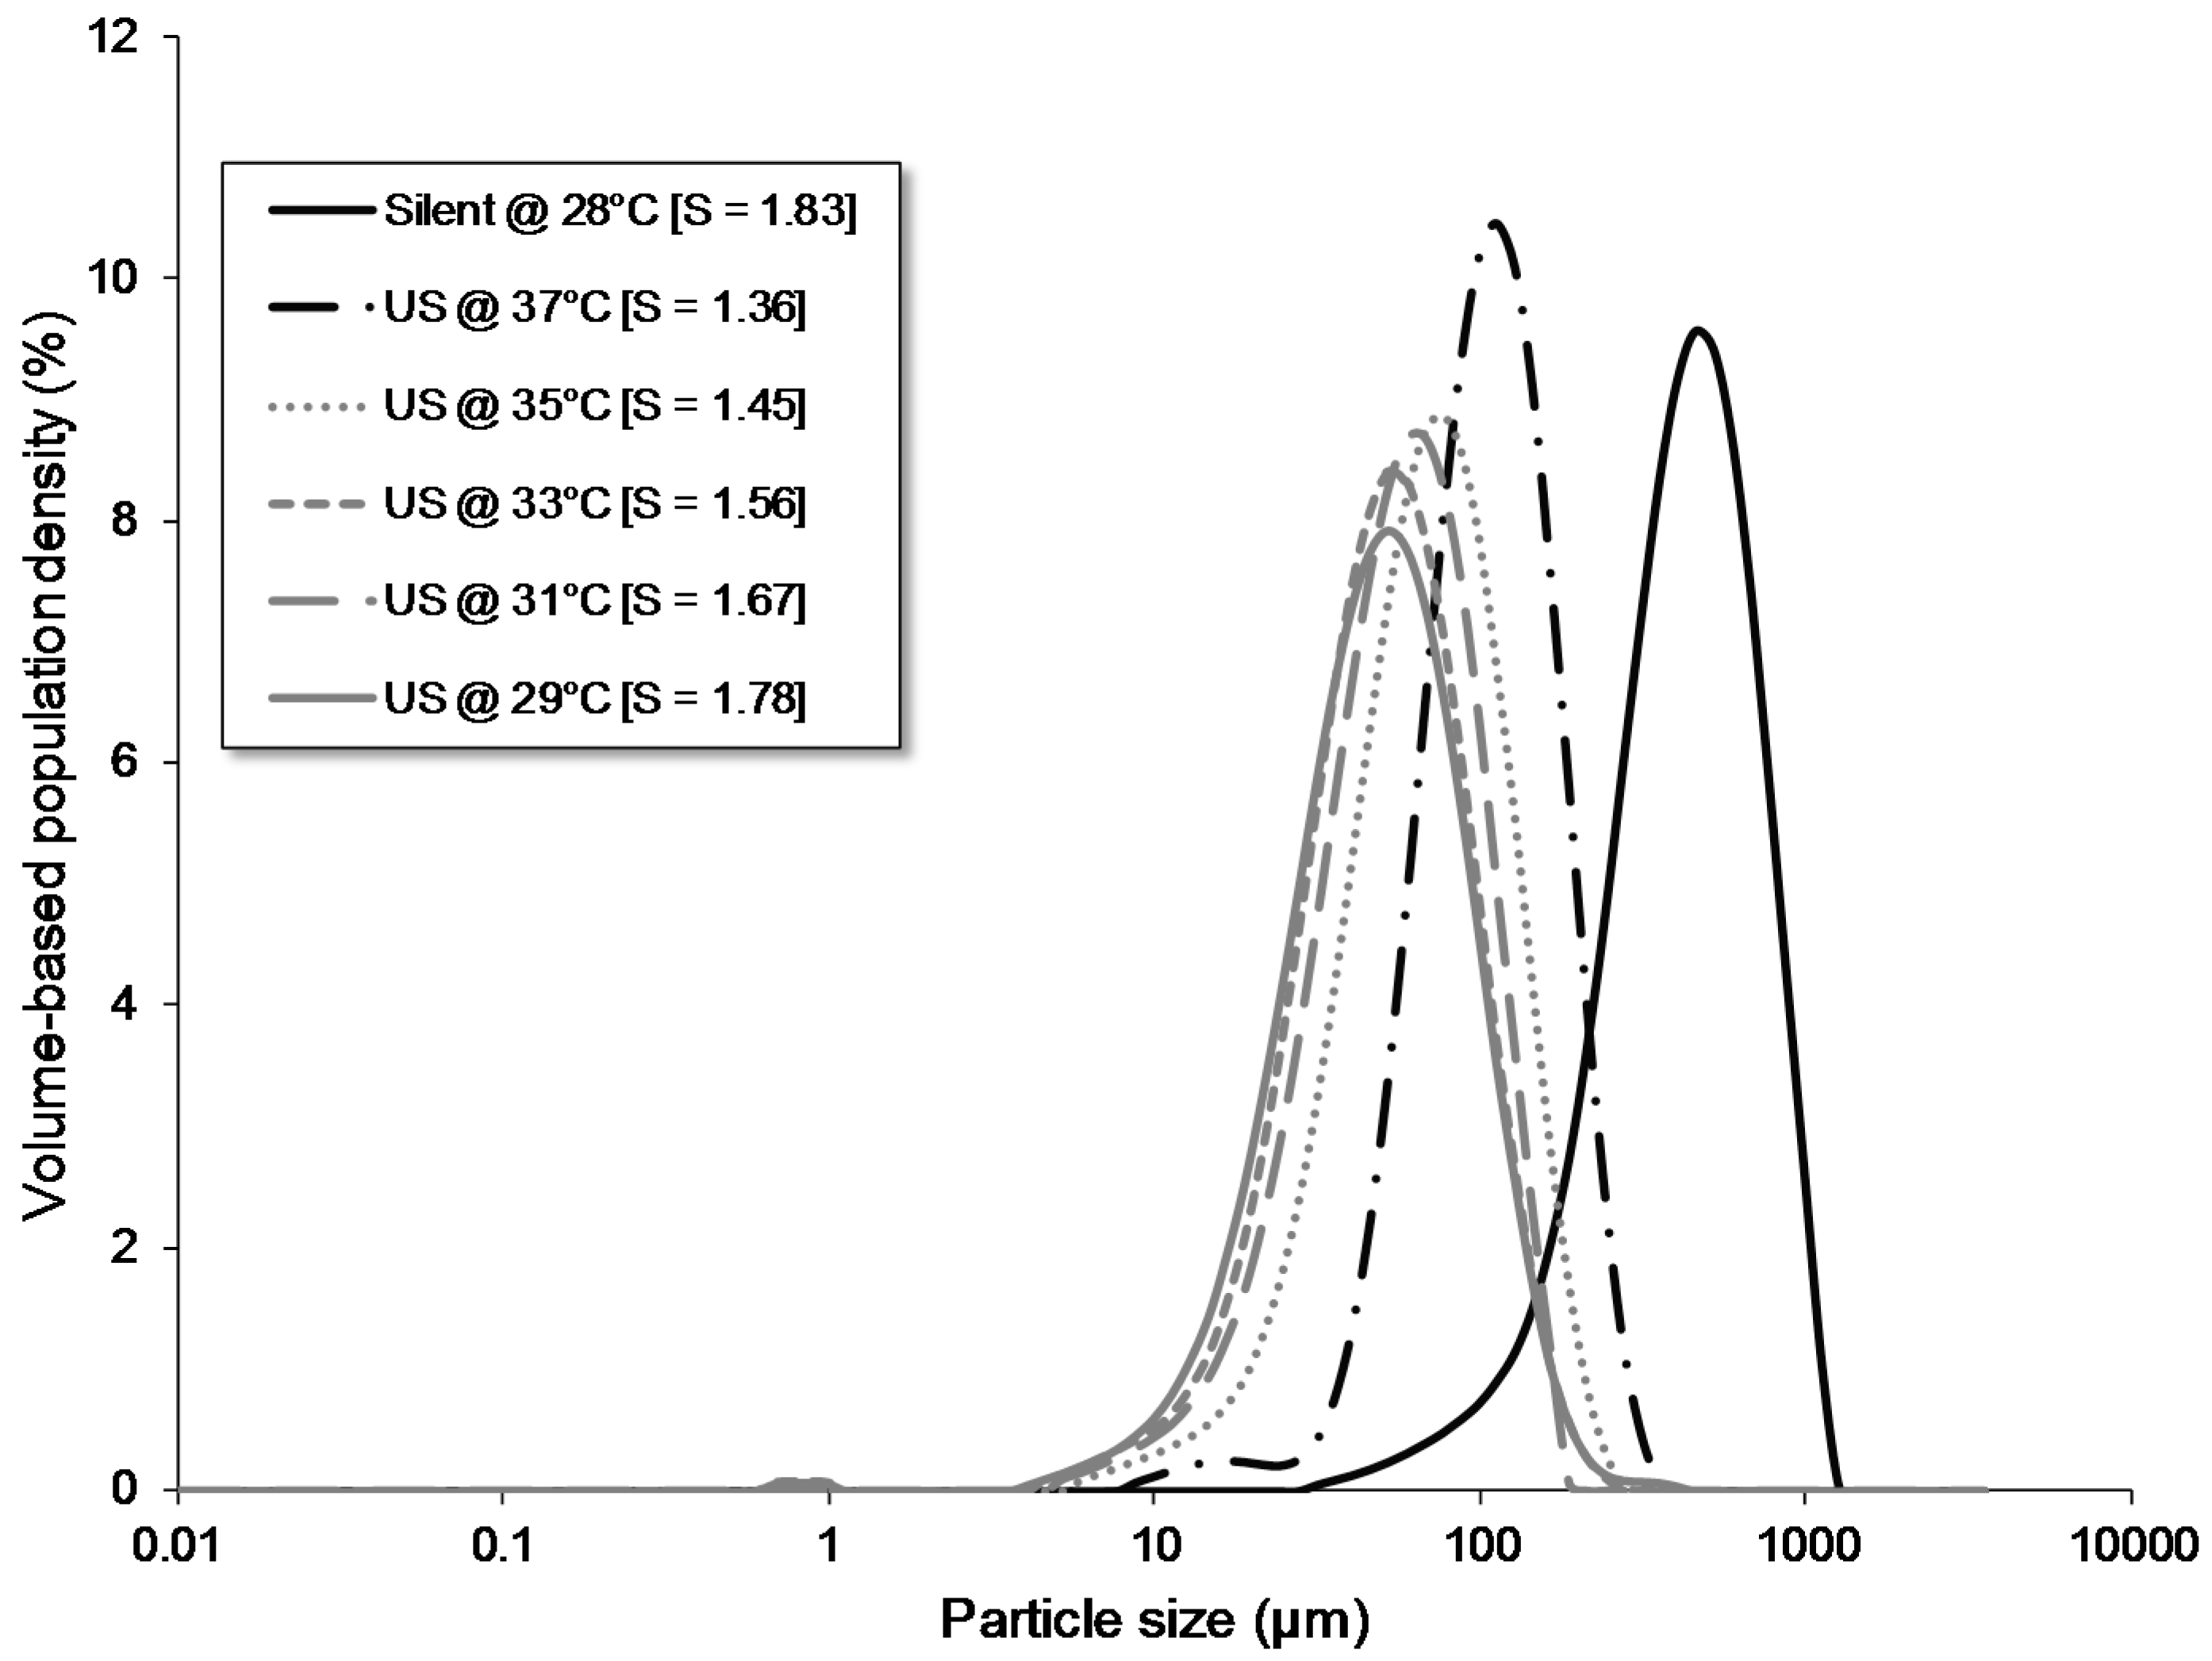
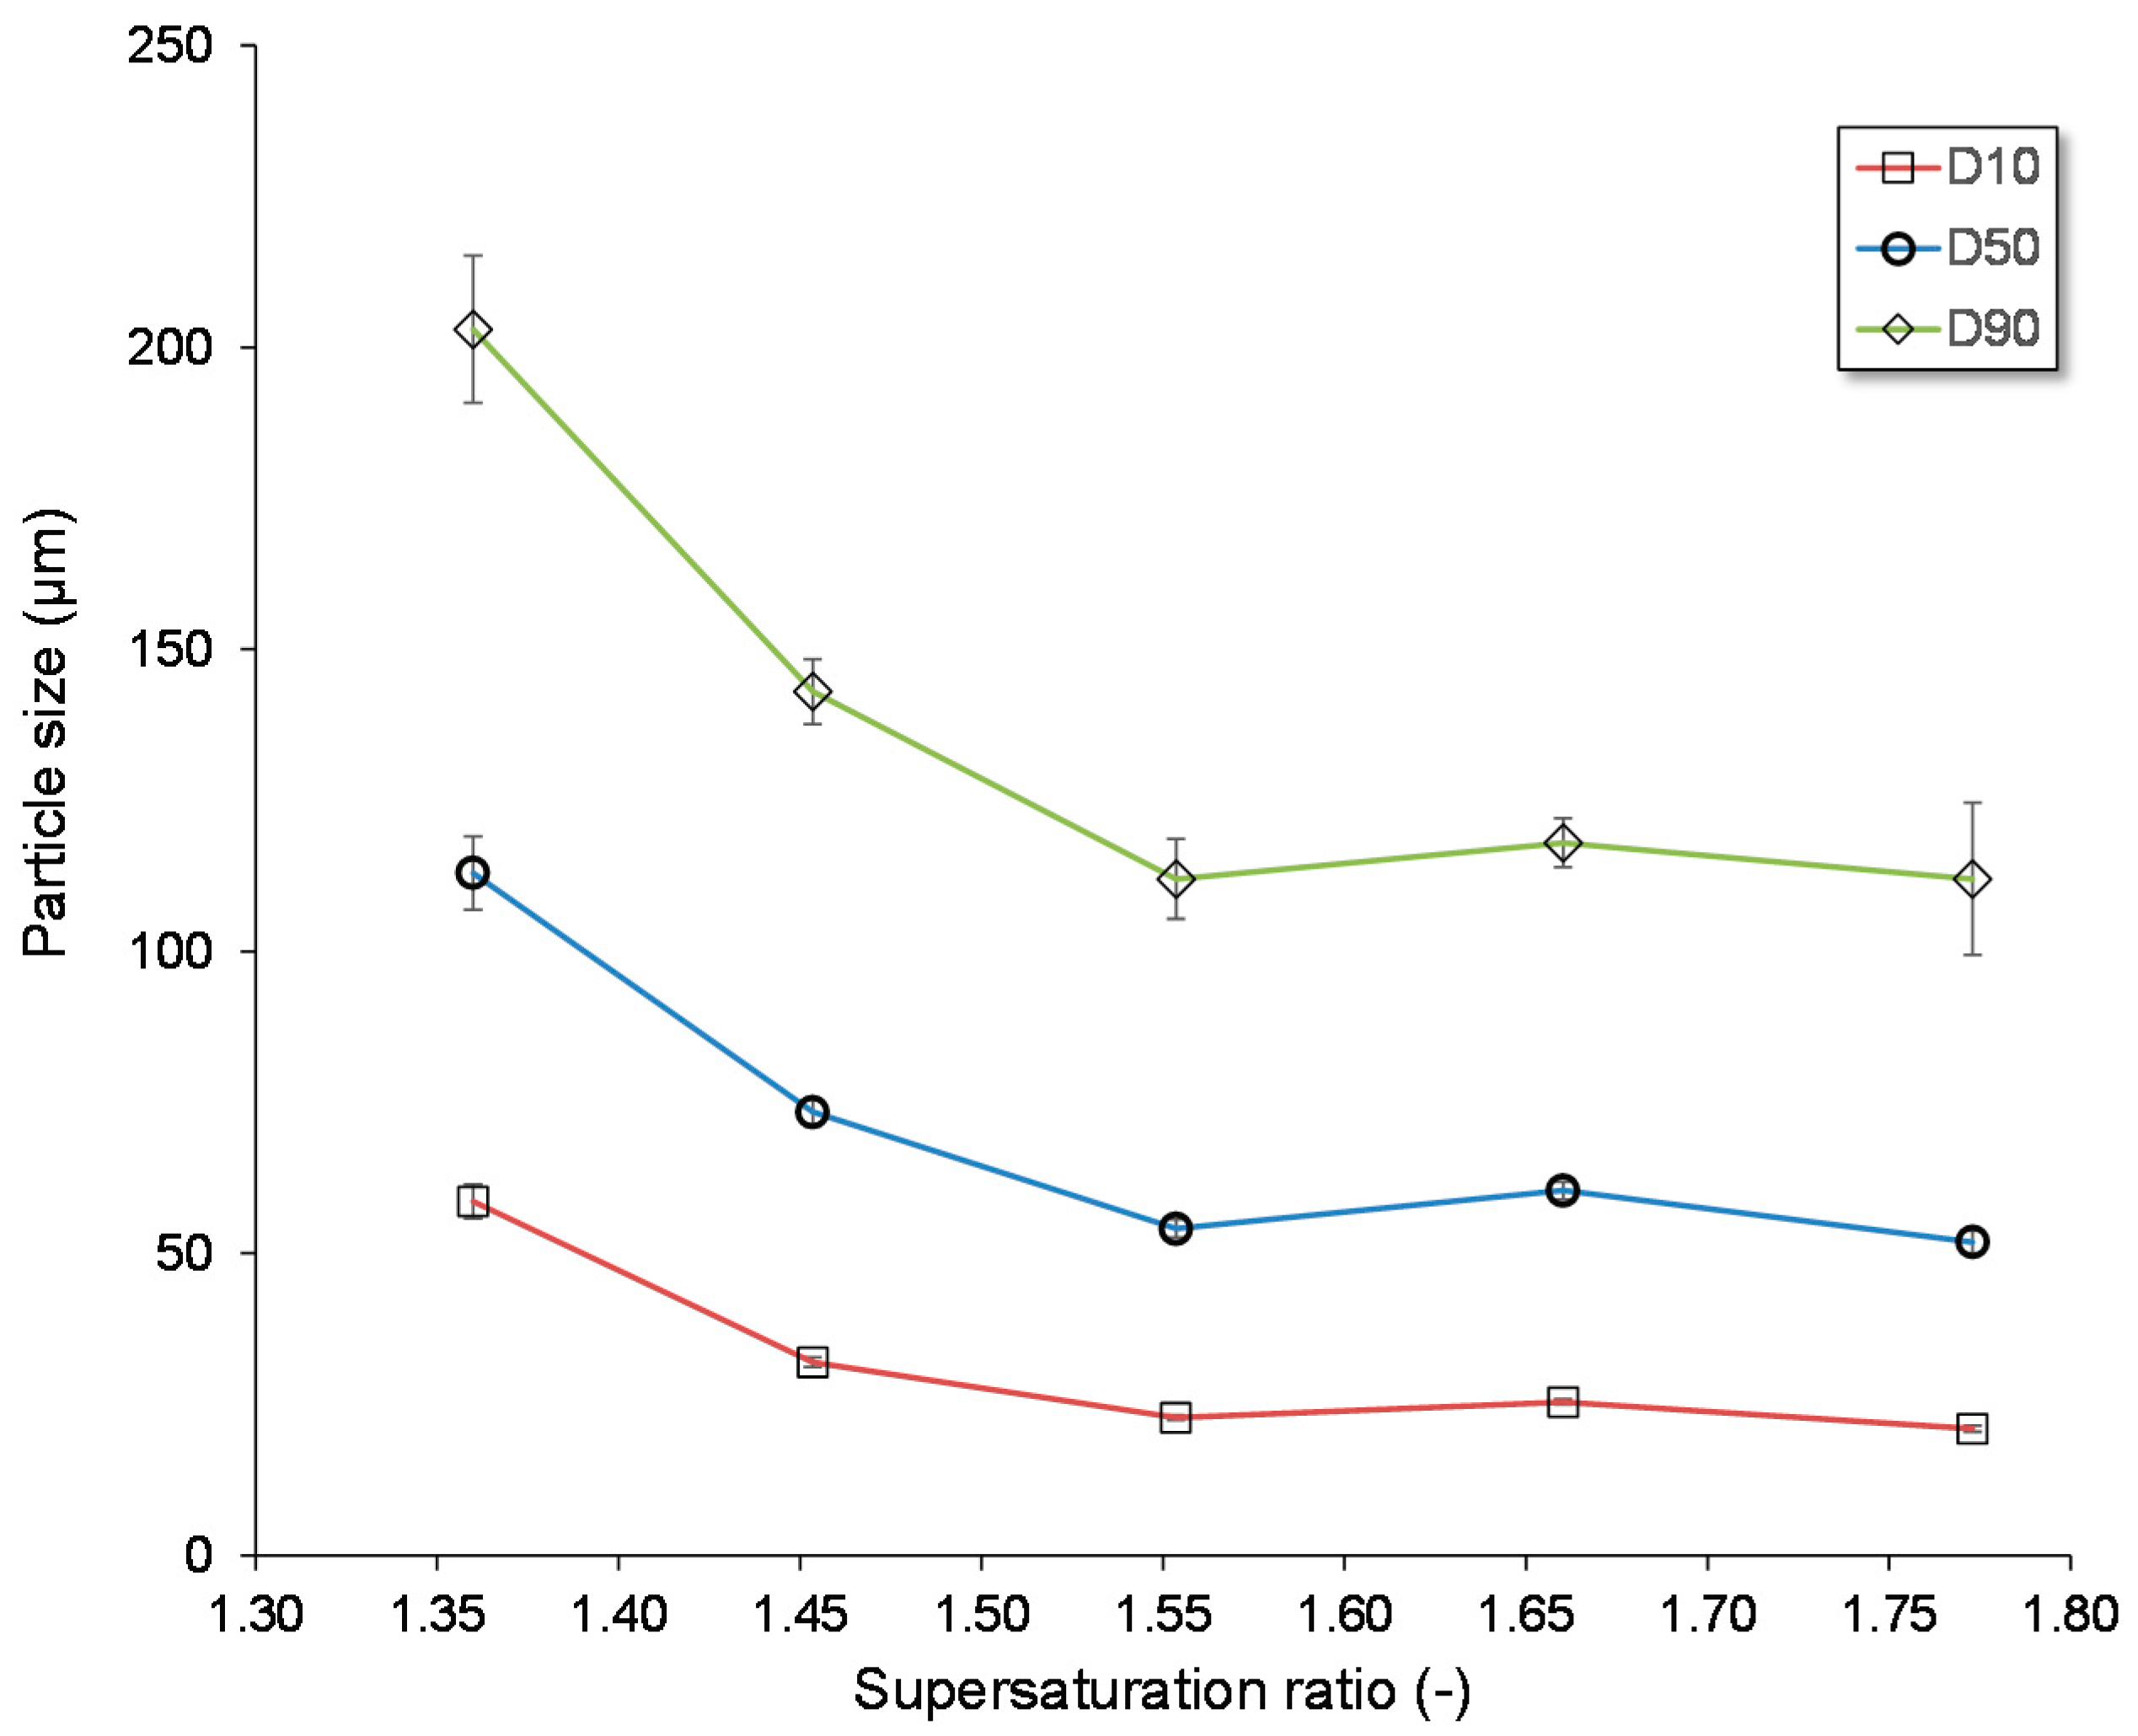
3.1.3. Influence of the Supersaturation Ratio

In the previous section, it was assumed that the supersaturation ratio at which nucleation was enabled could impact the final PSD. This hypothesis was further investigated by inducing nucleation at different supersaturation ratios in the flow setup without the 3-way valve. The silent and sonicated nucleation temperatures are defined therefore by, respectively, the minimum and maximum temperatures at which nucleation can be triggered. Figure 3 provides the nucleation temperatures under silent and sonicated conditions together with the corresponding supersaturation ratios. A significant difference of 10 °C in nucleation temperature can be observed. This corresponds to nucleation at a supersaturation ratio of 1.87 under silent conditions and 1.32 under sonication. A safety margin was applied to these supersaturation limits so that ultrasound was applied in the flow cell between supersaturation ratios of 1.36 and 1.78. Afterwards, all crystals are grown in the batch vessel under silent conditions. Figure 5 shows the final PSD of these crystals. A clear difference in PSD can be observed between the silent and sonicated experiments. The largest crystals were obtained without the use of ultrasound (silent conditions) at a supersaturation ratio of 1.83. Applying ultrasound at a supersaturation ratio of 1.36 yielded significantly smaller crystals. A further decrease of the sonication temperature, and thus increase of the supersaturation ratio, led to even smaller crystals. This trend is more obvious in Figure 6 where the D10, D50, and D90 of the PSDs are shown as a function of the supersaturation ratio at which sonication was started. A clear decrease in the particle sizes is visible with increasing supersaturation ratios. This effect is, however, limited as no significant effect on the particle size can be observed from a supersaturation ratio of 1.56 onwards. It seems that a kind of threshold in the particle size exists below which the particle size cannot be reduced by increasing the supersaturation ratio further. This can indicate that at a supersaturation ratio of 1.56, the maximum amount of nuclei is generated. A further increase in the supersaturation ratio will not lead to significantly more nuclei, so that the final crystals will all have a similar size.
These results are comparable with the ones obtained by Wohlgemuth et al. [16]. A cooling crystallization of adipic acid was performed in a 1.2 L batch vessel with sonication at different initial supersaturation ratios. The higher the initial supersaturation ratio, the more the second peak of the bimodal distribution was shifted to smaller sizes. The results of Figure 5 and Figure 6 indicate that also in a tubular crystallizer, the supersaturation ratio at which nucleation starts has a significant effect on the final PSD.

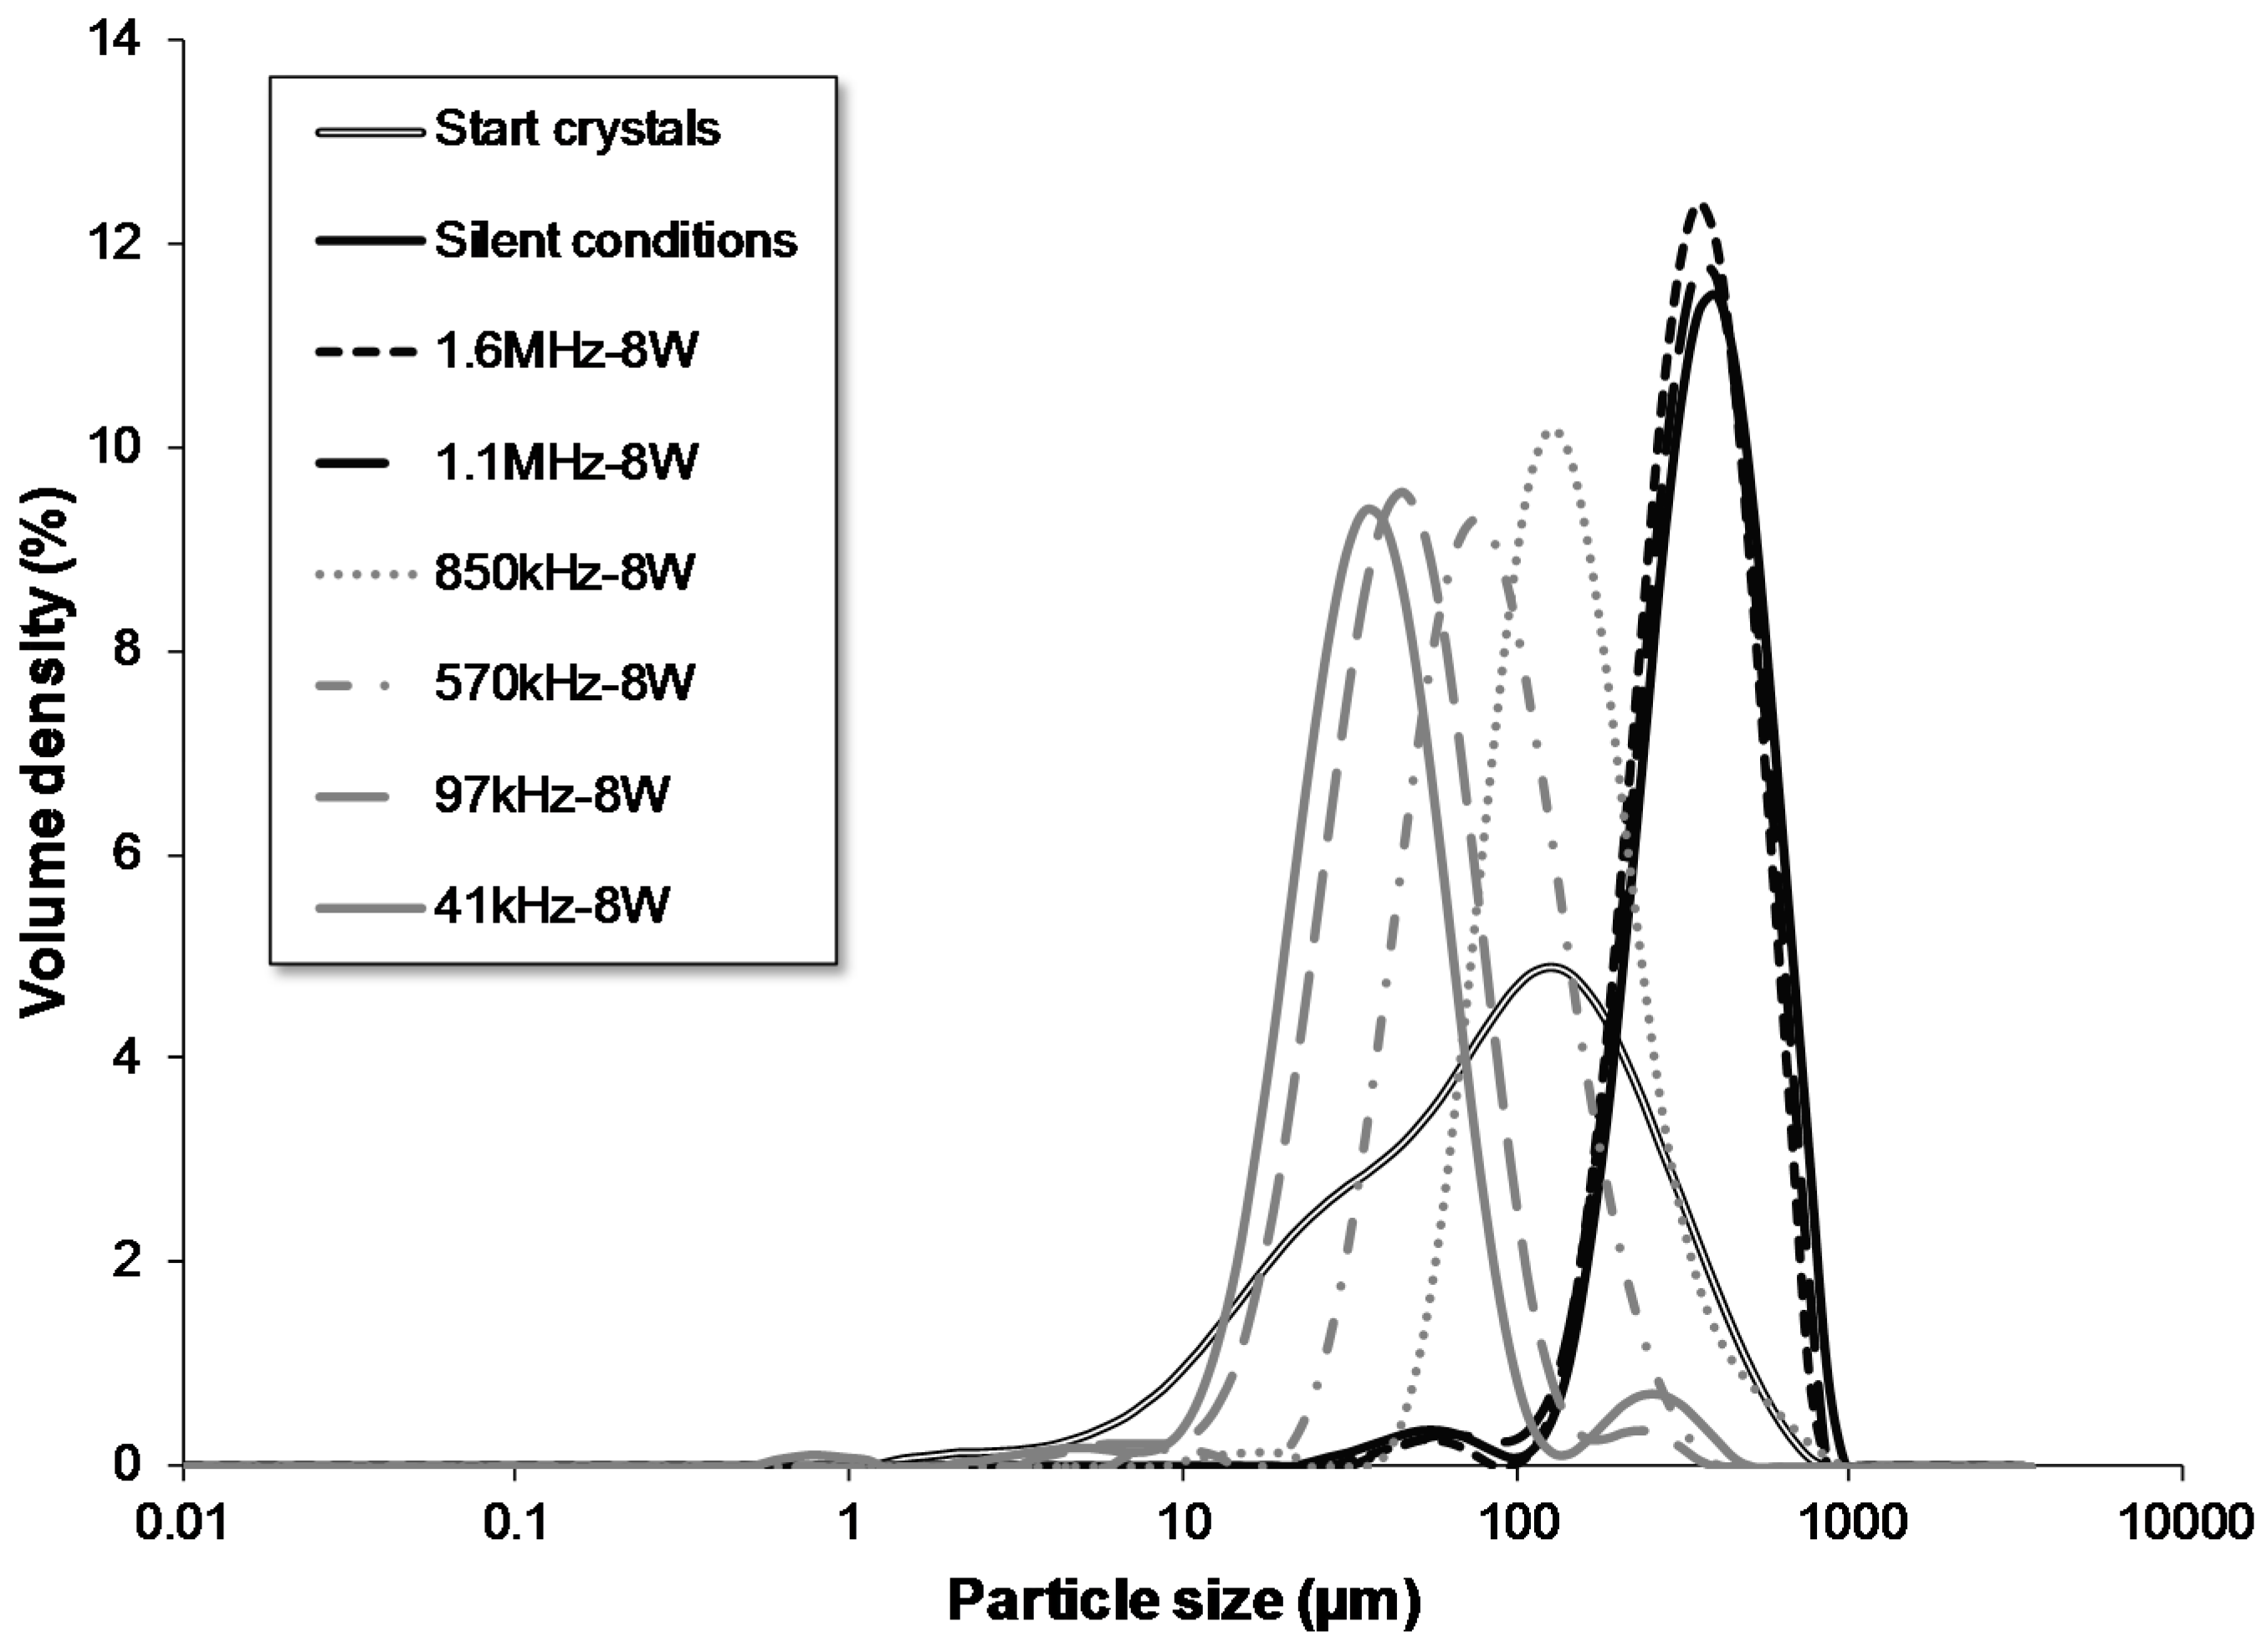
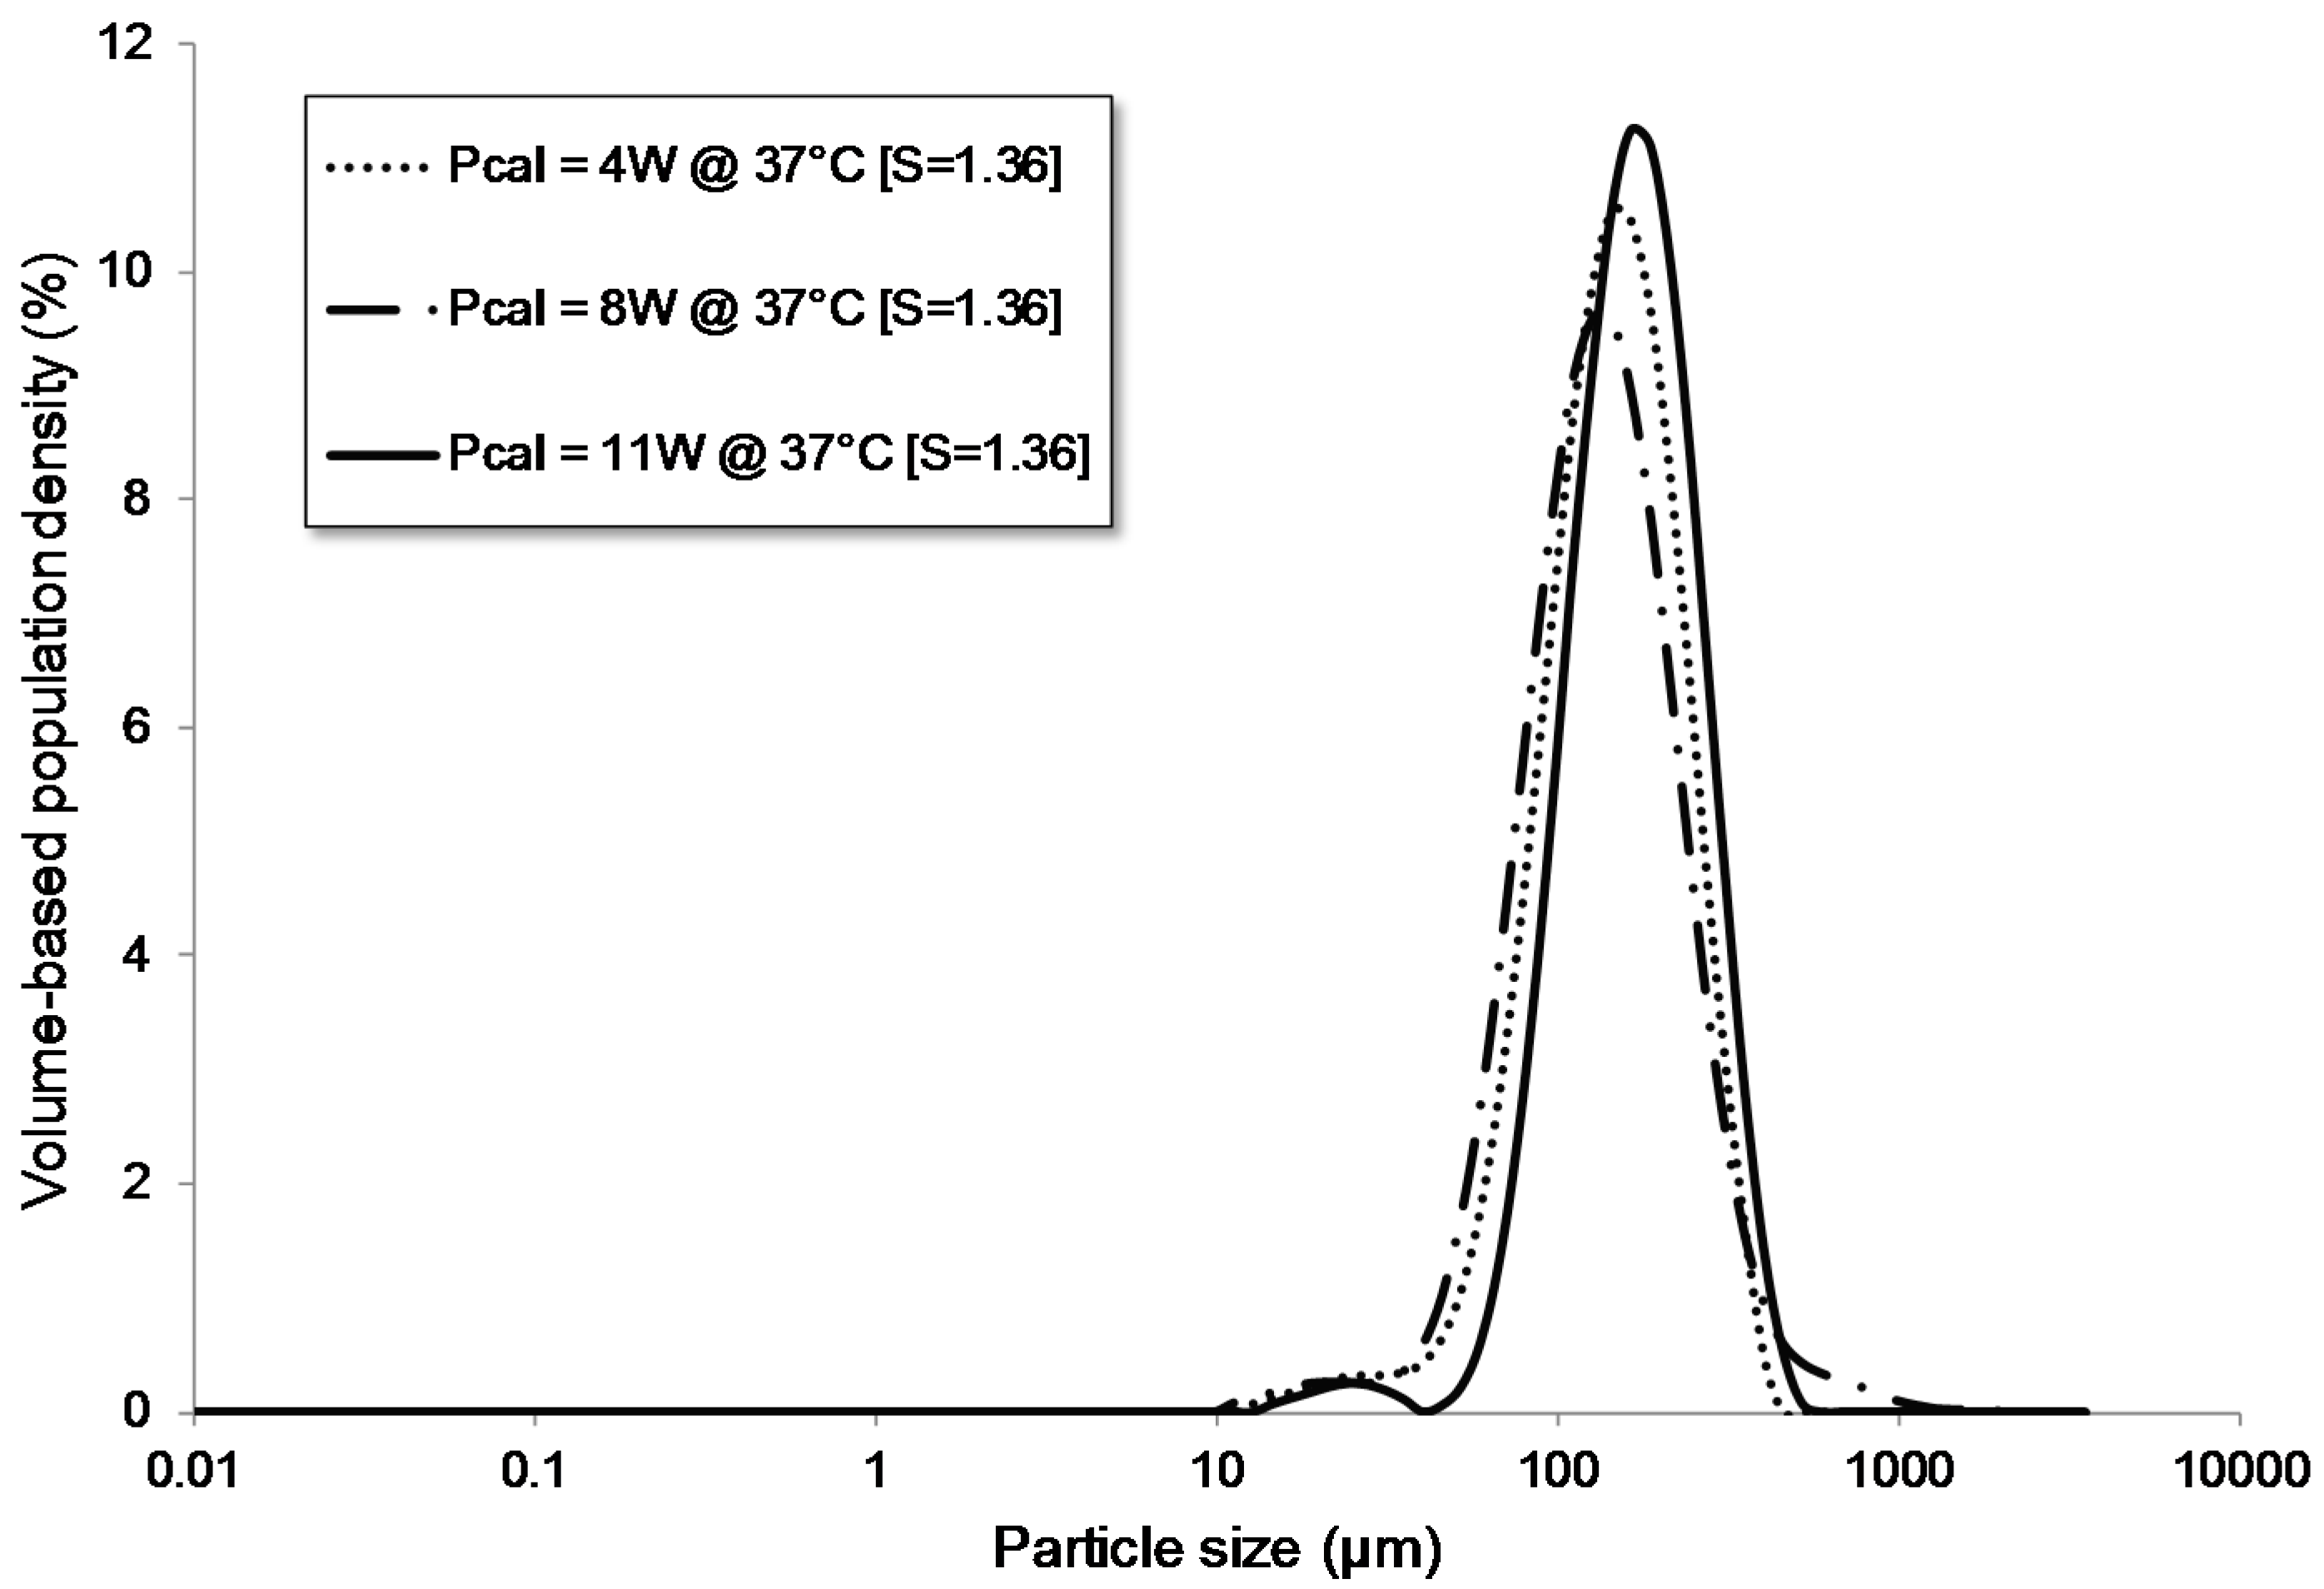
3.1.4. Influence of the Power Level

Furthermore, the ultrasonic power applied to the flow cell was changed so that calorimetric powers of 4 W, 8 W, and 11 W were tested. Figure 7 shows the PSDs of the final particles. All curves more or less overlap and one can therefore conclude that the calorimetric power level applied during nucleation has an insignificant effect on the final PSD.
These results are in agreement with the ones of Dennehy et al. [46]. An insignificant effect of the ultrasonic power between 10 W and 25 W was observed on the final PSD during a batch crystallization of a commercial drug substance [46]. In contrast, several other papers in the literature claim smaller particle sizes upon higher power levels [22,47,48,49]. However, these articles applied ultrasound for a long time during the whole crystallization process. Ultrasound was applied during both nucleation and crystal growth while ultrasound was only applied throughout a very short time during the nucleation stage in Figure 7. It was already shown that a short burst of ultrasound produces larger particles compared to continuous sonication [50]. Furthermore, ultrasonic probes were used in these papers compared to a bolt-clamped Langevin ultrasonic transducer in Figure 7. It is also shown in the literature that these probes can create different effects with respect to the power compared to ultrasonic transducers [13,23].
Furthermore, the XRD patterns of crystals produced at different supersaturations and power levels are given in Figure 8. Due to practical limitations, it was not possible to achieve XRD patterns for more experiments. All patterns overlap and show peaks at the same locations of the reference peaks for monoclinic acetaminophen, indicating that the same polymorph, namely monoclinic acetaminophen, is formed in all of the experiments [51]. Three polymorphic forms of acetaminophen exist, namely the monoclinic form I, the orthorhombic form II, and the unstable polymorphic form III [51,52]. Form I is thermodynamically stable at ambient temperature and pressure but shows poor technological and biopharmaceutical properties such as flowability, compactability, tabletability, wettability, and dissolution rate. Form II shows better properties but is harder to obtain because under normal conditions only form I can be generated. Furthermore, form II transforms within 6 h at 0 °C to form I in solution [52]. The crystals produced here were grown for 2 h at 27 °C to 43 °C, which is considerable higher than the 0 °C mentioned by Bhangu et al. Therefore, the transition of form II to form I will occur faster, which can explain why only form I can be expected in Figure 8. The detection of only polymorphic form I via Powder X-ray Diffraction (PXRD) during the sonocrystallization of acetaminophen was also observed by Bučar et al. [51]. Bhangu et al., in contrast, were able to detect form II via microscopic images and state that higher supersaturation ratios and higher ultrasonic powers favor the nucleation of the more energetic metastable orthorhombic form II [52]. These authors explain that the detection of form II is difficult using PXRD due to the large difference in mass fractions of the two polymorphs which renders the peak corresponding to form II undetectable [52]. This is an additional reason why only form I is detected in Figure 8.
In conclusion, one could state that the final PSD of crystals can be impacted by changing the supersaturation ratio at which ultrasound is enabled during nucleation. The higher the supersaturation ratio, the higher the driving force, the more nuclei generated and the smaller the final crystals become. This effect was visible up to a supersaturation ratio of 1.56. A further increase of the supersaturation ratio did not result in smaller particles. The power applied by an ultrasonic transducer to the flow cell, in contrast, seemed less important for the final PSD.

3.2. Particle Size Control in the Growth Section

Nucleation was performed in the flow section with the 3-way valve for practical reasons. The results provided in Section 3.1 already showed that the valve minimizes the impact of other parameters which could influence the final PSD. Four repetitions of the silent experiment were conducted to ensure the reproducibility of the obtained PSDs. All PSD curves of the final crystals overlapped, indicating that the procedure was reproducible.
The crystals generated in the flow section were drained by the 3-way valve into the batch vessel where ultrasound was applied while the crystals grew to their final size. Different ultrasonic frequencies were tested, all with the same calorimetric power of 8 W. Figure 9 shows the PSDs of these tests. The largest crystals are obtained under silent conditions and under sonication with frequencies of 1.1 MHz or above. The application of ultrasound with frequencies of 850 kHz or below resulted in significantly smaller crystals. The lower the frequency, the smaller the final particles become. Particle breakage, disaggregation, or secondary nucleation can explain these observations. Lower ultrasonic frequencies create larger cavitation bubbles which collapse more violently and consequently generate higher crystal breakage rates. These results are in agreement with previously reported results of our research group about the effect of the ultrasonic frequency on the crystal breakage rate (sonofragmentation) [13]. In this paper, the same setup and similar frequencies were used to investigate the effect of ultrasound on existing acetaminophen crystals in a saturated solution. A reduction of the crystal size over time was observed at frequencies of 570 kHz or below. In Figure 9, a similar trend was observed although a particle size reduction is already visible at a frequency of 850 kHz. A supersaturated solution was, however, used during these experiments compared to a saturated solution in the paper previously published in the literature. The breakage of existing particles can therefore induce secondary nucleation. Consequently, more nuclei can be produced which grow into smaller crystals in the end. Another possible explanation for the smaller particle sizes is disaggregation of the crystals during the growth phase. This effect was found to be present during the precipitation of calcium carbonate when exposed to ultrasound [53]. The shear induced by implosion of the cavitation bubbles prevented particles from aggregating together.
The transducer used to generate the frequency of 1.6 MHz is similar to the one used in the paper of Nii et al. [23]. In this paper, glycine was crystallized under sonication at 40 kHz and 1.6 MHz. Larger crystals, compared to silent conditions, were obtained at the frequency of 1.6 MHz. The incorporation of microcrystals into the growing crystal was given as a possible explanation for this observation. This could not be observed in Figure 9 as the peaks of the silent experiment and 1.6 MHz overlap. Monoclinic acetaminophen crystals can be observed on all SEM images of Figure 10. No microcrystals or changes in the crystal shape could be observed among the different frequencies, in contrast to the paper of Nii et al. Anti-solvent crystallization was, however, used in the paper of Nii et al. compared to a cooling crystallization in Figure 8 and Figure 9, and glycine was used instead of acetaminophen. The creation of microcrystals and ultrasound enhanced crystal growth can therefore depend on the used component or type of crystallization process.
It can be concluded that the particle size can be influenced during crystal growth by the ultrasonic frequency. The lower the frequency, the smaller the final crystal size becomes.

4. Conclusions

This paper showed that the particle size can be controlled by the application of ultrasound during both the nucleation and growth phase. Seeds were generated in a continuous tubular crystallizer and grown further in a batch vessel. Ultrasound allowed us to trigger nucleation at different supersaturation ratios. The supersaturation ratio at which ultrasound was enabled, during seed generation, significantly impacted the final particle size. The higher the supersaturation, the smaller the final crystals became up to a supersaturation ratio of 1.56. Above this level, a further rise in the supersaturation ratio did not impact the final particle size anymore. The ultrasonic power applied during seed generation, in contrast, had an insignificant effect on the final particle size. The introduction of a 3-way valve in the tubular setup used in this paper impeded the possibility of further particle size control.
The ultrasonic frequency applied during crystal growth in the batch vessel significantly impacted the final PSD. Frequencies from 41 kHz to 850 kHz reduced the final particle size compared to silent conditions; the lower the applied frequency in this range, the smaller the final particles became. Frequencies of 1.1 MHz or 1.6 MHz did not result in a change in the final PSD compared to the silent conditions.

Supplementary Materials

The following are available online at www.mdpi.com/2073-4352/7/7/195/s1, Figure S1: Continuous mode 1, Figure S2: Continuous mode 2, Figure S3: Continuous mode 3, Figure S4: Continuous mode 4, Figure S5: Batch mode.

Acknowledgments

The research leading to these results has received funding from the European Community’s Seventh Framework Program (FP7/2007-2013) under grant agreement No. NMP2-SL-2012-309874 (ALTEREGO). Jeroen Jordens acknowledges funding of a Ph.D. grant by the Agency for Innovation by Science and Technology (IWT).

Author Contributions

Jeroen Jordens and Enio Canini conceived and designed the experiments; Enio Canini performed the experiments; Jeroen Jordens, Enio Canini, Bjorn Gielen, Tom Van Gerven, and Leen Braeken analyzed the data; Jeroen Jordens wrote the paper.

Conflicts of Interest

The authors declare no conflict of interest.

References

  1. Eder, R.J.P.; Schmitt, E.K.; Grill, J.; Radl, S.; Gruber-Woelfler, H.; Khinast, J.G. Seed loading effects on the mean crystal size of acetylsalicylic acid in a continuous-flow crystallization device. Cryst. Res. Technol. 2011, 46, 227–237. [Google Scholar] [CrossRef]
  2. Alvarez, A.J.; Myerson, A.S. Continuous Plug Flow Crystallization of Pharmaceutical Compounds. Cryst. Growth Des. 2010, 10, 2219–2228. [Google Scholar] [CrossRef]
  3. Castro, F.; Kuhn, S.; Jensen, K.; Ferreira, A.; Rocha, F.; Vicente, A.; Teixeira, J.A. Process intensification and optimization for hydroxyapatite nanoparticles production. Chem. Eng. Sci. 2013, 100, 352–359. [Google Scholar] [CrossRef]
  4. Eder, R.J.P.; Schrank, S.; Besenhard, M.O.; Roblegg, E.; Gruber-Woelfler, H.; Khinast, J.G. Continuous Sonocrystallization of Acetylsalicylic Acid (ASA): Control of Crystal Size. Cryst. Growth Des. 2012, 12, 4733–4738. [Google Scholar] [CrossRef]
  5. Besenhard, M.O.; Neugebauer, P.; Ho, C.-D.; Khinast, J.G. Crystal Size Control in a Continuous Tubular Crystallizer. Cryst. Growth Des. 2015, 15, 1683–1691. [Google Scholar] [CrossRef]
  6. Thorat, A.A.; Dalvi, S.V. Liquid antisolvent precipitation and stabilization of nanoparticles of poorly water soluble drugs in aqueous suspensions: Recent developments and future perspective. Chem. Eng. J. 2012, 181–182, 1–34. [Google Scholar] [CrossRef]
  7. Lawton, S.; Steele, G.; Shering, P.; Zhao, L.; Laird, I.; Ni, X.-W. Continuous Crystallization of Pharmaceuticals Using a Continuous Oscillatory Baffled Crystallizer. Org. Process. Res. Dev. 2009, 13, 1357–1363. [Google Scholar] [CrossRef]
  8. Neugebauer, P.; Khinast, J.G. Continuous Crystallization of Proteins in a Tubular Plug-Flow Crystallizer. Cryst. Growth Des. 2015, 15, 1089–1095. [Google Scholar] [CrossRef] [PubMed]
  9. Furuta, M.; Mukai, K.; Cork, D.; Mae, K. Continuous crystallization using a sonicated tubular system for controlling particle size in an API manufacturing process. Chem. Eng. Process. Process. Intensif. 2016, 102, 210–218. [Google Scholar] [CrossRef]
  10. Siddique, H.; Brown, C.J.; Houson, I.; Florence, A.J. Establishment of a Continuous Sonocrystallization Process for Lactose in an Oscillatory Baffled Crystallizer. Org. Process. Res. Dev. 2015, 19, 1871–1881. [Google Scholar] [CrossRef]
  11. Jiang, M.; Papageorgiou, C.D.; Waetzig, J.; Hardy, A.; Langston, M.; Braatz, R.D. Indirect Ultrasonication in Continuous Slug-Flow Crystallization. Cryst. Growth Des. 2015, 15, 2486–2492. [Google Scholar] [CrossRef]
  12. Narducci, O.; Jones, A.G.; Kougoulos, E. Continuous crystallization of adipic acid with ultrasound. Chem. Eng. Sci. 2011, 66, 1069–1076. [Google Scholar] [CrossRef]
  13. Jordens, J.; Appermont, T.; Gielen, B.; Van Gerven, T.; Braeken, L. Sonofragmentation: Effect of Ultrasound Frequency and Power on Particle Breakage. Cryst. Growth Des. 2016, 16, 6167–6177. [Google Scholar] [CrossRef]
  14. Sander, J.R.G.; Zeiger, B.W.; Suslick, K.S. Sonocrystallization and sonofragmentation. Ultrason. Sonochem. 2014, 21, 1908–1915. [Google Scholar] [CrossRef] [PubMed]
  15. Zeiger, B.W.; Suslick, K.S. Sonofragmentation of molecular crystals. J. Am. Chem. Soc. 2011, 133, 14530–14533. [Google Scholar] [CrossRef] [PubMed]
  16. Wohlgemuth, K.; Ruether, F.; Schembecker, G. Sonocrystallization and crystallization with gassing of adipic acid. Chem. Eng. Sci. 2010, 65, 1016–1027. [Google Scholar] [CrossRef]
  17. Harzali, H.; Baillon, F.; Louisnard, O.; Espitalier, F.; Mgaidi, A. Experimental study of sono-crystallisation of ZnSO4·7H2O, and interpretation by the segregation theory. Ultrason. Sonochem. 2011, 18, 1097–1106. [Google Scholar] [CrossRef] [PubMed]
  18. Castillo-Peinado, L.; de los, S.; Castro, M.D.L. The role of ultrasound in pharmaceutical production: Sonocrystallization. J. Pharm. Pharmacol. 2016, 68, 1249–1267. [Google Scholar] [CrossRef] [PubMed]
  19. Kudo, S.; Takiyama, H. Production of Fine Organic Crystalline Particles by Using Milli Segmented Flow Crystallizer. J. Chem. Eng. Jpn. 2012, 45, 305–309. [Google Scholar] [CrossRef]
  20. Rossi, D.; Jamshidi, R.; Saffari, N.; Kuhn, S.; Gavriilidis, A.; Mazzei, L. Continuous-Flow Sonocrystallization in Droplet-Based Microfluidics. Cryst. Growth Des. 2015, 15, 5519–5529. [Google Scholar] [CrossRef]
  21. Suslick, K.S. Sonochemistry. Kirk Othmer Encycl. Chem. Technol. 1998. [Google Scholar] [CrossRef]
  22. Luque de Castro, M.D.; Priego-Capote, F. Ultrasound-assisted crystallization (sonocrystallization). Ultrason. Sonochem. 2007, 14, 717–724. [Google Scholar] [CrossRef] [PubMed]
  23. Nii, S.; Takayanagi, S. Growth and size control in anti-solvent crystallization of glycine with high frequency ultrasound. Ultrason. Sonochem. 2014, 21, 1182–1186. [Google Scholar] [CrossRef] [PubMed]
  24. Wong, S.Y.; Cui, Y.; Myerson, A.S. Contact Secondary Nucleation as a Means of Creating Seeds for Continuous Tubular Crystallizers. Cryst. Growth Des. 2013, 13, 2514–2521. [Google Scholar] [CrossRef]
  25. Jordens, J.; Gielen, B.; Braeken, L.; Van Gerven, T. Determination of the effect of the ultrasonic frequency on the cooling crystallization of paracetamol. Chem. Eng. Process. Process. Intensif. 2014, 84, 38–44. [Google Scholar] [CrossRef]
  26. Raso, J.; Mañas, P.; Pagán, R.; Sala, F.J. Influence of different factors on the output power transferred into medium by ultrasound. Ultrason. Sonochem. 1999, 5, 157–162. [Google Scholar] [CrossRef]
  27. Hagenson, L.C.; Doraiswamy, L.K. Comparison of the effects of ultrasound and mechanical agitation on a reacting solid-liquid system. Chem. Eng. Sci. 1998, 53, 131–148. [Google Scholar] [CrossRef]
  28. Hallez, L.; Touyeras, F.; Hihn, J.Y.; Klima, J. Energetic balance in an ultrasonic reactor using focused or flat high frequency transducers. Ultrason. Sonochem. 2007, 14, 739–749. [Google Scholar] [CrossRef] [PubMed]
  29. Sutkar, V.S.; Gogate, P.R. Design aspects of sonochemical reactors: Techniques for understanding cavitational activity distribution and effect of operating parameters. Chem. Eng. J. 2009, 155, 26–36. [Google Scholar] [CrossRef]
  30. Kordylla, A.; Koch, S.; Tumakaka, F.; Schembecker, G. Towards an optimized crystallization with ultrasound: Effect of solvent properties and ultrasonic process parameters. J. Cryst. Growth 2008, 310, 4177–4184. [Google Scholar] [CrossRef]
  31. Fujiwara, M.; Chow, P.S.; Ma, D.L.; Braatz, R.D. Paracetamol Crystallization Using Laser Backscattering and ATR-FTIR Spectroscopy: Metastability, Agglomeration, and Control. Cryst. Growth Des. 2002, 2, 363–370. [Google Scholar] [CrossRef]
  32. Kwak, B.-M.; Lee, J.E.; Ahn, J.-H.; Jeon, T.-H. Laser diffraction particle sizing by wet dispersion method for spray-dried infant formula. J. Food Eng. 2009, 92, 324–330. [Google Scholar] [CrossRef]
  33. Bari, A.H.; Chawla, A.; Pandit, A.B. Sono-crystallization kinetics of K2SO4: Estimation of nucleation, growth, breakage and agglomeration kinetics. Ultrason. Sonochem. 2017, 35, 196–203. [Google Scholar] [CrossRef] [PubMed]
  34. Ferguson, S.; Morris, G.; Hao, H.; Barrett, M.; Glennon, B. In-situ monitoring and characterization of plug flow crystallizers. Chem. Eng. Sci. 2012, 77, 105–111. [Google Scholar] [CrossRef]
  35. Marchisio, D.L.; Rivautella, L.; Barresi, A.A. Design and scale-up of chemical reactors for nanoparticle precipitation. AIChE J. 2006, 52, 1877–1887. [Google Scholar] [CrossRef]
  36. Myerson, A. Handbook of Industrial Crystallization; Butterworth-Heinemann: Oxford, UK, 2002. [Google Scholar]
  37. Méndez del Río, J.R.; Rousseau, R.W. Batch and Tubular-Batch Crystallization of Paracetamol: Crystal Size Distribution and Polymorph Formation. Cryst. Growth Des. 2006, 6, 1407–1414. [Google Scholar] [CrossRef]
  38. Del Rio, M.; Jose, R. Solubility and Phase Transitions in Batch and Laminar-Flow Tubular Crystallizers; Georgia Institute of Technology: Atlanta, GA, USA, 2004. [Google Scholar]
  39. Kim, K.-J.; Mersmann, A. Estimation of metastable zone width in different nucleation processes. Chem. Eng. Sci. 2001, 56, 2315–2324. [Google Scholar] [CrossRef]
  40. Nalajala, V.S.; Moholkar, V.S. Investigations in the physical mechanism of sonocrystallization. Ultrason. Sonochem. 2011, 18, 345–355. [Google Scholar] [CrossRef] [PubMed]
  41. Kiani, H.; Zhang, Z.; Delgado, A.; Sun, D.-W. Ultrasound assisted nucleation of some liquid and solid model foods during freezing. Food Res. Int. 2011, 44, 2915–2921. [Google Scholar] [CrossRef]
  42. Wohlgemuth, K.; Kordylla, A.; Ruether, F.; Schembecker, G. Experimental study of the effect of bubbles on nucleation during batch cooling crystallization. Chem. Eng. Sci. 2009, 64, 4155–4163. [Google Scholar] [CrossRef]
  43. Louisnard, O.; Gomez, F.J.; Grossier, R. Segregation of a liquid mixture by a radially oscillating bubble. J. Fluid Mech. 2007, 577, 385. [Google Scholar] [CrossRef]
  44. Chow, R.; Blindt, R.; Chivers, R.; Povey, M. The sonocrystallisation of ice in sucrose solutions: Primary and secondary nucleation. Ultrasonics 2003, 41, 595–604. [Google Scholar] [CrossRef] [PubMed]
  45. Kordylla, A.; Krawczyk, T.; Tumakaka, F.; Schembecker, G. Modeling ultrasound-induced nucleation during cooling crystallization. Chem. Eng. Sci. 2009, 64, 1635–1642. [Google Scholar] [CrossRef]
  46. Dennehy, R.D. Particle Engineering Using Power Ultrasound1. Org. Process. Res. Dev. 2003, 7, 1002–1006. [Google Scholar] [CrossRef]
  47. Abbas, A.; Srour, M.; Tang, P.; Chiou, H.; Chan, H.-K.; Romagnoli, J.A. Sonocrystallisation of sodium chloride particles for inhalation. Chem. Eng. Sci. 2007, 62, 2445–2453. [Google Scholar] [CrossRef]
  48. Kougoulos, E.; Marziano, I.; Miller, P.R. Lactose particle engineering: Influence of ultrasound and anti-solvent on crystal habit and particle size. J. Cryst. Growth 2010, 312, 3509–3520. [Google Scholar] [CrossRef]
  49. Louhi-Kultanen, M.; Karjalainen, M.; Rantanen, J.; Huhtanen, M.; Kallas, J. Crystallization of glycine with ultrasound. Int. J. Pharm. 2006, 320, 23–29. [Google Scholar] [CrossRef] [PubMed]
  50. Ruecroft, G.; Hipkiss, D.; Ly, T.; Maxted, N.; Cains, P.W. Sonocrystallization: The Use of Ultrasound for Improved Industrial Crystallization. Org. Process. Res. Dev. 2005, 9, 923–932. [Google Scholar] [CrossRef]
  51. Bučar, D.-K.; Elliott, J.A.; Eddleston, M.D.; Cockcroft, J.K.; Jones, W. Sonocrystallization Yields Monoclinic Paracetamol with Significantly Improved Compaction Behavior. Angew. Chem. 2015, 127, 251–255. [Google Scholar] [CrossRef]
  52. Kaur Bhangu, S.; Ashokkumar, M.; Lee, J. Ultrasound Assisted Crystallization of Paracetamol: Crystal Size Distribution and Polymorph Control. Cryst. Growth Des. 2016, 16, 1934–1941. [Google Scholar] [CrossRef]
  53. Wagterveld, R.M.; Miedema, H.; Witkamp, G.-J. Effect of Ultrasonic Treatment on Early Growth during CaCO3 Precipitation. Cryst. Growth Des. 2012, 12, 4403–4410. [Google Scholar] [CrossRef]
Figure 1. Experimental setup.
Crystals 07 00195 g001
Figure 2. Flow cell from borosilicate glass with the crystallization channel (center) and two cooling channels (outer channels).
Crystals 07 00195 g002
Figure 3. Nucleation temperatures under silent and sonicated conditions in the flow cell and batch vessel. The bars represent the average over 3 repetitions and the error bars represent the standard deviation. The silent batch nucleation experiment was performed only once as a reference case. S (-) represents the supersaturation ratio at which nucleation occurred.
Crystals 07 00195 g003
Figure 4. Volume-based particle size distribution for the complete batch crystallization, the semi-continuous crystallization setup, and the semi-continuous crystallization setup with a 3-way valve in the flow loop.
Crystals 07 00195 g004
Figure 5. Volume-based particle size distribution for sonication at different supersaturation ratios. Ultrasound at a calorimetric power of 8 W was only applied to the flow cell.
Crystals 07 00195 g005
Figure 6. D10, D50, and D90 in the function of the supersaturation ratio at which the ultrasound was enabled in the flow cell. The calorimetric power was constant at 8 W. The markers indicate the average value and the error bars are the standard deviation over five measurements.
Crystals 07 00195 g006
Figure 7. Volume-based particle size distribution for different calorimetric powers at a supersaturation ratio of 1.36. Ultrasound was only applied during the nucleation stage of the crystallization process.
Crystals 07 00195 g007
Figure 8. XRD patterns of crystals produced at different supersaturation and power levels. The reference peaks of monoclinic acetaminophen are shown in red.
Crystals 07 00195 g008
Figure 9. Volume-based particle size distribution for different ultrasonic frequencies. Ultrasound was only applied during both the nucleation and growth stages of the crystallization process.
Crystals 07 00195 g009
Figure 10. SEM images of the growth experiment at 41 kHz (a), 577 kHz (b), 1130 kHz (c), and 1600 kHz (d). Note that the magnification is 100× for pictures (a,b) and 50× for pictures (c,d).
Crystals 07 00195 g010
Table 1. Overview of the ultrasound transducers and settings.
SectionTransducer Typef (kHz)A (mVpp)ΔT (°C)Pcal (W)
FlowUltrasonics World MPI-7850D-20_40_60H682500.564
Ultrasonics World MPI-7850D-20_40_60H685701.218
Ultrasonics World MPI-7850D-20_40_60H6812001.6311
BatchUltrasonics World MPI-7850D-20_40_60H41318-8
Ultrasonics World MPI-7850D-20_40_60H97484-8
Meinhardt E/805/T/M570175-8
Meinhardt E/805/T/M850207-8
Meinhardt E/805/T/M1130172-8
Honda Electronics Co., Ltd.-1.6 MHz1600183-8
Table 2. Overview of all of the experiments with their settings and main results. fnucl is the frequency applied during the nucleation stage (kHz).
Experiment NameOperation Mode NucleationOperation Mode GrowthfnuclPcal nuclfgrowthPcal growth3-Way ValveTus in flowSTnuclD10D50D90
kHzWkHzW-°C-°Cµmµmµm
silent batchbatchbatch------1.8128.40190429878
silent flowflowbatch----no-1.8727.33197450825
sonicated flowflowbatch688--no60.001.3237.9059113203
silent flow with 3-way valveflowbatch----yes-1.2639.33225410687
Sonicated flow with 3-way valveflowbatch688--yes60.001.1242.89244444746
silent @28 °Cflowbatch----no-1.8328.00197450825
US @37 °Cflowbatch688--no37.001.3637.0059113203
US @35 °Cflowbatch688--no35.001.4535.003273143
US @33 °Cflowbatch688--no33.001.5533.002354112
US @31 °Cflowbatch688--no31.001.6631.002560118
US @29 °Cflowbatch688--no29.001.7729.002152112
Pcal = 4 Wflowbatch684--no60.001.3637.0079154271
Pcal = 8 Wflowbatch688--no60.001.3637.0071142282
Pcal = 11 Wflowbatch6811--no60.001.3637.0099177306
start crystalsflowbatch688--yes60.001.1242.5–43.11794305
1.6 MHzflowbatch68816008yes60.001.1242.5–43.1211364588
1.1 MHzflowbatch68811308yes60.001.1242.5–43.1205372614
850 kHzflowbatch6888508yes60.001.1242.5–43.179144295
570 kHzflowbatch6885708yes60.001.1242.5–43.14283170
97 kHzflowbatch688978yes60.001.1242.5–43.1234791
41 kHzflowbatch688418yes60.001.1242.5–43.1193979
Pcal nucl is the calorimetric power applied during the nucleation stage (W), fgrowth is the frequency applied during the growth stage (kHz), Pcal growth is the calorimetric power applied during the growth stage (W), and TUS in flow is the temperature at which ultrasound is enabled in the flow vessel (°C).
Table 3. Settings for the particle size distribution measurement.
SettingValueUnit
Refractive index particles1.619-
Absorption index particles0.01-
Density particles1.34g/mL
Refractive index dispersant1.375-
Lower obscuration limit10%
Upper obscuration limit30%
Stirring speed2400rpm
Duration measurement10s
Number of measurements5-
Max. allowed RSD D503%
Max. allowed RSD D10 & D903%

