CO2 Capture and Crystallization of Ammonia Bicarbonate in a Lab-Scale Scrubber

Department of Chemical and Materials Engineering, Lunghwa University of Science and Technology, Taoyuan 33306, Taiwan
*
Author to whom correspondence should be addressed.
Crystals 2018, 8(1), 39; https://doi.org/10.3390/cryst8010039
Submission received: 21 November 2017
/
Revised: 9 January 2018
/
Accepted: 12 January 2018
/
Published: 16 January 2018
(This article belongs to the Special Issue Carbonates)
Abstract
:A lab-scale bubble-column scrubber is used to capture CO2 gas and produce ammonia bicarbonate (ABC) using aqueous ammonia as an absorbent under a constant pH and temperature. The CO2 concentration is adjusted by mixing N2 and CO2 in the range of 15–60 vol % at 55 °C. The process variables are the pH of the solution, temperature, gas-flow rate and the concentration of gas. The effects of the process variables on the removal efficiency (E), absorption rate (RA) and overall mass-transfer coefficient (KGa) were explored. A multiple-tube mass balance model was used to determine RA and KGa, in which RA and KGa were in the range of 2.14 × 10⁻⁴–1.09 × 10⁻³ mol/(s·L) and 0.0136–0.5669 1/s, respectively. Results found that, RA showed an obvious increase with the increase in pH, inlet gas concentration and gas temperature, while KGa decreased with an increase in inlet gas concentration. Using linear regression, an empirical expression for KGa/E was obtained. On the other hand, ammonia bicarbonate crystals could be produced at a pH of 9.5 when the gas concentration was higher than 30% and γ (=Fg/FA, the gas-liquid molar flow rate ratio) ≥ 1.5.
1. Introduction
The total global carbon dioxide emissions are increasing by the day, which causes the temperature to rise rapidly, thus, creating severe impacts on the global ecology. Therefore, the issues of CO2 have attracted great attention with the most attention on the CO2 emission of coal fired power plants and steel plants [1]. There are two main kinds of CO2 capturing methods currently under study, namely, pre-combustion and post-combustion [2]. The technology of the pre-combustion method is to primary treat fossil fuels with steam and air or oxygen, in order to separate the fossil fuel into carbon dioxide and hydrogen and then, to store the carbon dioxide and use the hydrogen for combustion meaning no carbon dioxide would be produced. In the post-combustion method, the emitted CO2 is about 15% which is mainly captured by chemical absorption.
The absorbents used for chemical absorption include the alkaline solutions of all levels, such as amine, ammonia, sodium hydroxide and hot potassium carbonate [3,4,5,6]. Among numerous absorption technologies and absorbents, the monoethanolamine (MEA) process is the most popular and already operates in more than a thousand units which is comparable with 700 plants for potassium carbonate solution [6]. However, the MEA process still has some disadvantages including low absorption efficiency, low CO2 loading, high regeneration energy requirements and the container corrosion issue [3,7]. In the case of using MEA as the absorbent, the absorbed carbon dioxide is stored in the liquid phase in a liquid state, which might be released again due to the influence of the pH value and the huge volume. Therefore, in some studies, MEA is changed to aqueous ammonia as the absorbent, which is used to absorb the carbon dioxide as reported in the literature [1,3,8].
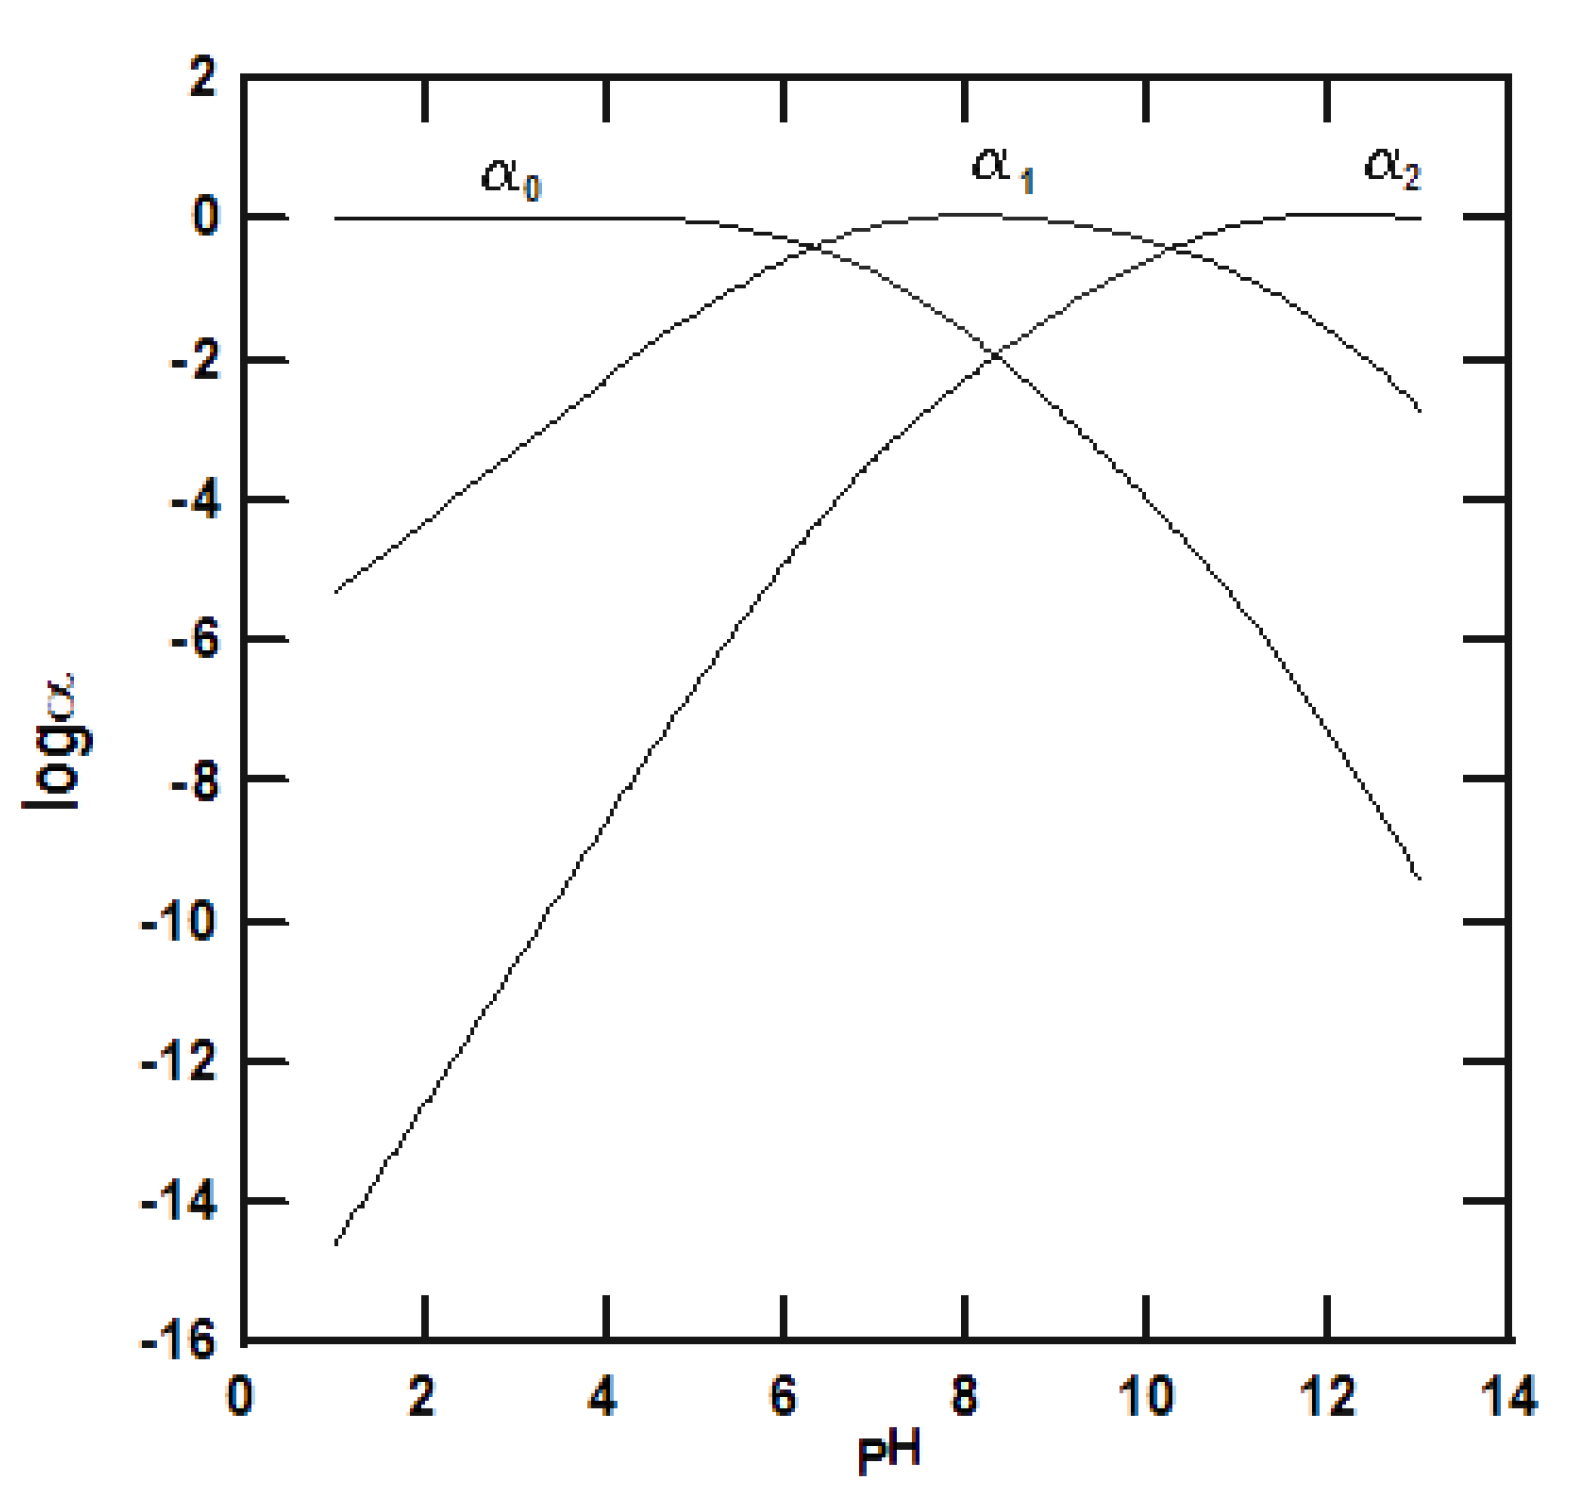
The advantages of using aqueous ammonia as the absorbent are high absorption load, low regeneration energy requirement, low corrosiveness, lower cost and higher removal efficiency [9,10,11]. Another advantage is that an aqueous ammonia solution can be used to simultaneously remove CO2, SO2 and NOx [12]. Moreover, the other reasons for using aqueous ammonia as an absorbent solution are due to its high CO2 loading capacity, low regeneration energy at a relatively low temperature (~8 °C) and reuse of ammonia and stripped water vapor for the distillation of aqueous carbonated ammonia [1,4,13]. The CO2 absorption process using aqueous ammonia solution depends on the temperature, ion concentration and pH value of the solution where more carbon dioxide is absorbed at a higher pH value and more ammonia is created [3,14]. Moreover, a higher aqueous ammonia concentration or lower CO2 concentration would cause the absorption efficiency to decline, which would affect the absorption of carbon dioxide. The carbonate dissociation degree in the aqueous phase is shown in Figure 1 [15,16]. Within a pH range of pH = 7–9, as shown by α1, the solution mainly contains bicarbonate; when the pH value is above 10, as shown by α2, the solution mainly contains carbonate; and when the pH value is less than 6, the solution mainly contains carbonic acid (H2CO3*).
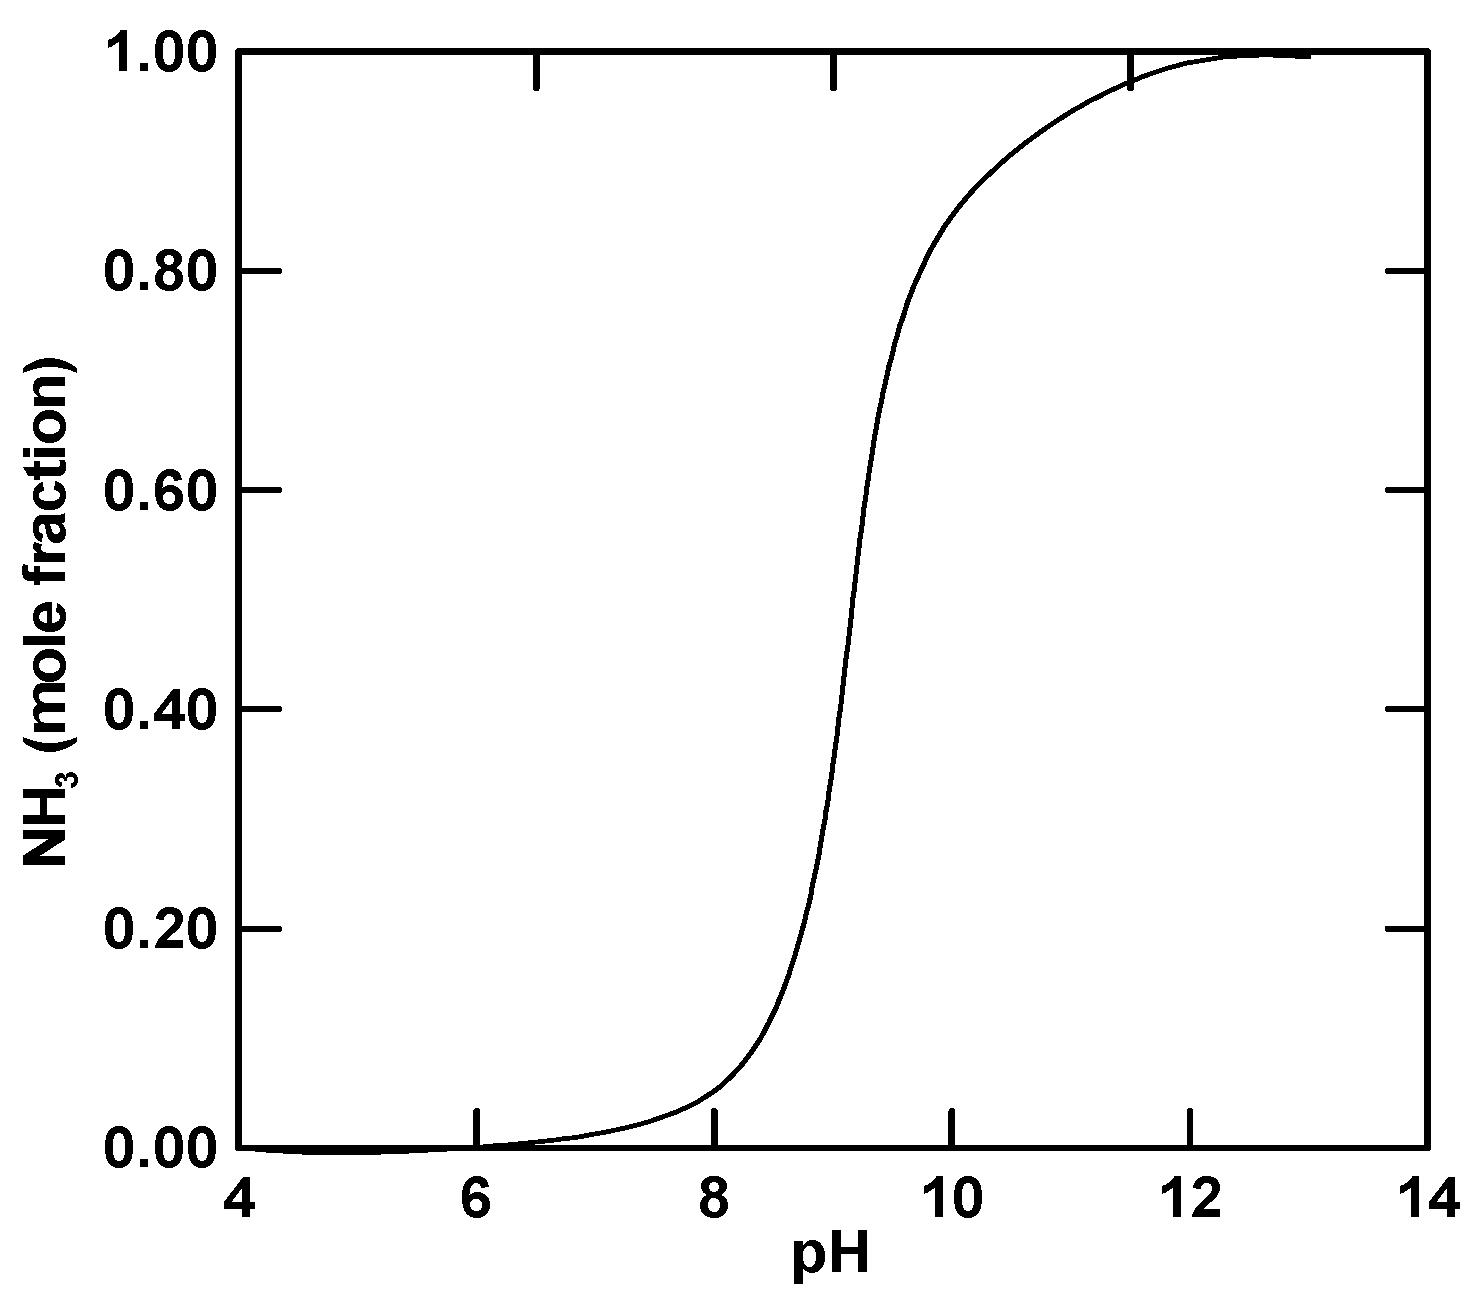
More carbon dioxide is absorbed by aqueous ammonia at a higher pH value; in addition, more ammonia is created at a higher pH value. Therefore, the best pH value will facilitate the absorption process, as shown in Figure 2. Equations (1)–(3) are the formulas for ammonia dissociation in water. As ammonia will be separated due to the effect of the pH value and a higher pH value can help the formation of NH3(aq), NH3 can be separated out of the solution [16]. As shown in Figure 2, it is known that, when pH = 9.5 the mole fraction of NH3 is about 0.8, which could be a very good operating condition in terms of ammonium bicarbonate generation.
Many scholars have studied the absorption of CO2 using an aqueous ammonia solution and have adopted different scrubbers for their studies, such as the stirred cell [4,17], sieve plate column [9], falling film [18], absorption column [19] and spray tower [20] scrubbers. In literature, the suitability of an absorber is determined by the level of the mass transfer coefficient. However, we can also use the absorption factor (φ) to make the comparison, which is the moles of CO2 that are able to be absorbed per mole per unit volume and is defined, as follows:
where Fg (mol/s) represents the molar flow rate of the feed gas, E is the absorption efficiency, FA (mol/s) is the molar flow rate of the solvent and VB (L)is the volume of the absorber.
Regarding the bubble column, the absorption factor is 5 to 10 times that of the packed column of high-efficiency structured packing material, which indicates that under the same conditions, in order to obtain the same absorption factor, the volume of the packed column of high-efficiency structured packing material should be 5 to 10 times that of the bubble column; and while the volume of a conventional packed column, needs to be 130 times that of the bubble column to have the same absorption factor as the bubble column [21]. The above results show that the bubble column shows superior performance and many scholars use the bubble column as the absorber and object of study to this end [5,22,23,24]. To summarize, using aqueous ammonia as the absorbent requires high load and low energy for regeneration. In addition, according to the absorption factor comparison, the absorption factor of the bubble column is higher than other types of absorbers.
From literature survey, capturing CO2 using aqueous ammonia has two possible: one is absorption without precipitation and the other is absorption with precipitation, depending on the pH of the solution. In addition, precipitation of ABC in the bubble-column scrubber is feasible as compared packed column and sieve tray. However, the research regarding to the capture of CO2 using aqueous ammonia in a bubble-column scrubber is scare. This indicates that no technique data, including precipitation rate of ABC, absorption rate and overall mass-transfer coefficient, can be found in the literature. Due to this, a study of capturing CO2 using aqueous ammonia solution in a bubble-column scrubber is required, including absorption without precipitation and absorption with precipitation. Therefore, the purposes of this research are to understand the phenomena in the absorption of CO2 in the bubble-column scrubber; to find the effect of process variables on the absorption rate, overall mass-transfer coefficient, precipitation of ABC; and to search for the better process in the capture of CO2 using aqueous ammonia as absorbent.
2. Absorption Model and Solution Chemistry
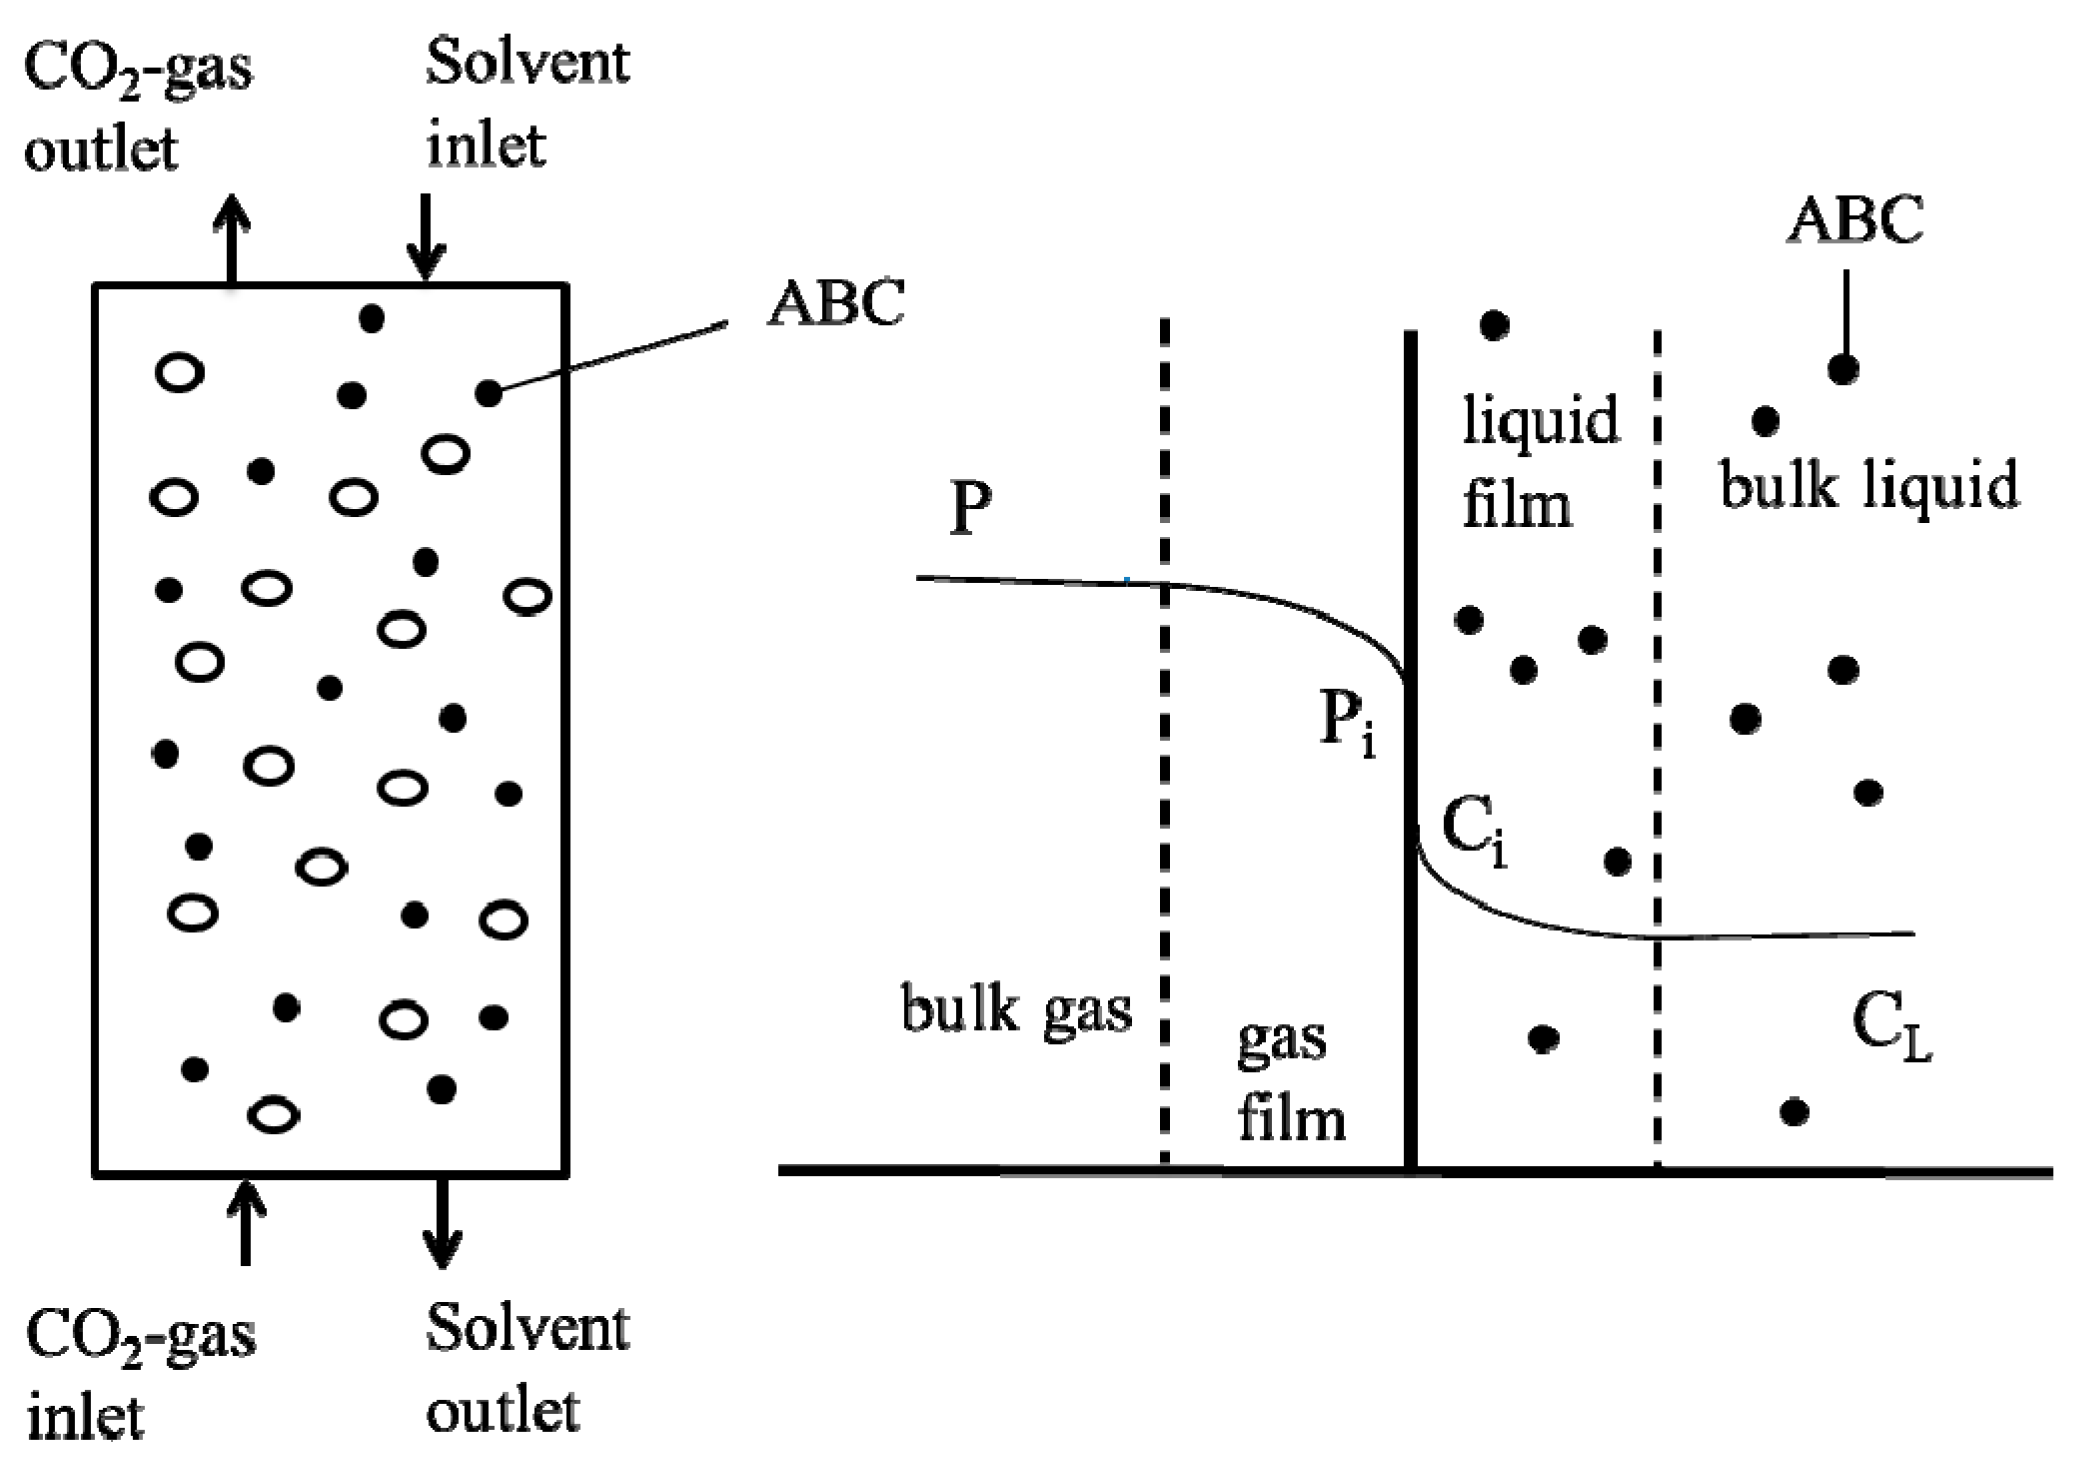
In a bubble-column scrubber, a gas mixture containing carbon dioxide (A) and nitrogen (B) flows into a bubble column from the bottom and continues through the distributor, thus, coming into continuous contact with the aqueous ammonia solution flowing into the column from the top. The two streams come into contact within the column’s countercurrent simultaneously. The diffusing of CO2 gas inside a gas bubble in the solution can be described by a Two-film model, as shown in Figure 3. The CO2 gas at pressure P diffuses from the left side to the gas-liquid interface and enters into the liquid side, where it is absorbed by the aqueous ammonia solution. At the interface, the relationship between the partial pressure of the CO2 and the dissolution of the CO2 in the liquid can be expressed by Harry’s Law (PA = HCA). According to this model, the absorption rate and overall mass transfer coefficient can be determined using measurable quantities [21].
The solution’s chemistry for the NH3-CO2-H2O system is presented in Table 1 [25]. Ionization of each component after the absorption of the CO2 into the aqueous ammonia solution can be expressed by six equations, as shown in Table 1. Equations (6) and (7) show the carbonation of CO2 dissolved in an aqueous solution. Equations (8)–(10) show that NH3 as a weak base will cause the chemical absorption of the weak acid CO2. In the absorbed solution, the various species include CO2 and bicarbonate, carbonate, carbamate anions and ammonium cation. In addition, Table 1 and Equation (10) include the formation of ammonia bicarbonate (ABC) and NH4HCO3(s), as this solid can precipitate in the scrubber depending on the operating conditions. However, the concentrations of chemical species can vary when the solution pH, CO2 concentration, temperature and ammonia concentration are changed. Thus, how to control the process variables becomes significant in the ammonia capture study. The absorption rate and overall mass transfer coefficient can be determined when CO2 is captured by an aqueous ammonia solution [5]. Therefore, once the inlet and outlet concentrations of CO2 can be measured at a steady state; the absorption rate, Equation (11) and overall mass transfer coefficient, Equation (13), can be evaluated, as shown in Table 2. Alternatively, the KGa can be estimated using Equation (14) when the outlet CO2 concentration is near zero. In Equation (14), is the arithmetic mean between the inlet and outlet.
3. Experimental Procedure
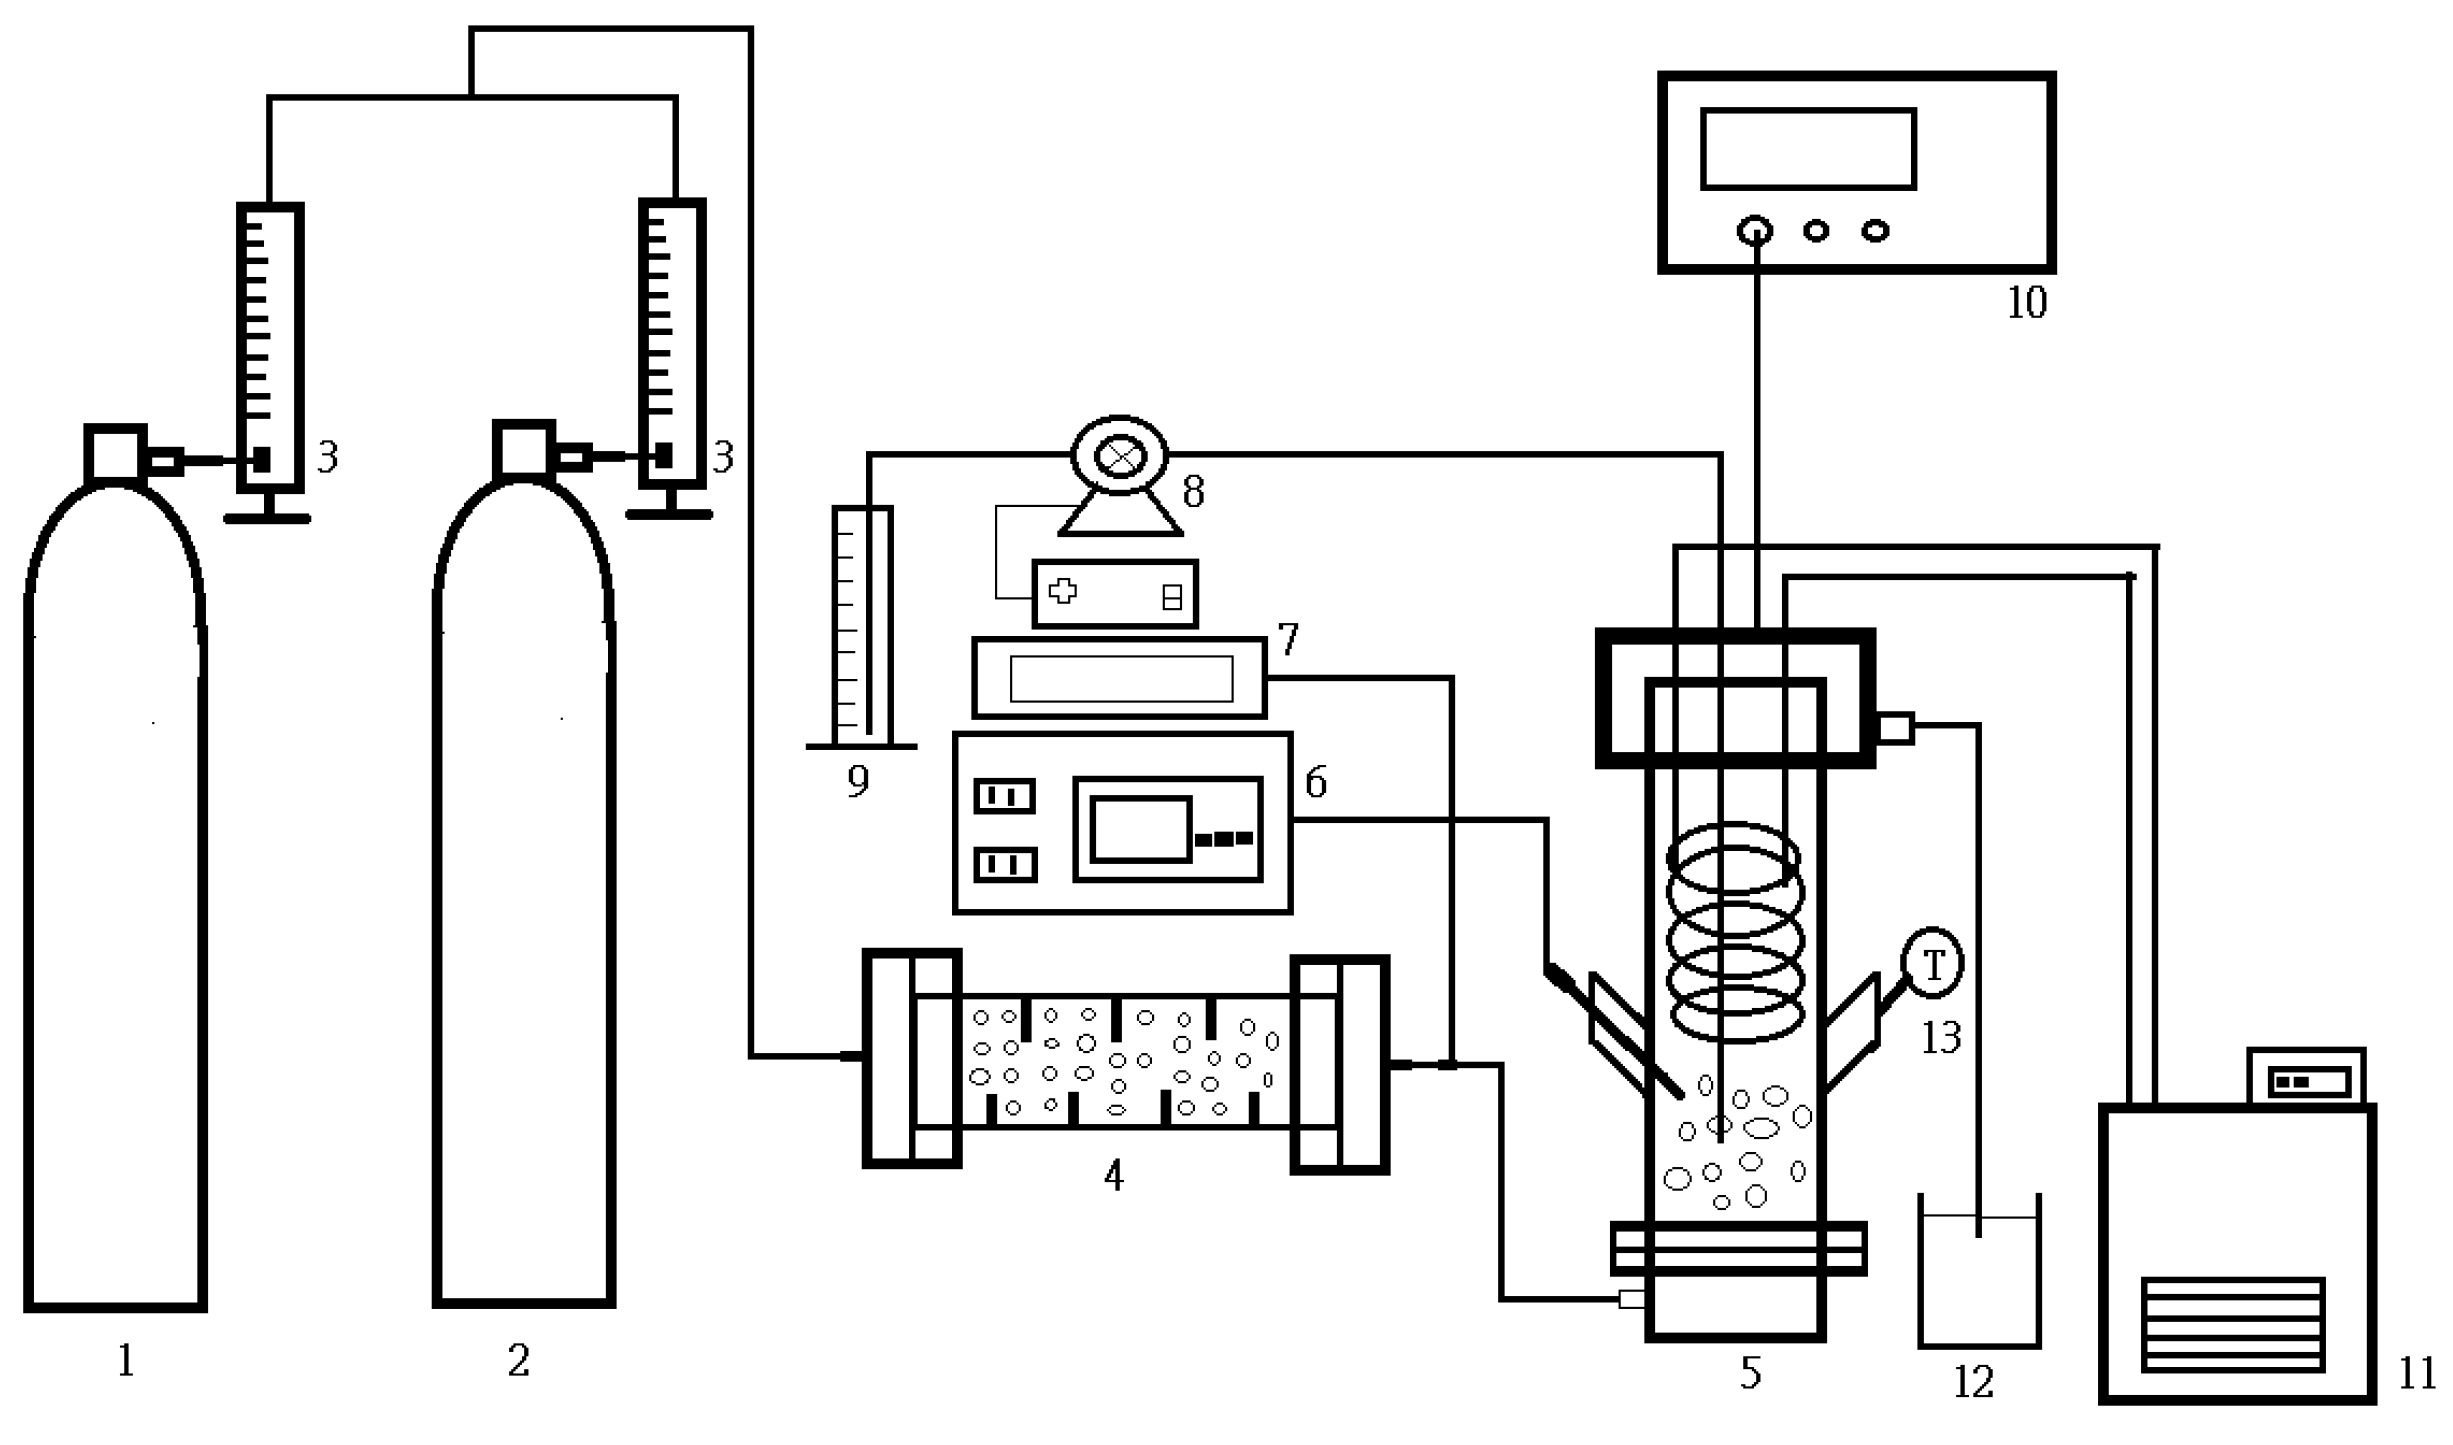
The experimental device used is shown in Figure 4. The inside diameter of the column is 5 cm and the gas distributor is a perforated plate designed with four holes per square centimeter and each hole is 1 mm in diameter. Initially, a known amount of aqueous ammonia solution (14%) is introduced into the column, into which a pH electrode is inserted. The solution is adjusted to the desired pH value by adding a known concentration of aqueous solution (28%). The experiment starts when the mixed N2–CO2 gas, in the range of 15–60% CO2 gas, begins bubbling through the column. The gas flow rates are in the range of 3 to 5 L/min. A gas heater and circulating cooling water tank are used to control the gas and solution temperatures. The mixed gas is delivered to the heater, which maintains the inlet gas temperature at 55 °C. The operating pH value is in the range of 9.5–11.5. The temperature in the bubble column is maintained at 25–60 °C by a water cooling system (Deng Yng, D-620, New Taipei, Taiwan). The operating time is 5–7 h, depending on the operating conditions. During the operation, the pH of the solution is decreased due to absorption in the scrubber. In order to hold the pH value of the solution at a desired value during operation, an aqueous ammonia solution is introduced into the column through the action of a pH controller (Suntex, PC-310, New Taipei, Taiwan). The overflow solution automatically flows out to the reservoir. The volume of added solution is recorded every ten minutes during the operation. A digital gauge pressure meter measures the inlet gas pressure. A CO2 gas meter (Guardian Plus, D600, Hartford, USA) is used to measure the concentration of the CO2 gas at the outlet of the bubble column (y2). When the concentration of CO2 gas changes to a steady state, the solutions are withdrawn using a syringe to measure the total dissolved CO2 in the solution. At the end of the operation, the solution is poured into a vessel and the volume of the solution (VL) is measured. In addition, the slurry solution is separated using a filter. The crystal size distribution is measured by a particle size analyzer (Galai, CIS-50, Or Akiva, Israel). The crystals obtained are characterized by X-ray (Rigaku, D/MAX-2200/PC, Tokyo, Japan), FESEM (Jeol, JSM-6500F, Tokyo, Japan) and EA (Thermo, Flash EA1112, Cambridge, UK ), respectively. A total of twenty runs are carried out in this work. The operating conditions and physical properties of ABC are, as shown in Table 3.
4. Results and Discussion
The results listed in Table 4 include the RA, KGa and E. It is found that, the removal efficiency E obtained here is in the range of 10.9–100%; the RA was in the range of 3.2122 × 10⁻⁴–10.999 × 10⁻⁴ mol/(s·L) and the KGa is in the range of 0.0136–0.3302 L/s. In addition, the ABC crystals are formed at a pH of 9.5, such as Nos. 3, 4, 6, 7, 8, 10, 11 and 12. For other pH values, no ABC crystals could be obtained.
4.1. Effect of Process Variables on E
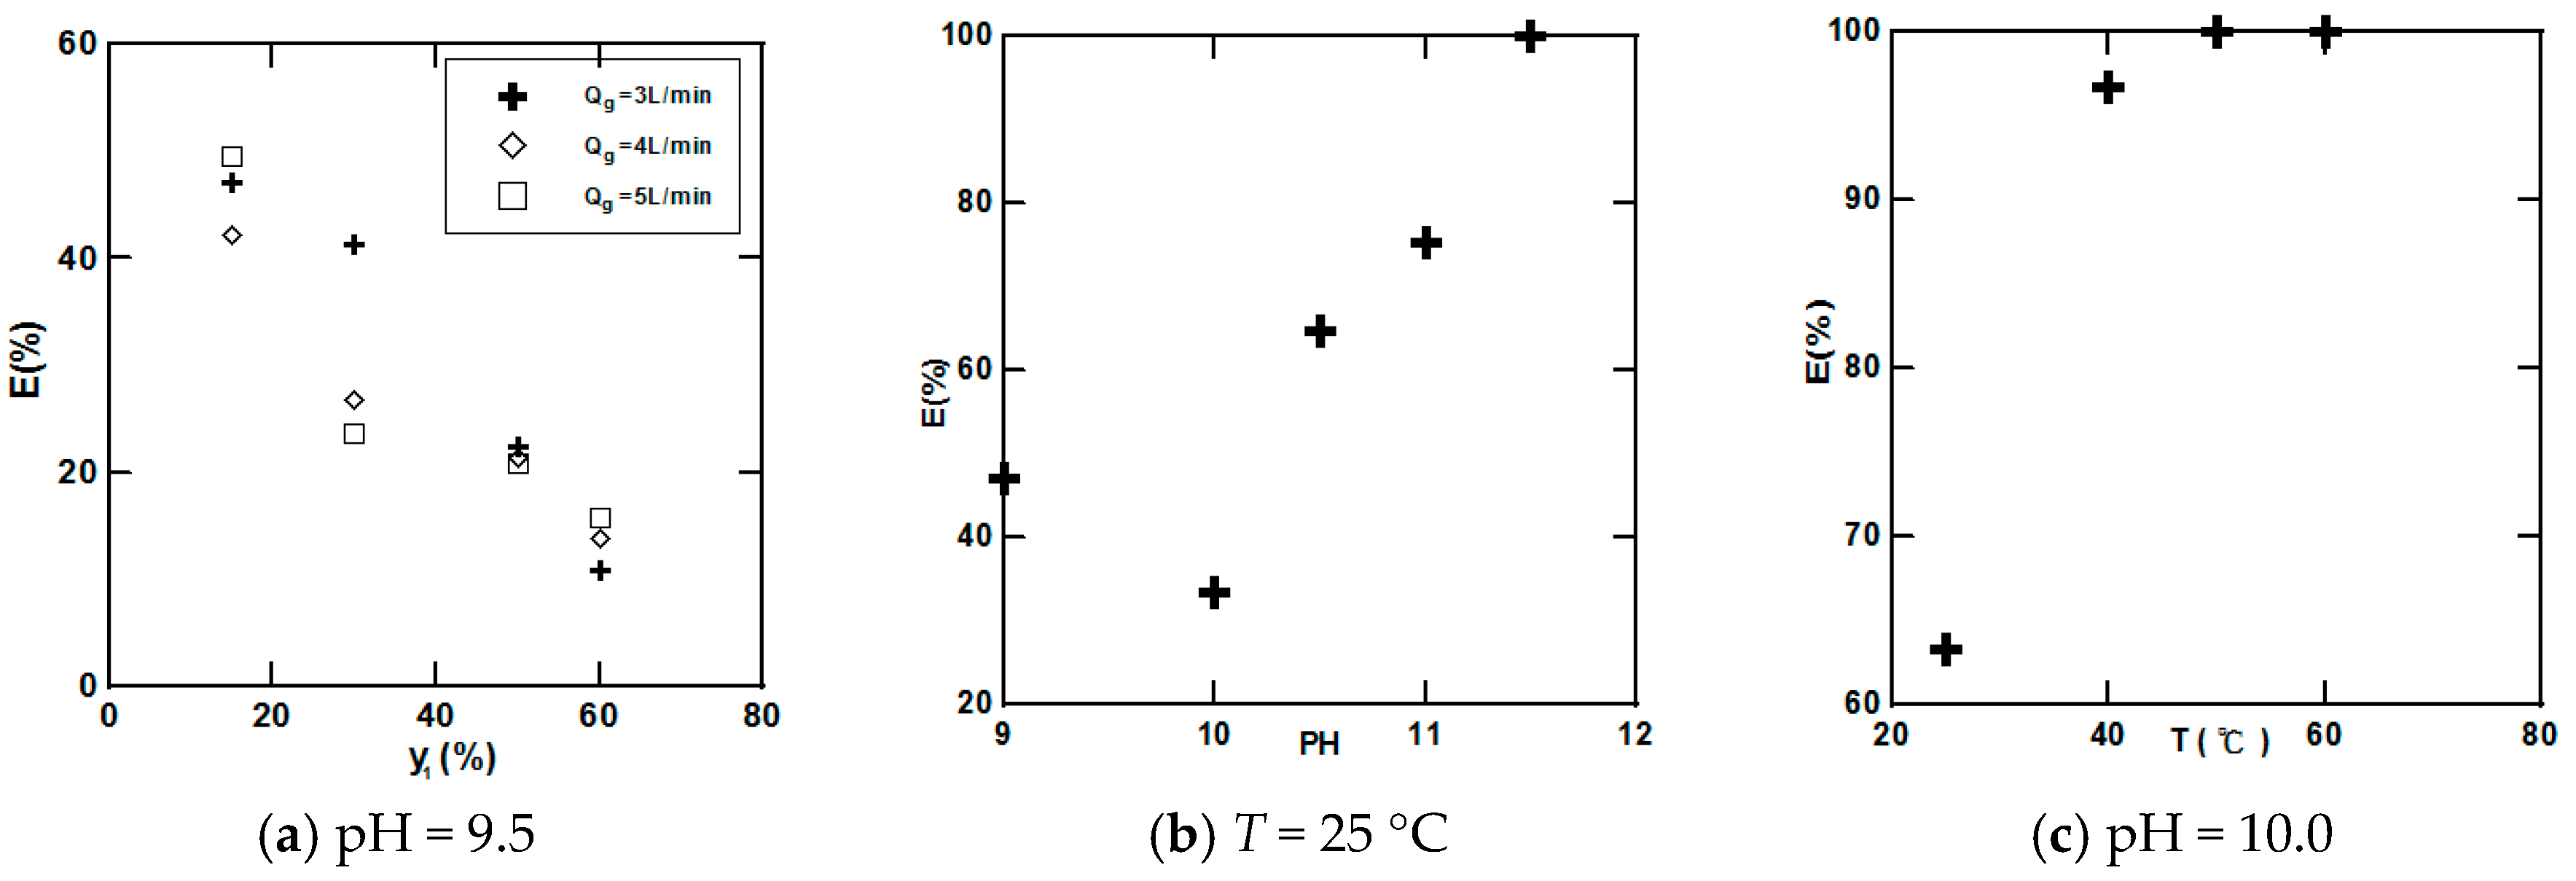
Figure 5a shows the effect of the CO2 inlet concentrations at various gas-flow rates on the removal efficiency of CO2. It is found that E decreases with the increase in CO2 gas concentration, while the effect of the gas flow rate was not obvious. On the other hand, the effects of the pH level and gas inlet temperature of E are significant, as shown in Figure 5b,c. The results show that E increases with the increase in the pH level and gas flow rate at the gas inlet. The analysis of the gas-liquid molar flow rate ratio, γ, as listed in Table 4, finds that the removal efficiency is higher than 60% when γ is lower than 0.5, indicating the influence of γ on E.
4.2. Effect of Process Variables on the RA and KGa
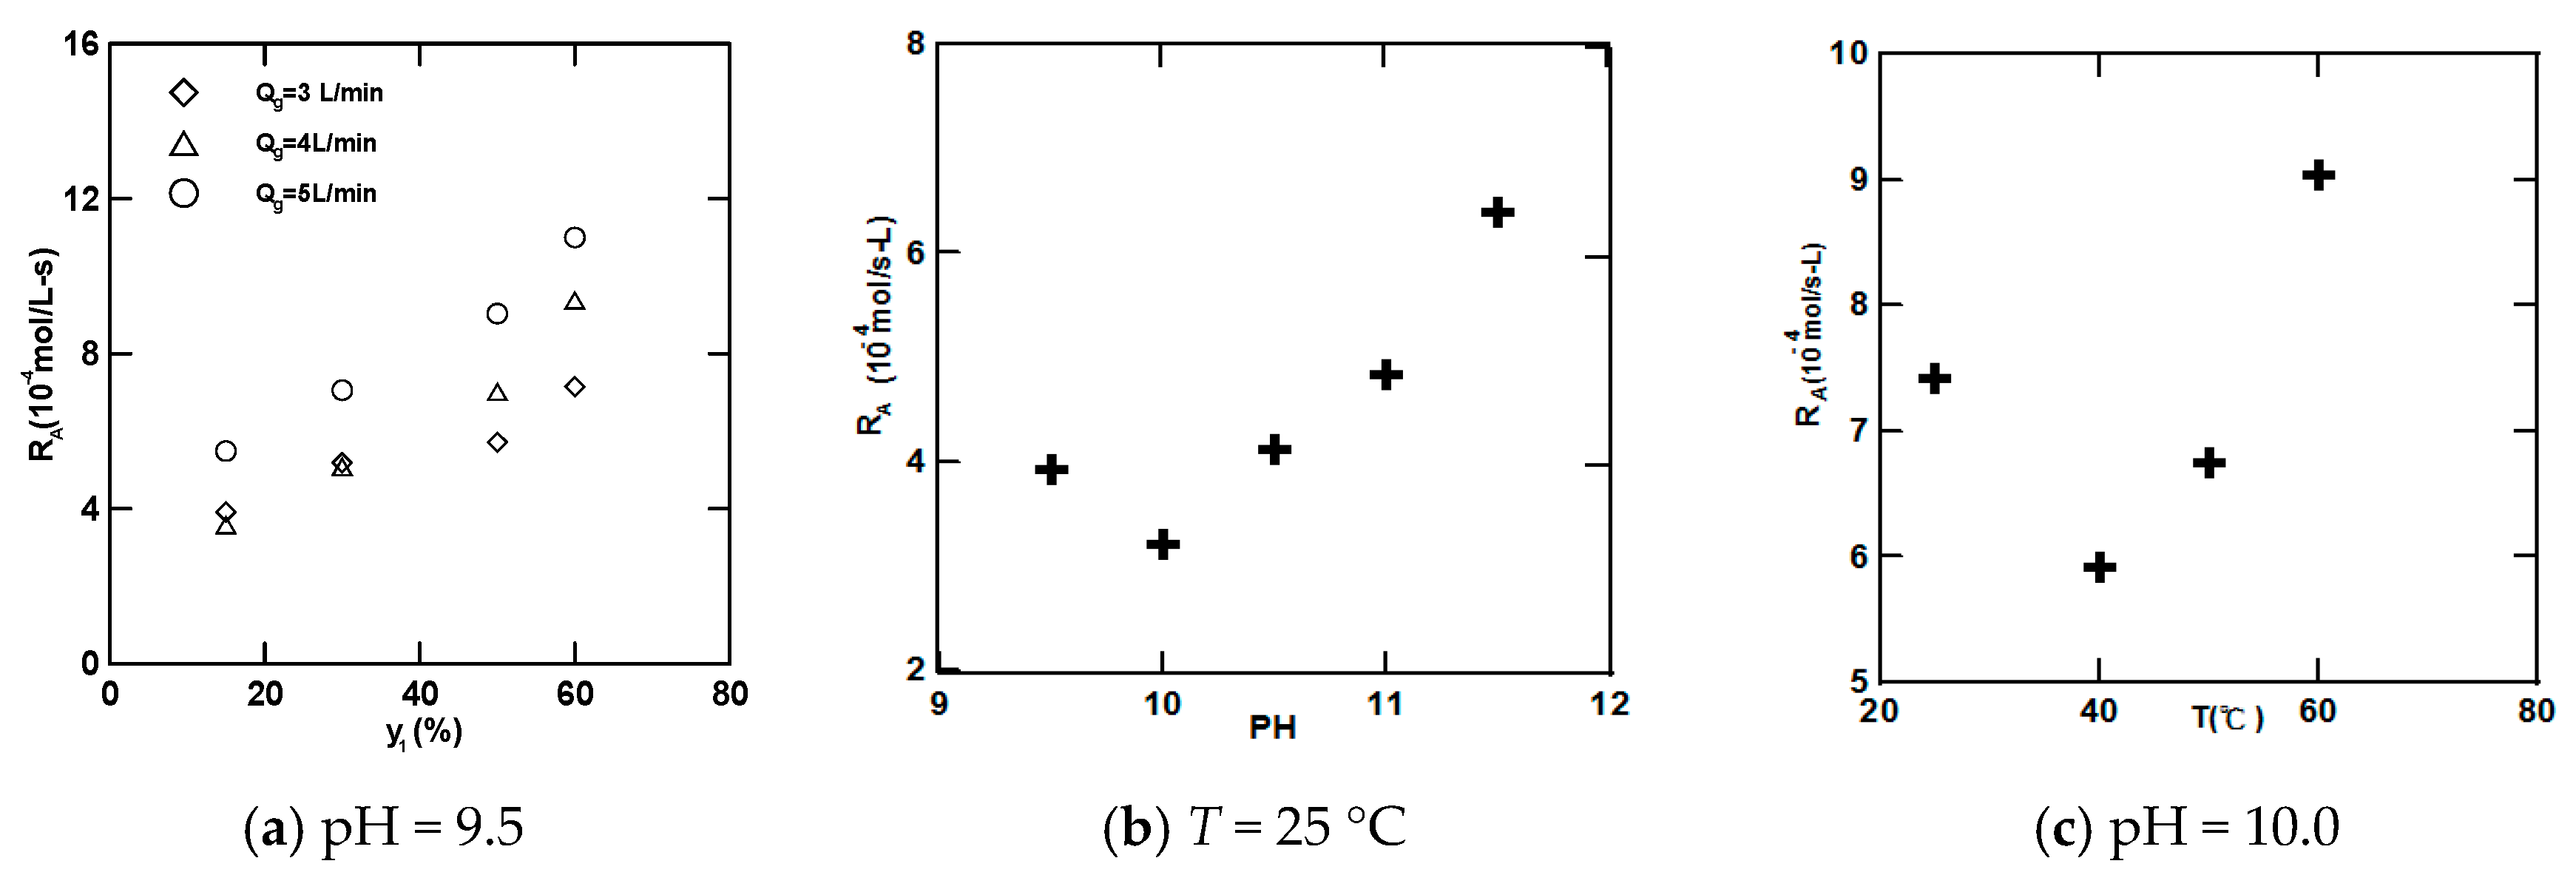
A plot of RA versus y1 at various gas-flow rate absorption rates is shown in Figure 6a. The results show that RA increases with an increase in y1, while RA is higher at higher gas flow rates. In addition, the results find that the RA increases with the pH and gas input concentrations, as shown in Figure 6b,c. Alternatively, a wetted-wall column for CO2 absorption test is reported in literatures by different scholars, who obtain RA in the range of 2.15 × 10⁻⁴–4.48 × 10⁻³ mol/(L·s) [13] and 2.05 × 10⁻⁴–5.53 × 10⁻³ mol/(L·s) [26], respectively. Some of these values are higher than that reported in here, 3.21 × 10⁻⁴–1.10 × 10⁻³ mol/(L·s). In addition, the higher RA (2.07 × 10⁻³–7.24 × 10⁻³ mol/(L·s)) can be obtained when aqueous hydrazine is used as a solvent for CO2 capture [27].
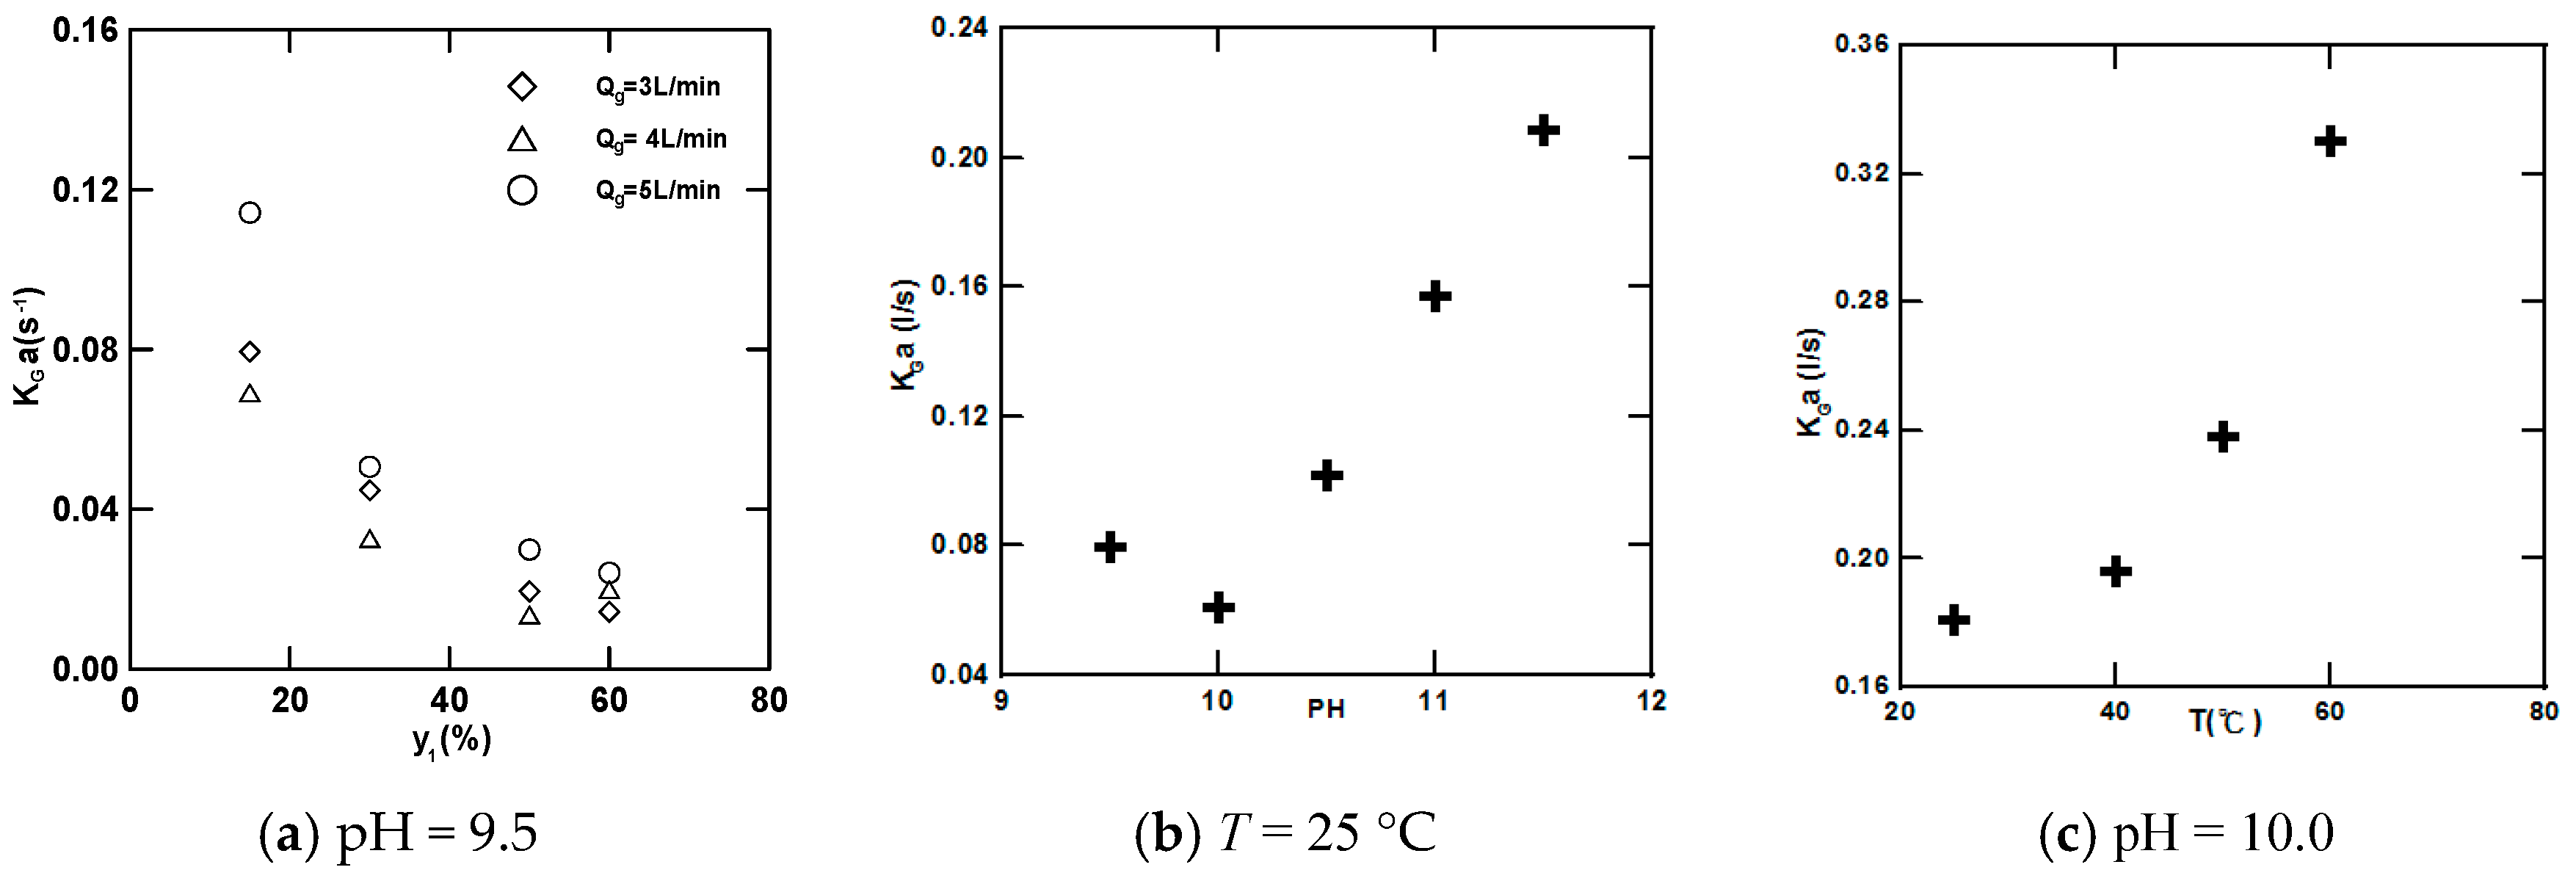
The effects of y1, Qg, pH and T on the overall mass transfer are also investigated. Figure 7a shows that the effect of y1 on KGa at various Qg is obvious. It also shows that KGa decreases with an increase in y1 indicating a higher mass resistance at higher gas concentrations. In addition, KGa increases with the increase in Qg, which indicates that increasing the gas-liquid contact surface area and turbulence mixing results in a more effective contact. The effects of pH levels and gas inlet temperatures on KGa are expressed in Figure 7b,c. The effects of the pH level and temperature on KGa are obvious, indicating the significance of pH and temperature. However, the KGa, as obtained here, is in the range of 0.0136–0.3302 1/s, which is comparable with other solvents, such as MEA solvent which is in the range of 0.0342–0.881 1/s [28] and NaOH/BaCl2/H2O, which is in the ranges of 0.0651–0.3396 1/s [5] and 0.015–0.14 1/s for a stirred-tank scrubber using an aqueous ammonia solution as the scrubbing solution [4]. On the other hand, from data reported in literatures [8,13,26,27], the KGa can be recalculated for comparison. The recalculated values of wetted-wall column tests are 0.03469–0.2658 1/s [13] and 0.02551–0.4336 1/s [26], respectively; while the recalculated values for packed column are in the range of 0.486–2.43 1/s [8] when a specific area of packings, 500 m2/m3, is available. Moreover, the KGa is 2.21 1/s when using aqueous hydrazine solvent [27].
4.3. Characterization of ABC Crystals
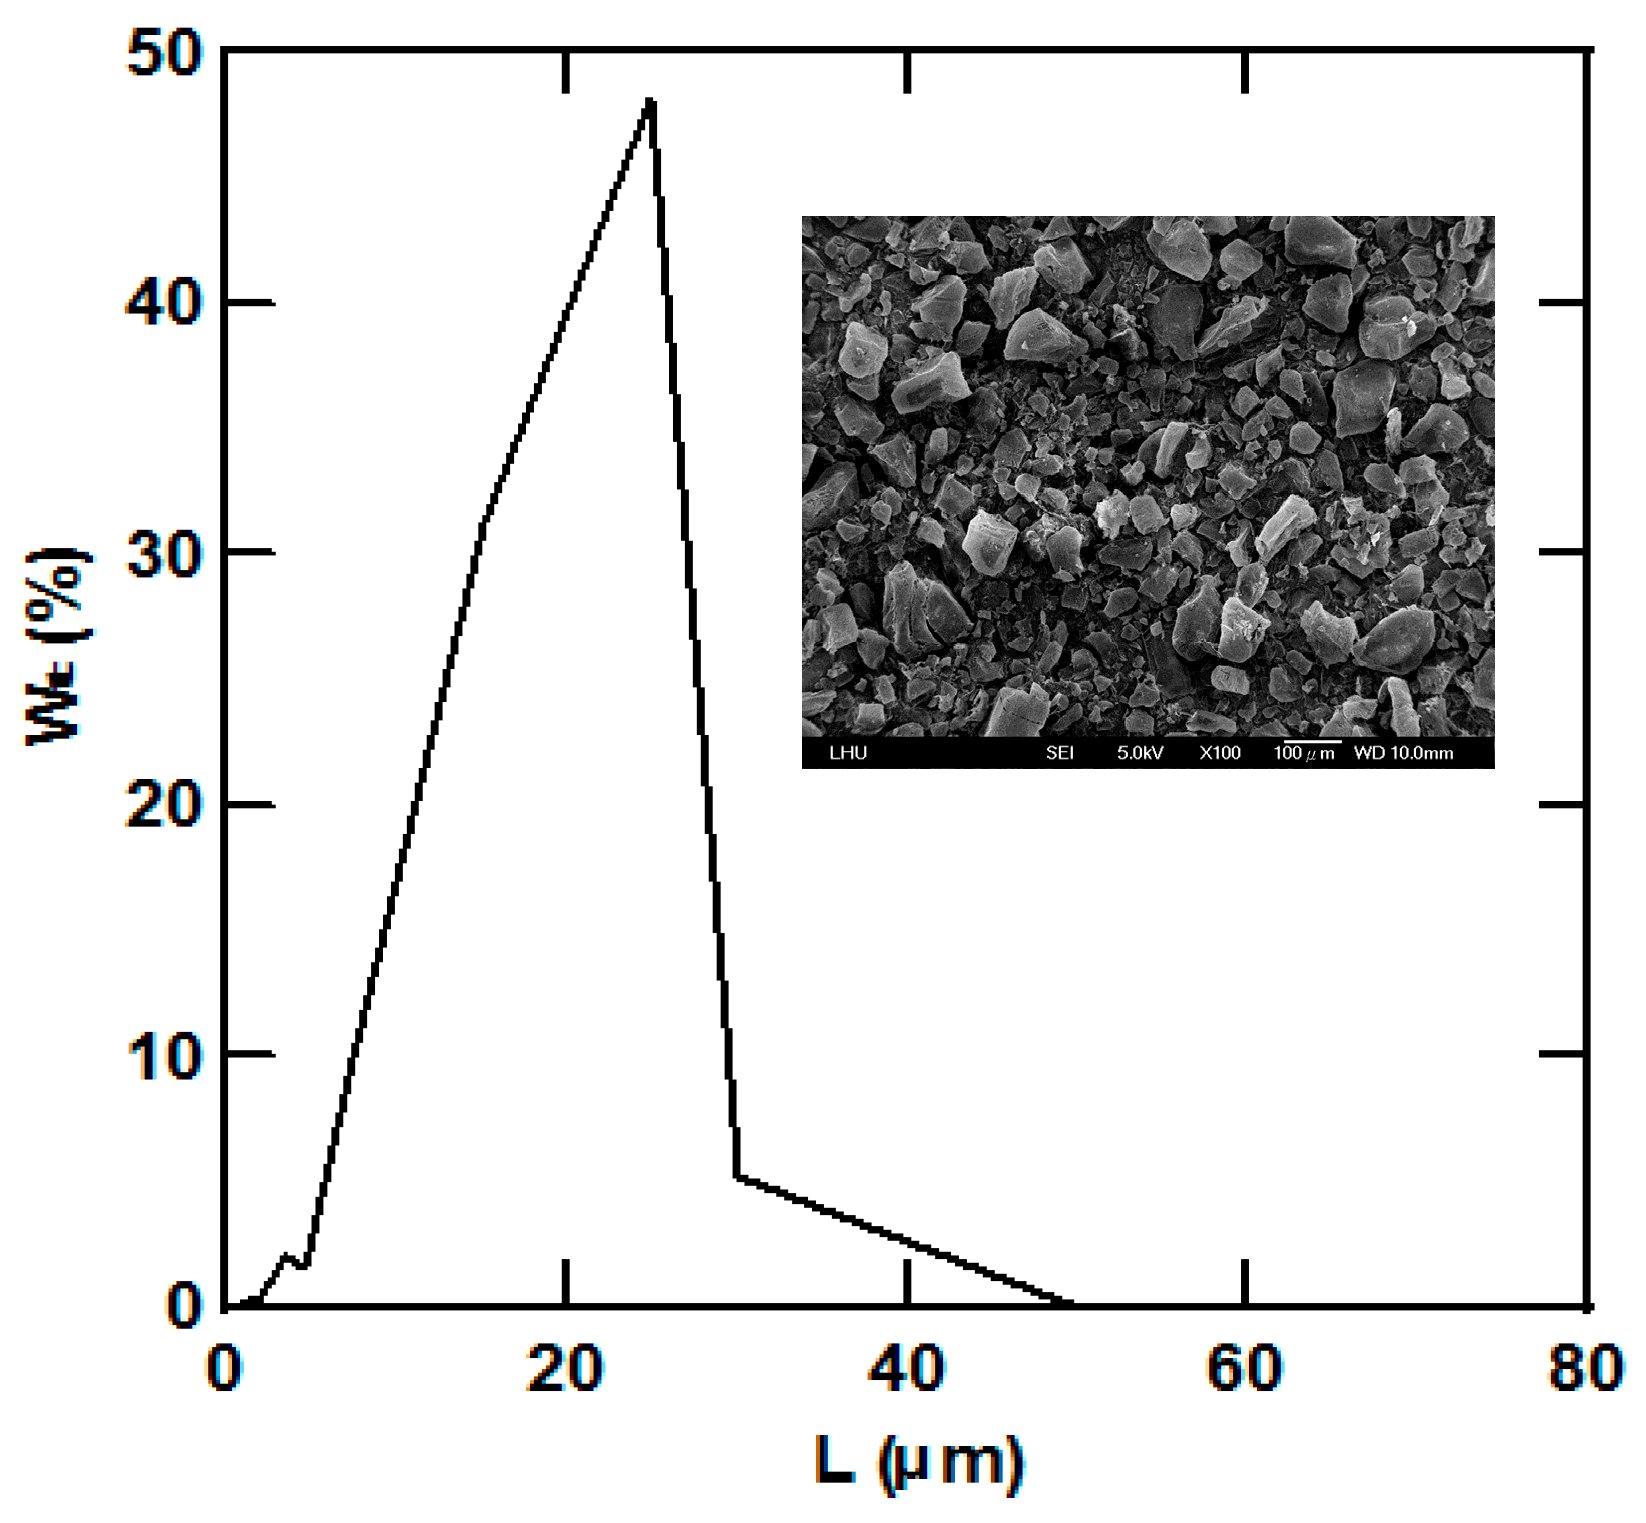
While the formation of ABC is found here, it is not found under all conditions, such as Nos. 3, 4, 6, 7, 8, 10, 11 and 12 at a pH level of 9.5. Figure 8 for No. 12 shows the crystal size distribution measured using a CIS-1 particle size analyzer. The major distribution is in the size range of 30–100 μm. On the other hand, when the crystals are examined by SEM, as also shown in Figure 8, small irregular crystals are observed indicating the fracture property of ABC crystals.
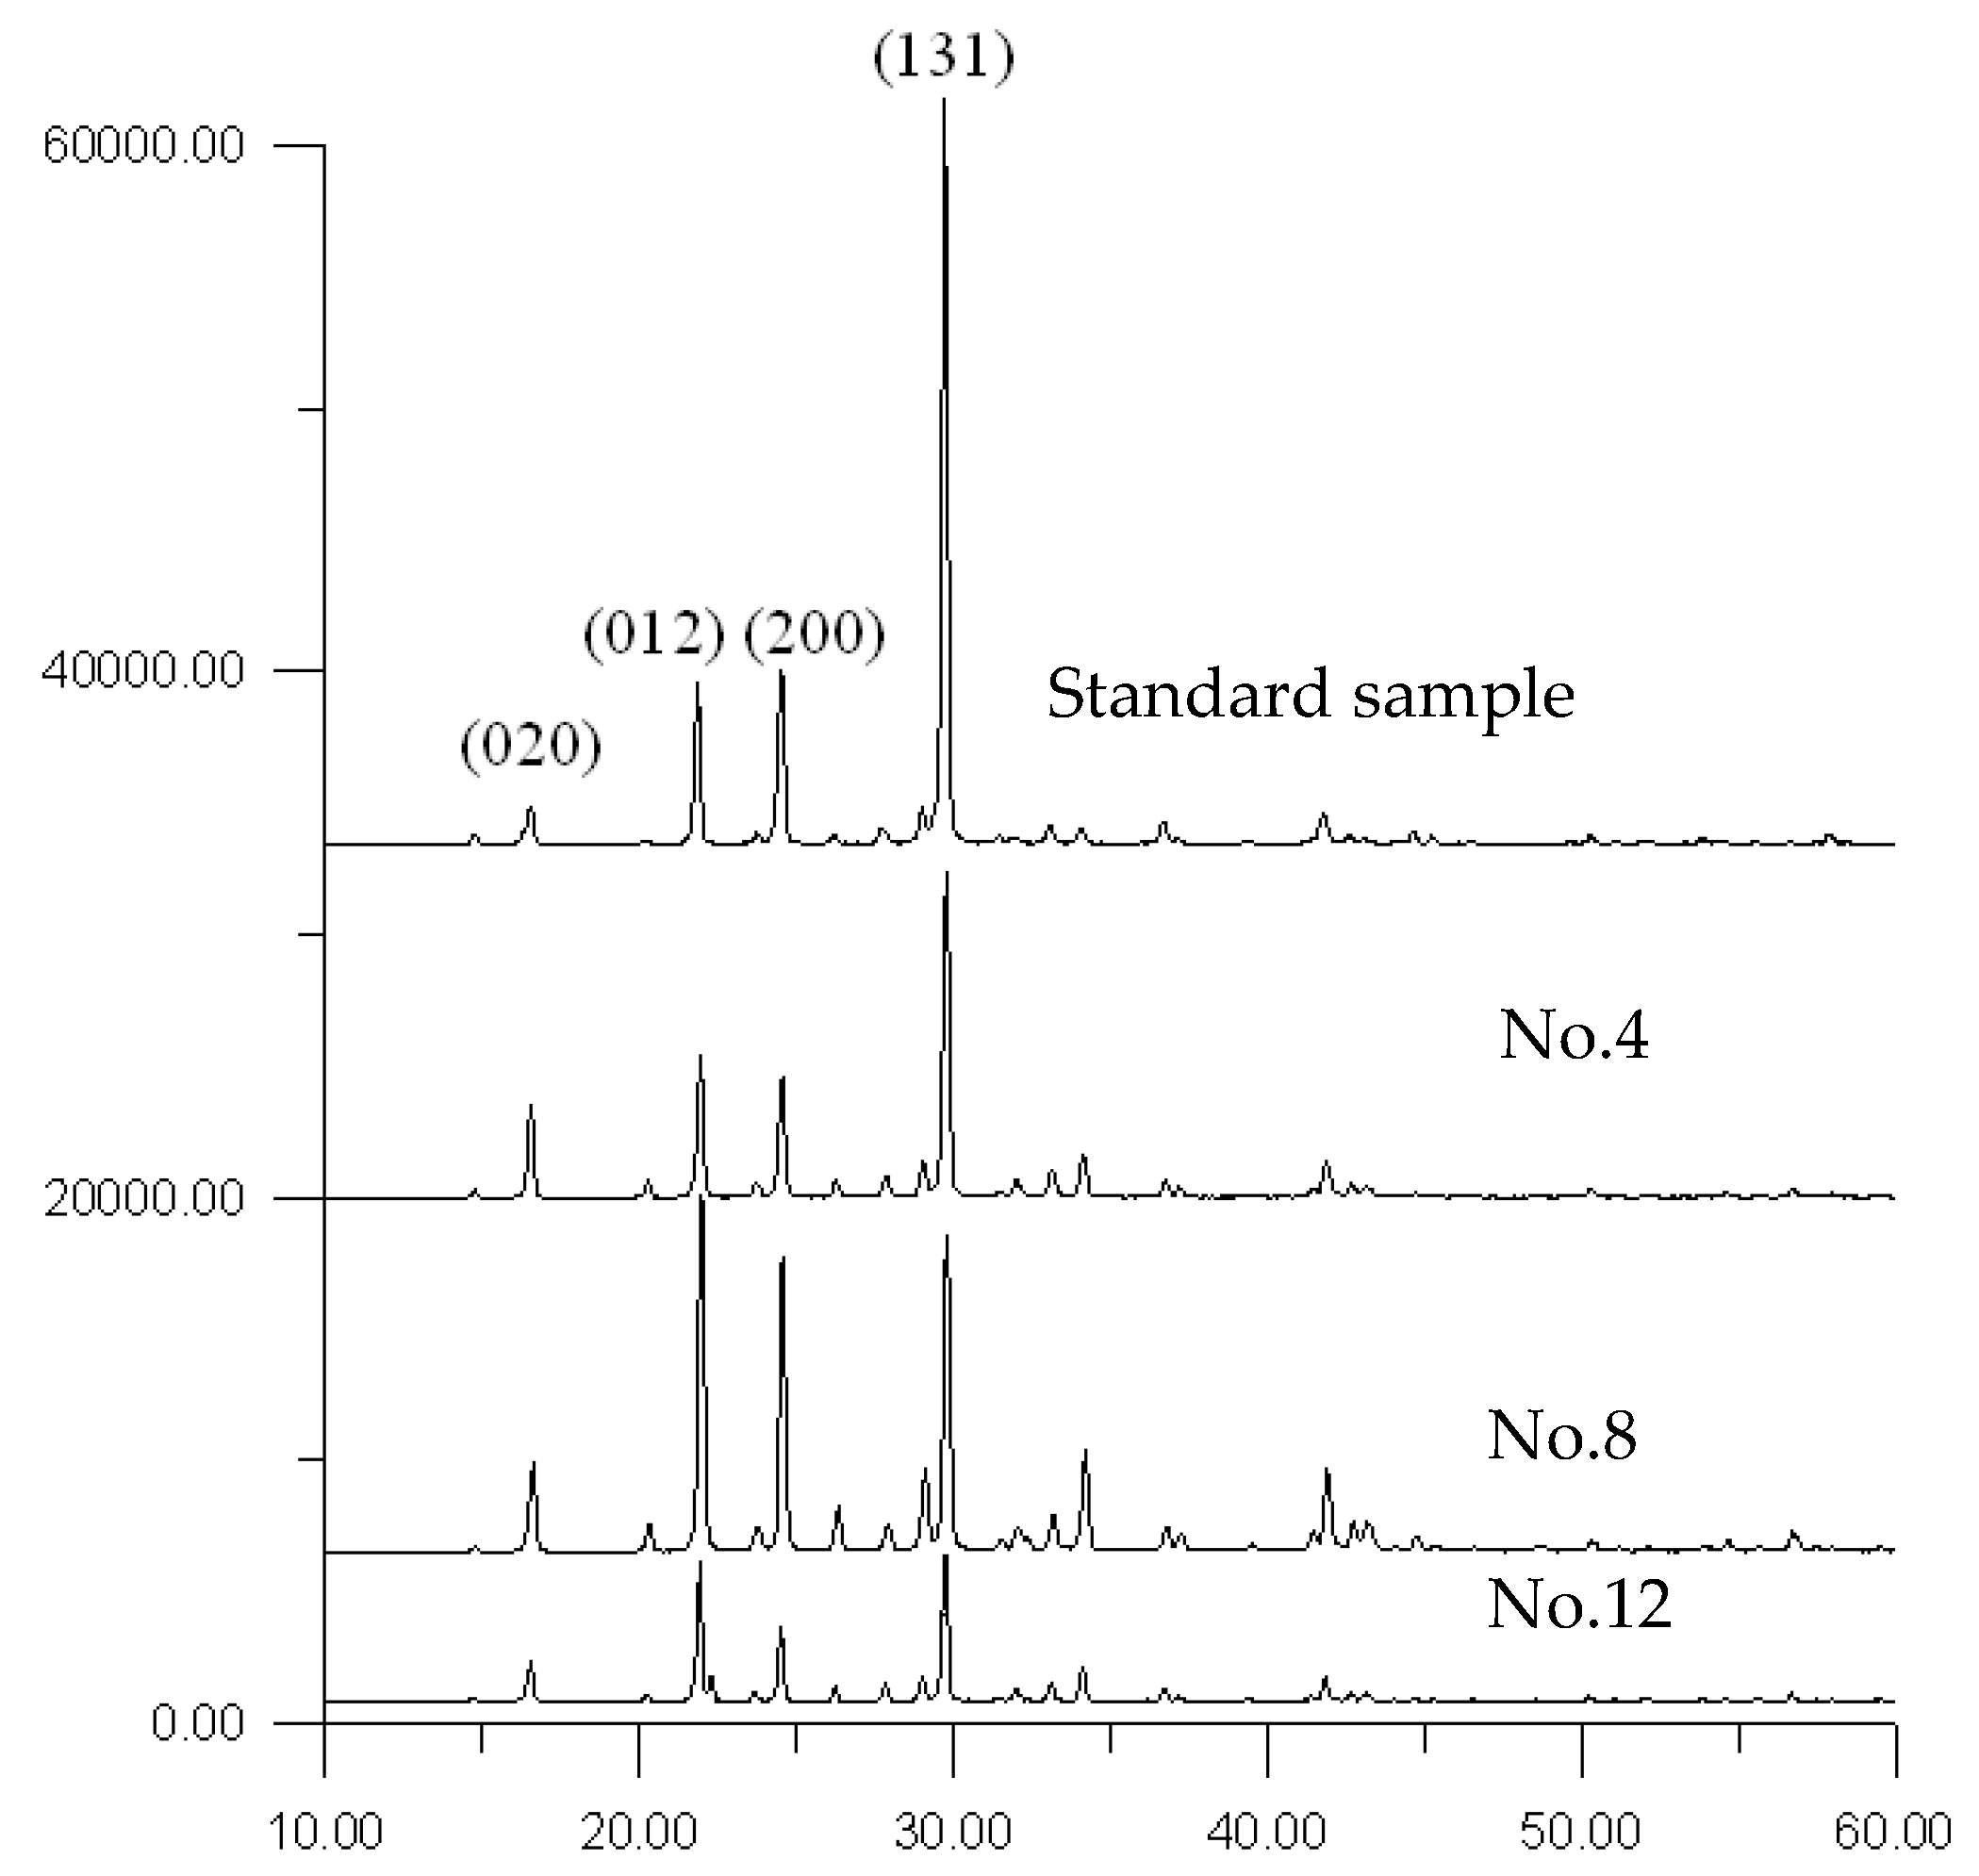
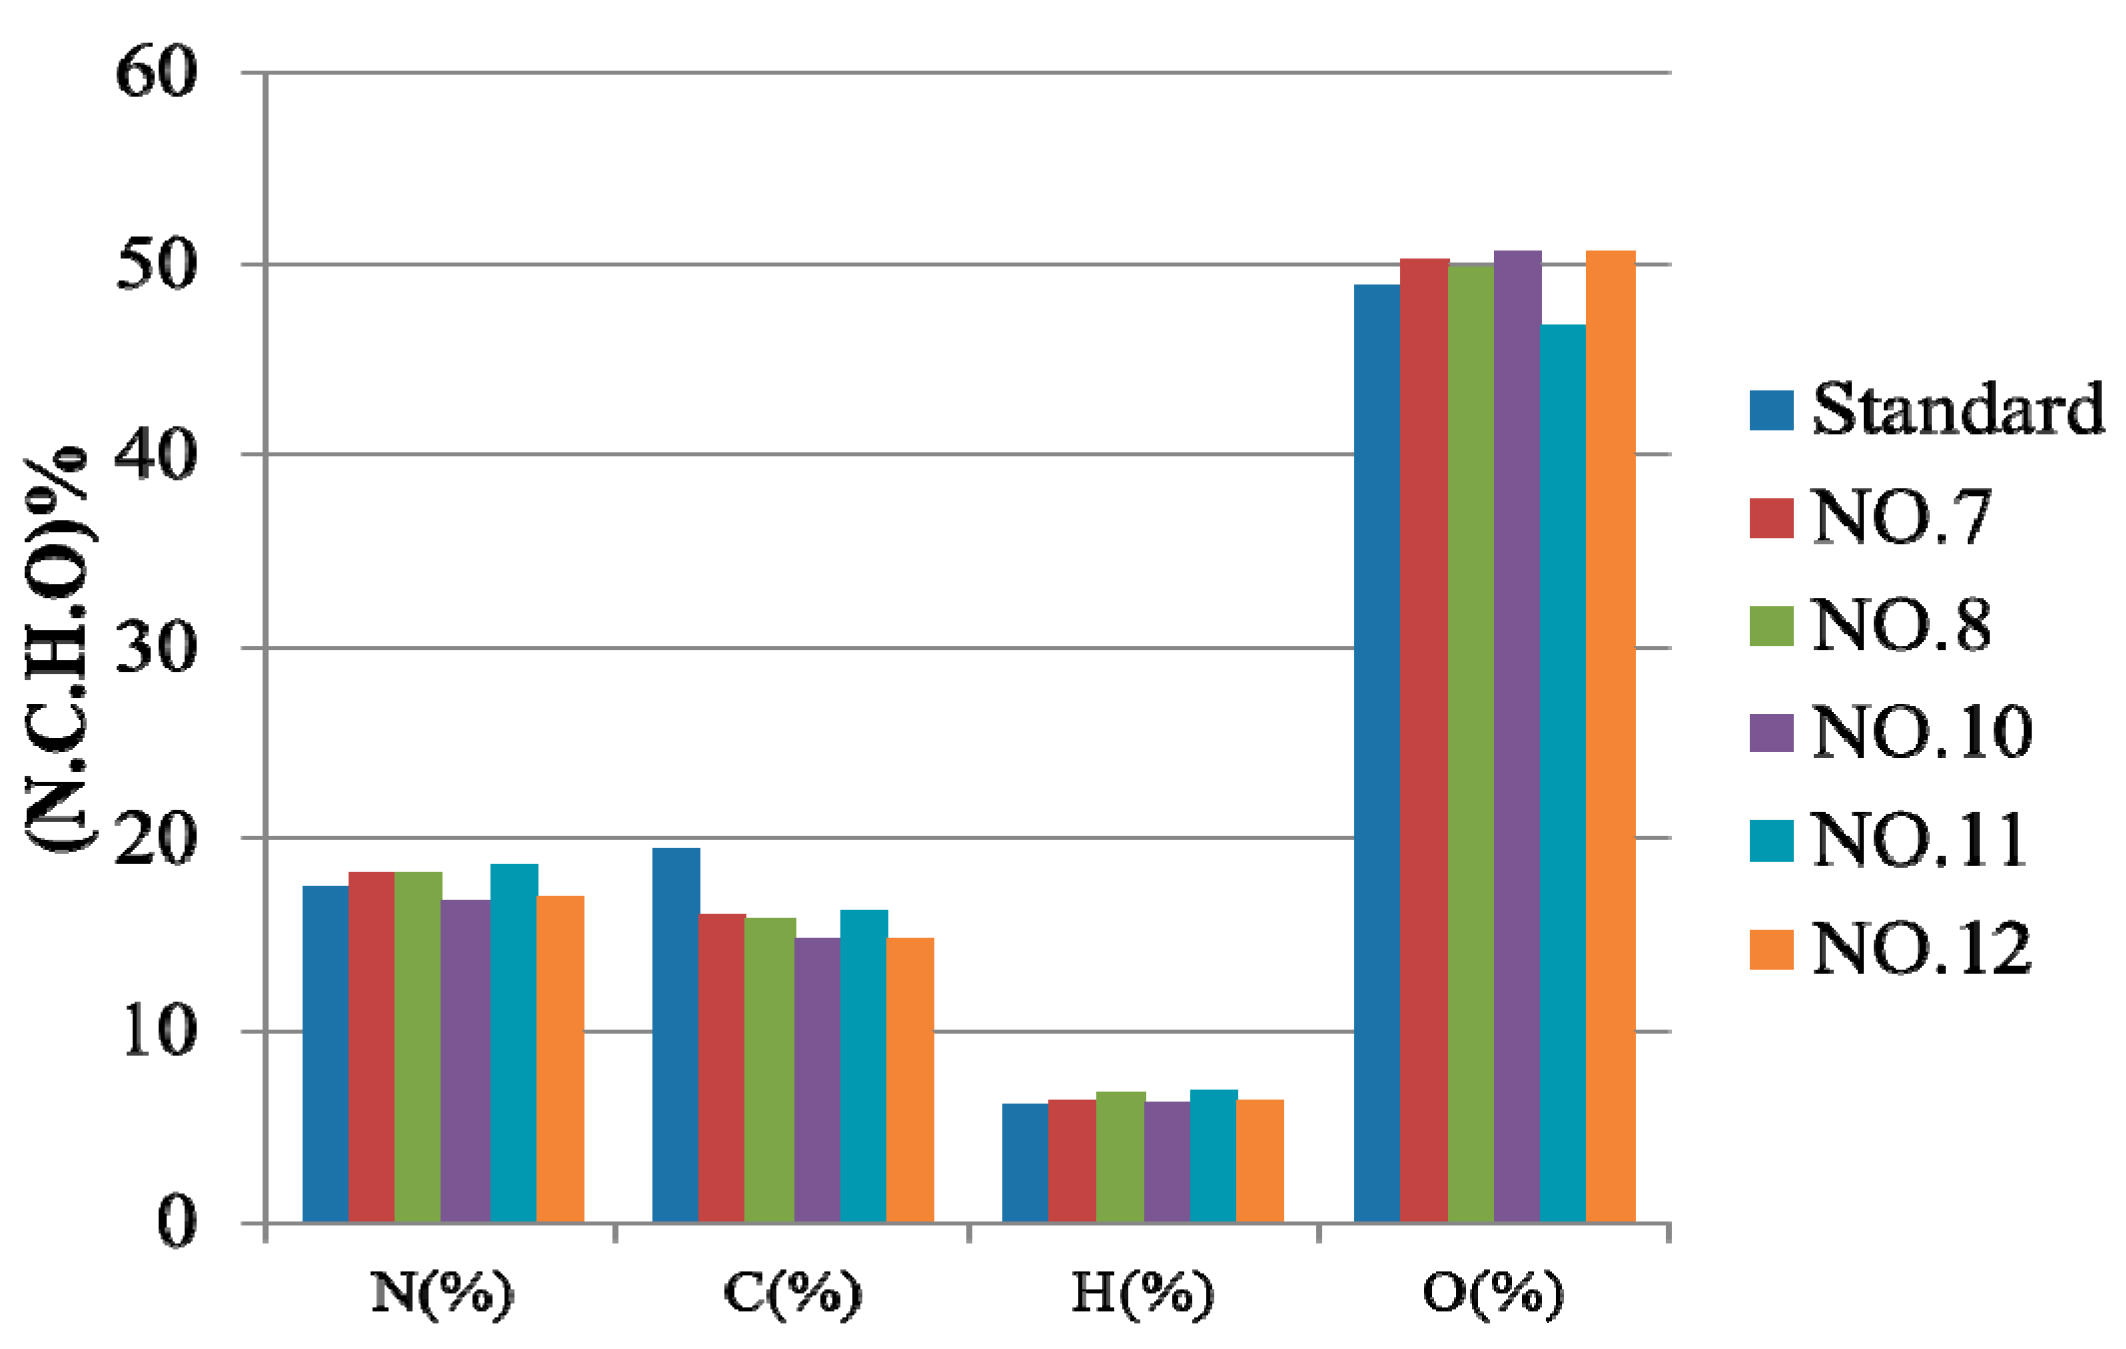
Figure 9 shows the XRD spectra for the three runs, as compared with the standard ABC crystals bought at the market. The major peaks for a standard sample are 29.7 (131), 16.6 (020), 21.9 (012) and 24.5 (200), which are the major peaks for ABC crystals, as reported by Meng [29]. However, the peaks of the three samples exhibit the same peaks as the standard sample, thus, confirming the formation of ABC crystals in this work. Alternatively, EA analyses according to N, H, O and C for ABC crystals are shown in Figure 10. Analysis finds that all elements are close to that of a standard sample, indicating that the precipitates obtained here are confirmed to be ABC crystals.
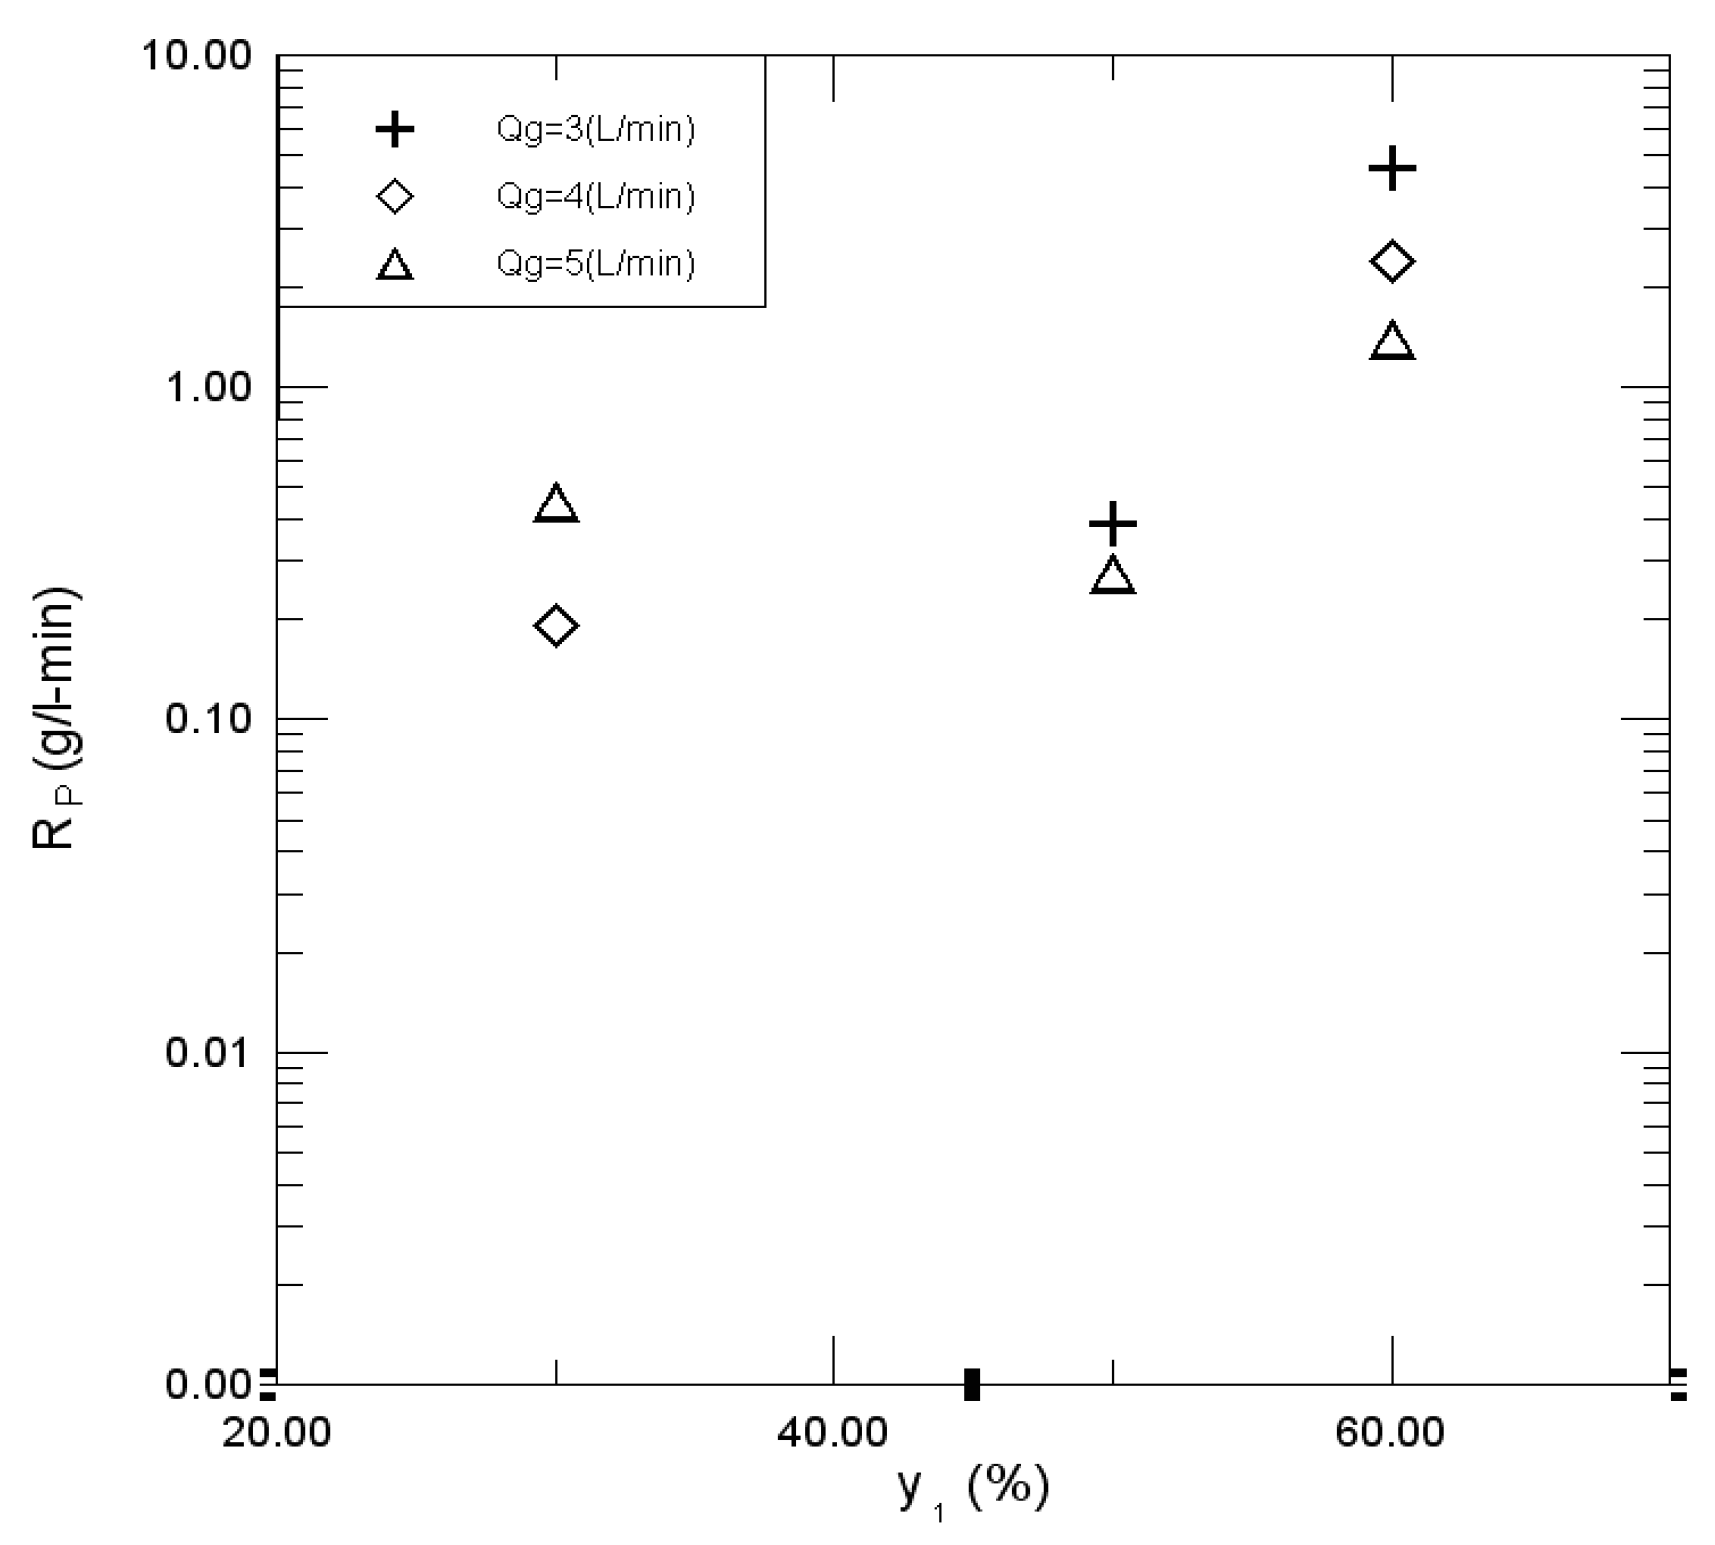
Finally, the precipitation rate for ABC crystals could be evaluated using Equations (15) and (16) when the slurry density (MT) and mean residence time (T) are obtained. Figure 11 shows that Rp is increased with an increase in y1 at various rates of Qg. The results show that, the gas concentration has significant effect on the Rp value as compared with Qg. Alternatively, analysis of γ finds that the precipitates of ABC can be obtained when γ is higher than 1.5; however, no precipitates are observed when γ is lower than 1.5, regardless of the pH level.
4.4. Strategy of CO2 Capture Using Aqueous Ammonia Solution
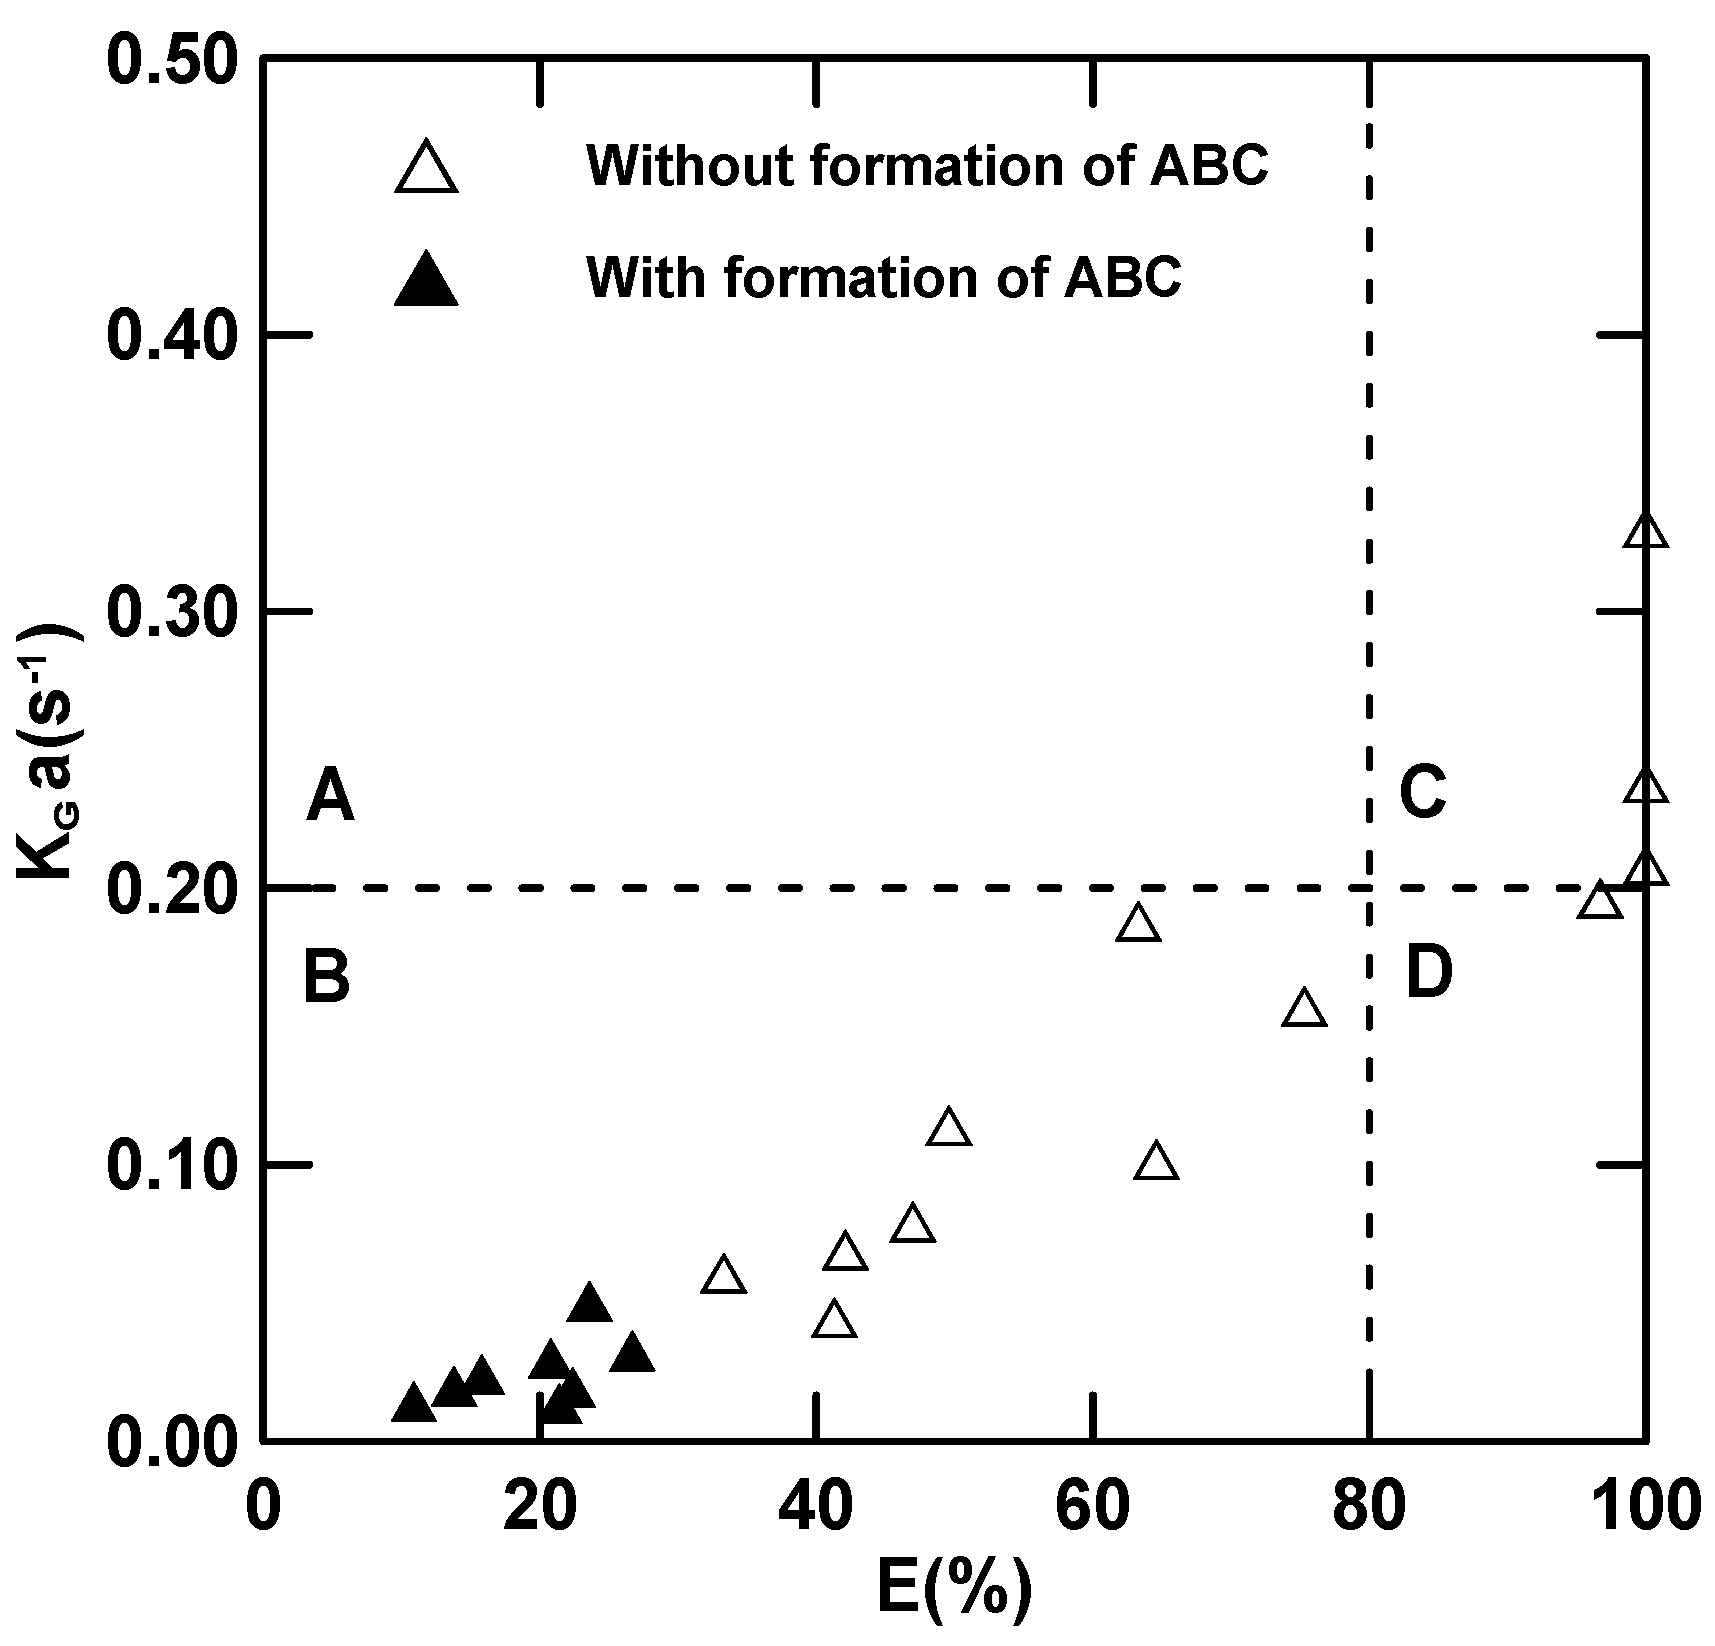
The KGa obtained here can be used to calculate the scrubber size [16]. Generally speaking, a larger KGa means that a smaller scrubber size is required, while a higher E shows an effective reduction in CO2 emissions. Thus, obtaining a larger KGa and E is the major focus in process design. Figure 12 shows that KGa increased with an increase in E, showing a linear relationship. In order to clarify, the target of KGa and E are set at 0.2 L/s and 80%, respectively. Therefore, the figure can be divided into four areas, i.e., A, B, C and D, in which C shows a higher KGa and E. On the contrary, B shows a lower KGa and E, especially in the case of the formation of ABC. Excluding the formation of ABC data, KGa/E can only be correlated with the pH of the solution and γ, as parameters T, the concentration and flow-rate are included in γ. The regression results are shown, as follows:
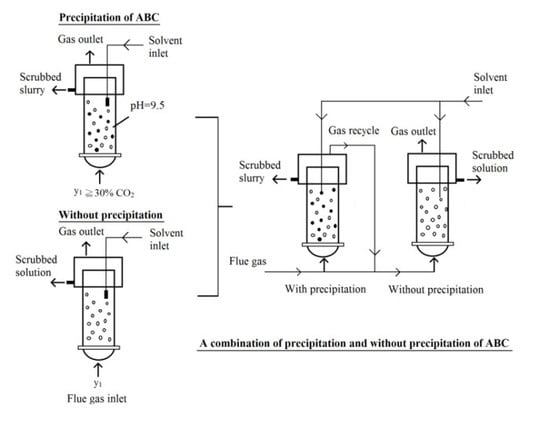
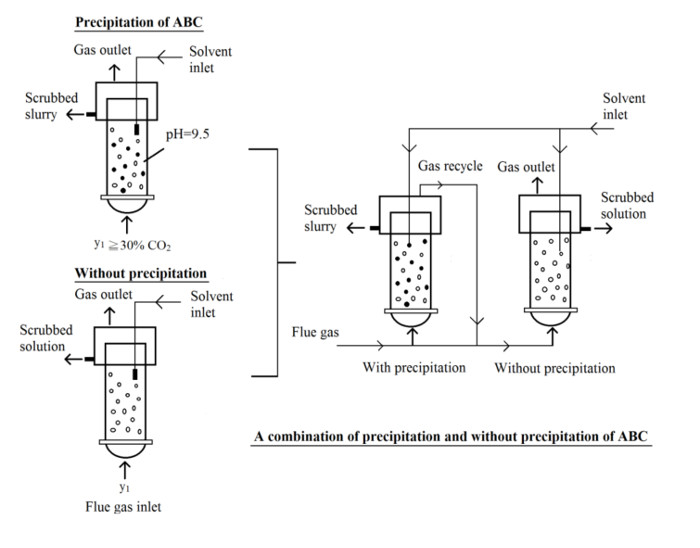
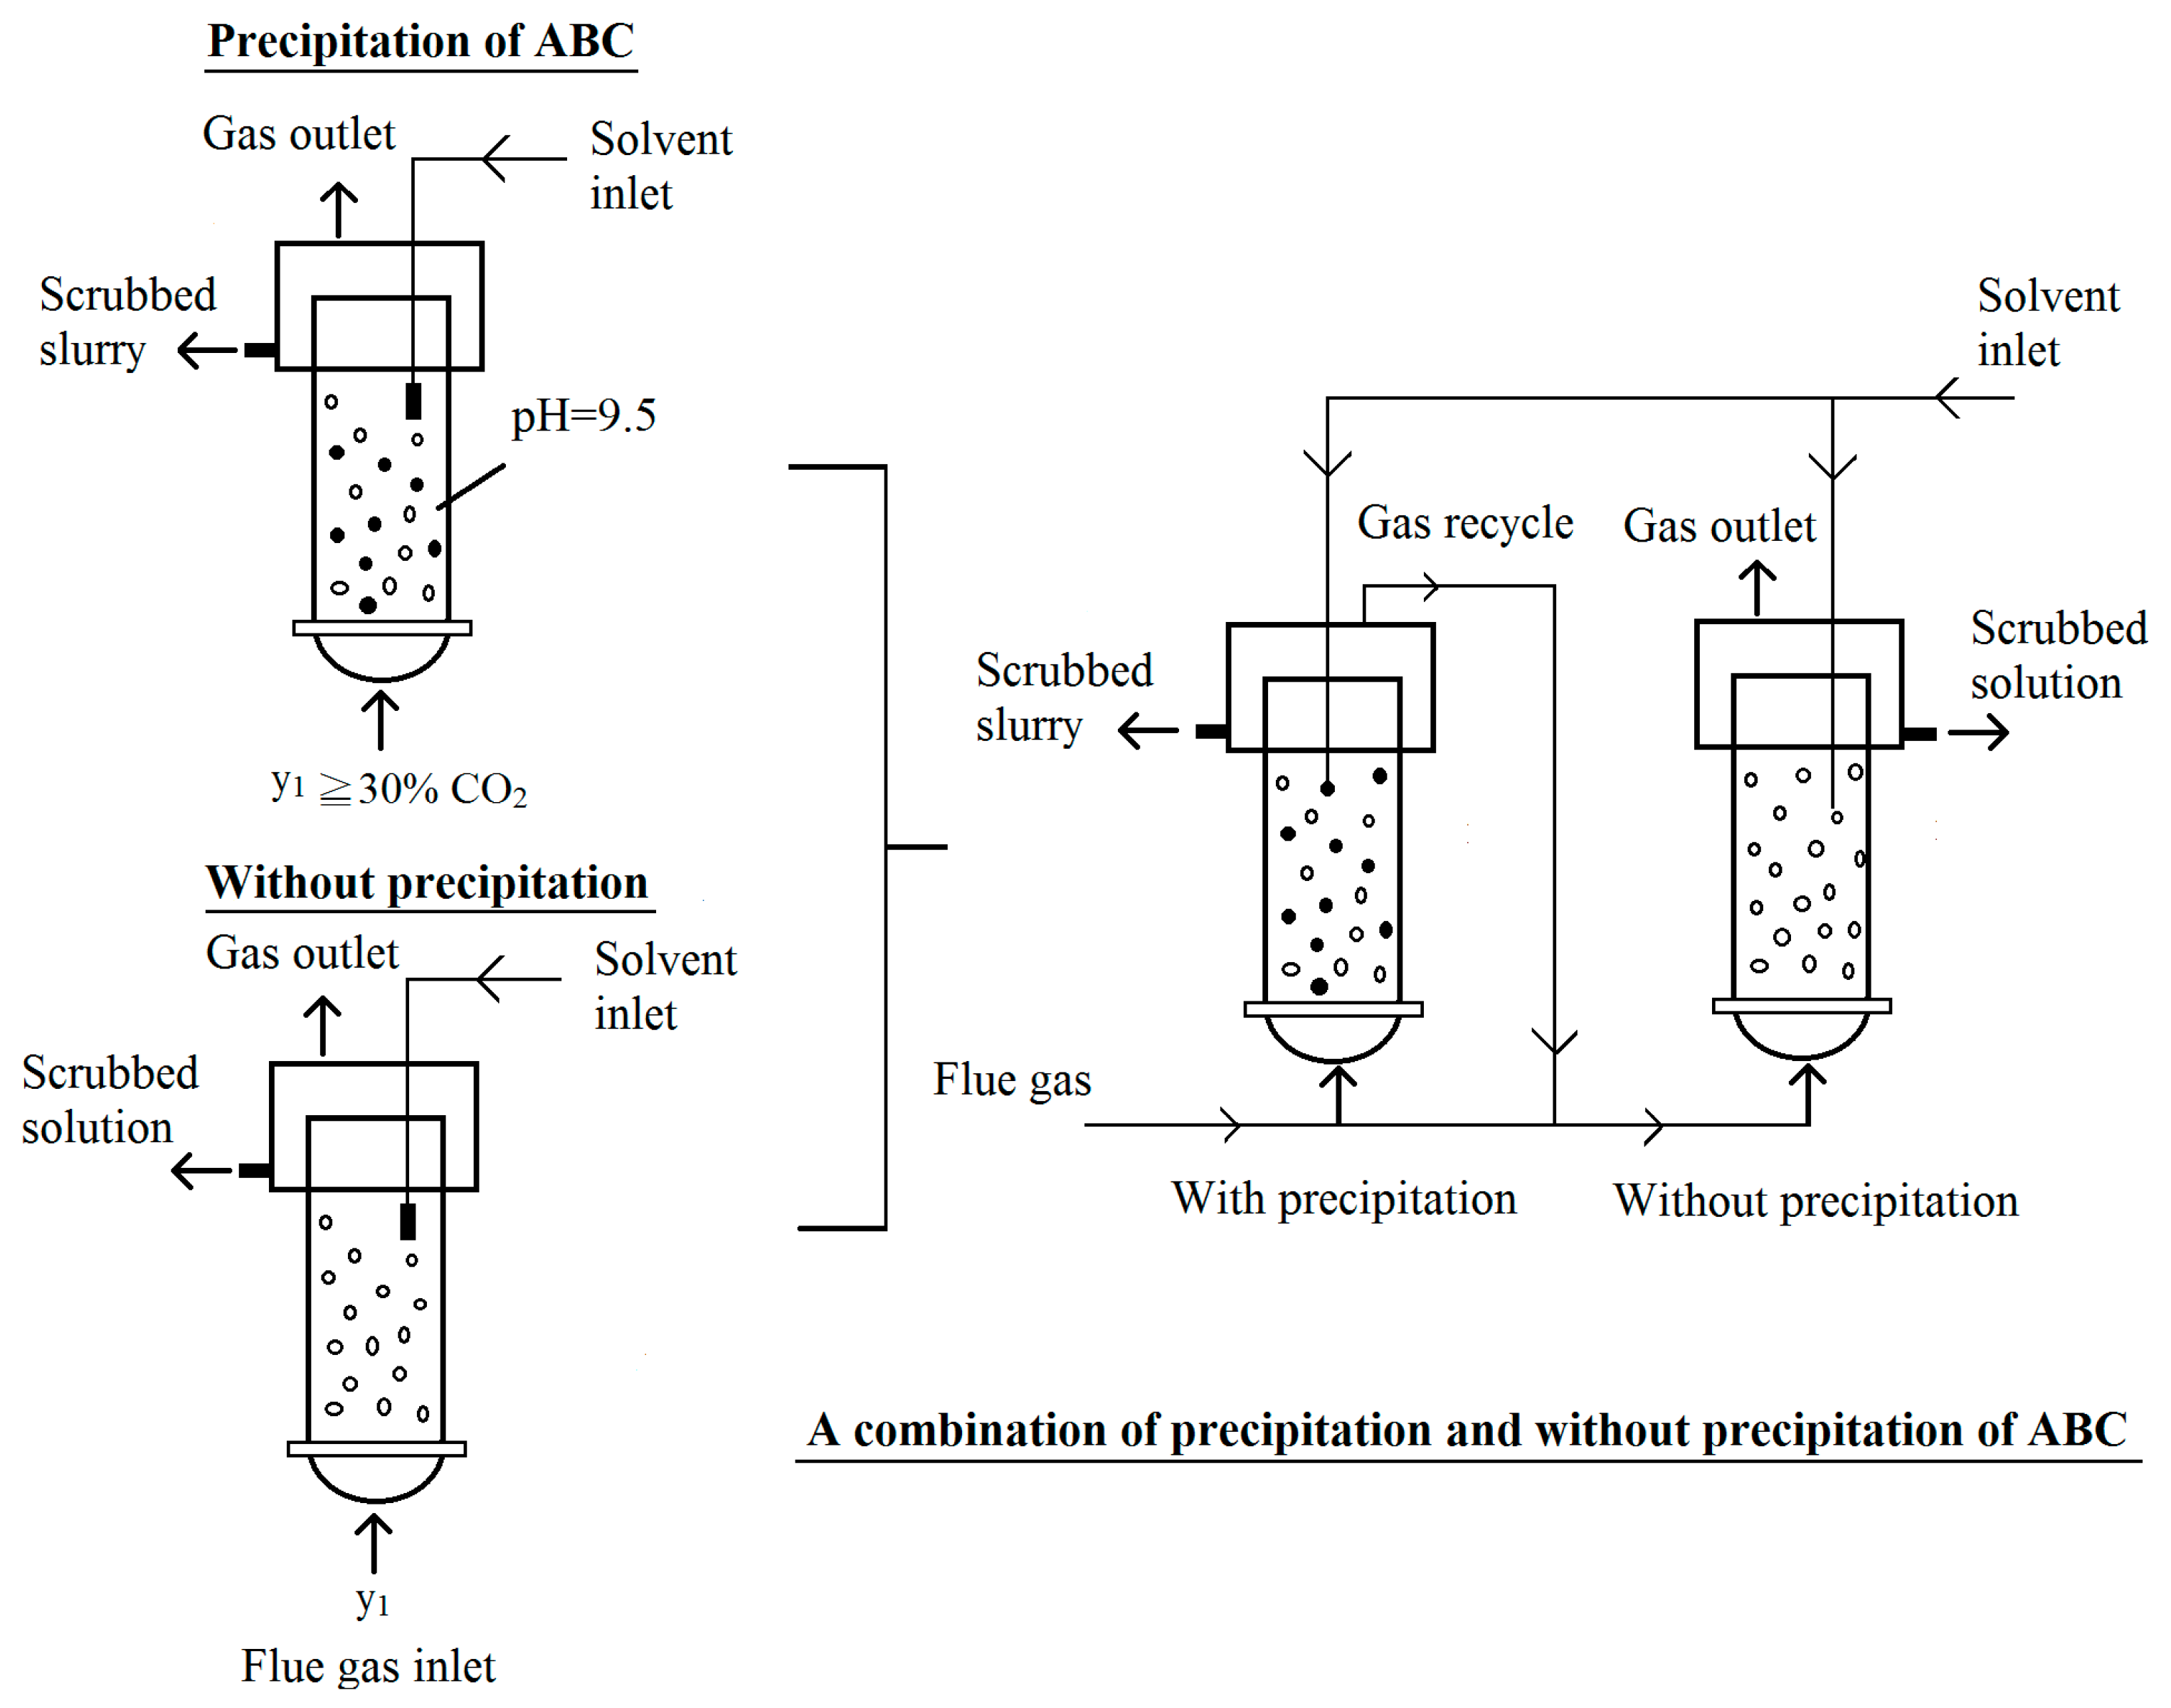
The regression error in Equation (17) is 12.68%. This equation can be used to predict KGa when E, pH and γ are given. In this way, the size of the scrubber can be estimated. In addition, in order to obtain the ABC at a higher E value, a two-scrubber in series is required. Figure 13 shows a possible process for CO2 capture using an aqueous ammonia solution in a bubble column.
5. Conclusions
A bubble-column scrubber was successfully used to explore the capture of CO2 and the precipitation of ABC crystals. ABC crystals can be generated at a pH level of 9.5 in the concentration range of 30–60% and γ ≥ 1.5. The removal efficiency can be controlled to a desired level when the pH of the solution and inlet gas temperature were effectively adjusted. The absorption rates and overall mass-transfer coefficient obtained were comparable with other solvents, resulting in positive development for the capture of CO2 using an aqueous ammonia solution. Data showed that KGa/E can be correlated with pH and γ to obtain an empirical equation for KGa/E. Finally, reducing the emission of CO2 from flue gas using an aqueous ammonia solution is found to be flexible both with and without precipitation depending on the requirement of CO2 capture technology.
Acknowledgments
The authors acknowledge the financial support of the MOST in Taiwan ROC (MOST-106-2221-E-262-015).
Author Contributions
Pao Chi Chen conceived and designed the experiments and wrote the paper, while Shun Chao Yu performed the experiments and analyzed the data.
Conflicts of Interest
The authors declare no conflict of interest.
References
- Han, K.; Ahn, C.K.; Lee, M.S. Performance of an ammonia-based CO2 capture pilot facility in iron and steel industry. Int. J. Greenh. Gas Control 2014, 27, 239–246. [Google Scholar] [CrossRef]
- Leung, D.Y.C.; Caramanna, C.; Maroto-Valer, M.M. An overview of current status of carbon dioxide capture and storage technologies. Renew. Sustain. Energy Rev. 2014, 39, 426–443. [Google Scholar] [CrossRef] [Green Version]
- Yeh, A.C.; Bai, H. Comparison of ammonia and monoethanolamine solvents to reduce CO2 greenhouse gas emissions. Sci. Total Environ. 1999, 228, 121–133. [Google Scholar] [CrossRef]
- Chen, P.C.; Lin, L.C. Capture of carbon dioxide using aqueous ammonia in a lab-scale stirred-tank scrubber. Adv. Mater. Res. 2014, 955–959, 1927–1934. [Google Scholar] [CrossRef]
- Chen, P.C.; Shi, W.; Du, R.; Chen, V. Scrubbing of CO2 greenhouse gases, accompanied by precipitation in a continuous bubble-column scrubber. Ind. Eng. Chem. Res. 2008, 47, 6336–6343. [Google Scholar] [CrossRef]
- Borhani, T.N.G.; Azarpour, A.; Akbari, V.; Wan Alwi, S.R.; Manan, Z.A. CO2 capture with potassium carbonate solutions: A state-of-the-art review. Int. J. Greenh. Gas Control 2015, 41, 142–162. [Google Scholar] [CrossRef]
- Bai, H.; Yeh, A.C. Removal of CO2 greenhouse gas by ammonia scrubbing. Ind. Eng. Chem. Res. 1997, 36, 2490–2493. [Google Scholar] [CrossRef]
- Dave, N.; Do, T.; Puxty, G.; Rowland, R.; Feron, P.H.M.; Attalla, M.I. CO2 capture by aqueous amines and aqueous ammonia—A Comparison. Energy Procedia 2009, 1, 949–954. [Google Scholar] [CrossRef]
- Diao, Y.F.; Zheng, X.Y.; He, B.S.; Chen, C.H.; Xu, X.C. Experimental study on capuring CO2 greenhouse gas by ammonia scrubbing. Energy Convers. Manag. 2004, 45, 2283–2296. [Google Scholar] [CrossRef]
- Huang, H.; Chang, S.G. Method to regenerate ammonia for the capture of carbon dioxide. Energy Fuels 2002, 16, 904–910. [Google Scholar] [CrossRef]
- Darde, V.; Thomsen, K.; van Well, W.J.M.; Stenby, E.H. Chilled ammonia process for CO2 capture. Energy Procedia 2009, 1, 1035–1042. [Google Scholar] [CrossRef]
- Resnik, K.P.; Yeh, J.T.; Pennline, H.W. Aqua ammonia process for simultaneous removal of CO2, SO2 and NOx. Int. J. Environ. Technonl. Manag. 2004, 4, 89–104. [Google Scholar] [CrossRef]
- Liu, J.; Wang, S.; Zhao, B.; Tong, H.; Chen, C. Absorption of carbon dioxide in aqueous ammonia. Energy Procedia 2009, 1, 933–940. [Google Scholar] [CrossRef]
- Yeh, J.T.; Resnik, K.P.; Rygle, K.; Pennline, H.W. Semi-batch absorption and regeneration studies for CO2 capture by aqueous ammonia. Fuel Process. Technol. 2005, 86, 1533–1546. [Google Scholar] [CrossRef]
- Chen, P.C.; Liu, S.M.; Jang, C.J.; Hwang, R.C.; Yang, Y.L.; Lee, J.S.; Jang, J.S. Interpretation of gas-liquid reactive crystallization data using a size-independent agglomeration model. J. Cryst. Growth 2003, 257, 333–343. [Google Scholar] [CrossRef]
- Morel, F.M.M. Principles of Aqueous Chemistry; John Wiley & Sons: New York, NY, USA, 1983; Chapter 4; pp. 127–177. ISBN 0-471-08683-5. [Google Scholar]
- Shen, J.F.; Yang, Y.M.; Ma, J.R. Promotion mechanism for CO2 absorption into partially carbonated ammonia solutions. J. Chem. Eng. Jpn. 1999, 32, 378–381. [Google Scholar] [CrossRef]
- Xiao, J.; Li, C.C.; Li, M.H. Kinetics of absorption of carbon dioxide into aqueous solutions of 2-amino-2-methyl-1-propanol + monoethanolamin. Chem. Eng. Sci. 2000, 55, 161–175. [Google Scholar] [CrossRef]
- Meng, L.; Burris, S.; Bui, H.; Pan, W.P. Development of an analytical method for distinguishing ammonia bicarbonate form the products of an aqueous ammonia CO2 scrubber. Anal. Chem. 2005, 77, 5947–5952. [Google Scholar] [CrossRef] [PubMed]
- Ma, S.; Zang, B.; Song, H.; Chen, G.; Yang, J. Research on mass transfer of CO2 absorption using ammonia solution in spray tower. Int. J. Heat Mass Transf. 2013, 67, 696–703. [Google Scholar] [CrossRef]
- Chen, P.C. Absorption of Carbon Dioxide in a Bubble Column Scrubber. Greenhouse Gases; Liu, G., Ed.; InTech: Rijeka, Croatia, 2012; Chapter 5; pp. 95–116. [Google Scholar]
- Petrov, P.; Ewert, G.; Rohm, H.J. Chemisorptive removal of carbon dioxide from process streams using a reactive bubble column with simultaneous production of usable materials. Chem. Eng. Technol. 2006, 29, 1084–1089. [Google Scholar] [CrossRef]
- Sánchez, O.; Michaud, S.; Escudié, R.; Delgenès, J.-P.; Bernet, N. Liquid mixing and gas–liquid mass transfer in a three-phase inverse turbulent bed reactor. Chem. Eng. J. 2005, 114, 1–7. [Google Scholar] [CrossRef]
- Zhao, B.; Su, Y.; Peng, Y.C. Effect of reactor geometry on aqueous ammonia-based carbon dioxide capture in bubble column reactors. Int. J. Greenh. Gas Control 2013, 17, 481–487. [Google Scholar] [CrossRef]
- Mathias, P.M.; Reddy, S.; Connell, J.P.O. Quantitative evaluation of the aqueous-ammonia process for CO2 capture using fundamental data and thermodynamic analysis. Energy Procedia 2009, 1, 1227–1234. [Google Scholar] [CrossRef]
- Puxty, G.; Rowland, R.; Attalla, M. Comparison of the rate of CO2 absorption into ammonia and manoethanolamine. Chem. Eng. Sci. 2010, 65, 915–922. [Google Scholar] [CrossRef]
- Lee, K.H.; Lee, B.; Lee, J.H.; You, J.K.; Park, K.T.; Baek, I.H.; Hur, N.H. Aqueous hydrazine as a promising candidate for capyuring carbon dioxide. Int. J. Greenh. Gas Control 2014, 29, 256–262. [Google Scholar] [CrossRef]
- Chen, P.C.; Luo, Y.X.; Cai, P.W. CO2 Capture using monoethanolamine in a bubble-column scrubber. Chem. Eng. Technol. 2015, 38, 274–282. [Google Scholar] [CrossRef]
- Meng, L. Development of an Analytical Method for Distinguishing Ammonium Bicarbonate from the Products of an Aqueous Ammonia CO2 Scrubber and the Characterization of Ammonium Bicarbonate. Master’s Thesis, Western Kentucky University, Bowling Green, KY, USA, December 2004. [Google Scholar]

Figure 2.
Dissociation of ammonium hydroxide varies with pH, re-plotted in here [16].
Figure 2.
Dissociation of ammonium hydroxide varies with pH, re-plotted in here [16].

Figure 3.
A two-film model showing the absorption of CO2 in an aqueous ammonia solution.

Figure 4.
Capture of CO2 using a lab-scale bubble-column scrubber. 1. CO2 gas tank; 2. N2 gas tank; 3. Gas-flow meter; 4. Gas-flow meter; 5. Bubble-column scrubber; 6. pH control; 7. Digital Pressure Gauge; 8. Tubing pump; 9. Solvent; 10. CO2 meter; 11. Cooling machine; 12. Reservoir; Digital thermometer.

Figure 5.
Effects of process parameters on the removal efficiency of CO2: (a) effect of y1 on E at pH = 9.5; (b) effect of pH on E at T = 25 °C; (c) effect of T on E at pH = 10.0.
Figure 5.
Effects of process parameters on the removal efficiency of CO2: (a) effect of y1 on E at pH = 9.5; (b) effect of pH on E at T = 25 °C; (c) effect of T on E at pH = 10.0.

Figure 6.
Effects of process variables on the absorption rate: (a) effect of y1 on RA at pH = 9.5; (b) effect of pH on RA at T = 25 °C; (c) effect of T on RA at pH = 10.0.
Figure 6.
Effects of process variables on the absorption rate: (a) effect of y1 on RA at pH = 9.5; (b) effect of pH on RA at T = 25 °C; (c) effect of T on RA at pH = 10.0.

Figure 7.
Effects of process variables on KGa showing the significant parameters: (a) effect of y1 on KGa at pH = 9.5; (b) effect of pH on KGa at T = 25 °C; (c) effect of T on KGa at pH = 10.0.
Figure 7.
Effects of process variables on KGa showing the significant parameters: (a) effect of y1 on KGa at pH = 9.5; (b) effect of pH on KGa at T = 25 °C; (c) effect of T on KGa at pH = 10.0.

Figure 8.
A plot of wt % vs. L showing the crystal size distribution of ABC (No. 12).

Figure 9.
XRD spectra for ABC crystals.

Figure 10.
EA analysis for ABC crystals compared with a standard sample.

Figure 11.
A plot of Rp vs. y1 at various values of Qg showing the influence of y1 and Qg.

Figure 12.
A plot of KGa vs. E showing the performance of the scrubbing process.

Figure 13.
A combination of the crystallization and non-crystallization of ABC in CO2 capture process using an aqueous ammonia solution.
Figure 13.
A combination of the crystallization and non-crystallization of ABC in CO2 capture process using an aqueous ammonia solution.


Table 1.
Solution chemistry for NH3-CO2-H2O system [25].
Table 1.
Solution chemistry for NH3-CO2-H2O system [25].
| (5) | |
| (6) | |
| (7) | |
| (8) | |
| (9) | |
| (10) |
Table 2.
Absorption rate and overall mass-transfer coefficient used in this work.
| (11) | |
| (12) | |
| (13) | |
| (14) | |
| (15) | |
| (16) |
Table 3.
Operating conditions and physical properties of ABC crystals.
| Operating Condition | |
| Gas-flow rate (L/min) | 3–5 |
| Concentration of CO2 | 15–60% |
| pH | 9.5 |
| Operating time (h) | 5–7 |
| Gas inlet temperature (°C) | 55 |
| Working temperature in the scrubber (°C) | 25–60 |
| Physical Property of ABC | |
| Density (kg/m3) | 1.58 |
| Molecular weight | 79.06 |
| Solubility (g/L-H2O) (20 (°C)) | 220 |
| Decomposition temperature (°C) | 35–60 |
Table 4.
Operating conditions and experimental data obtained in this work.
| No. | pH | Qg (L/min) | y1 (%) | y2 (%) | T (°C) | QL (mL/min) | γ (-) | RA × 104 (mol/(s·L)) | KGa (1/s) | E (%) |
|---|---|---|---|---|---|---|---|---|---|---|
| 1 | 9.5 | 3 | 15 | 7.95 | 25 | 3.66 | 0.58 | 3.9178 | 0.0794 | 47.0 |
| 2 | 9.5 | 3 | 30 | 17.7 | 25 | 3.30 | 1.33 | 5.1831 | 0.0447 | 41.3 |
| 3 | 9.5 | 3 | 50 | 38.8 | 25 | 4.90 | 1.50 | 5.7170 | 0.0194 | 22.4 |
| 4 | 9.5 | 3 | 60 | 53.5 | 25 | 4.96 | 1.75 | 7.1506 | 0.0143 | 10.9 |
| 5 | 9.5 | 4 | 15 | 8.7 | 25 | 2.22 | 1.33 | 3.5858 | 0.0692 | 42.1 |
| 6 | 9.5 | 4 | 30 | 22 | 25 | 3.51 | 1.71 | 5.0876 | 0.0327 | 26.7 |
| 7 | 9.5 | 4 | 50 | 39.3 | 25 | 4.73 | 2.05 | 7.0207 | 0.0136 | 21.4 |
| 8 | 9.5 | 4 | 60 | 51.7 | 25 | 6.63 | 1.77 | 9.3765 | 0.0199 | 13.8 |
| 9 | 9.5 | 5 | 15 | 7.56 | 25 | 3.30 | 1.11 | 5.4895 | 0.1142 | 49.6 |
| 10 | 9.5 | 5 | 30 | 22.9 | 25 | 0.60 | 12.24 | 7.0572 | 0.0506 | 23.6 |
| 11 | 9.5 | 5 | 50 | 39.6 | 25 | 7.28 | 1.69 | 9.0338 | 0.0299 | 20.8 |
| 12 | 9.5 | 5 | 60 | 50.6 | 25 | 7.10 | 2.07 | 10.999 | 0.0241 | 15.8 |
| 13 | 10.0 | 3 | 15 | 10.0 | 25 | 2.96 | 0.75 | 3.2122 | 0.0608 | 33.3 |
| 14 | 10.5 | 3 | 15 | 5.3 | 25 | 8.89 | 0.24 | 4.1095 | 0.1020 | 64.6 |
| 15 | 11.0 | 3 | 15 | 3.7 | 25 | 9.73 | 0.22 | 4.8295 | 0.1573 | 75.3 |
| 16 | 11.5 | 3 | 15 | 0 | 25 | 37.63 | 0.058 | 6.3943 | 0.2083 | 100 |
| 17 | 10.0 | 4 | 15 | 5.5 | 25 | 7.08 | 0.41 | 7.4126 | 0.1808 | 63.3 |
| 18 | 10.0 | 4 | 15 | 0 | 40 | 4.14 | 0.67 | 5.9145 | 0.1963 | 96.7 |
| 19 | 10.0 | 4 | 15 | 0 | 50 | 8.71 | 0.31 | 6.7421 | 0.2381 | 100 |
| 20 | 10.0 | 4 | 15 | 0 | 60 | 46.13 | 0.053 | 9.0425 | 0.3302 | 100 |
© 2018 by the authors. Licensee MDPI, Basel, Switzerland. This article is an open access article distributed under the terms and conditions of the Creative Commons Attribution (CC BY) license (http://creativecommons.org/licenses/by/4.0/).
Share and Cite
MDPI and ACS Style
Chen, P.C.; Yu, S.C. CO2 Capture and Crystallization of Ammonia Bicarbonate in a Lab-Scale Scrubber. Crystals 2018, 8, 39. https://doi.org/10.3390/cryst8010039
AMA Style
Chen PC, Yu SC. CO2 Capture and Crystallization of Ammonia Bicarbonate in a Lab-Scale Scrubber. Crystals. 2018; 8(1):39. https://doi.org/10.3390/cryst8010039
Chicago/Turabian StyleChen, Pao Chi, and Shun Chao Yu. 2018. "CO2 Capture and Crystallization of Ammonia Bicarbonate in a Lab-Scale Scrubber" Crystals 8, no. 1: 39. https://doi.org/10.3390/cryst8010039
Note that from the first issue of 2016, this journal uses article numbers instead of page numbers. See further details here.