3.1. Effects of Irradiation on the Lattice Effects at the Mott Transition in -Cl
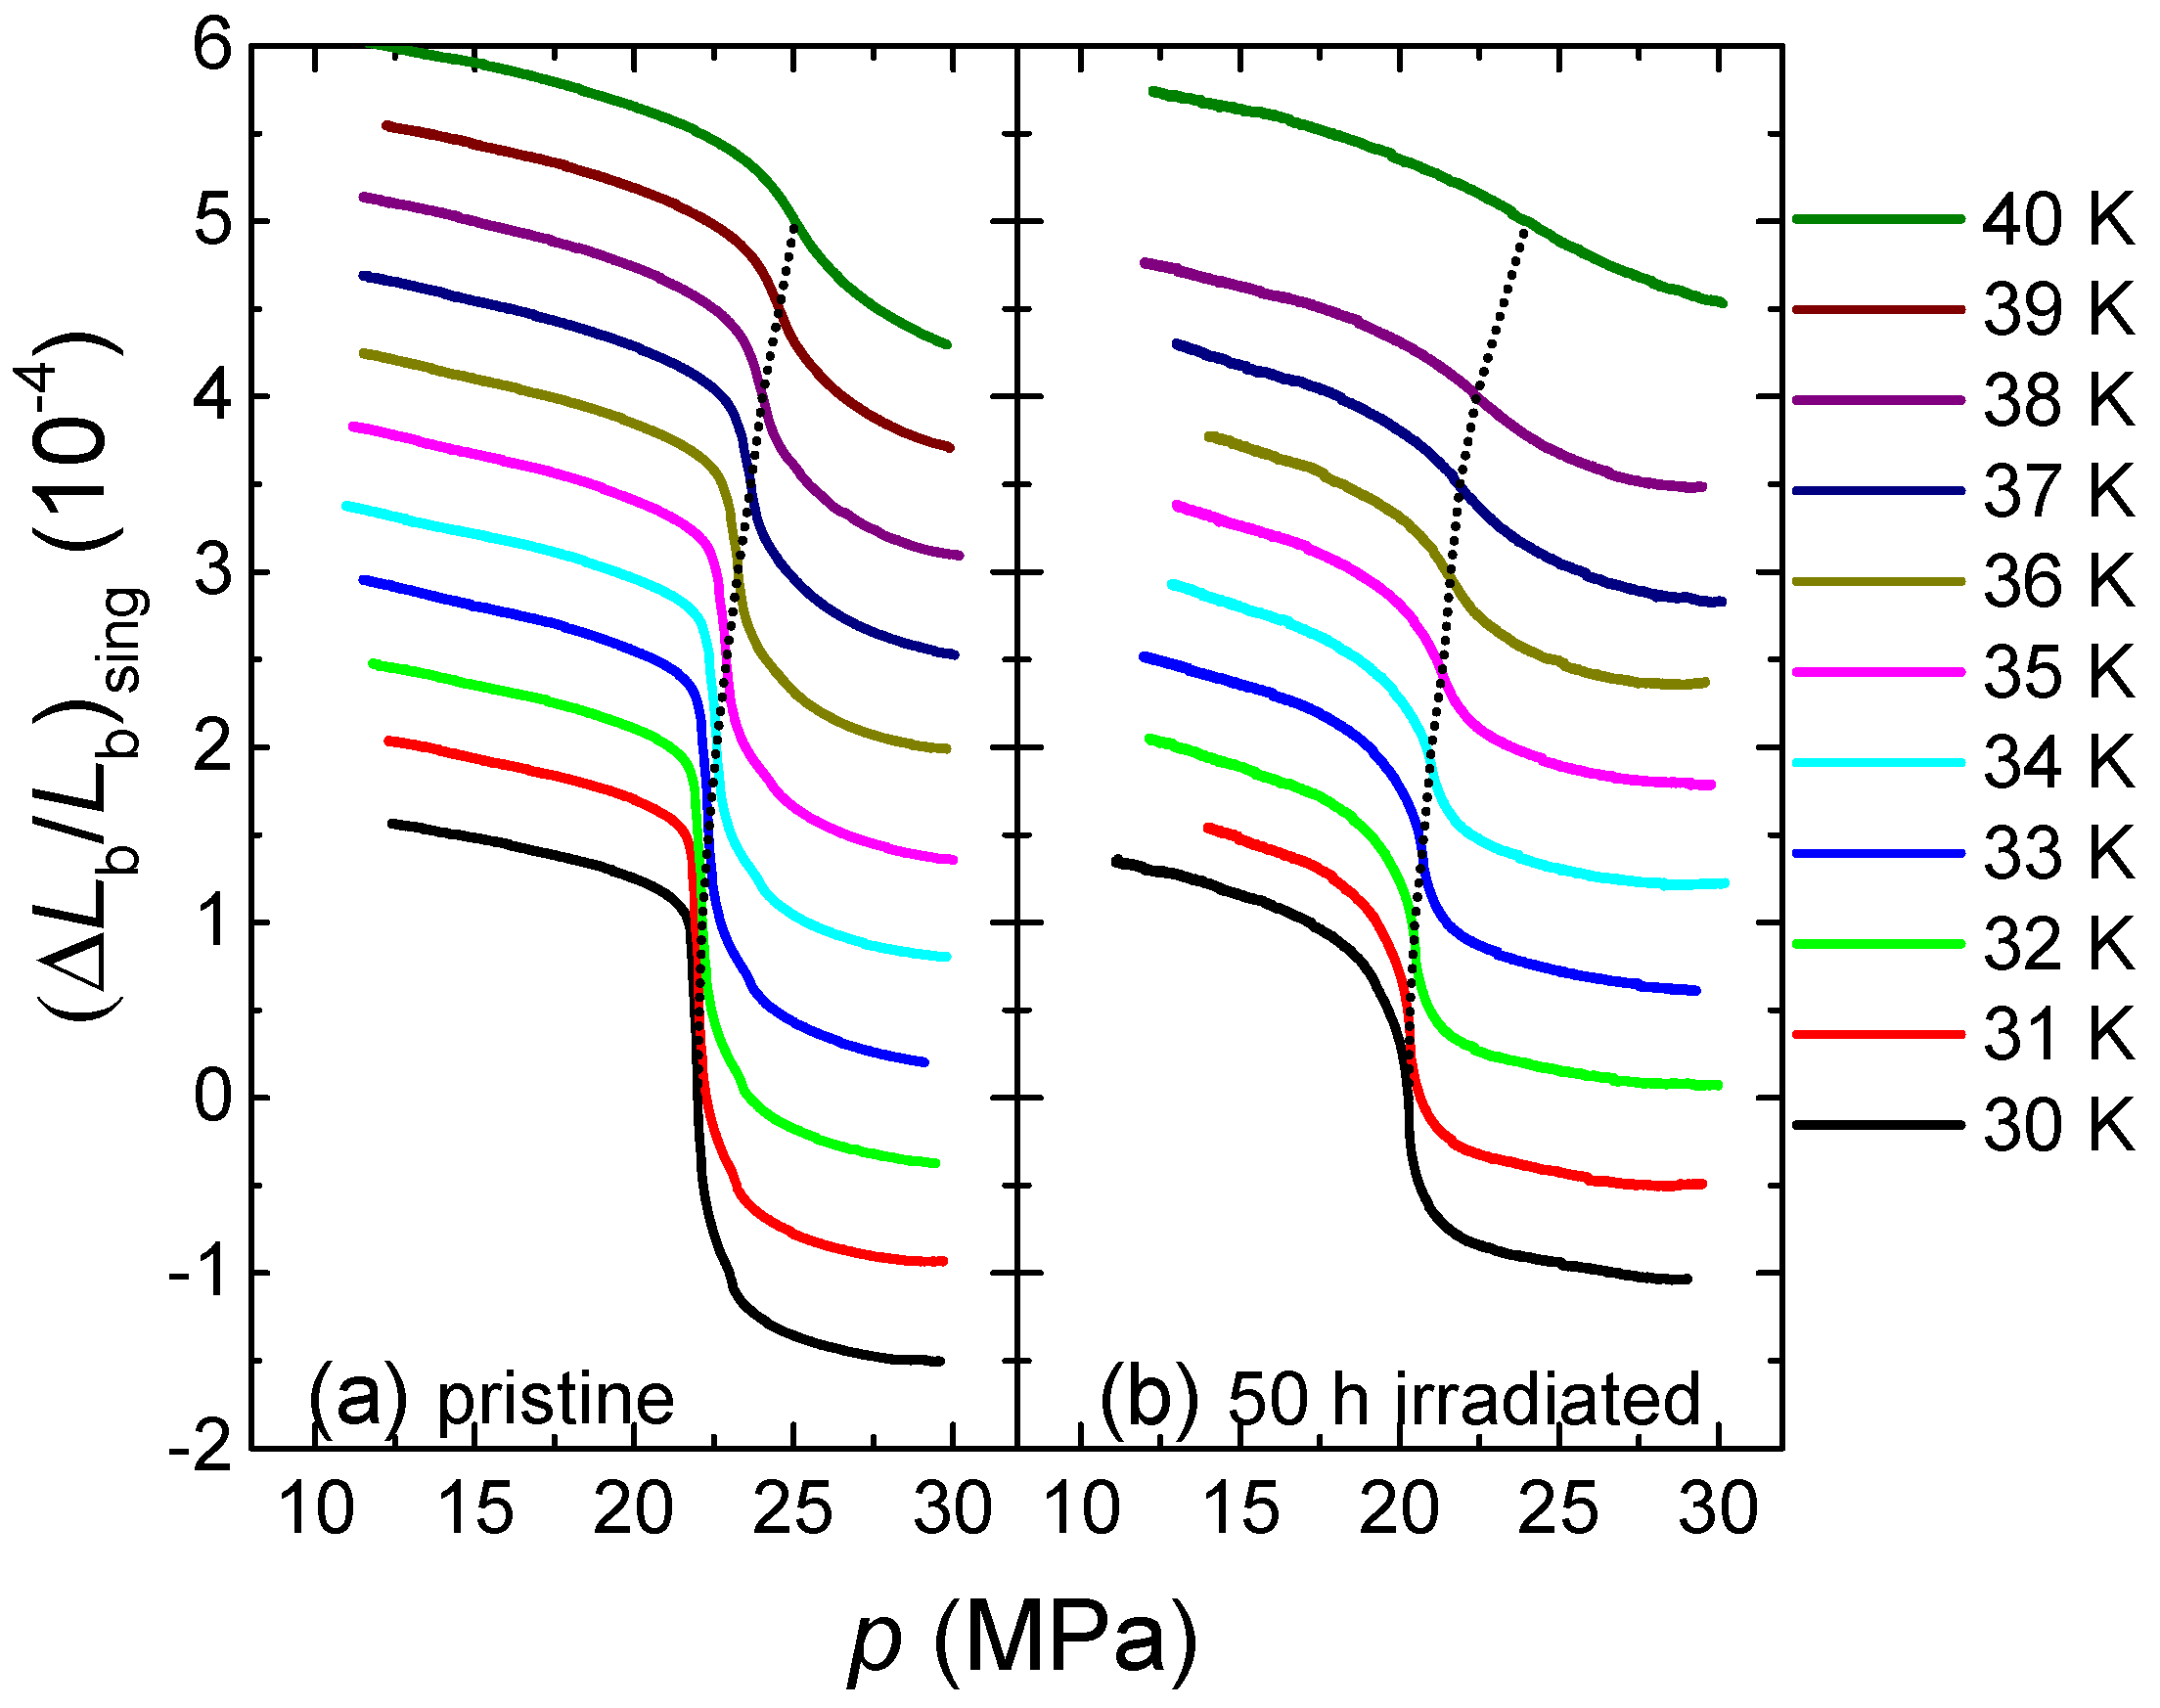
Figure 1 shows data of the relative length change
, measured along the
b axis, as a function of pressure
p in the temperature range 30 K
40 K for
-Cl in its pristine form [
25] (a) and after exposure to 50 h X-ray irradiation (b) (see
Section 2 for a description of the methods used, including details of the irradiation procedure). The displayed data represent only the singular contribution to the relative length change which was obtained by subtraction of an in-
p linear background contribution from the
data. We start by recalling some basic notations from the study of the pristine sample in Ref. [
25]. At the lowest temperature
K, a slightly broadened jump of the sample length as a function of pressure was observed at
MPa at which the length decreases on going from the low-pressure insulating side to the high-pressure metallic side of the transition. The observation of a discontinuity in
is consistent with the fact that a first-order transition line is passed as a function of
p. Upon increasing the temperature
T, the discontinuity decreases in size and evolves into a continuous crossover behavior for
K. This data set discloses a strong coupling of the electronic degrees of freedom to the lattice close to the Mott transition. It manifests itself in strong non-linear variations of
—a
breakdown of Hooke’s law—which can be observed in a wide range of
critical elasticity of
% above the critical endpoint. It was demonstrated in Ref. [
25] that these lattice effects can be modeled by mean-field criticality. The important implication of this finding was that, although the Mott transition is driven by strong electron correlations, the coupling of the electrons to the lattice degrees of freedom eventually alters the Mott critical behavior to that of an isostructural solid-solid endpoint with mean-field criticality [
26,
27].
A lattice response of similar strength around the Mott transition can also be inferred from the
data set in
Figure 1b taken on a crystal which was exposed to X-ray for 50 h. At the lowest temperature of
K, we find a strong decrease of the length upon going from the low-pressure insulating side to the high-pressure metallic side at
20.2 MPa. Note that this
value is smaller by ≈1.8 MPa than the corresponding value for the pristine sample at 30 K. This shift of the transition to lower pressure upon increasing the degree of disorder is one of the central results of the present work and will be discussed below in more detail. Concerning the character of the transition for the irradiated crystal, we observe an even more broadened jump-like feature as compared to the pristine crystal where a small broadening is visible. Yet, the data of the irradiated crystal still reveal a discontinuous change of the lattice parameter, i.e., a first-order phase transition (see below for a detailed discussion of the determination of
and
). In the pristine sample, the finite width of the transition is likely associated with a small amount of disorder that leads to a spatial variation of internal stress induced by impurities and/or other crystal defects. In order to account quantitatively for this broadening effect, we assumed in Ref. [
25] a multi-domain state, caused by extrinsic defects, where each domain contributes independently to the mean strain. Experimentally, the broadening manifests itself in a peak of finite width in the compressibility
, i.e., in the derivative of the present data sets with respect to
p. In order to quantify the increase in broadening upon irradiation, we determine the width
of the peak in
at
K by its full width at half maximum. This procedure yields
MPa for the irradiated sample and
MPa for the pristine sample. This implies that the distribution of internal stress in the 50 h-irradiated sample is about twice as wide as in the pristine sample, giving rise to a larger disorder-affected pressure regime. By lacking a microscopic characterization of the defect structure in the irradiated samples, we can only speculate that the defect sites, created by irradiation in the anion layer, may cause an increased number of domains. We suspect that this also affects the internal stress of each domain which in turn leads to an overall wider stress distribution in such a crystal. As the technique of dilatometry is unable to reveal the required spatially-resolved information on the formation of domains, we omit a detailed discussion of the role of domain formation at the first-order transition here and treat this broadening on a phenomenological level, whenever necessary. In addition to an enhanced broadening, we find a significant reduction of the size of the discontinuity at
K at
from
in the pristine case to
in the irradiated case. Apart from these small quantitative changes in the size and width of the anomalous length changes, we find that the evolution of the feature in
to higher
T is qualitatively similar to the above-described pristine case: The size of the discontinuity becomes reduced with increasing
T until it is replaced by a continuous change of
for
K. Importantly, also for the irradiated sample, we find highly non-linear variations of the length as a function of pressure, even at temperatures way above
, see, e.g., the data at
K, where
, i.e., the slope of the
curves at
, exceeds
by at least a factor of two. This behavior is distinctly different from the usual elastic behavior which is characterized by an in-first approximation linear change of
vs.
p, i.e.,
const., in accordance with Hooke’s law of elasticity. The observed breakdown of Hooke’s law here reflects the strong coupling between the critical electronic system and the underlying crystal lattice at the Mott transition, also in the presence of increased disorder.
3.2. T-p Phase Diagram for Weak Disorder
In the following, we analyze the effects of disorder by focusing on certain characteristics of the Mott transition. This includes the precise location of the critical endpoint and the critical behavior in its surrounding. In order to determine the location of the critical endpoint (
,
) for the irradiated crystal with high accuracy from measurements of the relative length change
, we take two complementary approaches, similar to the procedure applied to the pristine sample in Ref. [
25]. In our first approach, we determine (
,
) from the intersection of the first-order transition line with crossover lines which emanate from the critical endpoint. To this end, we combine results from
p-dependent measurements, which allow a precise determination of the first-order transition line (see below), with those performed as a function of
T. The latter measurements provide insight into the crossover lines by analyzing the maximum response
in the coefficient of thermal expansion
d
/d
T for
, as proposed in Ref. [
23]. Moreover, due to the finite slope of the first-order transition line at (
,
), these measurements as a function of temperature at different
const. provide not only information on the crossover line for
and
. In addition, these
T-dependent experiments allow us to cross the first-order transition line for
and
. As the crossing of the first-order transition is expected to manifest itself in a discontinuity in
, corresponding to a divergent behavior in
, the observation of such discontinuities can serve as a criterion for localizing
.
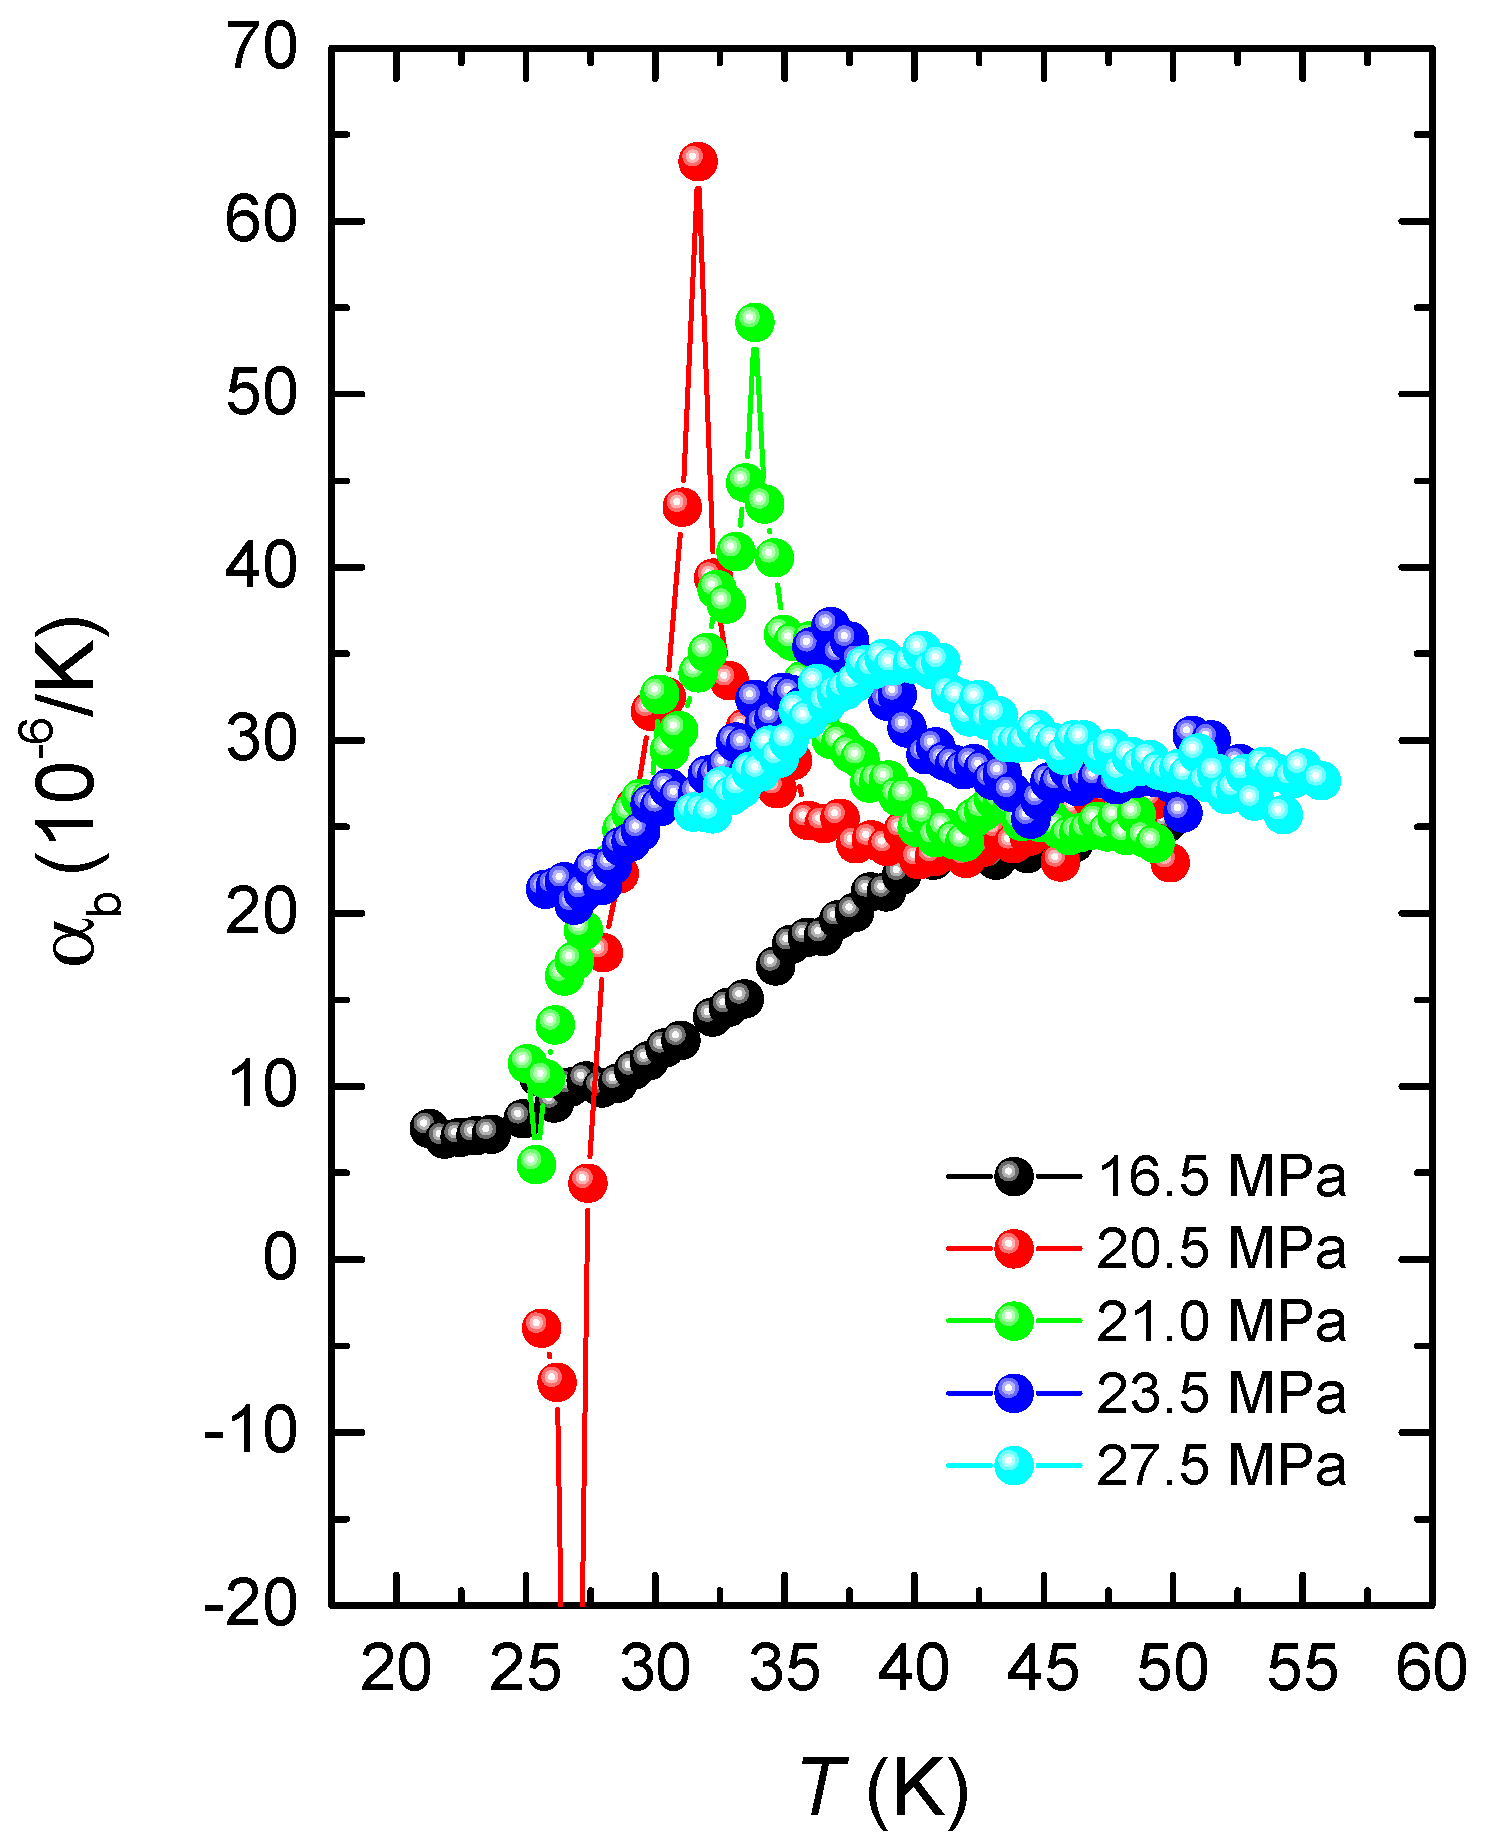
Figure 2 shows
, measured along the out-of-plane
b axis, of 50 h-irradiated
-Cl at several constant
p values around
. Starting at low
MPa, we observe the usual increase of
with increasing
T without any signatures for anomalous behavior. As we approach the endpoint from the low-
p side, however, we observe sharp and pronounced anomalies in
with the tendency to diverge in a narrow pressure range 20.3 MPa
21.0 MPa. We assign these features to signatures of the first-order phase transition. Note that for the data set taken at
MPa, the first-order transition line is crossed twice as a function of
T due to its
S-shaped form. As a result, we find two successive sharp anomalies of opposite sign, the latter one corresponding to the reentrance from the intermediate-
T metallic state to the low-
T insulating state. In contrast, for
MPa, the divergent features in
are absent and instead,
shows a smooth anomaly at slightly higher
T. These features can be assigned to signatures of a crossover line, as predicted theoretically in Ref. [
23].
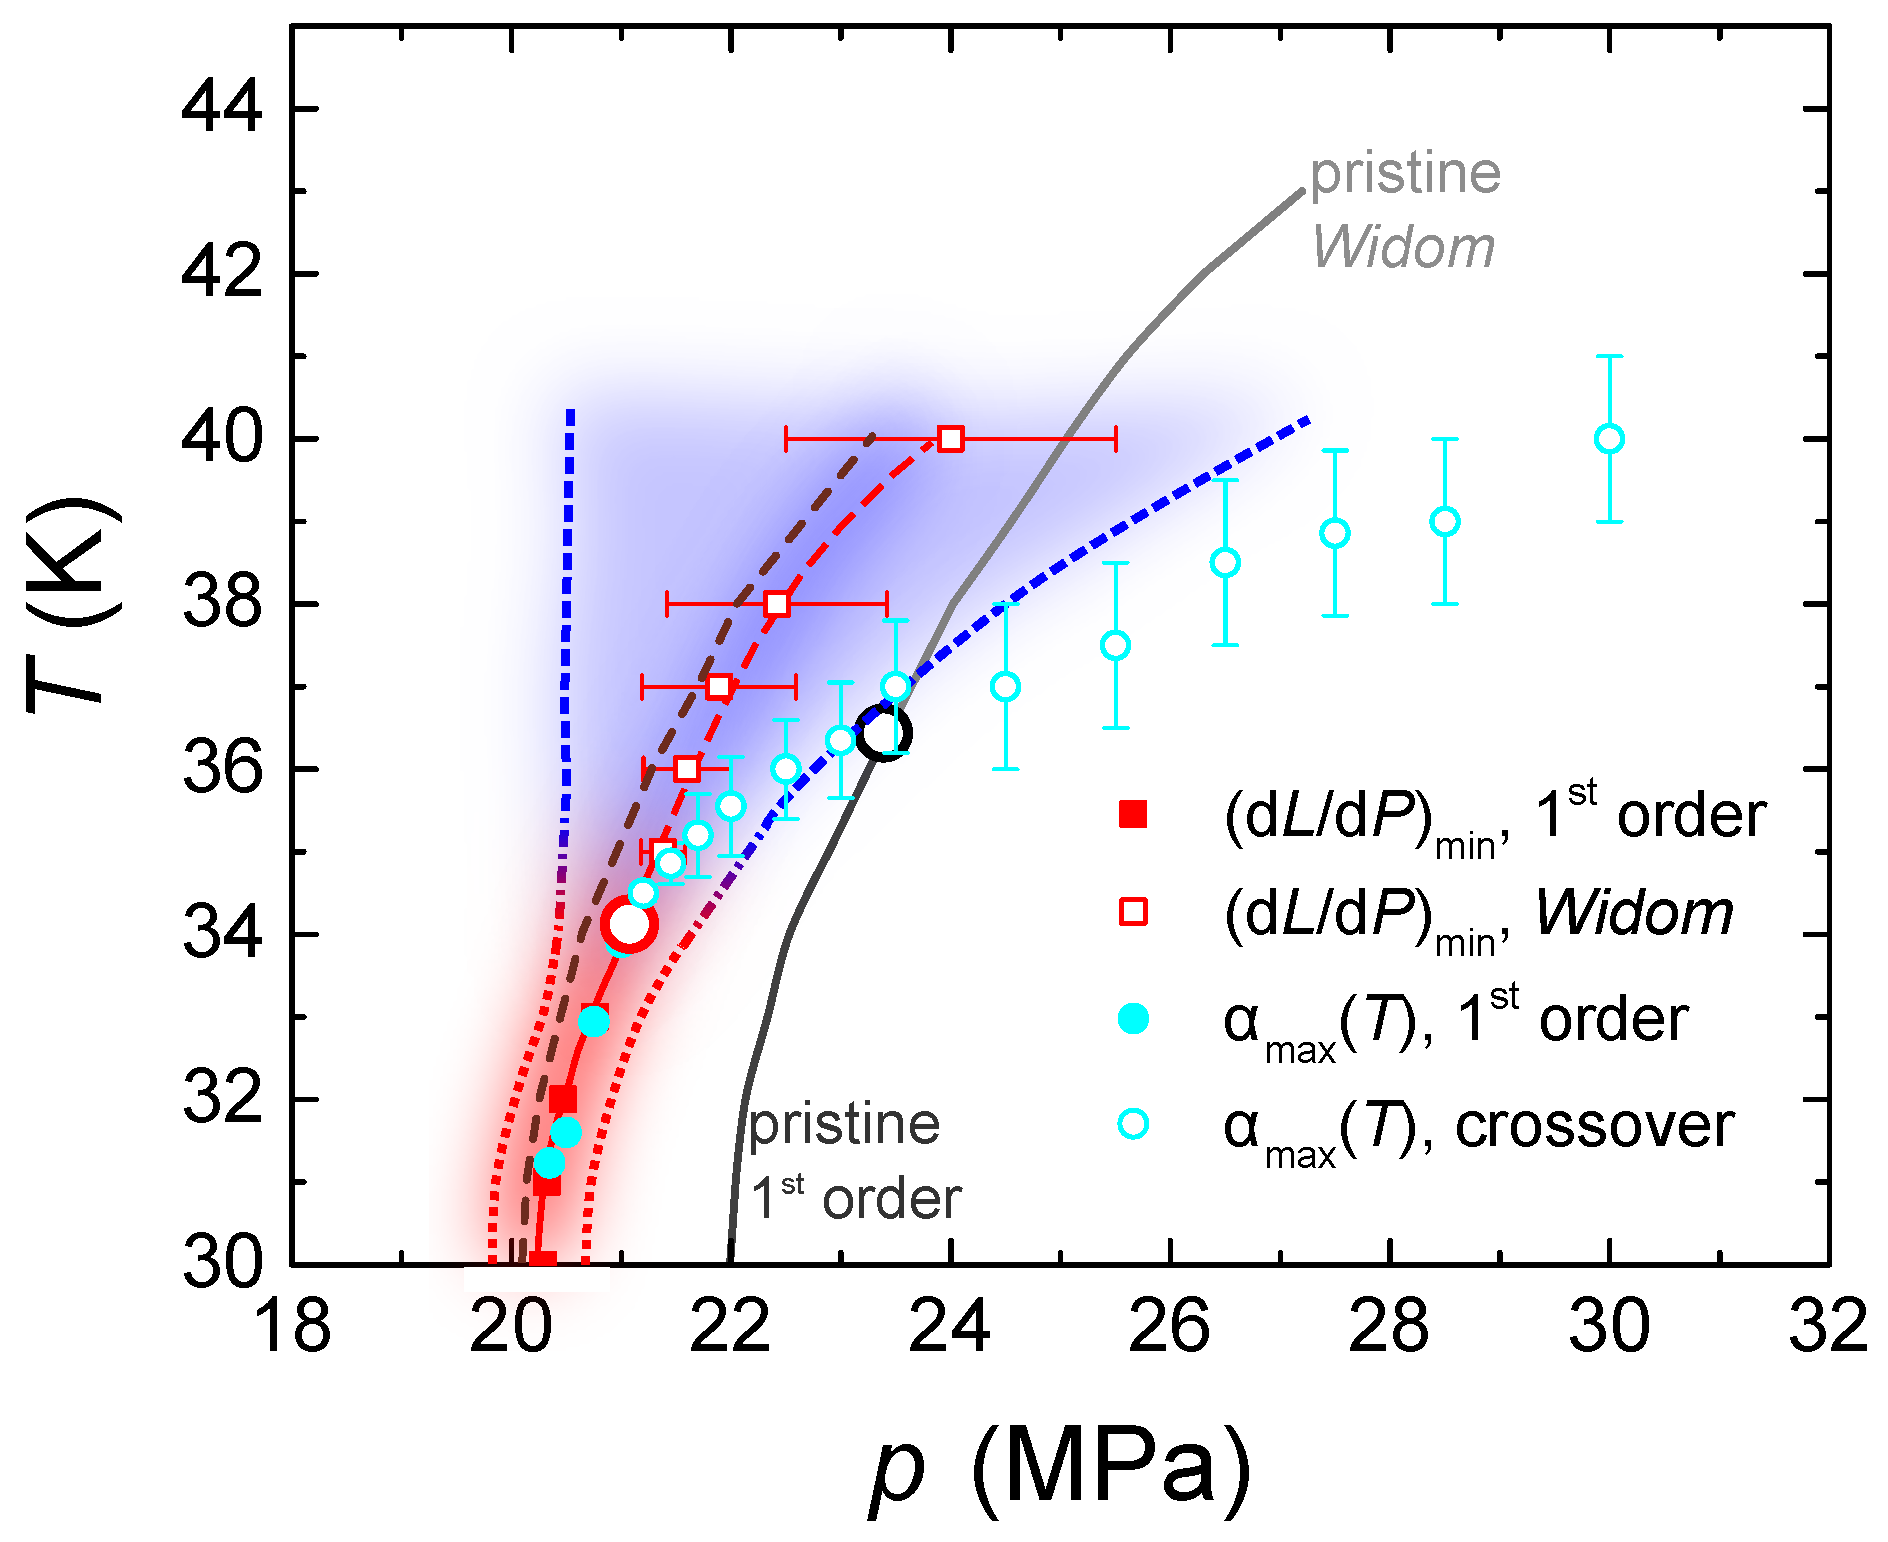
In
Figure 3, we compile in a
T-
p phase diagram the position of the sharp peaks in
for
21 MPa, reflecting the first-order transition temperatures, and the positions of
for
21.0 MPa indicating crossover temperatures. In addition, we also include the positions of the inflection points in the
p-dependent
data sets at different constant
T. These inflection points correspond to either the first-order transition for
or to the so-called
Widom line for
, i.e., the extension of the first-order transition line to higher
T. From the intersection point of the first-order transition line determined from
p-dependent measurements, and the crossover line determined from
T-dependent measurements, we find
K and
MPa for the 50 h-irradiated sample.
An alternative approach to determine (
,
) is provided by analyzing the width of the features observed in
. As mentioned above, the width of the discontinuity in
for
is governed by extrinsic effects. This gives rise to an in first approximation
T-independent width for low
T, as already visible in the bare data in
Figure 1b. In contrast, for
the width is strongly
T-dependent and can therefore be assigned to the effects of criticality. For a quantification of the increase in the width upon increasing
T, we determine the width of our experimental data by the full width at half maximum of the peak in
, as described above. We include the information of the width in the phase diagram, shown in
Figure 3, by red-broken lines for the disorder-dominated regime at
and blue-broken lines for the criticality-dominated regime at
. We find a significant increase in the width for
K. An extrapolation of the lines in the criticality-dominated regime from high
K, where disorder effects play only a minor role, to lower
T yields an alternative estimate of
K. Note that the two different approaches yield an identical position of the critical endpoint within the error bars.
Now we can compare the so-derived phase diagram for the irradiated crystal with the one of the pristine sample. To this end, we include the position of the first-order line, the
Widom line and the critical endpoint of the pristine sample in the phase diagram in
Figure 3. We find that central properties of the Mott transition, i.e., the first-order character at low
T and the second-order critical endpoint, survive at the level of disorder introduced by 50 h of irradiation. However, this irradiation leads to a significant reduction of
as well as
. Here, the exposure to X-ray for 50 h causes a decrease of
by ≈2.5 K (
7 %) and of
by ≈2.4 MPa (
10 %). This finding demonstrates a high sensitivity of the Mott transition line on the degree of disorder. We stress that the Mott transition lines for
-Cl reported in the studies by Kagawa et al. [
18] and Gati et al. [
25], practically coincide, indicating a similar low level of disorder in the pristine crystals studied there. In addition, a study of pristine crystals from batch #AF063 (not shown) discloses that
of two different crystals varies up to 1 K and
up to 0.5 MPa. Thus, the variations in the disorder level of pristine samples are distinctly smaller than the one introduced by exposure to X-ray for 50 h.
3.3. Critical Behavior for Weak Disorder
After having determined the location of the critical endpoint (
,
) for the irradiated crystal, we can proceed by analyzing the observed lattice effects in terms of the critical behavior. For pristine
-Cl [
25], the anomalous lattice effects could be well described by a mean-field critical model of an isostructural solid-solid endpoint. In fact, this type of criticality was predicted theoretically for the critical electronic Mott system that is coupled to a compressible lattice as a consequence of the long-ranged shear forces of the lattice [
26,
27]. In light of the strong lattice response revealed for the irradiated system, we employ the same mean-field critical model to the present
data set, presented in
Figure 1b. The model reads, as follows,
Here,
is the proportionality constant between the relative length change
and the critical strain singlet
which represents the order parameter of an isostructural solid-solid transition. The strain singlet obeys the mean-field equation
, with
the reduced temperature,
the reduced pressure and
u a parameter, which quantifies non-linearities in the mean-field potential, and
an offset contribution, see below. Note that the first two parameters are determined by our experiment, whereas the latter one enters as a free parameter. This model can be extended to account for the disorder broadening. To this end, we average the mean-field solution
with a Gaussian stress distribution
with variance
w, i.e.,
. The details of this model are given in the Supplementary Information of Ref. [
25]. In order to eliminate the temperature-dependent expansion effects, we normalized all data sets (see
Figure 1) to the inflection points of
at
, i.e.,
= 0. The increase in the broadening of the first-order transition upon irradiation is accompanied by an increasing asymmetry of the
curves in
Figure 1b with respect to the midpoint of the discontinuity. To account for this effect, which is not understood at present and which is also not covered by the above model, we proceed as follows: we use the experimentally determined inflection point of the
data for a first iteration for
in the fitting procedure, and then refined the fit by allowing for a small variation of
of the order of 0.1 MPa. The resulting optimized
values are included as a brown broken line in the phase diagram in
Figure 3. As a consequence of the small adjustment of
, we have to accept a small offset in
of
. The variance
w of the stress distribution can be determined from the experiment at lowest temperature of
K from a Gaussian fit to the
data, which results in
for the data set of the irradiated sample. Note that this value of
w in its dimensionless form corresponds to the above-determined broadening of
MPa.
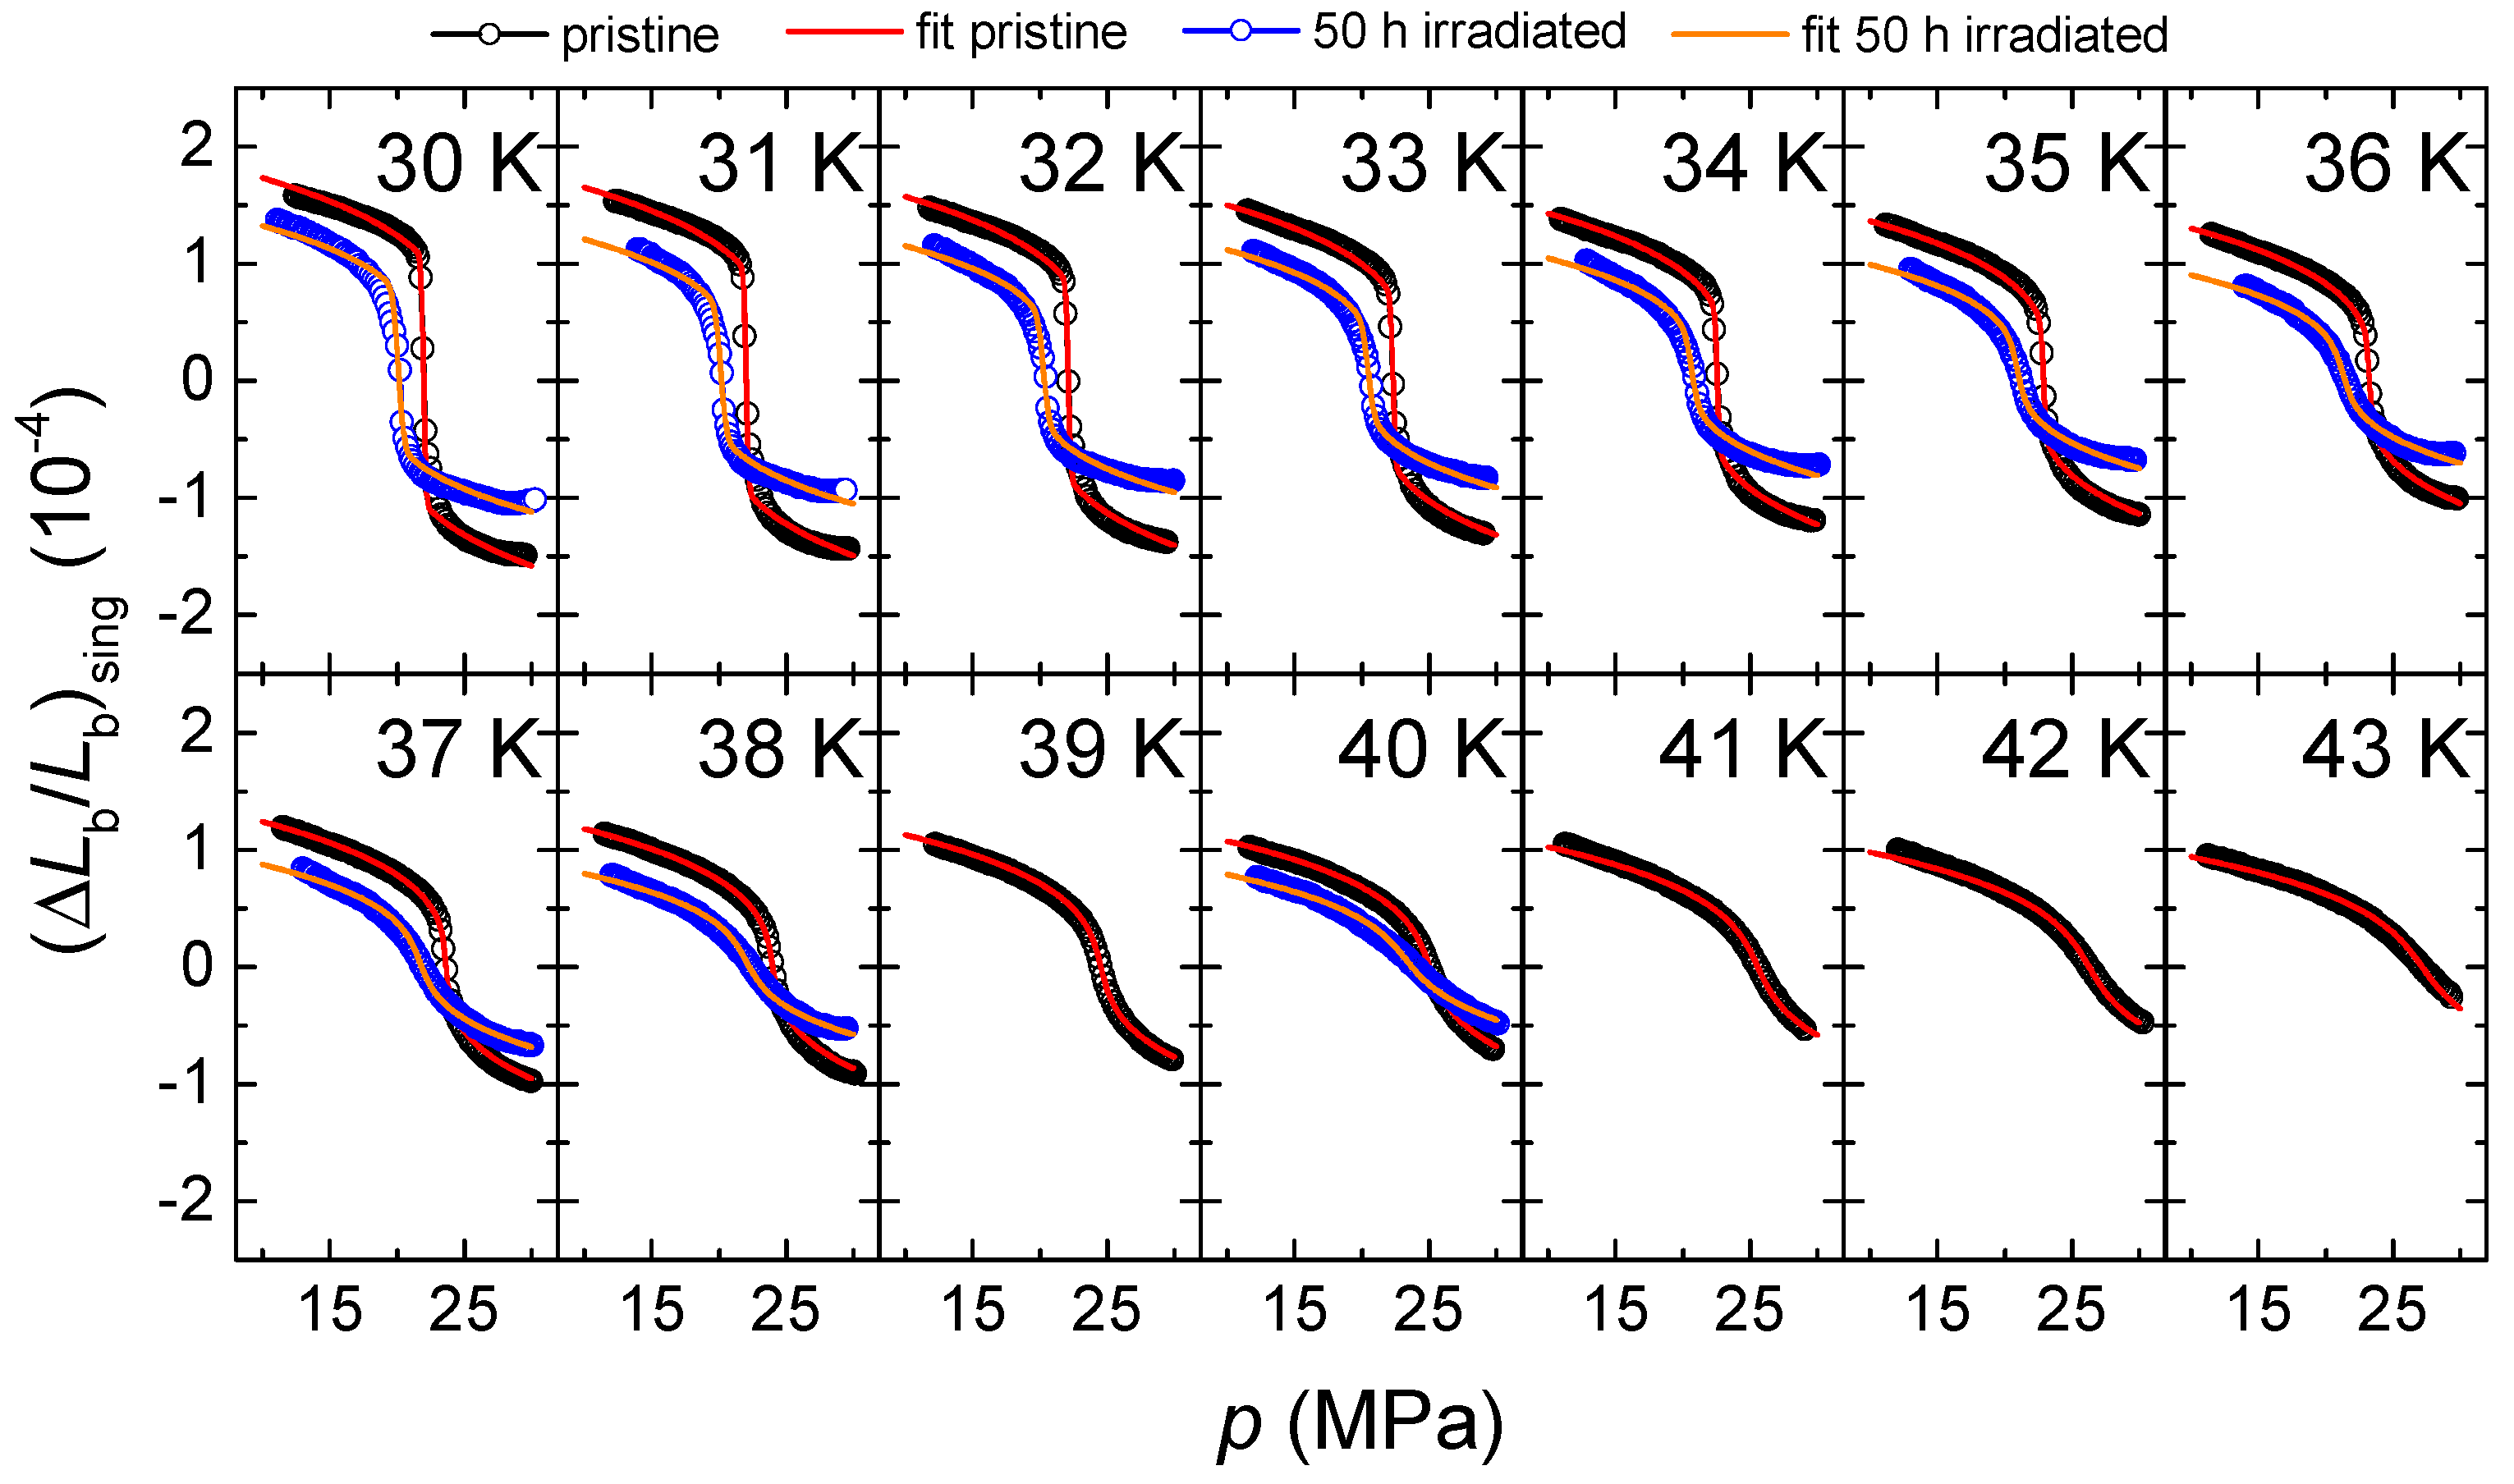
Figure 4 demonstrates that the data set of the irradiated crystal is in very good agreement with the mean-field critical model, given in Equation (
1), in the full
T range 30 K
40 K investigated. As a result of the fit, we obtain values for the parameters
u and
. The fit yields
, which is the parameter characterizing the non-linearity of the length change. We stress that the fit to the data set on the pristine sample [
25], which is included in
Figure 4 for comparison, yielded the identical value of
u. The extracted values
are slightly different for the various
const. scans. However, they follow to a good approximation a
T-linear behavior described by
. The fits for the data set of the pristine sample resulted in a similar small
T-linear variation of
. In the model for an isostructural solid-solid endpoint, the value of
is given by the eigenvalues and the eigenvectors of the elastic constant matrix (see Ref. [
25] for details) which is likely subject to a small
T-dependent variation.
As demonstrated in
Figure 4, the mean-field fits provide an excellent description of the experimental data not only for the pristine sample (see
Figure 4), but also for the irradiated sample. These results show that the character of the Mott transition remains essentially unchanged for the two different disorder levels. This relates to the first-order character of the transition and the strong coupling to the lattice with the concomitant change of universality class to mean-field criticality around the second-order critical endpoint.
3.4. T-p Phase Diagrams of the Metal-Insulator Transition for Higher Irradiation Doses Based on Resistance Measurements
In the following, we discuss how the characteristic features of the Mott transition for -Cl evolve upon further increasing the level of disorder. Instead of using measurements of the relative length change on one single crystal at varying irradiation levels, which is a very time consuming experiment, we employ measurements of the resistance R. Importantly, all of the presented data were taken on the same -Cl single crystal from batch #5-7 which was exposed to a three-step irradiation process (50 h, 100 h, and 150 h) and which was measured after each step.
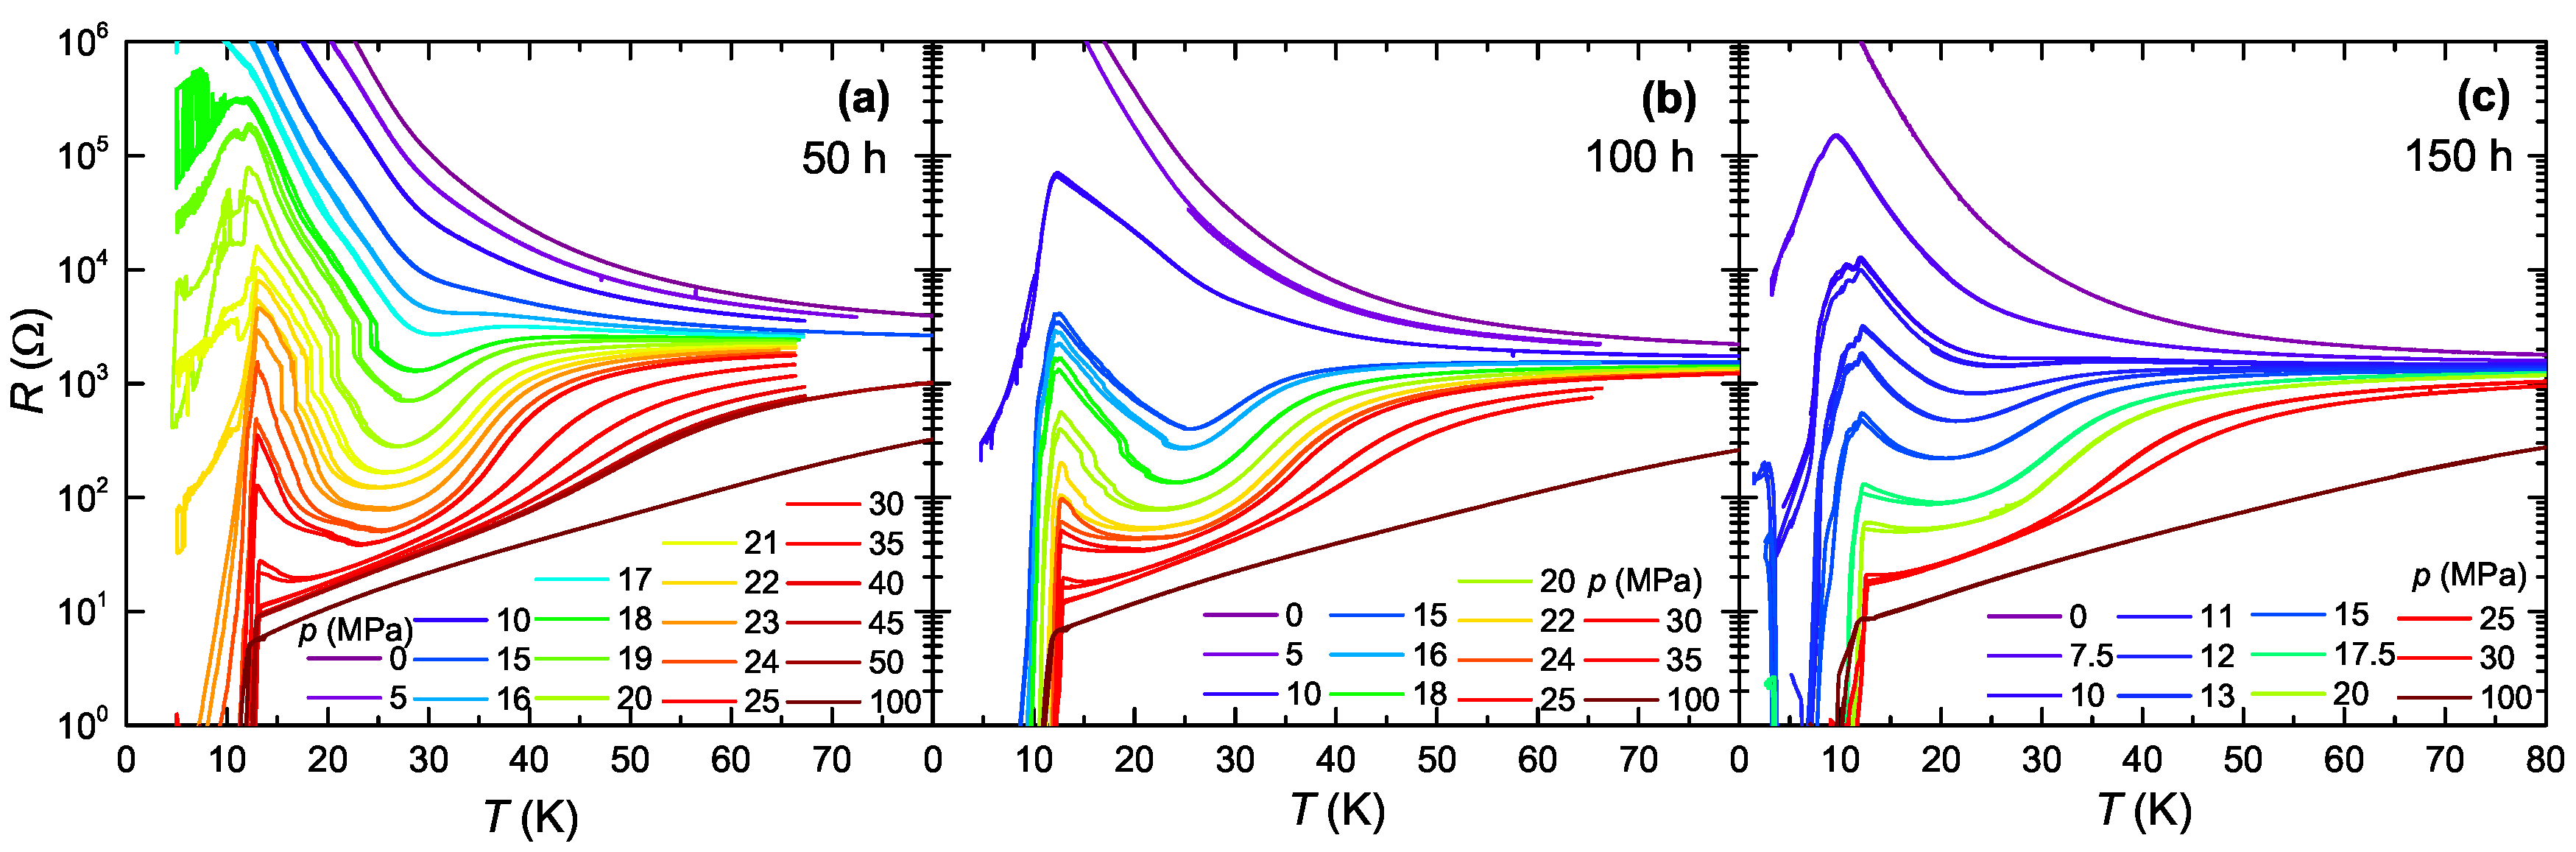
Figure 5 shows the out-of-plane resistance
R as a function of
T at varying
p=const. for a
-Cl crystal from batch #5-7 after exposure to X-ray for 50 h (a), for 100 h (b) and 150 h (c). For all three irradiation levels,
-Cl exhibits a non-metallic behavior at ambient pressure characterized by an increasing
R with decreasing
T, consistent with literature results [
48]. The
curves at different irradiation doses show the same general trend upon increasing
p as observed for pristine samples [
13,
14]: Low
p reduces the resistance at a fixed temperature, however, the resistance at a fixed, low
p value still shows a non-metallic behavior with d
R/d
. At intermediate
p, the system is non-metallic at low
T and undergoes a transition into a metallic state, characterized by d
R/d
, upon increasing
T and enters an anomalous transport regime at higher
T, characterized by d
R/d
0. This reentrant behavior, visible in the range 18 MPa
30 MPa after 50 h irradiation time, reflects the
S-shape of the first-order transition line and the
Widom line in the
T-
p phase diagram. At high
30 MPa, all data sets reveal a metallic behavior in the full
T range investigated with a transition into a superconducting state at low
12 K.
Despite these similarities in the overall behavior of
after different irradiation times, a closer inspection of the data in
Figure 5 discloses significant differences in the location and character of the metal-insulator transition. These irradiation-induced changes can be illustrated clearly by comparing data sets taken at the same
p values, e.g.,
p = 20 MPa. In the data at 50 h irradiation time, we find a kink in the
data with an abrupt sign change of d
R/d
T at
K which interrupts the increase in
R upon cooling, reflecting insulating behavior. This kink marks the entrance into a spurious superconducting phase at
K which is known to exist close to the first-order Mott metal-insulator boundary on the insulating side in pristine
-Cl [
11] and is likely responsible for the increased noise in
R(
T,
MPa) at low
T. Upon increasing the temperature, we find a pronounced jump-like suppression of
at
20.5 K. Importantly, the jump in
R(
= 20 MPa) is accompanied by a significant thermal hysteresis of
0.7 K, reflecting the first-order nature of this phase transition. We assign this discontinuity in
to the signature of the first-order metal-insulator transition, in accordance with the approach taken in literature [
13,
18,
22]. The fact that the resistance jump remains sharp in the presence of some disorder is a consequence of percolation, i.e., a current that runs through low-resistance domains. This contrasts with the broadening observed in the discontinuities of thermodynamic quantities, such as the lattice effects, which average over all domains in the crystal. Even though the jump in
occurs at
K, we stress that the hysteresis and the insulating character are visible up to a slightly higher temperature of
26.5 K where
exhibits a local minimum. Above the temperature of the local minimum in
, i.e.,
K, the system shows metallic behavior with d
R/d
T > 0. Upon further increasing the temperature, the system gradually changes from a metal into an anomalous transport regime, as indicated by an almost flat
R(
= 20 MPa) behavior at
K. This change is not accompanied by any hysteresis, indicating that this temperature corresponds to a crossover temperature.
At a higher irradiation time of 100 h, cf.
Figure 5b, the spurious superconducting phase at low
T and
MPa is replaced by percolative or even bulk superconductivity with
12.6 K, characterized by
at
K. With increasing temperature, we observe the same characteristics as in the case of 50 h irradiation, i.e., a jump-like reduction of the resistance at low
T, accompanied by thermal hysteresis, and thus indicative of a first-order phase transition, and a crossover at high
T. However, the jump in
R(
T,
p = 20 MPa) is significantly reduced in size and occurs in two concomitant steps at
K and
K. The fact that the transition takes place in several steps is likely of extrinsic nature and possibly associated with the formation of several domains in the presence of disorder. Therefore, we assign the metal-insulator transition to the larger jump at
K. The minimum in
, which marks the onset of hysteresis, and the change from low-
T insulating to high-
T metallic behavior, is observed at
22 K. The crossover from the metallic behavior to the
const. behavior is found at
K. Apparently, these characteristic temperatures react differently on increasing the irradiation dose from 50 h to 100 h: Whereas the position of the jump and the minimum in
R(
= 20 MPa) are shifted to lower temperatures, the position of the crossover is shifted to higher
T. This peculiar behavior can be related to the
S-shaped form of the first-order transition line and the crossover lines (see e.g., Ref. [
23,
25]). In pristine
-Cl, the temperature of the first-order transition decreases with increasing pressure distance to the critical point, whereas the crossover temperature increases. Thus, the present observation of a decrease in the first-order transition temperature and an increase in the crossover temperature at the same
p value upon irradiation can be considered as an indication that the critical endpoint of the irradiated sample is located lower in pressure than the pristine one.
Upon further increasing the irradiation time to 150 h, (cf.
Figure 5c), we do not find any indications for a jump-like change of
R(
T,
p = 20 MPa) at intermediate temperatures. Instead, the resistance changes smoothly yielding a minimum at
16 K. We note that despite the disappearance of a jump-like change of
R(
T,
p = 20 MPa), we still find a small hysteresis at low
T in the insulating regime which prevails until the resistance reaches its minimum. Apparently, at this irradiation level, the character of the phase transition has changed. Based on the present transport data, we cannot discriminate between a transition of weak first order, or a smeared first-order transition with residual hysteresis.
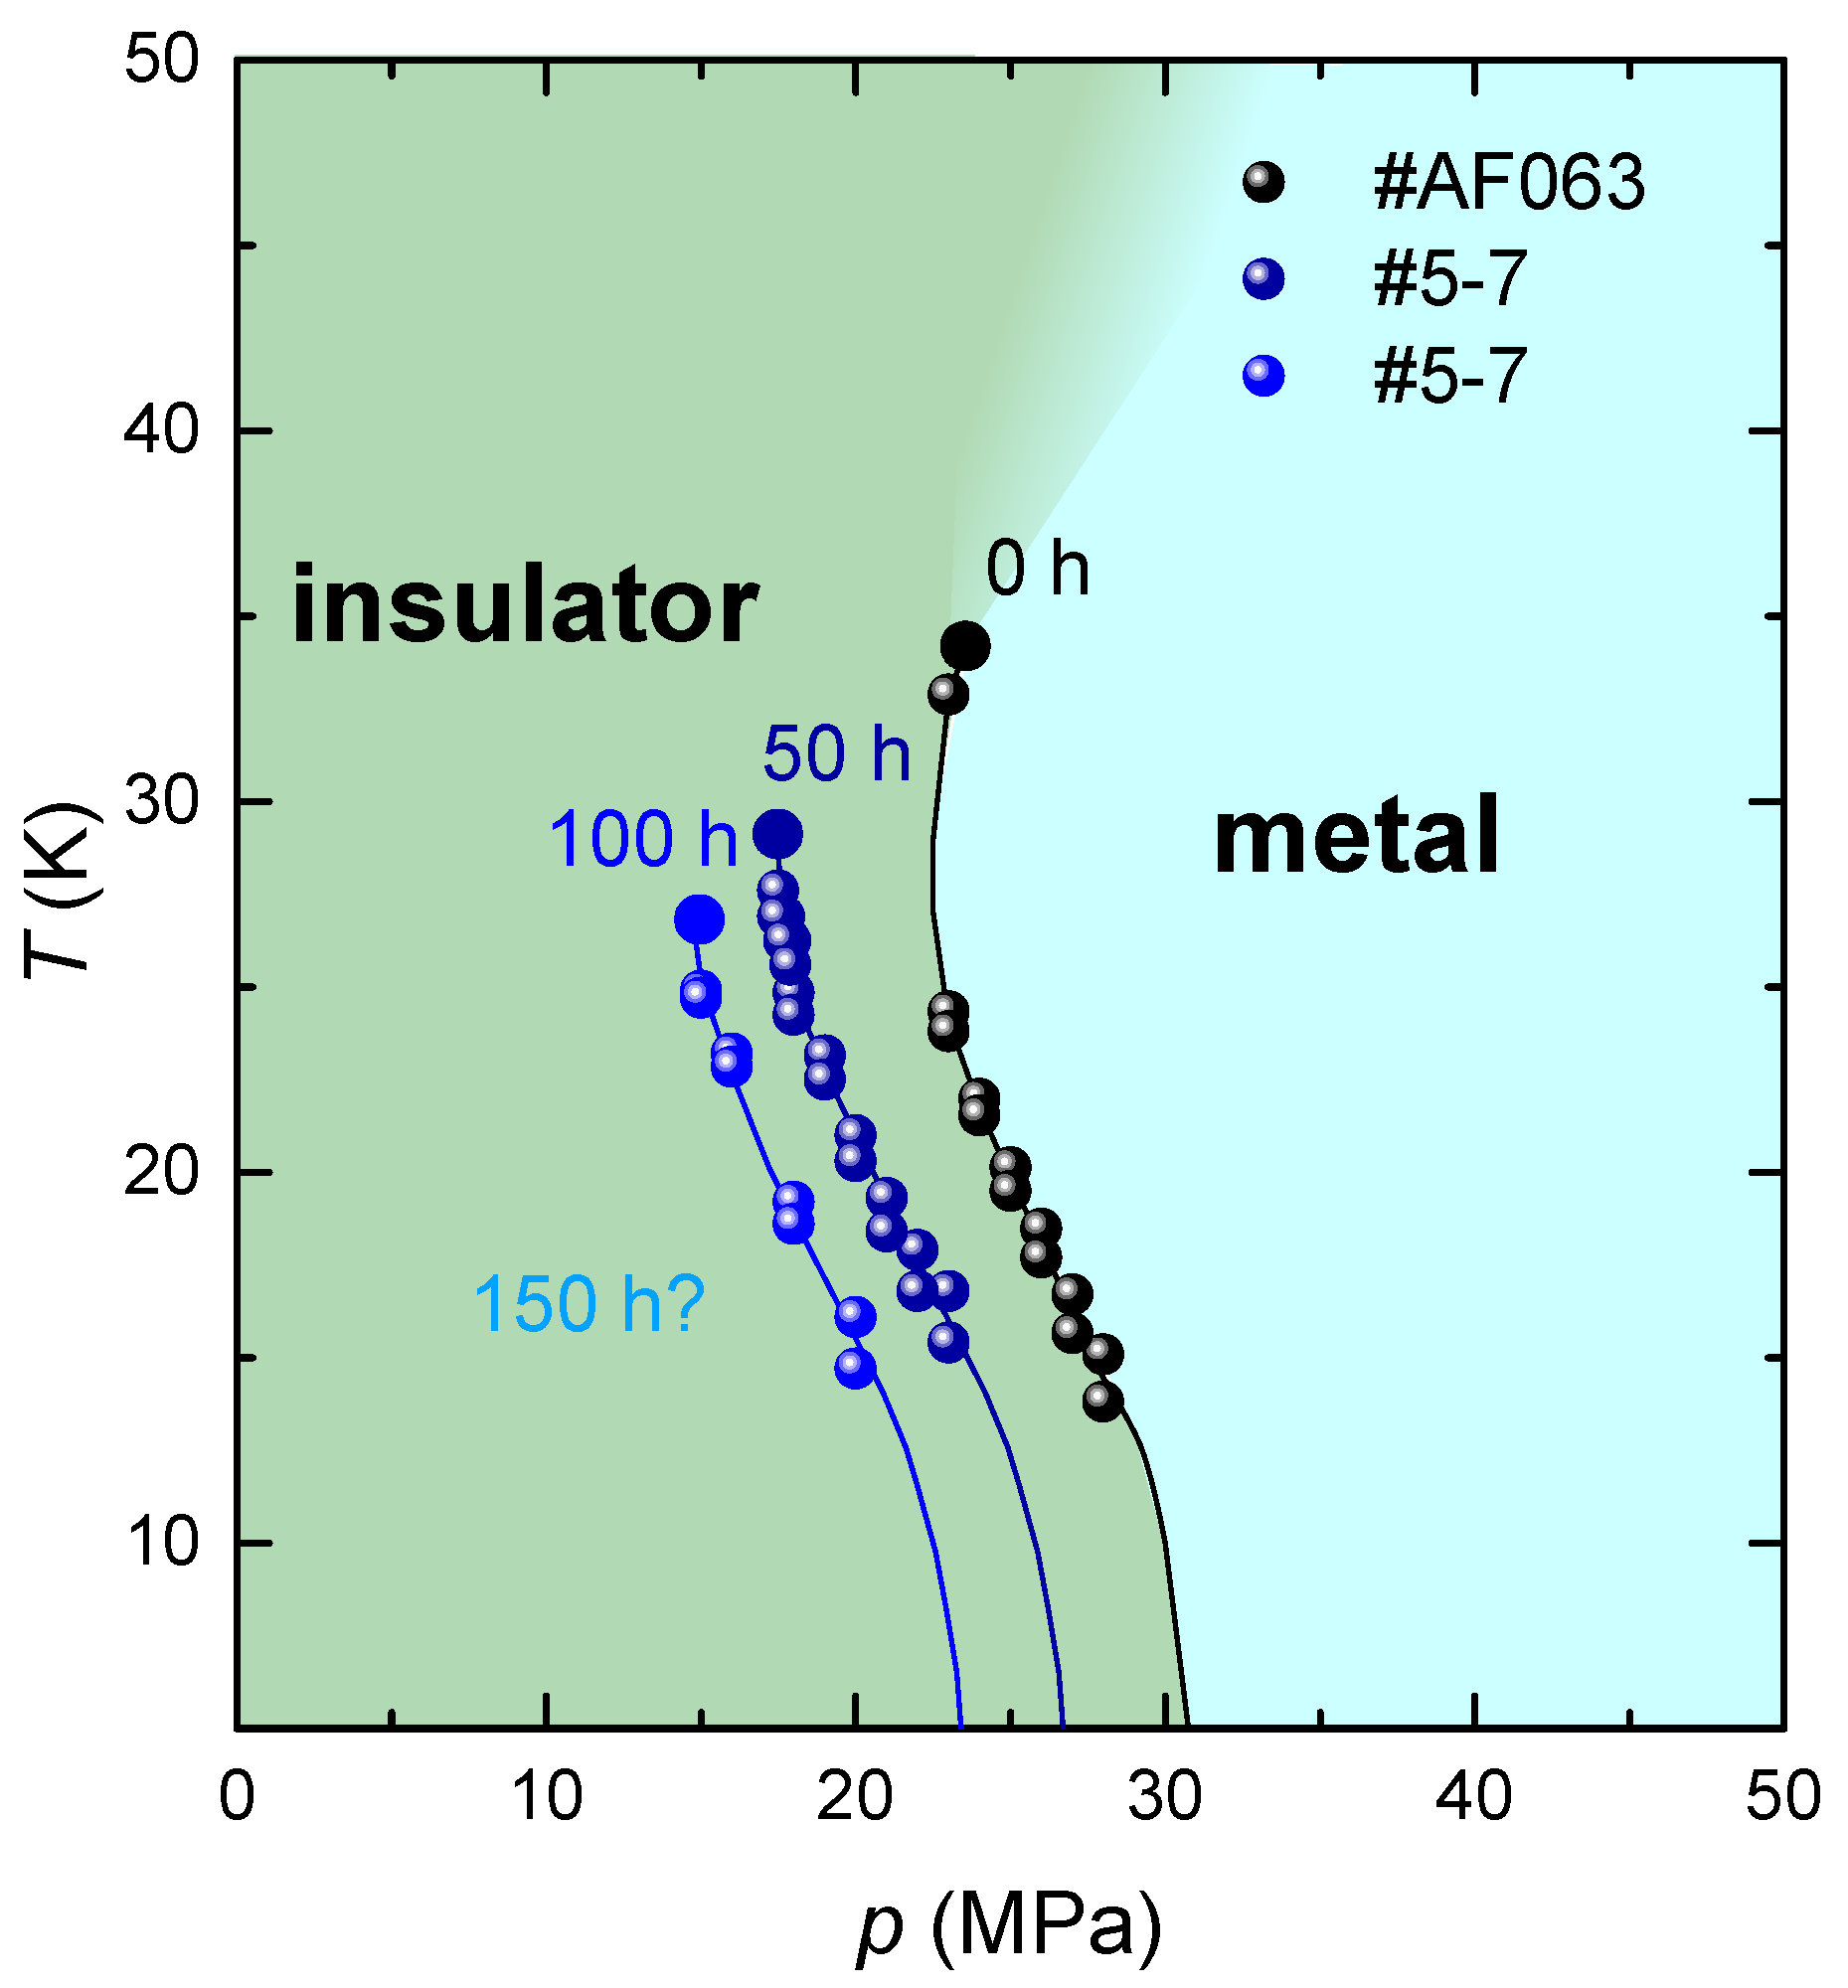
In order to illustrate the change of the first-order metal-insulator transition line upon irradiation, we compile the position of the jump for all investigated
p values in a
T-
p phase diagram in
Figure 6. For comparison, we included the transition temperatures of the first-order transition line extracted from
T-dependent resistance measurements on a pristine crystal of batch #AF063 (not shown) which are in good agreement with published data [
11,
14,
22,
25]. As already indicated by our thermodynamic measurements, we find a significant shift of the first-order transition line to lower
p upon irradiation for 50 h and 100 h. The shift of the phase transition line at
K, amounts to about
MPa per hour of irradiation time. In addition, we find that the position of the critical endpoint (
,
) becomes significantly reduced in temperature as well as in pressure: Our analysis yields (
,
)
(
K,
MPa) and (
,
)
(
K,
MPa) after irradiating
-Cl for 50 h and 100 h, respectively. We stress that the slightly different results of (
,
) after 50 h of irradiation, inferred from the resistance measurements on a crystal of batch #5-7, as compared to those of our thermodynamic measurements on a crystal of batch #AF063 (see
Section 3.2), might be related to details of our experiments. First, we cannot rule out small sample-to-sample variations of crystals from different batches. More importantly, however, the crystals involved had different surface-to-thickness ratios, implying that a different distribution of disorder was introduced within the same irradiation time. At even higher irradiation time of 150 h, we cannot find any discontinuous feature in the full
T-
p range investigated. Therefore, we cannot draw a phase transition line for this case.
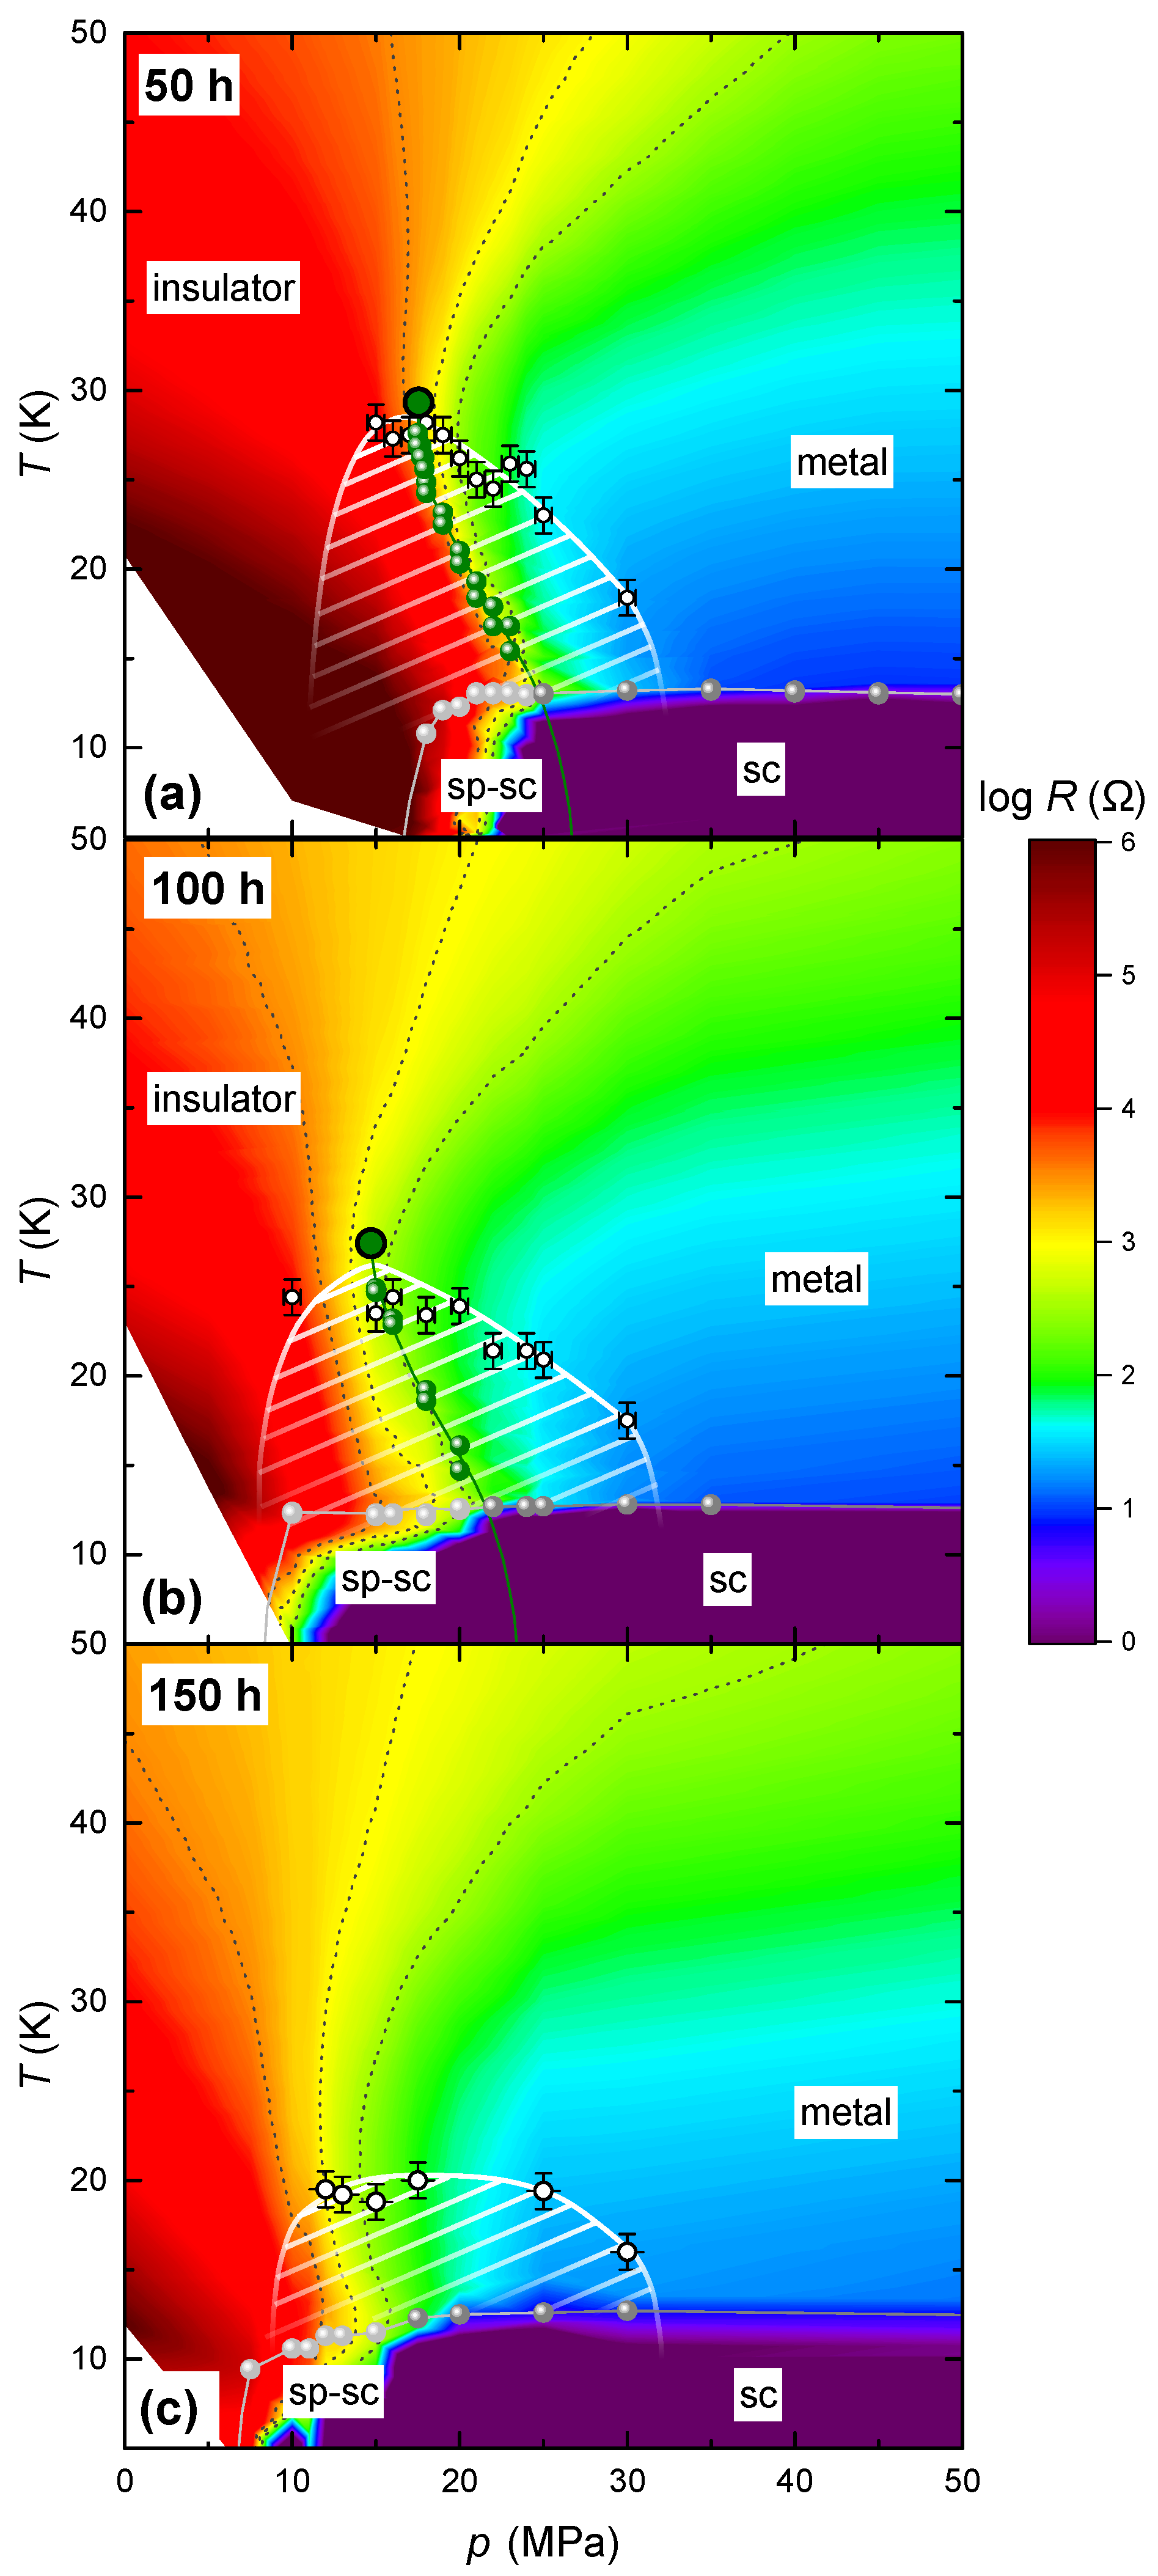
To quantify the range of hysteretic behavior and to follow its evolution upon irradiation, we define the onset of hysteresis by
with
(
) denoting the resistance taken upon warming (cooling). The onset temperatures together with the previously determined first-order transition lines (green symbols) and the second-order critical endpoint (thick green circle) are compiled in the contour plots in
Figure 7 which will be discussed below in more detail. For the 50 h irradiated crystal, we find clear signatures for thermal hysteresis in the pressure range ≈15 MPa
30 MPa and up to
K. The width of the hysteresis range (hatched area in
Figure 7) on the pressure axis is similar to the one found for a pristine crystal in Ref. [
13]. However, upon irradiation, the hysteresis regime is shifted to lower pressures and suppressed in temperature, consistent with the shift of the Mott transition line to lower
p and the reduction of
, discussed above. Upon further increasing the irradiation to 100 h, the hysteresis regime is shifted to even lower pressures and further reduced in temperature. Importantly, even after 150 h of irradiation thermal hysteresis occurs in a similarly wide pressure range ≈10 MPa
30 MPa and up to
K. This result speaks in favor of the notion of a smeared first-order transition after 150 h of irradiation where disorder causes the suppression of signatures, and therefore can no longer be discerned from a crossover. We stress that for a detailed analysis of the hysteresis range, measurements as a function of increasing and decreasing pressure, not possible with the available set-up, are much better suited for the following reasons: First, these organic charge-transfer salts tend to form small cracks due to their large thermal expansion, particularly when sweeping the temperature over a wide range, as done in the present work. These small cracks lead to small offset contributions in
which strongly hamper the analysis of the thermal hysteresis. This effect is avoided in pressure sweeps performed at low temperatures. Second, due to the almost vertical alignment of the metal-insulator transition line in the
T-
p phase diagram, the signatures in
p sweeps are more clearly pronounced as compared to
T sweeps.
3.5. Influence of Disorder on the Metallic and Insulating States Nearby the Mott Transition
Next, we focus on the influence of disorder on the range close to the first-order Mott metal-insulator transition. To this end, we include in
Figure 7 contour plots of the resistance in a wide
T-
p range for all three investigated irradiation times. The plots also contain the transition temperatures into spurious (dark grey symbols) or bulk (light grey symbols) superconductivity. The colors represent the absolute value of
R on a logarithmic scale. This presentation of the data highlights two remarkable aspects. First, the diagram shows how the superconducting state, observed in the immediate vicinity of the metal-insulator transition in the pristine case, is affected by irradiation. Second, it discloses a striking mirror symmetry along the
Widom line (see below for detailed definition) for
which has been known from the pristine case [
29]. In the latter case, this mirror symmetry has been interpreted in terms of a quantum-critical scaling [
28].
Concerning the superconducting properties of irradiated
-Cl, we find signatures for a bulk superconducting dome as well as a range of spurious superconductivity in the
T-
p phase diagram for all three irradiation doses. We use the term bulk superconductivity in cases where there is a sharp drop of
R at
below which the out-of-plane resistance reaches values
for
. This contrasts with spurious superconductivity which manifests itself in a broad kink in
at low
T without reaching a low resistance value, i.e.,
> 10
. After 50 h (100 h) of irradiation, we find spurious superconductivity in the range 18 MPa
24 MPa (10 MPa
20 MPa) and bulk superconductivity in the range
MPa (
22 MPa). Compared to the range of spurious superconductivity of 20 MPa
28 MPa and bulk superconductivity of
MPa in pristine
-Cl [
11], we find a significant shift of superconductivity to lower pressures upon increasing irradiation dose. We note that the shift of the superconducting dome on the pressure axis is similar to the shift of the first-order Mott metal-insulator transition line: The spurious superconducting phase occurs in all cases on the insulating side of the Mott transition, whereas the bulk superconducting phase can be found right on the metallic side. The fact that bulk superconductivity emerges as soon as the insulator is suppressed by pressure indicates the strong connection between the metal-insulator transition and superconductivity, also in disordered
-Cl. Surprisingly, even after 150 h of irradiation, bulk superconductivity is observed in a wide
p range despite the lack of clear signatures of a first-order phase transition. However, superconductivity starts to occur in the regime where the resistance at
changes strongly in a narrow pressure regime. This result suggests that the existence of superconductivity does not require a nearby strong first-order metal-insulator transition.
Besides the irradiation-induced shift of the superconducting dome on the pressure axis, the critical temperature
is also affected by irradiation. By using the onset temperature of the drop in
as a measure of
, we find that the maximum
is reduced from 13 K after 50 h of irradiation, to 12.7 K after 100 h and 12.2 K after 150 h. At
MPa, the highest pressure of the present experiment,
is reduced from 12.3 K to 12.0 K to 11.8 K upon increasing irradiation time from 50 h to 100 h to 150 h. A similar reduction of
upon irradiation was found also for
-(BEDT-TTF)
Cu(NCS)
[
49,
51], and
-(BEDT-TTF)
Cu[N(CN)
]Br [
50], both of which are located at ambient pressure on the metallic side of the Mott metal-insulator transition. In the latter cases, this shift was interpreted to be incompatible with a superconducting order parameter with one single component. This conclusion is consistent with the result of a recent combined theoretical and experimental scanning tunneling microscopy study [
57] which found strong indications for an extended
symmetry of the superconducting order parameter in
-(BEDT-TTF)
Cu[N(CN)
]Br.
Now we turn to the analysis of resistance behavior in the high-
T regime
. To this end, we included in the contour plots in
Figure 7 three dotted lines which represent constant
R lines in the phase diagram with
,
and
. The
is chosen such that it is very close to the resistance value along the
Widom line which is determined according to Refs. [
28,
29] as the inflection points of
vs.
p at
const. For all three irradiation doses, we find an extended range at
where
shows a mirror symmetry along the
Widom line. The notation of mirror symmetry here implies that the normalized resistance
with
, i.e., the resistance normalized to the value at the
Widom line at
, are identical on the low-pressure side of the
Widom line (
) and the high-pressure side (
) for a given pressure distance
to the
Widom line (
). The temperature range of this symmetric
behavior is extended to lower
T upon increasing irradiation: After 150 h of irradiation this symmetry is visible down to
20 K. As this mirror symmetry was associated with signatures of quantum criticality for pristine
-Cl [
29], the present data indicate that irradiation can be an appropriate parameter to further suppress
, thereby expanding the quantum-critical regime to somewhat lower temperatures. However, even after 150 h of irradiation, it appears that
is not fully suppressed to zero (see discussion of hysteresis above), so that more disorder is required to fully suppress the second-order critical endpoint in
-Cl. In this situation, it is possible that quantum-critical signatures of the Mott transition can develop. However, it may well be that in this case, the material’s properties are governed by disorder effects rather than quantum criticality. For a detailed investigation of the potential quantum-critical scaling around the
Widom line and of the role of disorder on this scaling (see Ref. [
58]), in-plane resistance measurements up to higher
T, as well as measurements of
R as a function of
p, similar to Ref. [
29], are required.

 ,
, 


