Novel Method for Estimating Phosphor Conversion Efficiency of Light-Emitting Diodes

 , ,
, , 
Abstract
:1. Introduction
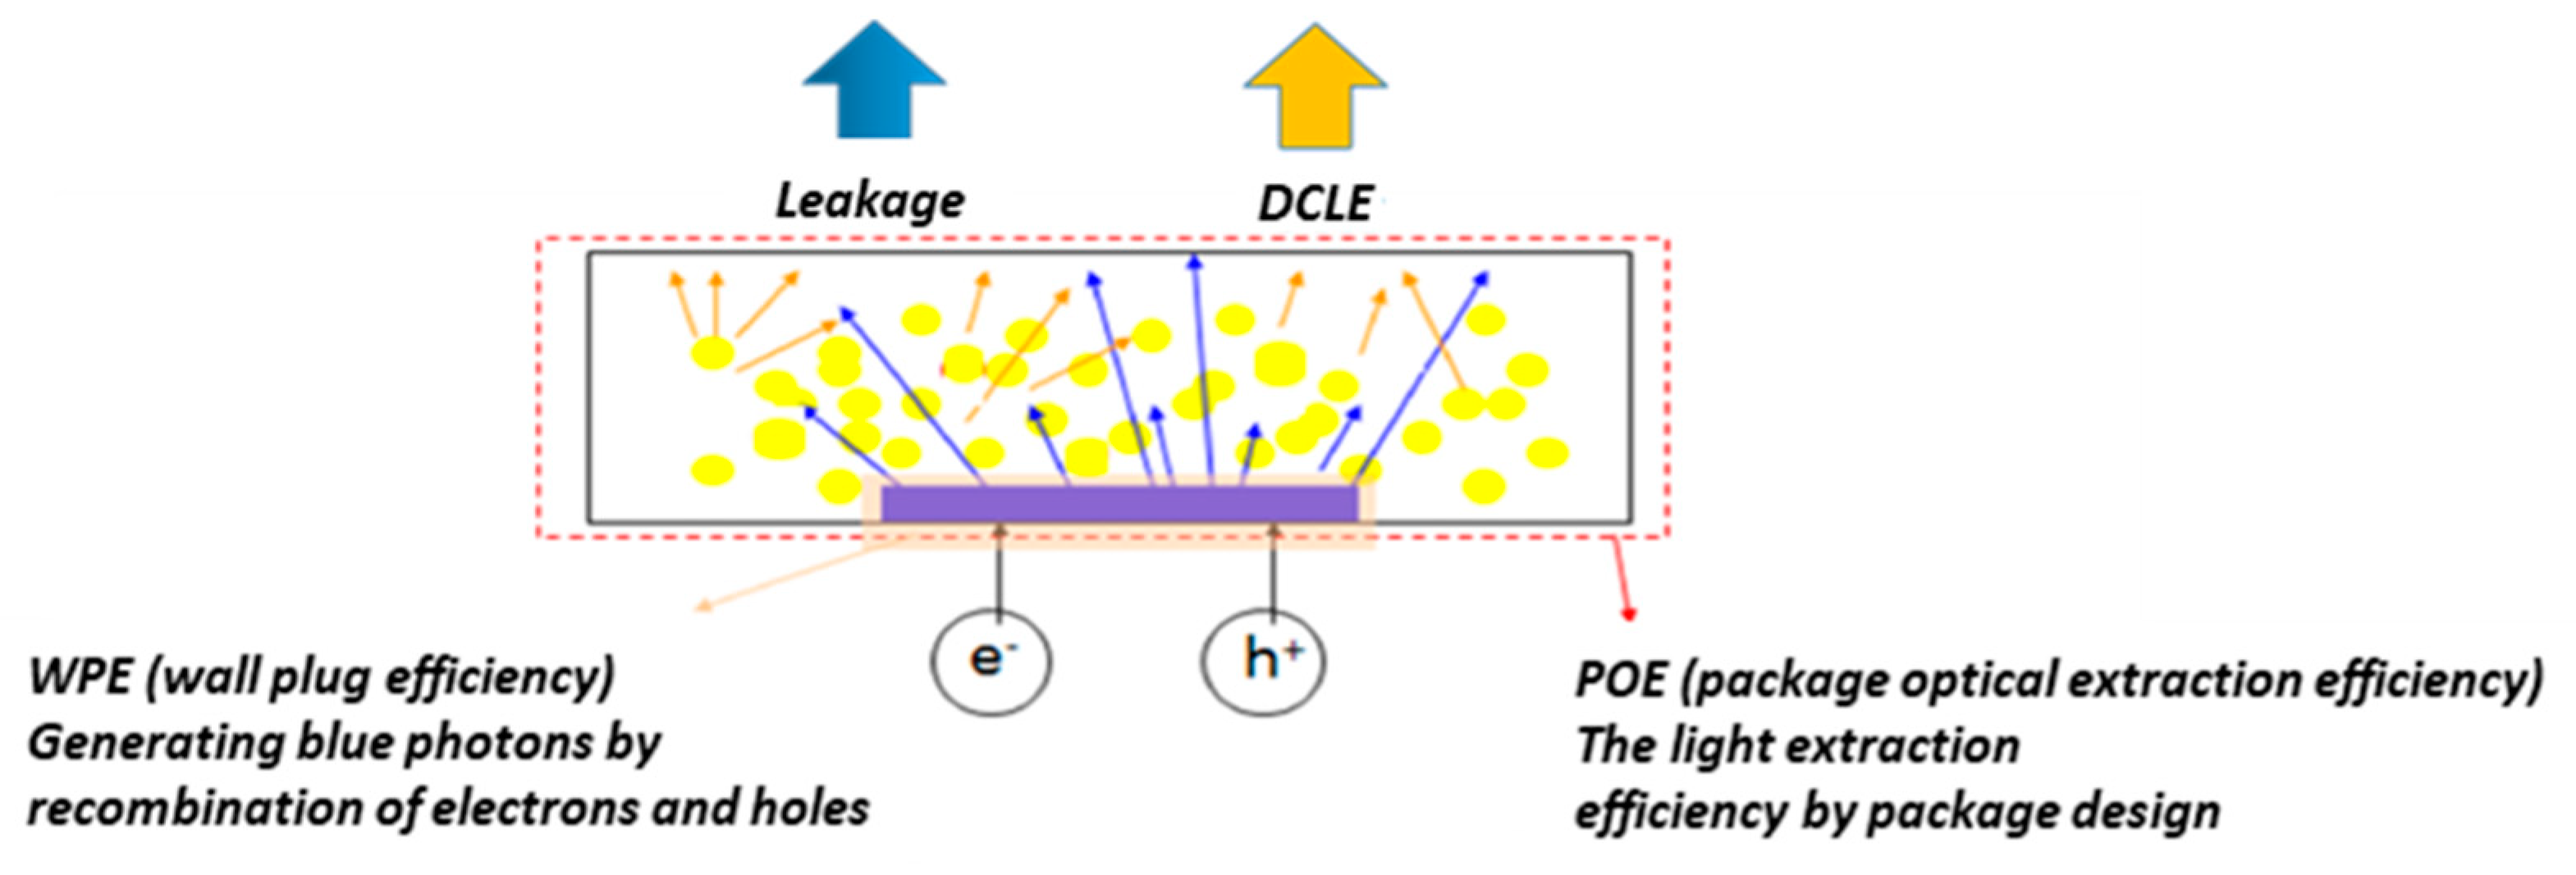
2. DCLE Concept for Phosphor Conversion System
3. Phosphor Conversion Model Based on the DCLE Concept
4. Novel Model for Phosphor Wavelength Conversion
5. Conclusions
Author Contributions
Funding
Acknowledgments
Conflicts of Interest
References
- Pimputkar, S.; Speck, J.S.; DenBaars, S.P.; Nakamura, S. Prospects for LED lighting. Nat. Photonics 2009, 3, 180. [Google Scholar] [CrossRef]
- Amano, H.; Kito, M.; Hiramatsu, K.; Akasaki, I. P-type conduction in Mg-doped GaN treated with low-energy electron beam irradiation (LEEBI). Jpn. J. Appl. Phys. 1989, 28, L2112. [Google Scholar] [CrossRef]
- Schubert, E.F.; Kim, J.K. Solid-state light sources getting smart. Science 2005, 308, 1274–1278. [Google Scholar] [CrossRef] [PubMed]
- Lin, C.C.; Liu, R.-S. Advances in phosphors for light-emitting diodes. J. Phys. Chem. Lett. 2011, 2, 1268–1277. [Google Scholar] [CrossRef] [PubMed]
- Nakamura, S.; Mukai, T.; Senoh, M. Candela-class high-brightness InGaN/AlGaN double-heterostructure blue-light-emitting diodes. Appl. Phys. Lett. 1994, 64, 1687–1689. [Google Scholar] [CrossRef]
- Nakamura, S.; Senoh, M.; Iwasa, N.; Nagahama, S.-i. High-power InGaN single-quantum-well-structure blue and violet light-emitting diodes. Appl. Phys. Lett. 1995, 67, 1868–1870. [Google Scholar] [CrossRef]
- Huang, H.-W.; Kao, C.; Chu, J.; Kuo, H.; Wang, S.; Yu, C. Improvement of InGaN-GaN light-emitting diode performance with a nano-roughened p-GaN surface. IEEE Photon. Technol. Lett. 2005, 17, 983–985. [Google Scholar] [CrossRef]
- Ling, S.-C.; Lu, T.-C.; Chang, S.-P.; Chen, J.-R.; Kuo, H.-C.; Wang, S.-C. Low efficiency droop in blue-green m-plane InGaN/GaN light emitting diodes. Appl. Phys. Lett. 2010, 96, 231101. [Google Scholar] [CrossRef]
- Krames, M.R.; Shchekin, O.B.; Mueller-Mach, R.; Mueller, G.O.; Zhou, L.; Harbers, G.; Craford, M.G. Status and future of high-power light-emitting diodes for solid-state lighting. J. Disp. Technol. 2007, 3, 160–175. [Google Scholar] [CrossRef]
- Liu, C.-Y.; Chen, K.-J.; Lin, D.-W.; Lee, C.-Y.; Lin, C.-C.; Chien, S.-H.; Shih, M.-H.; Chi, G.-C.; Chang, C.-Y.; Kuo, H.-C. Improvement of emission uniformity by using micro-cone patterned PDMS film. Opt. Express 2014, 22, 4516–4522. [Google Scholar] [CrossRef] [PubMed]
- Lin, H.-Y.; Chen, K.-J.; Wang, S.-W.; Lin, C.-C.; Wang, K.-Y.; Li, J.-R.; Lee, P.-T.; Shih, M.-H.; Li, X.; Chen, H.-M. Improvement of light quality by DBR structure in white LED. Opt. Express 2015, 23, A27–A33. [Google Scholar] [CrossRef] [PubMed]
- Chen, H.C.; Chen, K.J.; Wang, C.H.; Lin, C.C.; Yeh, C.C.; Tsai, H.H.; Shih, M.H.; Kuo, H.C.; Lu, T.C. A novel randomly textured phosphor structure for highly efficient white light-emitting diodes. Nanoscale Res. Lett. 2012, 7, 188. [Google Scholar] [CrossRef] [PubMed] [Green Version]
- Kuo, H.-C.; Hung, C.-W.; Chen, H.-C.; Chen, K.-J.; Wang, C.-H.; Sher, C.-W.; Yeh, C.-C.; Lin, C.-C.; Chen, C.-H.; Cheng, Y.-J. Patterned structure of remote phosphor for phosphor-converted white LEDs. Opt. Express 2011, 19, A930–A936. [Google Scholar] [CrossRef] [PubMed]
- Lin, H.-Y.; Wang, S.-W.; Lin, C.-C.; Chen, K.-J.; Han, H.-V.; Tu, Z.-Y.; Tu, H.-H.; Chen, T.-M.; Shih, M.-H.; Lee, P.-T. Excellent color quality of white-light-emitting diodes by embedding quantum dots in polymers material. IEEE J. Sel. Top. Quant. Electron. 2016, 22, 35–41. [Google Scholar] [CrossRef]
- Lin, H.-Y.; Sher, C.-W.; Lin, C.-H.; Tu, H.-H.; Chen, X.Y.; Lai, Y.-C.; Lin, C.-C.; Chen, H.-M.; Yu, P.; Meng, H.-F. Fabrication of Flexible White Light-Emitting Diodes from Photoluminescent Polymer Materials with Excellent Color Quality. ACS Appl. Mater. Interfaces 2017, 9, 35279–35286. [Google Scholar] [CrossRef] [PubMed]
- Sher, C.-W.; Lin, C.-H.; Lin, H.-Y.; Lin, C.-C.; Huang, C.-H.; Chen, K.-J.; Li, J.-R.; Wang, K.-Y.; Tu, H.-H.; Fu, C.-C. A high quality liquid-type quantum dot white light-emitting diode. Nanoscale 2015, 8, 1117–1122. [Google Scholar] [CrossRef] [PubMed]
- Sher, C.-W.; Chen, K.-J.; Lin, C.-C.; Han, H.-V.; Lin, H.-Y.; Tu, Z.-Y.; Tu, H.-H.; Honjo, K.; Jiang, H.-Y.; Ou, S.-L. Large-area, uniform white light LED source on a flexible substrate. Opt. Express 2015, 23, A1167–A1178. [Google Scholar] [CrossRef] [PubMed]
- Lee, S.J. Analysis of light-emitting diodes by Monte Carlo photon simulation. Appl. Opt. 2001, 40, 1427–1437. [Google Scholar] [CrossRef] [PubMed]
- Sommer, C.; Reil, F.; Krenn, J.R.; Hartmann, P.; Pachler, P.; Tasch, S.; Wenzl, F.P. The impact of inhomogeneities in the phosphor distribution on the device performance of phosphor-converted high-power white LED light sources. J. Light. Technol. 2010, 28, 3226–3232. [Google Scholar] [CrossRef]
- Ting, D.Z.; McGill, T.C. Monte Carlo simulation of light-emitting diode light-extraction characteristics. Opt. Eng. 1995, 34, 3545–3554. [Google Scholar] [CrossRef]
- Borbély, Á.; Johnson, S.G. Performance of phosphor-coated light-emitting diode optics in ray-trace simulations. Opt. Eng. 2005, 44, 111308. [Google Scholar] [CrossRef]
- Liu, Z.; Wang, K.; Luo, X.; Liu, S. Precise optical modeling of blue light-emitting diodes by Monte Carlo ray-tracing. Opt. Express 2010, 18, 9398–9412. [Google Scholar] [CrossRef] [PubMed]
- Liu, Z.-Y.; Liu, S.; Wang, K.; Luo, X.-B. Studies on optical consistency of white LEDs affected by phosphor thickness and concentration using optical simulation. IEEE Trans. Compon. Packag. Technol. 2010, 33, 680–687. [Google Scholar] [CrossRef]
- Yang, T.-H.; Chen, C.-C.; Chen, C.-Y.; Chang, Y.-Y.; Sun, C.-C. Essential factor for determining optical output of phosphor-converted LEDs. IEEE Photon. J. 2014, 6, 1–9. [Google Scholar] [CrossRef]
- Kang, D.-Y.; Wu, E.; Wang, D.-M. Modeling white light-emitting diodes with phosphor layers. Appl. Phys. Lett. 2006, 89, 231102. [Google Scholar] [CrossRef]
- Sun, C.-C.; Chen, C.-Y.; He, H.-Y.; Chen, C.-C.; Chien, W.-T.; Lee, T.-X.; Yang, T.-H. Precise optical modeling for silicate-based white LEDs. Opt. Express 2008, 16, 20060–20066. [Google Scholar] [CrossRef] [PubMed]
- Yang, T.-H.; Chen, C.-Y.; Chang, Y.-Y.; Glorieux, B.; Peng, Y.-N.; Chen, H.-X.; Chung, T.-Y.; Lee, T.-X.; Sun, C.-C. Precise simulation of spectrum for green emitting phosphors pumped by a blue LED die. IEEE Photon. J. 2014, 6, 1–10. [Google Scholar]
- Sommer, C.; Wenzl, F.-P.; Hartmann, P.; Pachler, P.; Schweighart, M.; Tasch, S.; Leising, G. Tailoring of the color conversion elements in phosphor-converted high-power LEDs by optical simulations. IEEE Photon. Technol. Lett. 2008, 20, 739–741. [Google Scholar] [CrossRef]
- Adachi, S. Photoluminescence properties of Mn 4+-activated oxide phosphors for use in white-LED applications: a review. J. Lumin. 2018, 201, 263–281. [Google Scholar] [CrossRef]


| Leakage Fraction | 0 | 0.1 | 0.2 | 0.3 | 0.4 | 0.5 | 0.6 | 0.7 | 0.8 | 0.9 | 1 |
| Radiant Flux (mW) | 53.3 | 55.4 | 57.4 | 59.5 | 61.6 | 63.6 | 65.7 | 67.78 | 69.9 | 72 | 74 |
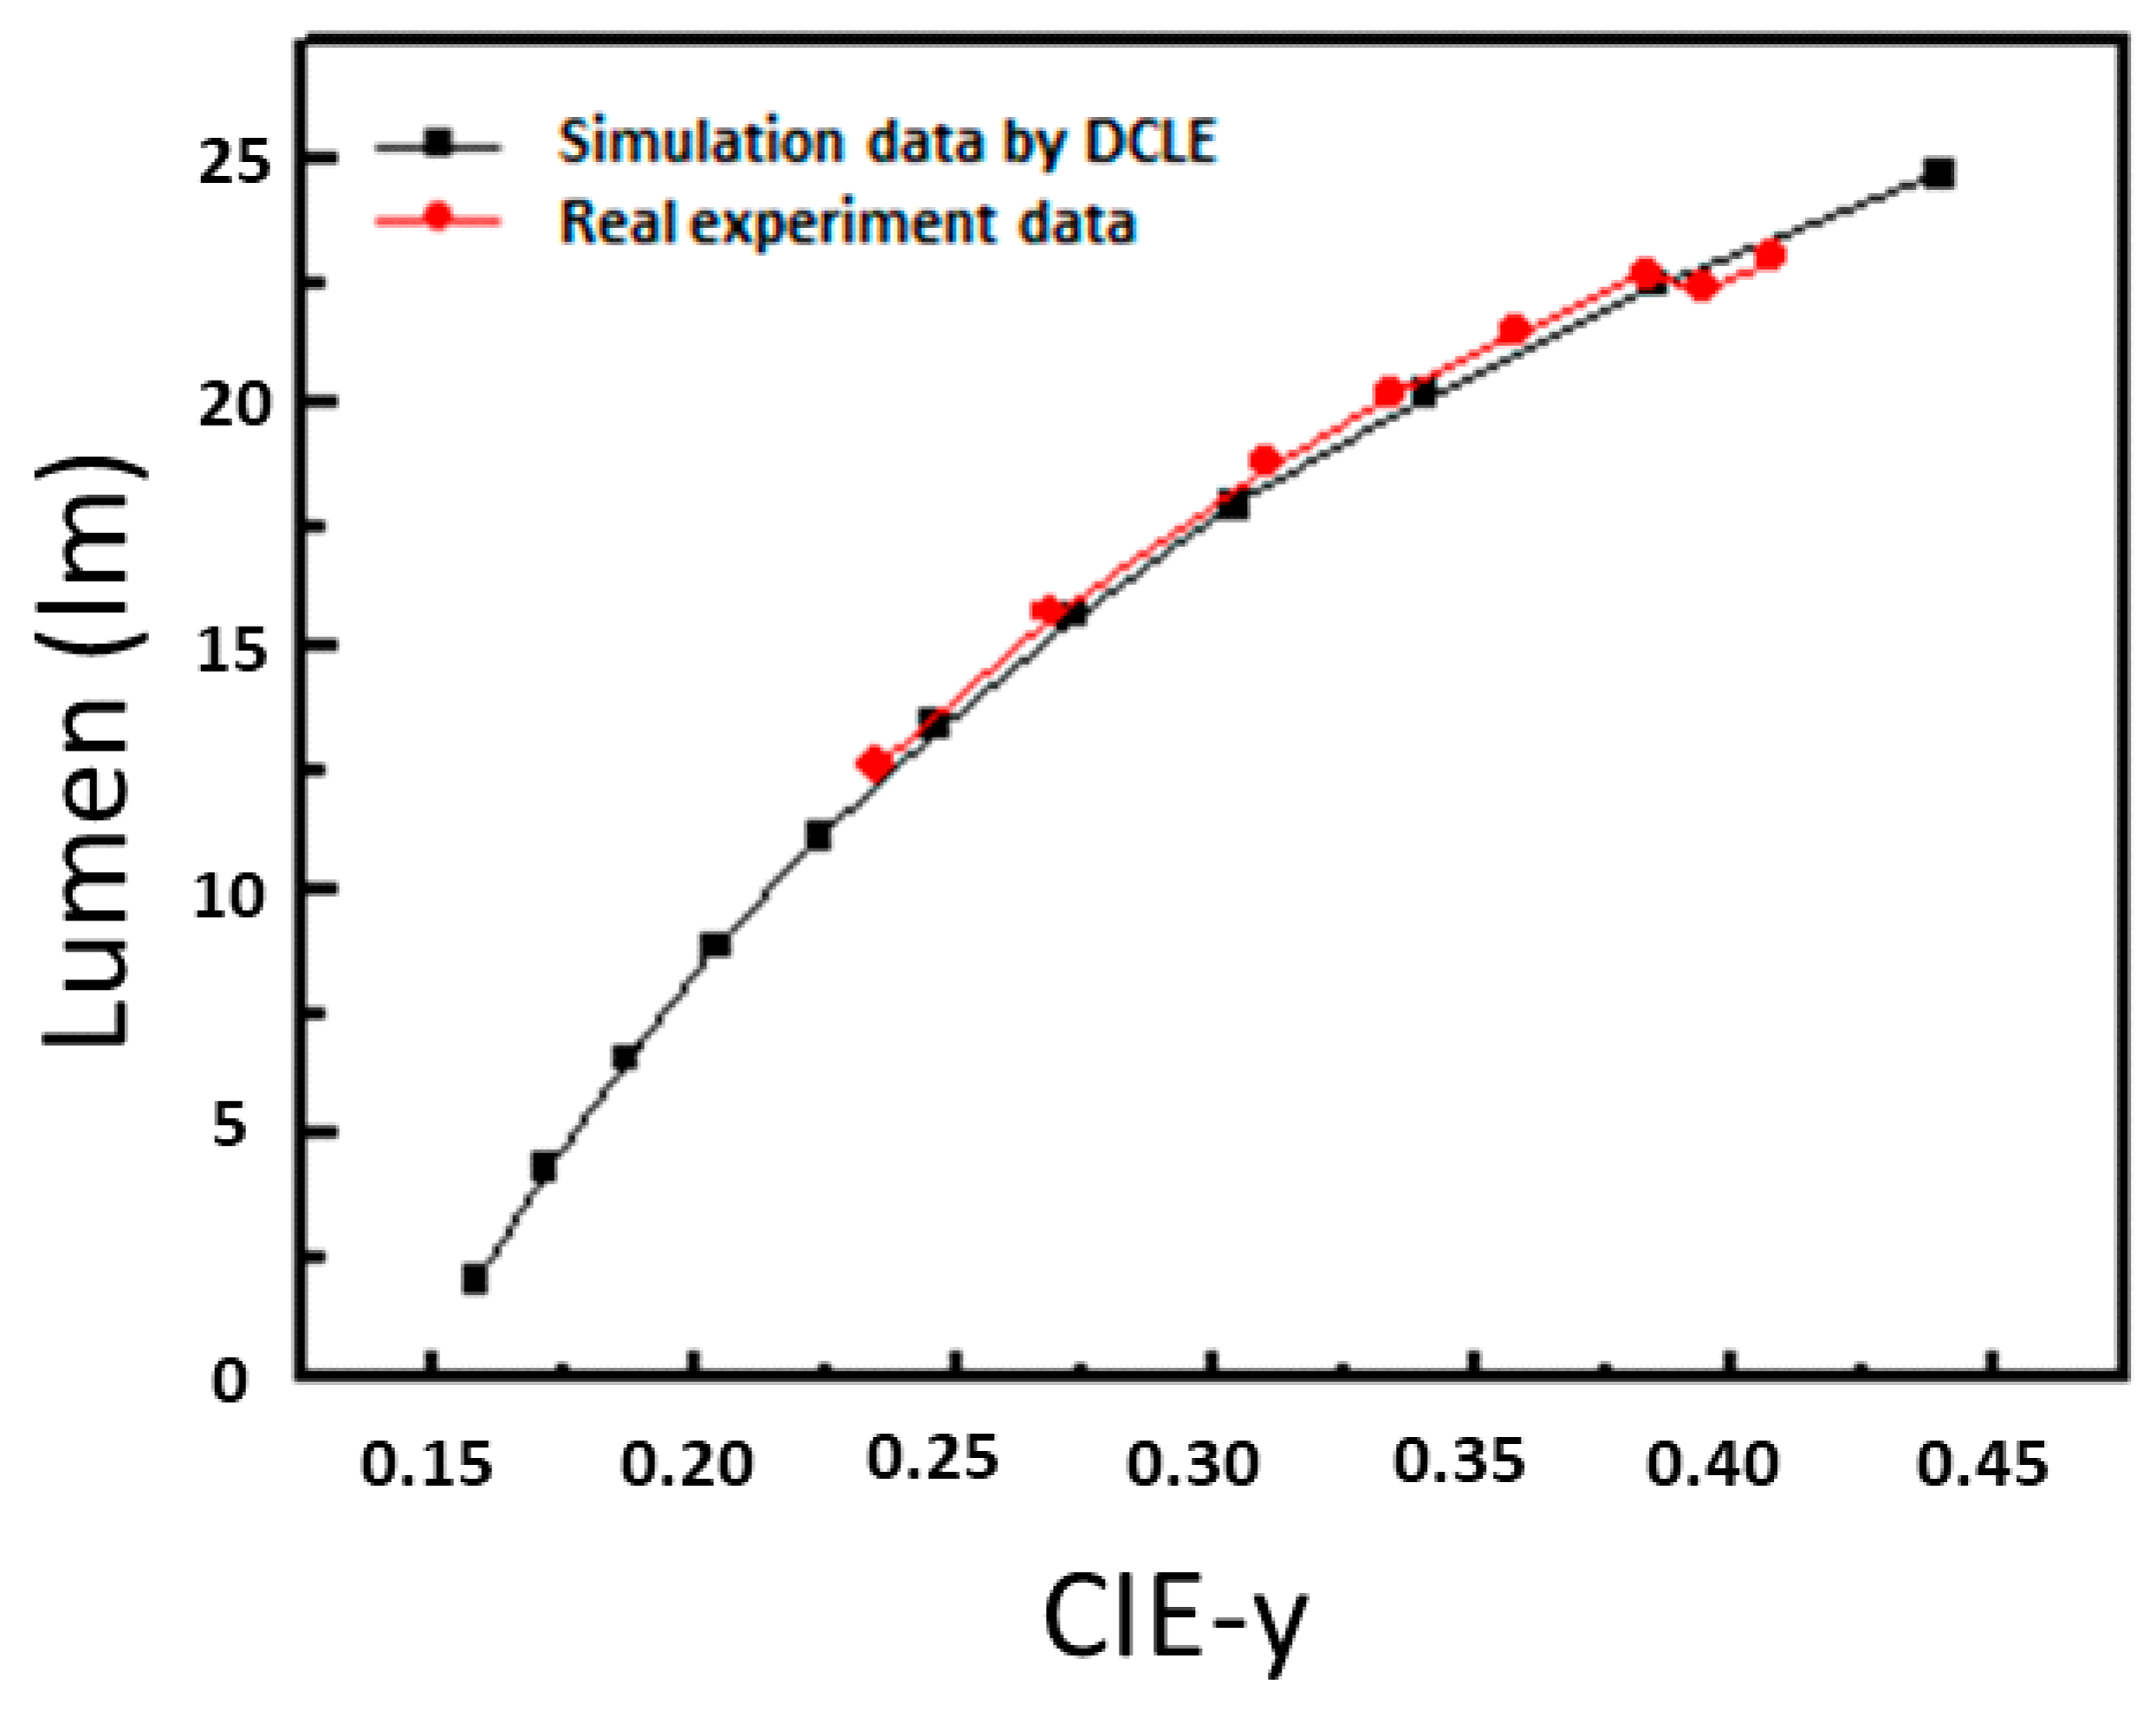
| Luminous Flux (lm) | 24.7 | 22.5 | 20.2 | 17.9 | 15.7 | 13.4 | 11.1 | 8.9 | 6.6 | 4.3 | 2.1 |
| CIE-x | 0.439 | 0.384 | 0.340 | 0.304 | 0.273 | 0.247 | 0.224 | 0.204 | 0.167 | 0.172 | 0.158 |
| CIE-y | 0.543 | 0.441 | 0.359 | 0.291 | 0.234 | 0.186 | 0.143 | 0.107 | 0.075 | 0.046 | 0.021 |
| Material | YAG | Silicate | ||
|---|---|---|---|---|
| w (%) | At | ln(At) | At | ln(At) |
| 10% | 14% | −1.9661 | 9.86% | −2.3166 |
| 15% | 14.6% | −1.9241 | 13.4% | −2.2164 |
| 20% | 15.3% | −1.8770 | 12.51% | −2.0786 |
| 25% | 15.8% | −1.8451 | 12.51% | −2.0010 |
| 30% | 16.26% | −1.8159 | 14.71% | −1.9167 |
© 2018 by the authors. Licensee MDPI, Basel, Switzerland. This article is an open access article distributed under the terms and conditions of the Creative Commons Attribution (CC BY) license (http://creativecommons.org/licenses/by/4.0/).
Share and Cite
Lin, C.-H.; Huang, C.-H.; Pai, Y.-M.; Lee, C.-F.; Lin, C.-C.; Sun, C.-W.; Chen, C.-H.; Sher, C.-W.; Kuo, H.-C. Novel Method for Estimating Phosphor Conversion Efficiency of Light-Emitting Diodes. Crystals 2018, 8, 442. https://doi.org/10.3390/cryst8120442
Lin C-H, Huang C-H, Pai Y-M, Lee C-F, Lin C-C, Sun C-W, Chen C-H, Sher C-W, Kuo H-C. Novel Method for Estimating Phosphor Conversion Efficiency of Light-Emitting Diodes. Crystals. 2018; 8(12):442. https://doi.org/10.3390/cryst8120442
Chicago/Turabian StyleLin, Chih-Hao, Che-Hsuan Huang, Yung-Min Pai, Chung-Fu Lee, Chien-Chung Lin, Chia-Wei Sun, Cheng-Huan Chen, Chin-Wei Sher, and Hao-Chung Kuo. 2018. "Novel Method for Estimating Phosphor Conversion Efficiency of Light-Emitting Diodes" Crystals 8, no. 12: 442. https://doi.org/10.3390/cryst8120442