Layered Indium Selenide under High Pressure: A Review


Departamento de Física Aplicada-ICMUV, Malta-Consolider Team, Universitat de València, 46100 Burjassot, Spain
Crystals 2018, 8(5), 206; https://doi.org/10.3390/cryst8050206
Submission received: 11 April 2018
/
Revised: 2 May 2018
/
Accepted: 7 May 2018
/
Published: 9 May 2018
(This article belongs to the Special Issue High-Pressure Studies of Crystalline Materials)
Abstract
:This paper intends a short review of the research work done on the structural and electronic properties of layered Indium Selenide (InSe) and related III–VI semiconductors under high pressure conditions. The paper will mainly focus on the crucial role played by high pressure experimental and theoretical tools to investigate the electronic structure of InSe. This objective involves a previous revision of results on the pressure dependence of the InSe crystal structure and related topics such as the equation of state and the pressure-temperature crystal phase diagram. The main part of the paper will be devoted to reviewing the literature on the optical properties of InSe under high pressure, especially the absorption experiments that led to the identification of the main optical transitions, and their assignment to specific features of the electronic structure, with the help of modern first-principles band structure calculations. In connection with these achievements we will also review relevant results on the lattice dynamical, dielectric, and transport properties of InSe, as they provided very useful supplementary information on the electronic structure of the material.
1. Introduction
Layered Indium Selenide (InSe) has been the object of scientific interest for nearly 50 years. Early studies focused on the investigation of the effect of crystal anisotropy on its transport and optical properties [1,2]. The availability of high-quality large single crystals [3], and the possibility of n and p doping [4], encouraged studies on its applications in photovoltaic solar energy conversion resulting in solar cells with conversion efficiencies of up to 10% [5,6]. Later on, several groups showed possible applications to nonlinear optical devices in the mid and far infrared spectrum [7]. The development of the Van der Waals epitaxy in the early 1990s [8], with the increase in the thin film crystal quality, brought some renewed interest in photovoltaic devices [9]. More recently, as the interest in 2D materials was triggered by graphene’s remarkable properties [10], InSe has become the object of intensive research as an ideal semiconductor for a large variety of single layer nano-devices [11,12,13,14].
The historical role of high pressure techniques in the investigation of the electronic structure of semiconductors can be hardly overstated. As early as 1961, Paul’s empirical rule [15] on the pressure coefficients of electronic transitions was a crucial tool to unravel the order of the conduction bands in zinc-blende semiconductors. The development of the diamond anvil cell (DAC) [16], and the ruby pressure scale [17,18], opened the way to the use of a large variety of optical spectroscopy and X-ray structural techniques under high pressure conditions. Accurate optical absorption spectra could be so obtained and quantitatively interpreted using sophisticated physical models, as reviewed by Goñi and Syassen [19]. The use of DAC in third generation synchrotron radiation facilities also produced very accurate X-ray diffraction and absorption spectra under high pressure, giving access to precise Equations of State (EOS) and crystal phase diagrams, as reviewed by Nelmes and McMahon [20]. Those experiment results have therefore become a rigorous experimental test for modern ab-initio electronic structure calculations [21].
In this context, high pressure studies have been a tool of choice for investigating the electronic structure of InSe and related III–VI layered semiconductors (GaS, GaSe, and GaTe). This paper reviews the literature on this subject in the last 40 years. This review mainly focuses on InSe, but, when relevant for the discussion, results on other III–VI semiconductors will be also presented. Section 2 is devoted to results on the pressure evolution of InSe crystal structure, its EOS, and its pressure-temperature crystal phase diagram. Section 3 will be devoted to studies on InSe electronic structure under pressure, showing how optical absorption and reflection experiments have contributed to clarifying the nature of electronic states and transitions, with the invaluable aid of ab-initio band structure calculations. Section 4 will be devoted to the literature on the lattice dynamics of low and high pressure InSe phases. Section 5 will discuss some results on the dielectric properties on layered InSe under pressure, and its correlation to electronic transitions and ionicity of the material. Finally, Section 6 will review some papers on the transport properties of InSe under high pressure, which have given supplementary information on relevant aspects of its electronic structure.
2. Crystal Structure, EOS, and Pressure-Temperature Phase Diagram of InSe
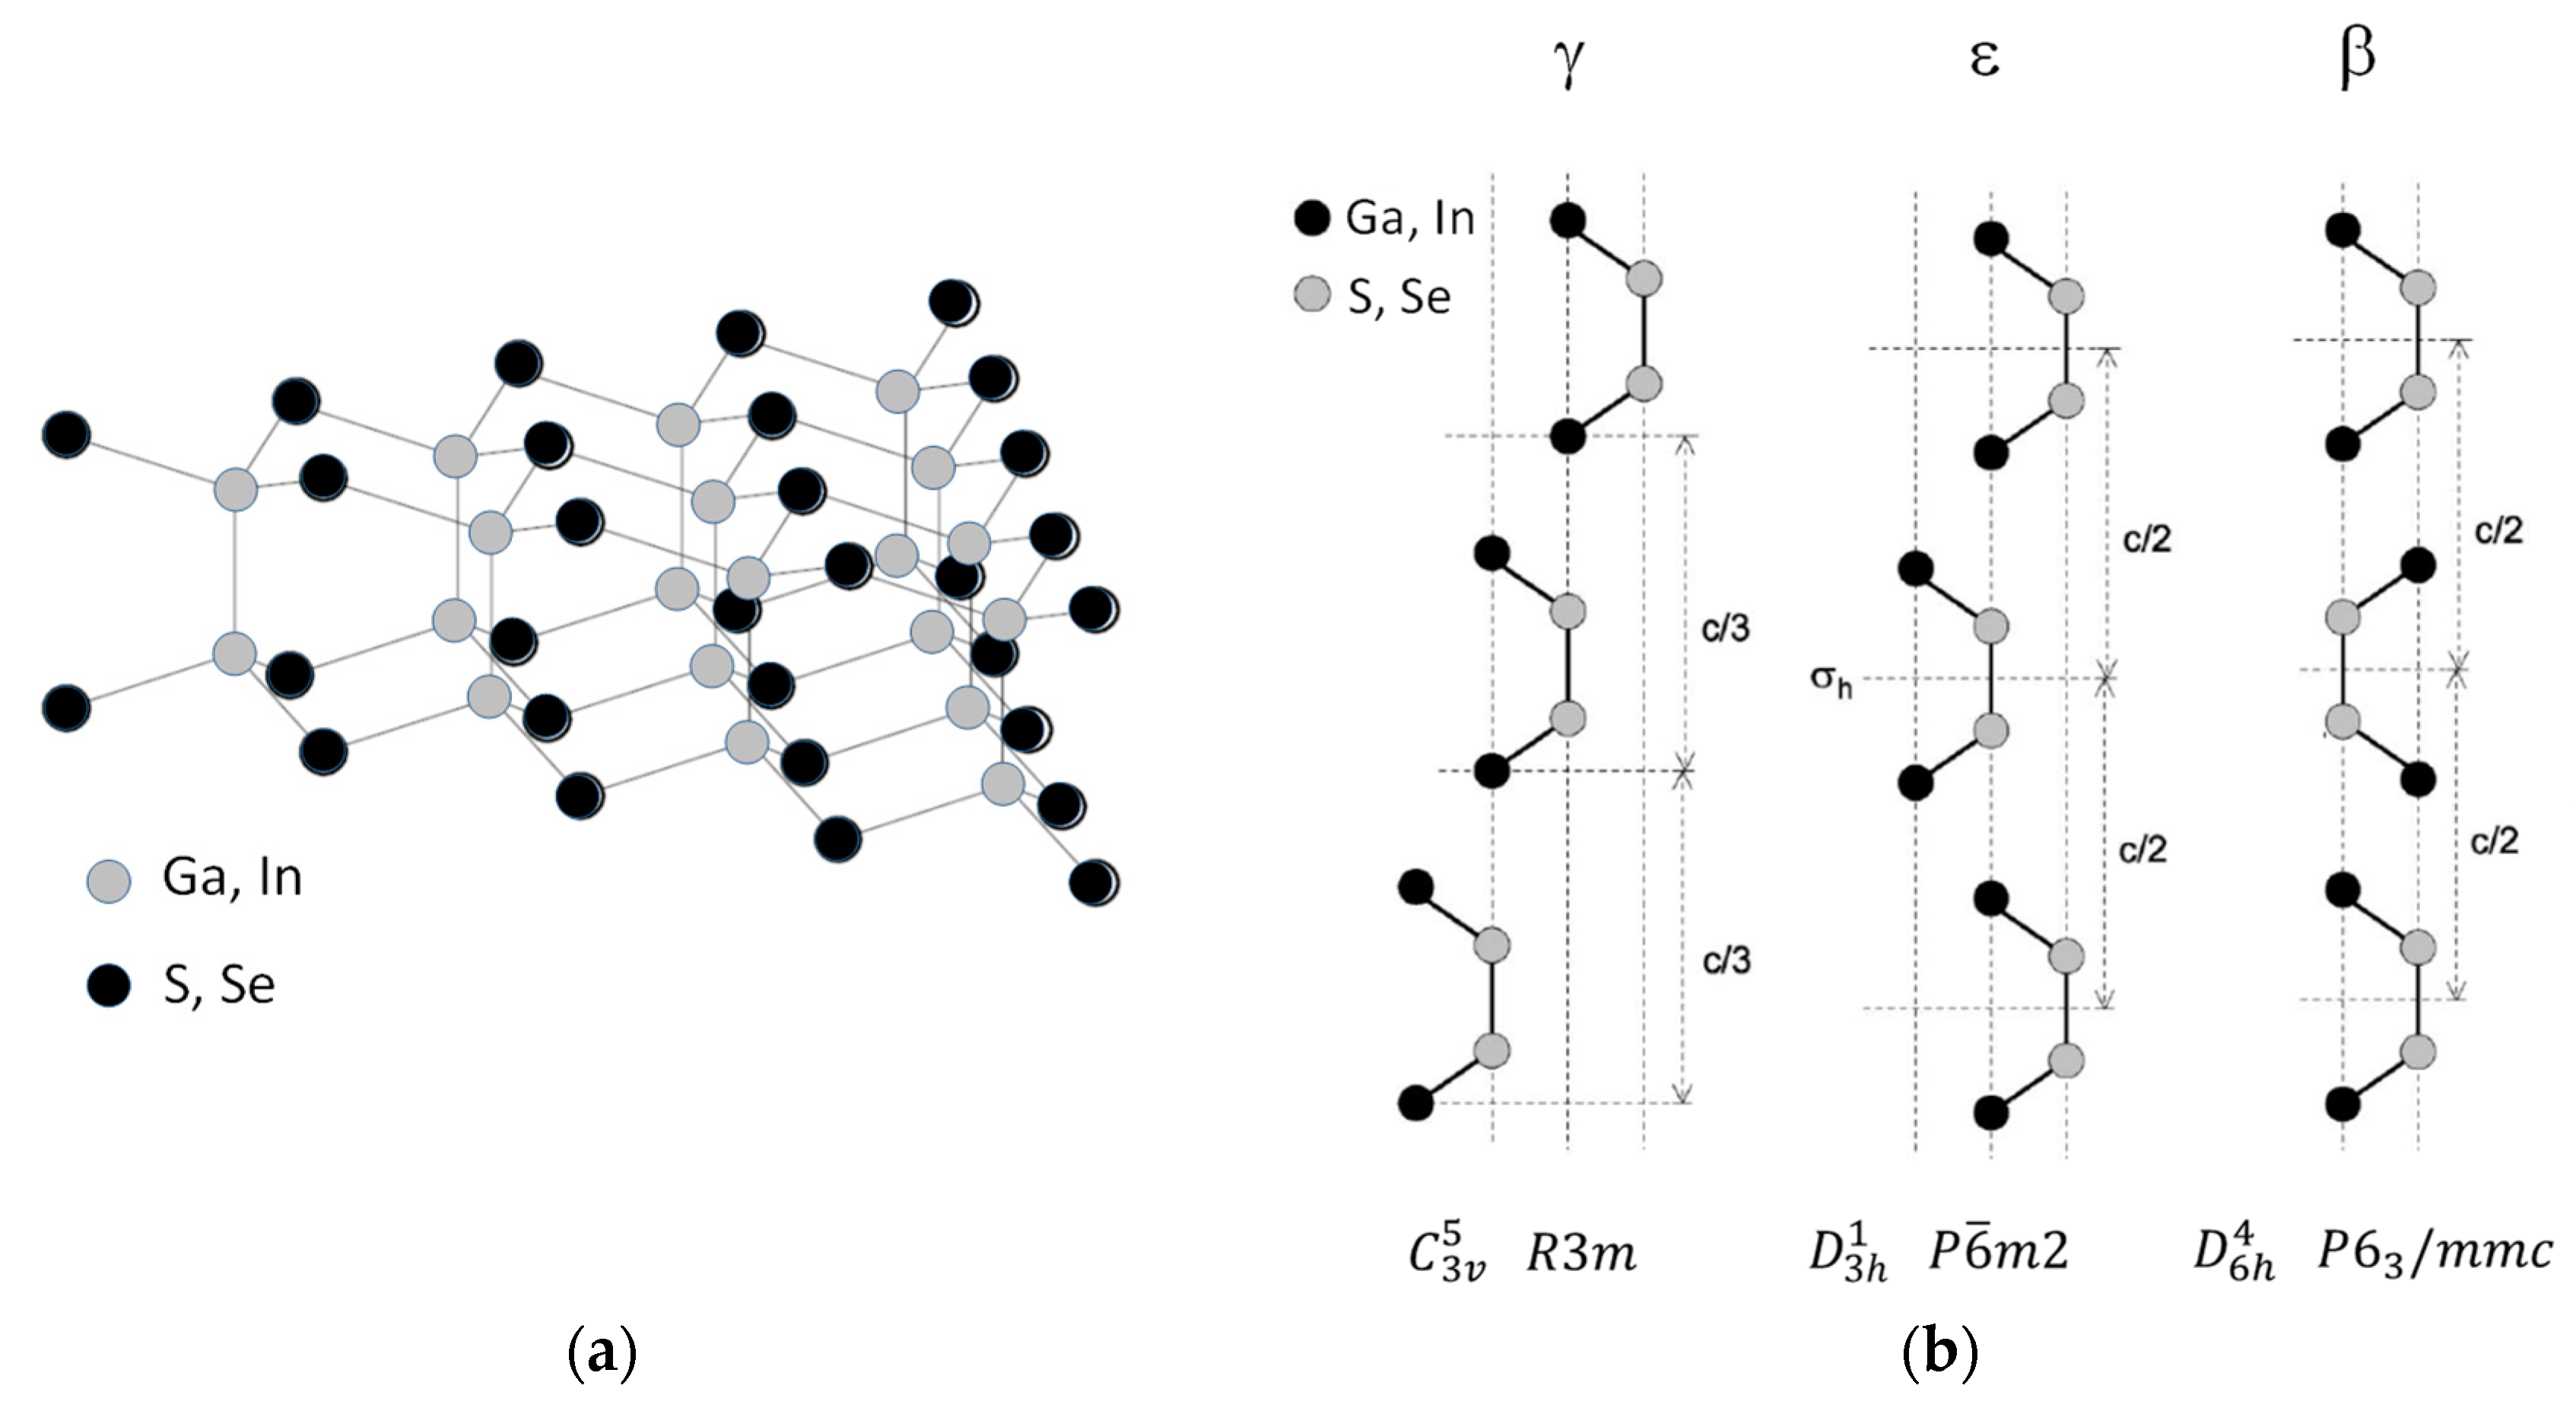
At ambient conditions, InSe crystallizes in the layered rhombohedral phase [22], built as a stack of 2D layers formed by two honeycomb In-Se sheets bound by strong In-In covalent bonds, as shown in Figure 1a. As in other semiconductors of the III–VI family (GaSe, GaS), layers are bound by weak Van der Waals forces. Several polytypes have been described, with different layer stacking sequence, as shown in Figure 1b. Four stacking sequences have been detected for the related compound GaSe [23]. InSe single crystals grown by the Bridgmann method [3] crystallize at ambient conditions in the so-called γ-polytype (InSe-I), with two chemical formulas per primitive unit cell, which belongs to the space group C3v (R3m) [22]. Most of the high-pressure experiments here discussed have been obtained with γ-InSe samples. A few results on lattice dynamics in ε-InSe under high pressure will be discussed in Section 4.
A first approach to the EOS of γ-InSe at low pressure, through ultrasonic measurement, was done by Gatulle et al. [24], who reported the pressure dependence of all elastic moduli, as well as the compressibility tensor, whose components are the linear compressibilities parallel () and perpendicular () to the c-axis. Values are given in Table 1, exhibiting a large anisotropy ratio (). It must be stressed that the compressibility values obtained from ultrasonic measurements are affected by very large relative errors (Table 1).
In a paper on the optical properties of InSe and GaSe under pressure, Kuroda et al. [25] report the pressure dependence of the c parameter of γ-InSe, as obtained from a non-published X-ray diffraction (XRD) experiment in DAC. They assumed a Murnaghan-type [26] pressure dependence for the c hexagonal unit cell parameter
In which B0 is the bulk modulus and B0′ is its pressure derivative. By assuming and taking the compressibility value from Ref. [22], they estimate the pressure derivative of the bulk modulus B0′ = 10.8, stressing that such high value illustrates the extremely nonlinear pressure behavior of the material compression along the c-axis.
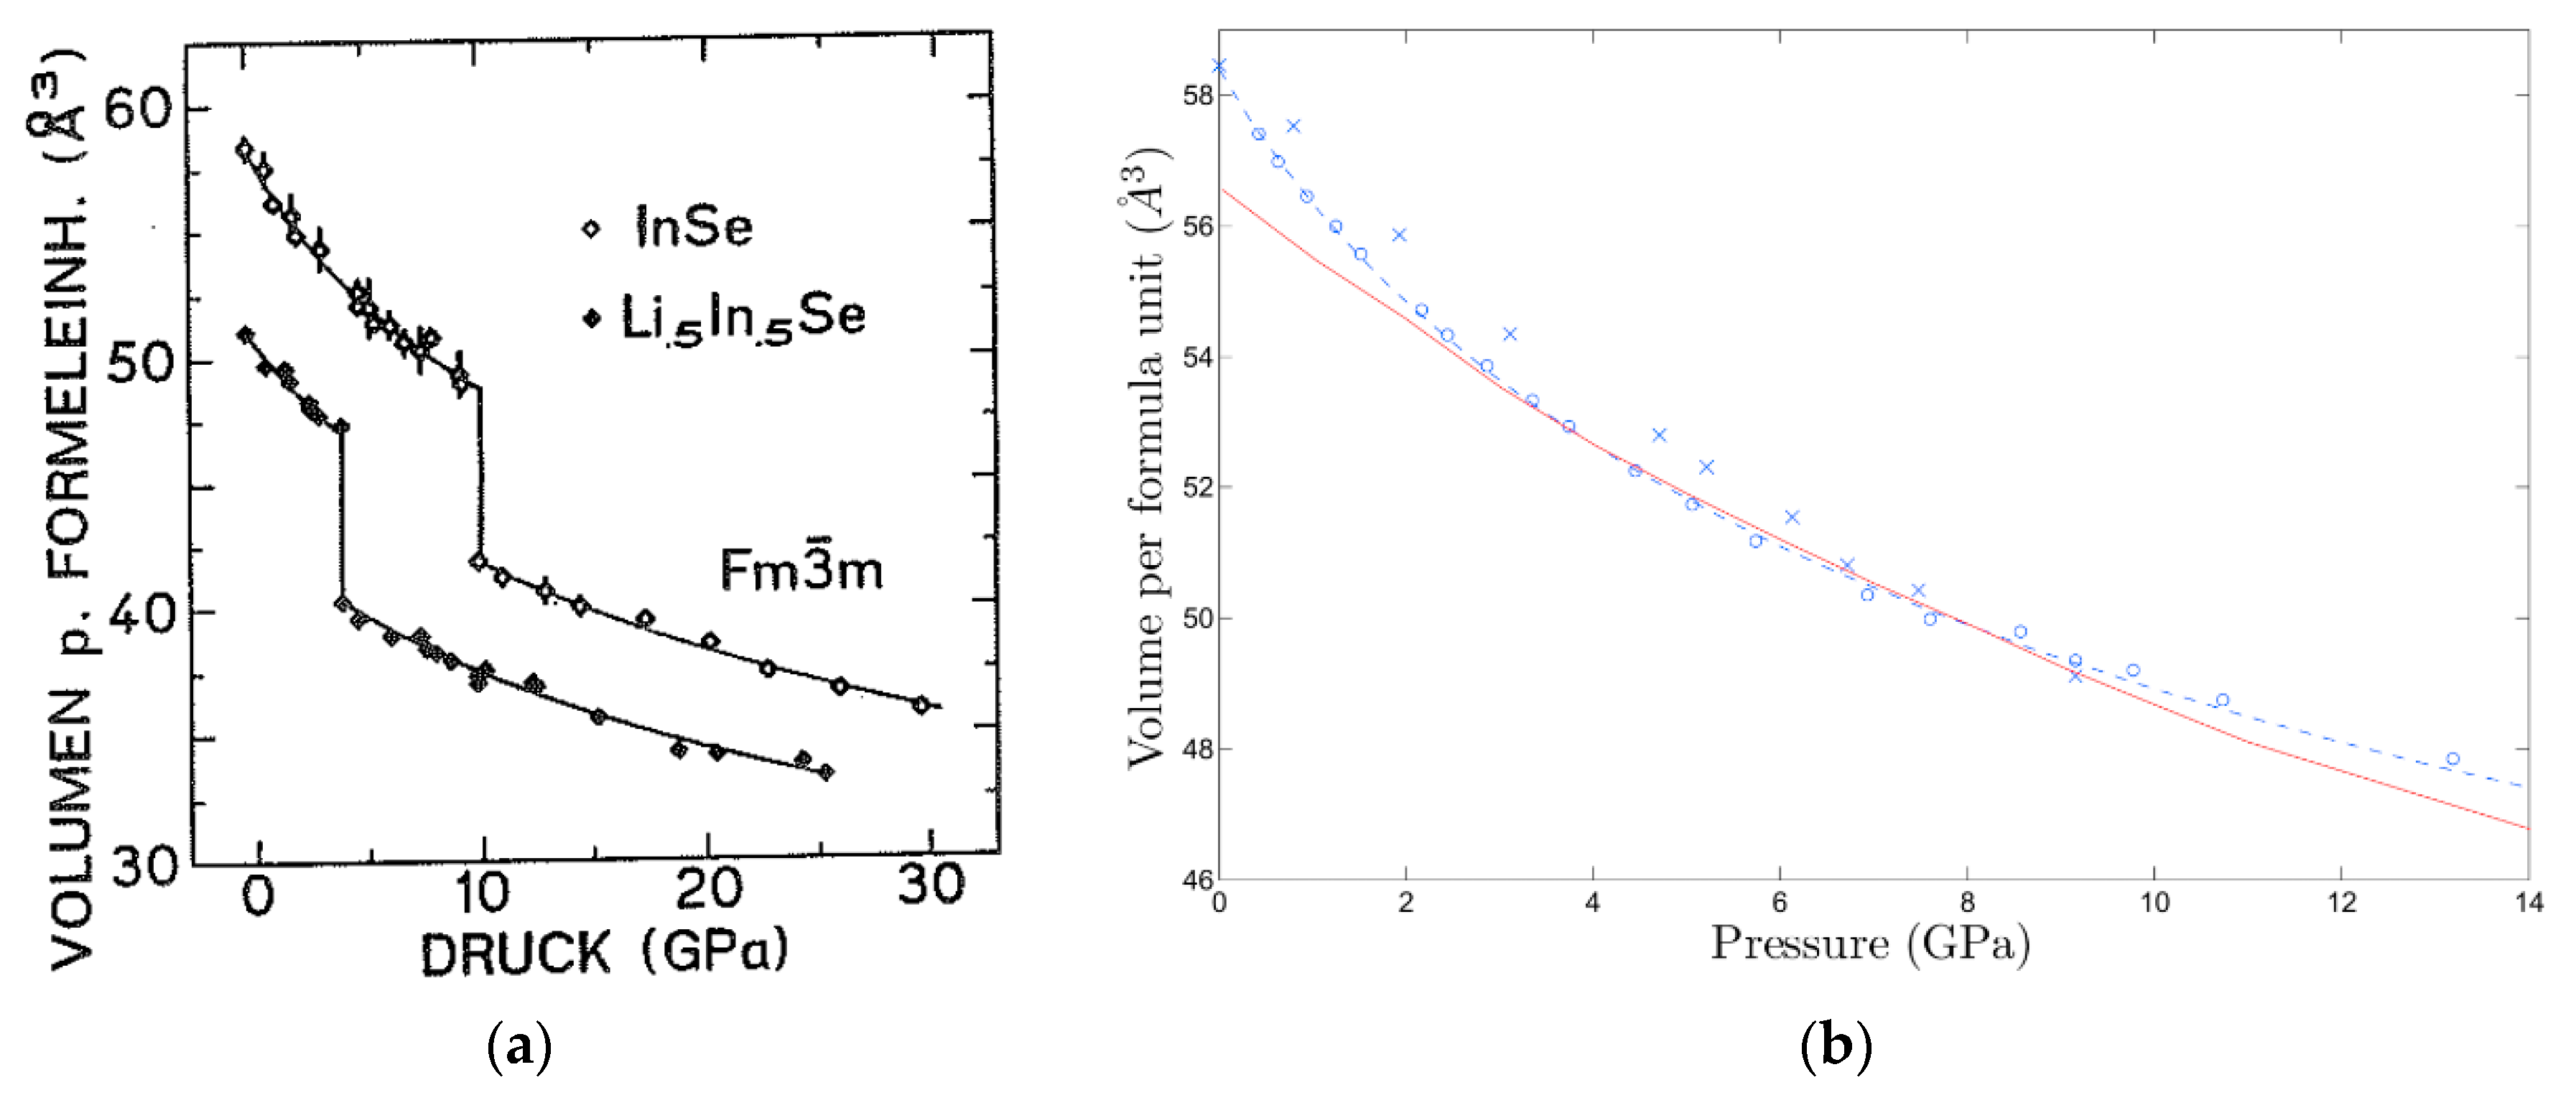
Schwartz et al. [27,28] reported for the first time the EOS and high-pressure crystal phase diagram of γ-InSe up to 30 GPa. From a powder XRD experiment in DAC, using an X-ray tube as source, they obtained the EOS of the layered phase and showed that it is stable up to 10 GPa (Figure 1a). Experimental data were interpreted through the Murnaghan EOS [26]
yielding the bulk modulus and its derivative given in Table 1. The anisotropy ratio of the low-pressure compressibility tensor, , as obtained from the pressure dependence of the a and c parameters, is much smaller than the one resulting from ultrasound experiments [24] (Table 1). Single crystal X-ray diffraction [29] and X-ray in DAC, using a synchrotron source, provided a more detailed picture of the low-pressure range of the EOS, as shown in Figure 1b. The values of the EOS parameters and compressibility tensor so obtained are affected by smaller relative errors, as shown in Table 1. In the low pressure range a larger compressibility is observed, as compared to the previous powder XRD results [25,27,28], as shown in Figure 2b. It must be emphasized that, in spite of the dispersion of the values given in Table 1, they are all compatible within the experimental error. When the low-pressure compressibility is determined using XRD data for P < 1 GPa, the fitting procedure yields larger compressibility values, closer to those of Reference [24] but with a very large relative error, larger than 50%, associated with the large relative errors of pressure, as determined through the ruby scale in the very low-pressure range (P < 1 GPa) [17,18].
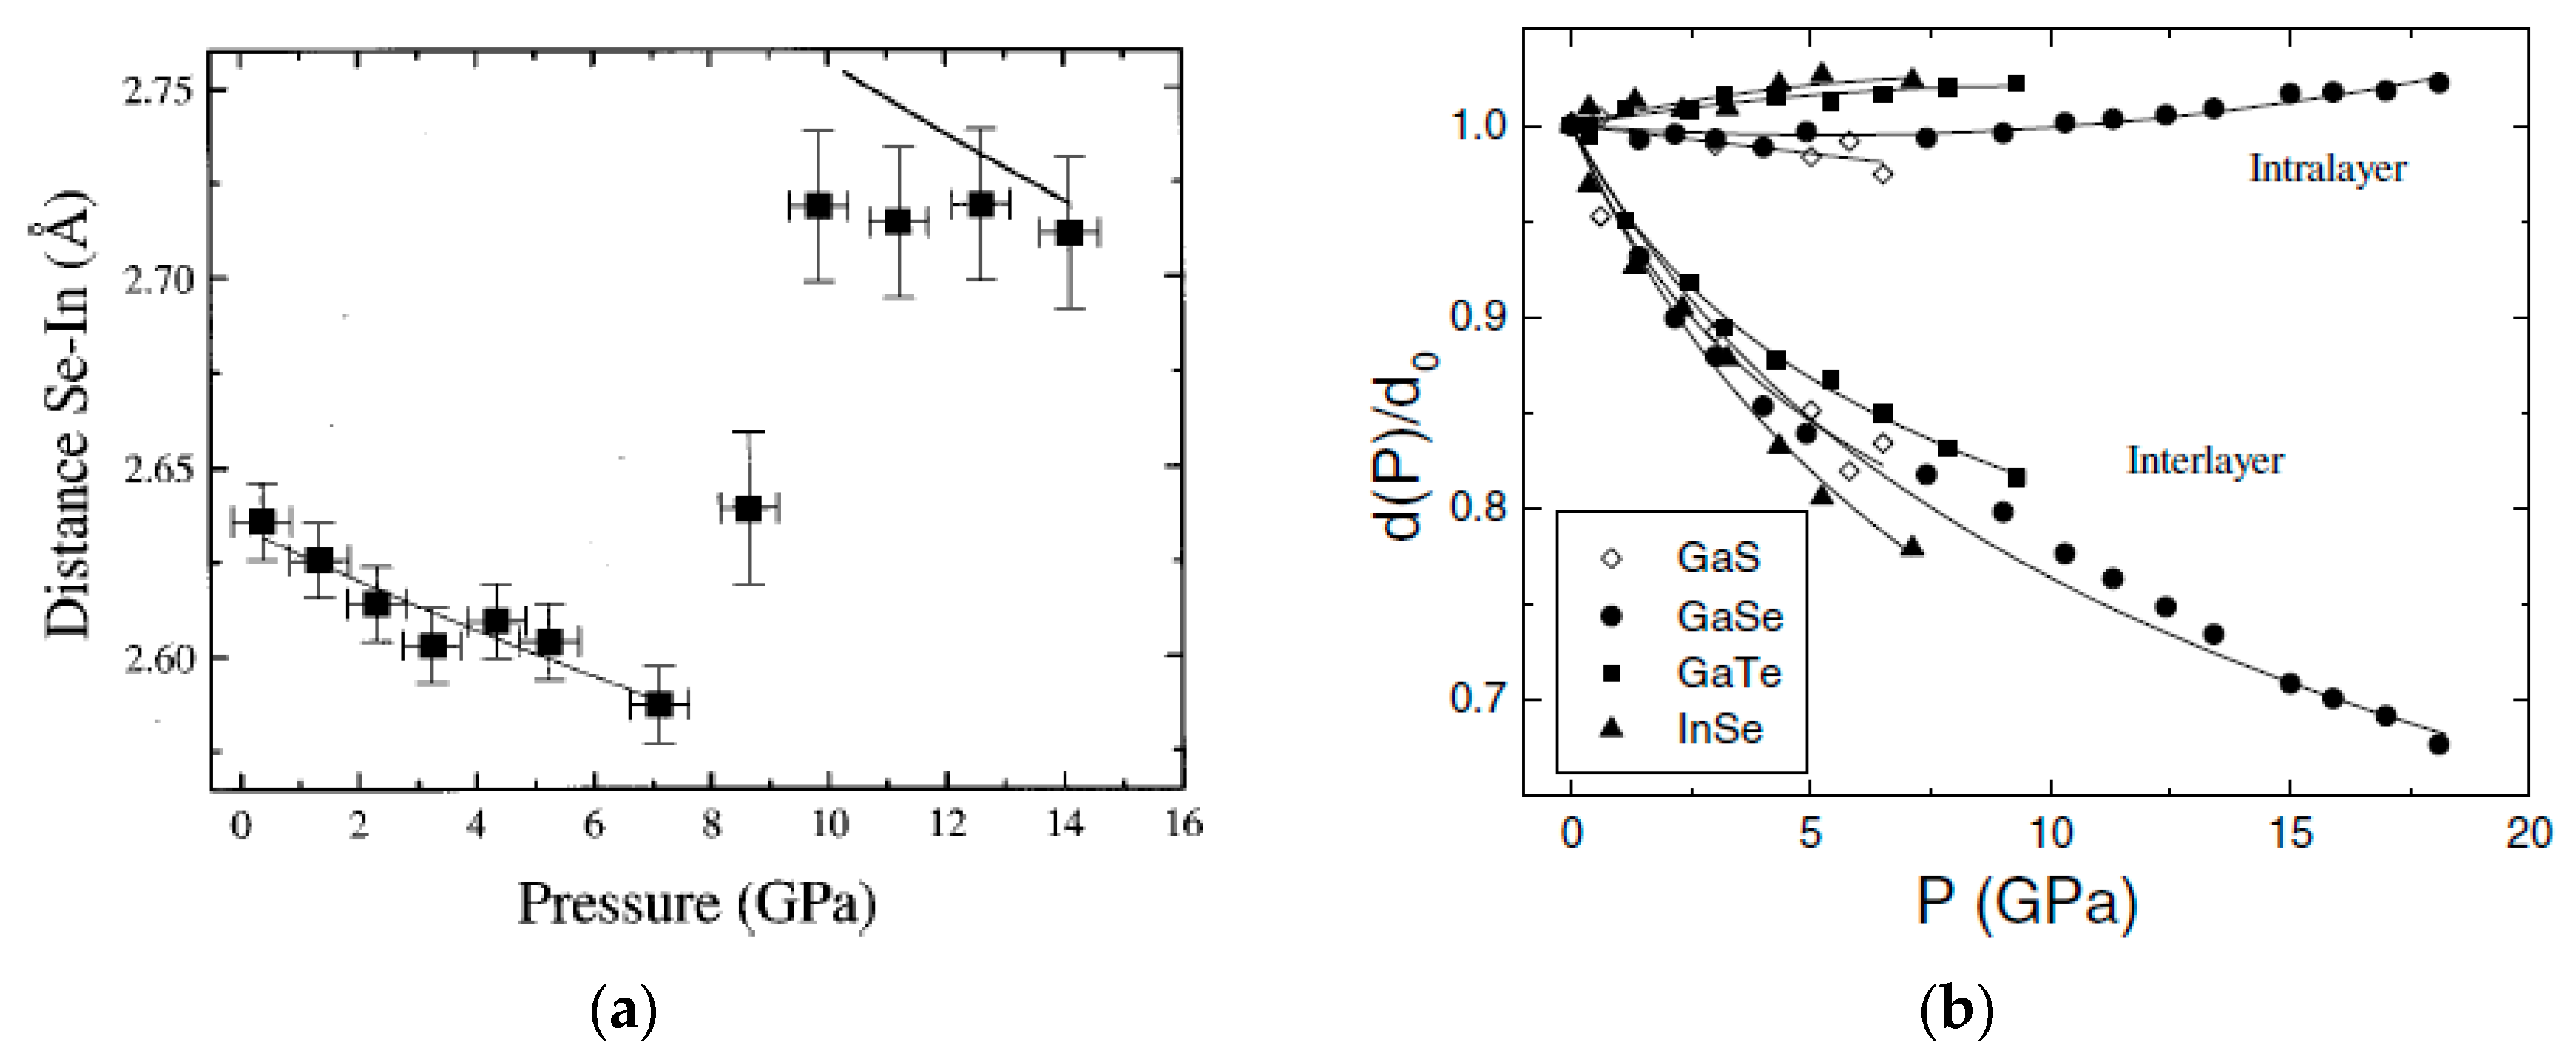
Results of X-ray absorption (XAS) [31] in DAC, using γ-InSe single crystals, added relevant information concerning the evolution of the whole crystal structure. Figure 3a shows the pressure dependence of the Se-In bond-length (dIn-Se), as obtained from XAS measurements. Compared with the pressure dependence of the a-parameter [27,28,29], it turns out that the linear compressibility of a is much larger than that of dIn-Se. This implies that the angle of the In-Se covalent bond with the layer plane increases with pressure. The combined analysis of XRD and XAS results in DAC for other III–VI layered compounds (GaS, GaSe. GaTe) [32,33,34,35,36] showed that this behavior can result in an unexpected effect: the thickness of the layer can actually increase under pressure, as shown in Figure 3b [37]. This behavior is very relevant to the discussion of the reliability of deformation potential models that were proposed to give quantitative account of the extremely non-linear pressure dependence of the bandgap in III–VI semiconductors, as we will discuss in Section 3.
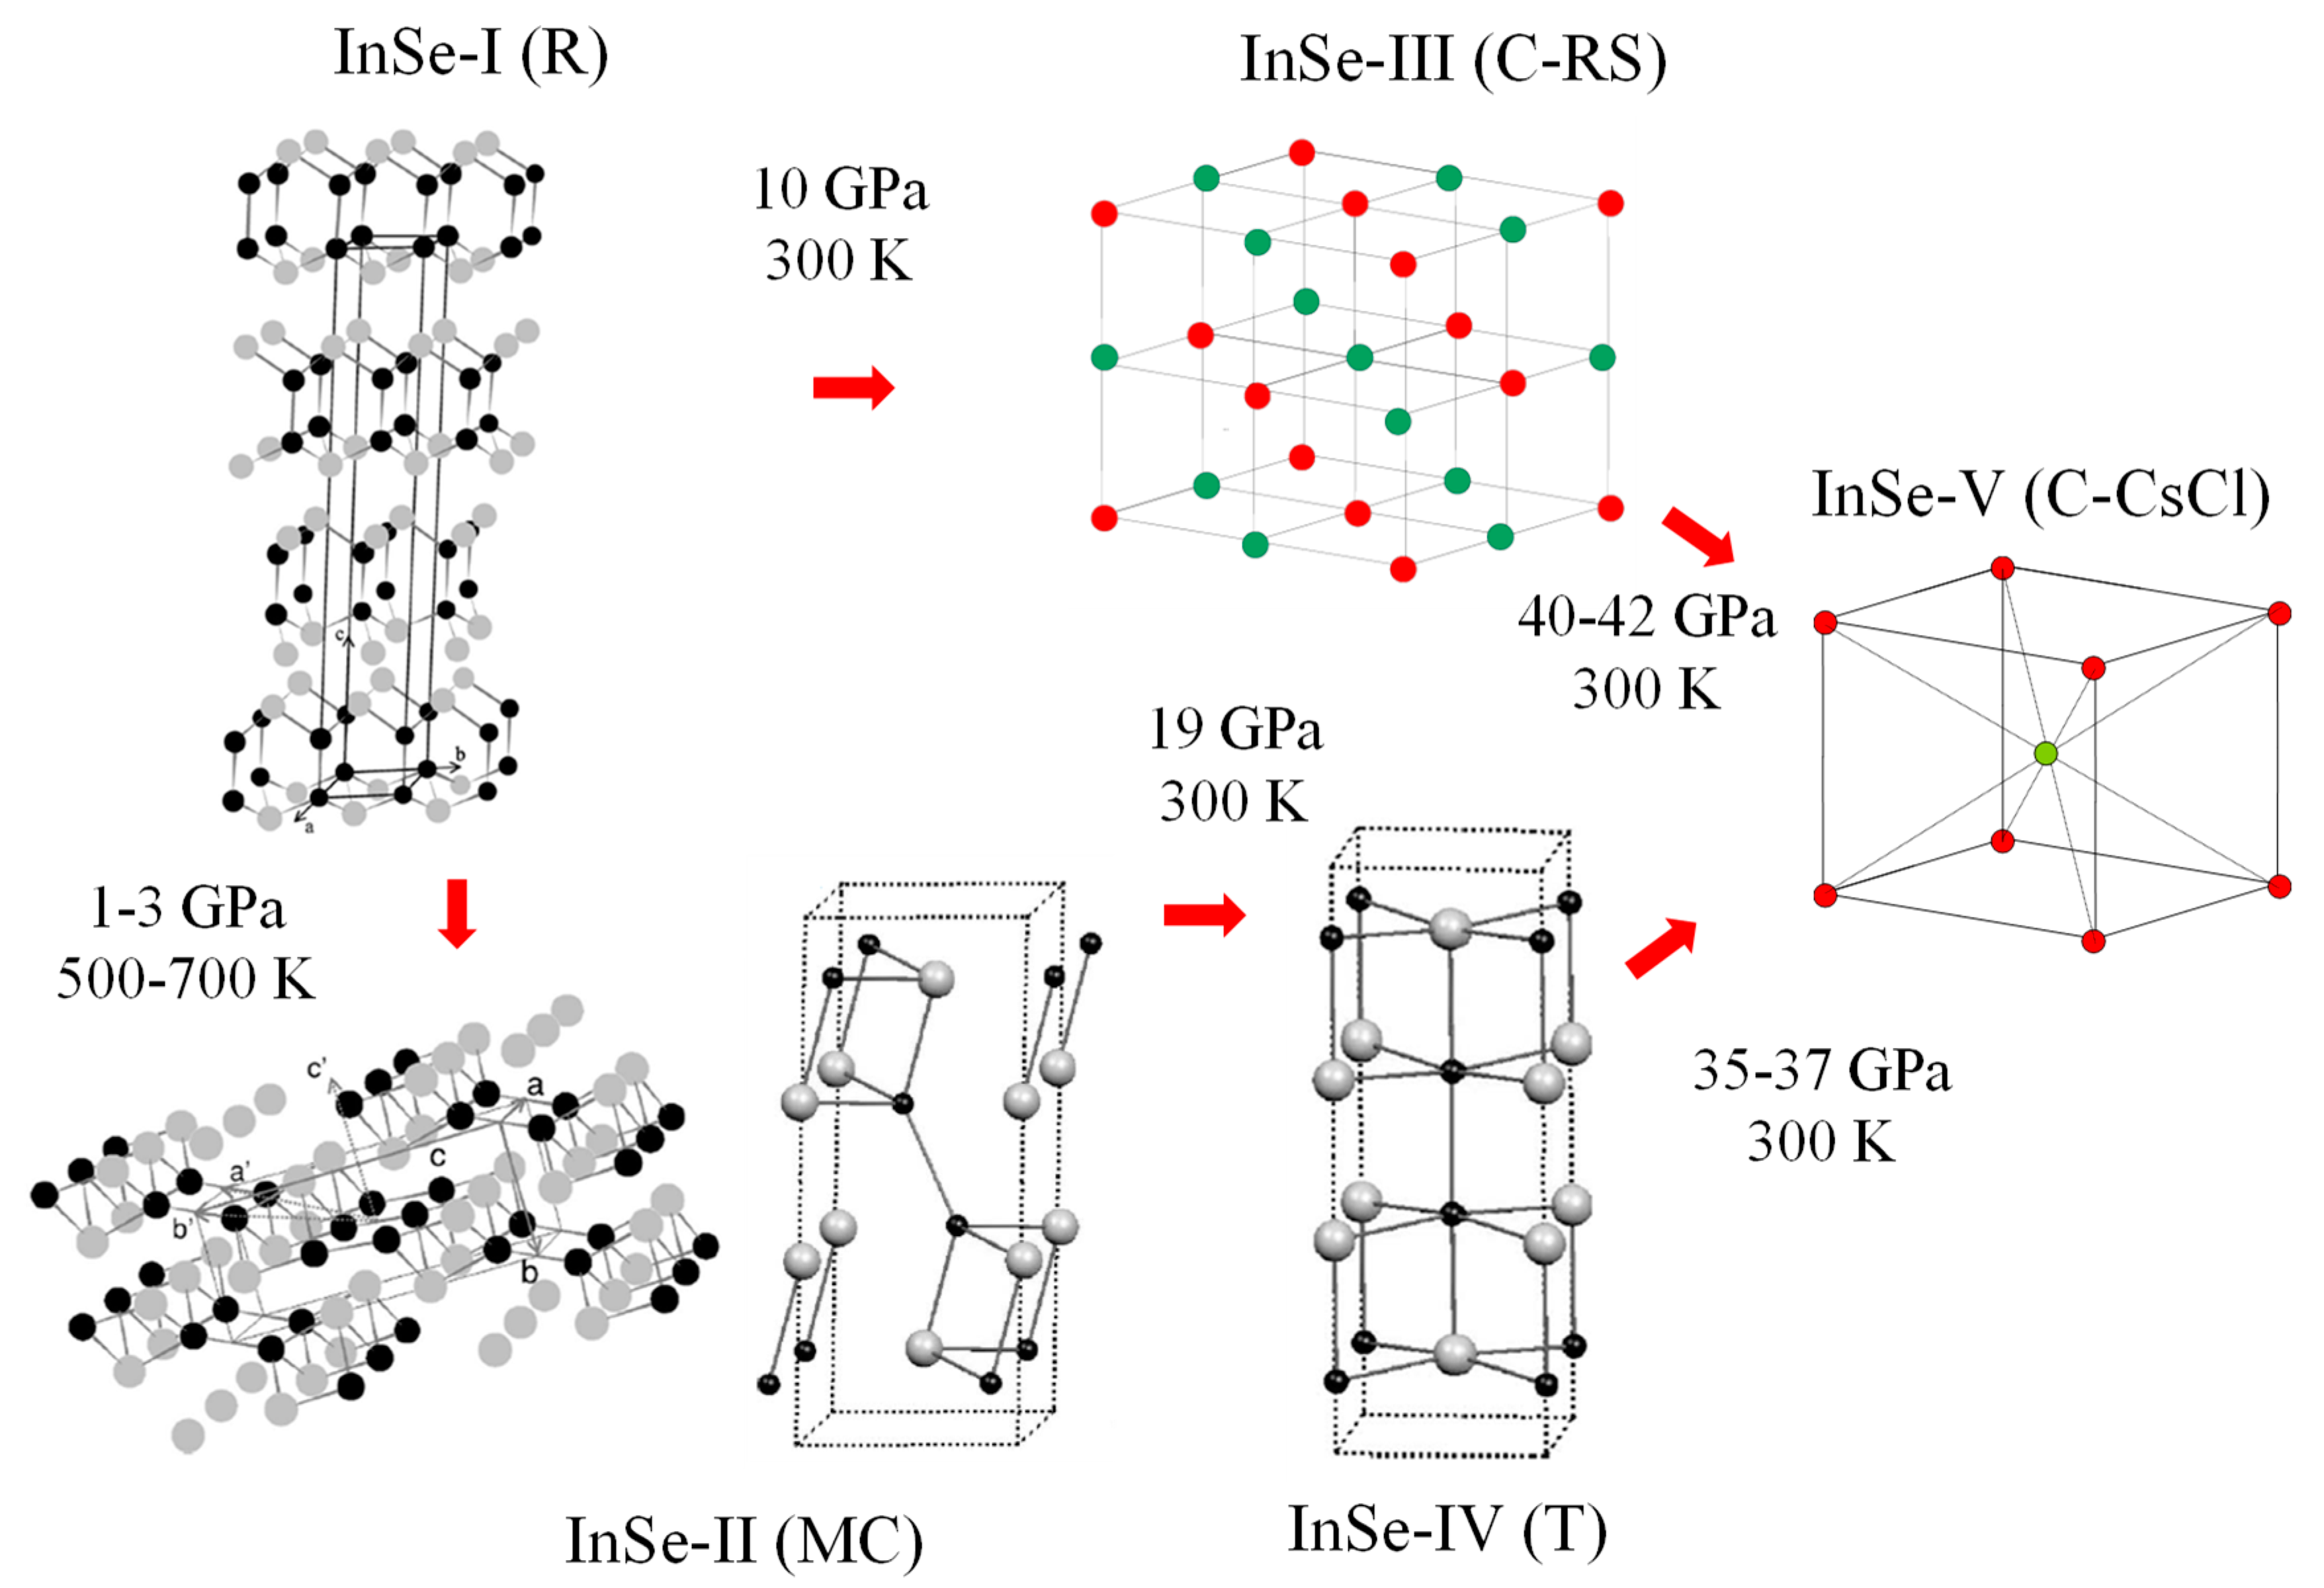
As concerns InSe crystal phase diagram, Schwarz et al. [27,28] showed that, around 10 GPa at room temperature, InSe-I transits to a rock-salt (RS) cubic phase (InSe-III) that is stable up to 30 GPa (Figure 2a). The transition to the rock-salt phase was also detected by EXAFS measurements [31]. The comparison of Figure 2a and Figure 3a illustrates the fact that, in spite of the volume collapse from the layered to the rock-salt phase, the first neighbor distance increases as a result of the increase of the first-neighbor coordination number.
The existence of a metastable phase introduces more complexity in the pressure-temperature phase diagram of InSe. This phase was first synthesized by Vezzoli [38], who did not report its crystal structure. A more systematic study by Iwasaki and coworkers [39,40] reported that InSe-I transforms into a monoclinic (MC) structure material (InSe-II) with space group C2h (P2/m), at relatively low pressure (1–3 GPa) and high temperature (500–700 K). This is an InS-like layered phase in which all In-In covalent bonds are virtually parallel to the layer plane, as shown in Figure 4. InSe-II is a semiconductor, which is metastable in ambient conditions [39,40,41].
The P-T phase boundary between the rhombohedral and monoclinic phases of InSe was explored by means of transport measurements under high pressure and temperatures [41], and by in-situ XRD measurements at high pressure and temperatures [42] in a Paris-Edinburgh press. [43] An inverse correlation was found between the pressure and temperature at which MC InSe-II grows from R InSe-I [41,42]. While at pressures below 0.6 GPa the temperature must be 750 K, above 7 GPa, only 400 K are needed for completing the phase transition.
Under high pressure, MC InSe-II progressively increases its symmetry and gradually approaches a Hg2Cl2-like tetragonal phase (InSe-IV), with symmetry D4h (I4/mmm) [30]. This seems to be a second order fully reversible phase transition, occurring at 19 GPa. The second sketch of the MC unit cell shown in Figure 4 illustrates the similarity between the MC and T structures, and the fact that they can transform into each other in a continuous way. InSe-IV was shown to be stable up to 30 GPa. [41] More recently it has been shown that, under further pressure increase, both RS InSe-III and T InSe-IV transform into a cubic CsCl phase, InSe-V (Figure 4) [44].
3. Electronic Structure under High Pressure
3.1. Optical Measurements and ab-Initio Band Structure Calculations
At ambient conditions InSe-I is a semiconductor with a bandgap of 1.27 eV, exhibiting intense excitonic effects in its fundamental absorption edge [2,45], as also observed in ε-GaSe, with a direct badgap of 2 eV at RT [46]. In β-GaS, with an indirect bandgap of 2.5 eV, the resonant direct exciton (at 3 eV) is observed only at low temperature [47].
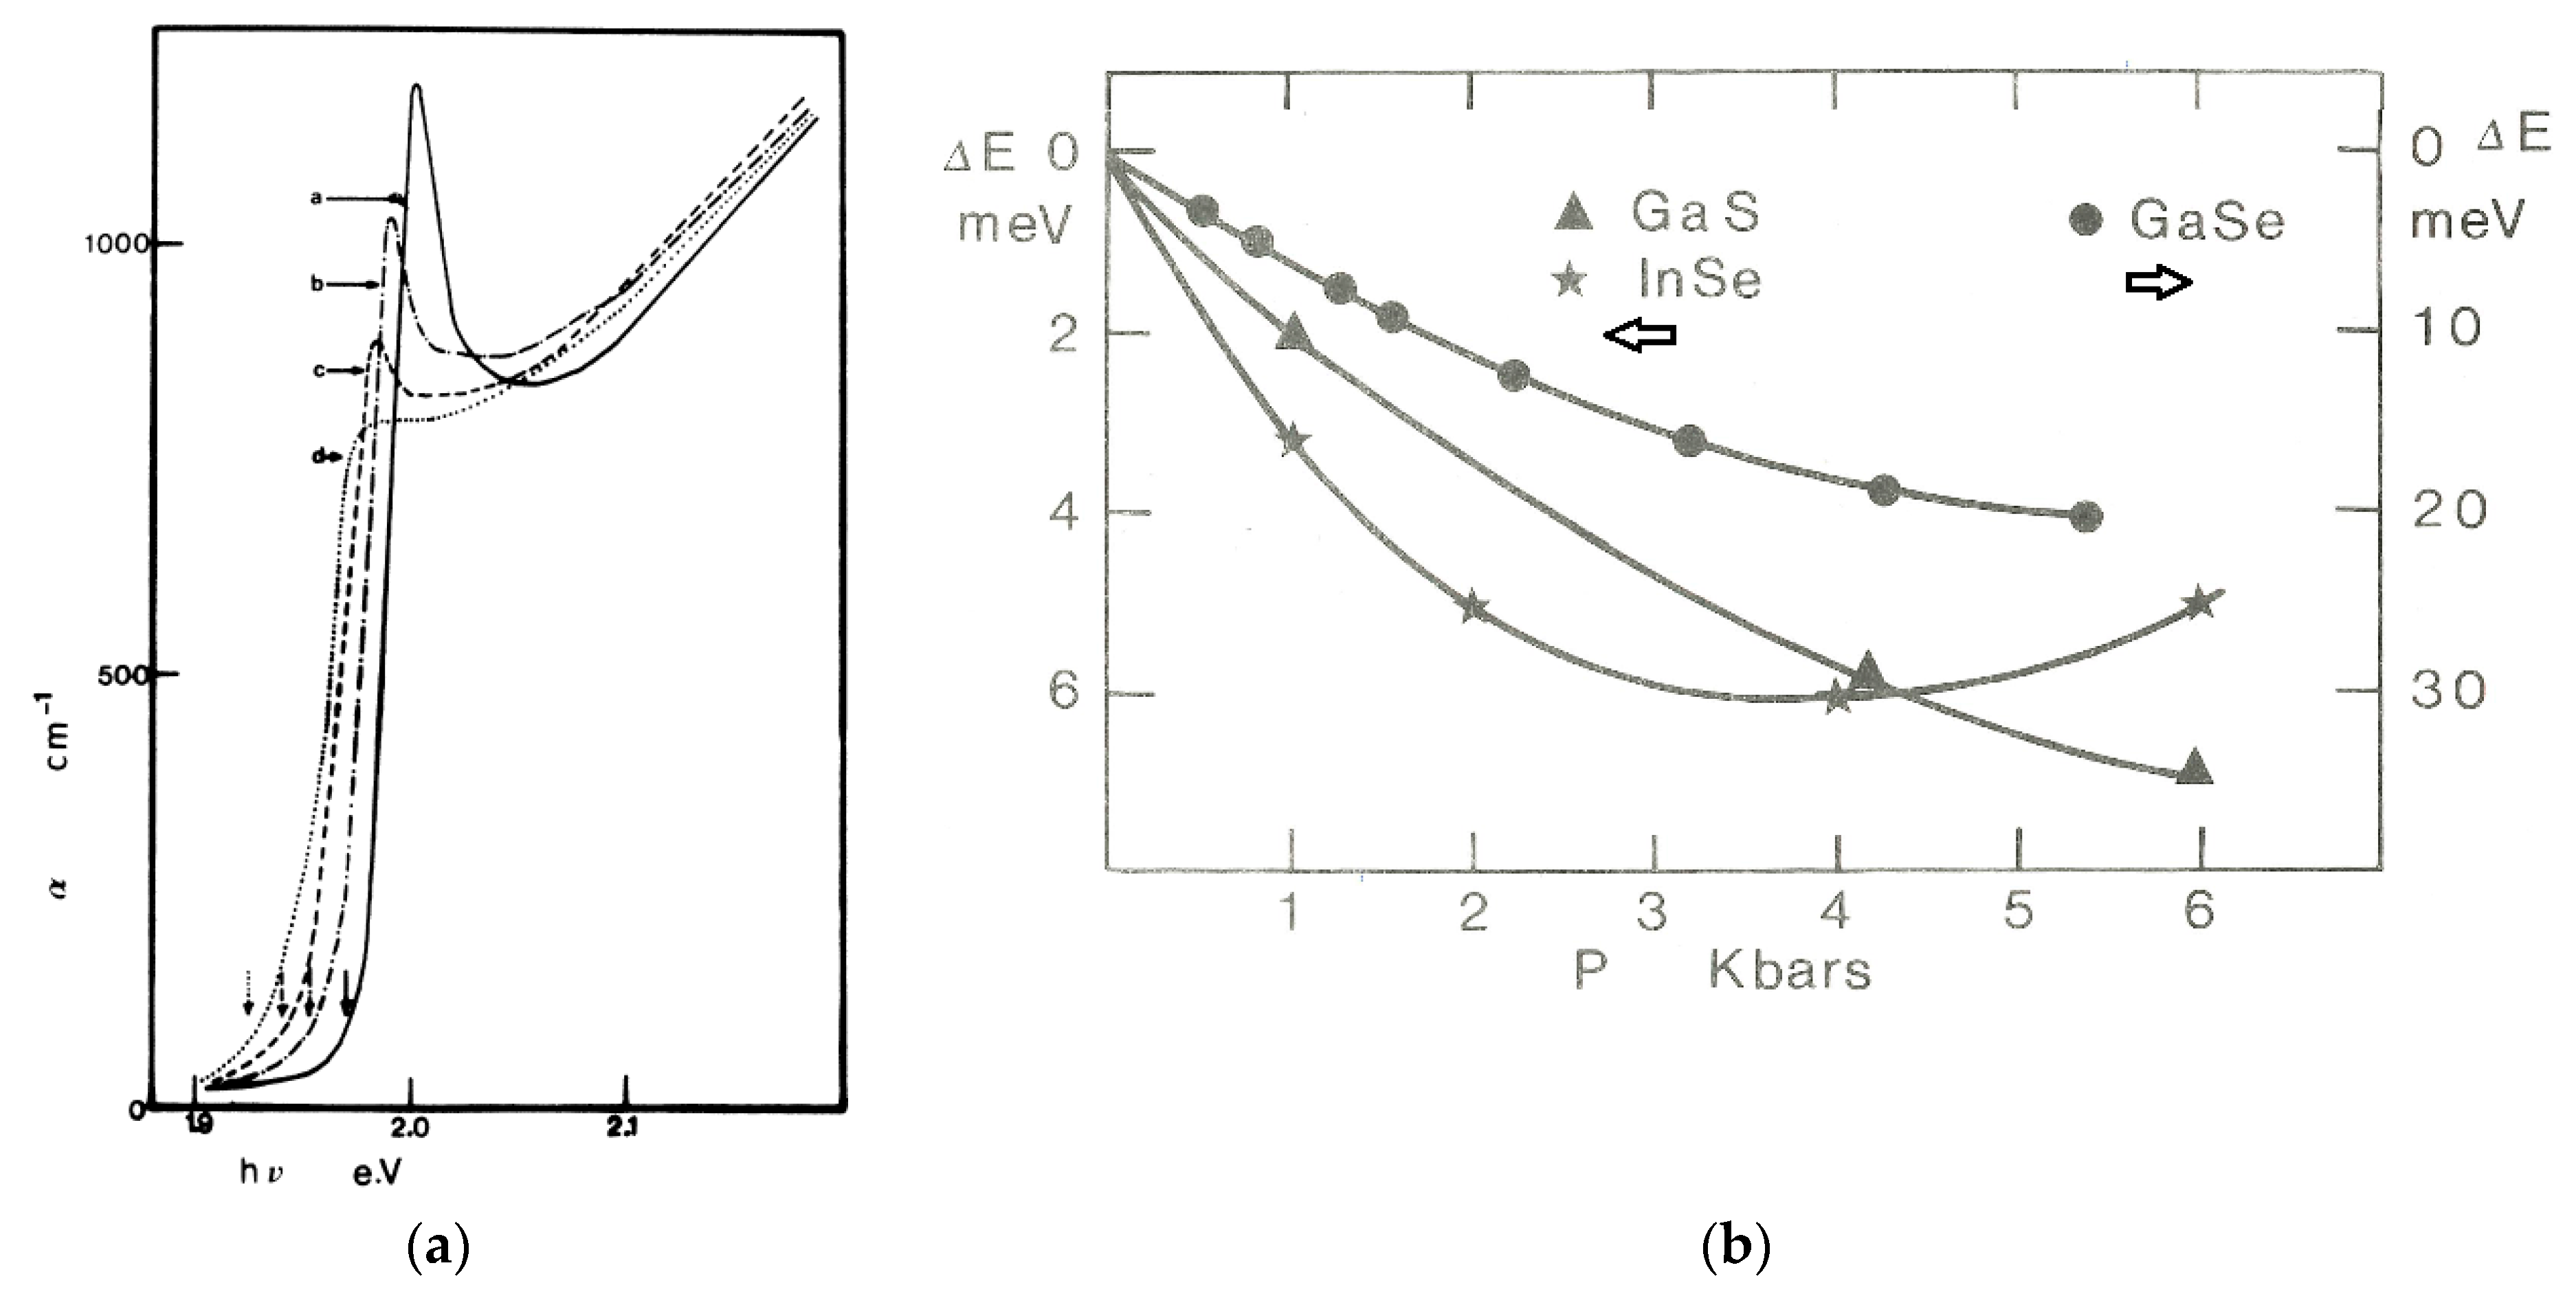
The pressure dependence of the absorption edge of these III–VI semiconductors was first investigated by Besson and coworkers [47,48,49] by means of optical absorption measurements in large volume piston cells, with the aim of extending Paul’s empirical rule [15] to non-tetrahedrally coordinated semiconductors. These authors reported complex behavior including (i) a nonlinear pressure dependence of the direct bangap, exhibiting a low-pressure interval with negative pressure coefficient and then increasing with pressure after a minimum, as shown in Figure 5b; (ii) a large negative pressure coefficient for the indirect gap of GaS; and (iii) a progressive widening and disappearing of the exciton peak, as shown in Figure 5a. Concerning ε-GaSe, Panfilov et al. [50] suggested that nonlinear behavior was the result of a phase transition to a different polytype occurring at 0.6 GPa, a hypothesis that was not supported by later XRD experiments [32,34].
The nonlinearity in the pressure dependence of the bandgap was explained by the interplay between intra- and inter-layer interactions, the latter dominating in the low-pressure range due to the large compressibility of the interlayer distances, determined by Van der Waals interactions. The widening and disappearance of the exciton absorption peak, i.e., the quick decrease of the exciton lifetime, was explained by the strong carrier inter-valley scattering resulting from the direct-to-indirect crossover [47,48].
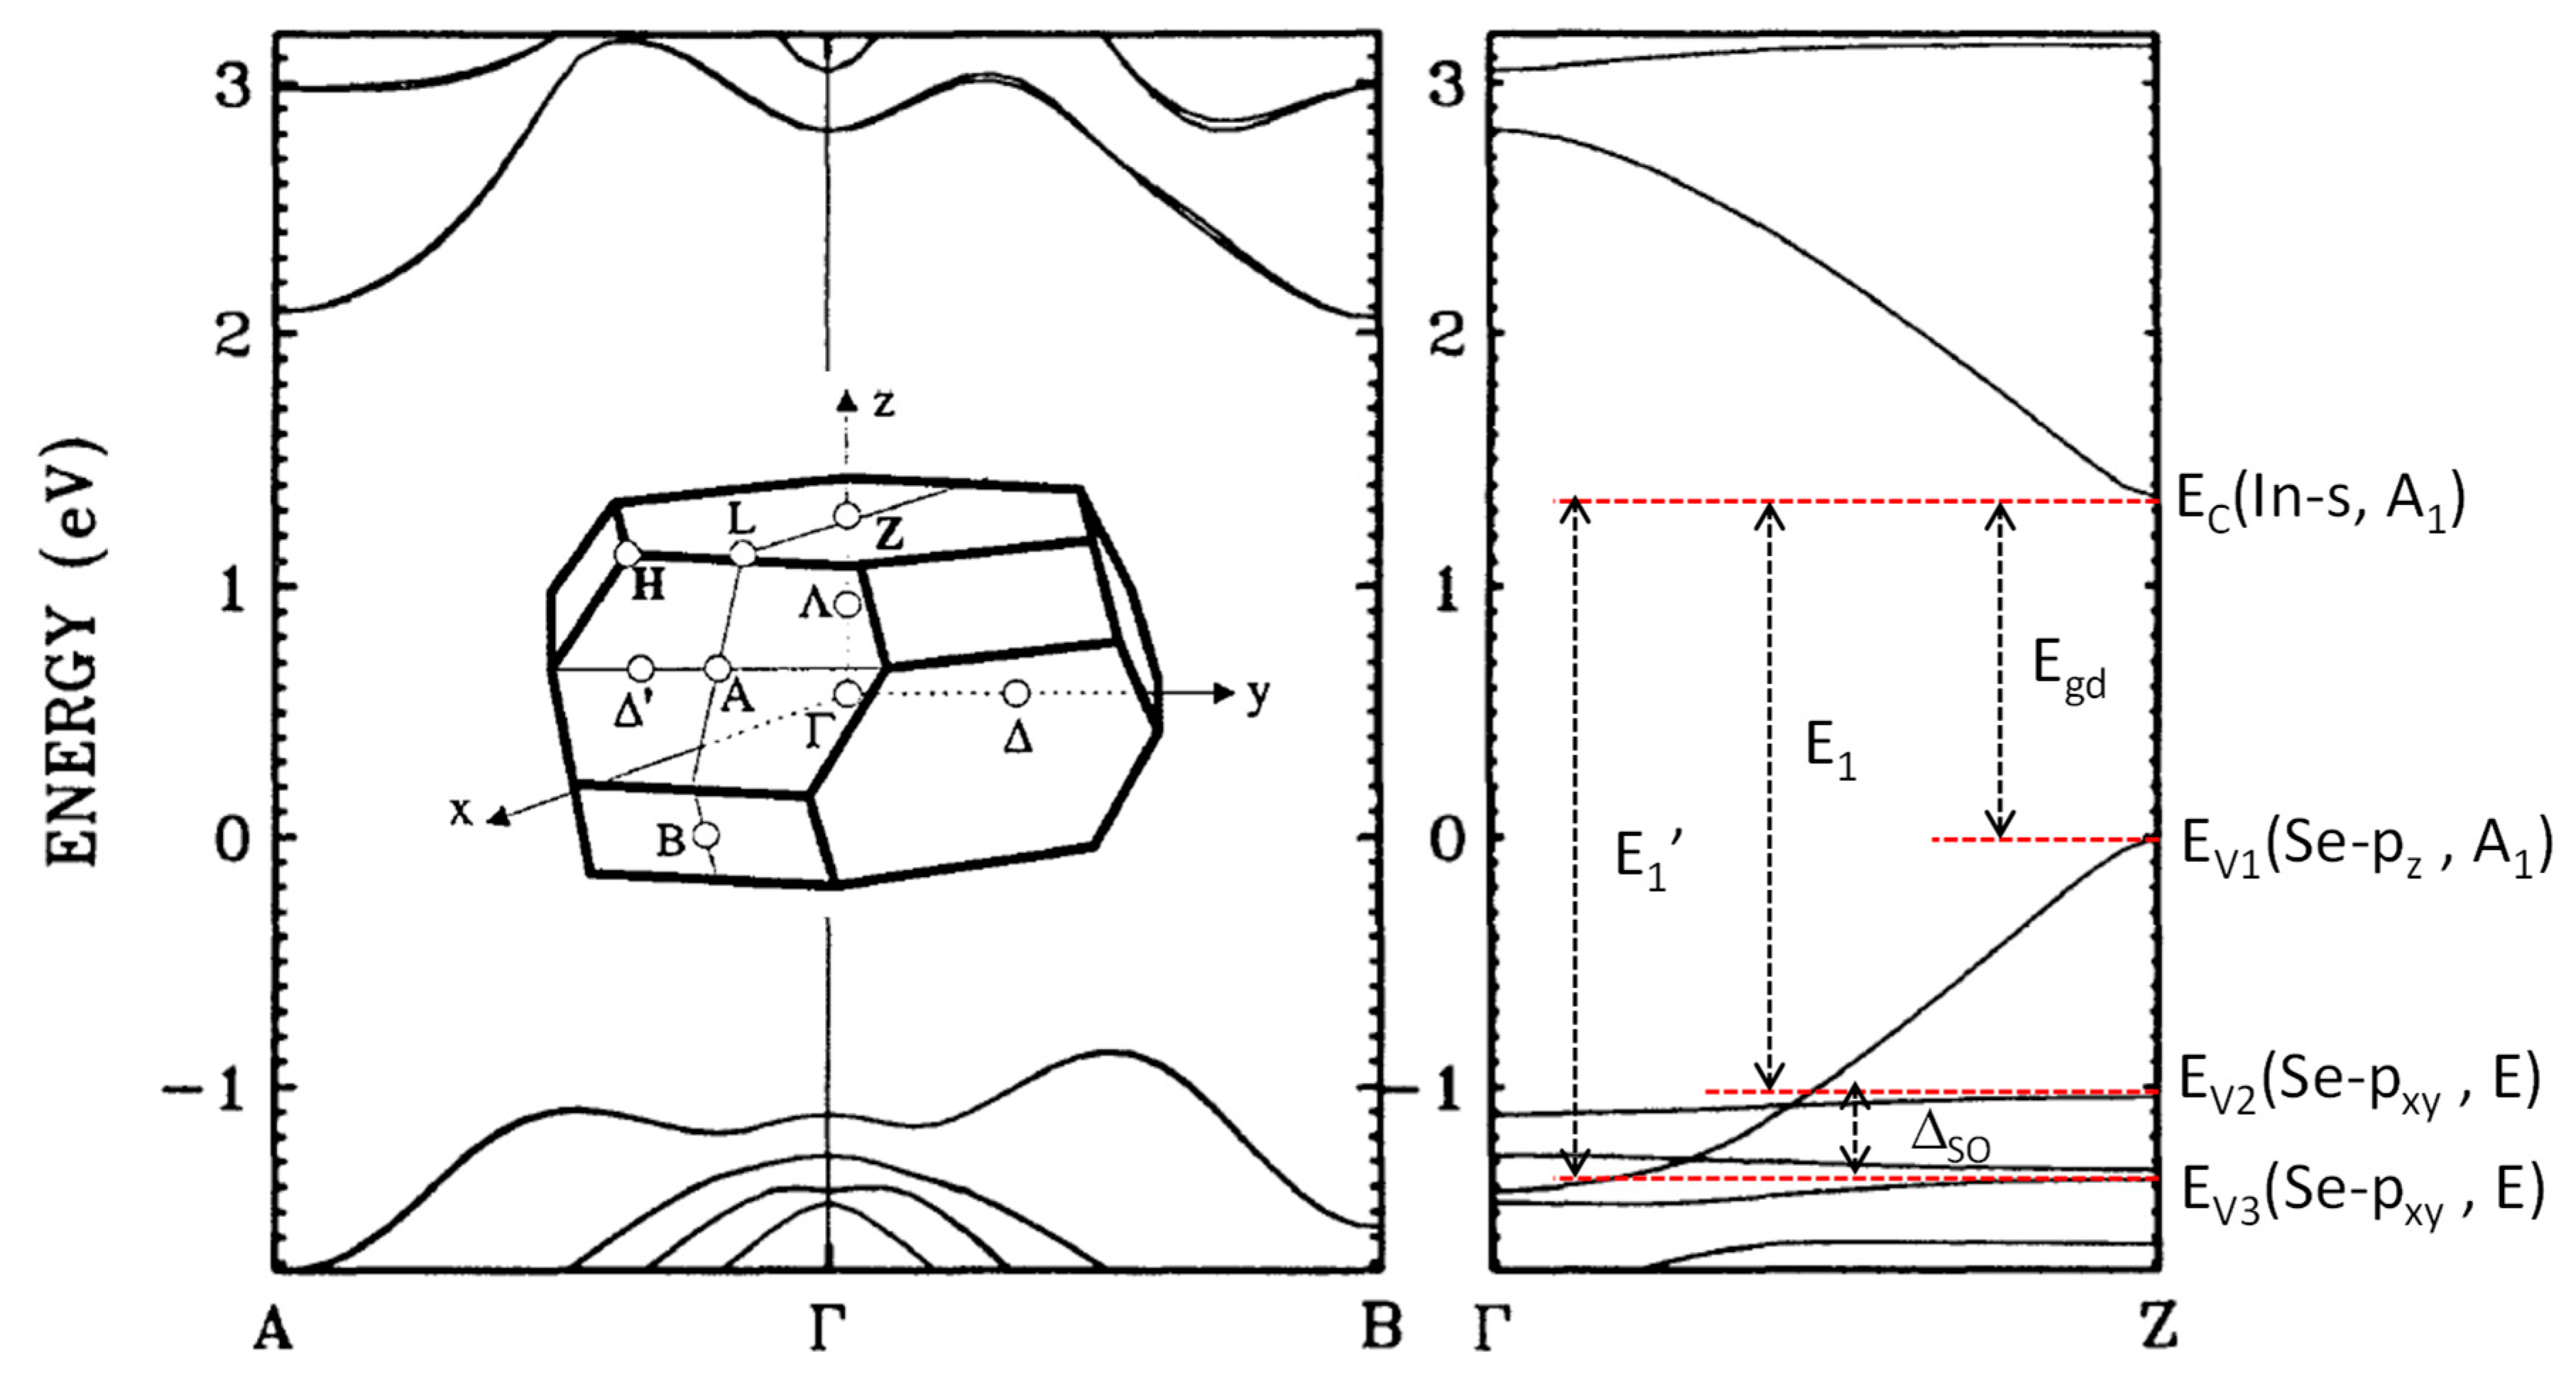
Attempts to give a theoretical account for this behavior were first done by means of empirical pseudopotential band structure calculations [51] that correctly predicted the bandgap coefficients but could hardly render a realistic description of the complex electronic structure of III–VI semiconductors. The first investigation of γ-InSe band structure using modern ab-initio methods, based in density functional theory (DFT) in the local density approximation (LDA), was done by Gomez da Costa et al. [52]. Results are shown in Figure 6 (notice that, as explained in their paper, the authors shifted the conduction bands upwards to match the experimental value of the bandgap). Even if this band structure was reported after some of the experimental papers that we will discuss later in this section, we will describe its main features so as to facilitate the identification of the main electronic transitions involved in the optical absorption experiments.
The valence band maximum (VBM) and conduction band minimum (CBM) are at the Z point of the first Brillouin zone (BZ) (also shown in Figure 6). This calculation gives account of the most relevant features of InSe electronic structure and especially the unexpected anisotropy of the electron and hole effective masses, which turns out to be smaller in the direction of the c-axis (Table 2).
Figure 6 also shows the assignment of the main direct transitions observed in the absorption spectrum of γ-InSe, as well as the main orbital character and symmetry of the initial and final states. It is relevant to notice that the fundamental transition is fully allowed only for polarization parallel to the c-axis. In the framework of the model [55], effective masses in a band extremum are inversely proportional to the squared dipole matrix element with other extrema and proportional to the energy difference between them. Effective mass values in Table 2 are then consistent with the observed features of the main direct transition [2,45,56]. The low values of the electron and hole effective masses along the c-axis are correlated to the strong allowed character of the fundamental transition for polarization parallel to the c-axis. For polarization perpendicular to the c-axis transitions, E1 and E1′ are allowed, while the fundamental transition at Egd becomes partially allowed by spin-orbit interaction mixing Se-pz states at the VBM with two deeper valence bands with Se-pxy character [52].
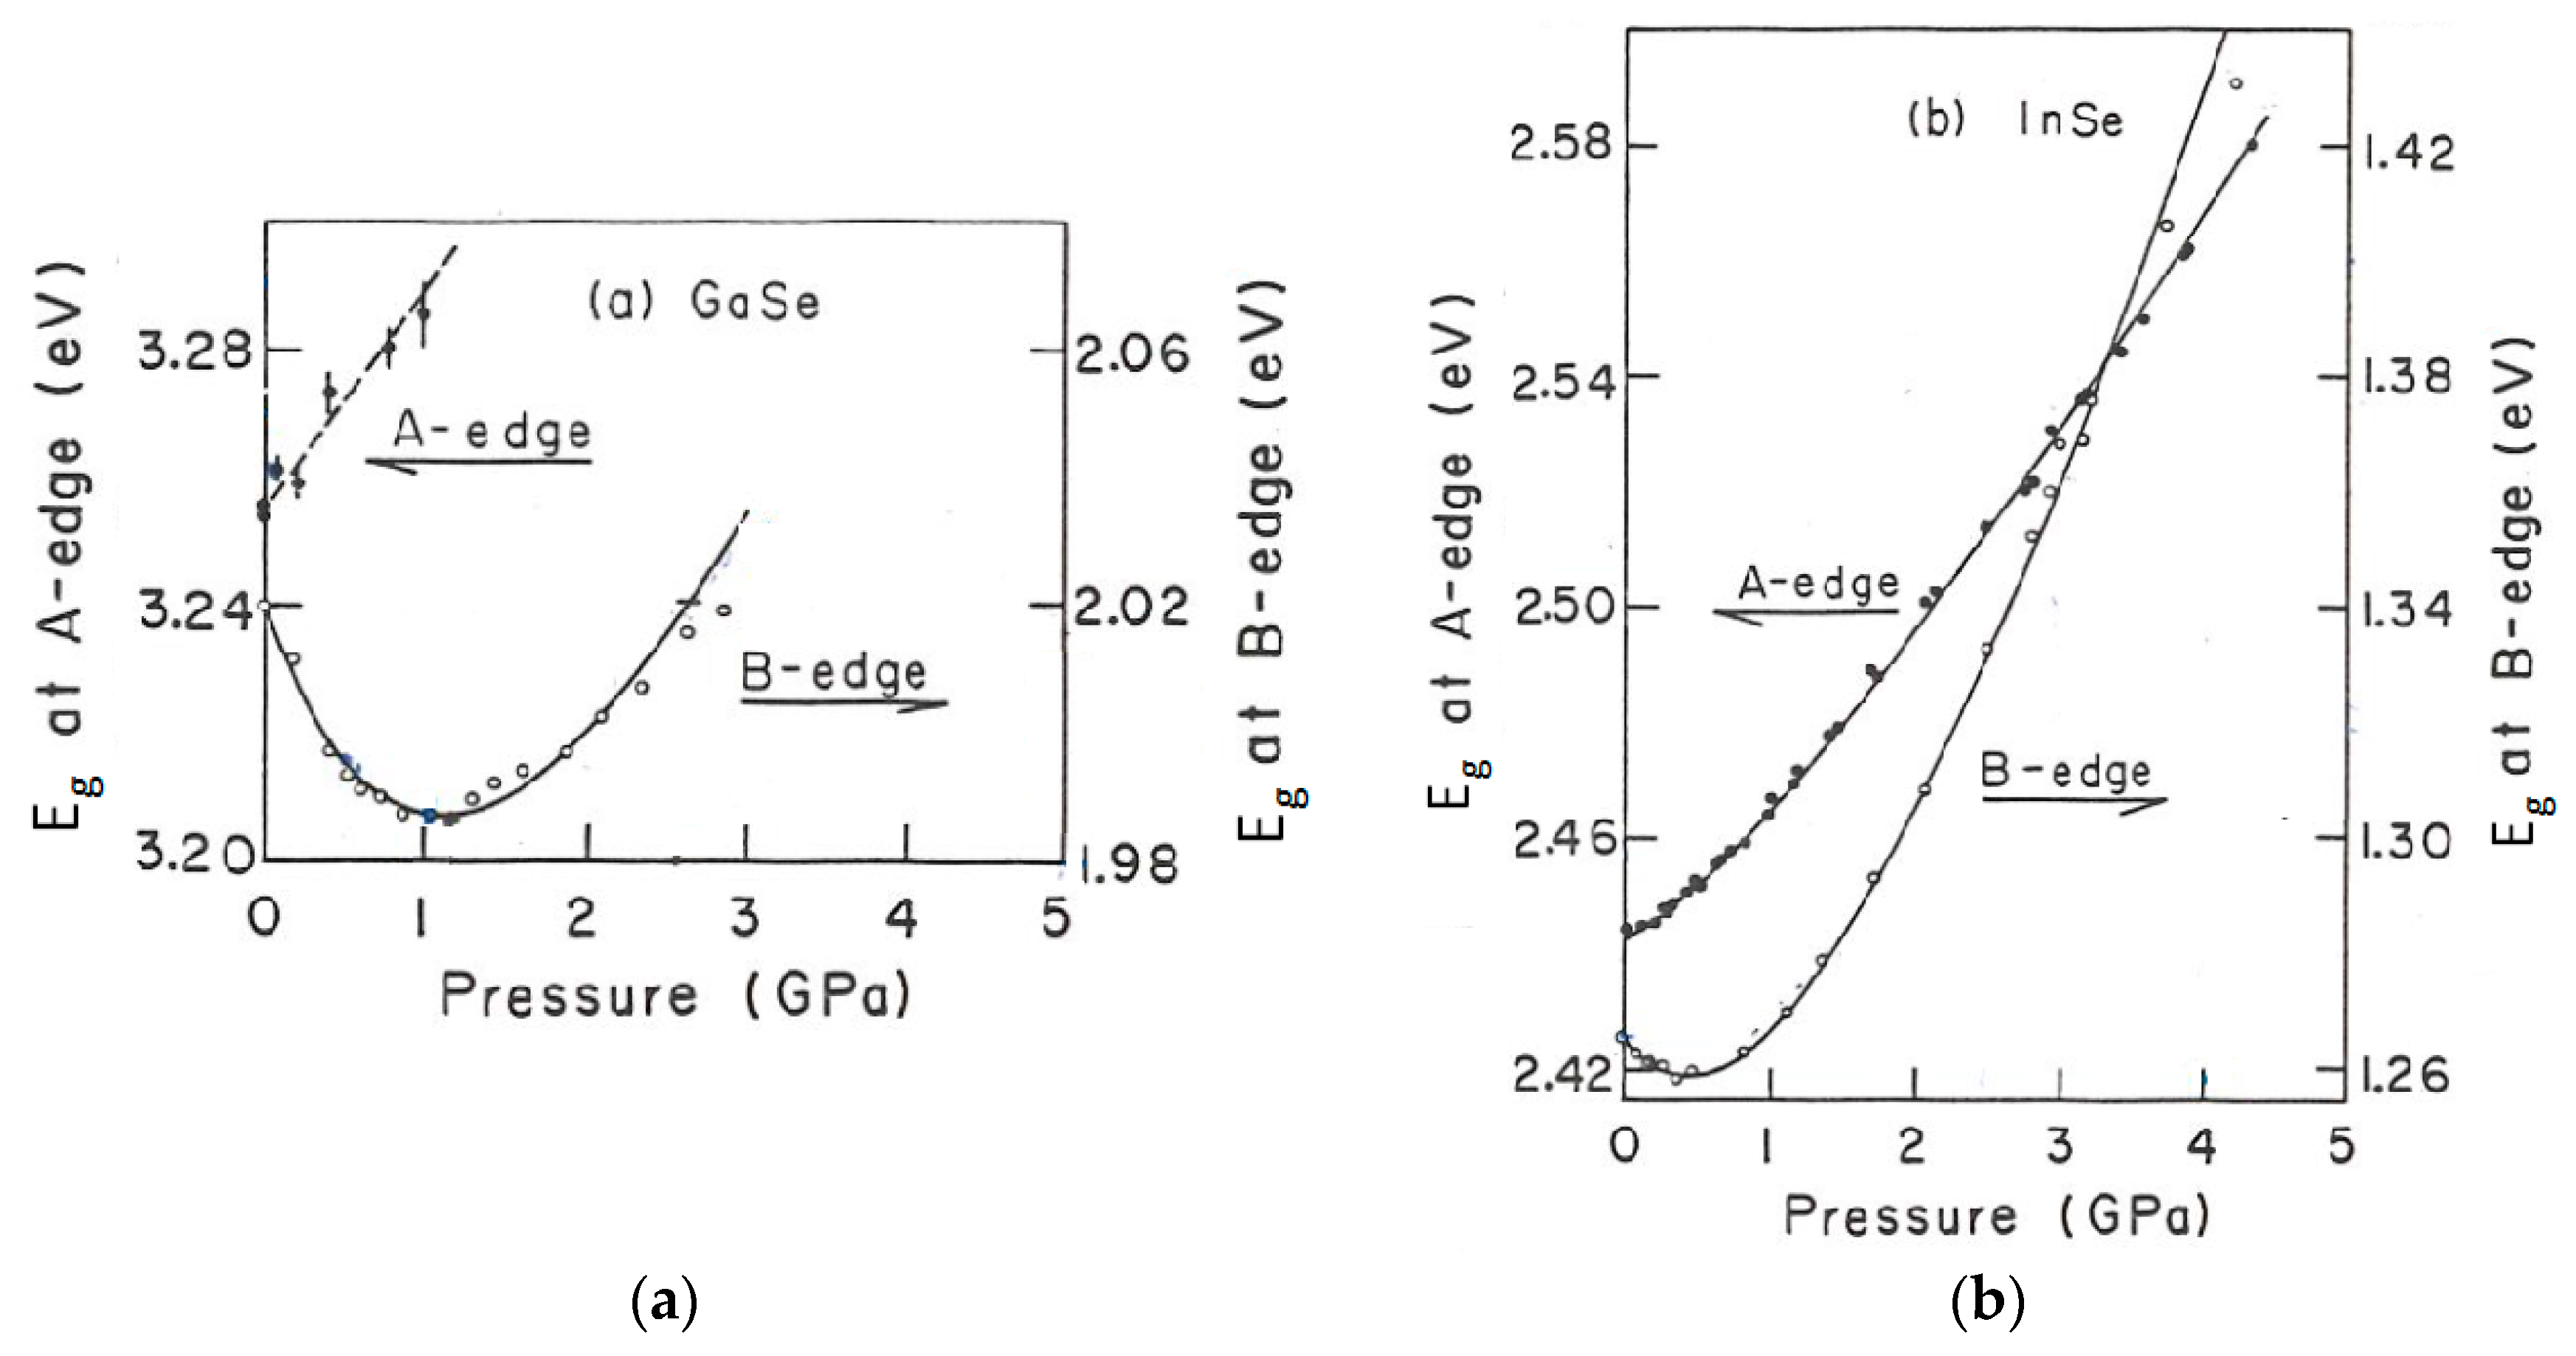
Further studies on γ-InSe and ε-GaSe absorption edge under pressure in DAC by Kuroda et al. [25] confirmed the nonlinear behavior of the fundamental edge (B-edge in Figure 7, corresponding to transition Egd in Figure 6), as well as the pressure-induced quenching of the exciton peak in both compounds. The use of very thin samples also led these authors to investigate the behavior of a more intense direct transition at larger photon energies (A-edge in Figure 7, corresponding to transition E1 in Figure 6), assigned to a transition from a deeper valence band to the CBM, which exhibits a quasi-lineal pressure dependence. The main features of ε-GaSe band structure can be imagined by folding γ-InSe bands along the ΓZ direction and shifting the CBM by about 0.7 eV, which makes the direct transition in ε-GaSe very close in energy to the indirect transition from the VBM to the conduction band minima at the Brillouin zone edge (points A and B in Figure 6).
This paper was the first one to report that, while in ε-GaSe the energy difference EV1-EV2 increases under pressure in the whole explored pressure range, in γ-InSe it slightly increases up to about 1 GPa and then quickly decreases as pressure increases. This different behavior of EV1-EV2 is most probably a consequence of the different symmetry of the ε and γ polytypes, leading to marked differences between both compounds regarding the pressure effects on the shape of the VBM, as we will discuss in Section 6. These authors also proposed a detailed empirical model including four deformation potentials to give quantitative account of the nonlinear dependence of the fundamental gap.
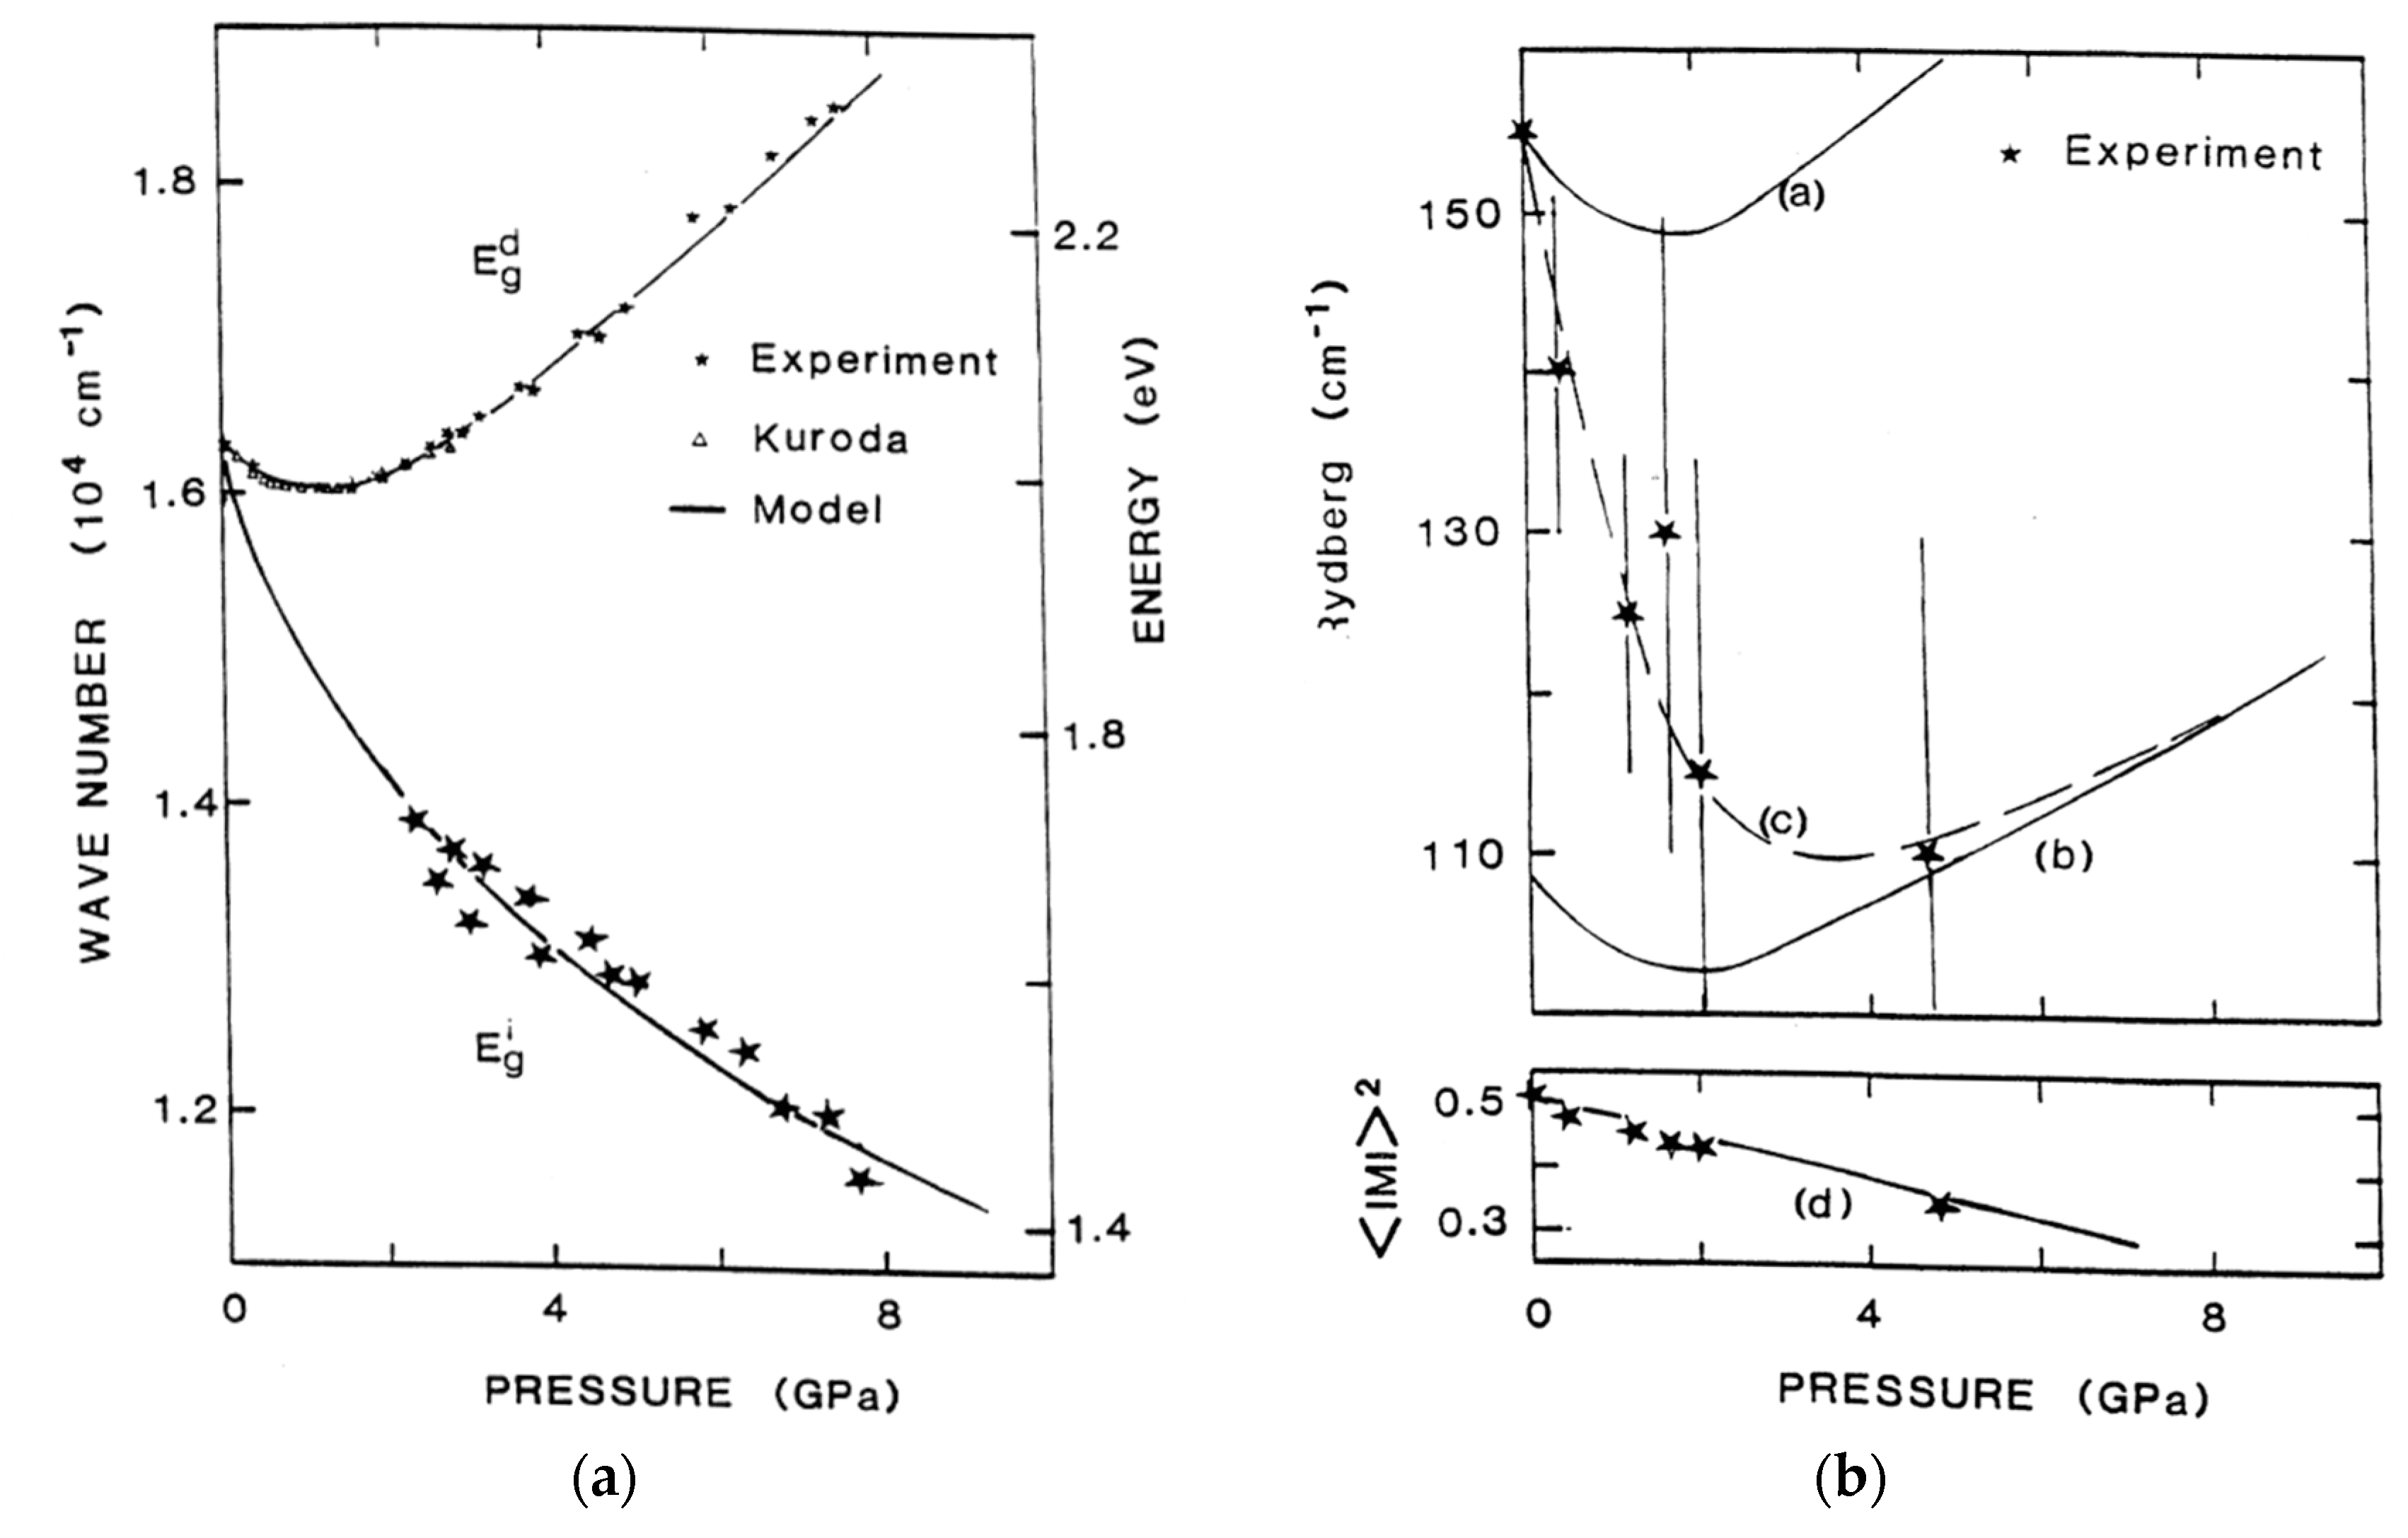
In a paper on the pressure effects on the lattice dynamics and optical properties of ε-GaSe, Gauthier et al. [57] reported a very detailed analysis of absorption edge that included a sound decomposition of it in contributions of direct and indirect transitions, and allowed them to obtain the pressure dependence of both the direct and indirect gaps (Figure 8a). The non-linearity of the pressure dependence of the direct gap was also explained (like in [25,48]) by the interplay between intra- and interlayer interactions. The direct gap contribution was analyzed by applying the Elliott-Toyozawa models [58,59], that gives account of the effect of the electron-hole electrostatic interaction on the absorption edge [58] and explains the widening of the exciton peaks from exciton-phonon scattering processes [59]. From that complete analysis, the authors obtained the pressure dependence of the direct exciton parameters (binding energy and absorption peak width) and the direct transition dipole-matrix-element. Under pressure, the matrix element linearly decreases (Figure 8b) as a consequence of the decrease of the Se-pxy contribution to the VBM, consistently with the increase of EV1-EV2 reported by Kuroda et al. [25], as discussed in the previous paragraph. The observed quick decrease of the exciton binding energy (Figure 8b) was proposed to be due to the increase of the static dielectric constant, an issue that will be discussed in Section 4 and Section 5. The large increase of the exciton peak width was explained through the pressure induced direct-to-indirect crossover, with a detailed discussion on the pressure dependence of the different mechanisms intervening in the exciton scattering [46,60].
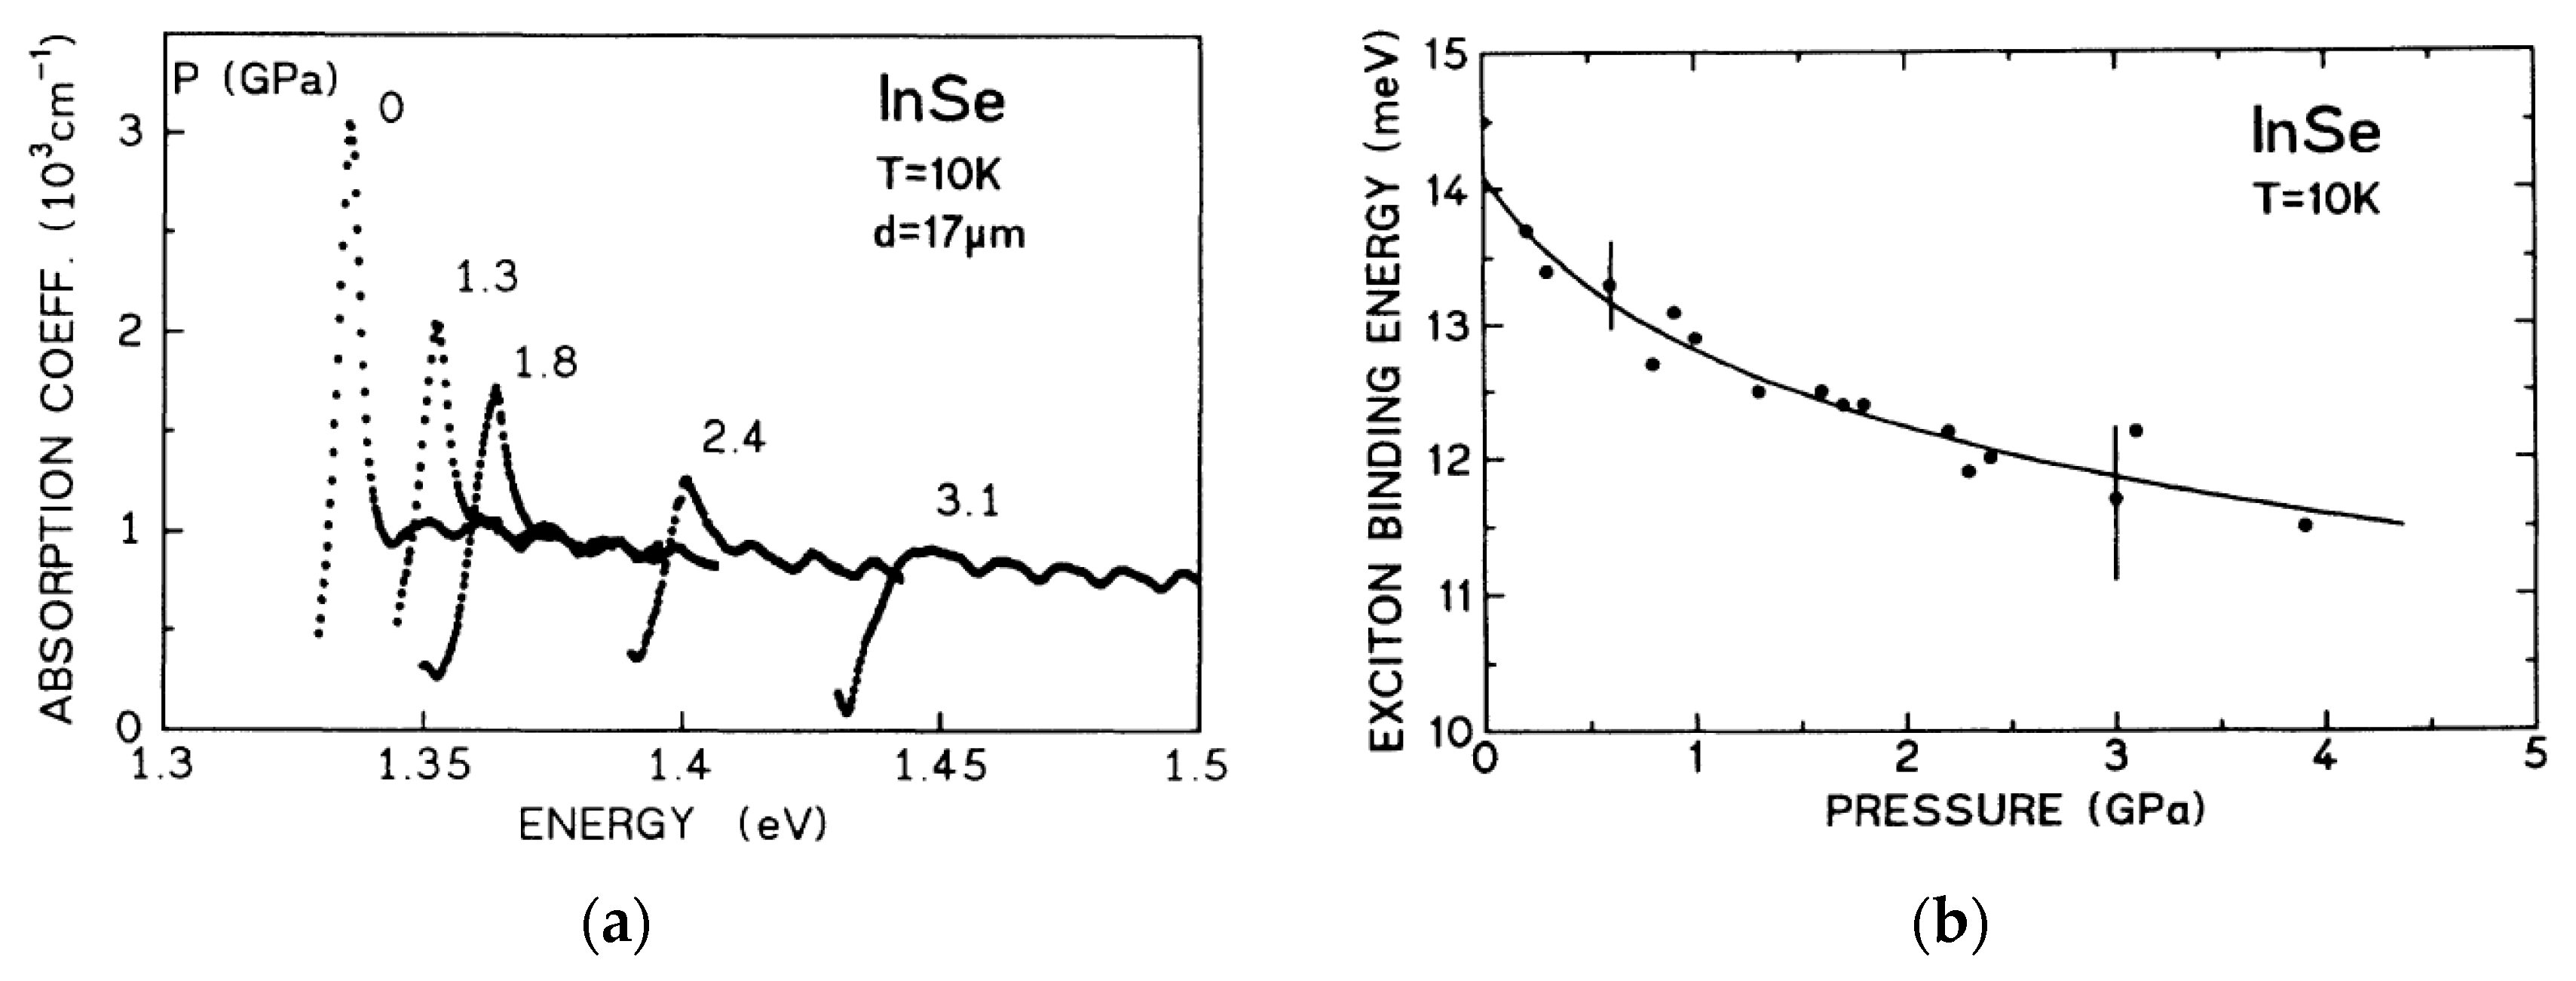
The first full interpretation of the pressure evolution of γ-InSe absorption edge in terms of the Elliot-Toyozawa model [58,59] was done by Goñi et al. [61] by means of low-temperature and high pressure optical measurements in DAC. Figure 9a shows the pressure evolution of the absorption edge of InSe at 10 K. Figure 9b shows the pressure dependence of the exciton binding energy.
As previously found in GaSe, [57] and in spite of the expected increase of the effective mass under pressure, the exciton binding energy decreases as pressure increases. This effect was attributed to a large increase of the static dielectric constant under pressure. As we will discuss in Section 5, this was later confirmed by capacitance measurements under high pressure. The authors also reported a detailed analysis of the pressure dependence of the exciton peak width, which was explained through a direct-to-indirect crossover attributed to the shift to lower energy of conduction band minima in points A or B of the Brillouin zone in the band structure shown in Figure 6, analogously to the large negative pressure coefficient of the indirect gap found in ε-GaSe [57] and β-GaS. [47] Below in this section we will discuss how this direct-to-indirect crossover in the conduction band is not enough to give account of the exciton peak widening in the low-pressure range. Changes in the valence band maximum at the Z point must also be taken into account.
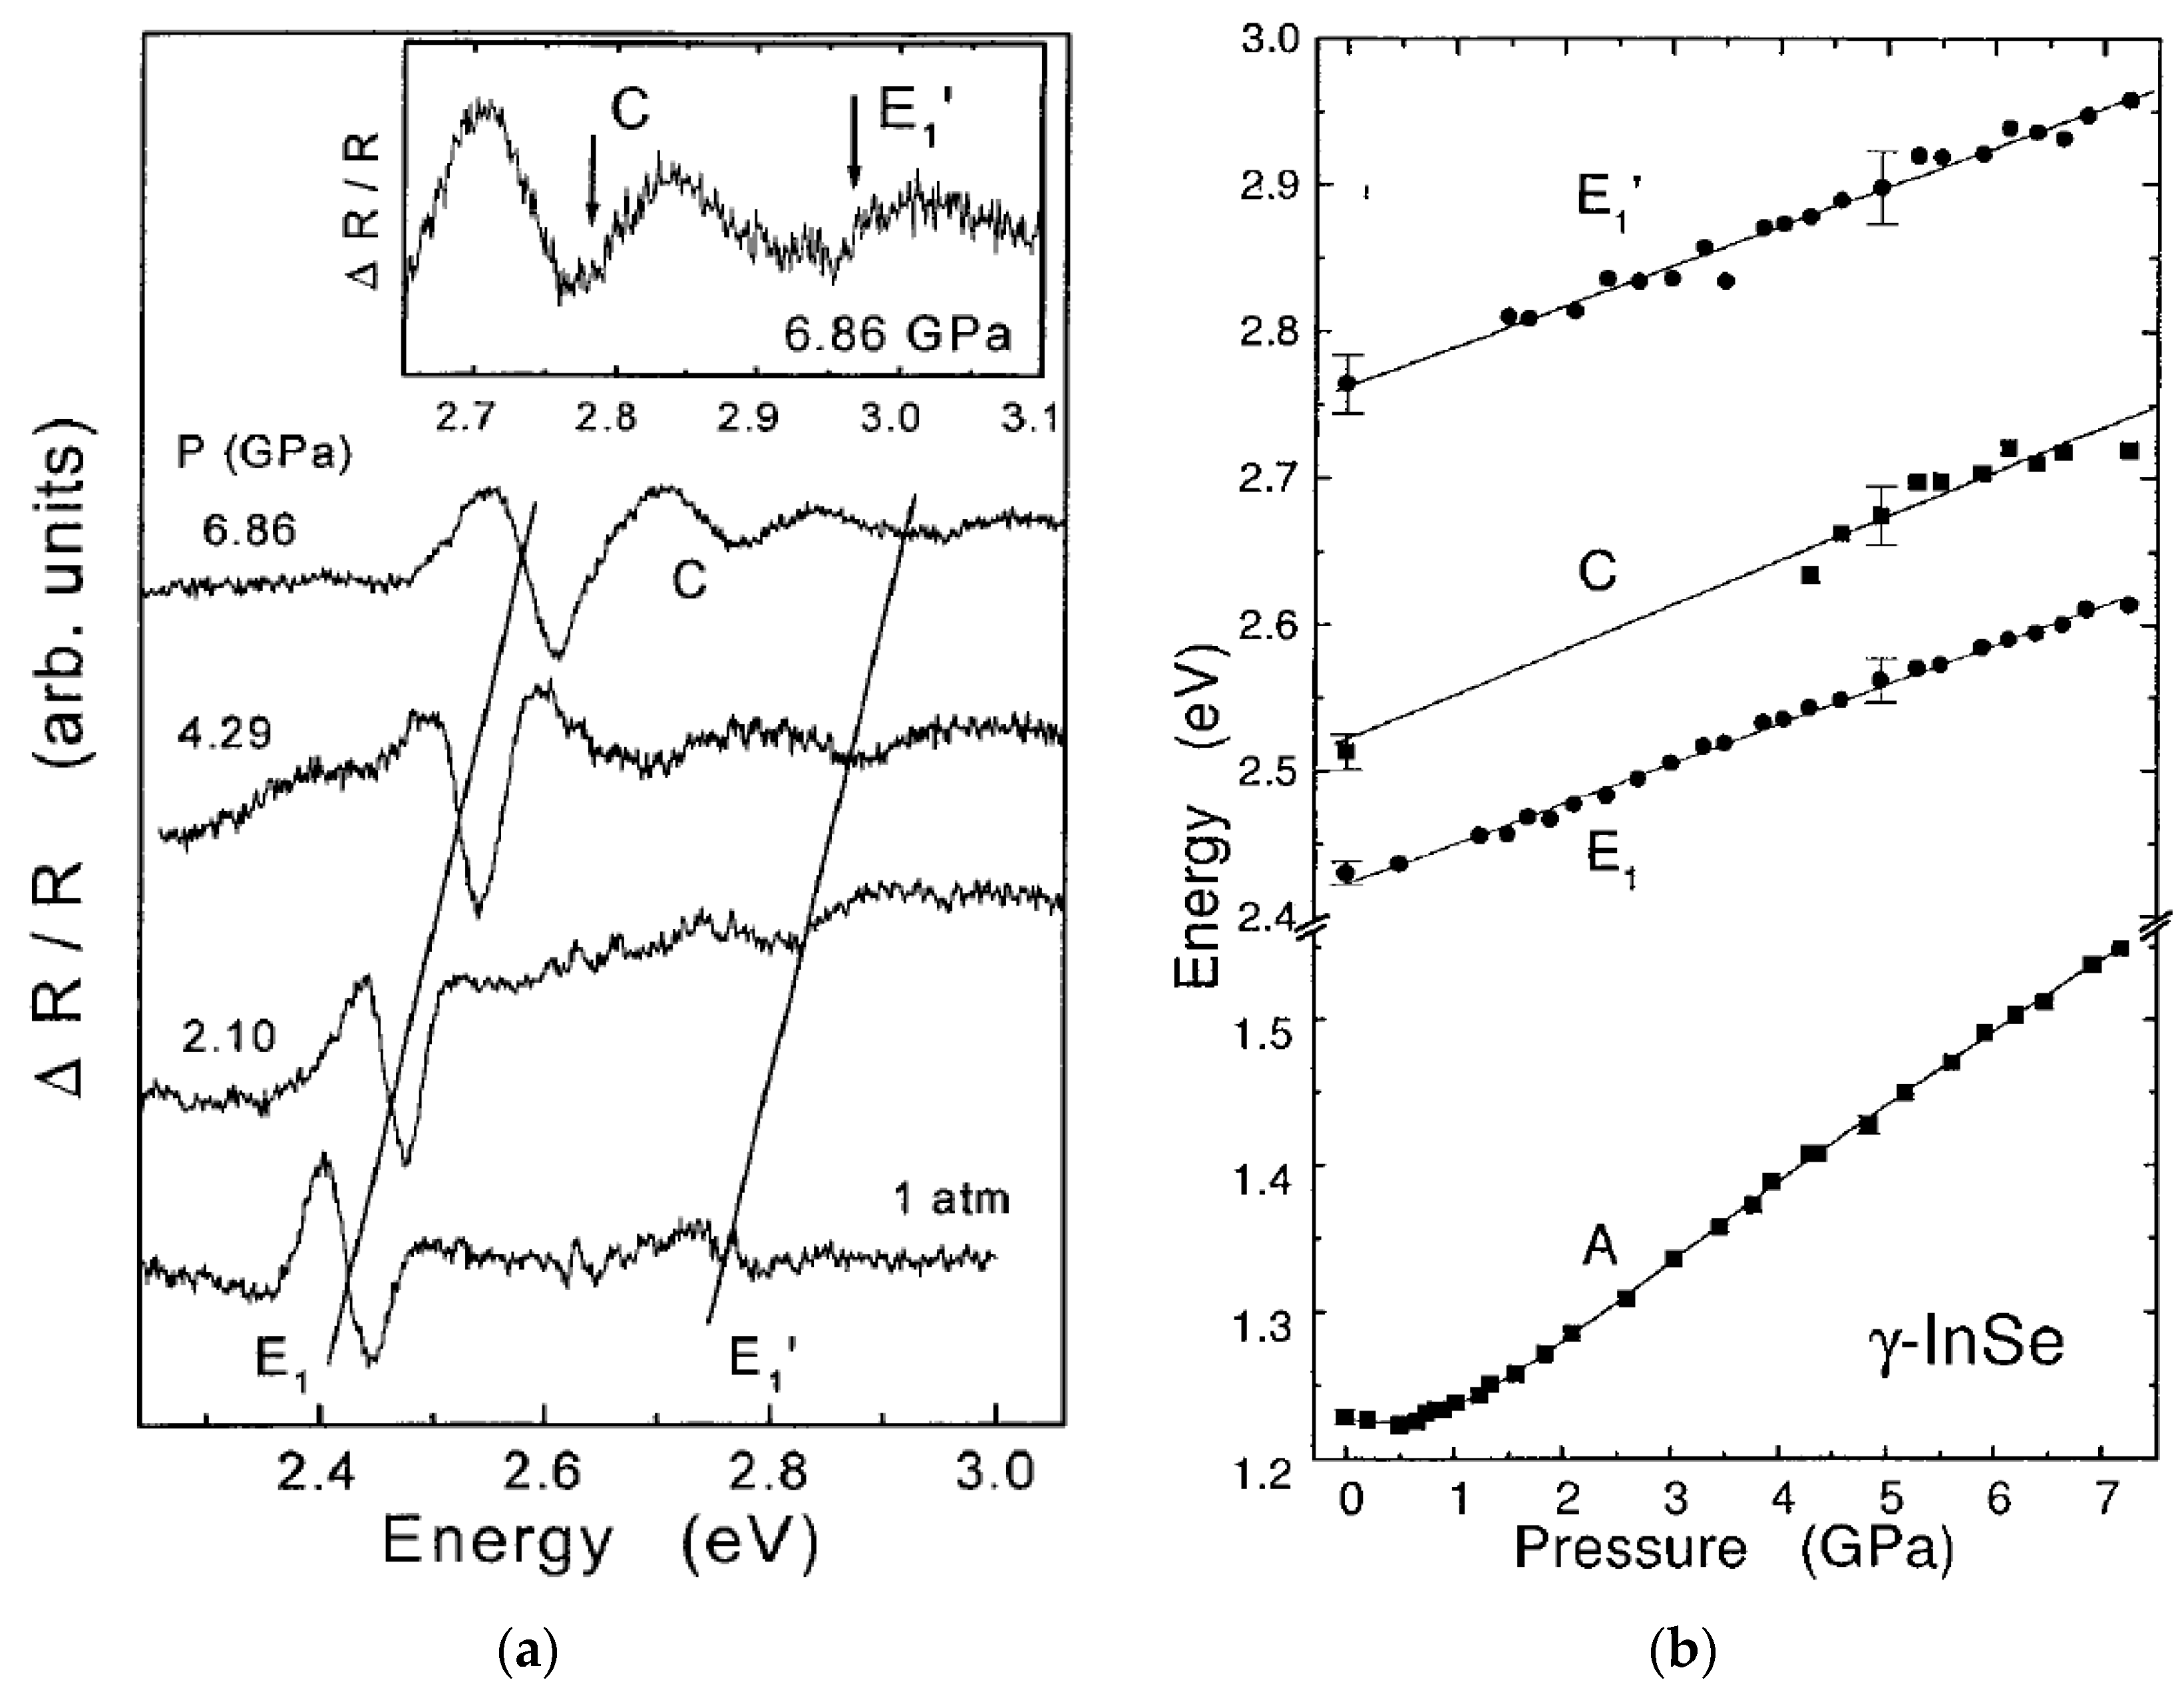
A series of later experiments on the optical properties of γ-InSe under high pressure contributed to improve the picture of its electronic structure with the crucial help of modern DFT-LDA ab-initio electronic structure calculations. Ulrich et al. [62] reported the pressure dependence of the three direct transitions described in Figure 6, as obtained from photo-modulated reflectance (PMR) measurements in DAC. Figure 10a shows the PMR spectrum of InSe in the range of the high photon energy fully allowed direct transitions E1 and E1′, whose pressure dependence, along with that of the fundamental gap is shown in Figure 10b. These results confirm the previously discussed ones by Kuroda et al. [23], showing that E1 and E1′ direct transitions do not exhibit the extreme nonlinear behavior of the fundamental gap. From the pressure dependence of the three transitions given in Figure 10b, one can determine the pressure dependence of the energy differences EV1-EV2 and EV1-EV3 between the upper VBM and the second and third valence bands at the Z point. These energies correspond to E1-Egd and E1′-Egd. They slightly increase in the low-pressure range, but quickly decrease above 1 GPa. At 7 GPa they are nearly 20% below their value at ambient pressure. As previously discussed, this behavior increases the contribution of Se pxy states to the VBM.
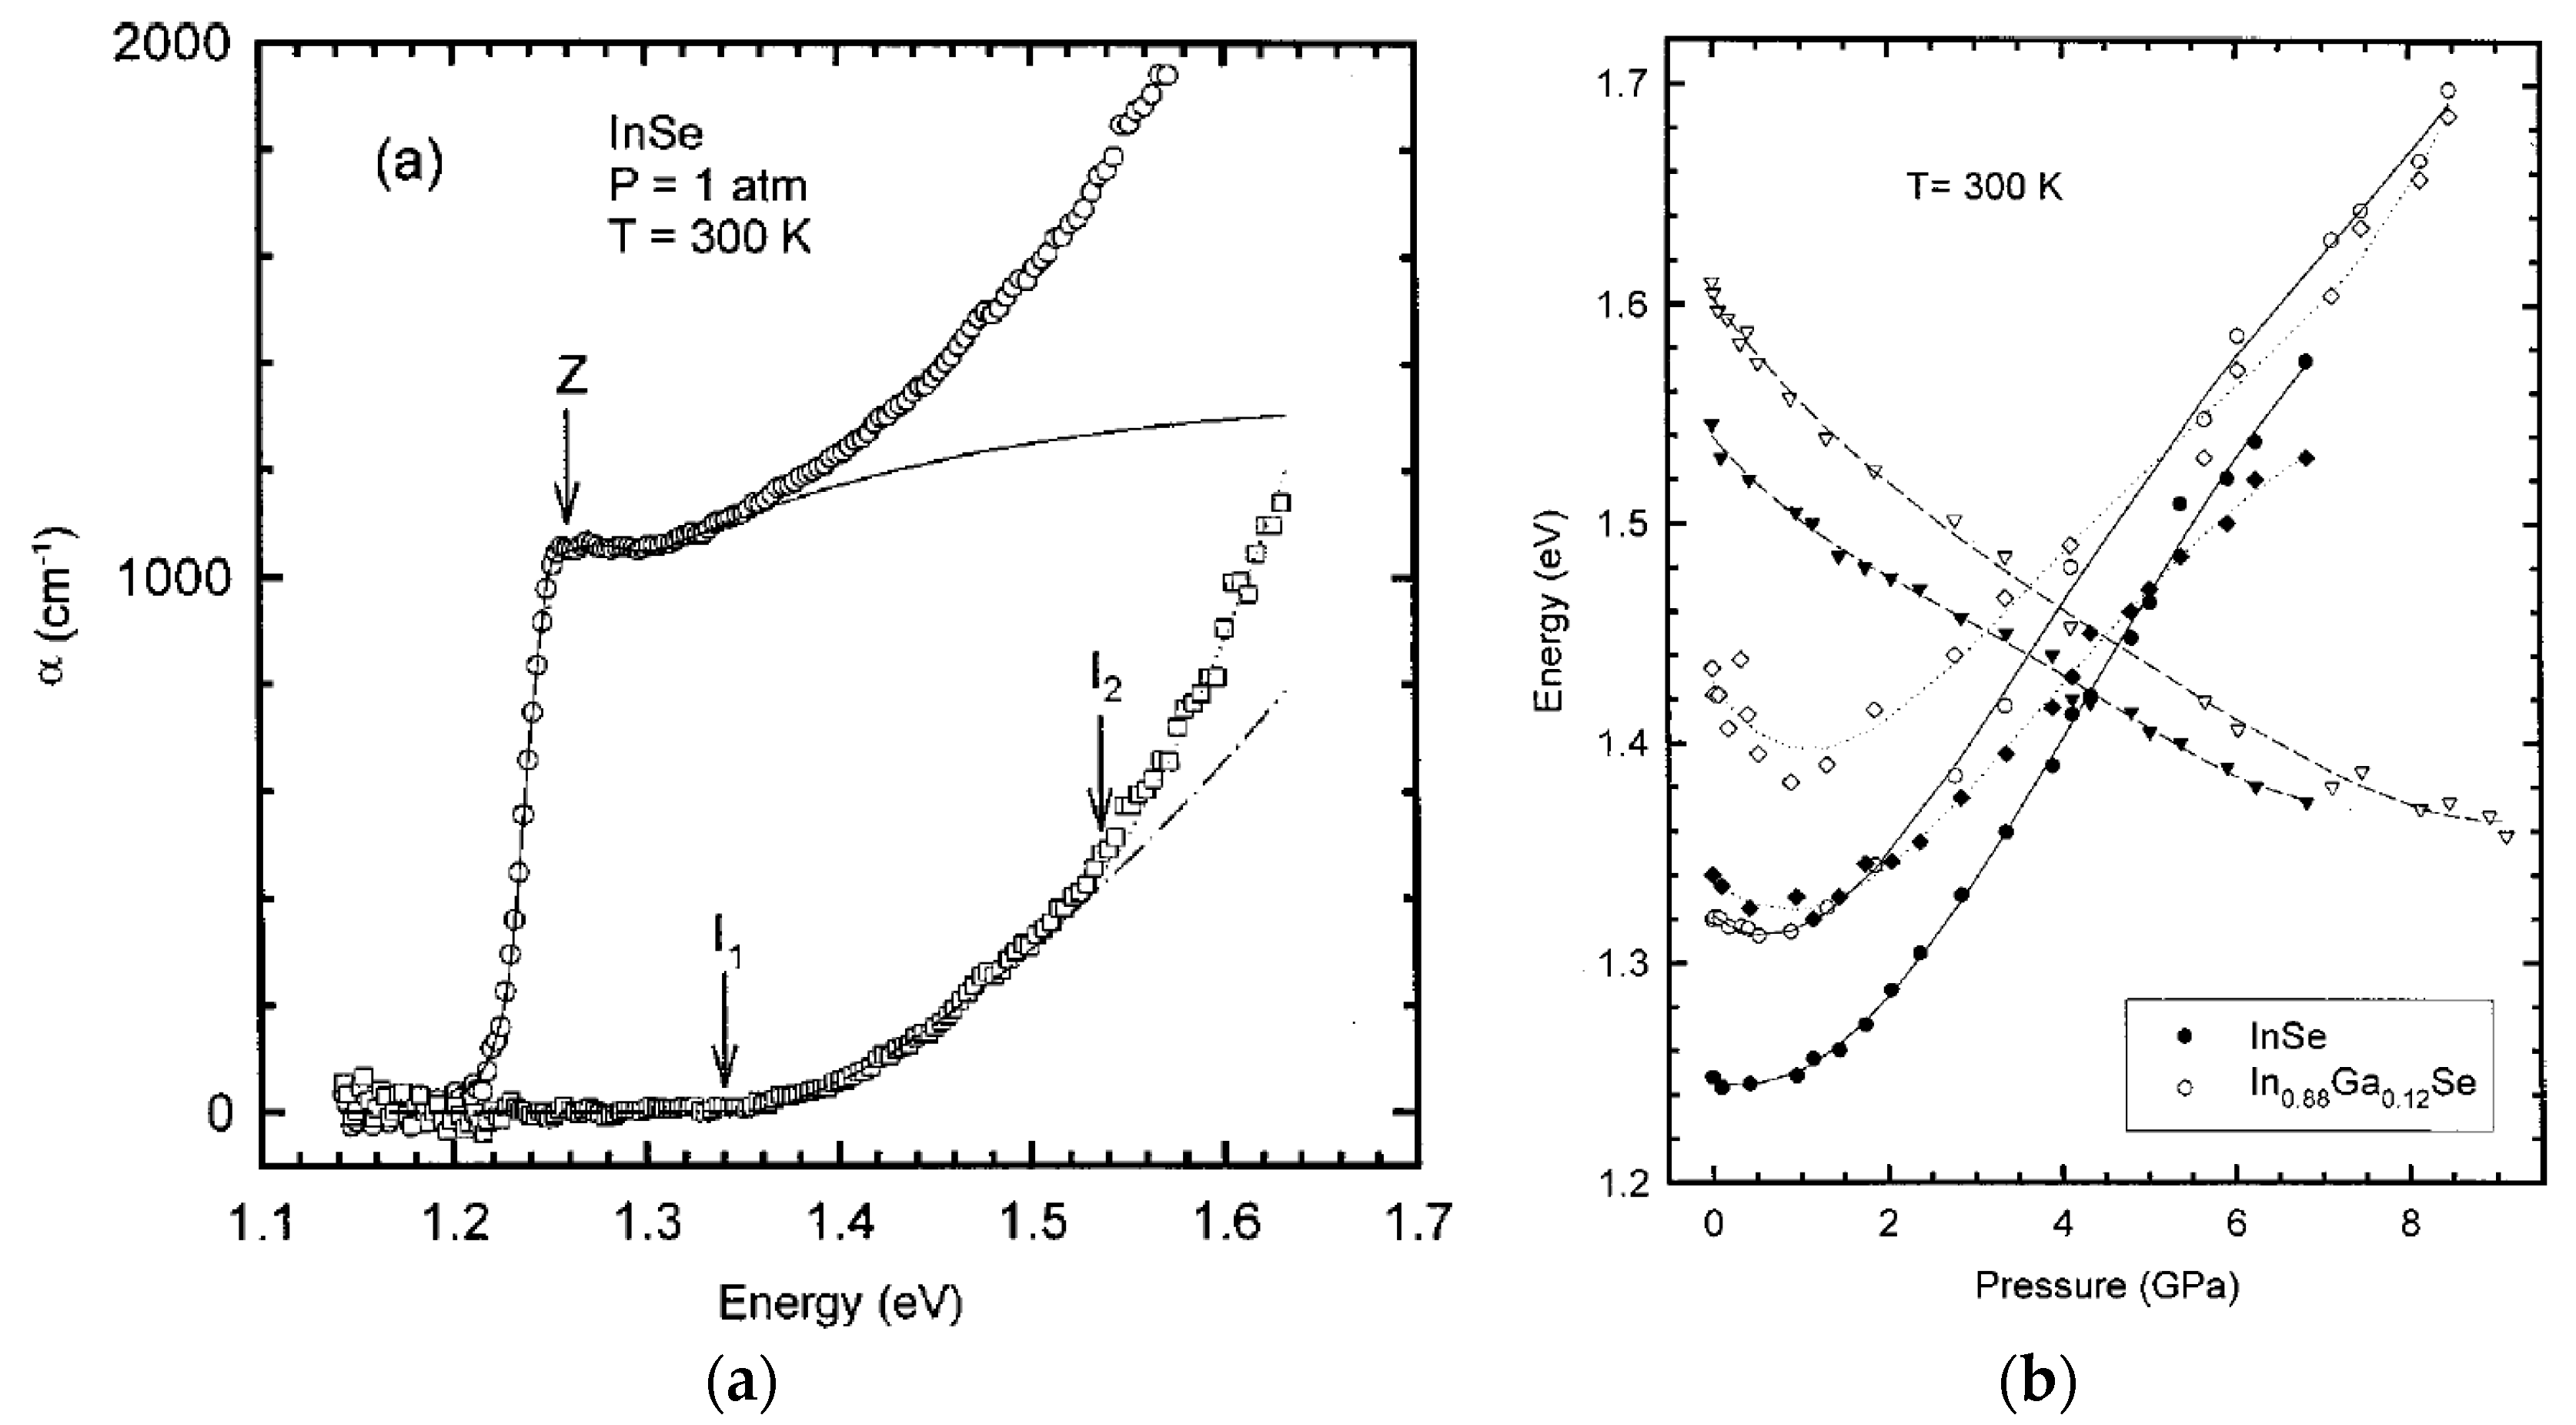
The role of the direct-to-indirect crossovers in InSe was further investigated in a series of systematic experiments combined with DFT-LDA ab-initio calculations by Manjón et al. [63,64]. Through a detailed analysis of the absorption edge, illustrated in Figure 11a, it was shown that two different direct-to-indirect cross-over occur in InSe in the pressure range up to 4 GPa. These crossovers are consistently reflected in the shape of the absorption edge and in the pressure dependence of the exciton absorption width, which increases under pressure with two clearly defined onsets [64].
In this way, the pressure dependence of the fundamental direct gap (Z in Figure 11a) and the two indirect transitions (I1 and I2 in Figure 11a) could be determined, as shown in Figure 11b.
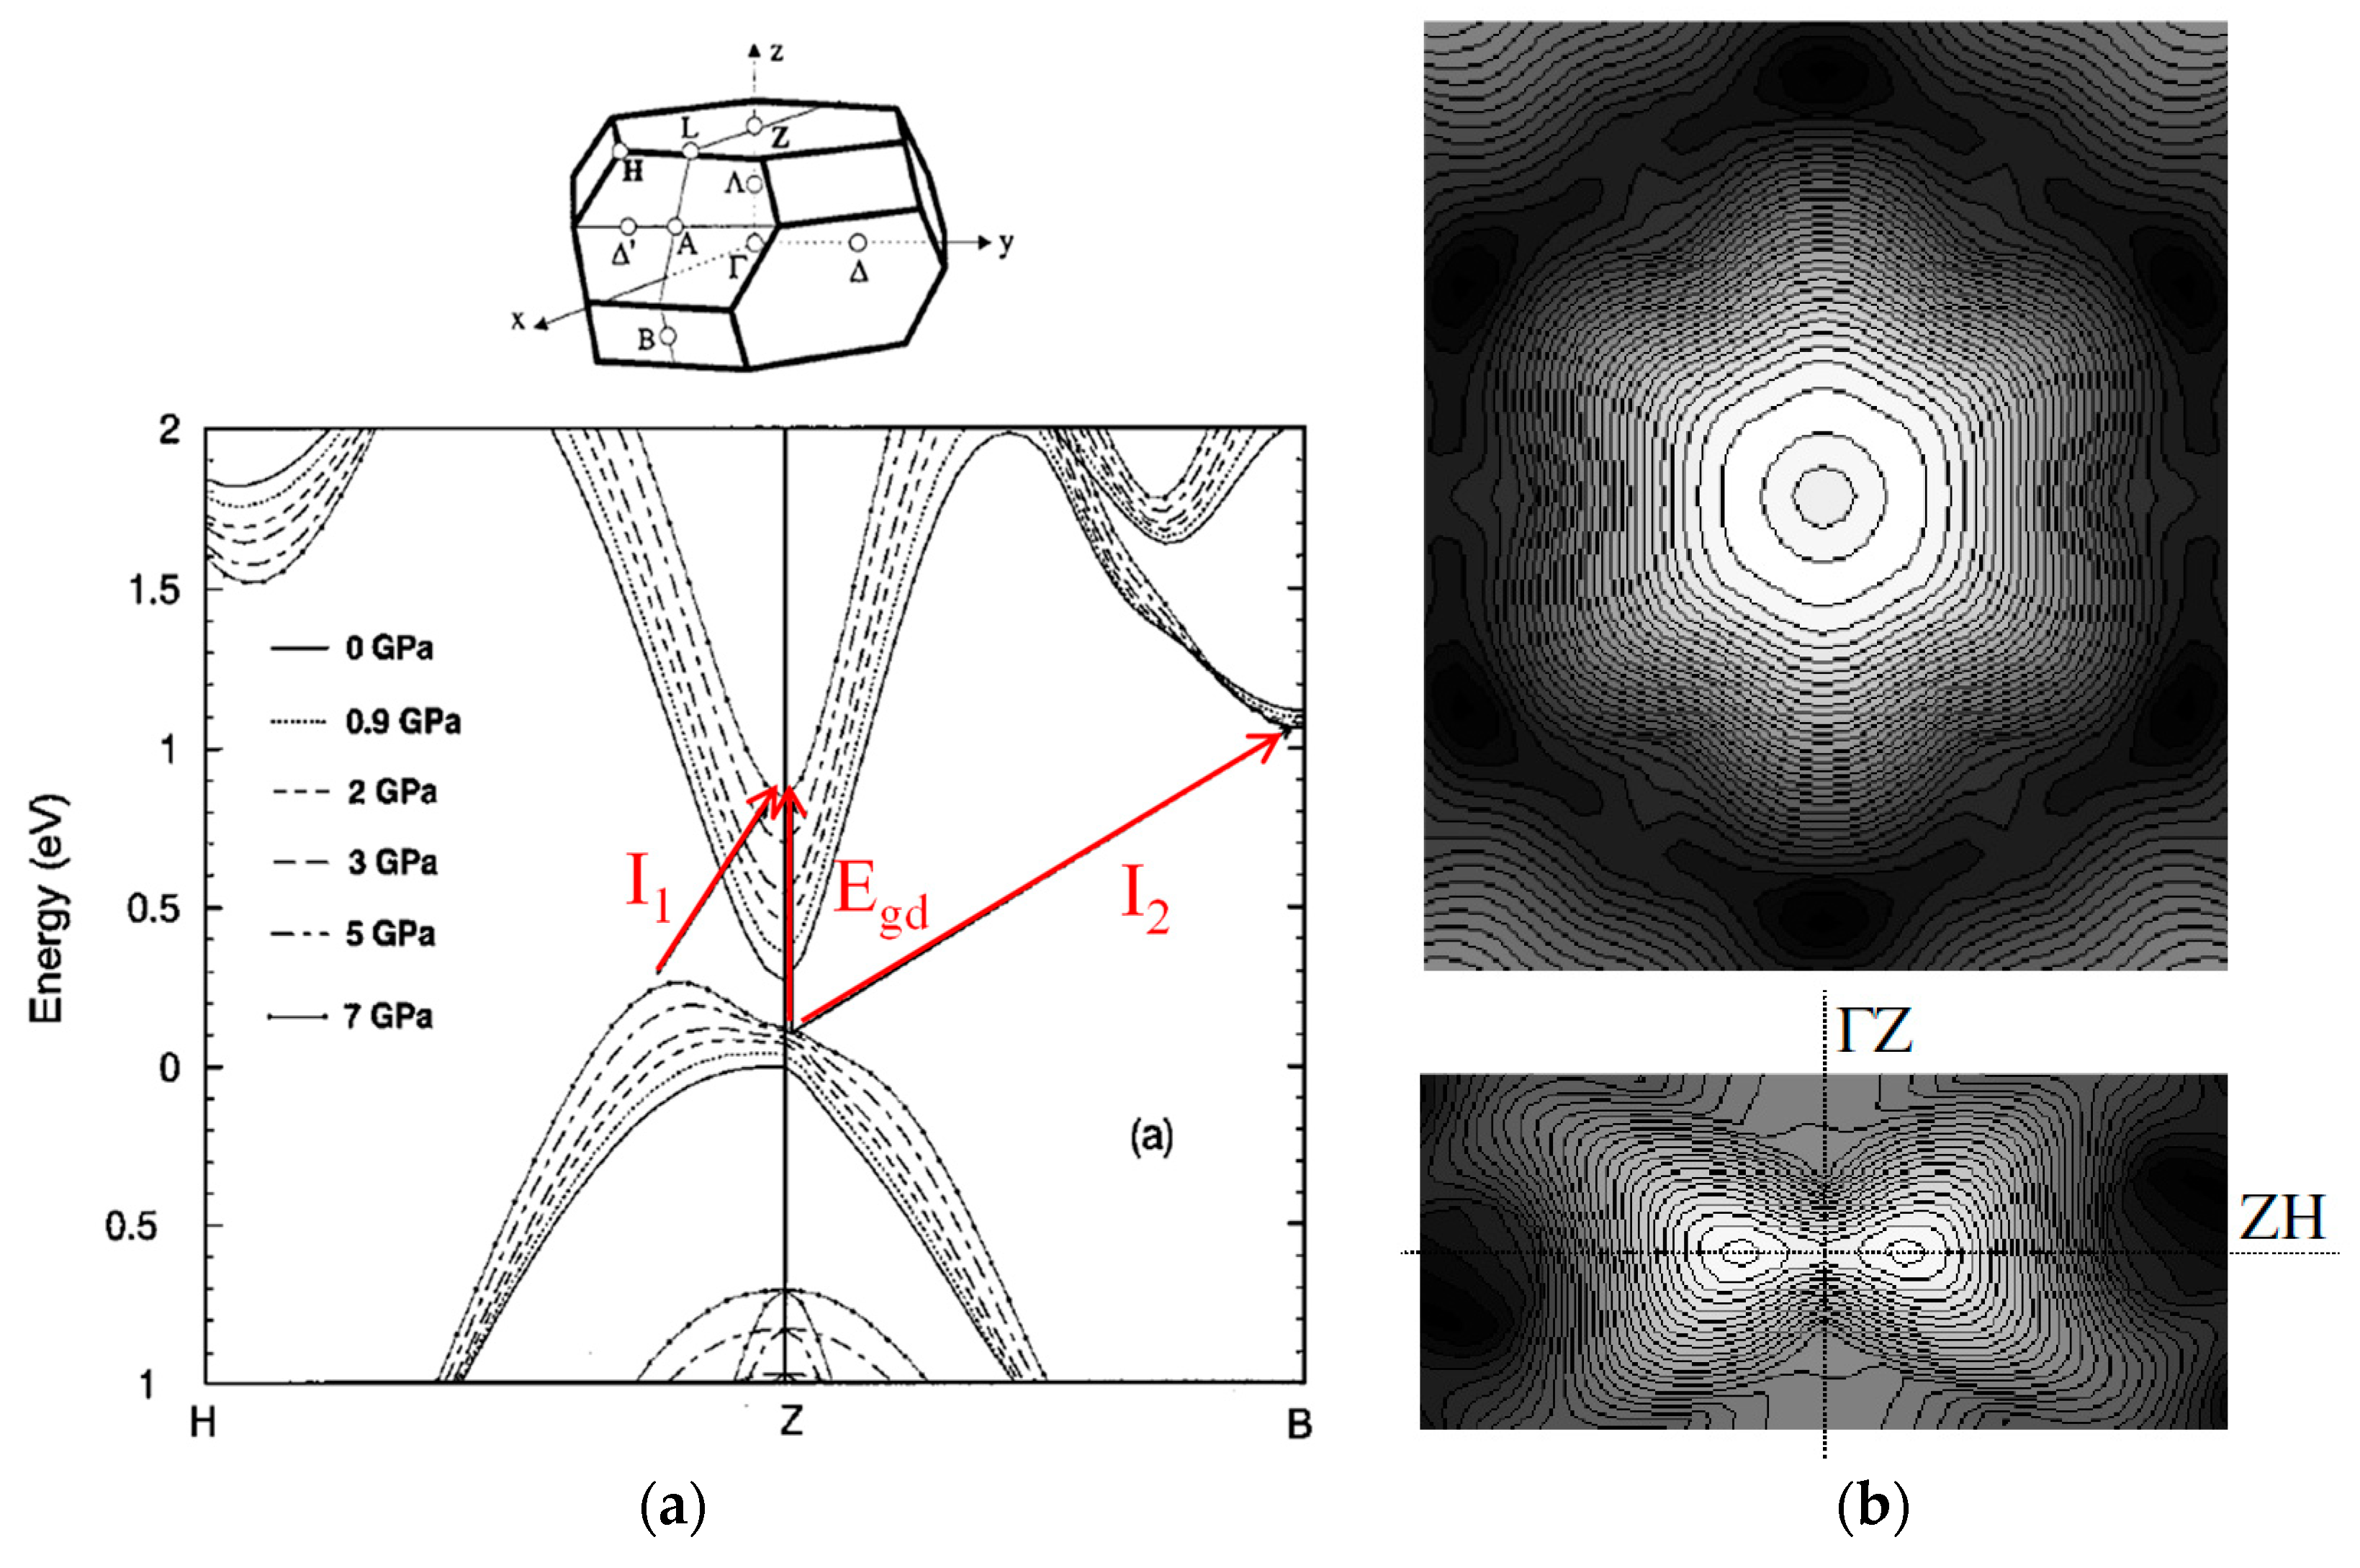
The band structure of γ-InSe was calculated using ab-initio DFT-LDA methods, including paths in the BZ that had not been explored in previous calculations [62] but were included in later ones [65,66]. As pressure increases, the VBM undergoes a dramatic change: a new maximum develops, close to the Z point, in the direction ZH. This maximum becomes the absolute VBM at about 2.5 GPa.
The transition assignment shown in Figure 12a was proposed by comparing the calculated pressure dependence of the VBM and CBM at Z, the toroidal maximum, the CBM at H, and the experimental pressure dependence of the direct and indirect transitions shown in Figure 11b.
A detailed analysis of the new VBM at 4 GPa showed that it has quasi-cylindrical symmetry around the c-axis and mirror symmetry with respect to the ZHL plane, giving rise to toroidal constant energy surfaces [37].
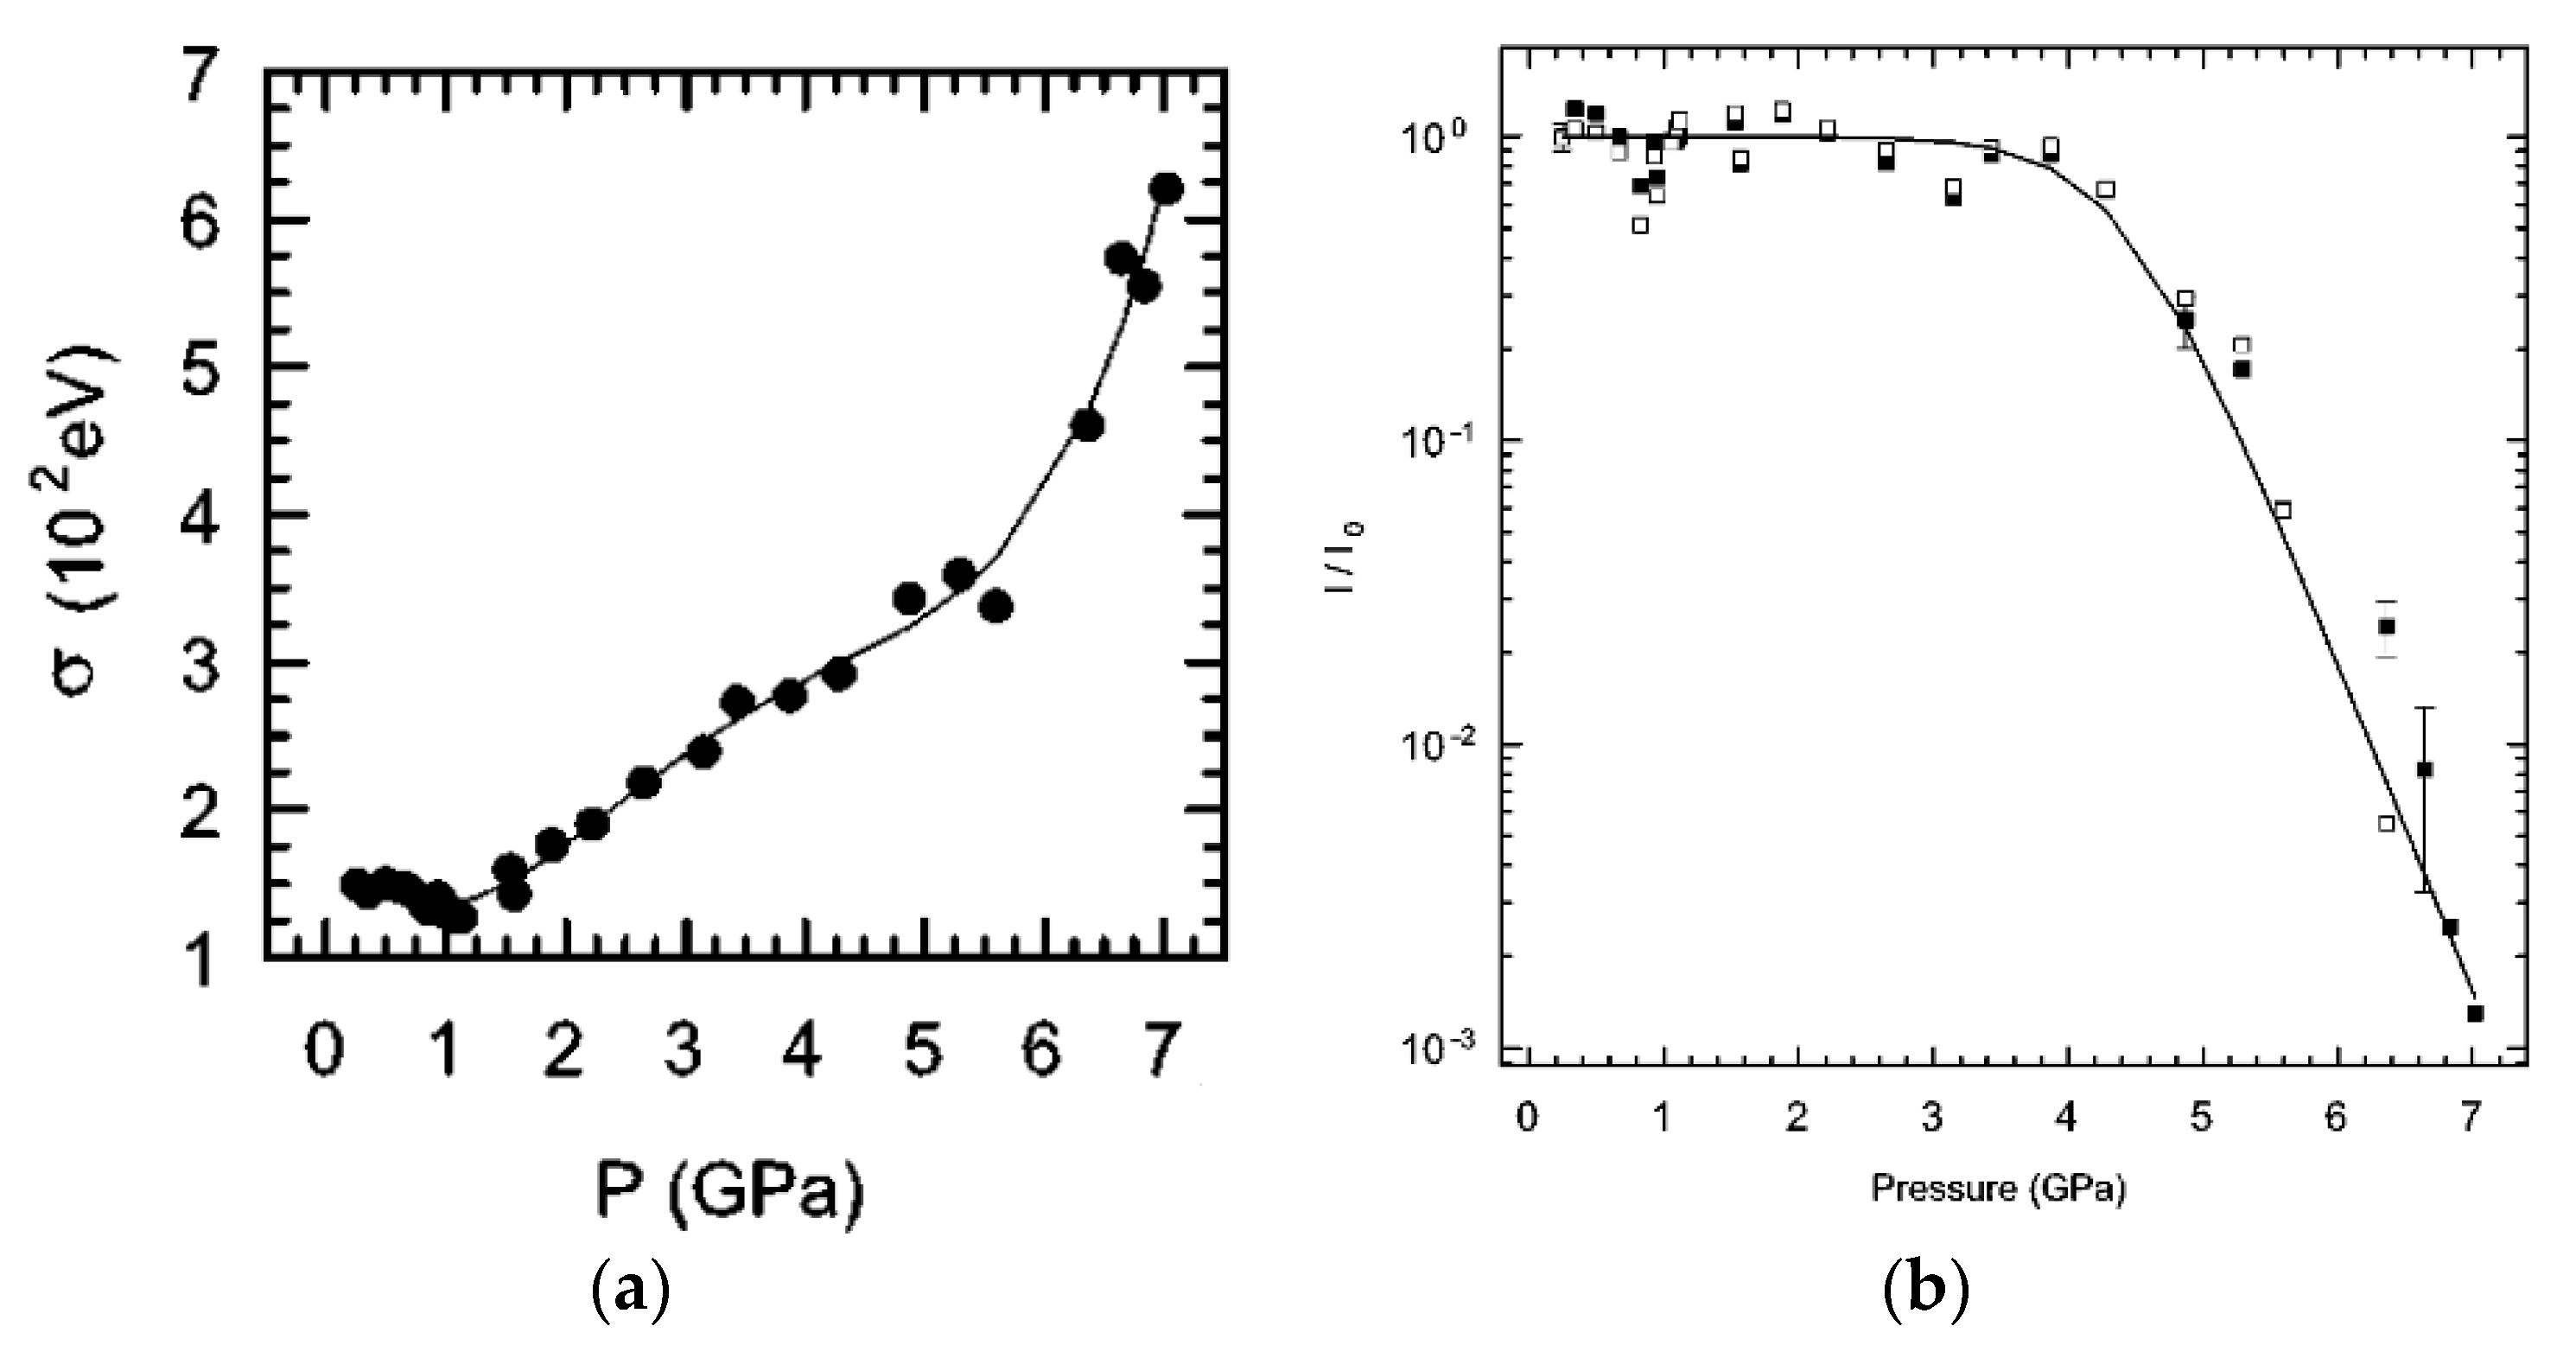
This assignment is fully consistent with later experiments on intrinsic photoluminescence (PL) under high pressure [67]. On the one side, the pressure dependence of the PL peak width clearly exhibits two onsets, as shown in Figure 13a and previously observed for the exciton peak absorption edge [64], corresponding to the direct to indirect crossovers, at the predicted pressures, as shown in Figure 12a. On the other side, the exponential quenching of the intrinsic PL intensity for pressures beyond 4 GPa, shown in Figure 13b, is consistent with the direct to indirect crossover occurring in the conduction band at that pressure. As we will see in Section 6, this crossover is also responsible for the behavior of the transport properties of n-type InSe under high pressure.
Further details on the electronic structure of InSe were obtained through magneto-optic experiments at low temperature and high pressure [68,69].
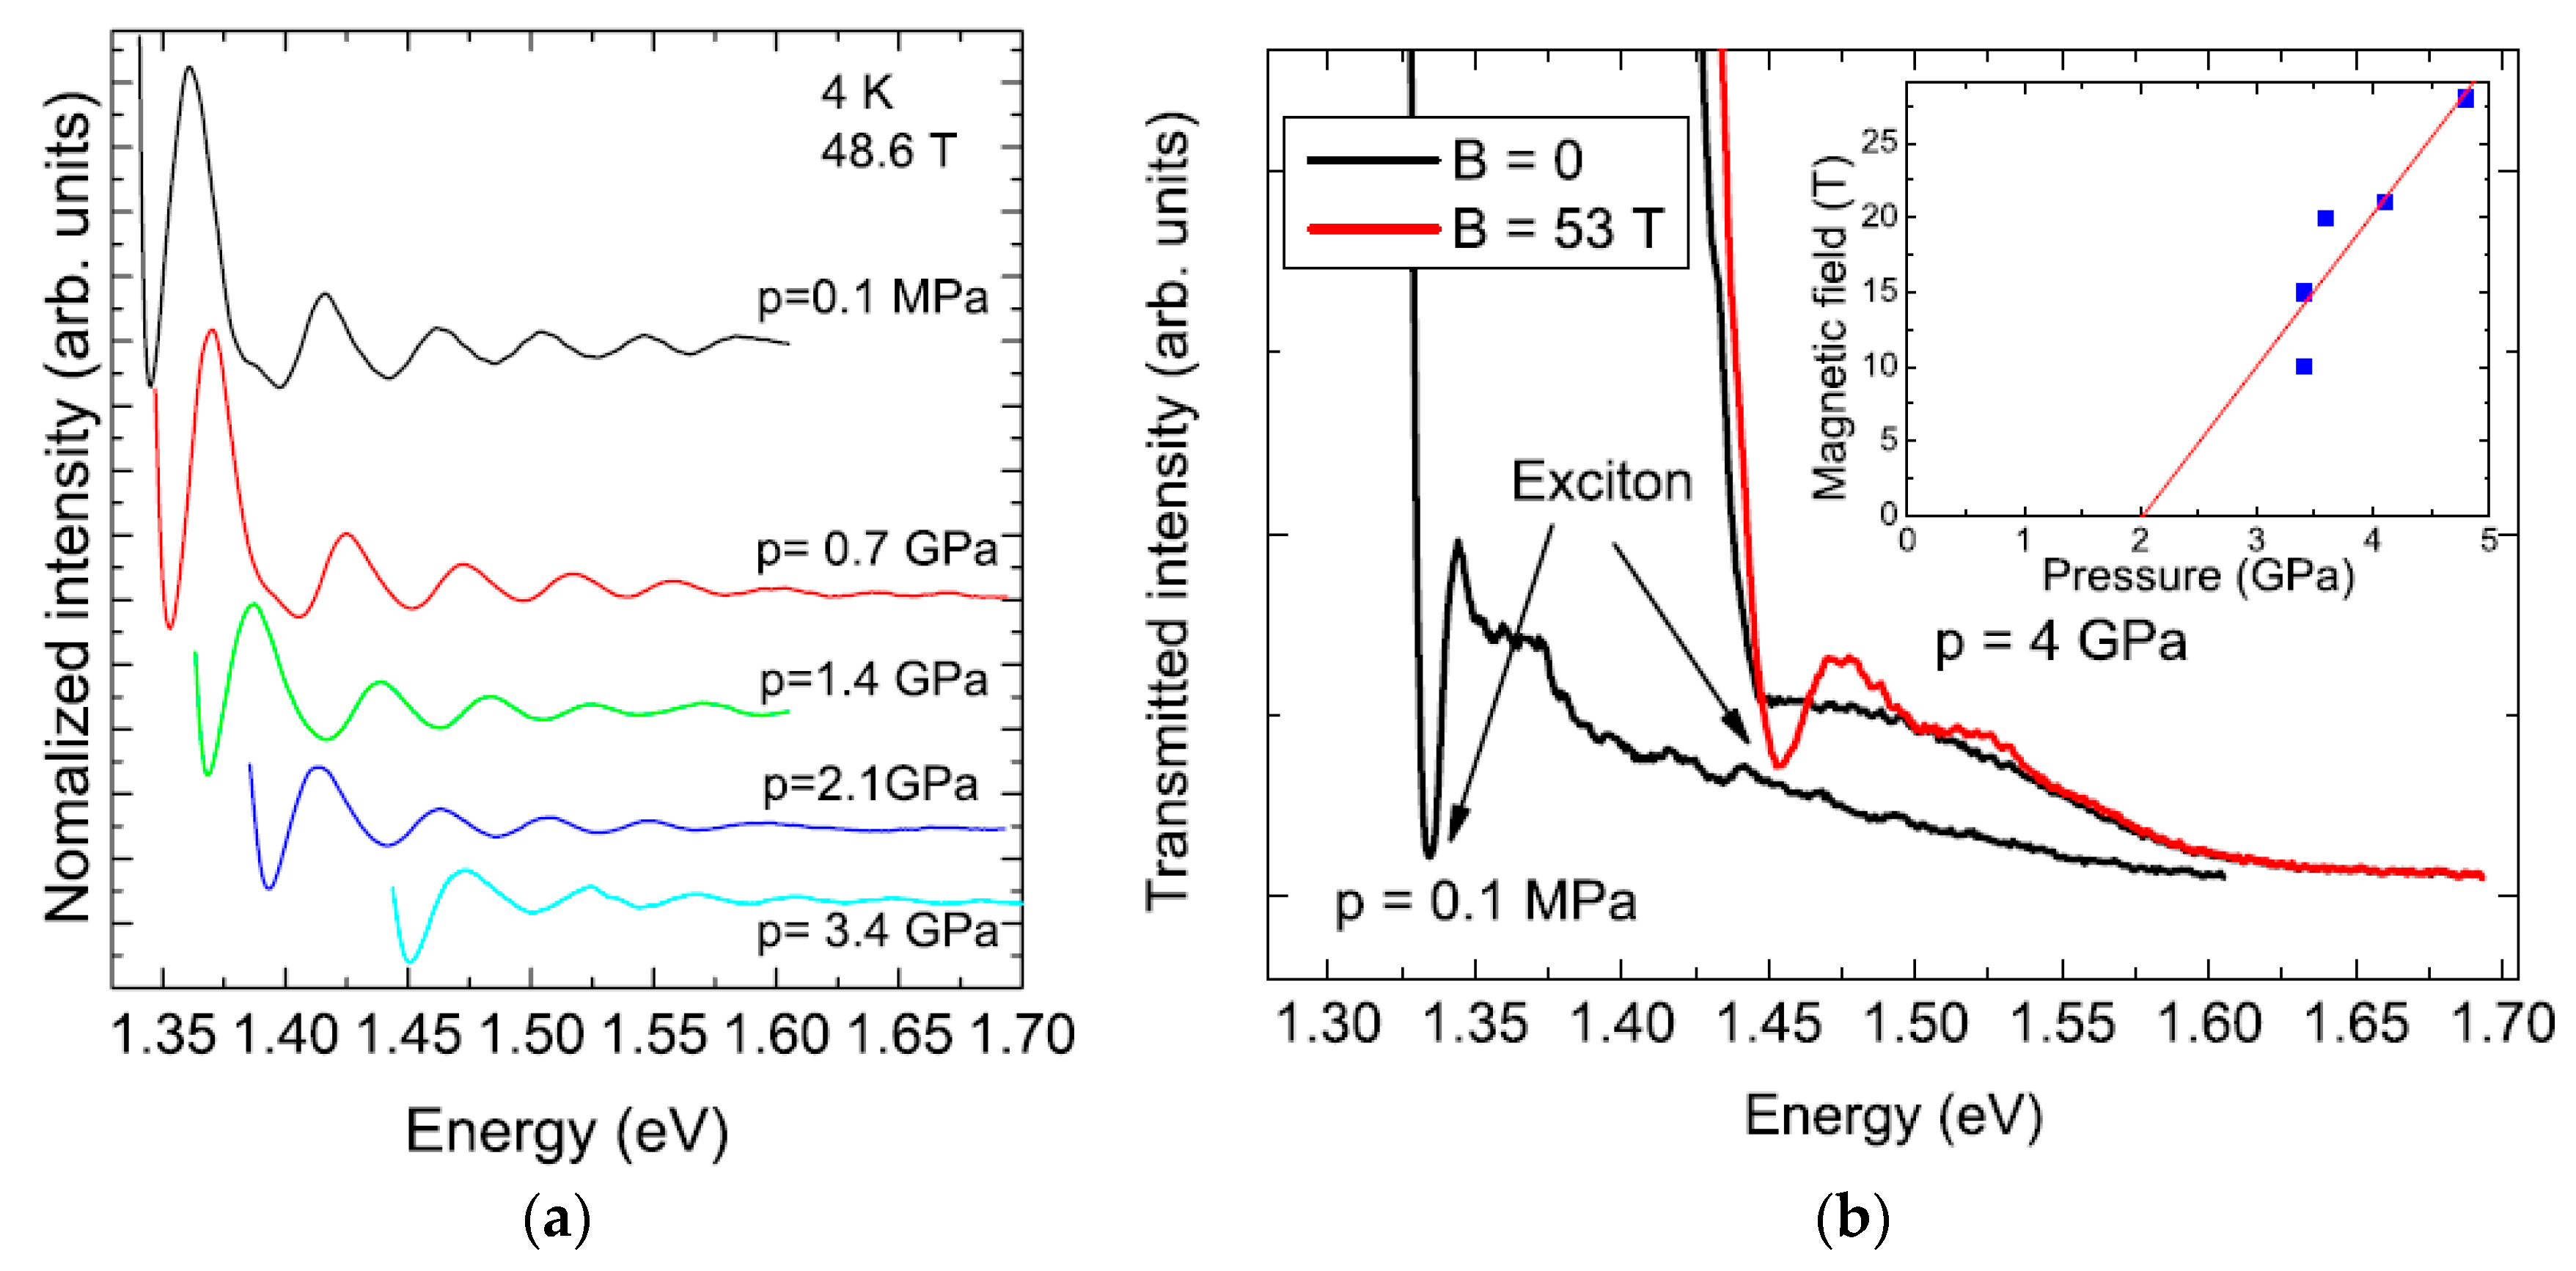
Magneto-absorption oscillations in the absorption spectrum in pulsed magnetic fields up to 56 T [69] allowed for a detailed measurement of the of the Landau levels structure as a function of pressure (Figure 14a). This led to the determination of the pressure dependence of the reduced effective mass in the layer plane () that was shown to increase linearly with pressure. In the framework of a simple model [52], this is an unexpected behavior, as the effective mass should be proportional to the bandgap and then exhibit its nonlinear behavior.
This apparent inconsistency was explained through a model adapted to the specific features of InSe band structure [34,61,66]. Given that that most intense transitions for polarization perpendicular to the c-axis are those named as E1 and E1′ in Figure 6, the electron effective mass in the layer plane must follow their pressure behavior and increase linearly as they actually do (Figure 7b and Figure 10b) [25,62].
On the other side, a remarkable behavior of the exciton peak was observed at high pressure and high magnetic field. In the absence of a magnetic field, the exciton peak is no longer observed at 4 GPa. Under high magnetic field, the exciton peak reappears, as shown in Figure 14b, indicating that Landau levels associated with the toroidal valence band maximum shift to lower energies quicker than those associated to the maximum at Z, that so becomes the absolute maximum. This behavior indicates that the hole effective mass at the toroidal maximum is much smaller than the effective mass at Z. The magnetic field at which the exciton peak reappears increases with pressure, as the inset in Figure 14b shows. This effect allows for an estimation of the hole effective mass in the toroidal maximum [69].
It is important to notice that none of the ab-initio band structure calculations discussed in this section gives quantitative account of the extreme non-linear behavior of the pressure dependence of the bandgap. This seems to be related to the inability of DFT-LDA calculations to deal with Van der Waals interactions. Several attempts to give quantitative account of the nonlinear behavior of the bandgap, based in empirical deformation potential models, were proposed in References [25,57] or [61]. All these empirical models share simple assumptions about intra and interlayer compressibilities that are hardly compatible with the complex pressure behavior of the intralayer bond-lengths and bond-angles revealed by XRD diffraction and absorption experiments under pressure, as discussed in Section 1.
3.2. Electronic Structure of High Pressure Phases
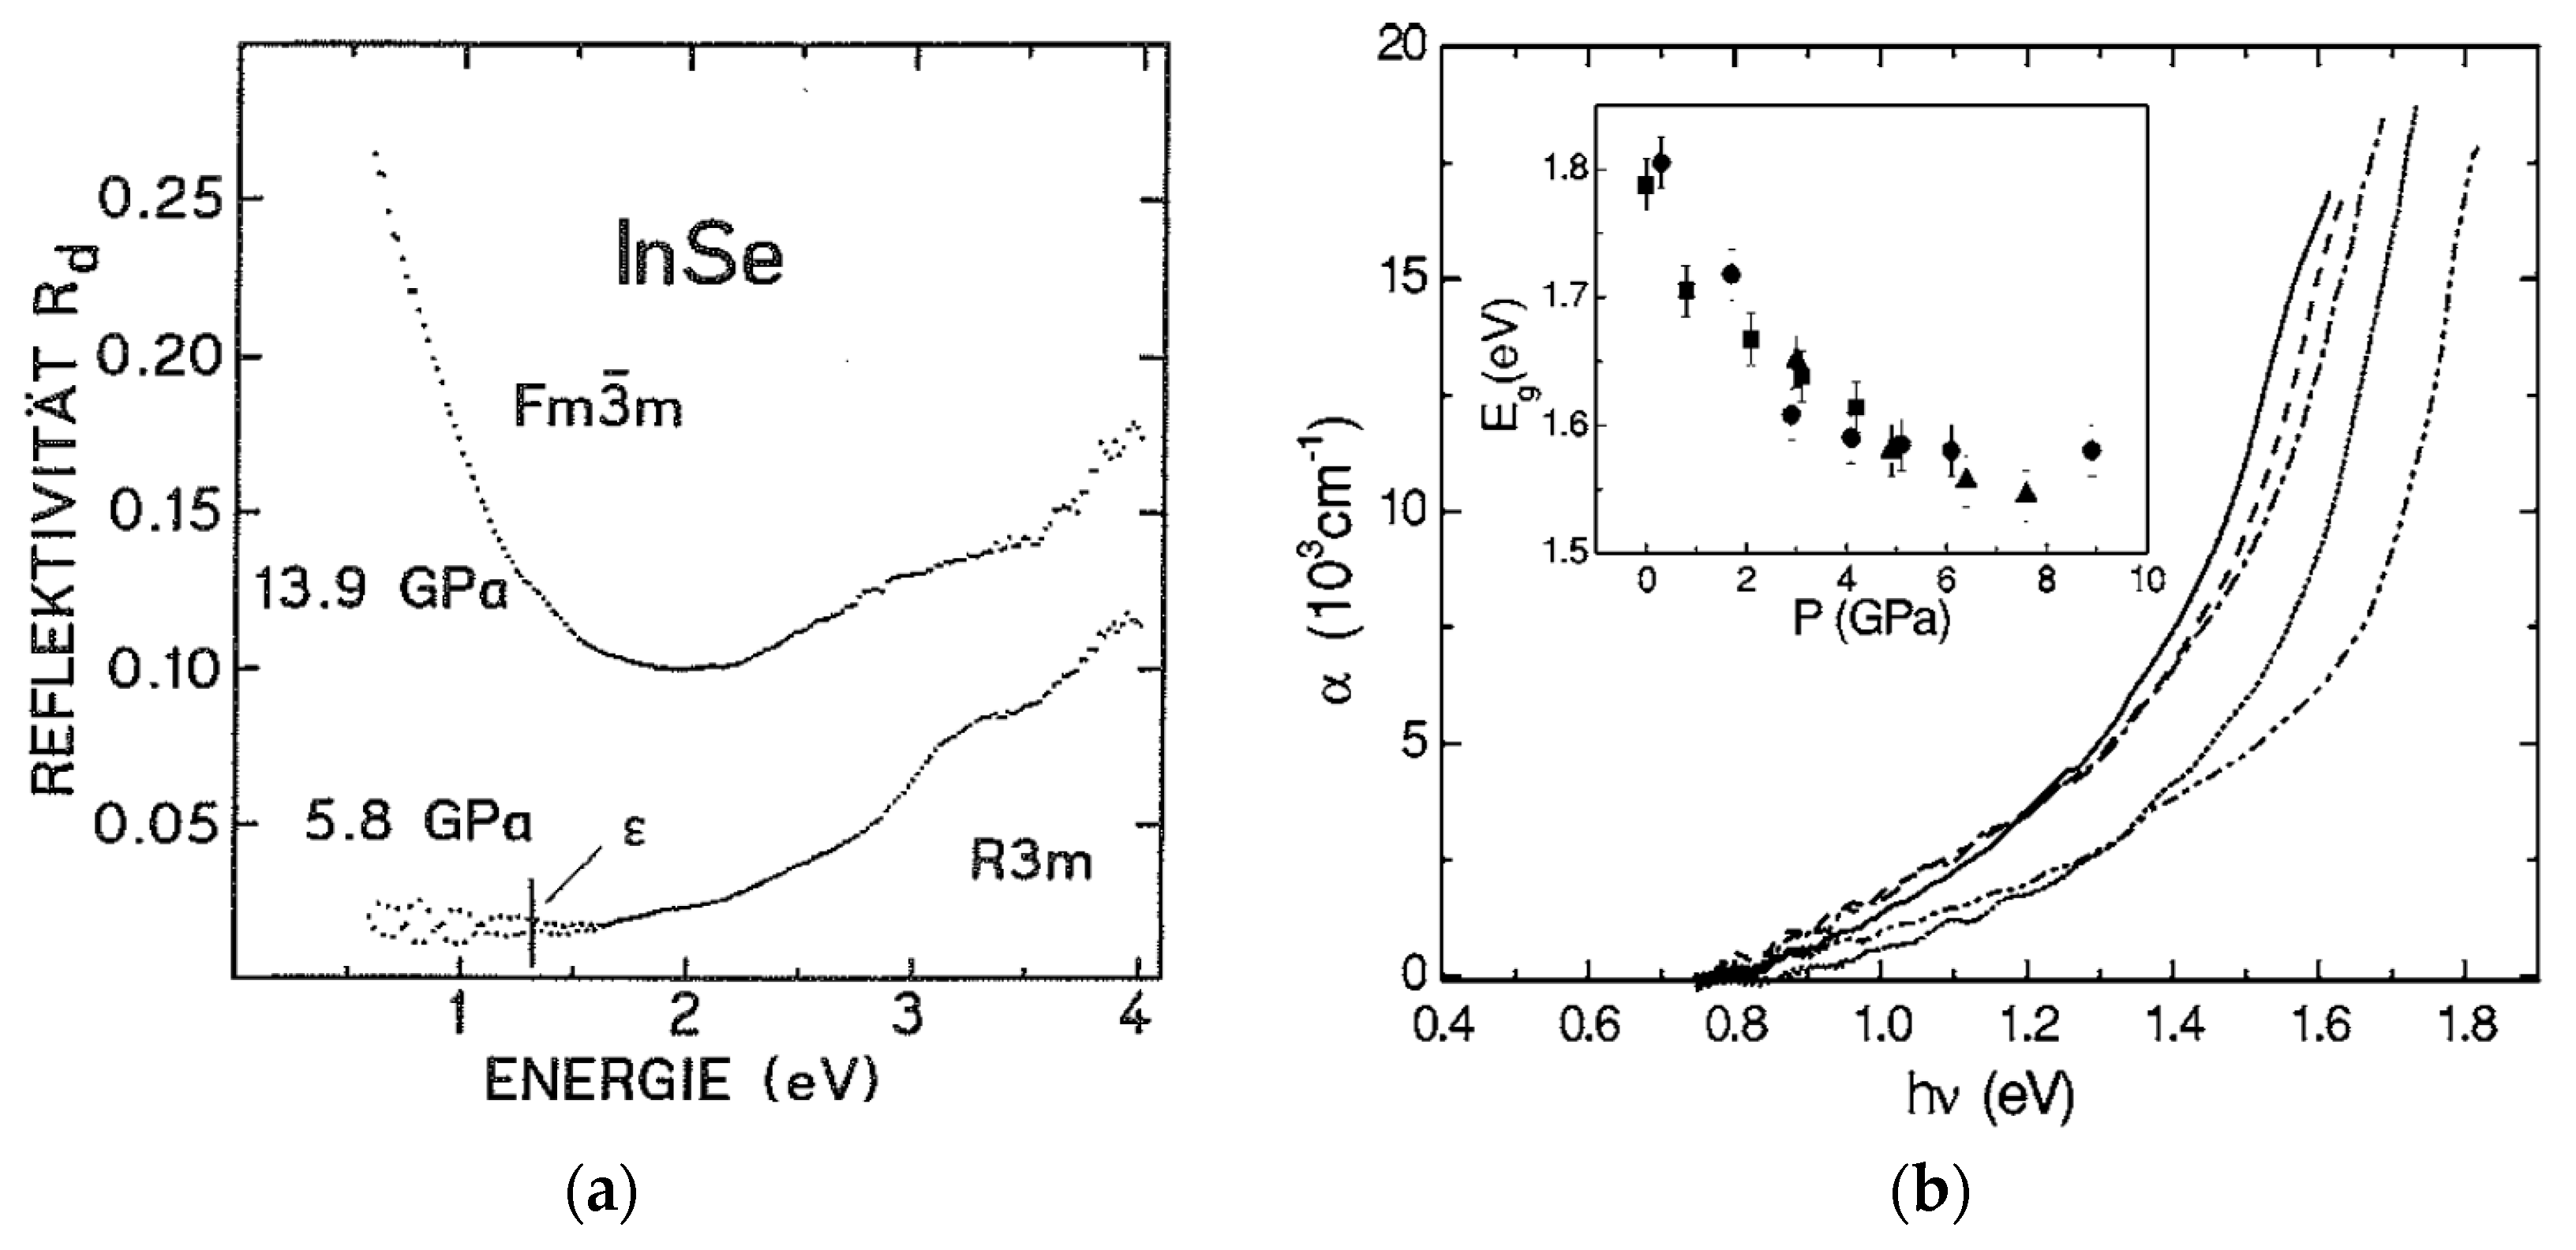
As regards the electronic structure of high pressure phases, RS-InSe was shown to be a metal, as expected from the odd number of electrons per primitive unit cell and clearly confirmed by its Drude-like plasma reflection in the near infrared [27,28], as shown in Figure 15a, with a plasma frequency of about 2 eV, corresponding to a carrier concentration below 1022 cm−3.
Both band structure calculations and optical measurements indicate that monoclinic InSe is a semiconductor with a bandgap of the order of 1.6–1.8 eV at ambient pressure, as shown in Figure 15(b) [41,70]. Band structure calculations predict a small band overlapping in tetragonal InSe [41], but no bandgap closure was observed in the transition from the MC to the T phase [30]. Also, as we will discuss in Section 4, no indication of metallization was observed in the Raman effect spectrum at the transition pressure [30]. Thus, tetragonal InSe is most probably a low gap semiconductor. As regards CsCl cubic InSe [44], it must necessarily be a metal, given its odd number of electrons per primitive unit cell.
4. Lattice Dynamics under High Pressure
Raman effect experiments in III–VI layered materials under high pressure have been used as a tool to investigate the structure stability and the evolution of the chemical bond anisotropy, especially the relative intensity of intra- and interlayer bonds. Lattice dynamics of β-GaS and ε-GaSe under high pressure was investigated by Polian et al. [71], Kuroda et al. [72], and Gauthier et al. [57]. The pressure coefficients of phonon modes were found to be very dependent on their intra- or interlayer character. The largest pressure coefficients were found for low-frequency, rigid-layer interlayer modes in which restoring forces are mainly determined by weak Van der Waals bonds, whose strength quickly increases under high pressure. The frequency of these modes, which only occurs in polytypes with two or more layers per primitive unit cell, nearly doubles in the pressure range up to 6 GPa. [57,71]. This behavior was also reported for ε-InSe in Raman effect measurements up to 1 GPa [73,74].
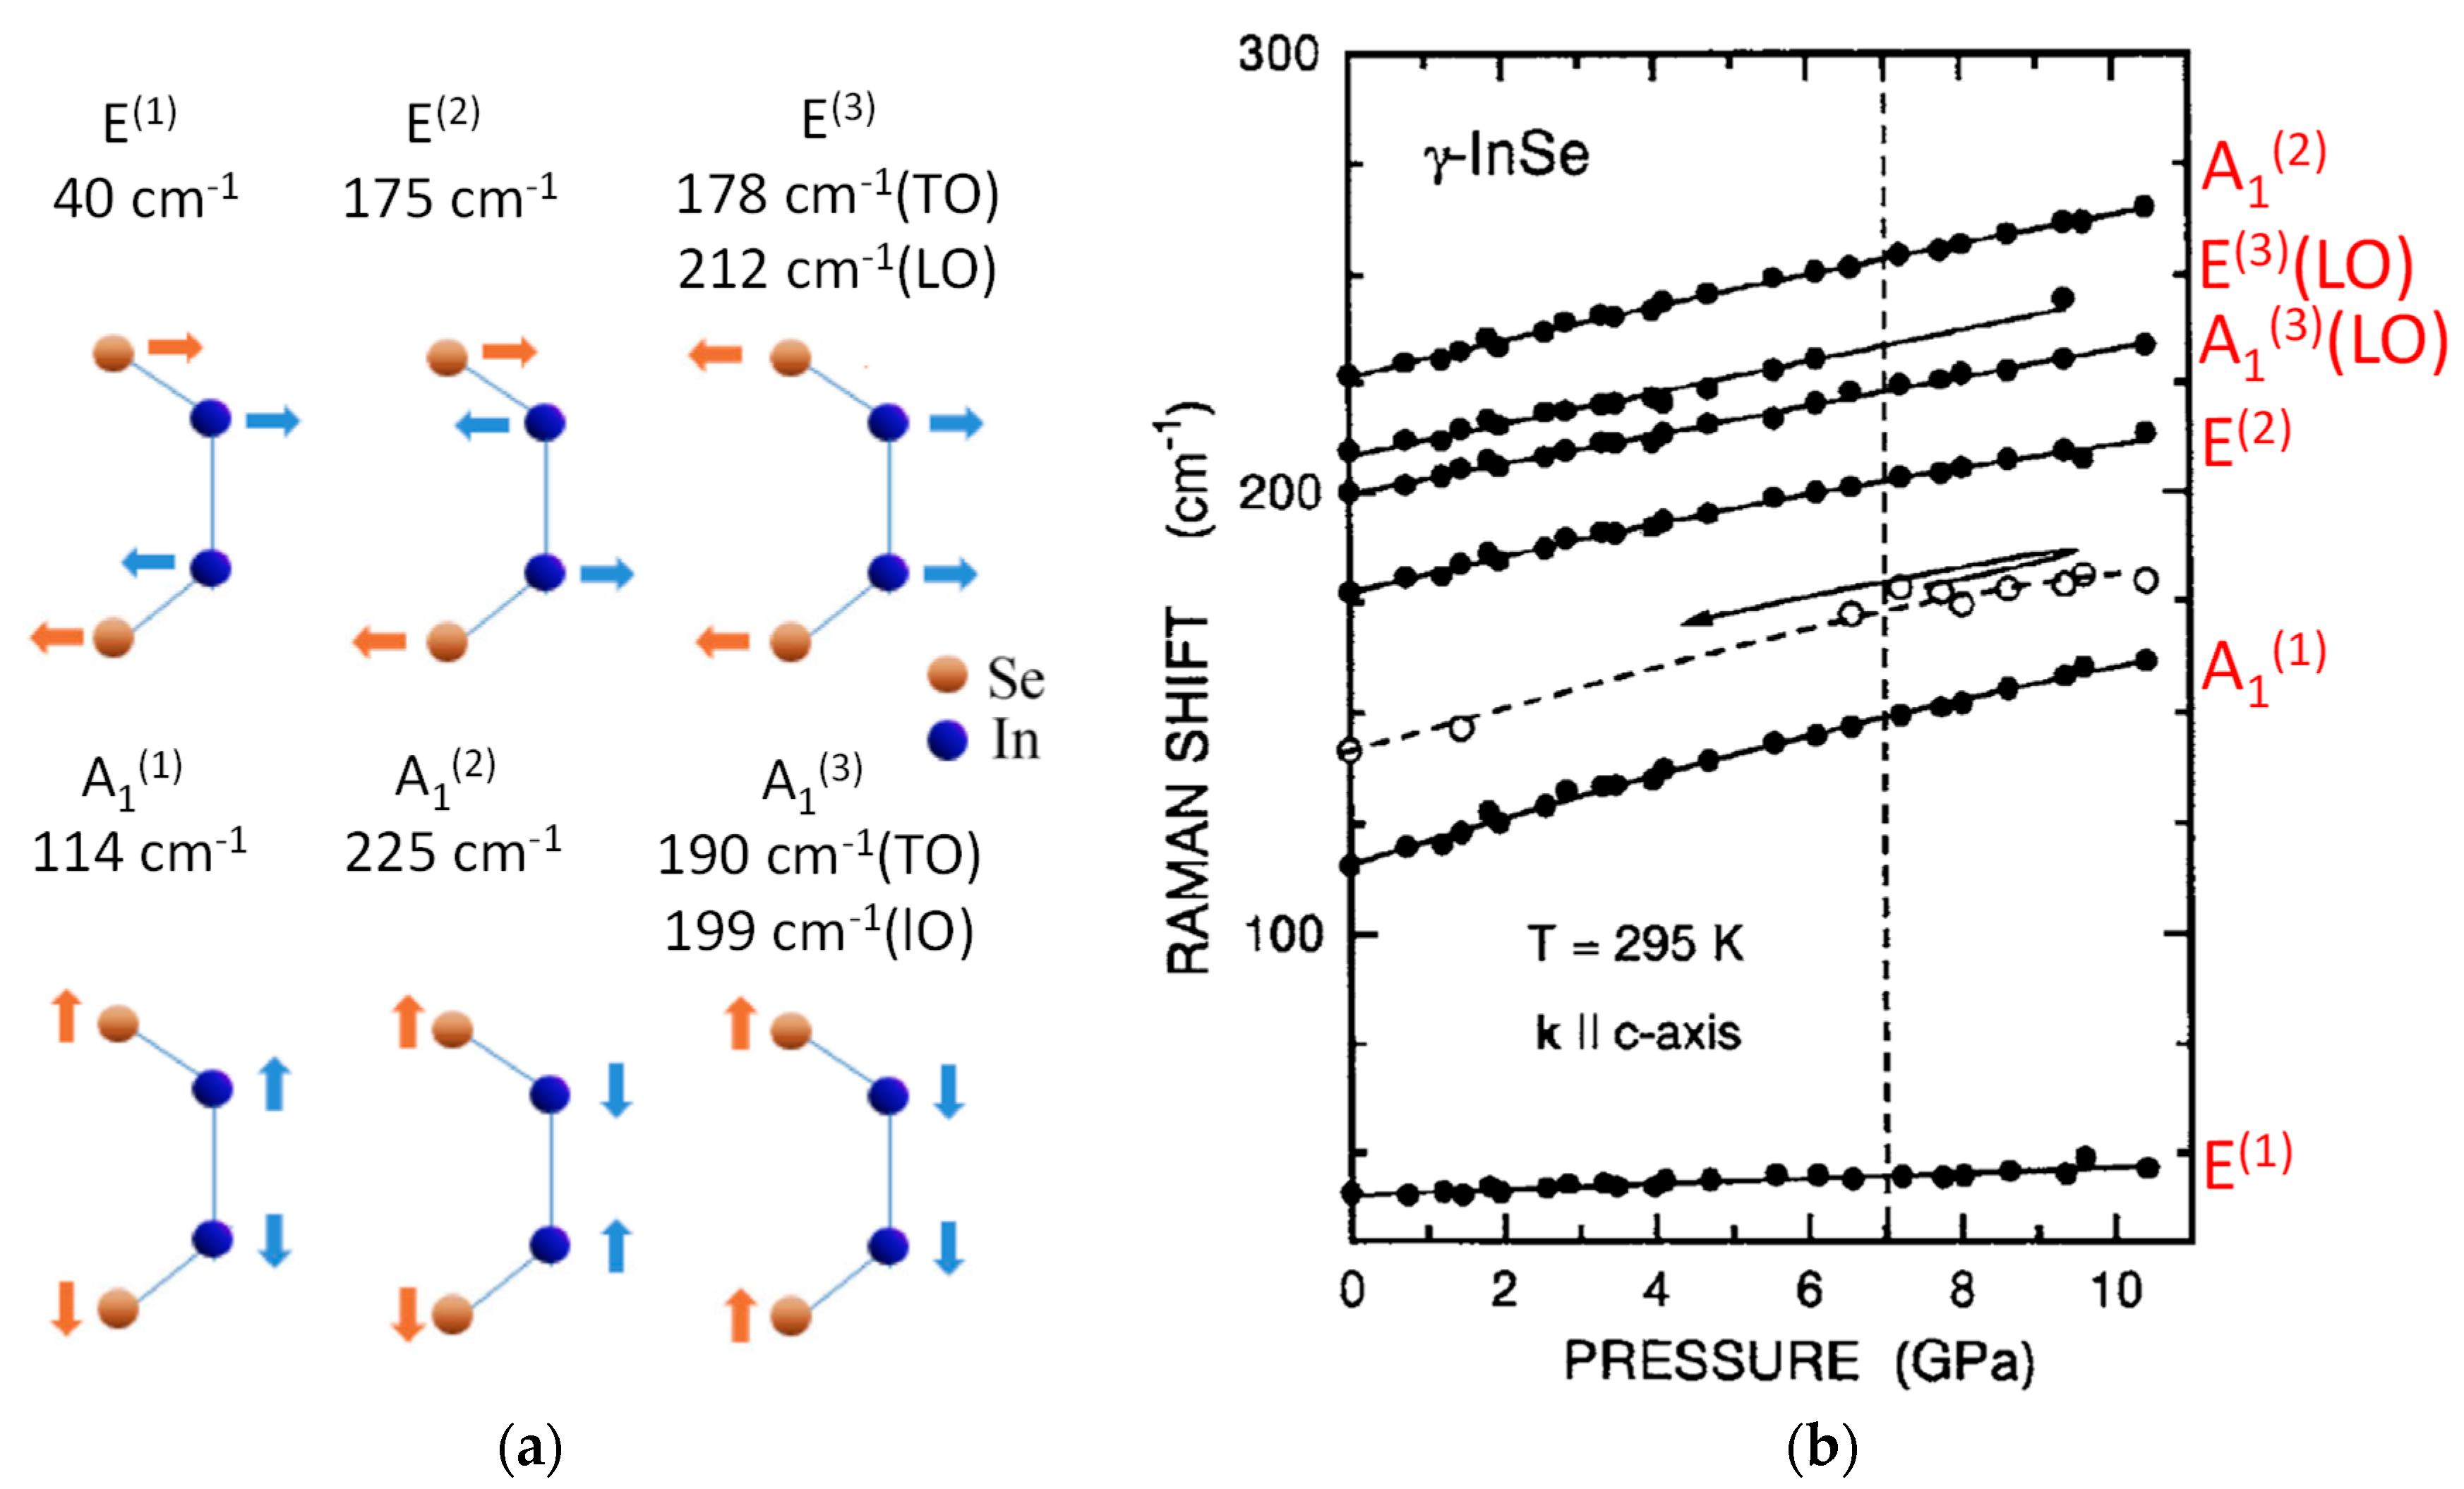
The first systematic study on γ-InSe lattice dynamics under pressure was carried out by Ulrich et al. [75], as shown in Figure 16b. Later on, Choi and Yu [76] reported a Raman experiment under pressure in ε-InSe, but they do not report the behavior of the low-frequency rigid-layer mode that is the main signature of the ε-polytype. The primitive unit cell of γ-InSe contains only one layer per unit cell, and it does not present the low-frequency rigid-layer mode. The lowest frequency mode is the E(1) mode (Figure 16), a rigid-half-layer mode in which the restoring forces receive contributions from interlayer forces and from In-In intra-layer bond bending.
The pressure coefficient of this mode is remarkably low, as also reported for the similar modes in β-GaS [71] and ε-GaSe [57]. This behavior indicates that the increase of the interlayer forces under pressure is accompanied by a weakening of the In-In bond, suggesting the existence of some kind of charge transfer from intra-layer covalent bonds to the interlayer space under high pressure. In the case of GaSe [57], this effect was proposed to be correlated to the observed marked decrease of the transverse dynamic charge associated with the LO-TO splitting of polar phonons vibrating perpendicular to the c-axis (E phonons). Based on this consideration, it was proposed that the transverse dynamic charge of polar phonons vibrating parallel to the c-axis (A1 phonons) should dramatically increase under pressure, resulting in a strong increase of the static dielectric constant for polarization parallel to the c-axis [57,77]. This issue will be discussed in Section 5.
An ab-initio investigation of the lattice dynamics of γ-InSe under pressure was published by Rushchanskii [78]. This calculation accurately predicts the experimental pressure dependence of the Raman modes [75]. It is relevant to notice that the calculation underestimates the LO-TO splitting of A1 polar mode at ambient pressure. Also, even if it predicts its increase under high pressure, this pressure-enhanced LO-TO splitting is not be enough to reproduce the pressure increase of the static dielectric constant under pressure predicted by the charge transfer model proposed by Gauthier et al. [57,77].
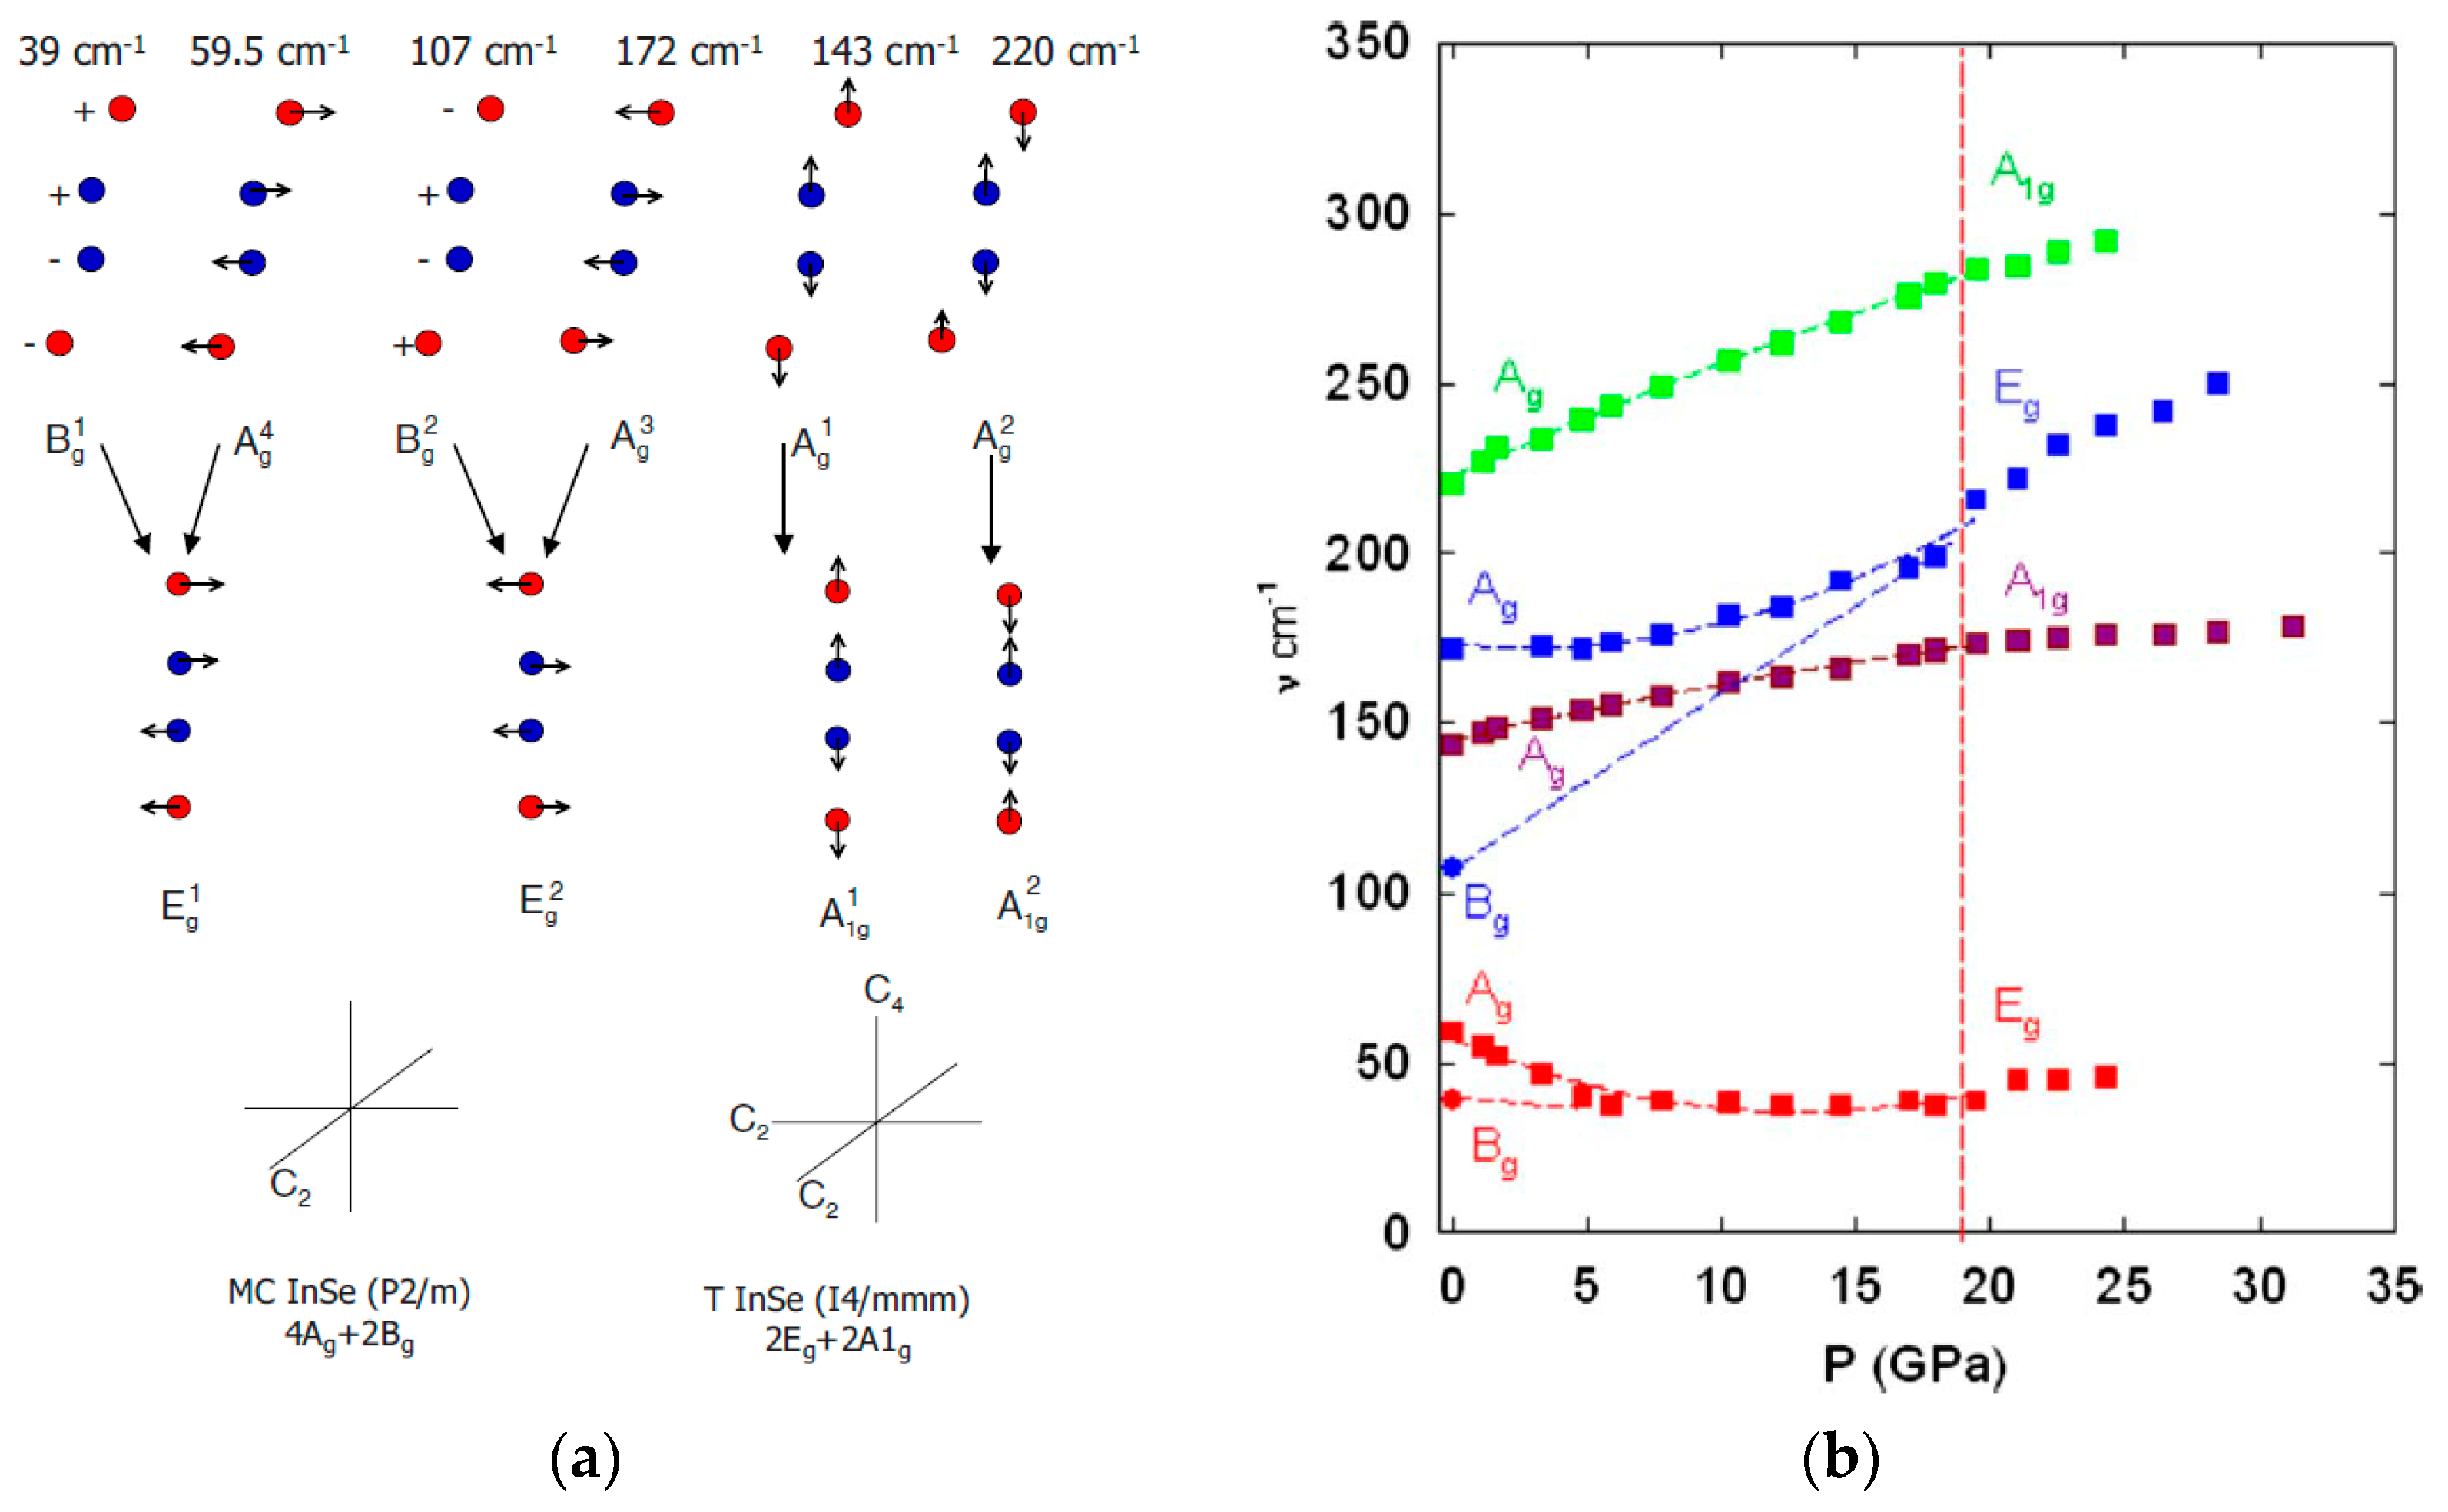
The lattice dynamics of metastable and high-pressure phases of InSe have been investigated in the context of the crystal phase transition from MC-InSe to T-InSe [30]. Figure 17a shows the vibration scheme of Raman active modes in both crystal phases. Figure 17b shows the pressure dependence of its frequencies and how four non-degenerate Raman active modes of MC-InSe (Ag-Bg modes) converge into two doubly degenerate Eg modes in T-InSe.
The fact that no discontinuity in the frequency or intensity of the Raman peaks is observed through the monoclinic-to-tetragonal phase transition is consistent with the semiconductor character of T-InSe, as previously discussed in Section 3.1.
5. Dielectric Properties under High Pressure
The pressure dependence of the electronic and lattice contributions to the static dielectric constant in InSe and other layered III–VI materials has been investigated through different experimental techniques. The pressure effect on the electronic contribution to the dielectric constant has been determined through refractive index measurements under pressure.
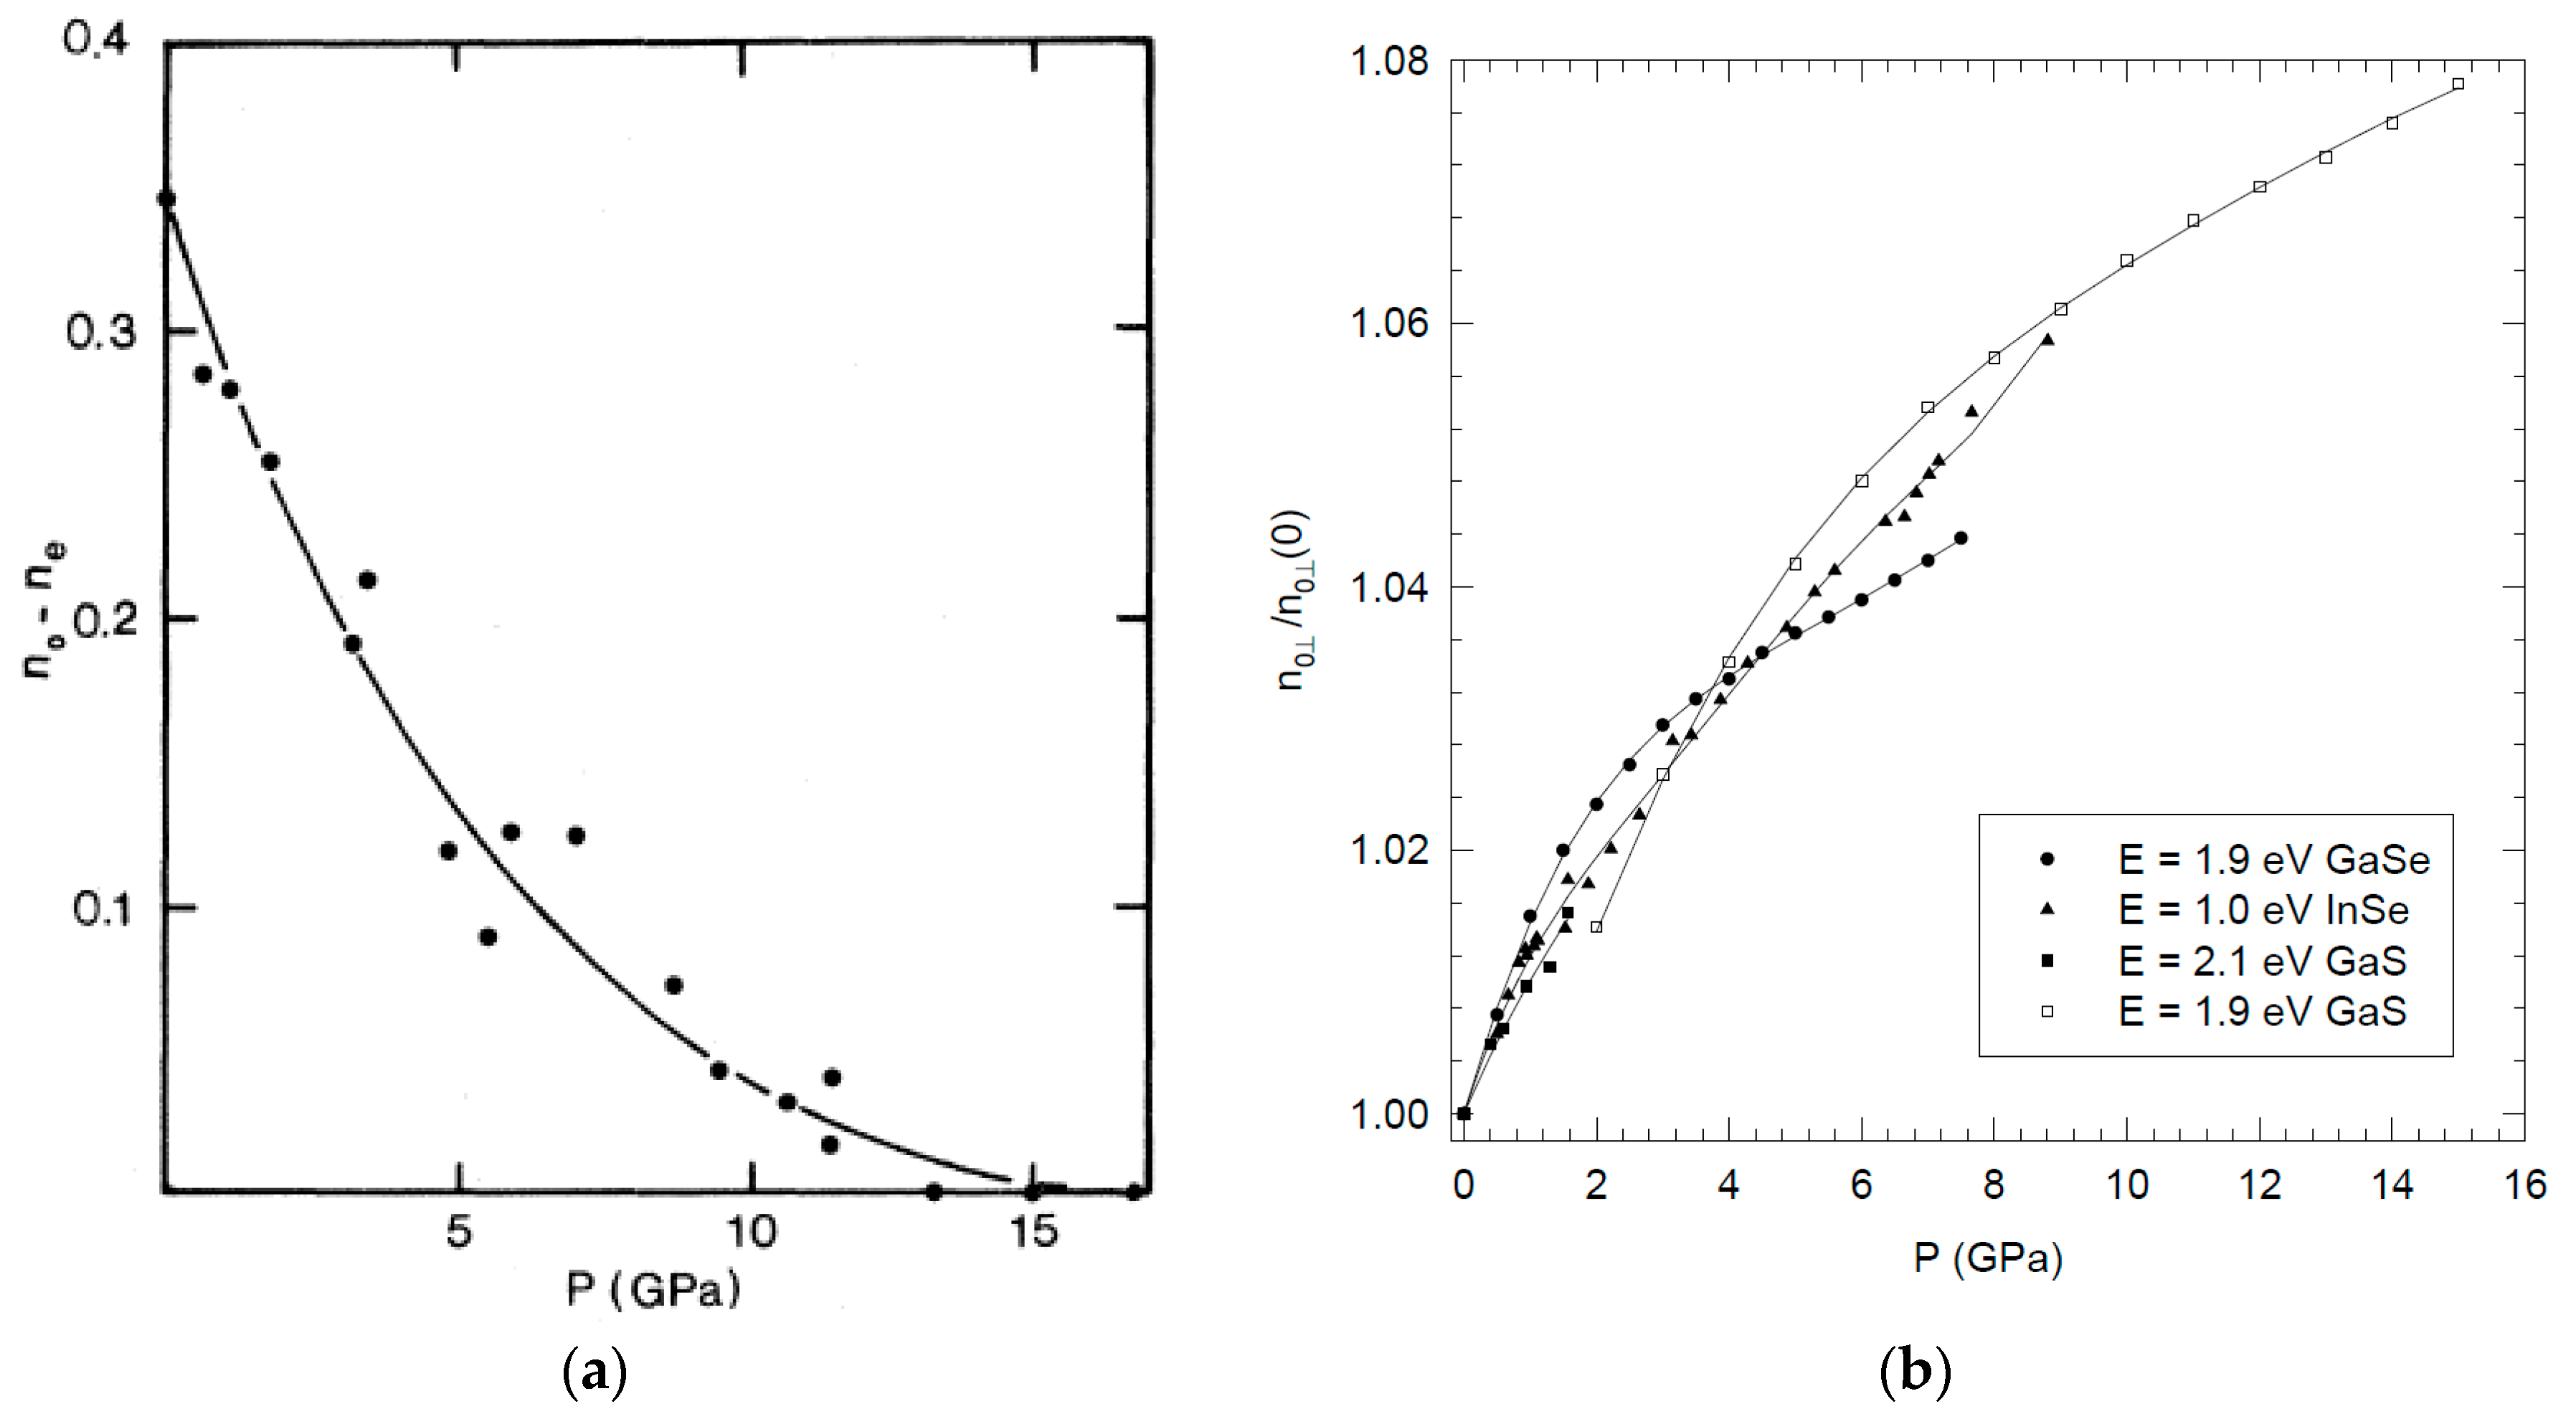
Polian et al. [78] used Brillouin effect experiments in DAC to measure the pressure dependence of refractive index in β-GaS, for light polarization perpendicular () and parallel () to the c-axis (named no and ne respectively in Figure 18a), reporting a large increase of both indexes under pressure. The pressure increase was shown to be much larger for and, as a result, at 15 GPa the difference vanishes, as shown in Figure 18a.
For ε-GaSe [57,72] and γ-InSe [80,81], the interference fringe pattern of the transmitted light was used to determine the pressure dependence of the refractive index for polarization perpendicular to the c-axis (). A large increase of was found for both materials. Figure 18b illustrates those findings. Results were interpreted in the framework of the Phillips-Van Vechten model [82,83] for semiconductor dielectric response.
Once the large compressibility of these materials is taken into account, it turns out that the electronic polarizability for light polarization perpendicular to the c-axis decreases under pressure due to the positive pressure coefficient of the material Penn gap, i.e., the average most intense dipole allowed transition between the valence and conduction bands [84].
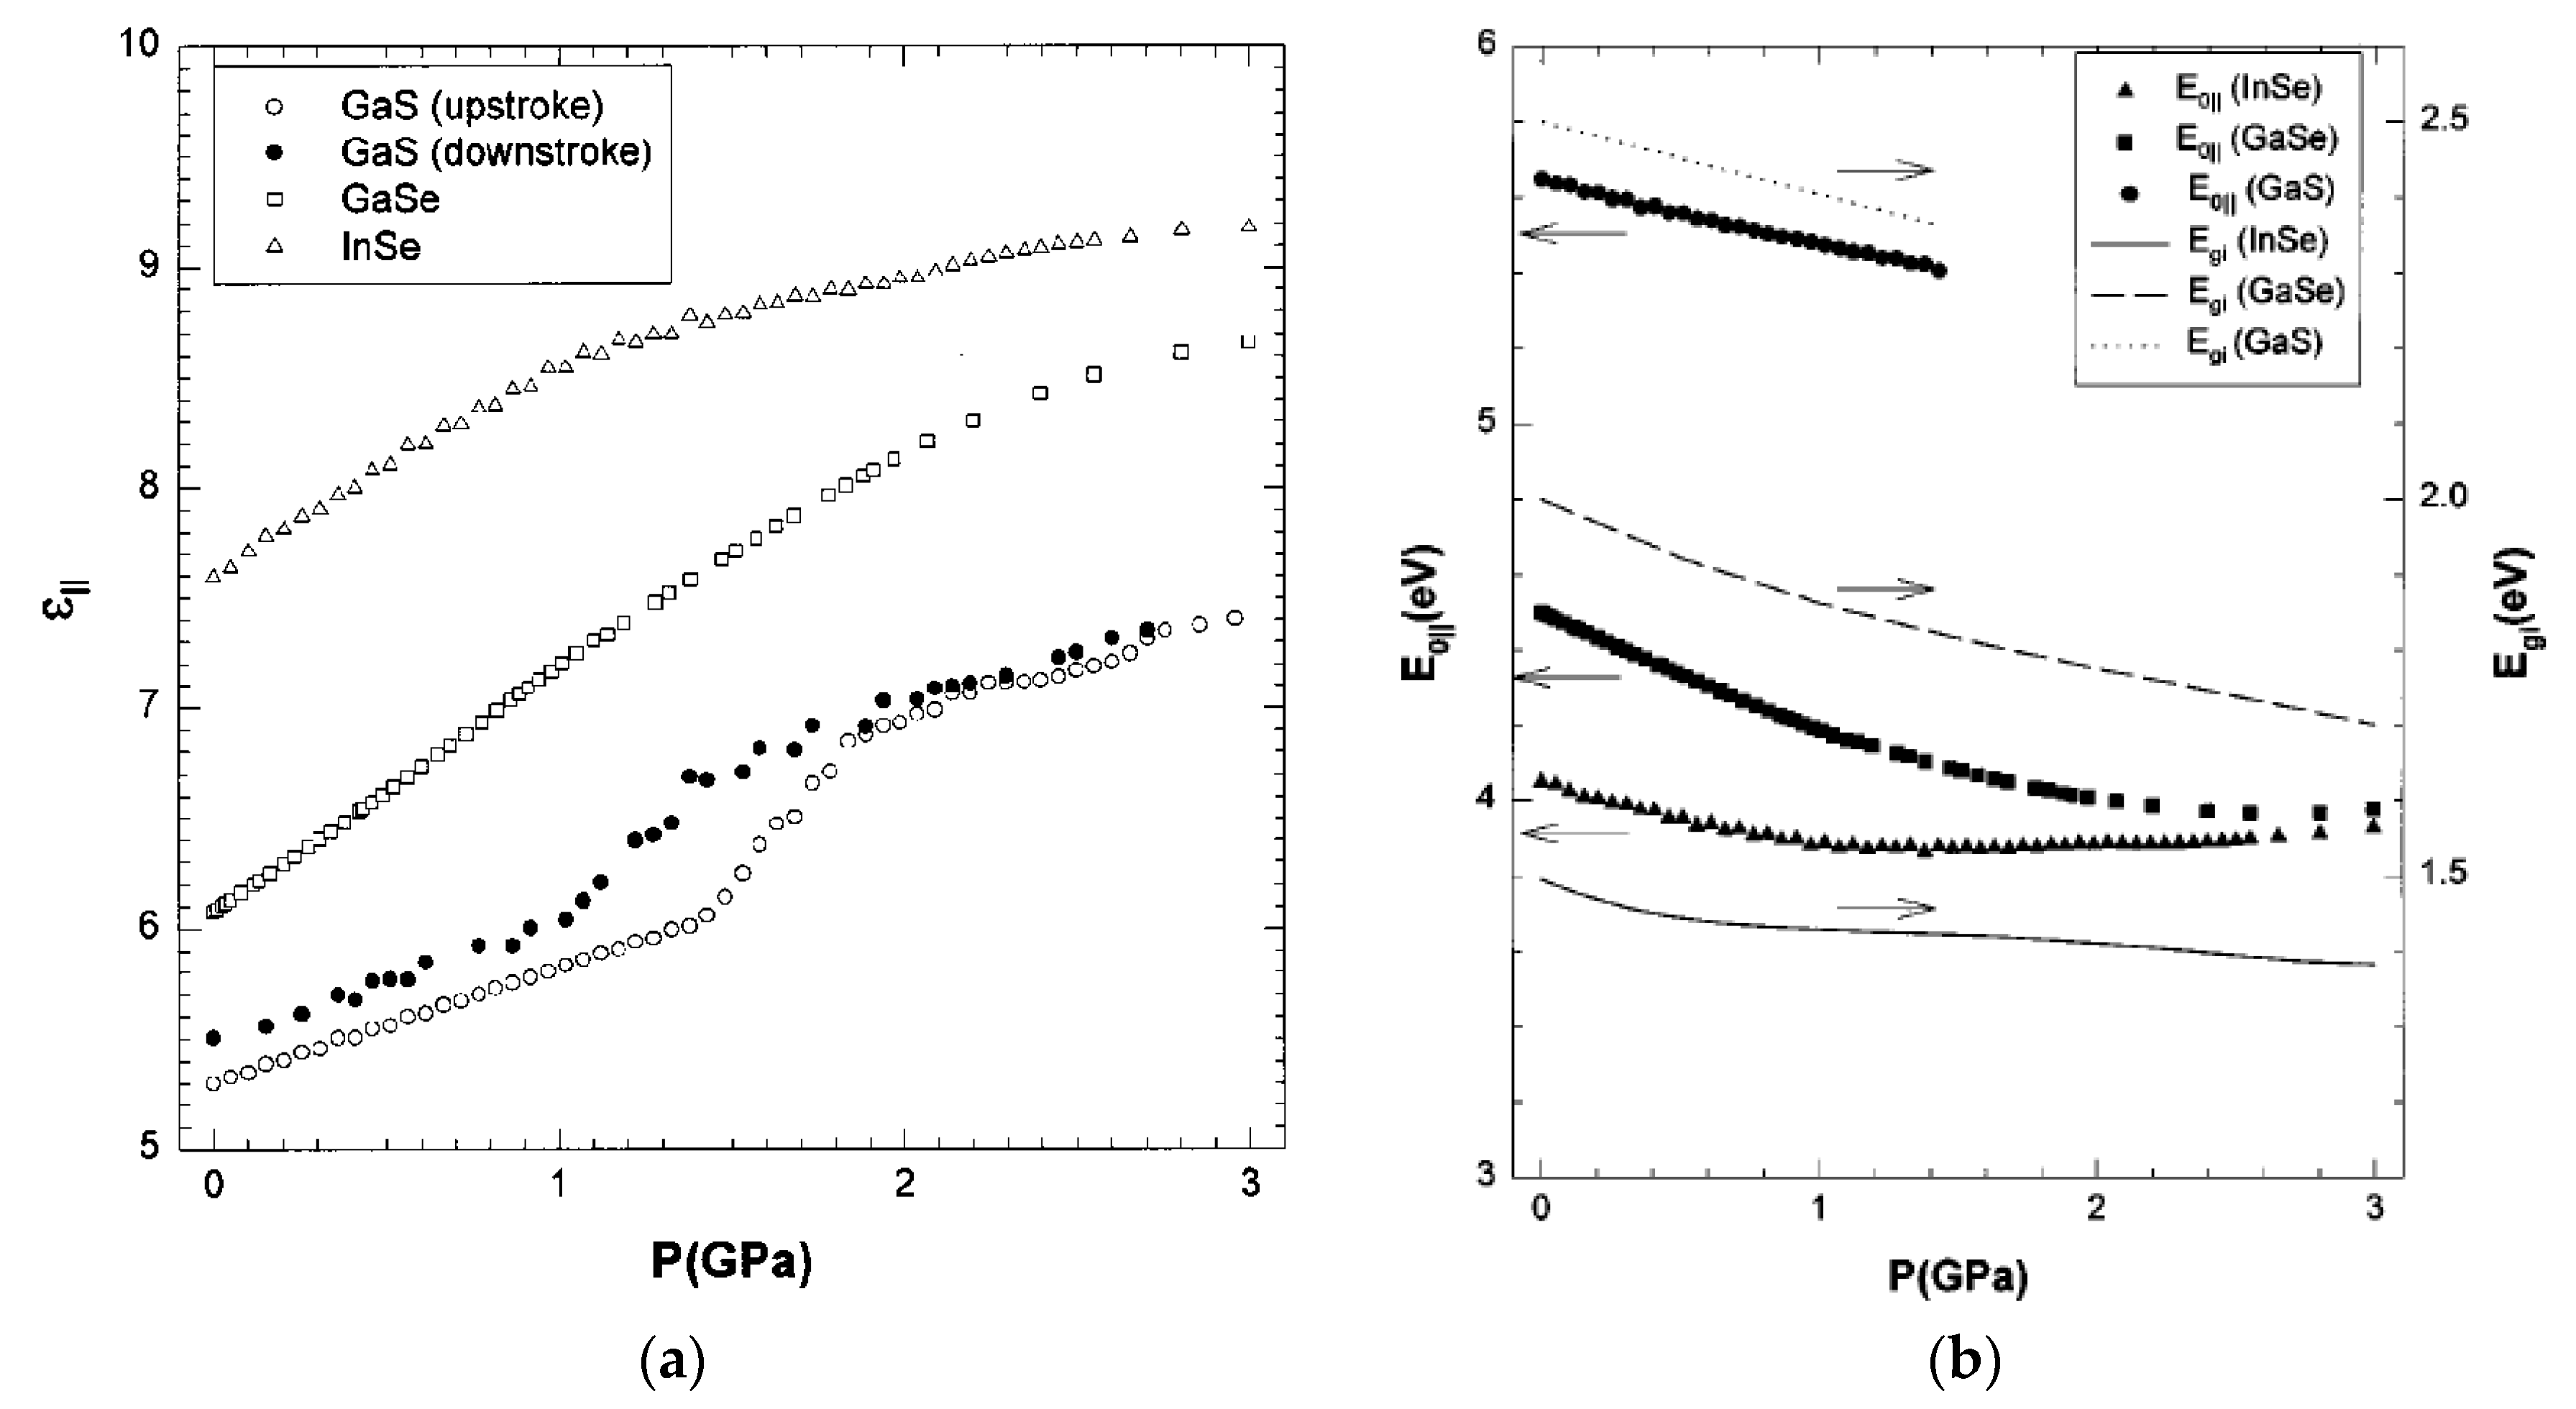
Errandonea et al. [85,86,87] investigated the pressure dependence of the static dielectric constant for polarization parallel to the c-axis () for the three compounds by means of capacitance measurements on insulating samples, in Bridgman anvil cells, as shown in Figure 19a. The steep increase at 1.5 GPa for β-GaS is related to a reversible crystal phase transition to a denser layered phase [23,88]. For this polarization, the material compressibility accounts only for a small part of the large increase of the static dielectric constant [87]. A large increase of the total polarizability must be assumed. Given that Brillouin effect experiments in β-GaS confirm a large increase of , it seems clear that the electronic contribution is responsible for most of the increase of the static dielectric constant for polarization parallel to the c-axis. The pressure behavior of the Penn gap for this light polarization was found to be correlated to the pressure behavior of the indirect gap in the three compounds, as shown in Figure 19b. It was proposed that the strong decrease under pressure of both electronic transitions has the same origin: the quick shift to lower energies of a CBM that is the final state in both the indirect gap and the Penn gap transitions [87].
6. Electronic Transport Properties under High Pressure
The pressure behavior of electronic transport parameters of layered III–VI semiconductors has been investigated through resistivity, Hall effect, and thermos-power measurements under high pressure. Given the extrinsic character of most samples in these materials, obtaining reliable information on intrinsic parameters (like effective masses or impurity ionization energies) or specific features of the electronic structure involves very systematic experiments, using well characterized samples with carrier concentration extending over several order of magnitude.
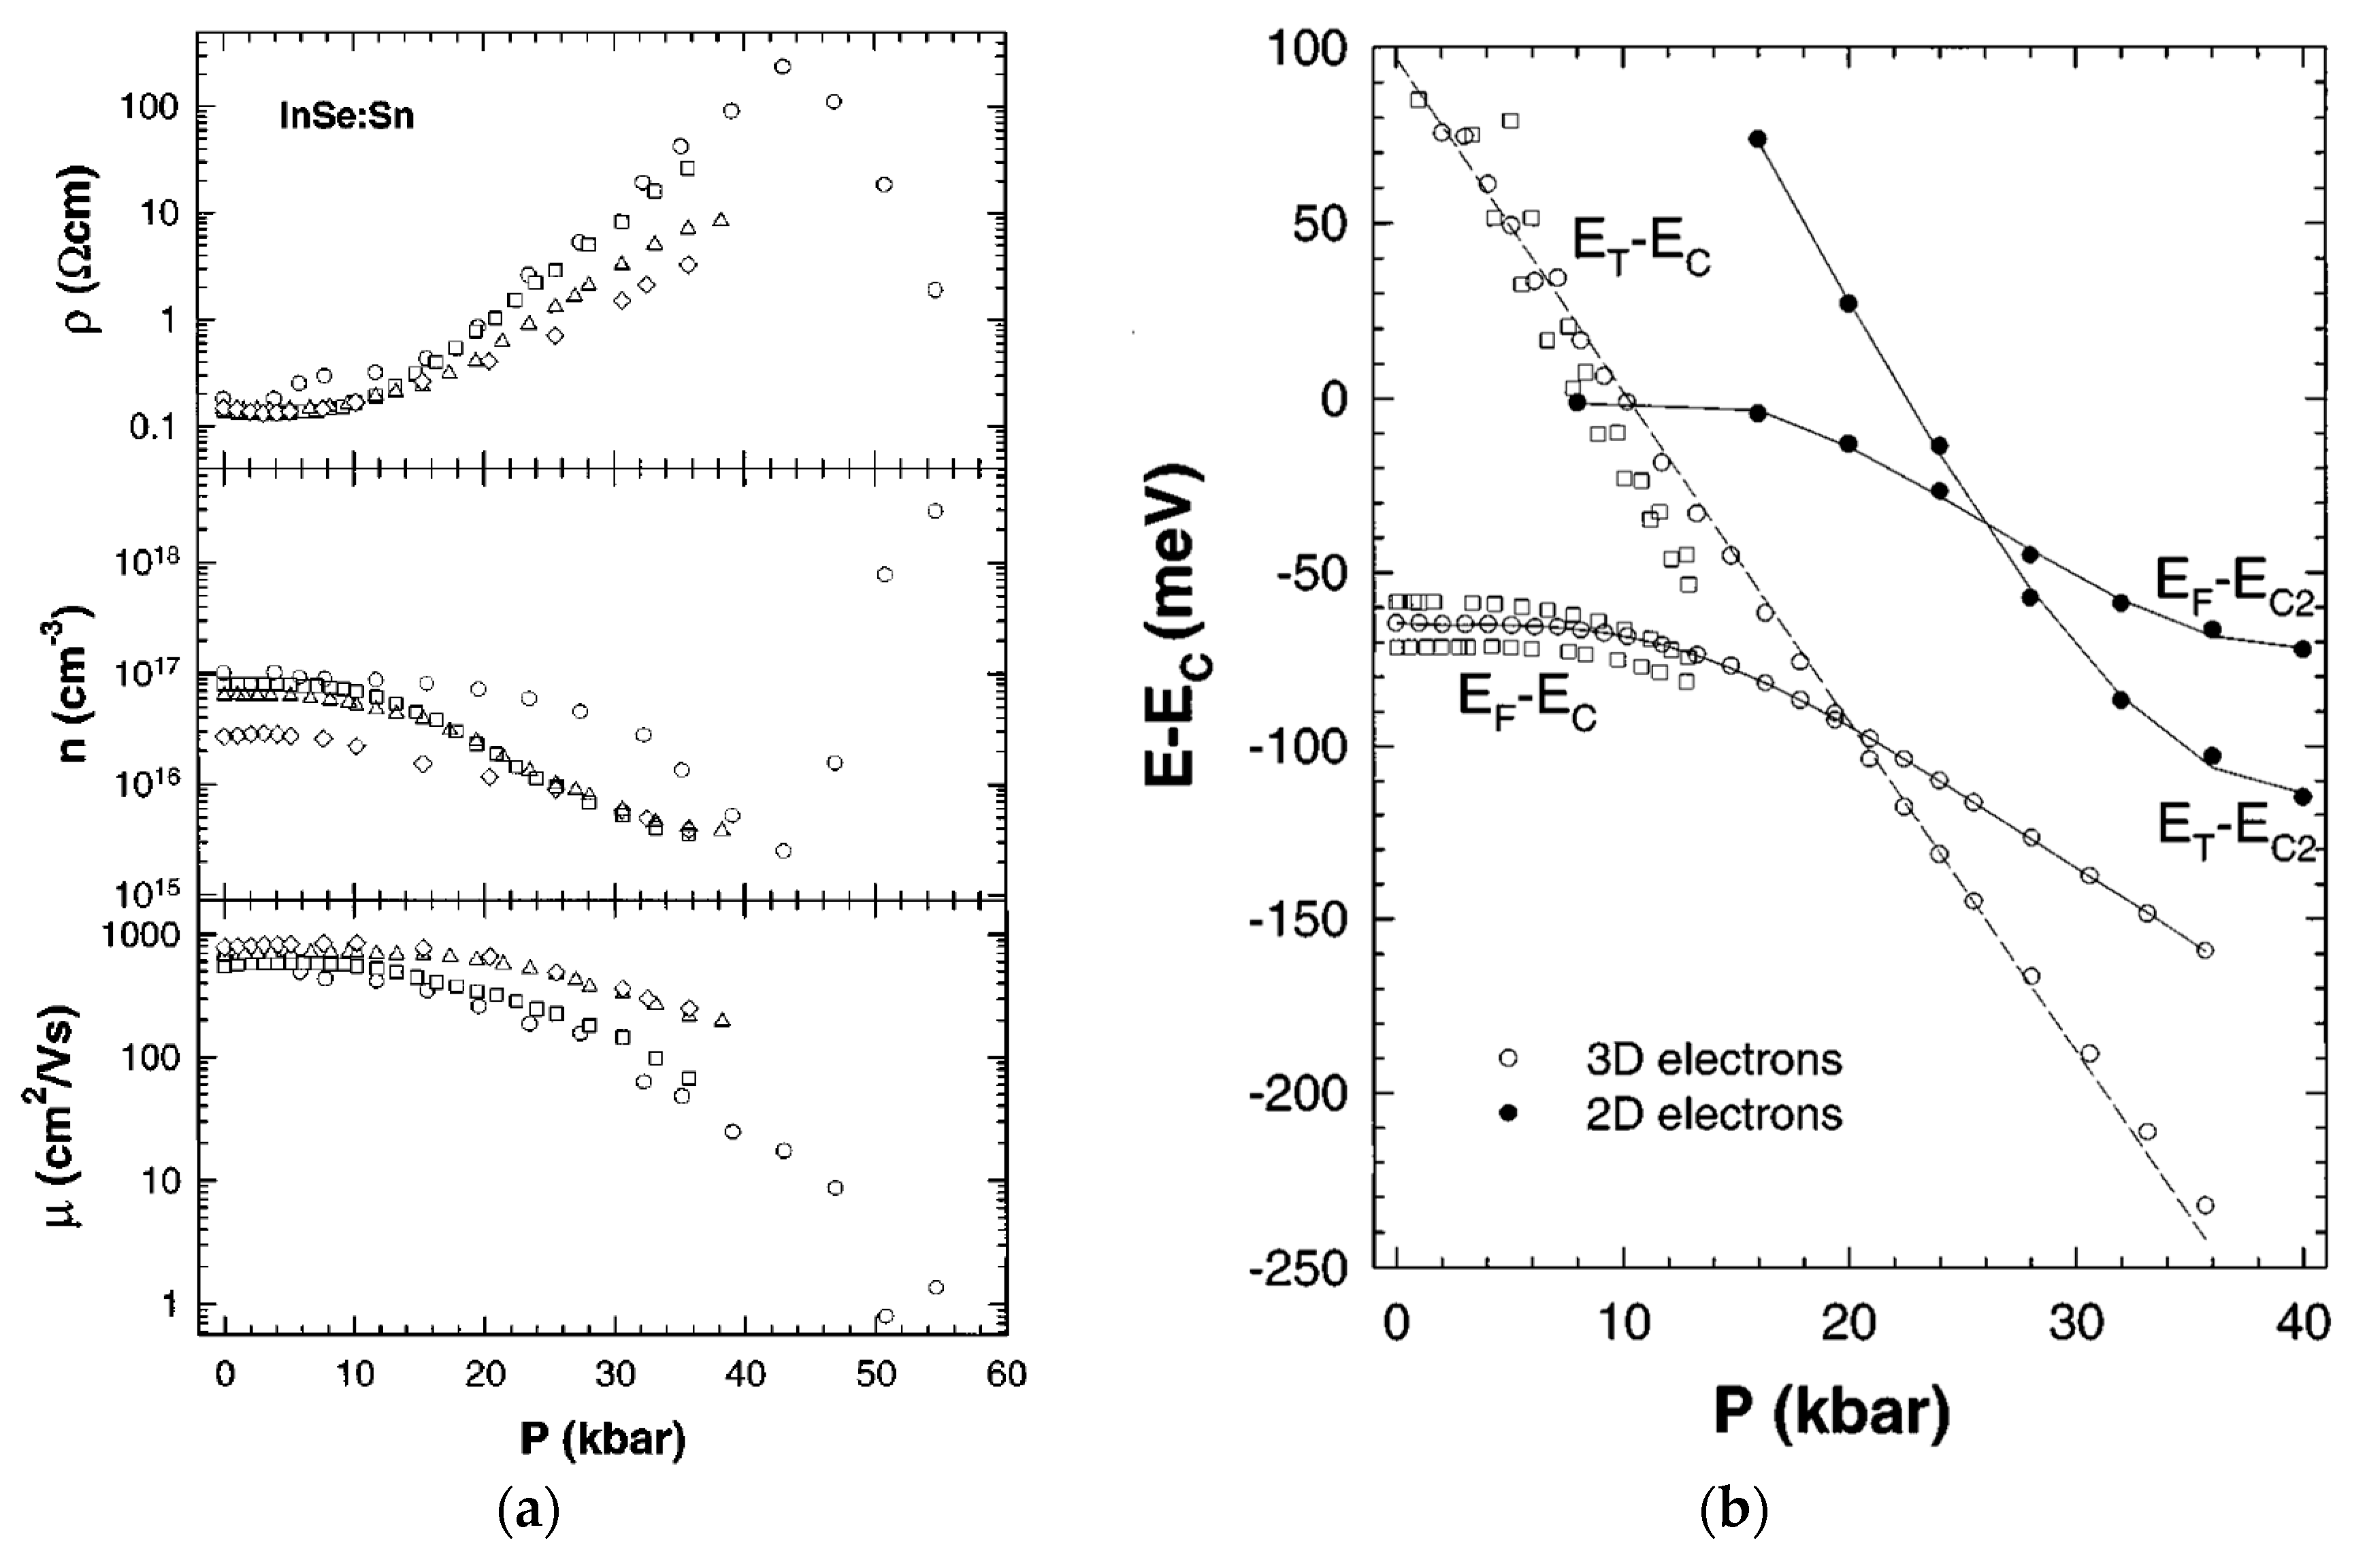
In the case of n-type InSe doped with Sn, a clear correlation was found between the ambient pressure carrier concentration and its pressure behavior, with a more accused, pressure-induced exponential quenching of the free carrier concentration for larger carrier concentrations at ambient pressure, as shown in Figure 20a [89,90,91]. This behavior could be consistently explained by assuming the existence of an electron trap associated with an excited minimum of the conduction band, moving down with a pressure coefficient of −100 meV/GPa, and trapping the free electrons as they enters the forbidden band and cross the Fermi level, as shown in Figure 20b.
This picture is consistent with the findings of the pressure-induced changes in the band structure of γ-InSe discussed in Section 3.1. Optical measurements and ab initio band structure calculations showed a direct to indirect crossover in the conduction band [64]. Impurity levels associated with the different minima in the conduction band have different ionization energies. Given that all band structure calculations [64,65,66] predict a large electron effective mass for the zone-edge excited minimum of the conduction band, moving downwards under pressure (minimum at B in Figure 12a), its related donor can reasonably be assumed to be a deep level. Then, it can be assimilated into an electron trap moving down in energy, trapping free electrons as it approaches the Fermi level, as depicted in Figure 20b. This also explains why the electron trapping onset occurs around 1.2 GPa, a pressure lower than the direct to indirect crossover pressure (4 GPa).
It is also relevant to mention that transport measurements have also been used to investigate precursor effects of the structural phase transitions. It was noticed [90] that at about 4.5 GPa, some irreversible changes occur in the material, which were detected first in the transport properties as an irreversible increase of the carrier concentration, as shown in Figure 20a. Then, at about 7 GPa, dark lines start appearing in the monocrystalline samples [92] and a new Raman active mode is observed, which remains at ambient pressure after the pressure down-stroke [75,92]. All these effects can be considered as precursor effects of the crystal phase transition to the RS phase occurring at 10 GPa [27,28,29]. The appearance of these dark lines was attributed to a local increase of the pressure, associated with the stress field of edge dislocations. Along the edge dislocation lines, the rhombohedral phase would become locally unstable at a lower macroscopic pressure [92].
Transport measurements in p-type InSe were also shown to be consistent with the findings of the pressure-induced changes occurring in the band structure around the VBM at the Z point, unraveled by optical measurements and band structure calculations.
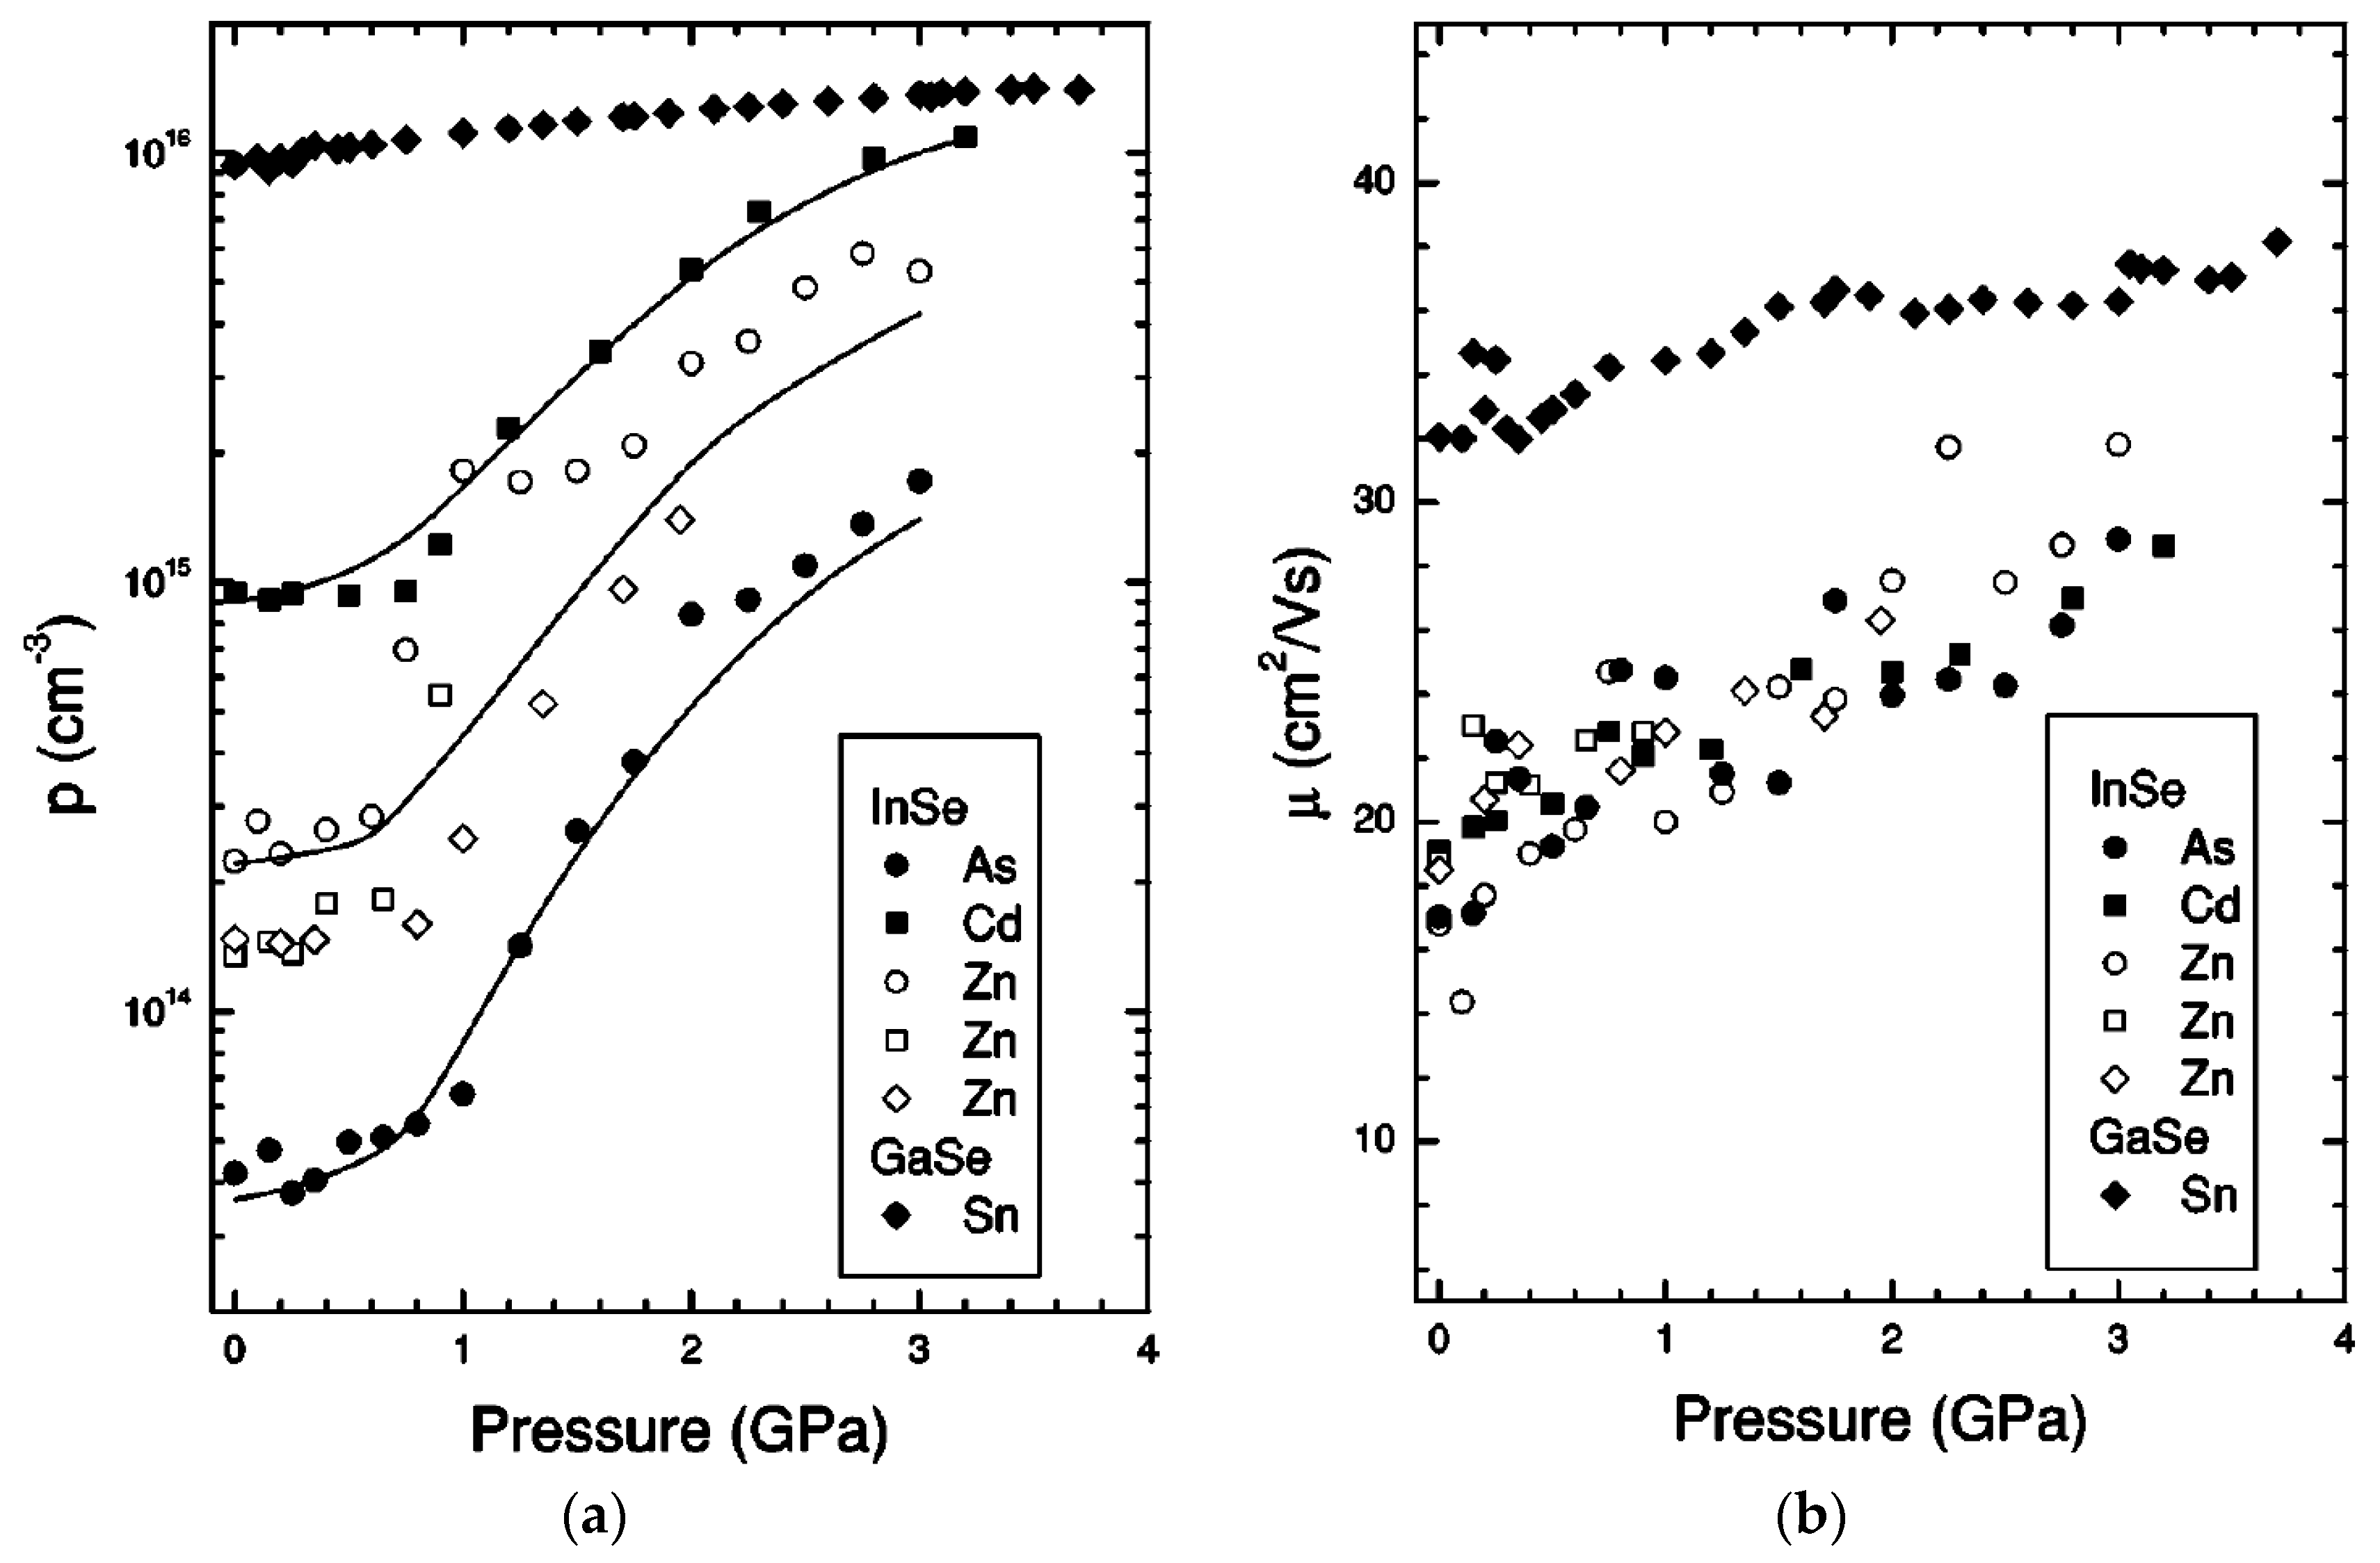
The hole concentration in p-type γ-InSe samples doped with different acceptors has been reported to increase by a factor 40 between 1 and 3 GPa, while the hole mobility increases by a factor 2, as shown in Figure 21 [93,94,95,96]. The onset pressure at which the hole concentration starts rising (1 GPa) is practically the same as the onset pressure at which the width of the exciton absorption peak [61,64] and the width of the PL peak [67] start increasing. The behavior of hole transport parameters (concentration and mobility) is consistent with the emergence of a new VBM with a larger effective density of states and lower effective mass. These are distinctive features of the toroidal VBM are shown in Figure 12.
In contrast, both the hole concentration and mobility increase monotonously under pressure in p-type ε-GaSe and do not exhibit any dramatic changes (Figure 21). Ab-initio band structure calculations [32,94] do not show any trace of a toroidal maximum or any other dramatic modification of the VBM (occurring at the Γ point) in ε-GaSe, at 7 GPa [94], or at 16 GPa [32]. The different pressure behavior of the VBM in ε-GaSe with respect to γ-InSe has been attributed to differences in the band mixing and dipole matrix elements between the highest energy valence bands imposed by symmetry elements of the P6m2 group (to which ε-GaSe belongs) [94].
7. Conclusions and Perspectives
In spite of the remarkable advances here reviewed, some relevant features of the electronic structure of InSe and related III–VI semiconductors are not yet well understood. Concerning ab-initio band structure calculations, as we stressed in Section 3, they give a quantitative account of the linear pressure dependence of the main electronic transitions in the high pressure range but fail to predict the extremely non-linear behavior of some physical parameters in the low pressure range. The problem stems from the well-known inability of DFT-LDA ab-initio calculations to deal with van der Waals interactions. New techniques, like the so called van der Waals corrected-DFT [97,98,99], which were successfully applied to layered materials like graphene or MoS2, do not seem to have yet been used to investigate III–VI layered materials.
From an experimental point of view, the main structural feature of InSe and related compounds (the weakness of the inter-layer forces) makes it especially difficult to prepare thin samples with faces containing the c-axis. This has led to a lack of results for the pressure dependence of some important physical parameters like the absorption coefficient for polarization parallel to the c-axis, the static dielectric constant for polarization perpendicular to the c-axis, and the electron and hole mobility along the c-axis.
We will finally mention some perspectives on the investigation of impurity levels, a crucial issue for the design of electronic devices. Shallow donors [100] and acceptors [54] in InSe are quite well characterized at ambient pressure. High pressure studies on impurity levels here reviewed [89,90,91,92,93,94,95,96] are based on transport measurements and do not give direct information on the internal electronic structure of impurity levels, as the one provided by Fourier transform infrared spectroscopy (FTIR) in DAC. FTIR spectroscopy investigations would also provide information on the pressure behavior of relevant band structure parameters, like carrier effective mass tensors. In an extended spectral range, FTIR experiments in DAC would also serve to complete the understanding of high pressure lattice dynamics of III–VI materials by exploring the pressure behavior of polar phonons, for which Raman Effect measurements give relatively limited information, as we have seen in Section 4.
In summary, this review has shown that high pressure experimental techniques and ab-initio band structure calculations have been an exceptional tool, leading to a deep understanding of the electronic structure of InSe and related III–VI layered semiconductors.
Acknowledgments
This work has been supported by the Spanish MINECO/FEDER under Contract No. MAT2016-75586-C4-1-P.
Conflicts of Interest
The authors declare no conflict of interest.
References
- Damon, R.W.; Redington, R.W. Electrical and optical properties of indium selenide. Phys. Rev. 1954, 96, 1498–1500. [Google Scholar] [CrossRef]
- Andriyashik, M.V.; Sakhnovskit, M.Y.; Timofeev, V.B.; Yakimova, A.S. Optical transitions in the spectra of the fundamental absorption and reflection of InSe single crystals. Phys. Status Solidi (B) 1968, 28, 277–285. [Google Scholar] [CrossRef]
- Chevy, A.; Kuhn, A.; Martin, M.S. Large InSe monocrystals grown from a nonstoichiometric melt. J. Cryst. Growth 1977, 38, 118–122. [Google Scholar] [CrossRef]
- Chevy, A. Segregation of dopants in melt-grown indium selenide crystals. J. Appl. Phys. 1984, 56, 978–982. [Google Scholar] [CrossRef]
- Segura, A.; Guesdon, J.P.; Besson, J.M.; Chevy, A. Photoconductivity and photo-voltaic effect in indium selenide. J. Appl. Phys. 1983, 54, 876–888. [Google Scholar] [CrossRef]
- Martinez-Pastor, J.; Segura, A.; Valdes, J.L.; Chevy, A. Electrical and photovoltaic properties of indium-tin-oxide/p-InSe/Au solar cells. J. Appl. Phys. 1987, 62, 1477–1483. [Google Scholar] [CrossRef]
- Bringuier, E.; Bourdon, A.; Piccioli, N.; Chevy, A. Optical 2nd-harmonic generation in lossy media-application to GaSe and InSe. Phys. Rev. B 1994, 49, 16971–16982. [Google Scholar] [CrossRef]
- Koma, A. Van der Waals epitaxy: A new epitaxial-growth method for a highly lattice-mismatched system. Thin Solid Films 1992, 216, 72–76. [Google Scholar] [CrossRef]
- Sanchez-Royo, J.F.; Segura, A.; Lang, O.; Schaar, E.; Pettenkofer, C.; Jaegermann, W.; Roa, L.; Chevy, A. Optical and photovoltaic properties of indium selenide thin films prepared by van der Waals epitaxy. J. Appl. Phys. 2001, 90, 2818–2823. [Google Scholar] [CrossRef]
- Novoselov, K.S.; Geim, A.K.; Morozov, S.V.; Jiang, D.; Zhang, Y.; Dubonos, S.V.; Grigorieva, I.V.; Firsov, A.A. Electric field effect in atomically thin carbon films. Science 2004, 306, 666–669. [Google Scholar] [CrossRef] [PubMed]
- Mudd, G.W.; Svatek, S.A.; Ren, T.; Patanè, A.; Makarovsky, O.; Eaves, L.; Beton, P.H.; Kovalyuk, Z.D.; Lashkarev, G.V.; Kudrynskyi, Z.R.; et al. Tuning the bandgap of exfoliated InSe nanosheets by quantum confinement. Adv. Mater. 2013, 25, 5714–5718. [Google Scholar] [CrossRef] [PubMed]
- Sánchez-Royo, J.F.; Muñoz-Matutano, G.; Brotons-Gisbert, M.; Martínez-Pastor, J.P.; Segura, A.; Cantarero, A.; Mata, R.; Canet-Ferrer, J.; Tobias, G.; Canadell, E.; et al. Gerardot, Electronic structure, optical properties, and lattice dynamics in atomically thin indium selenide flakes. Nano Res. 2014, 7, 1556–1568. [Google Scholar] [CrossRef]
- Sucharitakul, S.; Goble, N.J.; Kumar, U.R.; Sankar, R.; Bogorad, Z.A.; Chou, F.C.; Chen, Y.T.; Gao, X.P.A. Intrinsic Electron Mobility Exceeding 10 cm2/(V s) in Multilayer InSe FETs. Nano Lett. 2015, 15, 3815–3819. [Google Scholar] [CrossRef] [PubMed]
- Bandurin, D.A.; Tyurnina, A.V.; Yu, G.L.; Mishchenko, A.; Zolyomi, V.; Morozov, S.V.; Kumar, R.K.; Gorbachev, R.V.; Kudrynskyi, Z.R.; Pezzini, S.; et al. High electron mobility, quantum Hall effect and anomalous optical response in atomically thin InSe. Nat. Nanotechnol. 2017, 12, 223–227. [Google Scholar] [CrossRef] [PubMed]
- Paul, W. Band structure of intermetallic semiconductors from pressure experiments. J. Appl. Phys. Suppl. 1961, 32, 2092–2095. [Google Scholar] [CrossRef]
- Jayaraman, A. Diamond anvil cell and high-pressure physical investigations. Rev. Mod. Phys. 1983, 55, 65–108. [Google Scholar] [CrossRef]
- Forman, R.A.; Piermarini, G.J.; Barnett, J.D.; Block, S. Pressure Measurement Made by the Utilization of Ruby Sharp-Line Luminescence. Science 1972, 176, 284–285. [Google Scholar] [CrossRef] [PubMed]
- Barnett, J.D.; Block, S.; Piermarini, G.J. An Optical Fluorescence System for Quantitative Pressure Measurement in the Diamond-Anvil Cell. Rev. Sci. Instrum. 1973, 44, 1–9. [Google Scholar] [CrossRef]
- Goñi, A.R.; Syassen, K. Optical Properties of Semiconductors under pressure. In Semiconductors and Semimetals; Suskiy, T., Paul, W., Eds.; Academic Press: New York, NY, USA, 1998; Volume 54, pp. 247–425. [Google Scholar]
- Nelmes, R.J.; McMahon, M.I. Structural transitions in the group IV, III_V and II-VI semiconsuctors under pressure. In Semiconductors and Semimetals; Suskiy, T., Paul, W., Eds.; Academic Press: New York, NY, USA, 1998; Volume 54, pp. 145–246. [Google Scholar]
- Mujica, A.; Rubio, A.; Munoz, A.; Needs, R.J. High-pressure phases of group-IV, III–V, and II–VI compounds. Rev. Mod. Phys. 2003, 75, 863–912. [Google Scholar] [CrossRef]
- Likforman, A.; Carre, D.; Etienne, J.; Bachet, B. Crystal-structure of indium monoselenide (InSe). Acta Crystallogr. Sect. B Struct. Crystallogr. Cryst. Chem. 1975, 31, 1252–1254. [Google Scholar] [CrossRef]
- Polian, A.; Kunc, K.; Kuhn, A. Low-frequency lattice-vibrations of δ-GaSe compared to epsilon-polytypes and gamma-polytypes. Solid State Commun. 1976, 19, 1079–1082. [Google Scholar] [CrossRef]
- Gatulle, M.; Fischer, M.; Chevy, A. Elastic-constants of the layered compounds GaS, GaSe, InSe, and their pressure-dependence. 1. Experimental part. Phys. Status Solidi (B) 1983, 119, 327–336. [Google Scholar] [CrossRef]
- Kuroda, N.; Ueno, O.; Nishina, Y. Supernonlinear shifts of optical-energy gaps in InSe and GaSe under hydrostatic-pressure. J. Phys. Soc. Jpn. 1986, 55, 581–589. [Google Scholar] [CrossRef]
- Murnaghan, F.D. The compressibility of media under extreme pressures. Proc. Natl. Acad. Sci. USA 1944, 30, 244–247. [Google Scholar] [CrossRef] [PubMed]
- Schwarz, U. Zustandgleichungen unf Phasenumwaldungen von Halbleitenden Verbindungen unter Hohem Druck: Rötgenpulveruntersuchungen und Optische Spektroskopie, Ph.D. Thesis, Technishen Hochschule Darmstadt, Darmstadt, Germany, 1992. [Google Scholar]
- Schwarz, U.; Goñi, A.R.; Syassen, K.; Cantarero, A.; Chevy, A. Structural and optical properties of InSe under pressure. High Press. Res. 1991, 8, 396–398. [Google Scholar] [CrossRef]
- Pellicer-Porres, J.; Machado-Charry, E.; Segura, A.; Gilliland, S.; Canadell, E.; Ordejon, P.; Polian, A.; Munsch, P.; Chevy, A.; Guignot, N. GaS and InSe equations of state from single crystal diffraction. Phys. Status Solidi (B) 2007, 244, 169–173. [Google Scholar] [CrossRef]
- Errandonea, D.; Martínez-García, D.; Segura, A.; Haines, J.; Machado-Charry, E.; Canadell, E.; Chervin, J.C.; Chevy, A. High-pressure electronic structure and phase transitions in monoclinic InSe: X-ray diffraction, Raman spectroscopy, and density functional theory. Phys. Rev. B 2008, 77, 045208. [Google Scholar] [CrossRef]
- Pellicer-Porres, J.; Segura, A.; Muñoz, V.; San Miguel, A. High-pressure x-ray absorption study of InSe. Phys. Rev. B. 1999, 50, 3757–5763. [Google Scholar] [CrossRef]
- Schwarz, U.; Olguin, D.; Cantarero, A.; Hanfland, M.; Syassen, K. Effect of pressure on the structural properties and electronic band structure of GaSe. Phys. Status Solidi (B) 2007, 244, 244–255. [Google Scholar] [CrossRef]
- Schwarz, U.; Syassen, K.; Kniep, R. Structural phase-transition of GaTe at high-pressure. J. Alloy. Compd. 1995, 224, 212–216. [Google Scholar] [CrossRef]
- Takumi, M.; Hirata, A.; Ueda, T.; Koshio, Y.; Nishimura, H.; Nagata, K. Structural Phase Transitions of Ga2Se3 and GaSe under High Pressure. Phys. Status Solidi (B) 2001, 223, 423–426. [Google Scholar] [CrossRef]
- Pellicer-Porres, J.; Segura, A.; Munoz, V.; San Miguel, A. High-pressure X-ray absorption study of GaTe including polarization. Phys. Rev. B 2000, 61, 125–131. [Google Scholar] [CrossRef]
- Pellicer-Porres, J.; Segura, A.; Ferrer, C.; Munoz, V.; San Miguel, A.; Polian, A.; Itie, J.P.; Gauthier, M.; Pascarelli, S. High-pressure X-ray-absorption study of GaSe. Phys. Rev. B 2002, 65, 174103. [Google Scholar] [CrossRef]
- Segura, A.; Manjón, F.J.; Errandonea, D.; Pellicer-Porres, J.; Muñoz, V.; Tobias, G.; Ordejón, P.; Canadell, E.; San Miguel, A.; Sánchez-Portal, D. Specific features of the electronic structure of III−VI layered semiconductors: Recent results on structural and optical measurements under pressure and electronic structure calculations. Phys. Status Solidi (B) 2003, 235, 267–276. [Google Scholar] [CrossRef]
- Vezzoli, G.C. Synthesis and properties of a pressure-induced and temperature-induced phase of indium selenide. Mater. Res. Bull. 1971, 6, 1201–1204. [Google Scholar] [CrossRef]
- Iwasaki, H.; Watanabe, Y.; Kuroda, N.; Nishina, Y. Pressure-induced layer-nonlayer transformation in InSe. Physica B C 1981, 105B, 314–318. [Google Scholar] [CrossRef]
- Kuroda, N.; Nishina, Y.; Iwasaki, H.; Watanabe, Y. Raman scatterings of layered and non-layered phases of InSe. Solid State Commun. 1981, 38, 139–142. [Google Scholar] [CrossRef]
- Errandonea, D.; Martínez-García, D.; Segura, A.; Chevy, A.; Tobias, G.; Canadell, E.; Ordejon, P. High-pressure, high-temperature phase diagram of InSe: A comprehensive study of the electronic and structural properties of the monoclinic phase of InSe under high pressure. Phys. Rev. B. 2006, 73, 235202. [Google Scholar] [CrossRef]
- Ferlat, G.; Martinez-Garcia, D.; San Miguel, A.; Aouizerat, A.; Muñoz-Sanjosé, V. High pressure-high temperature phase diagram of InSe. High Press. Res. 2004, 4, 111–116. [Google Scholar] [CrossRef]
- Besson, J.M.; Nelmes, R.J.; Hamel, G.; Loveday, J.S.; Weill, G.; Hull, S. Neutron Powder Diffraction above 10-GPa. Physica B 1992, 180, 907–910. [Google Scholar] [CrossRef]
- Segura, A.; Pellicer-Porres, J.; Martinez-García, D.; Rodríguez-Hernández, P.; Muñoz, A.; Itié, J.P. CsCl-InSe as End-Phase of Metastable Rock-Salt and Tetragonal InSe, Book of Abstracts of the Joint AIRAPT-25 and EHPRG-53 (Abstract P2-67). In Proceedings of the Joint AIRAPT-25 and EHPRG-53, Madrid, Spain, 30 August–4 September 2015. [Google Scholar]
- Camassel, J.; Merle, P.; Mathieu, H.; Chevy, A. Excitonic absorption-edge of indium selenide. Phys. Rev. B 1978, 17, 4718–4725. [Google Scholar] [CrossRef]
- Le Toullec, R.; Piccioli, N.; Chervin, J.C. Optical properties of the band-edge exciton in GaSe crystals at 10 K. Phys. Rev. B 1980, 22, 6162–6170. [Google Scholar] [CrossRef]
- Mejatty, M.; Segura, A.; Letoullec, R.; Besson, J.M.; Chevy, A.; Fair, H. Optical absorption edge of GaS under hydrostatic pressure. J. Phys. Chem. Solids 1978, 39, 25–28. [Google Scholar] [CrossRef]
- Besson, J.M.; Jain, K.P.; Kuhn, A. Optical-absorption edge in GaSe under hydrostatic-pressure. Phys. Rev. Lett. 1974, 32, 936–939. [Google Scholar] [CrossRef]
- Segura, A. Phototransport Dans InSe: Application à La Conversion Photovoltaique de L’énergie Solaire. Thèse de Trosième Cycle, Univerité Pierre et Marie Curie, Paris, France, 1977. [Google Scholar]
- Panfilov, V.V.; Subbotin, S.I.; Vereshchagin, L.F.; Ivanov, I.I.; Molchanova, R.T. Exciton absorption, band-structure, and phase-transformation of GaSe under pressure. Phys. Status Solidi (B) 1975, 72, 823–831. [Google Scholar] [CrossRef]
- Bourdon, A.; Chevy, A.; Besson, L. Band Structure of Indium Selenide: Physics of Semiconductors 1978. In Proceedings of the 14th International Conference on the Physics of Semiconductors, Edinburgh, Scotland, 4–8 September 1978; Wilson, H., Ed.; Institute of Physics and Physical Society: London, UK, 1979; pp. 1371–1374. [Google Scholar]
- Gomes da Costa, P.; Dandrea, R.G.; Wallis, R.F.; Balkanski, M. First principles of the electronic structure study of γ-InSe and β-InSe. Phys. Rev. B 1993, 48, 14135–14141. [Google Scholar] [CrossRef]
- Kress-Rogers, E.; Nicholas, R.J.; Portal, J.C.; Chevy, A. Cyclotron-resonance studies on bulk and two-dimensional conduction electrons in InSe. Solid State Commun. 1982, 44, 379–383. [Google Scholar] [CrossRef]
- Ferrer-Roca, C.; Segura, A.; Andres, M.V.; Pellicer, J.; Munoz, V. Investigation of nitrogen-related acceptor centers in indium selenide by means of photoluminescence: Determination of the hole effective mass. Phys. Rev. B 1997, 55, 6981–6987. [Google Scholar] [CrossRef]
- Kane, E.O. Band structure of indium antimonide. J. Phys. Chem. Solids 1957, 1, 249–261. [Google Scholar] [CrossRef]
- Piccioli, N.; Le Toullec, R.; Piccioli, N.; Chervin, J.C. Constantes optiques de InSe entre 10,500 cm−1 (1.30 eV) et 22,500 cm−1 (2.78 eV). J. Physique 1981, 42, 1129–1135. [Google Scholar] [CrossRef]
- Gauthier, M.; Polian, A.; Besson, J.M.; Chevy, A. Optical-properties of gallium selenide under high-pressure. Phys. Rev. B 1989, 40, 3837–3854. [Google Scholar] [CrossRef]
- Elliott, R.J. Intensity of optical absorption by excitons. Phys. Rev. 1957, 108. [Google Scholar] [CrossRef]
- Toyozawa, Y. Theory of line-shapes of the exciton absorption bands. Prog. Theor. Phys. 1958, 20, 53–81. [Google Scholar] [CrossRef]
- Piccioli, N.; Letoullec, R. Exciton-phonon interaction in GaDe. J. Phys. 1989, 50, 3395–3406. [Google Scholar] [CrossRef]
- Goi, A.R.; Cantarero, A.; Schwarz, U.; Syassen, K.; Chevy, A. Low temperature exciton absorption in InSe under pressure. Phys. Rev. B 1992, 45, 4221–4226. [Google Scholar] [CrossRef]
- Ulrich, C.; Olguin, D.; Cantarero, A.; Goñi, A.R.; Syassen, K.; Chevy, A. Effect of pressure on direct optical transitions of gamma-InSe. Phys. Status Solidi (B) 2000, 221, 777–787. [Google Scholar] [CrossRef]
- Errandonea, D.; Manjon, F.J.; Pellicer, J.; Segura, A.; Munoz, V. Direct to indirect crossover in III–VI layered compounds and alloys under pressure. Phys. Status Solidi (B) 1999, 211, 33–38. [Google Scholar] [CrossRef]
- Manjón, F.J.; Errandonea, D.; Segura, A.; Muñoz, V.; Tobías, G.; Ordejón, P.; Canadell, E. Experimental and theoretical study of band structure of InSe and In1−xGaxSe (x < 0.2) under high pressure: Direct to indirect crossovers. Phys. Rev. B 2001, 63, 125330. [Google Scholar] [CrossRef]
- Ferlat, G.; Xu, H.; Timoshevskii, V.; Blasé, X. Ab initio studies of structural and electronic properties of solid indium selenide under pressure. Phys. Rev. B 2002, 66, 085210. [Google Scholar] [CrossRef]
- Olguín, D.; Cantarero, A.; Ulrich, C.; Syassen, K. Effect of pressure on structural properties and energy band gaps of γ-InSe. Phys. Status Solidi (B) 2003, 235, 456–463. [Google Scholar] [CrossRef]
- Manjón, F.J.; Segura, A.; Muñoz-Sanjosé, V.; Tobías, G.; Ordejón, P.; Canadell, E. Band structure of indium selenide investigated by intrinsic photoluminescence under high pressure. Phys. Rev. B 2004, 70, 125201. [Google Scholar] [CrossRef]
- Millot, M.; Broto, J.M.; George, S.; Gonzalez, J.; Segura, A. High pressure and high magnetic field behavior of free and donor-bound-exciton photoluminescence in InSe. Phys. Status Solidi (B) 2009, 246, 532–535. [Google Scholar] [CrossRef]
- Millot, M.; Broto, J.M.; George, S.; Gonzalez, J.; Segura, A. Electronic structure of indium selenide probed by magneto-absorption spectroscopy under high pressure. Phys. Rev. B 2010, 81, 205211. [Google Scholar] [CrossRef]
- Ghalouci, L.; Taibi, F.; Ghalouci, F.; Bensaid, M.O. Ab initio investigation into structural, mechanical and electronic properties of low pressure, high pressure and high pressure-high temperature phases of Indium Selenide. Comput. Mater. Sci. 2016, 124, 62–77. [Google Scholar] [CrossRef]
- Polian, A.; Chervin, J.C.; Besson, J.M. Phonon modes and stability of GaS up to 200 kilobars. Phys. Rev. B 1980, 22, 3049–3058. [Google Scholar] [CrossRef]
- Kuroda, N.; Ueno, O.; Nishina, Y. Lattice-dynamic and photoelastic properties of GaSe under high-pressures studied by raman-scattering and electronic susceptibility. Phys. Rev. B 1987, 35, 3860–3870. [Google Scholar] [CrossRef]
- Allahverdi, K.; Babaev, S.; Ellialtioǧlu, Ş.; Ismailov, A. Raman scattering in layer indium selenide under pressure. Solid State Commun. 1993, 87, 675–678. [Google Scholar] [CrossRef]
- Allakhverdiev, K.; Ellialtioglu, S.; Ismailov, Z. Raman scattering and Hall effect in layer InSe under pressure. High Press. Res. 1994, 13, 121–125. [Google Scholar] [CrossRef]
- Ulrich, C.; Mroginski, M.A.; Goñi, A.; Cantarero, A.; Schwarz, U.; Muñoz, V.; Syassen, K. Vibrational Properties of InSe under Pressure: Experiment and Theory. Phys. Status Solidi (B) 1996, 198, 121–127. [Google Scholar] [CrossRef]
- Choi, I.H.; Yu, P.Y. Pressure dependence of phonons and excitons in InSe films prepared by metal-organic chemical vapor deposition. Phys. Rev. B. 2003, 68, 165339. [Google Scholar] [CrossRef]
- Gauthier, M. Pressure-induced charge transfer. High Press. Res. 1992, 9330–9342. [Google Scholar] [CrossRef]
- Rushchanskii, K.Z. The influence of hydrostatic pressure on the static and dynamic properties of an InSe crystal: A first-principles study. Phys. Solid State 2006, 46, 179–187. [Google Scholar] [CrossRef]
- Polian, A.; Besson, J.M.; Grimsditch, M.; Vogt, H. Elastic properties of GaS under high-pressure by brillouin-scattering. Phys. Rev. B 1982, 25, 2767–2775. [Google Scholar] [CrossRef]
- Manjón, F.J. Estudio de la estructura de bandas del seleniuro de indio mediante medidas ópticas bajo presión hidrostática. Tesis Doctoral, Universitat de València, Valencia, Spain, 1999. [Google Scholar]
- Manjon, F.J.; Van der Vijver, Y.; Segura, A.; Muñoz, V. Pressure dependence of the refractive index in InSe. Semicond. Sci. Technol. 2000, 15, 806–812. [Google Scholar] [CrossRef]
- Van Vechten, J.A. Quantum dielectric theory of electronegativity in covalent systems. I. electronic dielectric constant Phys. Rev. 1969, 182, 891–905. [Google Scholar] [CrossRef]
- Phillips, J.C. Ionicity of chemical bond in crystals. Rev. Mod. Phys. 1970, 42, 317–356. [Google Scholar] [CrossRef]
- Penn, D.R. Wave-number-dependent dielectric function of semiconductors. Phys. Rev. 1962, 128, 2093–2097. [Google Scholar] [CrossRef]
- Segura, A.; Chevy, A. Large increase of the low-frequency dielectric-constant of gallium sulfide under hydrostatic-pressure. Phys. Rev. 1994, 49, 4601–4604. [Google Scholar] [CrossRef]
- Errandonea, D.; Segura, A.; Munoz, V.; Chevy, A. Pressure dependence of the low-frequency dielectric constant in III-VI semiconductors. Phys. Status Solidi (B) 1999, 211, 201–206. [Google Scholar] [CrossRef]
- Errandonea, D.; Segura, A.; Muñoz, V.; Chevy, A. Effects of pressure and temperature on the dielectric constant of GaS, GaSe, and InSe: Role of the electronic contribution. Phys. Rev. B 1999, 60, 15866–15874. [Google Scholar] [CrossRef]
- D’Amour, H.; Holzapfel, W.B.; Polian, A.; Chevy, A. Crystal-structure of a new high-pressure polymorph of gas. Solid State Commun. 1982, 44, 853–855. [Google Scholar] [CrossRef]
- Errandonea, D.; Segura, A.; Sanchez-Royo, J.F.; Muñoz, V.; Ulrich, C.; Grima, P.; Chevy, A. Effects of Conduction Band Structure and Dimensionality of the Electron Gas on Transport Properties of InSe under Pressure. Phys. Status Solidi (B) 1996, 198, 129–134. [Google Scholar] [CrossRef]
- Errandonea, D.; Segura, A.; Sanchez-Royo, J.F.; Muñoz, V.; Grima, P.; Chevy, A.; Ulrich, C. Investigation of conduction-band structure, electron-scattering mechanisms, and phase transitions in indium selenide by means of transport measurements under pressure. Phys. Rev. B 1997, 55, 16217–16225. [Google Scholar] [CrossRef]
- Errandonea, D.; Segura, A.; Manjón, F.J.; Chevy, A. Transport measurements in InSe under high pressure and high temperature: Shallow-to-deep donor transformation of Sn related donor impurities. Semicond. Sci. Technol. 2003, 18, 241–246. [Google Scholar] [CrossRef]
- Manjon, F.J.; Errandonea, D.; Segura, A.; Chervin, J.C.; Muñoz, V. Precursor effects of the rhombohedral-to-cubic phase transition in indium selenide. High Press. Res. 2002, 22, 261. [Google Scholar] [CrossRef]
- Errandonea, D.; Sanchez-Royo, J.F.; Segura, A.; Chevy, A.; Roa, L. Investigation of acceptor levels and hole scattering mechanisms in p-gallium selenide by means of transport measurement under pressure. High Press. Res. 1998, 16, 13–26. [Google Scholar] [CrossRef]
- Errandonea, D.; Segura, A.; Manjón, F.J.; Chevy, A.; Machado, E.; Tobias, G.; Ordejón, P.; Canadell, E. Crystal symmetry and pressure effects on the valence band structure of γ-InSe and γ-GaSe: Transport measurements and electronic structure calculations. Phys. Rev. B 2005, 71, 125206. [Google Scholar] [CrossRef]
- Errandonea, D.; Martínez-García, D.; Segura, A.; Ruiz-Fuertes, J.; Lacomba-Perales, R.; Fages, V.; Chevy, A.; Roa, L.; Muñoz-San José, V. High-pressure electrical transport measurements on p-type GaSe and InSe. High Press. Res. 2006, 26, 513–518. [Google Scholar] [CrossRef]
- Segura, A.; Errandonea, D.; Martínez-García, D.; Manjón, F.J.; Chevy, A.; Tobias, G.; Ordejón, P.; Canadell, E. Transport measurements under pressure in III–IV layered semiconductors. Phys. Status Solidi (B) 2007, 244, 162–168. [Google Scholar] [CrossRef]
- Rydberg, H.; Dion, M.; Jacobson, N.; Schroder, E.; Hyldgaard, P.; Simak, S.I.; Langreth, D.C.; Lundqvist, B.I. Van der Waals density functional for layered structures. Phys. Rev. Lett. 2003, 91, 126402. [Google Scholar] [CrossRef] [PubMed]
- Cazorla, C.; Boronat, J. Simulation and understanding of atomic and molecular quantum crystals. Rev. Mod. Phys. 2017, 89, 035003. [Google Scholar] [CrossRef]
- Tawfik, S.A.; Gould, T.; Stampfl, C.; Ford, M.J. Evaluation of van der Waals density functionals for layered materials. Phys. Rev. Mater. 2018, 2, 034005. [Google Scholar] [CrossRef]
- Martinez-Pastor, J.; Segura, A.; Julien, C.; Chevy, A. Shallow-donor impurities in indium selenide investigated by means of far-infrared spectroscopy. Phys. Rev. B 1992, 46, 4607–4616. [Google Scholar] [CrossRef]
Figure 1.
Crystal structure of III–VI layered semiconductors: (a) structure of a single layer and (b) stacking sequence of the single layers for three different polytypes.
Figure 1.
Crystal structure of III–VI layered semiconductors: (a) structure of a single layer and (b) stacking sequence of the single layers for three different polytypes.

Figure 2.
Results of XRD experiments in InSe-I DAC: (a) EOS of InSe-I and InSe-II from powder diffraction. The x-axis corresponds to the pressure and the y–axis to the volume per formula [27]. (b) EOS of of InSe-I from single crystal diffraction (circles). Crosses represent the data of Figure 1a [29].

Figure 3.
(a) Pressure dependence of the InSe bond-length as obtained from EXAFS measurements [31]. (b) Relative variation of the layer thickness (intralayer) and the Van der Waals gap (interlayer) as a function of pressure [37].

Figure 4.
Basic scheme of crystal phase transitions between the different InSe crystal phases.
Figure 5.
Pressure dependence of the direct absorption edge in III–VI semiconductors. (a) Absorption edge of GaSe at different pressures [48]. (b) Pressure dependence of the direct gap shift for GaSe [48], InSe [49], and GaS [47].

Figure 6.
Band structure of γ-InSe as obtained from ab-initio calculations, with assignment of the three lowest energy direct transitions [52].
Figure 6.
Band structure of γ-InSe as obtained from ab-initio calculations, with assignment of the three lowest energy direct transitions [52].

Figure 7.
Pressure dependence of the fundamental absorption edge (B-edge) and the second direct transition (A-edge) in GaSe (a) and InSe (b) [25].
Figure 7.
Pressure dependence of the fundamental absorption edge (B-edge) and the second direct transition (A-edge) in GaSe (a) and InSe (b) [25].
Figure 8.
(a) Pressure dependence of the direct and indirect absorption edges in GaSe. (b) Pressure dependence of effective exciton Rydberg (exciton binding energy) and the dipole matrix element (exciton absorption intensity) in GaSe fundamental edge [57].
Figure 8.
(a) Pressure dependence of the direct and indirect absorption edges in GaSe. (b) Pressure dependence of effective exciton Rydberg (exciton binding energy) and the dipole matrix element (exciton absorption intensity) in GaSe fundamental edge [57].
Figure 9.
InSe optical properties under pressure. (a) InSe fundamental absorption edge at 10 K and different pressures. (b) Pressure dependence of the exciton binding energy in InSe [58].
Figure 9.
InSe optical properties under pressure. (a) InSe fundamental absorption edge at 10 K and different pressures. (b) Pressure dependence of the exciton binding energy in InSe [58].

Figure 10.
Optical properties of γ-InSe under pressure. (a) PMR spectra of γ-InSe at different pressures in the spectral range of direct allowed transitions. (b) Pressure dependence of the direct transitions in InSe [62].
Figure 10.
Optical properties of γ-InSe under pressure. (a) PMR spectra of γ-InSe at different pressures in the spectral range of direct allowed transitions. (b) Pressure dependence of the direct transitions in InSe [62].

Figure 11.
InSe absorption edge under pressure. (a) Decomposition of the absorption spectrum in direct and two indirect absorption contributions. (b) Pressure dependence of the direct and indirect transitions in InSe and In0.86Ga0.12Se [64].
Figure 11.
InSe absorption edge under pressure. (a) Decomposition of the absorption spectrum in direct and two indirect absorption contributions. (b) Pressure dependence of the direct and indirect transitions in InSe and In0.86Ga0.12Se [64].

Figure 12.
Band structure of γ-InSe under presssure. (a) Assignment of the indirect transitions [64]. (b) Constant energy surface plots around the toroidal valence band maximum, for a plane perpendicular to the c-axis at the Γ point (upper figure) and a plane parallel to the c-axis at the Γ point (lower figure) [37].

Figure 13.
Intrinsic photoluminescence in γ-InSe under high pressure. (a) Pressure dependence of the PL peak width. (b) Pressure dependence of the photoluminescence peak intensity [67].
Figure 13.
Intrinsic photoluminescence in γ-InSe under high pressure. (a) Pressure dependence of the PL peak width. (b) Pressure dependence of the photoluminescence peak intensity [67].
Figure 14.
Magnetoabsorption experiments in InSe. (a) Magnetoabsorption spectra at different pressures. (b) Reemergence of the exciton peak at 4 GPa under high magnetic field. Inset: magnetic field at which the exciton peak reappears as a function of pressure [69].
Figure 14.
Magnetoabsorption experiments in InSe. (a) Magnetoabsorption spectra at different pressures. (b) Reemergence of the exciton peak at 4 GPa under high magnetic field. Inset: magnetic field at which the exciton peak reappears as a function of pressure [69].

Figure 15.
(a) Reflectivity versus photon energy in the plasma spectral range of RS-InSe [27]. (b) Absorption edge of monoclinic InSe under high pressure. Inset: pressure dependence of the direct bandgap in MC InSe [41].
Figure 16.
Phonons in γ-InSe. (a) Vibration schemes of the normal modes at the Γ point. (b) Pressure dependence of the normal modes frequencies [75].
Figure 16.
Phonons in γ-InSe. (a) Vibration schemes of the normal modes at the Γ point. (b) Pressure dependence of the normal modes frequencies [75].
Figure 17.
Phonon modes in MC- and T-InSe. (a) Vibration schemes of Raman active modes at the Γ point. (b) Pressure dependence of the normal modes frequencies [30].
Figure 17.
Phonon modes in MC- and T-InSe. (a) Vibration schemes of Raman active modes at the Γ point. (b) Pressure dependence of the normal modes frequencies [30].

Figure 18.
(a) Pressure dependence of the birefringence in β-GaS [79]. (b) Relative change of the refractive index as a function of pressure for β-GaS, ε-GaSe, and γ-InSe [80].
Figure 19.
(a) Pressure dependence of the static dielectric constant for β-GaS, ε-GaSe, and γ-InSe [87]. (b) Correlation between the pressure behavior of the Penn gap and the indirect gap in the three compounds [87].
Figure 20.
(a) Pressure dependence of the transport parameters (resistivity, electron concentration, and electron mobility) in Sn-doped n-type γ-InSe. (b) Pressure dependence of the Fermi level and the deep trap (both with respect to the conduction band minimum) as determined from the data in Figure 20a [90].
Figure 21.
(a) Pressure dependence of the hole concentration in p-type γ-InSe and ε-GaSe. (b) Pressure dependence of the hole mobility in p-type γ-InSe and ε-GaSe.
Figure 21.
(a) Pressure dependence of the hole concentration in p-type γ-InSe and ε-GaSe. (b) Pressure dependence of the hole mobility in p-type γ-InSe and ε-GaSe.

Table 1.
Equation of state parameters and compressibility tensor for InSe crystal phases.
| Crystal | V0 (Å3) | B0 (GPa) | B0′ | (GPa−1) | (GPa−1) | |
|---|---|---|---|---|---|---|
| γ-InSe 1 | - | 35(10) | - | 0.0033(19) | 0.022(7) | 6.7 |
| γ-InSe 2 | - | - | 10.8(8) | 0.0033(19) 3 | - | - |
| γ-InSe 4 | 350.8 | 36(10) | 4.05(30) | 0.005(1) 5 | 0.014(2) 5 | 2.8 |
| γ-InSe 6 | 350.4 | 24(3) | 8.6(8) | 0.0063(6) | 0.016(2) | 2.5 |
| RS-InSe 4 | 190.5 | 51.2 | 4 | - | - | - |
| MC(T)-InSe 7 | 207 | 44 | 5.4 | - | - | - |
Table 2.
Electron and hole effective mass in γ-InSe.
| Title | ||||
|---|---|---|---|---|
| Theory 1 | 0.18 | 0.11 | 5 | 0.11 |
| Theory 2 | 0.12 | 0.03 | 3.1 | 0.03 |
| Experiment 3,4 | 0.141(2) | 0.081(9) | 0.73(9) | 0.17(3) |
© 2018 by the author. Licensee MDPI, Basel, Switzerland. This article is an open access article distributed under the terms and conditions of the Creative Commons Attribution (CC BY) license (http://creativecommons.org/licenses/by/4.0/).
Share and Cite
MDPI and ACS Style
Segura, A. Layered Indium Selenide under High Pressure: A Review. Crystals 2018, 8, 206. https://doi.org/10.3390/cryst8050206
AMA Style
Segura A. Layered Indium Selenide under High Pressure: A Review. Crystals. 2018; 8(5):206. https://doi.org/10.3390/cryst8050206
Chicago/Turabian StyleSegura, Alfredo. 2018. "Layered Indium Selenide under High Pressure: A Review" Crystals 8, no. 5: 206. https://doi.org/10.3390/cryst8050206
Note that from the first issue of 2016, this journal uses article numbers instead of page numbers. See further details here.