Article

New Polymorphs of the Phase-Change Material Sodium Acetate

Institute of Anorganische Chemie and Strukturchemie 2, Heinrich-Heine University of Düsseldorf, Universitätsstraße 1, 40225 Düsseldorf, Germany
*
Author to whom correspondence should be addressed.
Crystals 2018, 8(5), 213; https://doi.org/10.3390/cryst8050213
Submission received: 15 March 2018 / Revised: 6 May 2018 / Accepted: 8 May 2018 / Published: 15 May 2018
(This article belongs to the Special Issue Experimental and Theoretical Electron Density Analysis of Crystals)

Abstract

:
Two new polymorphs of the phase-change material sodium acetate were characterized by single-crystal X-ray diffraction. A tetragonal form was found first. It converted to a orthorhombic form after measurement of a single crystal of the tetragonal form at 100 K and subsequent warming to ambient temperature. Hirshfeld surface fingerprint plots show the different packing environments of the two new compared to the two known orthorhombic polymorphs Forms I and II. The accuracy and precision of the structures were improved compared to conventional independent atom model refinement through the use of aspherical scattering factors of the invariom database. We think that the layered nature of all sodium acetate forms, and the thereby limited (“quantized”) availability of vibrational modes, is related to the phenomenon of supersaturation, which is connected to its phase-change properties.

Graphical Abstract

1. Introduction

The use of fossil fuels is in most cases unsustainable. A necessary approach to cope with the limited availability of such fuels is to improve energy efficiency and to change to renewable sources of energy. Research into storage and controlled release of energy is thus a very important area of fundamental and applied research, where possible solutions would have a major impact on society.
In many industrial processes, waste heat is a major source of untapped energy. Season-dependent sources of excess heat are solar thermal energy systems for domestic heating. Phase-change materials (PCMs) [1,2,3] can absorb and release excess heat through reversible changes in their solid state structures. For such processes, the term latent heat thermal energy storage was coined. A phase change can be induced when the heat is required again. This way, energy can be stored and released in a controlled manner in space and time; or further converted if so desired or required, which cannot be achieved using water. Another major advantage of PCMs over using water for storing heat is the significant reduction in storage volume. Many (mixtures of) compounds can fulfill such a function. Often, these materials are simple, which is beneficial for everyday use. For commercial use, additional requirements are non-toxicity and low cost. The PCM sodium acetate can fulfill these requirements [4], which is why its solid state structure is of some relevance.
In 1983, structural determinations of sodium acetate [5] were carried out, and two orthorhombic polymorphs were characterized. These crystals were obtained at elevated temperatures of 337 K, since at room temperature, the anhydrate quickly transforms into the trihydrate [6,7]. We recently obtained two so far unknown tetragonal and orthorhombic crystal forms of sodium acetate. Accurate structure determinations of both new structures reported here rely on refinements with aspherical scattering factors of the invariom database [8]. These results are compared to conventional refinements using the independent atom model (IAM). Using the known and new structure of sodium acetate, we speculate why supersaturation [9] might occur.

2. Materials and Methods

2.1. Experimental

Two single-crystal X-ray diffraction experiments (Table 1) on different polymorphs of sodium acetate using the same crystal were carried out at temperatures of 100 K with Mo K α radiation. Data collection was performed on a Huber Type 512 four circle diffractometer equipped with a Bruker APEX I CCD area detector, an Incoatec microsource with mirror optics and a Oxford Cryosystems nitrogen gas-stream cooling device. An overall coverage of over 99% was obtained for full resolution ( sin θ / λ = 0.88 and 0.84) in both cases. Then, 15,026 and 52,457 reflections were collected, and no significant intensity decay was observed. sadabs [10] was used for scaling and multi-scan absorption correction [11]. A correction factor for low-energy contamination of 0.0037 was also applied to take this source-specific effect into account [12]. Full crystallographic details are given in Table 1. CCDC 1,829,943 (tetragonal Form III) and 1,829,942 (orthorhombic Form IV) contain the corresponding depositions including merged structure factors embedded in the CIF file.

2.2. Least-Squares Refinement

The structural solution with the dual-space direct method program shelxt [13] gave the tetragonal space group P 4 / n m m for Form III and the orthorhombic space group P c c a for Form IV. The ADDSYMM routine of the program platon [14] also suggests the higher symmetry at 300 K when disorder is ignored, but figures of merit show that the structure is indeed orthorhombic. After initial IAM refinements with shelxl [15], we have subsequently carried out invariom refinements [8] that used fixed pseudoatom scattering factors derived from density functional theory (DFT) computations on both new forms of sodium acetate with the xd2006 suite of programs [16]. Table 2 lists invariom scattering-factor names, the respective local-atomic site symmetry and the model compounds that provide the local chemical environment from which these scattering factors were computed. For the sodium ion, full charge transfer was assumed [17,18]. Invariom refinement relies on the Stewart–Hansen–Coppens multipole model [19,20] and can also be applied to disordered structures [21] like sodium acetate.
Initial hydrogen-atom positions for invariom refinement were generated with shelxl using AFIX commands. All X-H bond distances were then elongated to invariom database values (obtained from geometry optimization of the respective model compound) and constrained in a riding-hydrogen model. Constraints and input files for invariom refinement with the program xd2006 were generated with the preprocessor program invariomtool [22]. Due to disorder, invariom refinements comprised the best model that could be applied. Invariom refinement also ensures that the same aspherical-atom model is underlying the structural comparisons and analysis.

3. Results

3.1. Crystallization and Space Group Changes

Crystallization of a new tetragonal Form III from a supersaturated aqueous solution was observed. Tetragonal crystals formed from a supersaturated solution at room temperature that had matured over six months. When left at ambient conditions, these crystals subsequently dissolved again in the same solution to give the well-studied trihydrate. We isolated a tetragonal crystal specimen and collected and evaluated X-ray diffraction data at 100 K. When we warmed the specimen up to ambient temperature, we found a new lower-symmetry orthorhombic form that was initially measured at 300 K and then also cooled and measured at 100 K.
The tetragonal high-symmetry space group P 4 / n m m was thus obtained first. We suspect that initial cooling and measurement at 100 K did not lead to a phase change of the orthorhombic low-temperature Form IV since the tetragonal form is metastable when shock-frozen in a, open-flow nitrogen cooling device. Since both datasets can thus be collected at 100 K, the measurement temperature does not provide information on which form is lower in energy. However, since cooling the tetragonal crystal led to the orthorhombic form in P c c a later on and since a transformation to the tetragonal form was not observed afterwards, it is suspected that the orthorhombic Form IV is lower in energy.
There is no obvious group/subgroup relationship between the tetragonal high-temperature Form III and the orthorhombic low-temperature Form IV. However, when we heated the crystal (i.e., Form IV) to 320 K, yet another structure could be solved and refined in space group C m m a . A complete dataset could not be measured, since the space group changed during the measurement; only 100 frames could be collected that unambiguously belonged to the same phase. Hence, the R-Factor (>10%), completeness and redundancy of these data are poor. Since a detailed discussion of the structural details of Form II was already provided in [5], results other than the space group are not further discussed here. Nevertheless, the space group found is a subgroup of the tetragonal space group P 4 / n m m and a supergroup of the orthorhombic low-temperature form in P c c a . It can thus be established that the tetragonal form is the aristotype present at ambient temperature. We suspect that the orthorhombic Form IV in P c c a is the most stable at low temperature.

3.2. Figures of Merit and Hirshfeld Test

The crystallographic R-factor after invariom model refinement improved by approximately 0.5% in both new structures when compared to the IAM. Likewise, anisotropic displacement parameters (ADPs) improved for all non-hydrogen atoms compared to the IAM and became physically more meaningful, and this is proven by the results of the Hirshfeld-test [23] provided in Table 3, where R-factors and the goodness of fit are compared for both structures and where details available for the earlier structures [5] are also provided.

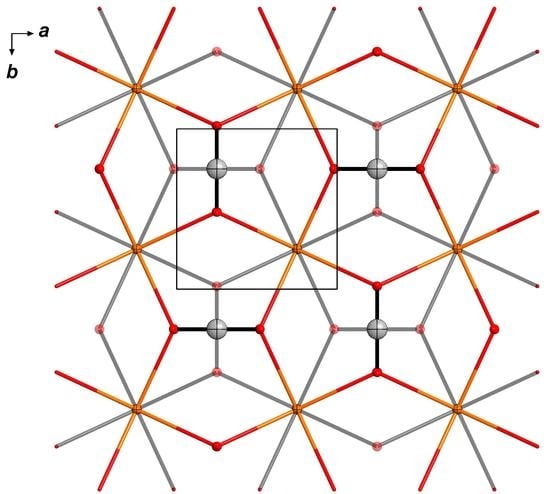
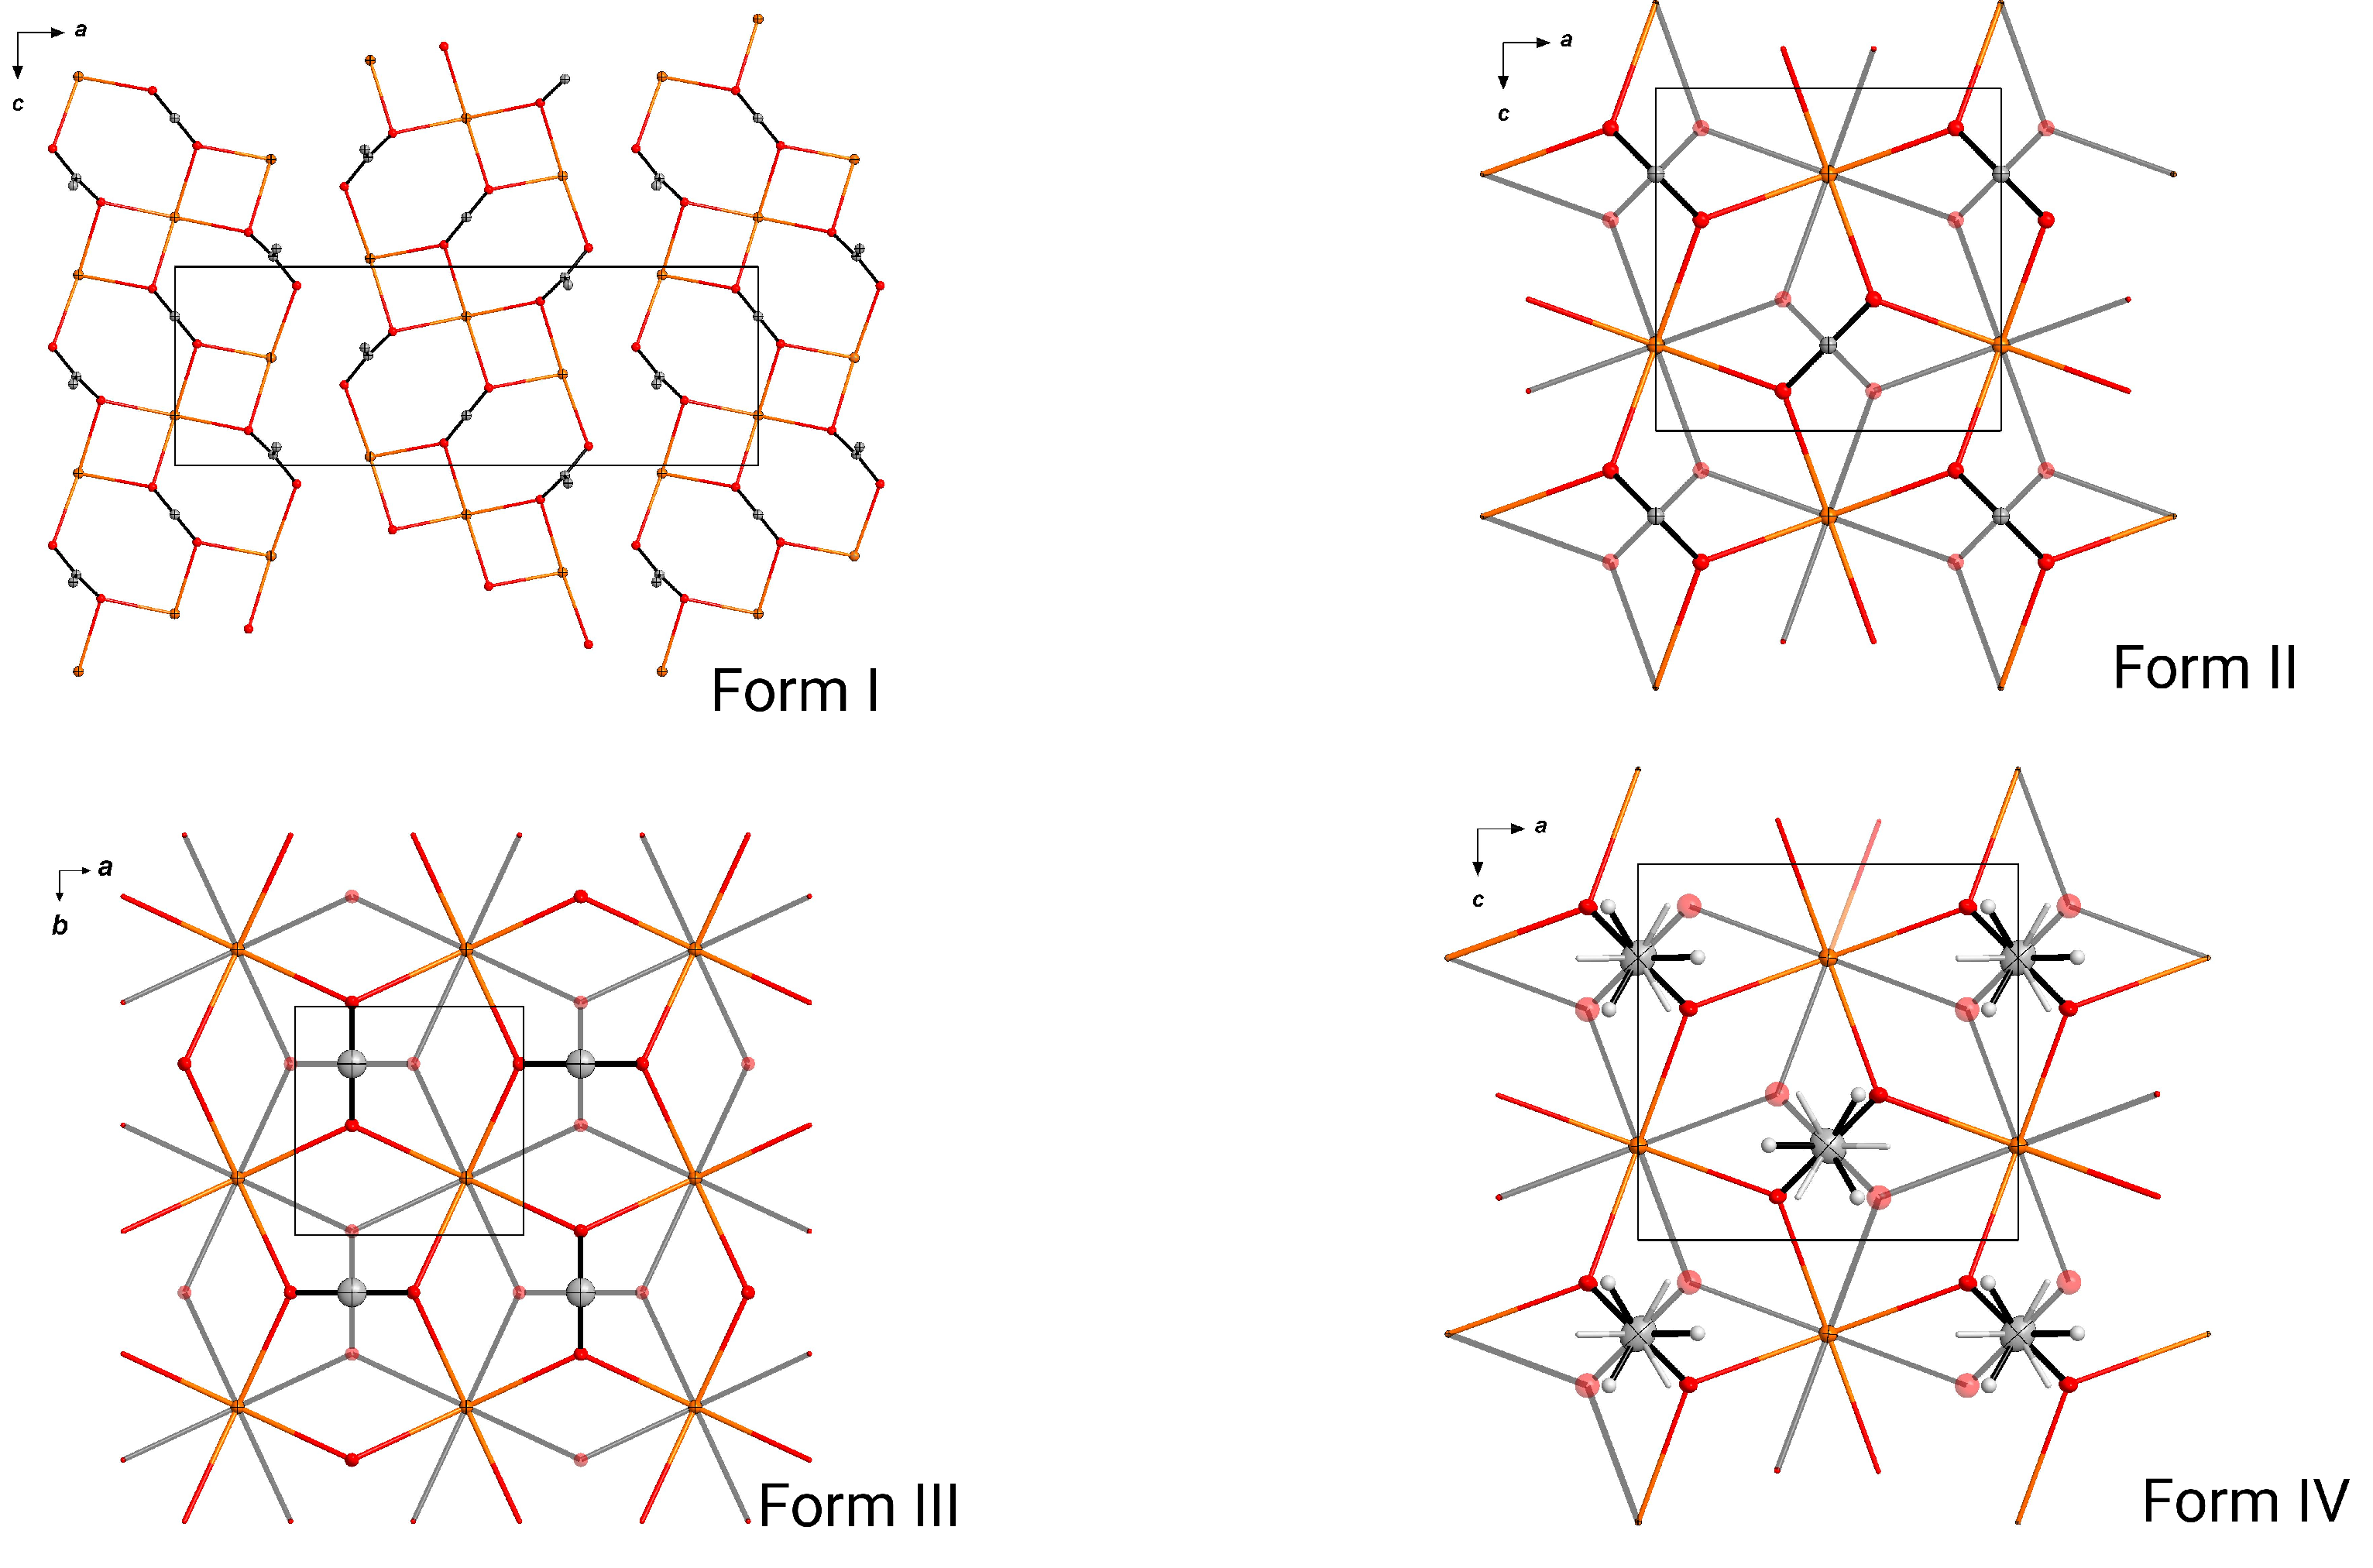
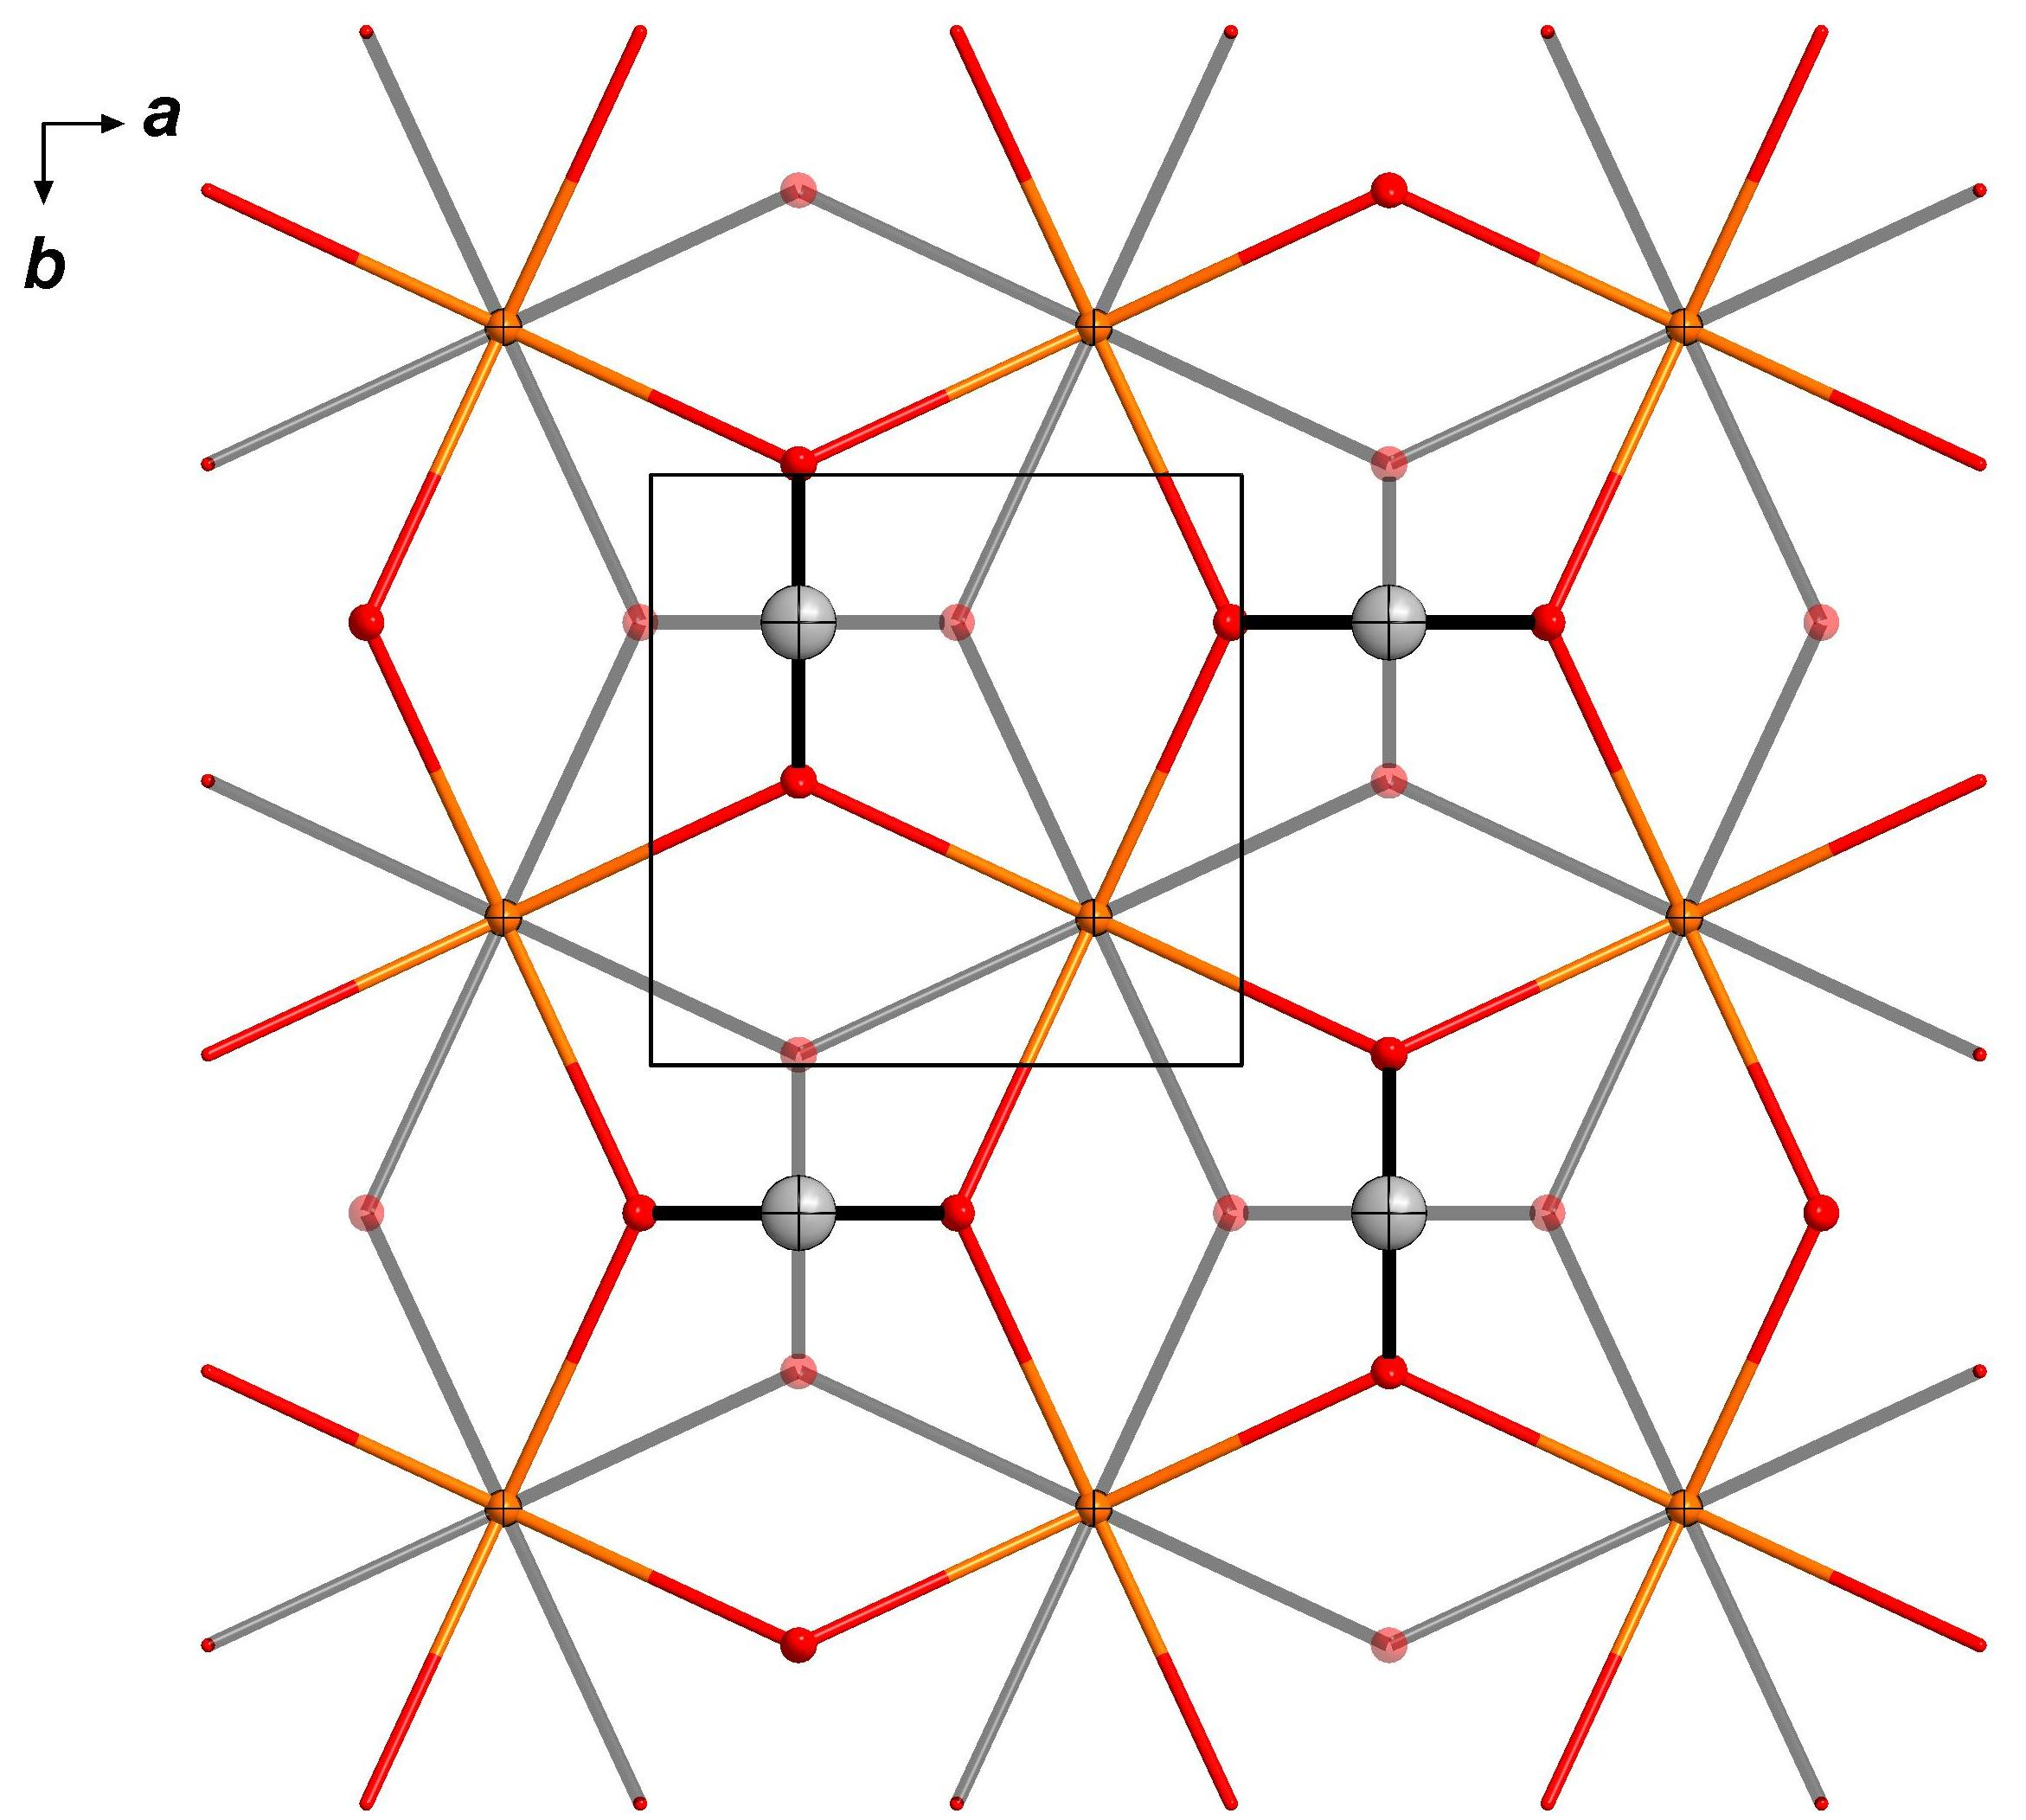
3.3. Structural Details

Bond distances and angles in the structure of Forms I and II of sodium acetate have been discussed in detail already [5]. Intramolecular bond distances and angles agree well between all forms. Figure 1 illustrates the packing of the two new polymorphs in comparison to the two known forms. From the figures, it becomes immediately obvious that all are layered structures. However, differences between the atomic arrangements are rather difficult to comprehend from the figures alone, and that is why a more detailed discussion follows.
Form I is different from all other forms. As shown in the figure (upper left part), there are strands that run along the c direction of the crystal structure. Only the shortest Na⋯O distances were considered in the figure. When longer Na⋯O distances are also taken into account, a double-layer is obtained. The methyl groups on both sides of the double layers point to the next double layer, generating a hydrophobic and a hydrophilic stack. The acetate ion at the edge of the strand-type structure (there are two crystallographically independent anions) shows a very asymmetric coordination, whereas the acetate ions in the middle of the strand are more symmetrically coordinated.
Form II shows a more symmetrical arrangement. Like for Form I, we only consider the shortest Na⋯O distances in this layered structure, where disorder in the carboxylate orientation is observed (Figure 1, upper right part; disordered bonds and atoms are transparent). As in Form I, a double layer is obtained when considering longer Na⋯O distances. It should also be mentioned that there are two crystallographically independent layers stacked along the b direction ( P c c a , a = 5.951 (2) Å, b = 20.213 (7) Å, c = 5.902 (3) Å). Full details on this interesting structure are provided in [5].
Form IV is closely related to Form II, and the general features of the layers are the same (lower right part of Figure 1). In Form IV, the b vector gets halved with respect to Form II, and thus, only one crystallographically independent layer is maintained ( P c c a , a = 5.9136 (5) Å, b = 10.0457 (8) Å, c = 5.8572 (4) Å). In terms of group-subgroup relations, this is classified as isomorphic with an index of two [25].
Tetragonal Form III (lower left part of Figure 1) finally seems to represent the aristotype of the family of sodium acetate modifications ( P 4 / n m m , a , b = 4.176 (4) Å, c = 10.092 (18) Å). In Form III, a 50% occupation of both carboxylate-group orientations is required by symmetry. In the orthorhombic Form IV, this carboxylate disorder is reduced to 85/15% (both at 300 K and 100 K), whereas in Form II, only one molecule shows such disorder, and in Form I, no such disorder exists, with Z’ (the number of molecules in the asymmetric unit of the unit cell) being 1.5 in Form I and one in Form II. The hydrogen methyl groups are most probably rotationally disordered in all four structures (certainly in Forms III and IV); not all hydrogen atoms were present in the deposited CIF files of Form II, and partial hydrogen disorder for Form I had been already mentioned in [5]. It would be interesting to study the possible influence of temperature, pressure and packing on the hydrogen rotational disorder in more detail.
In summary, Form III is similar to Form IV in that the packing is essentially the same, except that the site occupancies of the disordered oxygen atoms differ; Form IV is also very closely related to Form II. Common to all four polymorphs are layers formed by alternating predominantly ionic Na⋯O (carboxylate) interactions and non-directional dispersive interactions between the methyl groups of the acetate anions. At higher temperatures, the order within the acetate layer starts to weaken. This becomes most apparent from the emerging alternative positions of all atoms in the acetate anion in Form I.
Since the directionality of the ionic interactions orients the carboxylate groups towards the sodium layers, perturbing the layers will incur an energetic penalty. Solvation with water might not be able to provide this energy even at room temperature. We therefore suggest that from this observation alone, an indication is provided as to why sodium acetate forms supersaturated solutions. Another side of the same coin is comprised by the molecular vibrations, which correspond to a particular energy. Only discrete energy portions will cause layers to vibrate and ultimately to break up. To each vibration, a particular mass and force constant are associated. Since whole layers need to be broken up in the process of solvation, observing partial fragmentation in Form I might provide a snapshot in the dynamic process to further fragmentation of the layers at higher temperature.

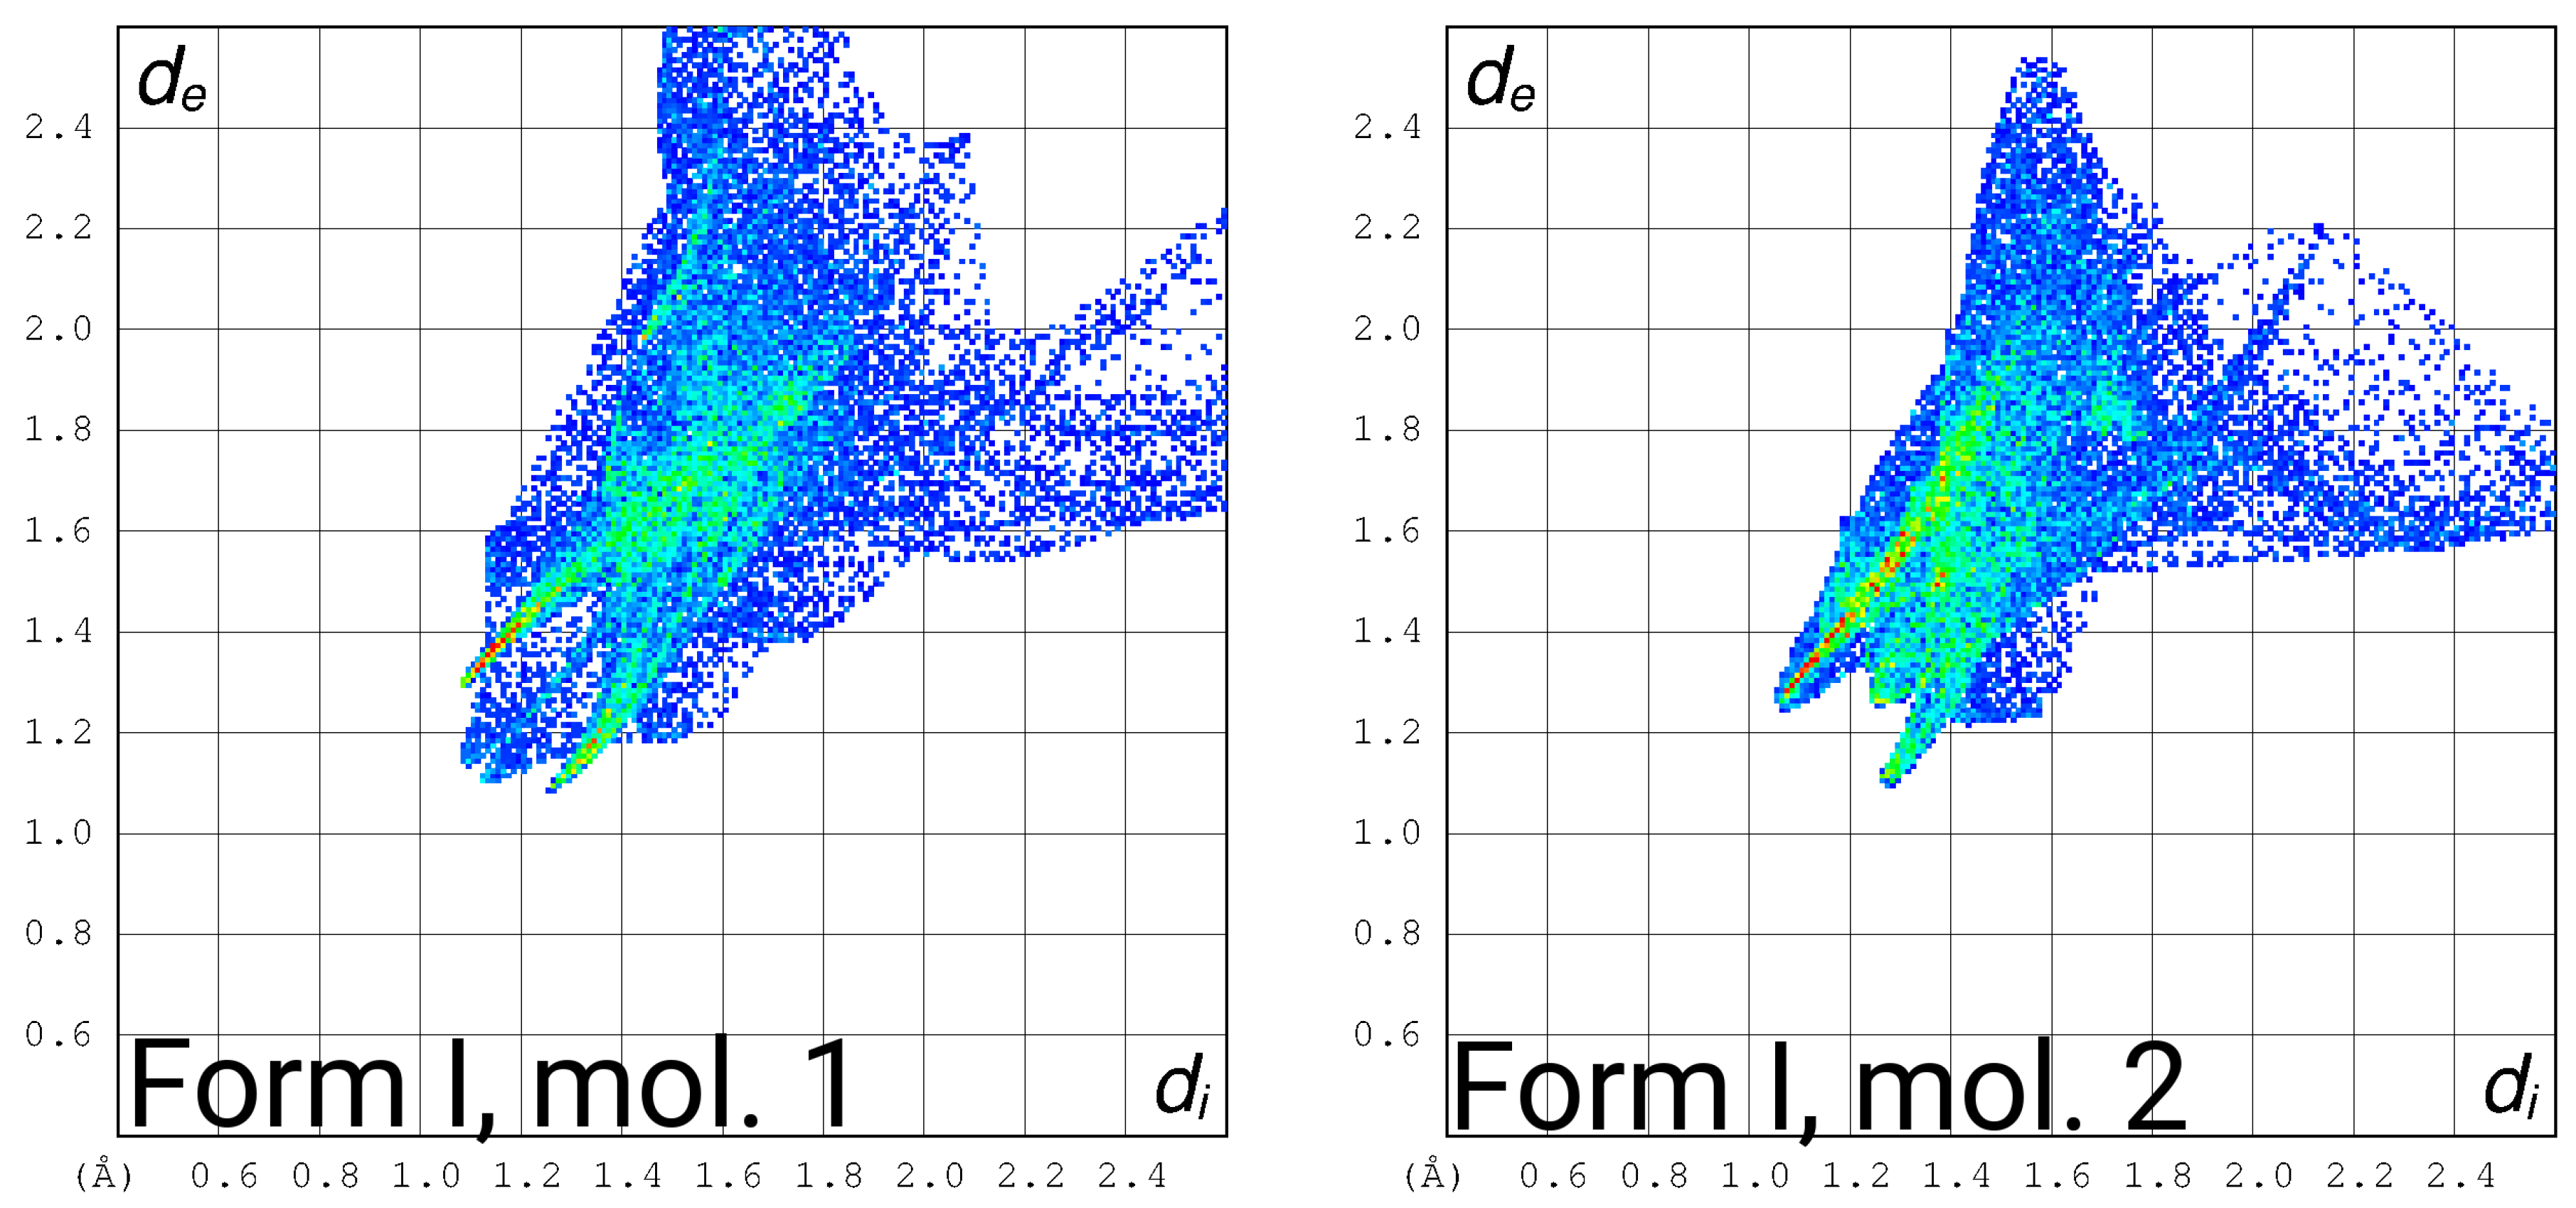
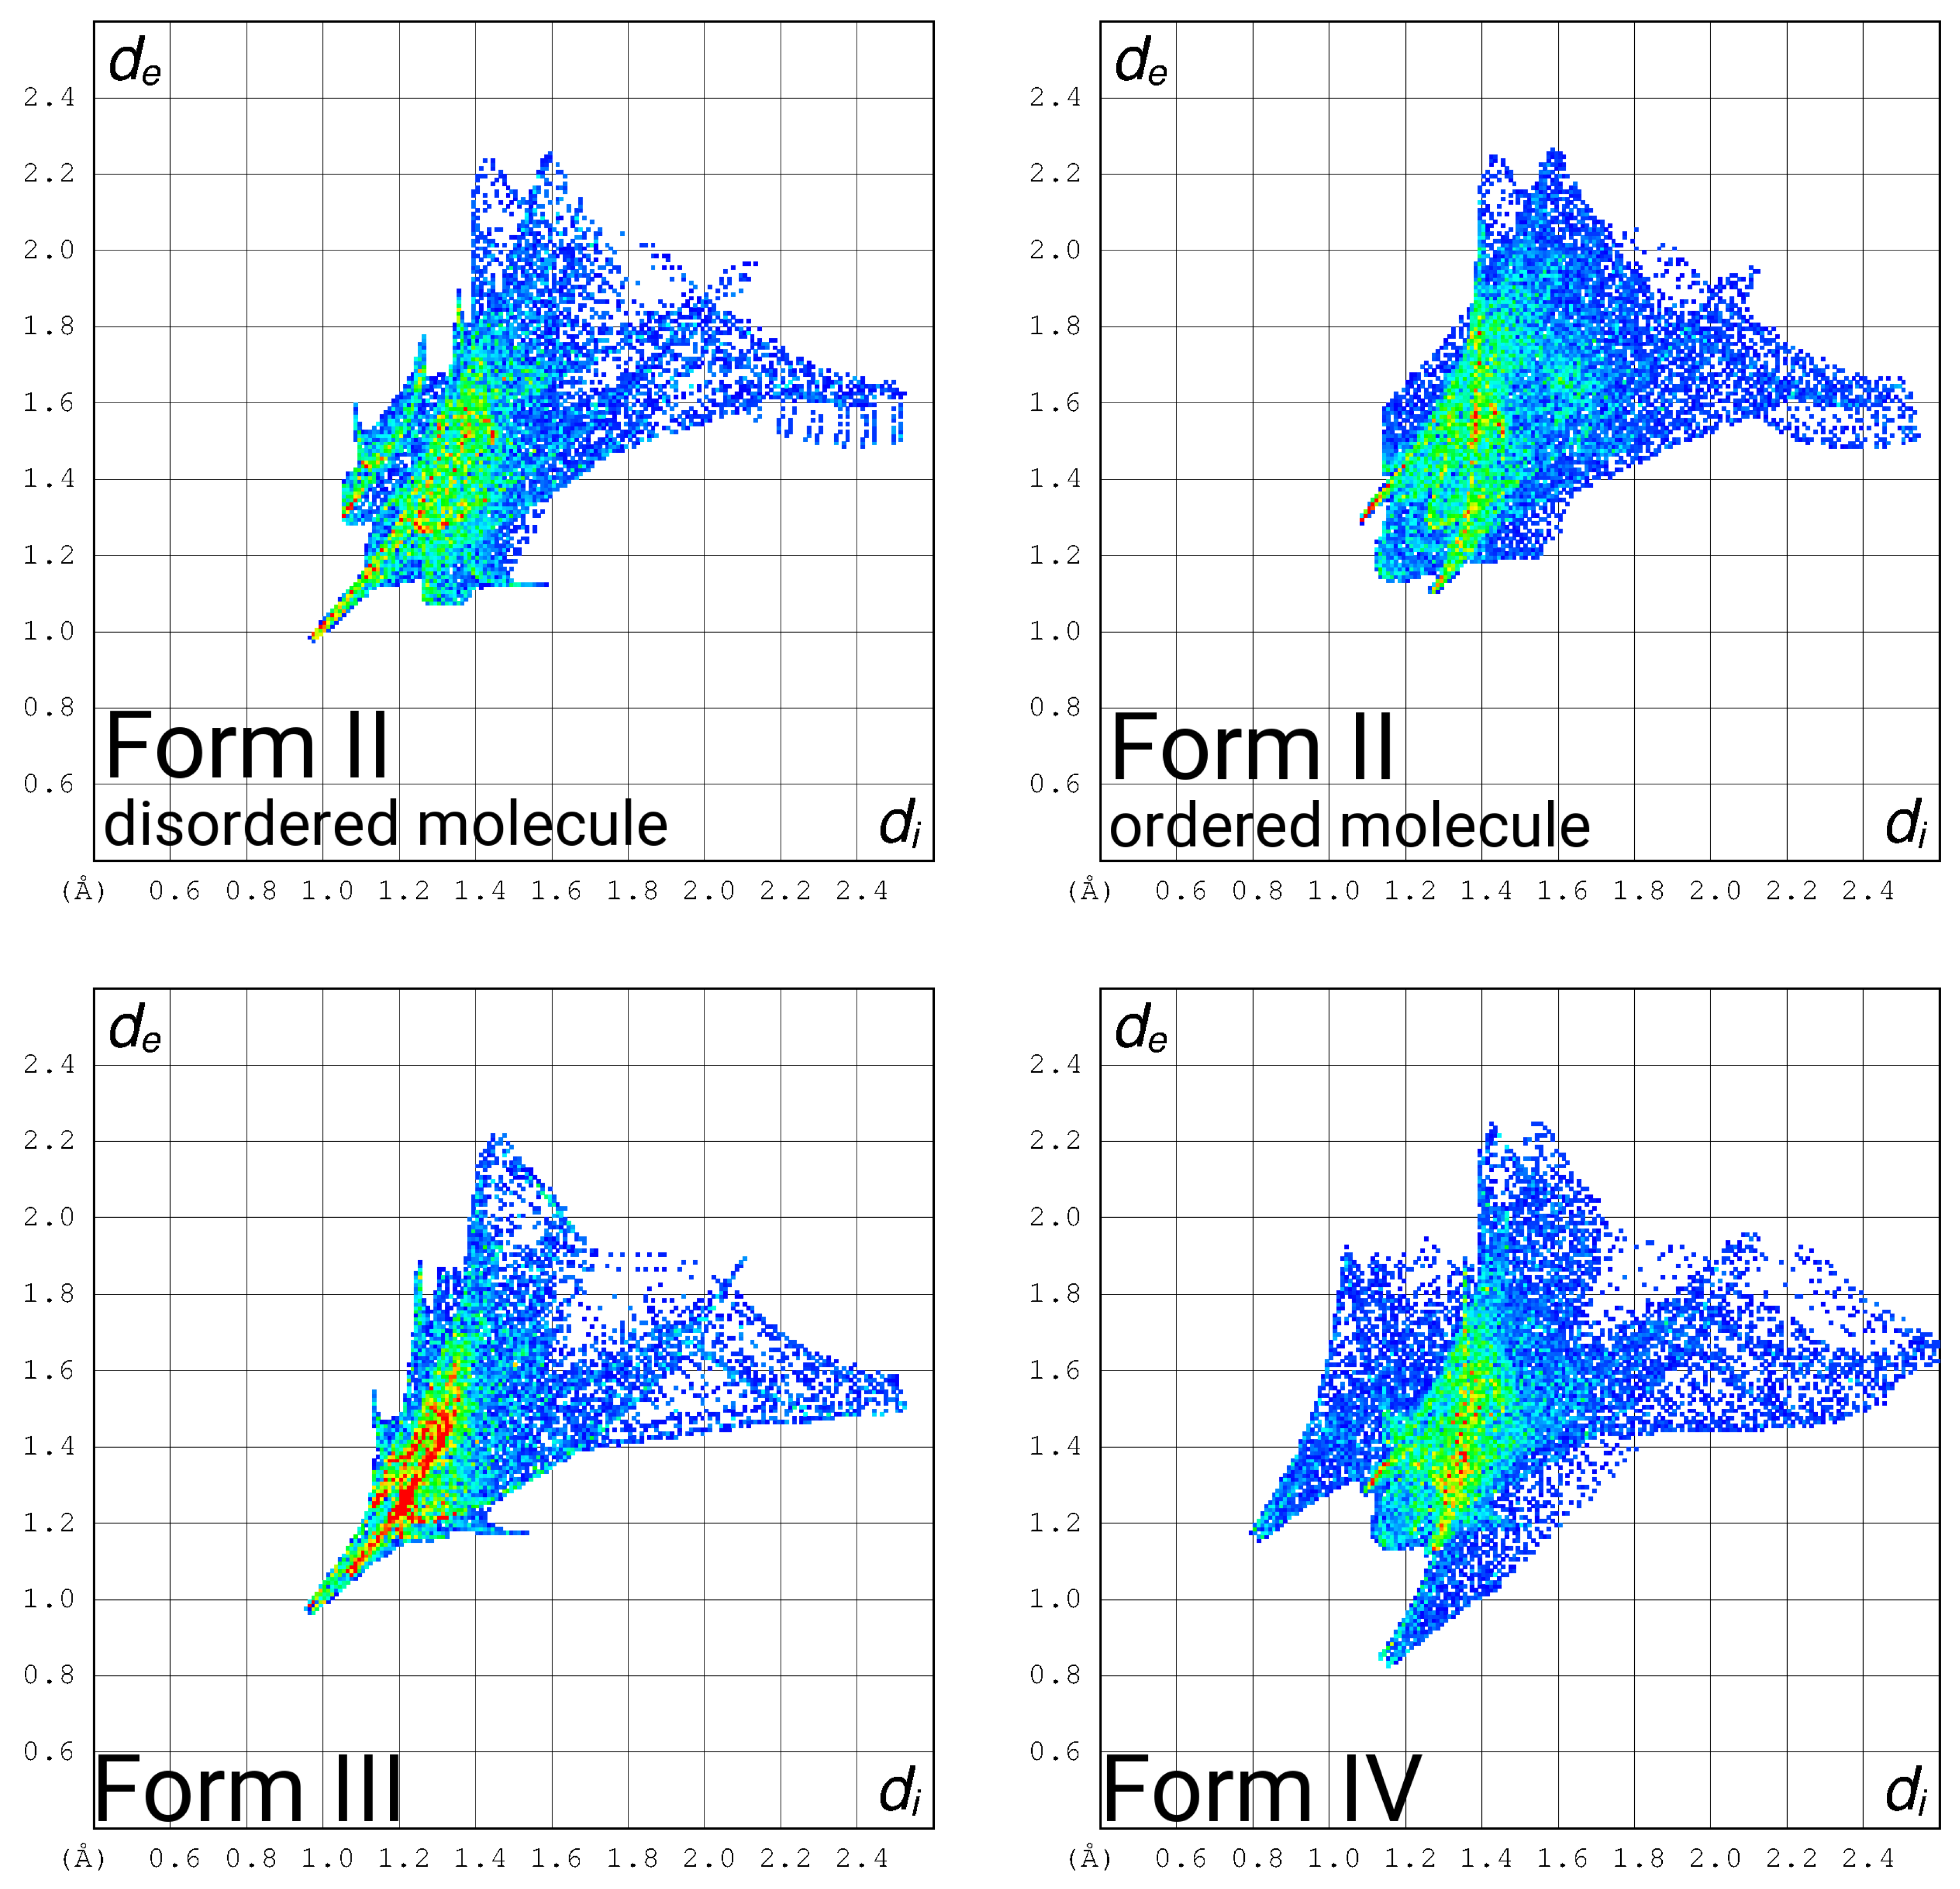
3.4. Hirshfeld Surface Fingerprint Plots

Visualizing the differences in packing is not always straight-forward and usually requires some skill. An easier and therefore more useful method for comparison of polymorphs is the use of graphical fingerprint plots derived from the corresponding Hirshfeld surfaces [26] developed by McKinnon and Spackman [27]. Both are unique for a distinct crystal structure and consequently for any polymorph, and they therefore provide a powerful tool for elucidating and comparing intermolecular interactions, as well as for spotting common features/trends in specific classes of compounds. Fingerprint plots were generated for Forms I, II, III and IV of sodium acetate. To be able to calculate comparable Hirshfeld surfaces, we had to add calculated hydrogen positions for Forms I and II since they were missing in the original CIF depositions.
The six fingerprint plots in Figure 2 show several common, but also significantly different features. For Forms III and IV, pseudo-symmetry about the diagonal arises from the close packing of the Hirshfeld surfaces, which guarantees that where surfaces touch one another, both of the points ( d i , d e ) and ( d e , d i ) are plotted on the 2D graph. For Forms I and II, where there is more than one molecule in the asymmetric unit and therefore also two plots for each of them, this pseudo-symmetry is broken. However, all plots show sharp `tails’ corresponding to Na⋯O contacts of the ionic interaction extending down to around d e + d i ≈ 2.38 Å. The single shortest-distance feature prominent in Forms II and III is due to O⋯O contacts.
For the disordered molecules in Forms I, III and IV, we have chosen to use all partial positions for creating the fingerprint plot. This way, an implicit averaging over fingerprint plots is performed, and the fingerprint is for an ensemble of molecules and not a single molecule. Due to their differences, certainty over the presence of four different polymorphs can hence be gained.

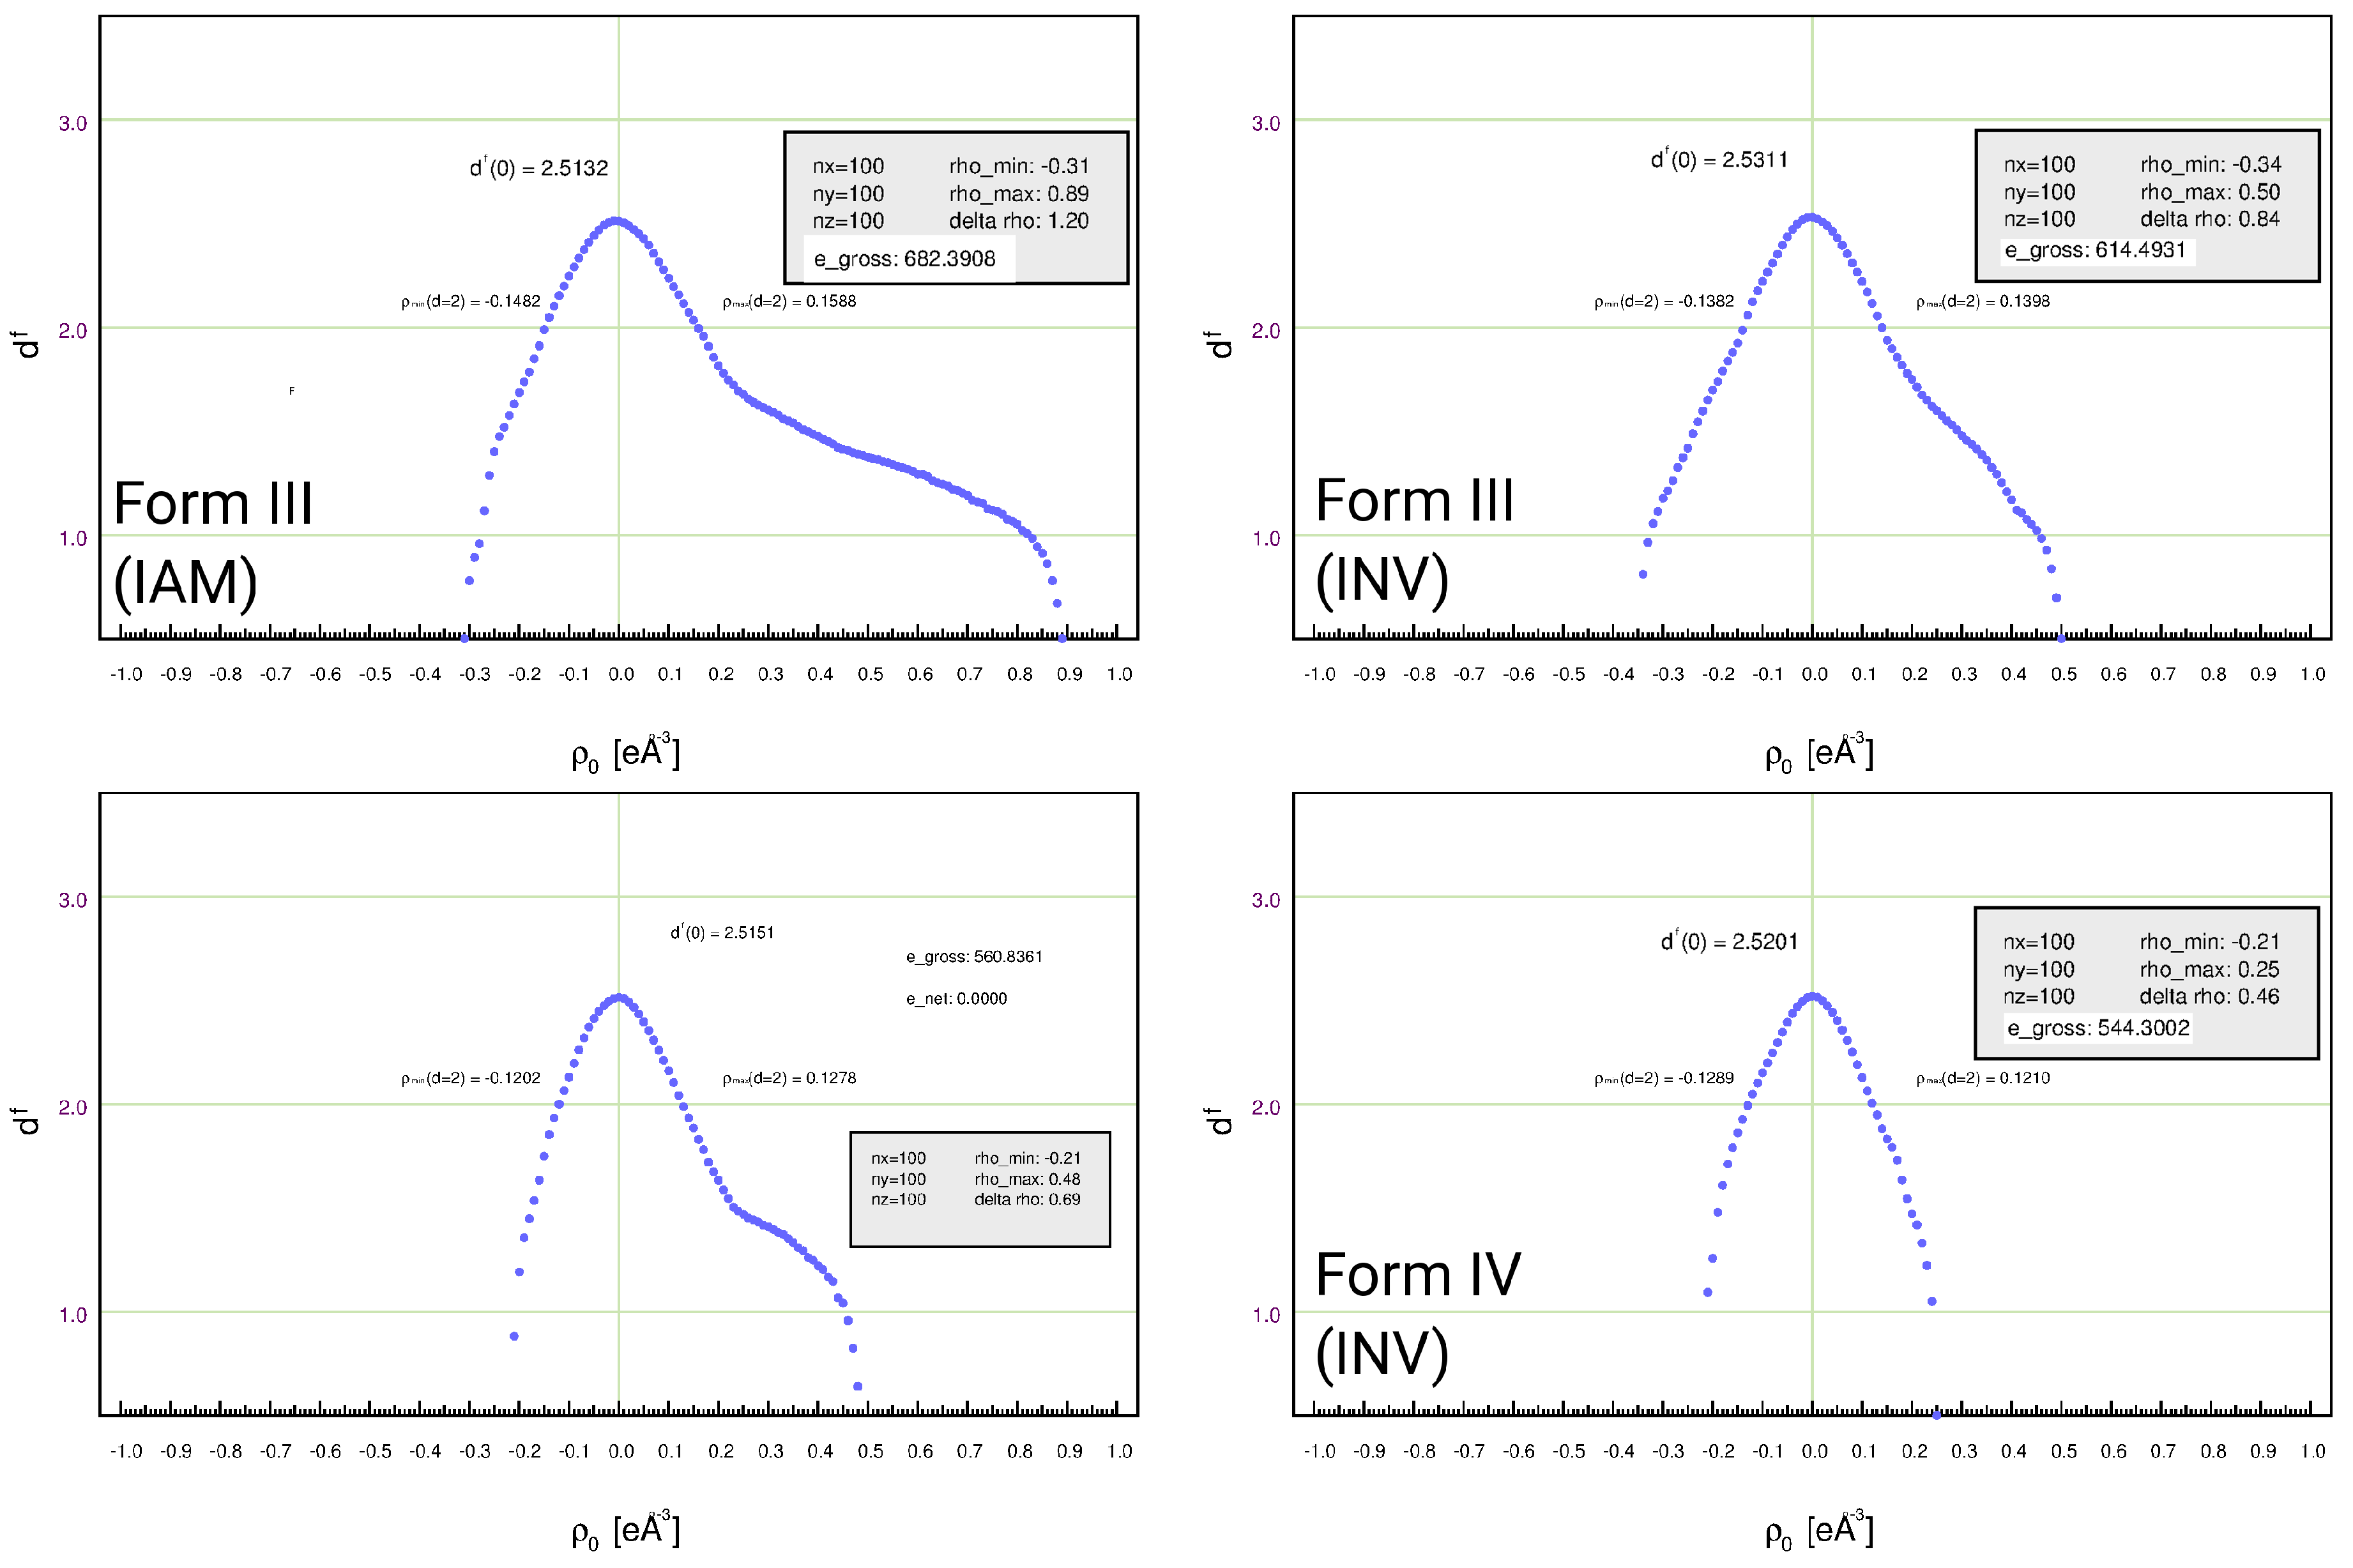
3.5. Residual-Density Analysis

The residual density (Equation (1)), i.e., the difference of the density ρ 0 ( r ) based on the phases Φ c from the invariom model, was analyzed following [29] to visually compare and quantify IAM and invariom refinement for both new Forms III and IV of sodium acetate.
ρ 0 ( r ) = 1 V H F o ( H ) F c ( H ) · e ( i Φ c H ) · e ( 2 π i H · r )
In residual density analysis, the total amount of residual density present in the unit cell (here calculated from 100 grid points in each direction) can be obtained by summation over the modulus of the individual values. The resulting gross number of residual electrons therefore is:
e g r o s s = V 2 M k = 1 M | ρ 0 ( k ) | ,
where M is the number of sets of grid points. e g r o s s quantifies the difference between model and data. In Figure 3, the 3D residual density distribution is mapped onto the 2D fractal dimension distribution function d f . For d f , the maximum value is closer to the biggest possible value of three after invariom refinement than after IAM refinement. The residual density is also more Gaussian-like and parabolic in shape and the width of the baseline, providing the range of residual-density values (flatness) Δ ρ 0 , has smaller values.
For Forms III and IV of sodium acetate, improvements in the models are mainly due to taking into account the bonding density in between the carbon atoms. The fact that e g r o s s is smaller in invariom than in IAM refinement for both forms and that the shape of d f in both INV models is more parabolic shows that the INV model is superior to the IAM.
For Form III, remaining rather high values of residual density affect the flatness even after invariom refinement, and these are due to some flexibility of the sodium position, which already becomes apparent in conventional residual density maps. They also give rise to diffuse scattering. For Form IV, we measured another dataset at 300 K, and no such features of un-modeled electron density are seen (not shown). Cooling to 100 K leads to an increase in the signal. This signal can again be associated with the sodium atom, which has more residual density in its vicinity than at 300 K. This residual density cannot be modeled with split sites and leads to shoulders in the residual-density analysis (RDA), both in the tetragonal Form III and the orthorhombic Form IV.
We conclude that combined with the classical figures of merit, the maximum and minimum residual electron density and the average Hirshfeld test, both invariom refinements are considered to both provide a better accuracy and precision.

4. Discussion

Speculations on the Causes of Supersaturation

Finally, we want to speculate on the link between molecular vibration, lattice vibration, crystallization and supersaturation. The latter is of fundamental importance for the technical suitability of phase-change materials. Hence, for a rational design of such materials, supersaturation deserves great attention. In sodium acetate, strong, predominantly ionic interactions exist within the sodium and the acetate layers, whereas only van der Waals-type interactions link the acetate layers. For solvation to the well-crystallizing trihydrate, overcoming both barriers is required, and to initiate such processes, layers need to vibrate to make space for solvent water. Hence, discrete portions of vibrational energy, the one involving in-plane and in between layers, are needed. As long as thermal motion does not provide excess energy, supersaturation can persist. Crystallization is thus a quantum phenomenon in that discrete portions of energy are required. In that sense, a phase change is also a transition between two discrete energy levels. Most compounds that show supersaturation are simple inorganic compounds, and we think that this is consistent with our hypotheses.

5. Conclusions and Outlook

In order to design a suitable PCM, ideally all individual structures of all solid state forms, its supersaturation and nucleation in solution and finally crystallization all would need to be understood. For sodium acetate, our current contribution towards this goal is accurate structural determinations that permit adding missing structural information to the phase diagram. Despite its chemical simplicity and the fact that sodium acetate has been widely studied, two new polymorphs (and a metastable form) of this phase-change material have been identified. Diffraction data to comparably high resolution were measured, and both structures were refined with aspherical scattering factors of the invariom database, thereby providing a higher accuracy and precision than conventional IAM refinements. Hirshfeld surface fingerprint plots clearly point to differences of the new and known forms. In contrast, arriving at an understanding of the structural differences by visual inspection of packing plots is usually challenging. To understand supersaturation, structural determinations will really need to be accompanied by computations of temperature-dependent energetic and entropic contributions, as well as studies of the molecule in solution. Nevertheless, the new layered structures of the anhydrate provide indications on a likely energetic penalty that needs to be overcome before the supposedly energetically favorable trihydrate can form.

Author Contributions

B.D. conceived of and designed the experiments. J.B. performed one experiment. B.D. and G.J.R. analyzed the data. P.R. contributed to the analysis. B.D. wrote the paper.

Acknowledgments

Funding within DFG Project DI921/6-1 is gratefully acknowledged.

Conflicts of Interest

The authors declare no conflict of interest.

References

  1. Zalba, B.; Marín, J.; Cabeza, L.F.; Mehling, H. Review on thermal energy storage with phase change: Materials, heat transfer analysis and applications. Appl. Therm. Eng. 2003, 23, 251–283. [Google Scholar] [CrossRef]
  2. Agyenim, F.; Hewitt, N.; Eames, P.; Smyth, M. A review of materials, heat transfer and phase change problem formulation for latent heat thermal energy storage systems (LHTESS). Renew. Sustain. Energy Rev. 2010, 14, 615–628. [Google Scholar] [CrossRef]
  3. Mohamed, S.A.; Al-Sulaiman, F.A.; Ibrahim, N.I.; Zahir, H.; Al-Ahmed, A.; Saidur, R.; Yilbas, B.S.; Sahin, A.Z. A review on current status and challenges of inorganic phase change materials for thermal energy storage systems. Renew. Sustain. Energy Rev. 2017, 70, 1072–1089. [Google Scholar] [CrossRef]
  4. Kumar, R.; Vyas, S.; Kumar, R.; Dixit, A. Development of sodium acetate trihydrate-ethylene glycol composite phase change materials with enhanced thermophysical properties for thermal comfort and therapeutic applications. Sci. Rep. 2017, 7, 5203–5214. [Google Scholar] [CrossRef] [PubMed]
  5. Hsu, L.-Y.; Nordman, C.E. Structures of two forms of sodium acetate, Na+·C2H3O2. Acta Cryst. C 1983, 39, 690–694. [Google Scholar] [CrossRef]
  6. Cameron, T.S.; Mannan, K.M.; Obaidur Rahman, M. The crystal structure of sodium acetate trihydrate. Acta Cryst. B 1976, 32, 87–90. [Google Scholar] [CrossRef]
  7. Wei, K.-T.; Ward, D.L. Sodium acetate trihydrate: A redetermination. Acta Cryst. B 1977, 33, 522–526. [Google Scholar] [CrossRef]
  8. Dittrich, B.; Hübschle, C.B.; Pröpper, K.; Dietrich, F.; Stolper, T.; Holstein, J.J. The generalized invariom database (GID). Acta Cryst. B 2013, 69, 91–104. [Google Scholar] [CrossRef] [PubMed]
  9. Coquerel, G. Crystallization of molecular systems from solution: Phase diagrams, supersaturation and other basic concepts. Chem. Soc. Rev. 2014, 43, 2286–2300. [Google Scholar] [CrossRef] [PubMed]
  10. Krause, L.; Herbst-Irmer, R.; Sheldrick, G.M.; Stalke, D. Comparison of silver and molybdenum microfocus X-ray sources for single-crystal structure determination. J. Appl. Cryst. 2015, 48, 3–10. [Google Scholar] [CrossRef] [PubMed]
  11. Blessing, R.H. An empirical correction for absorption anisotrophy. Acta Cryst. A 1995, 51, 33–38. [Google Scholar] [CrossRef]
  12. Macchi, P.; Bürgi, H.-B.; Chimpri, A.S.; Hauser, J.; Gál, Z. Low-energy contamination of Mo microsource X-ray radiation: Analysis and solution of the problem. J. Appl. Cryst. 2011, 44, 763–771. [Google Scholar] [CrossRef]
  13. Sheldrick, G.M. Shelxt-integrated space-group and crystal structure determination. Acta Cryst. A 2015, 71, 3–8. [Google Scholar] [CrossRef] [PubMed]
  14. Spek, A.L. Structure validation in chemical crystallography. Acta Cryst. D 2009, 65, 148–155. [Google Scholar] [CrossRef] [PubMed]
  15. Sheldrick, G.M. Crystal structure refinement with shelxl. Acta Cryst. C 2015, 71, 3–8. [Google Scholar] [CrossRef] [PubMed]
  16. Volkov, A.; Macchi, P.; Farrugia, L.J.; Gatti, C.; Mallinson, P.; Richter, T.; Koritsánszky, T. XD2006—A Computer Program Package for Multipole Refinement, Topological Analysis of Charge Densities and Evaluation of Intermolecular Energies from Experimental or Theoretical Structure Factors; University at Buffalo, State University of New York: New York, NY, USA, 2006. [Google Scholar]
  17. Dittrich, B.; Munshi, P.; Spackman, M.A. Re-determination and invariom model refinement of l-ornithine hydrochloride. Acta Cryst. B 2007, 63, 505–509. [Google Scholar] [CrossRef] [PubMed]
  18. Nelyubina, Y.V.; Lyssenko, K.A. Probing ionic crystals by the invariom approach: An electron density study of guanidinium chloride and carbonate. Chem. Eur. J. 2015, 21, 9733–9741. [Google Scholar] [CrossRef] [PubMed]
  19. Stewart, R.F. Electron population analysis with rigid pseudoatoms. Acta Cryst. A 1976, 32, 565–574. [Google Scholar] [CrossRef]
  20. Hansen, N.K.; Coppens, P. Testing aspherical atom refinements on small-molecule data sets. Acta Cryst. A 1978, 34, 909–921. [Google Scholar] [CrossRef]
  21. Dittrich, B.; Schürmann, C.; Hübschle, C.B. Invariom modeling of disordered structures: Case studies on a dipeptide, an amino acid, and cefaclor, a cephalosporin antibiotic. Z. Kristallogr. 2016, 231, 725–736. [Google Scholar] [CrossRef]
  22. Hübschle, C.B.; Luger, P.; Dittrich, B. Automation of invariom and of experimental charge density modelling of organic molecules with the preprocessor program invariomtool. J. Appl. Cryst. 2007, 40, 623–627. [Google Scholar] [CrossRef]
  23. Hirshfeld, F.L. Can X-ray data distinguish bonding effects from vibrational smearing? Acta Cryst. A 1976, 32, 239–244. [Google Scholar] [CrossRef]
  24. Brandenburg, K.; Berndt, M. DIAMOND—Visual Crystal Structure Information System. J. Appl. Cryst. 1999, 32, 1028–1029. [Google Scholar] [CrossRef]
  25. Hahn, T. (Ed.) International Tables for X-ray Crystallography Volume A: Space Group Symmetry, 5th ed.; Springer: Dordrecht, The Netherlands, 2005. [Google Scholar]
  26. McKinnon, J.J.; Mitchell, A.S.; Spackman, M.A. Hirshfeld surfaces: A new tool for visualising and exploring molecular crystals. Chem. Eur. J. 1998, 4, 2136–2141. [Google Scholar] [CrossRef]
  27. Spackman, M.A.; McKinnon, J.J. Fingerprinting intermolecular interactions in molecular crystals. CrystEngComm 2002, 4, 378–392. [Google Scholar] [CrossRef]
  28. Mackenzie, C.F.; Spackman, P.R.; Jayatilaka, D.; Spackman, M.A. CrystalExplorer model energies and energy frameworks: Extension to metal coordination compounds, organic salts, solvates and open-shell systems. IUCrJ 2017, 4, 575–587. [Google Scholar] [CrossRef] [PubMed]
  29. Meindl, K.; Henn, J. Foundations of residual-density analysis. Acta Cryst. A 2008, 64, 404–418. [Google Scholar] [CrossRef] [PubMed]
Figure 1. Crystal packing of all four structures as generated with diamond [24]. Form I (top left) and II (top right) show decreased ordering at higher temperature. Tetragonal Form III (smaller unit cell, bottom left) and orthorhombic Form IV are structurally rather similar; Forms II and IV differ by another layer below the visible plane that is not shown. Grey bonds represent the less occupied site in case disorder in the carboxylate group occurs.
Crystals 08 00213 g001
Figure 2. Fingerprint plots calculated from the Hirshfeld surfaces for Forms I (top, with the molecule in a special position on the right), II (middle, with the disordered molecule on the left), III and IV of sodium acetate as generated with CrystalExplorer 17 [28].
Crystals 08 00213 g002aCrystals 08 00213 g002b
Figure 3. Meindl plot [29] from residual density analysis for the IAM (left) and invariom models (right) for new tetragonal (top) and orthorhombic polymorphs (bottom) of sodium acetate.
Crystals 08 00213 g003
Table 1. Experimental, crystallographic and refinement details.
Crystal Data
Chemical formulaC 2 H 3 NaO 2
M r 82.03
Crystal systemorthorhombicorthorhombictetragonalorthorhombic
space group P c c a P c c a (more details in [5]) P 4 / n m m P c c a
Temperature (K)298 K100 K
a (Å)17.850 (15)5.951 (2)4.1560 (15)5.9136 (5)
b (Å)9.982 (7)20.213 (7)4.1560 (15)10.0457 (8)
c (Å)6.068 (4)5.902 (3)10.053 (7)5.8572 (4)
V (Å 3 )1081.2 (14)709.9 (5)173.64 (17)347.96 (4)
Z12824
Radiation typeMo K α
wavelength Å0.7107
μ (mm 1 )0.2470.237
Crystal size (mm)0.6 × 0.3 × 0.05several crystals0.12 × 0.45 × 0.54
Data Collection
Diffractometern. a.Huber Type 512 with APEX I
Absorption correctionn. a.Empirical [10]
T m i n , T m a x n. a.0.5594, 0.65070.5303, 0.6499
No. of meas. refl.1426104615,02693,856
No. of indep. refl.n. a.342840
No of obs. [ I > 2 σ ( I ) ] refl.556427306703
R i n t 0.0460.042
( sin θ / λ ) m a x 1 )0.880.83
Refinement
H-atom treatmentH-atoms not present in CIF x , y , z -parameters constr. and U i s o refined
No. of reflections556427306703
IAM
R 1 ( F ) , w R ( F 2 ) , S0.0610, n. a., n. a.0.0740, n. a., n. a.0.0322, 0.0887, 2.02880.0304, 0.0849, 1.6601
Δ ρ m a x , Δ ρ m i n (e Å 3 )n. a.0.867, −0.3070.453, −0.198
Invariom
R 1 ( F ) , w R ( F 2 ) , Sn. a.0.0270, 0.0777, 1.77520.287, 0.0811, 1.5854
Δ ρ m a x , Δ ρ m i n (e Å 3 )n. a.0.482,−0.3400.227, −0.193
Table 2. Details of invariom refinement [8].
Atom NameInvariom AssignedLocal-Atomic Site SymmetryModel Compound
NaNanoneSodium cation
O(3)O1.5c[1.5o1c]macetic acid anion
C(1)C1.5o1.5o1cmacetic acid anion
C(2)C1c1h1h1h 3 m ethane
H(2A,B,C)H1c[1c1h1h]6ethane
Table 3. Figures of merit for the independent atom model (IAM) and the Invariom model (new Forms III and IV).
Form IForm IIForm IIIForm IV
IAMIAMInvariomIAMInvariomIAM
R(F)6.10%7.40%2.70%3.22%2.87%3.04%
wR(F)4.35%4.91%4.26%4.49%
S1.782.031.591.66
No. of parameters1731
H-atom positionsnot presentconstrained to parent site
H-atom displacements U i s o refined
Average DMSDA11.5 × 10 4 Å 2 13.5 × 10 4 Å 2 4.5 × 10 4 Å 2 9.5 × 10 4 Å 2

