High-Pressure, High-Temperature Behavior of Silicon Carbide: A Review


Department of Geology & Geophysics, Yale University, New Haven, CT 06511, USA
*
Author to whom correspondence should be addressed.
Crystals 2018, 8(5), 217; https://doi.org/10.3390/cryst8050217
Submission received: 26 April 2018
/
Revised: 10 May 2018
/
Accepted: 11 May 2018
/
Published: 16 May 2018
(This article belongs to the Special Issue High-Pressure Studies of Crystalline Materials)
Abstract
:The high-pressure behavior of silicon carbide (SiC), a hard, semi-conducting material commonly known for its many polytypic structures and refractory nature, has increasingly become the subject of current research. Through work done both experimentally and computationally, many interesting aspects of high-pressure SiC have been measured and explored. Considerable work has been done to measure the effect of pressure on the vibrational and material properties of SiC. Additionally, the transition from the low-pressure zinc-blende B3 structure to the high-pressure rocksalt B1 structure has been measured by several groups in both the diamond-anvil cell and shock communities and predicted in numerous computational studies. Finally, high-temperature studies have explored the thermal equation of state and thermal expansion of SiC, as well as the high-pressure and high-temperature melting behavior. From high-pressure phase transitions, phonon behavior, and melting characteristics, our increased knowledge of SiC is improving our understanding of its industrial uses, as well as opening up its application to other fields such as the Earth sciences.
1. Introduction
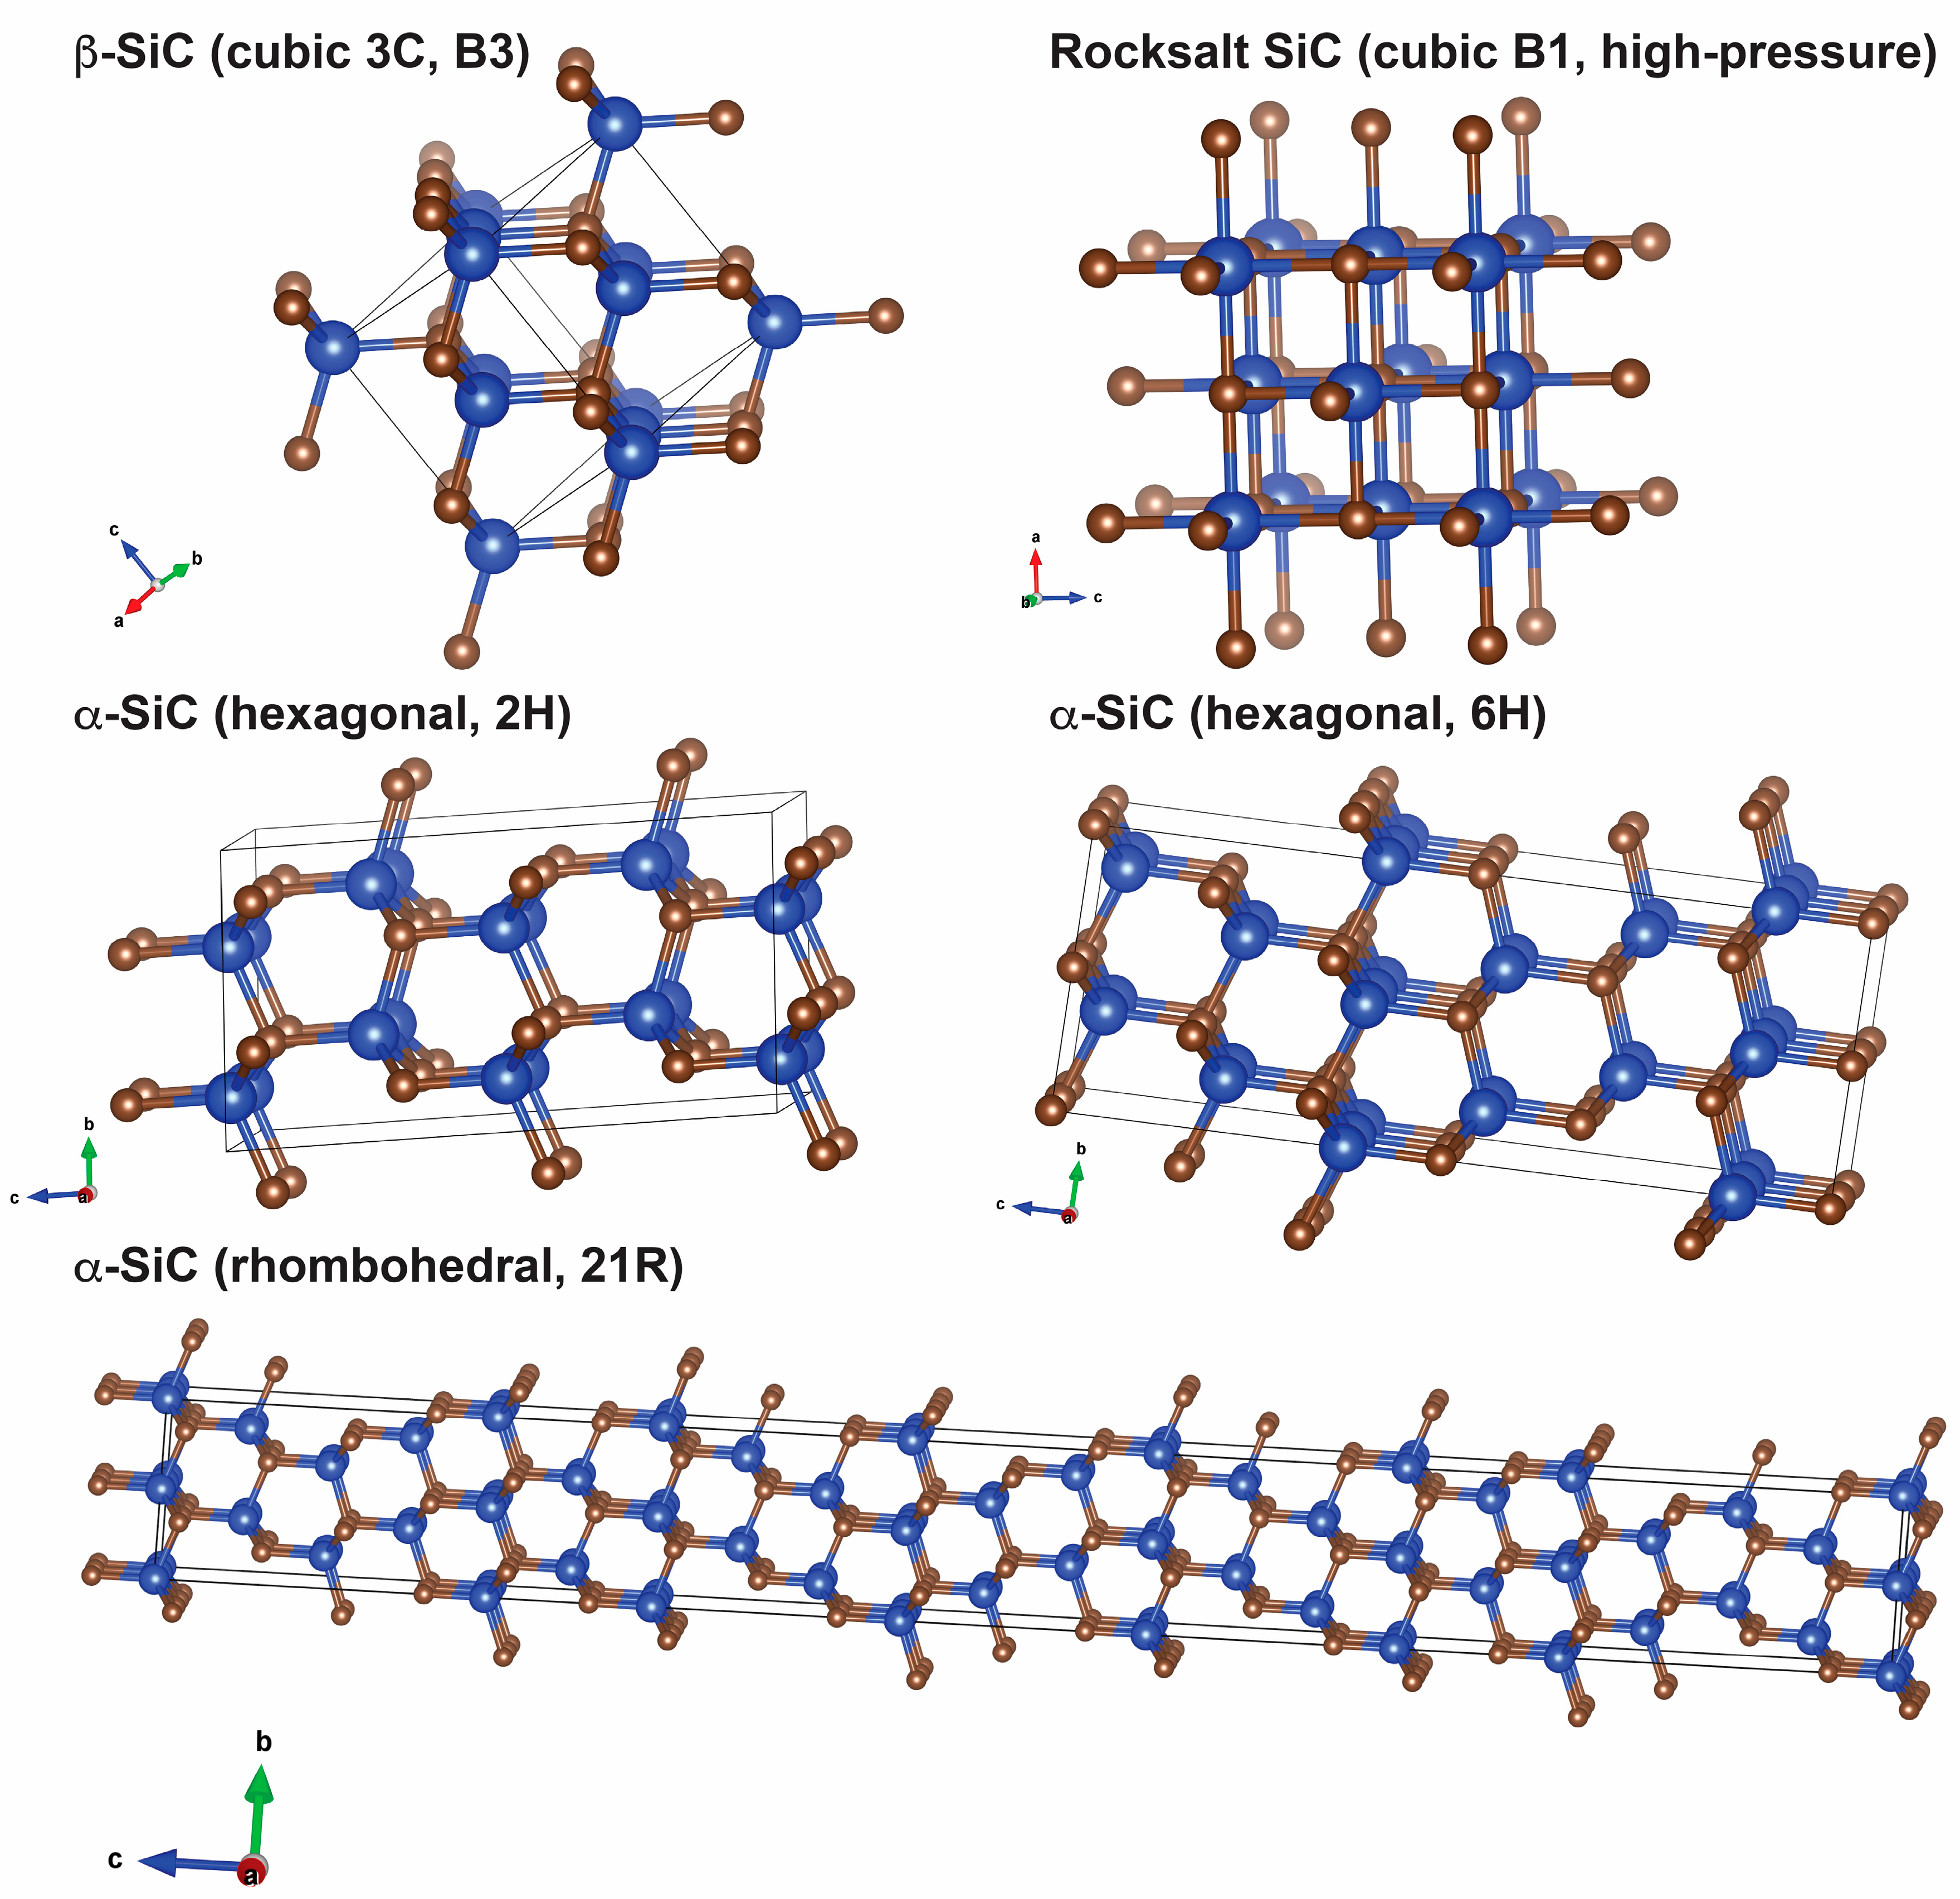
A hard and refractory semi-conductor, silicon carbide (SiC) is both a useful industrial material as well as an interesting component of naturally occurring systems. Known for its many polytypic structures appearing at ambient conditions, SiC is composed of stacked Si4C (or SiC4) tetrahedra and is found in cubic, hexagonal or rhombohedral forms depending on the stacking sequence [1]. The most well studied and/or naturally occurring structures are the zinc-blende (B3), also known as the 3C polytype, and the hexagonal wurtzite structured 6H polytype. The cubic structure is also known as beta (β) SiC while the hexagonal and rhombohedral structures are all classified under the umbrella term alpha (α) SiC [1]. Although not exhaustive, the range of typical SiC polytype structures is depicted in Figure 1.
The effect of high pressure on the crystal structure, material properties and melting characteristics of SiC has been an active area of research for many years. In addition to better understanding the industrial uses of SiC, such work has also allowed a better understanding of SiC in a planetary context. Known under the mineral name moissanite [7], SiC has been found in small amounts in many geologic settings on Earth [8], as well as in meteorites and other astronomical bodies [9]. It was recently proposed that star systems more carbon-rich than the Solar System may harbor entire planets composed of significant quantities of SiC [10,11]. This review aims to summarize and discuss aspects of high-pressure work on SiC that aids in our understanding of both its industrial uses as well as its place in the natural world.
We begin with a discussion of the high-pressure structure of SiC, including the stability of different polytypes. Following, we present a discussion of the large body of work on the high-pressure phase transition in SiC, including observations and predictions of the transition conditions, predicted intermediate structures and transition mechanisms, as well as the kinetics across the transition. We then discuss proposed alternative stoichiometries at pressure. Work on the vibrational modes of SiC at pressure, as well as absorption measurements, and both measurements and computations of the equation of state (EOS) parameters and elastic constants are discussed in the following section. We end with a discussion of thermal expansivity and the thermal equation of state, as well as a discussion of high-pressure and high-temperature (high P-T) melting and decomposition. We find that thermodynamic equilibrium is often difficult to attain in high P-T experiments on SiC, meaning that time-dependent kinetic effects and hysteresis are often observed across phase transitions and melting reactions. The observed sluggish kinetics of SiC can explain many of the discrepant findings between studies.
2. High-Pressure Crystal Structure
Over 250 polytypes of SiC have been observed at ambient conditions [12]. Much work has been done to understand the formation of specific polytypes at ambient pressure and high temperature and to understand the transformation conditions and mechanisms between polytypes (i.e., [13]). As the structure of SiC may have an impact on material properties, identifying the stable structure at pressure is necessary to improve our understanding of SiC in high-pressure contexts, such as in dynamic applications or in planetary interiors. Several experiments have been performed exclusively on determining stable polytype structures at pressure [14,15,16]. It was found in [14] that the 3C cubic phase was stable at lower temperatures but became more stable with increased pressure, while the 6H phase was preferred at high temperatures (2300–2800 K), at least at pressures of 6.5 GPa and below. These findings were supported by observations in [17] at pressures below 3 GPa. The phase boundary marking the transition to 6H likely crosses the melting/decomposition line at high pressures [18,19], however, implying that 3C may be the more stable solid phase at higher-pressure conditions.
Shock studies on both α-SiC and β-SiC compare the proportion of polytypes present in samples after being shocked to P-T conditions of 5–25 GPa and 600–1500 K [16]. They find that in α-SiC, 6H begins to transform to 15R and a small amount of 3C after shock experiments as indicated by X-ray diffraction of recovered samples. β-SiC also transforms to rhombohedral structures (21R, 33R) during shock again based on X-ray diffraction after shock. This preference for rhombohedral polytypes at high P-T may be due to the effect of the shear stresses from the passing shockwave, however, rather than an indication that 15R, 21R or 33R are the equilibrium stable phases at pressure. The shockfront is associated with a reduction in particle size as well as potentially changing the stacking sequence of the Si-C layers, resulting in the formation of rhombohedral polytypes. Shock studies to higher pressures of over 100 GPa with in situ X-ray diffraction do not see a transition to rhombohedral structures but instead find a transition to the high-pressure rocksalt structure over 100 GPa [20]. These findings support previous shock work on 6H SiC [21] that infers a transition to the rocksalt structure from a density change in the sample.
Upon consideration of all the high P-T studies on 3C, 6H, and 15R, a consistent phase boundary marking transitions between polytypes is not agreed upon. This indicates that their relative enthalpy is perhaps small or that their transformation kinetics are slow. Impurities may also play a role in the expressed polytypes as has been observed in ambient pressure experiments [13]. In reported static experiments at high-pressures the starting polytype structure remains throughout pressure loading and unloading [22,23], at least up to the conditions of the transition to the rocksalt structure [20,24,25]. See Figure 2 for a compilation of experimental data on the stability of common polytypes at pressure. In addition to polytype transformations and the high-pressure transition to the rocksalt structure, other structural transitions have also been found in SiC, such as the transition to a high-density amorphous phase under large plastic shear and high pressure [26].
2.1. Transition to the Rocksalt Structure
The most well studied aspect of high pressure SiC is the transition from the cubic 3C (zinc-blende, B3) structure to the cubic rocksalt (B1) structure, with additional work considering the transition from the hexagonal 6H polytype to the rocksalt structure. Computational and experimental work has made significant progress in identifying the transition conditions, the intermediate structures and the mechanism of the transition in both cases. Such research has additionally illuminated the slow kinetics and hysteresis of the transition.
The transition from a four-fold coordinated zinc-blende structure to a six-fold coordinated rocksalt structure at high pressure occurs in many semi-conductors i.e., [29]. It was first predicted for the 3C-SiC system by [30] and first observed experimentally by [25] during room temperature compression of SiC in a static diamond-anvil cell (DAC). Since these early results, many computational studies have worked to better understand the transition conditions [31,32,33,34,35,36,37,38] and several experimental studies have further observed the transition using both laser-heated diamond-anvil cells (LHDAC) and shockwave experiments [20,21,24,27,28,39,40].
Calculations also predict the transition to the rocksalt structure from the 6H polytype as well [33,36,41]. Experimentally, this transition has been observed in shock studies at pressures of ~105 GPa [21]. Calculations find that the 2H and 4H polytypes also transform to the rocksalt structure at high pressures [33,42] although no experimental work has been done on the transition in these polytypes to date.
A hallmark feature in the transition to the rocksalt structure is the large unit cell volume drop, or density increase, across the transition. Both experimental and computational work indicates that the volume of SiC drops between 15% and 20% across the transition. Such a large density increase has implications for the role of SiC deep in planetary interiors as has been discussed by several studies [24,27,43]. A compilation of the transition parameters from computations and experiments is presented in Table 1, while a summary of the P-T transition conditions, with a focus on experimental work, can be found in Figure 3.
2.2. Intermediate Structures
In addition to identifying the transition conditions, work has been done to understand the mechanism of the transition to the high-pressure structure, particularly to identify the intermediate structures that come about during the transition from the four-fold coordinated structure to the six-fold coordinated structure. Experimental work has not identified an intermediate structure across the transition. This is perhaps not surprising as the intermediate structures are likely very transient, with computations indicating that the transition to the rocksalt structure occurs in 0.1 ps [46]. Despite the large amount of work however, the transitional structure still remains controversial.
In early first-principle calculations it was proposed that SiC passes through a rhombohedral R3m transition state with one formula unit per primitive unit cell [33,47]. Molecular dynamics (MD) simulations using a new interatomic potential model in [45] found that the MD cell changes from cubic to monoclinic (rather than rhombohedral) during the transition at 100 GPa, and is accompanied by the Si and C sublattices shifting relative to each other along the [100] direction in the zinc-blende structure. The following year it was proposed that the intermediate state actually has orthorhombic Pmm2 symmetry with two formula units per cell [31]. These least-enthalpy calculations used a periodic linear-combination-of-atomic-orbitals scheme with a transition pressure of 92 GPa. It was found by [31] that this orthorhombic transition pathway has a much lower activation energy than the original R3m state. The Pmm2 symmetry of the orthorhombic pathway was questioned in an active comment thread by [48,49] and it was instead proposed that the transition structure has an Imm2 symmetry. The Imm2 structure was later confirmed by the original author [50], although the results of the study were not affected by favoring the higher symmetry Imm2 structure over the Pmm2 structure. It was also suggested that the orthorhombic structure is body-centered rather than primitive [48], in contrast with the original study [51].
The orthorhombic transition pathway was seen to have the least enthalpy barrier by [52] along with seven other structures with low enthalpy barriers that could represent the transition state. Their computations were performed with density functional theory (DFT) using both the local density and generalized gradient approximations (LDA, GGA) in addition to spin polarization [53]. They propose a bilayer sliding mechanism of the [111] planes such that the bonding evolves from tetrahedral to octahedral without breaking any of the bonds. Such a mechanism is consistent with each of the lowest enthalpy barrier structures in their study.
This orthorhombic transition pathway was found to be very close to a generalized monoclinic pathway by [36], which was found to be a unified path for any tetrahedrally bonded SiC polytype to transition to the rocksalt structure. In a later work, it was suggested that this pathway would also hold true for the transition to a rocksalt structure in other similarly structured semiconductors regardless of the chemical components [29]. This transition state was proposed to be a unified path for all semi-conductors going from the zinc-blende to the rocksalt structure at high-pressure.
More recently, several studies have found that the transition pathway follows a tetragonal and an orthorhombic [32] path at very high transition pressures of 600 GPa. After further consideration it was found that the transition path follows a tetragonal and then a monoclinic intermediate state by [38] at 101 GPa and that the transition pressure could change the favored transition pathway, particularly in studies with over-applied pressure [46].
The disparate findings from the previous studies can be explained as follows. The various computational techniques likely contribute to the conflicting results. As discussed in [46], they could also be partly due to the differing transition pressures at which the zinc-blende to rocksalt transition occurs between studies. It is possible that different transition pathways stabilize at different pressure conditions. As will be discussed in the next section, there appears to be a strong kinetic barrier across the transition, meaning that a single transition pressure is difficult to agree on both experimentally and computationally. It is possible that several transition pathways could occur in nature or in experiment depending on the conditions and how close to or far from equilibrium the system is.
2.3. Transition Kinetics
One emerging result of the work on the transition to the rocksalt structure is the variability in the observed transition conditions both in computational, but particularly in the experimental studies (as can be seen in Table 1, Figure 3). The transition to the rocksalt structure has been observed at a range of pressures and temperatures from as low as 62 GPa at ~1750 K to as high as 100 GPa at room temperature [24,25,27]. Such a steep Clapeyron slope is not expected for the transition however, as the volume change is large (~17–18%) but the entropy change is likely small across this solid-solid transition [24,54]. Calculations performed in [24] based on the method proposed in [54] indicate that the Clapeyron slope is very nearly flat at equilibrium transition conditions. The steep experimental phase boundary as well as the offsets between different experimental results can be explained if there is a large kinetic barrier across the transition. This is particularly evident when comparing static diamond-anvil cell work with shock wave data. Even though shock wave experiments generate heat, the time scale of the experiment is so short that the transition to rocksalt occurs at higher pressures than in heated diamond-anvil cell studies (e.g., [21]).
Recent computational work considers the hysteresis across the B3 to B1 (zinc-blende to rocksalt) transition, finding that the equilibrium transition pressure is at 65.9 GPa but that a large enthalpy barrier is present [44]. This work uses a martensitic approach with an intermediate Imm2 structure. The enthalpy barrier can be surmounted by over pressurizing SiC, as seen in room temperature static data [25] or by heating the sample as seen in laser-heated diamond-anvil cell studies [24,27]. This barrier also explains the hysteresis upon decompression in which rocksalt SiC has been seen to remain until ~35–40 GPa after which it transitions back to zinc-blende or B3 SiC [24,25,27]. The slow kinetics is perhaps not surprising as transitions in pure carbon are also quite slow, such as that of cold compressed graphite to M-carbon [55,56,57] or of metastable diamond to graphite. It does mean, however, that we must be aware of the experimental conditions at which high-pressure SiC is studied due to the difficulty in achieving equilibrium conditions.
2.4. Beyond Equimolar Compositions
At ambient pressure, 1:1 SiC is the only stable stoichiometry in the Si-C system with enrichments of Si or C remaining in their elemental form. Computations exploring the possibilities of other structures, such as Si2C or SiC2, find that these structures are all unstable relative to SiC, though may be formed metastably [58]. Other stoichiometries have also been explored computationally for monolayer 2D Si-C structures [59]. The Si-C system has been considered at pressure in both experimental and computational work. Laser-heated diamond-anvil cell experiments coupled with in situ synchrotron X-ray diffraction find that both Si- and C-rich compositions form SiC with the enrichment coming out in its elemental form up to pressures of 200 GPa and temperatures of 3500 K [28]. This indicates that alternative stoichiometries, such as Si2C or SiC2, are not stable at the experimental conditions considered [28]. It has been proposed however, that such stoichiometries become stable at much higher pressures than those accessible by current experiments [43]. It was found by [43] through a random structure search algorithm that SiC + Si forms I4/mcm structured Si2C at pressures over 13 Mbar and that SiC + C forms Cmmm structured SiC2 at pressures over 23 Mbar. Experimental confirmation of such findings is not easily achieved, though such high-pressure SiC may be applicable to the interior structure and composition of very large carbon-rich exoplanets [43].
3. High-Pressure Spectroscopy and Equations of State
3.1. High-Pressure Vibrational Spectroscopy
Raman spectroscopic measurements have improved our understanding of the lattice structure of SiC. At pressure, detailed Raman measurements have been performed on the 3C, 6H and 15R polytypes.
The first Raman measurements of SiC at pressure were performed nearly 50 years ago by [60], where the shift of the longitudinal optical (LO) and transverse optical (TO) phonon modes were measured on single crystal zinc-blende 3C-SiC. At ambient pressure, the LO mode was measured at 971 cm−1 and the TO mode was found at 795 cm−1. Both modes were seen to shift with pressures up to ~1 GPa, with the LO mode shifting linearly to higher wave numbers and the TO mode shifting non-linearly to higher wave numbers [60]. Similar measurements on 3C were subsequently explored in many experimental studies, covering a pressure range up to 80 GPa [22,61,62,63,64,65,66]. Several observations have come from these Raman measurements. One is that the splitting between the LO and TO modes increases with pressure. This implies that the transverse effective charge is also increasing, indicating that it is quite sensitive to the electronic structure [64]. The pressure dependence of the LO and TO bands in 3C-SiC based on DAC studies is summarized in Figure 4a. The agreement between studies at lower pressures is exceptional. The two studies reaching higher pressures find a slightly different pressure dependence for the phonons [22,66], though the increased LO-TO splitting is still robust. Second order phonons are reported in [63], although the modes were not all identified. The modes labeled in Figure 4a indicate their interpretation [63].
Pressure dependence of the Raman phonons in 6H-SiC was measured by [67] up to ~10 GPa in a diamond-anvil cell. Five optical modes (LO, TO1, TO2, axial and planar modes) as well as four acoustic phonon modes were measured. While the optical modes and one acoustic mode all shifted linearly to higher wavenumbers with pressure, three of the measured acoustic modes showed no response to increased lattice compression. This is unexpected based on most tetrahedrally coordinated semi-conductors [68]. The mode-Grüneisen parameters were calculated for each mode with only one, the planar acoustic mode (x = 1), having a slightly negative γ, indicating a softening of that mode with pressure. This is again counter to findings of other similar semi-conductors [67]. Raman measurements of 6H-SiC were extended to 50 GPa [22] where fifteen fundamental bands were observed. It was again observed that the transverse acoustic (TA) modes were anomalously pressure-independent while the LO, TO and longitudinal acoustic (LA) modes have a strong positive pressure dependence. Raman measurements of 15R-SiC were also carried out to 35 GPa by [22] where eighteen bands were observed. The behavior of the LO, TO, LA, and TA modes are similar to the 6H polytypes. Work on 6H-SiC to even higher pressures of 95 GPa measured by [69] observes that the splitting between the LO and TO modes increases rapidly below 60 GPa but then flattens out at higher pressures. Based on their measurements, the transverse effective charge is seen to decrease at high pressures indicating an increasing covalent bonding. It is also seen that both the LO and TO mode show an anomalous decrease potentially due to the high-pressure phase transition. High-pressure IR measurements on 6H SiC were also carried out to 53 GPa where the LO and TO modes were measured and compared to the Raman data [70]. The shift in the LO and TO modes agree well with the Raman measurements and are shown as symbols on the plot in Figure 4b.
The pressure dependence of Raman linewidths in 3C-SiC have been explored in several studies. It was found by [63] that the linewidths of the first-order optical phonons increased dramatically at ~10 GPa. This increase was inferred to indicate a corresponding increase in the decay rates of the phonons with pressure. Raman linewidths was subsequently explored in several other works. It was observed experimentally that the linewidths remained constant with pressures up to 20 GPa [71] and up to ~15 GPa [65]. This result was consistent with ab initio computations [65] and it was proposed that the broadening observed in [63] was due to non-isotropic stress from the freezing of their alcohol pressure medium rather than from an increased phonon decay rate. Based on the results in [65], in which helium was used as a pressure medium for hydrostatic conditions, pressure appears to have little effect on the Raman linewidths of SiC, at least up to pressures of ~15–20 GPa.
3.2. High-Pressure Absorption
Absorption measurements of SiC particles, particularly in the infrared (IR) wavelengths, are essential for understanding the spectrum of carbon-stars where SiC is ubiquitous [74,75]. Detailed IR measurements at ambient pressure are necessary in order to interpret the stellar spectra of such stars. These IR absorption measurements indicate that there is an absorption feature in SiC at around 11.3 μm [76] which is also present in carbon stars [74,75]. At pressure, the absorption properties of SiC have been measured in reference to the use of moissanite anvils in high-pressure experiments [70]. Measurements on moissanite single crystals have been carried out up to 53 GPa, while absorption measurements have been performed up to 43 GPa on powdered SiC. It was observed that pressure did not significantly change the transmission properties of the moissanite anvils. Additionally, transmission through the anvils was up to an order of magnitude higher than through type II diamonds across a wavenumber range of 1900–2600 cm−1, aside from the absorption feature in moissanite at 2300 cm−1 [70]. This range corresponds to the strong second order phonon absorption in diamond, and suggests that moissanite anvils may provide a solution to measuring absorption spectra across these wavenumbers in materials at high pressure [70]. The concentration of impurities in SiC may change the absorption over this region, however [70] did not observe differences in absorption between different moissanite anvils, in contrast to diamonds which can vary drastically depending on type [77]. These observations open up applications of moissanite anvils for high-pressure absorption measurements on materials.
Absorption measurements on additional polytypes of pure SiC at pressure are limited. Measurements on doped n-type 3C-SiC up to 14 GPa in a diamond-anvil cell were performed by [78] in which the pressure dependence of the luminescence spectra was investigated. Four luminescence lines were measured, all of which moved to higher wavenumbers with pressure [78]. To our knowledge, no studies have been carried out to higher pressure on pure 3C-SiC nor have they been made on the other polytypes.
The pressure dependence on the band gap of SiC has also been considered in several studies. The first experimental work measured the movement of the absorption edge of 3C-SiC [78] and found that the band gap had a very small pressure derivative of −1.9 MeV/GPa. The experimental data was later reanalyzed and found to be more consistent with a value of −3.4 MeV/GPa, consistent with computations finding −3.3 MeV/GPa [79]. High-pressure and low-temperature experiments were conducted on nitrogen-doped 6H- and 4H-SiC where positive pressure dependence was observed. The pressure dependence of the indirect gap in these cases was found to be 2.0 MeV/GPa for N doped 6H-SiC at 29 K and pressures up to 5 GPa [80], and 2.7 MeV/GPa for N doped 4H-SiC at 7 K and pressures up to 5 GPa [81].
3.3. High-Pressure Elasticity and Equation of State
SiC is known to be a hard and strong material [82]. The elastic properties and equation of state of SiC have been explored comprehensively at pressure both experimentally and computationally. The equation of state (EOS) has been found experimentally through X-ray diffraction, ultrasonic measurements, or Brillouin scattering by [25,66,83,84,85] and computationally through several techniques by [86,87,88,89]. SiC has been found to have a large room-pressure bulk modulus K0 greater than 200 GPa with pressure derivative K0′ around 4. Table 2 compiles the experimental EOS data for each polytype of SiC that has been studied in the literature.
In addition to the EOS parameters, work has been performed on the pressure dependence of the elastic constants of SiC. Brillouin and Raman spectroscopy on the 3C polytypes done by [66] finds that the C11 and C12 constants increase by over 50% across the pressure range of 0 to 65 GPa (399 GPa increase to 672 GPa and 133 GPa increase to 339 GPa respectively). The C44 constant also increases, although much less dramatically and seeming to follow a second-order polynomial fit (251 increase to 316 GPa over the same pressure range). The pressure dependence of several of the elastic constants of the 6H polytype were predicted by first principles DFT calculations using LDA potentials [87]. A similar pressure dependence trend holds for the C11 and C44 constants, although the predicted value of C11 is a little higher than that measured for 3C while the predicted values of C12 and C44 are a little lower.
3.4. Thermal Expansion and Equation of State
The combined effect of pressure and temperature on SiC has been the subject of several recent studies with a focus on the thermal expansion of both the 3C- and 6H-SiC polytypes. At ambient pressure the thermal expansion of SiC, particularly of 3C-SiC, has been extensively studied due to its importance in material applications. The thermal expansion has consistently been reported to be between 4 × 10⁻⁶ 1/K and 6 × 10⁻⁶ 1/K based on both X-ray diffraction and dilatometer measurements [93,94,95,96,97,98,99]. X-ray diffraction measurements taken over a temperature range of 300–1300 degrees K find that a second order polynomial better fits the thermal expansion giving a value of ~3.2 × 10⁻⁶ 1/K at ~300 K and a larger value of 5.1 × 10⁻⁶ 1/K at ~1300 K [100].
Determination of the thermal EOS of SiC and the thermal expansion at pressure has recently been carried out. Both DFT calculations and large volume press experiments coupled with in situ X-ray diffraction at conditions up to 8.1 GPa and 1100 K were performed by [91] to determine thermal EOS parameters. Fitting their diffraction data to a modified Birch–Murnaghan EOS gives a value of α = 5.77 × 10⁻⁶ + 1.36 × 10⁻⁸ T. Their DFT results give a similar thermal expansion, with a value of α = 5.91 × 10⁻⁶ + 1.08 × 10⁻⁸ T using LDA and α = 6.99 × 10⁻⁶ + 1.11 × 10⁻⁸ T using GGA. The values from each method seem to agree well, both with each other as well as with previous ambient pressure data. They find that the thermal expansion decreases with pressure and find the pressure derivative through two different methods. The modified Birch–Murnaghan EOS gives a pressure derivative of −6.53 × 10⁻⁷ GPa−1 K−1, while a thermal pressure approach gives a slightly lower value of −7.23 × 10⁻⁷ GPa−1 K−1.
Only one study to date has explored the thermal expansion of SiC at even higher pressures. A recent study [23] used the LHDAC coupled with in situ X-ray diffraction to measure the thermal expansion of both the 3C- and 6H-SiC polytypes [23]. Their measurements spanned a range of conditions up to 80 GPa and 1900 K for 3C-SiC, and up to 65 GPa and 1920 K for 6H-SiC. They determined pressure by a gold standard loaded in their sample chamber and considered three different gold EOS’s [101,102,103] when calculating the thermal expansion from their measurements. Several interesting findings are presented, including a higher thermal expansion for SiC than previous measurements, although this is likely due to the high temperatures of their study. The thermal expansion found in [23] is on the order of 1 × 10⁻⁵ 1/K at 2500 K, nearly an order of magnitude higher than previous studies at room temperature. They also find that the thermal expansion changes very little with pressure. Based on the gold scale in [102] they find that the thermal expansion of SiC is nearly constant over the entire pressure range considered. The gold scale by [101] gives a decrease in the thermal expansion with pressure, though the change is still less than a factor of two. Further studies on the effect of pressure on the thermal expansion of SiC are needed to better understand these observations.
4. Melting Behavior and Decomposition
SiC is known to be a very refractory material with a high ambient pressure melting point [19]. Rather than melting congruently (i.e., solid SiC melting to liquid SiC), SiC has been observed to melt incongruently at ambient pressure with the Si fraction coming out as a liquid and the C fraction remaining as a solid [19]. The ambient pressure decomposition of SiC into solid C plus liquid Si begins at ~2840 K in experiments [19] but is predicted to occur at higher temperatures of 3100 K in computations [104,105]. Prior to recent diamond-anvil cell work up to ~80 GPa [18], explorations of high-pressure melting and decomposition have gone up to ~10 GPa while heating to temperatures as high as 3500 K [17,106,107,108,109,110]. Although confusion has arisen as to the nature of SiC melting at lower pressures, higher pressure studies indicate that 3C-SiC continues to decompose at high temperature, at least up to the transition to the rocksalt structure at ~60 GPa.
Many earlier studies have observed decomposition of SiC to Si + C at low pressure. SiC was seen to decompose up to 8 GPa based on quench texture and composition [110], although the temperature of the decomposition was not directly measured. Similar results were found in [17,106] in a high-pressure high-temperature cell at 3 GPa without a direct temperature measurement, though the power-temperature relation indicated that the sample was above 2800 K. Incongruent melting was also observed in [109] up to ~10 GPa. Decomposition was identified through a change in the resistivity of the sample as well as through Si and C diffraction signals upon quench. Temperature of decomposition was determined based on the inserted energy and it was found that SiC decomposed following a positive phase boundary. Based on the increase in the solubility of C in liquid Si with increasing pressure, however, [109] predicts that decomposition does not continue past about ~10 GPa, after which SiC melts congruently.
In contrast to these works, congruent melting was inferred by several studies over the same pressure-temperature conditions. Sokolov et al., 2012 [108] performed experiments in a high-temperature, high-pressure apparatus at 5 and 7.7 GPa, in which they identified melting of SiC by a change in the microstructure of recovered samples or by a jump in the electrical resistivity of the sample. They additionally performed X-ray diffraction measurements but did not see evidence of decomposition. Based on their experiments SiC melts congruently following a negative phase boundary. Congruent melting at pressure was also previously seen in [107].
Recent diamond-anvil cell work [18] finds that 3C-SiC continues to decompose at high pressures and high temperatures, following a phase boundary with a negative slope. The high-pressure decomposition temperatures measured are considerably lower than the decomposition temperature at ambient, with the measurements indicating that SiC begins to decompose at ~2000 K at 60 GPa as compared to ~2800 K at ambient pressure. Once 3C-SiC had transitioned to the high-pressure rocksalt structure, decomposition was no longer observed, despite heating to temperatures in excess of ~3200 K. Several methods were used to identify in situ decomposition in samples as temperature increased, including the appearance of diamond peaks in X-ray diffraction as well as changes in the optical character of the sample. Additionally, recovered samples were cross-sectioned and analyzed for composition, confirming the presence of SiC decomposition products. Raman measurements across decomposed regions indicated the presence of carbon, whereas measurements across un-decomposed regions did not. Kinetics appears to be a strong influence on the decomposition reaction as well, since complete decomposition was not observed on the timescale of the experiments (on the order of minutes) and the reaction was not observed to be reversible. Once the products of decomposition were observed, they remained in the sample both upon temperature/pressure quench and upon heating to temperatures below the observed decomposition onset boundary.
The temperature of decomposition and the nature of the decomposition phase boundary appear to be strongly influenced by the pressure-induced phase transitions to higher density structures in SiC, silicon and carbon, as is discussed further in [18]. However, additional work is necessary to understand the melting characteristics of the rocksalt structure at pressures above 60 GPa. Figure 5 summarizes the high P-T phase diagram of SiC to date including the data on melting and/or decomposition from each previous study. Above the transition to the B1 structure, it is still unclear whether or not SiC decomposes at high temperatures or melts congruently, as indicated by the arrow in the top right corner of the plot. As these measurements have not been performed, the temperatures required for melting may be much higher than those represented on the current phase diagram.
5. Conclusions
High-pressure work on SiC has opened up many new questions as well as answering those discussed here. The issue of kinetics continues to reappear in high-pressure studies of SiC, whether it is on the transition between polytypes or in the melting behavior. Metastable states and the time scales needed to achieve equilibrium at high P-T conditions are topics that are not yet well understood but which may have important implications for industrial and naturally occurring SiC. More high-P-T studies above 10 GPa are certainly needed to confirm and expand upon thermal expansion and thermal equation of state measurements, as well as to explore decomposition/melting in other polytypes or in the B1 rocksalt structure.
Acknowledgments
We acknowledge support from the Carnegie DOE Alliance Center (CDAC) as well as from the NASA Connecticut Space Grant Consortium (CTSGC) Graduate Research Fellowship grant number P-1127.
Conflicts of Interest
The authors declare no conflicts of interest.
References
- Shaffer, P. A review of the structure of silicon carbide. Acta Crystallogr. Sect. B Struct. Crystallogr. Cryst. Chem. 1969, 25, 477–488. [Google Scholar] [CrossRef]
- Momma, K.; Izumi, F. VESTA 3 for three-dimensional visualization of crystal, volumetric and morphology data. J. Appl. Crystallogr. 2011, 44, 1272–1276. [Google Scholar] [CrossRef]
- Braekken, H. Zur Kristallstruktur des kubischen Karborunds. Zeitschrift für Kristallographie 1930, 75, 572–573. [Google Scholar]
- Wyckoff, R. Interscience Publishers, New York, New York rocksalt structure. Cryst. Struct. 1963, 1, 85–237. [Google Scholar]
- Capitani, G.C.; Di Pierro, S.; Tempesta, G. The 6H-SiC structure model: Further refinement from SCXRD data from a terrestrial moissanite. Am. Mineral. 2007, 92, 403–407. [Google Scholar] [CrossRef]
- Ramsdell, L.S. The crystal structure of α-SiC, type 4. Am. Mineral. 1944, 29, 431–442. [Google Scholar]
- Moissan, H. Nouvelles recherches sur la météorité de Cañon Diablo. C. R. 1904, 139, 773–786. [Google Scholar]
- Lyakhovich, V. Origin of accessory moissanite. Int. Geol. Rev. 1980, 22, 961–970. [Google Scholar] [CrossRef]
- Amari, S.; Lewis, R.S.; Anders, E. Interstellar grains in meteorites: I. Isolation of SiC, graphite and diamond; size distributions of SiC and graphite. Geochim. Cosmochim. Acta 1994, 58, 459–470. [Google Scholar] [CrossRef]
- Kuchner, M.J.; Seager, S. Extrasolar carbon planets. arXiv, 2005; arXiv:astro-ph/0504214. [Google Scholar]
- Madhusudhan, N.; Lee, K.K.M.; Mousis, O. A possible carbon-rich interior in Super-Earth 55 Cancri e. Astrophys. J. Lett. 2012, 759, L40. [Google Scholar] [CrossRef]
- Fisher, G.; Barnes, P. Towards a unified view of polytypism in silicon carbide. Philos. Mag. B 1990, 61, 217–236. [Google Scholar] [CrossRef]
- Jepps, N.; Page, T. Polytypic transformations in silicon carbide. Prog. Cryst. Growth Charact. 1983, 7, 259–307. [Google Scholar] [CrossRef]
- Whitney, E.; Shaffer, P. Investigation of the Phase Transformation between α-and β-Silicon Carbide at High Pressures. High Temp. High Press. 1969, 1, 107–110. [Google Scholar]
- Sugiyama, S.; Togaya, M. Phase Relationship between 3C-and 6H-Silicon Carbide at High Pressure and High Temperature. J. Am. Ceram. Soc. 2001, 84, 3013–3016. [Google Scholar] [CrossRef]
- Zhu, Y.; Sekine, T.; Kobayashi, T.; Takazawa, E. Shock-induced phase transitions among SiC polytypes. J. Mater. Sci. 1998, 33, 5883–5890. [Google Scholar] [CrossRef]
- Bhaumik, S. Synthesis and sintering of monolithic and composite ceramics under high pressures and high temperatures. Metals Mater. Process. 2000, 12, 215–232. [Google Scholar]
- Daviau, K.; Lee, K.K.M. Decomposition of silicon carbide at high pressures and temperatures. Phys. Rev. B 2017, 96, 174102. [Google Scholar] [CrossRef]
- Dolloff, R. Research Study to Determine the Phase Equilibrium Relations of Selected Metal Carbides at High Temperatures; Period Covered January 1959–March 1960; WADD-TR-60-143; Union Carbide Corp. Parma Research Lab.: Parma, OH, USA, 1960. [Google Scholar]
- Tracy, S.J.; Smith, R.F.; Wicks, J.K.; Fratanduono, D.E.; Gleason, A.E.; Bolme, C.; Speziale, S.; Appel, K.; Prakapenka, V.B.; Fernandez Panella, A.; et al. High-pressure phase transition in silicon carbide under shock loading using ultrafast X-ray diffraction. In Proceedings of the AGU Fall Meeting, New Orleans, LA, USA, 11–15 December 2017. [Google Scholar]
- Sekine, T.; Kobayashi, T. Shock compression of 6H polytype SiC to 160 GPa. Phys. Rev. B 1997, 55, 8034. [Google Scholar] [CrossRef]
- Aleksandrov, I.; Goncharov, A.; Yakovenko, E.; Stishov, S. High pressure study of diamond, graphite and related materials. High Press. Res. Appl. Earth Planet. Sci. 1992, 409–416. [Google Scholar]
- Nisr, C.; Meng, Y.; MacDowell, A.; Yan, J.; Prakapenka, V.; Shim, S.H. Thermal expansion of SiC at high pressure-temperature and implications for thermal convection in the deep interiors of carbide exoplanets. J. Geophys. Res. Planets 2017, 122, 124–133. [Google Scholar] [CrossRef]
- Daviau, K.; Lee, K.K.M. Zinc-blende to rocksalt transition in SiC in a laser-heated diamond-anvil cell. Phys. Rev. B 2017, 95, 134108. [Google Scholar] [CrossRef]
- Yoshida, M.; Onodera, A.; Ueno, M.; Takemura, K.; Shimomura, O. Pressure-induced phase transition in SiC. Phys. Rev. B 1993, 48, 10587. [Google Scholar] [CrossRef]
- Levitas, V.I.; Ma, Y.; Selvi, E.; Wu, J.; Patten, J.A. High-density amorphous phase of silicon carbide obtained under large plastic shear and high pressure. Phys. Rev. B 2012, 85, 054114. [Google Scholar] [CrossRef]
- Kidokoro, Y.; Umemoto, K.; Hirose, K.; Ohishi, Y. Phase transition in SiC from zinc-blende to rock-salt structure and implications for carbon-rich extrasolar planets. Am. Mineral. 2017, 102, 2230–2234. [Google Scholar] [CrossRef]
- Miozzi Ferrini, F.; Morard, G.; Antonangeli, D.; Clark, A.N.; Edmund, E.; Fiquet, G.; Mezouar, M. On the Interior of Carbon-Rich Exoplanets: New Insight from SiC System at Ultra High Pressure. In Proceedings of the AGU Fall Meeting, New Orleans, LA, USA, 11–15 December 2017. [Google Scholar]
- Miao, M.; Lambrecht, W.R. Universal transition state for high-pressure zinc blende to rocksalt phase transitions. Phys. Rev. Lett. 2005, 94, 225501. [Google Scholar] [CrossRef] [PubMed]
- Chang, K.J.; Cohen, M.L. Ab initio pseudopotential study of structural and high-pressure properties of SiC. Phys. Rev. B 1987, 35, 8196. [Google Scholar] [CrossRef]
- Catti, M. Orthorhombic intermediate state in the zinc blende to rocksalt transformation path of SiC at high pressure. Phys. Rev. Lett. 2001, 87, 035504. [Google Scholar] [CrossRef] [PubMed]
- Durandurdu, M. Pressure-induced phase transition of SiC. J. Phys. Condens. Matter 2004, 16, 4411. [Google Scholar] [CrossRef]
- Karch, K.; Bechstedt, F.; Pavone, P.; Strauch, D. Pressure-dependent properties of SiC polytypes. Phys. Rev. B 1996, 53, 13400. [Google Scholar] [CrossRef]
- Lee, W.; Yao, X. First principle investigation of phase transition and thermodynamic properties of SiC. Comput. Mater. Sci. 2015, 106, 76–82. [Google Scholar] [CrossRef]
- Lu, Y.-P.; He, D.-W.; Zhu, J.; Yang, X.-D. First-principles study of pressure-induced phase transition in silicon carbide. Phys. B Condens. Matter 2008, 403, 3543–3546. [Google Scholar] [CrossRef]
- Miao, M.S.; Lambrecht, W.R.L. Unified path for high-pressure transitions of SiC polytypes to the rocksalt structure. Phys. Rev. B 2003, 68, 092103. [Google Scholar] [CrossRef]
- Wang, C.-Z.; Yu, R.; Krakauer, H. Pressure dependence of Born effective charges, dielectric constant, and lattice dynamics in SiC. Phys. Rev. B 1996, 53, 5430. [Google Scholar] [CrossRef]
- Xiao, H.; Gao, F.; Zu, X.T.; Weber, W.J. Ab initio molecular dynamics simulation of a pressure induced zinc blende to rocksalt phase transition in SiC. J. Phys. Condens. Matter 2009, 21, 245801. [Google Scholar] [CrossRef] [PubMed]
- Gust, W.; Holt, A.; Royce, E. Dynamic yield, compressional, and elastic parameters for several lightweight intermetallic compounds. J. Appl. Phys. 1973, 44, 550–560. [Google Scholar] [CrossRef]
- Vogler, T.; Reinhart, W.; Chhabildas, L.; Dandekar, D. Hugoniot and strength behavior of silicon carbide. J. Appl. Phys. 2006, 99, 023512. [Google Scholar] [CrossRef]
- Eker, S.; Durandurdu, M. Phase transformation of 6H-SiC at high pressure: An ab initio constant-pressure study. EPL (Europhys. Lett.) 2008, 84, 26003. [Google Scholar] [CrossRef]
- Eker, S.; Durandurdu, M. Pressure-induced phase transformation of 4H-SiC: An ab initio constant-pressure study. EPL (Europhys. Lett.) 2009, 87, 36001. [Google Scholar] [CrossRef]
- Wilson, H.F.; Militzer, B. Interior phase transformations and mass-radius relationships of silicon-carbon planets. Astrophys. J. 2014, 793, 34. [Google Scholar] [CrossRef]
- Salvadó, M.A.; Franco, R.; Pertierra, P.; Ouahrani, T.; Recio, J. Hysteresis and bonding reconstruction in the pressure-induced B3–B1 phase transition of 3C-SiC. Phys. Chem. Chem. Phys. 2017, 19, 22887–22894. [Google Scholar] [CrossRef] [PubMed]
- Shimojo, F.; Ebbsjö, I.; Kalia, R.K.; Nakano, A.; Rino, J.P.; Vashishta, P. Molecular dynamics simulation of structural transformation in silicon carbide under pressure. Phys. Rev. Lett. 2000, 84, 3338. [Google Scholar] [CrossRef] [PubMed]
- Xiao, H.; Gao, F.; Wang, L.M.; Zu, X.T.; Zhang, Y.; Weber, W.J. Structural phase transitions in high-pressure wurtzite to rocksalt phase in GaN and SiC. Appl. Phys. Lett. 2008, 92, 241909. [Google Scholar] [CrossRef]
- Blanco, M.A.; Recio, J.; Costales, A.; Pandey, R. Transition path for the B3⇌B1 phase transformation in semiconductors. Phys. Rev. B 2000, 62, R10599. [Google Scholar] [CrossRef]
- Perez-Mato, J.; Aroyo, M.; Capillas, C.; Blaha, P.; Schwarz, K. Comment on “Orthorhombic Intermediate State in the Zinc Blende to Rocksalt Transformation Path of SiC at High Pressure”. Phys. Rev. Lett. 2003, 90, 049603. [Google Scholar] [CrossRef] [PubMed]
- Miao, M.; Prikhodko, M.; Lambrecht, W.R. Comment on “orthorhombic intermediate state in the zinc blende to rocksalt transformation path of SiC at high pressure”. Phys. Rev. Lett. 2002, 88, 189601. [Google Scholar] [CrossRef] [PubMed]
- Catti, M. Cattie Replies. Phys. Rev. Lett. 2003, 90, 049604. [Google Scholar] [CrossRef]
- Catti, M. Catti Replies. Phys. Rev. Lett. 2002, 88, 189602. [Google Scholar] [CrossRef]
- Hatch, D.M.; Stokes, H.T.; Dong, J.; Gunter, J.; Wang, H.; Lewis, J.P. Bilayer sliding mechanism for the zinc-blende to rocksalt transition in SiC. Phys. Rev. B 2005, 71, 184109. [Google Scholar] [CrossRef]
- Lewis, J.P.; Glaesemann, K.R.; Voth, G.A.; Fritsch, J.; Demkov, A.A.; Ortega, J.; Sankey, O.F. Further developments in the local-orbital density-functional-theory tight-binding method. Phys. Rev. B 2001, 64, 195103. [Google Scholar] [CrossRef]
- Li, X.; Jeanloz, R. Measurement of the B1-B2 transition pressure in NaCl at high temperatures. Phys. Rev. B 1987, 36, 474–479. [Google Scholar] [CrossRef]
- Wang, Y.; Lee, K. From soft to superhard: Fifty years of experiments on cold-compressed graphite. J. Superhard Mater. 2012, 34, 360–370. [Google Scholar] [CrossRef]
- Wang, Y.; Panzik, J.E.; Kiefer, B.; Lee, K.K. Crystal structure of graphite under room-temperature compression and decompression. Sci. Rep. 2012, 2, 520. [Google Scholar] [CrossRef] [PubMed]
- Montgomery, J.M.; Kiefer, B.; Lee, K.K. Determining the high-pressure phase transition in highly-ordered pyrolitic graphite with time-dependent electrical resistance measurements. J. Appl. Phys. 2011, 110, 043725. [Google Scholar] [CrossRef]
- Gao, G.; Ashcroft, N.W.; Hoffmann, R. The unusual and the expected in the Si/C phase diagram. J. Am. Chem. Soc. 2013, 135, 11651–11656. [Google Scholar] [CrossRef] [PubMed]
- Li, P.; Zhou, R.; Zeng, X.C. The search for the most stable structures of silicon–carbon monolayer compounds. Nanoscale 2014, 6, 11685–11691. [Google Scholar] [CrossRef] [PubMed]
- Mitra, S.; Brafman, O.; Daniels, W.; Crawford, R. Pressure-induced phonon frequency shifts measured by Raman scattering. Phys. Rev. 1969, 186, 942. [Google Scholar] [CrossRef]
- Aleksandrov, I.; Goncharov, A.; Jakovenko, E.; Sttshov, S. High pressure study of cubic BN and SIC (Raman scattering and EDS). High Press. Sci. Technol. 1990, 5, 938–940. [Google Scholar] [CrossRef]
- Debernardi, A.; Ulrich, C.; Syassen, K.; Cardona, M. Raman linewidths of optical phonons in 3C-SiC under pressure: First-principles calculations and experimental results. Phys. Rev. B 1999, 59, 6774. [Google Scholar] [CrossRef]
- Olego, D.; Cardona, M. Pressure dependence of Raman phonons of Ge and 3C-SiC. Phys. Rev. B 1982, 25, 1151. [Google Scholar] [CrossRef]
- Olego, D.; Cardona, M.; Vogl, P. Pressure dependence of the optical phonons and transverse effective charge in 3C-SiC. Phys. Rev. B 1982, 25, 3878. [Google Scholar] [CrossRef]
- Ulrich, C.; Debernardi, A.; Anastassakis, E.; Syassen, K.; Cardona, M. Raman linewidths of phonons in Si, Ge, and SiC under pressure. Phys. Status Solidi B 1999, 211, 293–300. [Google Scholar] [CrossRef]
- Zhuravlev, K.K.; Goncharov, A.F.; Tkachev, S.N.; Dera, P.; Prakapenka, V.B. Vibrational, elastic, and structural properties of cubic silicon carbide under pressure up to 75 GPa: Implication for a primary pressure scale. J. Appl. Phys. 2013, 113, 113503–113512. [Google Scholar] [CrossRef]
- Salvador, G.; Sherman, W. Pressure dependence of the Raman phonon spectrum in 6h-silicon carbide. J. Mol. Struct. 1991, 247, 373–384. [Google Scholar] [CrossRef]
- Weinstein, B.A.; Zallen, R. Pressure-Raman effects in covalent and molecular solids. In Light Scattering in Solids IV; Springer: Berlin/Heidelberg, Germany, 1984; pp. 463–527. [Google Scholar]
- Liu, J.; Vohra, Y.K. Raman modes of 6 h polytype of silicon carbide to ultrahigh pressures: A comparison with silicon and diamond. Phys. Rev. Lett. 1994, 72, 4105. [Google Scholar] [CrossRef] [PubMed]
- Liu, Z.; Xu, J.; Scott, H.P.; Williams, Q.; Mao, H.-K.; Hemley, R.J. Moissanite (SiC) as windows and anvils for high-pressure infrared spectroscopy. Rev. Sci. Instrum. 2004, 75, 5026–5029. [Google Scholar] [CrossRef]
- Kobayashi, M.; Akimoto, R.; Endo, S.; Yamanaka, M.; Shinohara, M.; Ikoma, K. Amorphous and Crystalline Silicon Carbide III. In Springer Proceedings in Physics; Springer: Berlin, Germany, 1992; Volume 56, p. 263. [Google Scholar]
- Feldman, D.; Parker, J.H., Jr.; Choyke, W.; Patrick, L. Phonon Dispersion Curves by Raman Scattering in SiC, Polytypes 3C, 4H, 6H, 15R, and 21R. Phys. Rev. 1968, 173, 787. [Google Scholar] [CrossRef]
- Feldman, D.; Parker, J.H., Jr.; Choyke, W.; Patrick, L. Raman Scattering in 6H SiC. Phys. Rev. 1968, 170, 698. [Google Scholar] [CrossRef]
- Hackwell, J. Long wavelength spectrometry and photometry of M, S and C-stars. Astron. Astrophys. 1972, 21, 239–248. [Google Scholar]
- Treffers, R.; Cohen, M. High-resolution spectra of cool stars in the 10-and 20-micron regions. Astrophys. J. 1974, 188, 545–552. [Google Scholar] [CrossRef]
- Mutschke, H.; Andersen, A.; Clément, D.; Henning, T.; Peiter, G. Infrared properties of SiC particles. Astron. Astrophys. 1999, 345, 187–202. [Google Scholar]
- Walker, J. Optical absorption and luminescence in diamond. Rep. Prog. Phys. 1979, 42, 1605. [Google Scholar] [CrossRef]
- Kobayashi, M.; Yamanaka, M.; Shinohara, M. High-Pressure Studies of Absorption and Luminescence Spectra in 3C-SiC. J. Phys. Soc. Jpn. 1989, 58, 2673–2676. [Google Scholar] [CrossRef]
- Cheong, B.; Chang, K.; Cohen, M.L. Pressure dependences of band gaps and optical-phonon frequency in cubic SiC. Phys. Rev. B 1991, 44, 1053. [Google Scholar] [CrossRef]
- Engelbrecht, F.; Zeman, J.; Wellenhofer, G.; Peppermüller, C.; Helbig, R.; Martinez, G.; Rössler, U. Pressure Dependence of the Electronic Band Gap in 6H-Sic. Phys. Status Solidi B 1996, 198, 81–86. [Google Scholar] [CrossRef]
- Zeman, J.; Engelbrecht, F.; Wellenhofer, G.; Peppermüller, C.; Helbig, R.; Martinez, G.; Rössler, U. Pressure Dependence of the Band Gap of 4H-SiC. Phys. Status Solidi B 1999, 211, 69–72. [Google Scholar] [CrossRef]
- Harris, G.L. Properties of Silicon Carbide; IET: London, UK, 1995. [Google Scholar]
- Amulele, G.M.; Manghnani, M.H.; Li, B.; Errandonea, D.J.H.; Somayazulu, M.; Meng, Y. High pressure ultrasonic and X-ray studies on monolithic SiC composite. J. Appl. Phys. 2004, 95, 1806–1810. [Google Scholar] [CrossRef]
- Bassett, W.; Weathers, M.; Wu, T.C.; Holmquist, T. Compressibility of SiC up to 68.4 GPa. J. Appl. Phys. 1993, 74, 3824–3826. [Google Scholar] [CrossRef]
- Strössner, K.; Cardona, M.; Choyke, W. High pressure X-ray investigations on 3C-SiC. Solid State Commun. 1987, 63, 113–114. [Google Scholar] [CrossRef]
- Prikhodko, M.; Miao, M.; Lambrecht, W.R. Pressure dependence of sound velocities in 3C-SiC and their relation to the high-pressure phase transition. Phys. Rev. B 2002, 66, 125201. [Google Scholar] [CrossRef]
- Sarasamak, K.; Limpijumnong, S.; Lambrecht, W.R. Pressure-dependent elastic constants and sound velocities of wurtzite SiC, GaN, InN, ZnO, and CdSe, and their relation to the high-pressure phase transition: A first-principles study. Phys. Rev. B 2010, 82, 035201. [Google Scholar] [CrossRef]
- Tang, M.; Yip, S. Atomistic simulation of thermomechanical properties of β-SiC. Phys. Rev. B 1995, 52, 15150. [Google Scholar] [CrossRef]
- Xu-Dong, Z.; Shou-Xin, C.; Hai-Feng, S. Theoretical study of thermodynamics properties and bulk modulus of SiC under high pressure and temperature. Chin. Phys. Lett. 2014, 31, 016401. [Google Scholar]
- Aleksandrov, I.; Goncharov, A.; Zisman, A.; Stishov, S. Diamond at high pressures: Raman scattering of light, equation of state, and high pressure scale. Zhurnal Eksperimental'noi i Teoreticheskoi Fiziki 1987, 93, 680–691. [Google Scholar]
- Wang, Y.; Liu, Z.T.; Khare, S.V.; Collins, S.A.; Zhang, J.; Wang, L.; Zhao, Y. Thermal equation of state of silicon carbide. Appl. Phys. Lett. 2016, 108, 061906. [Google Scholar] [CrossRef]
- Jakovenko, E.; Goncharov, A.; Stishov, S. SiC up to 35 GPa: Eos, phonon dispersion curves and sum rule. polytypes 6H and 15R. Int. J. High Press. Res. 1992, 8, 433–435. [Google Scholar] [CrossRef]
- Becker, K. Eine röntgenographische Methode zur Bestimmung des Wärmeausdehnungskoeffizienten bei hohen Temperaturen. Zeitschrift für Physik 1926, 40, 37–41. [Google Scholar] [CrossRef]
- Clark, D.; Knight, D. Royal Aircraft Establishment; Technical Report RAE-TR-65049; Royal Aircraft Establishment: Farnborough, England, 1965. [Google Scholar]
- Hiroshige, S.; Takayoshi, I.; Masahiko, I. Annealing behavior of neutron irradiated β-SiC. J. Nucl. Mater. 1973, 48, 247–252. [Google Scholar] [CrossRef]
- Kern, E.; Hamill, D.; Deem, H.; Sheets, H. Thermal properties of β-Silicon Carbide from 20 to 2000 °C. In Silicon Carbide–1968; Elsevier: University Park, PA, USA, 1969; pp. S25–S32. [Google Scholar]
- Popper, P.; Mohyuddin, I. The Preparation and Properties of Pyrolytic Silicon Carbide; Special Ceramics; Academic Press: New York, NY, USA, 1965; Volume 45. [Google Scholar]
- Price, R. Structure and Properties of Pyrolytic Silicon Carbide; Gulf General Atomic, Inc.: San Diego, CA, USA, 1969. [Google Scholar]
- Taylor, A.; Jones, R. The crystal structure and thermal expansion of cubic and hexagonal silicon carbide. Silicon Carbide 1960, 147–161. [Google Scholar]
- Li, Z.; Bradt, R. Thermal expansion of the cubic (3C) polytype of SiC. J. Mater. Sci. 1986, 21, 4366–4368. [Google Scholar] [CrossRef]
- Dorogokupets, P.; Dewaele, A. Equations of state of MgO, Au, Pt, NaCl-B1, and NaCl-B2: Internally consistent high-temperature pressure scales. High Press. Res. 2007, 27, 431–446. [Google Scholar] [CrossRef]
- Fei, Y.; Ricolleau, A.; Frank, M.; Mibe, K.; Shen, G.; Prakapenka, V. Toward an internally consistent pressure scale. Proc. Natl. Acad. Sci. USA 2007, 104, 9182–9186. [Google Scholar] [CrossRef] [PubMed]
- Yokoo, M.; Kawai, N.; Nakamura, K.G.; Kondo, K.-I.; Tange, Y.; Tsuchiya, T. Ultrahigh-pressure scales for gold and platinum at pressures up to 550 GPa. Phys. Rev. B 2009, 80, 104114. [Google Scholar] [CrossRef]
- Franke, P.; Neuschütz, D.; Europe, S.G.T. The Landolt-Börnstein Database; Springer Materials: Heidelberg, Germany, 2004. [Google Scholar]
- Gröbner, J.; Lukas, H.L.; Aldinger, F. Thermodynamic calculation of the ternary system Al-Si-C. Calphad 1996, 20, 247–254. [Google Scholar] [CrossRef]
- Bhaumik, S.; Divakar, C.; Mohan, M.; Singh, A. A modified high-temperature cell (up to 3300 K) for use with a cubic press. Rev. Sci. Instrum. 1996, 67, 3679–3682. [Google Scholar] [CrossRef]
- Hall, H.T. High Temperature Studies; Bringham Young University: Provo, UT, USA, 1956; p. 36. [Google Scholar]
- Sokolov, P.S.; Mukhanov, V.A.; Chauveau, T.; Solozhenko, V.L. On melting of silicon carbide under pressure. J. Superhard Mater. 2012, 34, 339–341. [Google Scholar] [CrossRef]
- Togaya, M.; Sugiyama, S. Melting Behavior of β-SiC at High Pressure. Rev. High Press. Sci. Technol. 1998, 7, 1037–1039. [Google Scholar] [CrossRef]
- Ekimov, E.; Sadykov, R.; Gierlotka, S.; Presz, A.; Tatyanin, E.; Slesarev, V.; Kuzin, N. A high-pressure cell for high-temperature experiments in a toroid-type chamber. Instrum. Exp. Tech. 2004, 47, 276–278. [Google Scholar] [CrossRef]
Figure 1.
Structure diagram of several low pressure polytypes of SiC as well as the high-pressure rocksalt structure. The larger blue spheres represent the Si atoms while the smaller brown spheres represent the C atoms. Structures visualized using the program VESTA [2] with 3C from [3], 2H from [4], 6H from [5], and 21R from [6].

Figure 2.
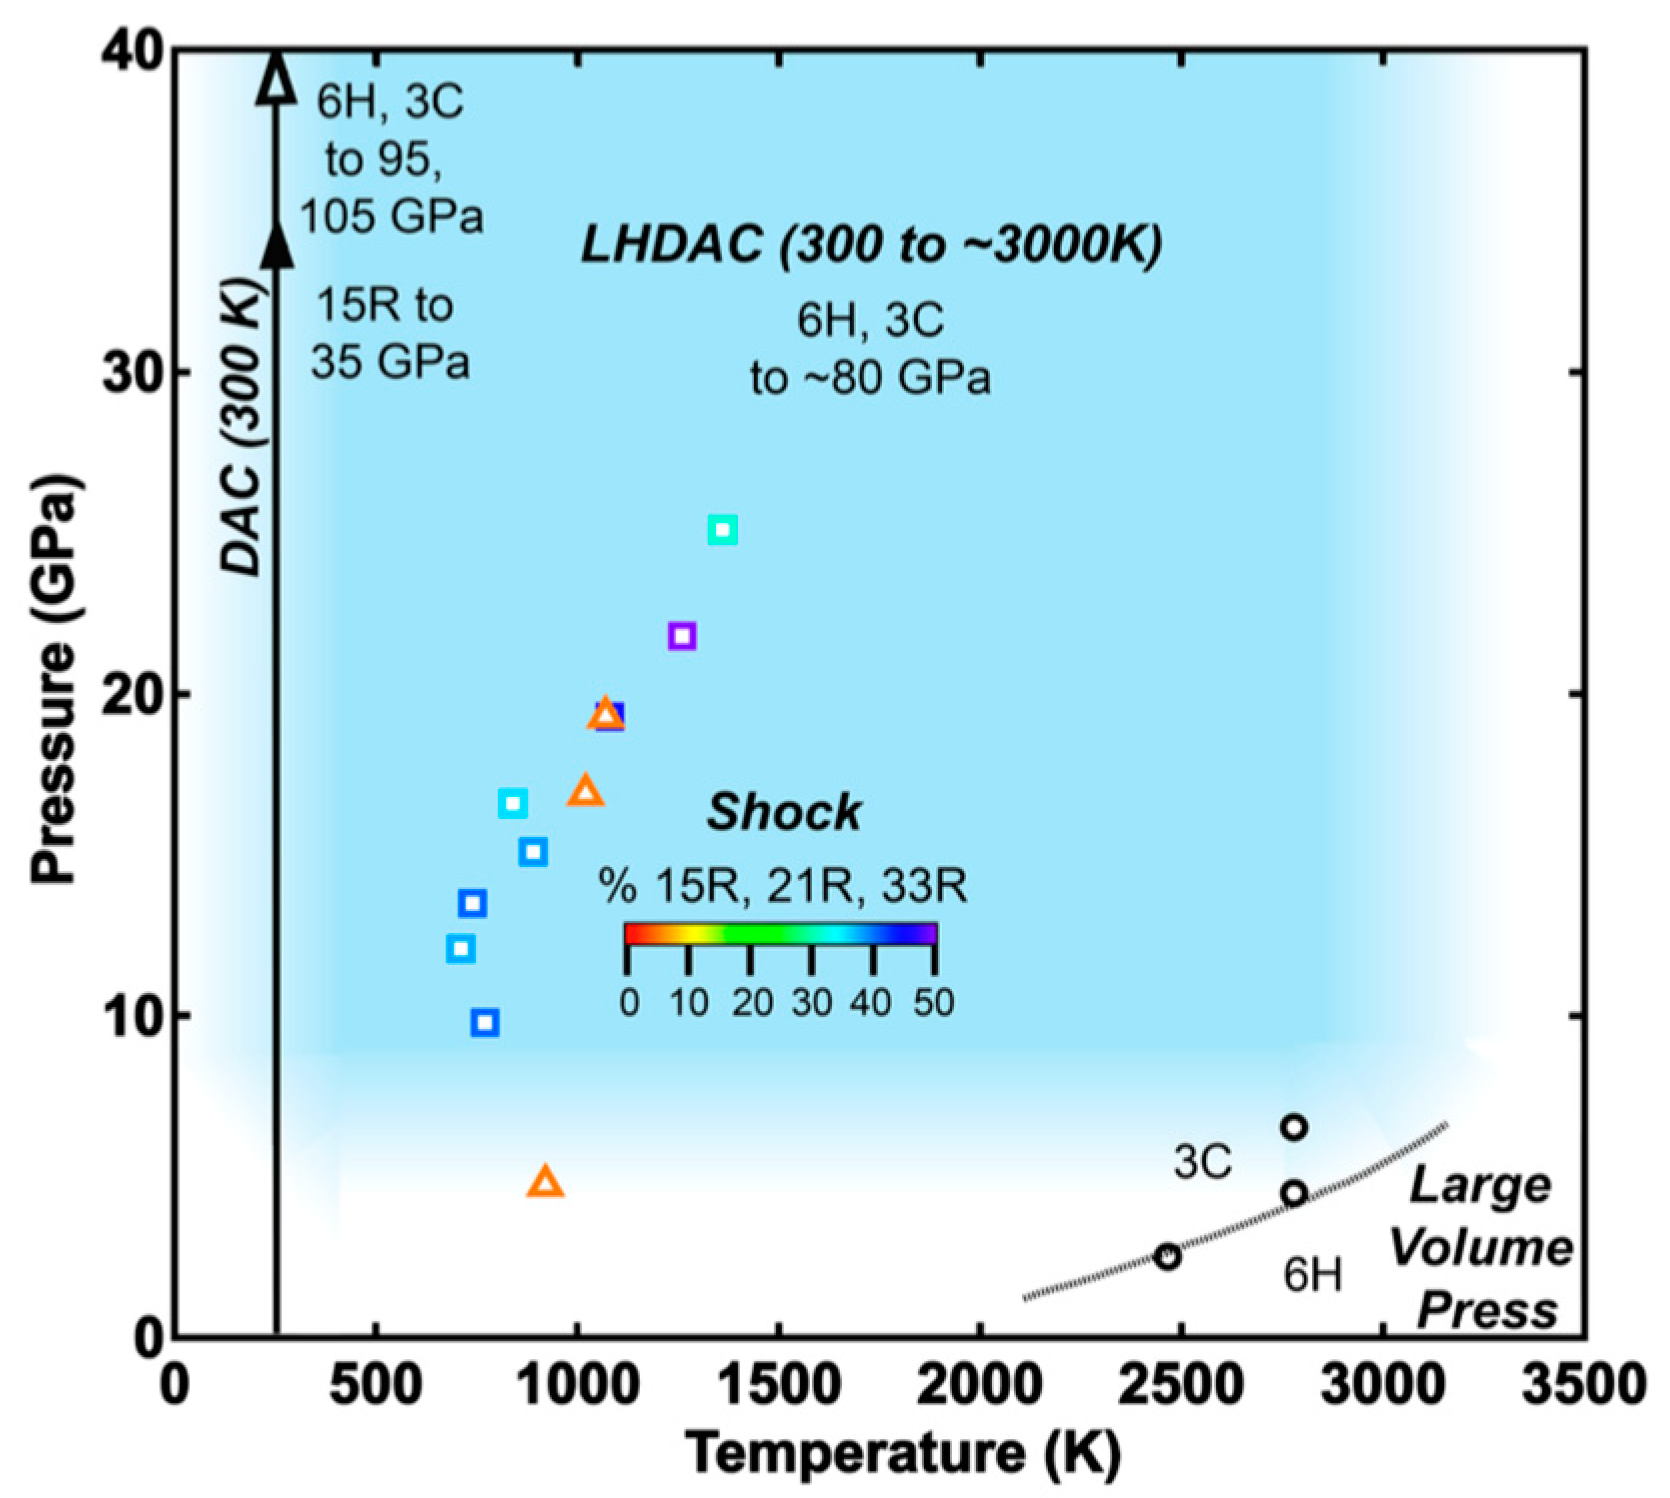
Compilation of experimental work on polytype transformations at pressure. DAC studies find that 15R remains under compression to at least 35 GPa at 300 K [22], 3C remains stable to 105 GPa at 300 K and 6H remains stable to 95 GPa at 300 K before transition to a dense, high-pressure rocksalt structure [25]. LHDAC experiments find that both 6H and 3C remain in experiments covering conditions of ~10–80 GPa and ~3000 K (shown in blue) before transition to the rocksalt structure [18,23,24,27,28]. Shock experiments up to 25 GPa and ~2000 K find an increase in the proportion of rhombohedral and cubic phases at high P-T and a decrease in hexagonal phases [16]. Rainbow colored shock data indicate the proportion of rhombohedral polytypes resulting from shock: 15R forming in the α-SiC sample (15% in starting sample), plotted with open squares; 21R and 33R forming in the β-SiC sample (0% in starting sample), plotted with open triangles. Multi-anvil, high pressure apparatus work finds that 3C transitions to 6H at high P-T over 2000 K [14]. The lack of clear boundaries between phases may indicate that either the kinetics of transition are sluggish or that the energy difference between polytypes is low at high P-T.
Figure 2.
Compilation of experimental work on polytype transformations at pressure. DAC studies find that 15R remains under compression to at least 35 GPa at 300 K [22], 3C remains stable to 105 GPa at 300 K and 6H remains stable to 95 GPa at 300 K before transition to a dense, high-pressure rocksalt structure [25]. LHDAC experiments find that both 6H and 3C remain in experiments covering conditions of ~10–80 GPa and ~3000 K (shown in blue) before transition to the rocksalt structure [18,23,24,27,28]. Shock experiments up to 25 GPa and ~2000 K find an increase in the proportion of rhombohedral and cubic phases at high P-T and a decrease in hexagonal phases [16]. Rainbow colored shock data indicate the proportion of rhombohedral polytypes resulting from shock: 15R forming in the α-SiC sample (15% in starting sample), plotted with open squares; 21R and 33R forming in the β-SiC sample (0% in starting sample), plotted with open triangles. Multi-anvil, high pressure apparatus work finds that 3C transitions to 6H at high P-T over 2000 K [14]. The lack of clear boundaries between phases may indicate that either the kinetics of transition are sluggish or that the energy difference between polytypes is low at high P-T.

Figure 3.
Experimental data from DAC (black), shock, (blue), and selected computational results (red) for the high-P-T transition conditions to the rocksalt (B1) structure. All data shown start with the cubic B3 polytype aside from the shock study [21], which starts with the 6H polytype. Bars extending from shock studies (blue triangle [20], blue square [21]) indicate the likely high sample temperature. Open symbols represent the low pressure B3 structure (open circle [24], open triangles [27]) while solid symbols indicate the appearance or stability of the B1 structure in (LH) DAC experiments (solid circles [24], solid triangles [27], solid thick diamond [25], solid thin diamonds [28]). Computations considering the hysteresis across the transition are plotted in red crosses [44], while the range of most transition temperatures found in computational studies is shown by the red bar. Long dashed line indicates Clapeyron slope proposed by [24] while short dashed line indicates Clapeyron slope proposed by [27].

Figure 4.
Summary of DAC studies on the first-order LO and TO phonon pressure dependence in SiC. (a) Summary of experimental Raman data of the first and second order phonons in 3C-SiC. The first-order LO and TO phonons are labeled and are consistent between studies. Crosses are from [60], thick black lines from [64], thin dot-dot-dash lines from [22], thick dashed lines from [62], and thin dashed lines from [66]. The second-order phonons as measured by [63] are plotted as dotted grey lines to 11 GPa, with zero pressure positions in order of increasing wavenumber listed: 764.8, 795.9, 881.3, 972.9, 1028.5, 1456.3, 1519.3, 1623.7, 1712.8 cm−1. The assignment of second-order phonon modes from [63] are labeled. All measured phonons for 3C-SiC shift to higher wavenumbers with increased pressure with a slight increase in the LO-TO splitting; (b) Summary of experimental Raman data on the phonons of 6H-SiC. Phonons in 6H that have been measured, with zero pressure positions in order of increasing wavenumber listed: 149.1, 241.3, 267.2, 506, 766.7, 773, 787.8, 796.3, 887.8, 969.3 cm−1. Thick black lines are from [69], thin black lines from [22], and dashed lines from [67]. IR measurements are plotted in solid black circles [70].

Figure 5.
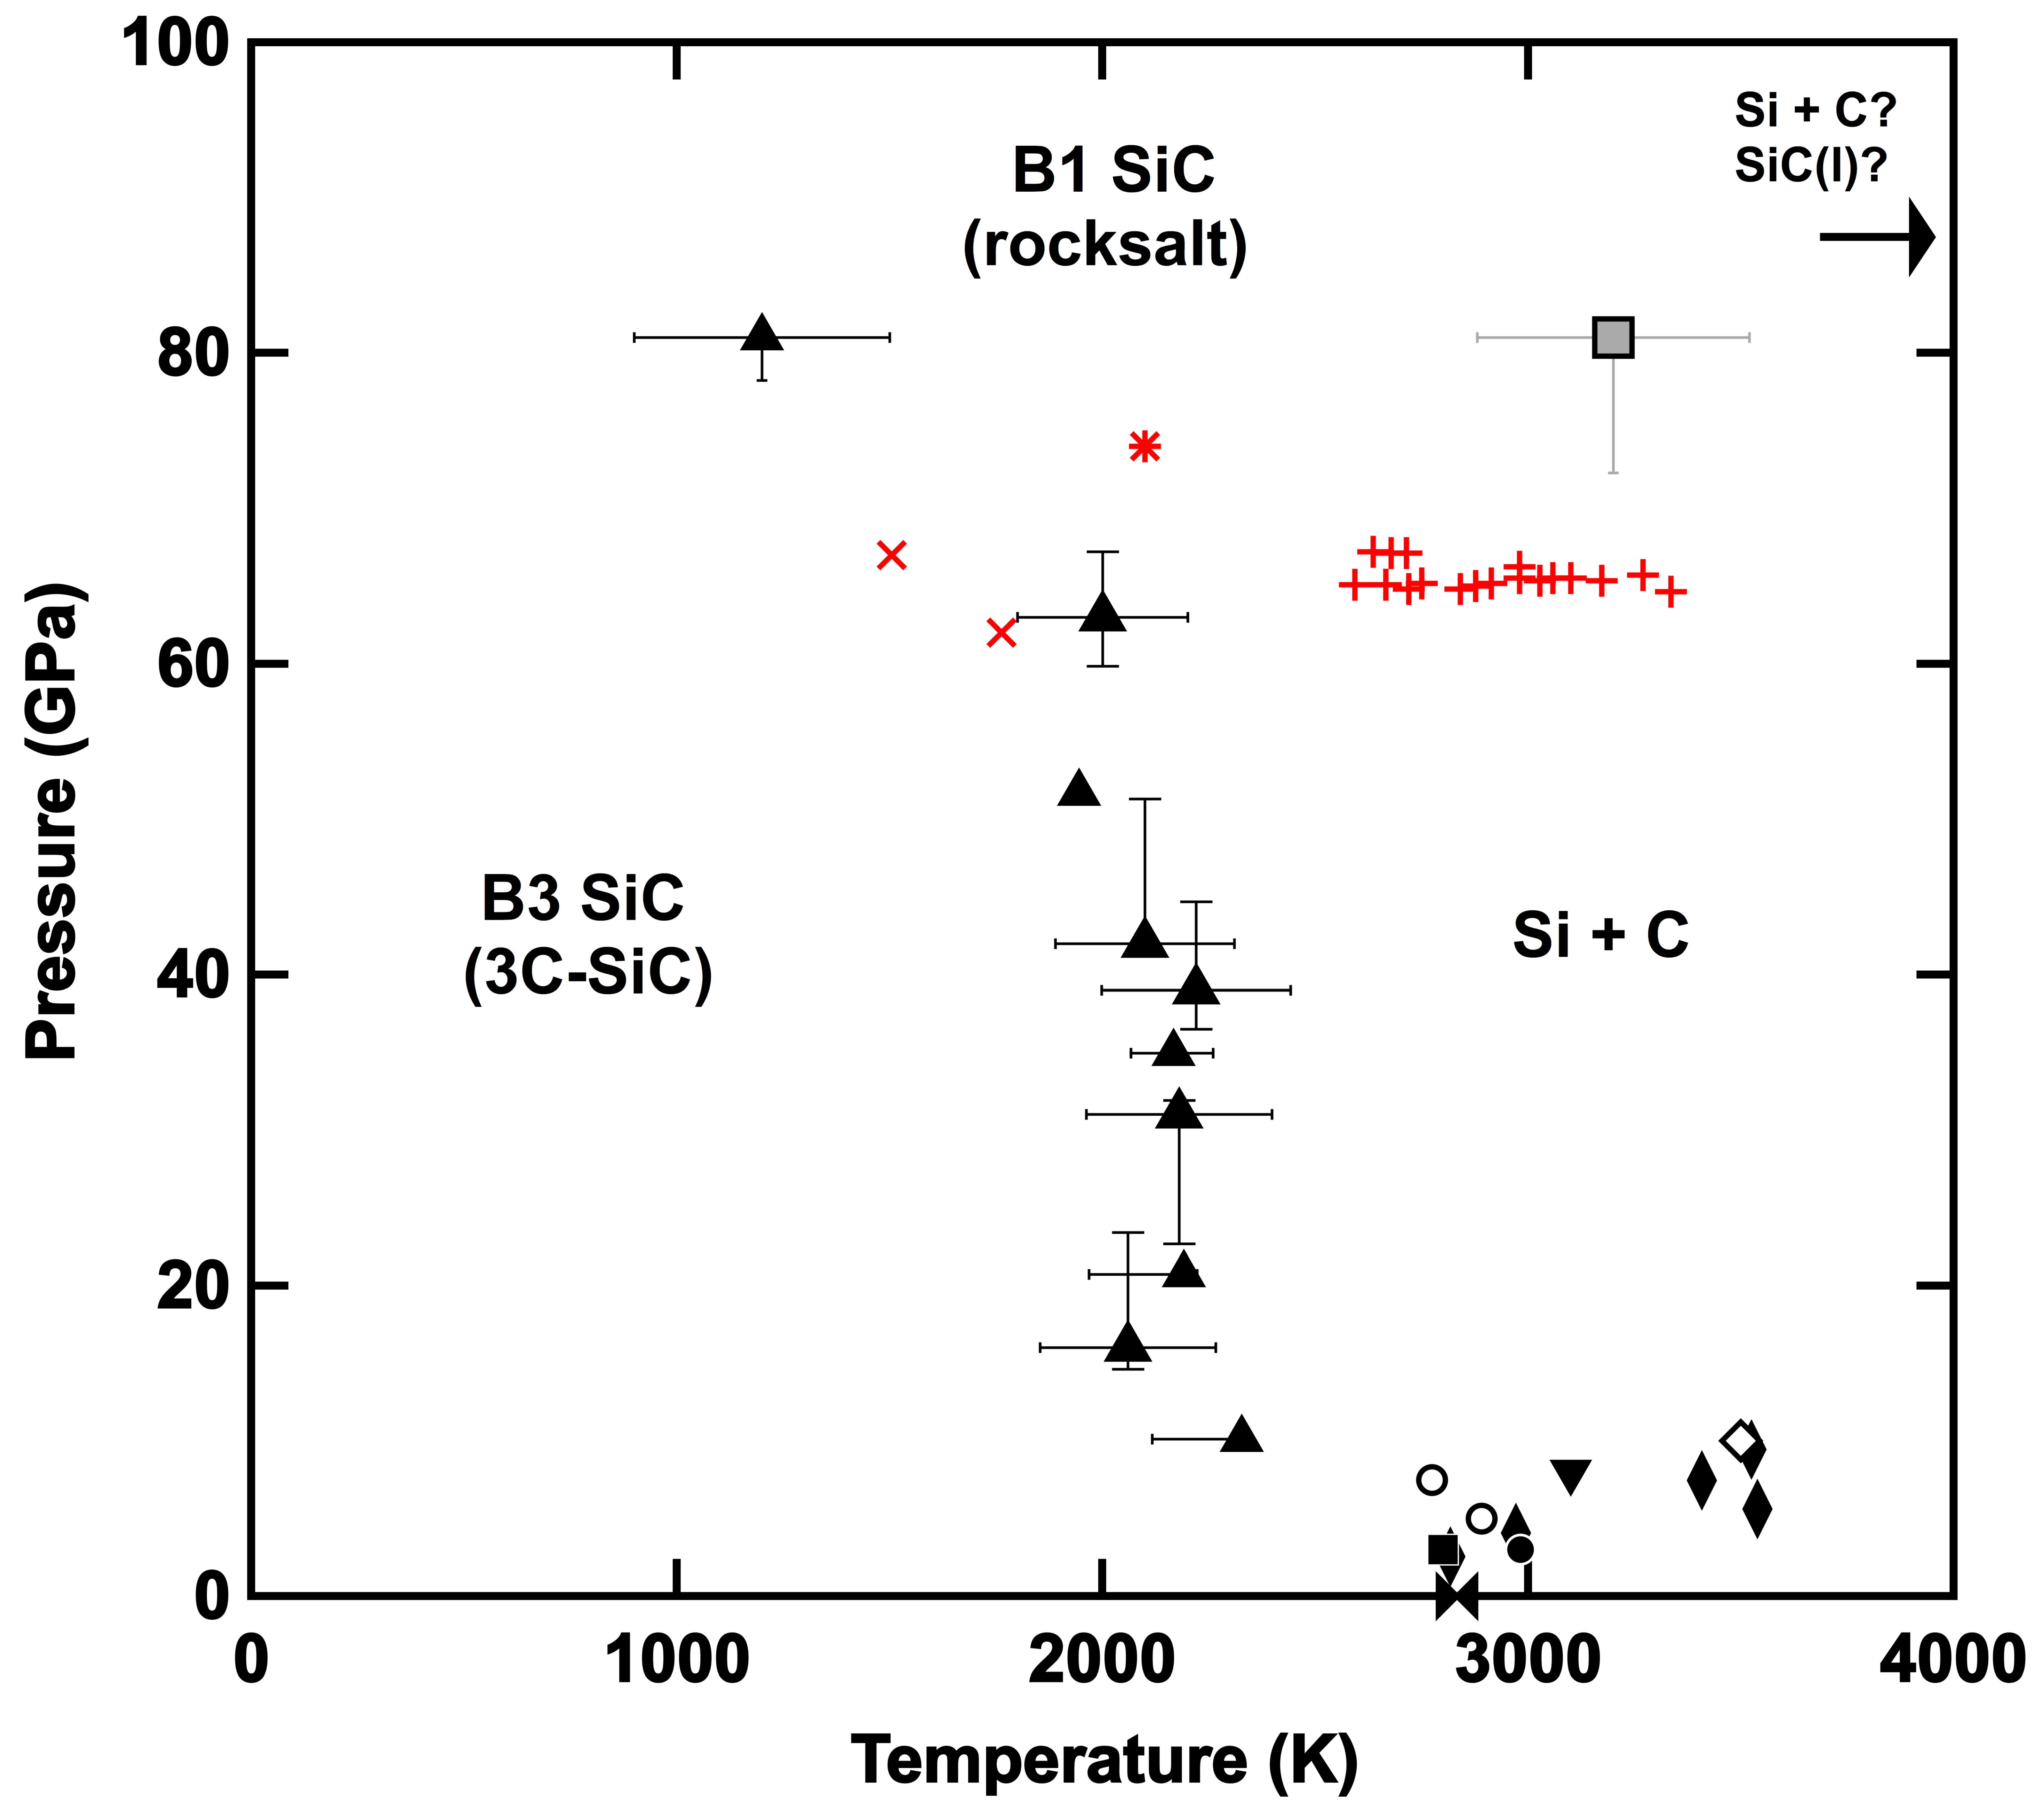
High-pressure and -temperature phase diagram of SiC melting and decomposition. Solid black symbols indicate studies finding incongruent melting (decomposition) (bowtie [19], circle [106], diamonds [109], upside down triangle [110], square [17], triangles (multi-wavelength imaging radiometry and X-ray diffraction) [18]) while open symbols indicate studies observing congruent melting to SiC liquid (open circles [108], diamond [107]). The solid grey square indicates P-T conditions where no melting of any kind was observed [18]. Red symbols indicate the experimentally observed conditions of the B3 to B1 transition in the LHDAC (red x’s [24], red asterisk [27], red plus signs [28]).
Figure 5.
High-pressure and -temperature phase diagram of SiC melting and decomposition. Solid black symbols indicate studies finding incongruent melting (decomposition) (bowtie [19], circle [106], diamonds [109], upside down triangle [110], square [17], triangles (multi-wavelength imaging radiometry and X-ray diffraction) [18]) while open symbols indicate studies observing congruent melting to SiC liquid (open circles [108], diamond [107]). The solid grey square indicates P-T conditions where no melting of any kind was observed [18]. Red symbols indicate the experimentally observed conditions of the B3 to B1 transition in the LHDAC (red x’s [24], red asterisk [27], red plus signs [28]).


Table 1.
Parameters for the transition from zinc-blende (B3) to rocksalt (B1) SiC, compiled from both experiments and computations. Vt/V0 represents the ratio of the volume of B3 SiC at the transition, to the zero pressure volume of B3. ΔV (%) shows the change in volume between B3 and B1 at the transition pressure.
| Pressure (GPa) | Vt/V0 | ΔV (%) | Method | Reference |
|---|---|---|---|---|
| Experiments | ||||
| 74 | 0.813 | 17.3 | LHDAC | [27] |
| 65–70 | LHDAC | [28] | ||
| 62.4 | 0.811 | 16.5 | LHDAC | [24] |
| 66.6 | 0.809 | 17.4 | LHDAC | |
| 100 | 0.757 | 20.3 | DAC | [25] |
| Computations | ||||
| 58 | 0.825 | 18.1 | DFT (PBE) | [34] |
| 67 | 0.811 | 18.2 | DFT (PBEsol) | |
| 75.4 | 0.799 | 18 | DFT (LDA) | [35] |
| 63 | 0.80 | 18 | DFT (GGA) | [36] |
| 140 | 0.78 | 21 | MD | [45] |
| 66 | 0.819 | 17.9 | DFT (LDA) | [33] |
| 66 | 0.81 | 18.5 | Ab initio pseudopotential | [30] |
| 65.9 | 0.823 | 18.3 | DFT (GGA) | [44] |
Table 2.
Experimental equations of state for several polytypes of SiC.
| Polytype | Max Pressure (GPa) | EOS | K0 | K0’ | Method | Ref. |
|---|---|---|---|---|---|---|
| 3C | 45 | scale proposed by [90] | 227 ± 3 | 4.1 ± 0.1 | Raman | [61] |
| 3C | 25 | Murnaghan (M) EOS | 248 ± 9 | 4.0 ± 0.3 | XRD | [85] |
| 3C | 75 | primary scale | 218 ± 1 | 3.75 ± 4 | XRD, Brillouin, Raman | [66] |
| 3C | 8.1 | Birch–Murnaghan (BM EOS) | 237 ± 2 | 4 (fixed) | XRD | [91] |
| 3C, 6H | 95 | BM EOS | 260.9 ± 9 | 2.9 ± 0.3 | XRD | [25] |
| 6H | 68.4 | BM EOS | 230.2 ± 4.0 | 4 (fixed) | XRD | [84] |
| 6H | 13.6 | BM EOS | 216.5 ± 1.1 | 4.19 ± 0.09 | Ultrasonic | [83] |
| 6H | 27 | BM EOS | 218.4 ± 4.9 | 4.19 (fixed) | XRD | [83] |
| 15R | 35 | scale proposed by [90] | 224 ± 3 | 4.3 ± 0.3 | XRD, Raman | [22,92] |
© 2018 by the authors. Licensee MDPI, Basel, Switzerland. This article is an open access article distributed under the terms and conditions of the Creative Commons Attribution (CC BY) license (http://creativecommons.org/licenses/by/4.0/).
Share and Cite
MDPI and ACS Style
Daviau, K.; Lee, K.K.M. High-Pressure, High-Temperature Behavior of Silicon Carbide: A Review. Crystals 2018, 8, 217. https://doi.org/10.3390/cryst8050217
AMA Style
Daviau K, Lee KKM. High-Pressure, High-Temperature Behavior of Silicon Carbide: A Review. Crystals. 2018; 8(5):217. https://doi.org/10.3390/cryst8050217
Chicago/Turabian StyleDaviau, Kierstin, and Kanani K. M. Lee. 2018. "High-Pressure, High-Temperature Behavior of Silicon Carbide: A Review" Crystals 8, no. 5: 217. https://doi.org/10.3390/cryst8050217
Note that from the first issue of 2016, this journal uses article numbers instead of page numbers. See further details here.