Copper Delafossites under High Pressure—A Brief Review of XRD and Raman Spectroscopic Studies

1
High Pressure and Synchrotron Radiation Physics Division, Bhabha Atomic Research Centre, Mumbai 400085, India
2
Homi Bhabha National Institute, Anushaktinagar, Mumbai 400094, India
3
Solid State Physics Division, Bhabha Atomic Research Centre, Mumbai 400085, India
*
Author to whom correspondence should be addressed.
Crystals 2018, 8(6), 255; https://doi.org/10.3390/cryst8060255
Submission received: 10 May 2018
/
Revised: 13 June 2018
/
Accepted: 16 June 2018
/
Published: 19 June 2018
(This article belongs to the Special Issue High-Pressure Studies of Crystalline Materials)
Abstract
:Delafossites, with a unique combination of electrical conductivity and optical transparency constitute an important class of materials with their wide range of applications in different fields. In this article, we review the high pressure studies on copper based semiconducting delafossites with special emphasis on their structural and vibrational properties by synchrotron based powder X-ray diffraction and Raman spectroscopic measurements. Though all the investigated compounds undergo pressure induced structural phase transition, the structure of high pressure phase has been reported only for CuFeO2. Based on X-ray diffraction data, one of the common features observed in all the studied compounds is the anisotropic compression of cell parameters in ambient rhombohedral structure. Ambient pressure bulk modulus obtained by fitting the pressure volume data lies between 135 to 200 GPa. Two allowed Raman mode frequencies Eg and A1g are observed in all the compounds in ambient phase with splitting of Eg mode at the transition except for CuCrO2 where along with splitting of Eg mode, A1g mode disappears and a strong mode appears which softens with pressure. Observed transition pressure scales exponentially with radii of trivalent cation being lowest for CuLaO2 and highest for CuAlO2. The present review will help materials researchers to have an overview of the subject and reviewed results are relevant for fundamental science as well as possessing potential technological applications in synthesis of new materials with tailored physical properties.
1. Introduction
Delafossites are ternary metal oxides belonging to a large family of compounds with the general formula A+1B+3O2−, (A is monovalent cation Pt, Pd, Ag or Cu; B is trivalent transition metal). The primary member of the series is the mineral CuFeO2 and the compounds adopting structure of CuFeO2 are clubbed together as delafossites [1]. Scientific interest in this class of compounds is due to the diversity of the physical properties exhibited by them. They show a wide range of conductivity from insulating to metallic [2,3,4]. Most of the Cu and Ag based delafossites are semiconductors whereas Pt and Pd based compounds exhibit good metallic conductivity; with their room temperature in-plane conductivity reaching about a few μΩ cm, which is comparable to that of metallic elemental copper [5]. Along with good electrical conductivity, many of the delafossites show good transparency to optical photons and the compounds exhibiting the combination of these two properties are termed as transparent conducting oxides (TCO) [6,7,8]. Furthermore, depending on the donor or acceptor level in the band gap, they can show p-type or n-type conductivity. The origin of p-type conductivity in un-doped delafossites is either due to excess oxygen in the interstitials or copper vacancies [9]. Due to the unique combination of optical transparency and electrical conductivity, delafossites have been proposed to be useful in many areas, including in the solar energy industry [10], for liquid crystal displays [11], and in electro-chromatic materials for smart windows [12]. Thin films of a few delafossites find their uses as photocathodes to produce hydrogen by water splitting [13]. The catalytic activity of copper delafossites also finds applications in hydrogen production by decomposition of toxic H2S gas [14]. Doping of a few delafossites also increases the p-type conductivity by an order of three [15,16]. Mineral CuFeO2 finds its uses in medicine as a novel antimicrobial material [17], as an anode in lithium ion batteries [18], and as a gas sensor [19]. CuCrO2 is being used as a catalyst for the production of chlorine [20]. Interestingly a few of these compounds also exhibit negative thermal expansion (NTE) behavior [21], which is attributed to the anharmonicity of linear O-Cu-O bond along the c-axis. A few members of the delafossite family where B atom is magnetic have attracted interest due to the multiferroic properties, wherein ferroelectricity is induced by magnetic ordering [22]. Low temperature investigations of these materials led to interesting magnetic behavior along with spin lattice coupling [23]. Various synthesis routes are also being employed to engineer different polymorphs of these semiconductors for applications as an absorber in solar cells by manipulating their band gaps. In fact, synthesis of tetrahedral structured wurtzite analogues with the same general formula ABO2 has been successfully achieved [24]. These are direct narrow band gap semiconductors, unlike the rhombohedral modification where the band gap is indirect. Synthesis of delafossites in nanophase such as nanoparticles, nanowires, nanoplates and investigating the particle size effect on the properties of these materials is another interesting field which is currently being explored. Eu3+ doped CuAlO2 single phase nanofibers prepared via an electrospinning technique show strong photoluminescence spectra with emission bands at 405 and 610 nm due to the intrinsic near-band-edge transition of CuAlO2 and the f-f transition of the Eu3+ activator respectively [25]. Nanoplates of CuGaO2 synthesized via low temperature hydrothermal method exhibited a blue emission at room temperature and free exciton emission at low temperature. P-N junction fabricated by these nanoparticles of p-type CuGaO2 and n-type nano ZnO exhibited enhanced photocatalytic activity and light absorption properties [26]. Investigation of structural and vibrational behavior of CuAlO2 as a function of particle size shows the expansion of lattice parameters and the cell volume with the reduction of particle size. Raman spectra shows large red shifts (∼60 cm−1) and line broadening (∼50 cm−1) as the particle size becomes of the order of 13 nm [27]. The electrochemical performance of nano CuAlO2 with an average particle size of ≈20 nm demonstrated 12 times more catalytic activity in the electrolysis of water to the hydrogen evolution reactions and oxygen evolution reactions compared to bulk CuAlO2 [28]. Research on thin films of delafossite is another interesting and widely investigated area for their potential uses in optoelectronic device fabrication [29,30,31,32]. As has been well established by the high pressure scientific community, compression is yet another way to engineer the crystal/electronic structure of materials, producing compounds with entirely different set of physical properties without altering their chemical composition [33,34]. The focus of the present article is to comprehend the high pressure studies on delafossite structured compounds till date in general, with special emphasis on their X-ray diffraction and Raman spectroscopic investigations. With the exception of one preliminary study on PdCoO2 [35], most of the high pressure work has been focused on copper based delafossites, probably because of the difficulty in preparing the Ag/Pt/Pd based delafossites. Due to low decomposition temperature of their respective oxides, special synthesis techniques are required to synthesize Ag/Pt/Pd based delafossites [36,37]. It is to be noted here, that since it is easier to synthesize the rhombohedral polytype of delafossites, most of the experimental high pressure studies carried out are on rhombohedral structured delafossites [38].
2. Ambient Crystal Structure and Vibrational Properties of ABO2
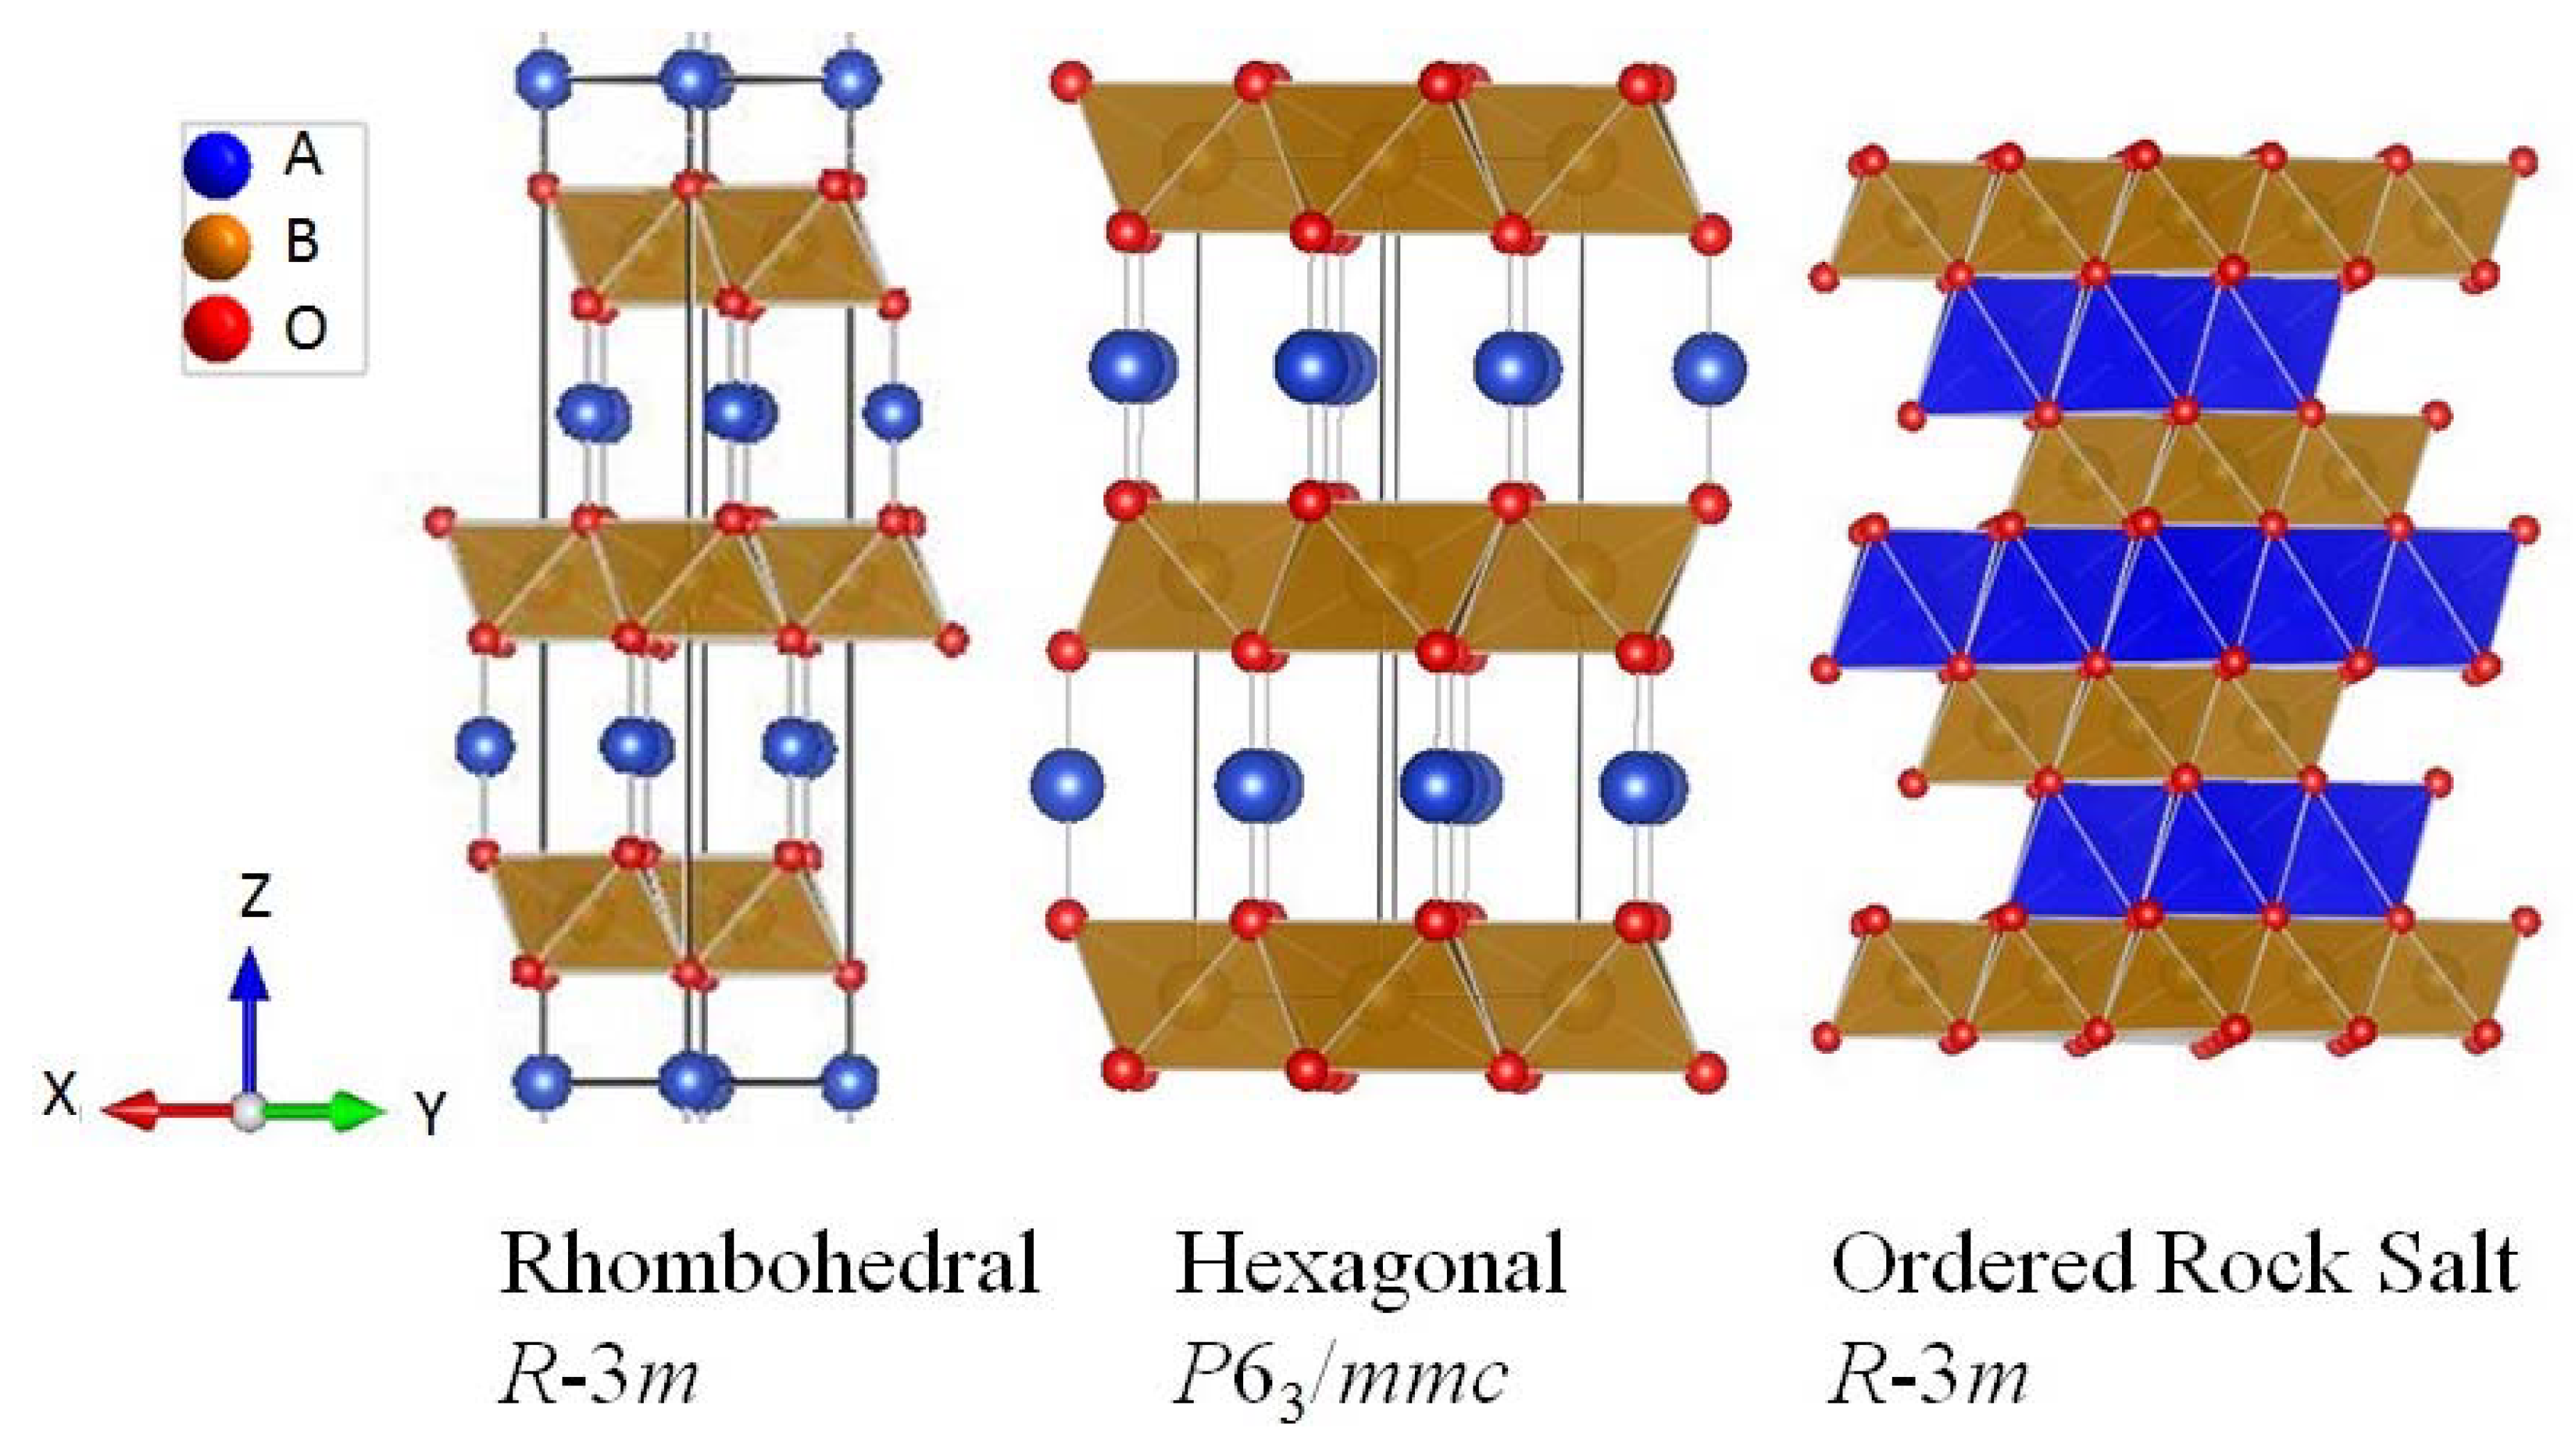
As shown in Figure 1, delafossite crystallizes in layered structure with hexagonal symmetry and can exist in two structural polymorphs, namely rhombohedral 3R with space group: R-3m, or hexagonal 2H with space group: P63/mmc. The building block of both the polytypes is layers of edge-connected BO6 octahedra and triangular metallic planes of monovalent element A which are stacked along the c-axis. A cation is linearly coordinated with oxygen of upper and lower BO6 layers. The difference in the two structures is the different orientation of the triangular metallic plane along the c-axis stacking. When two consecutive A layers are stacked with each layer rotated by 180° with respect to one another, the structure is hexagonal. Alternatively, when the layers are stacked in the same direction with respect to one another, resultant structure is rhombohedral. In the primitive rhombohedral cell, there are only four atoms: one A, one B and two oxygen atoms. However, in the triple hexagonal cell which is conventionally used to describe this structure, A and B cations occupy 3a (0,0,0) and 3b (0,0,0.5) Wyckoff positions respectively. The O atoms are situated at 6c (0,0,u) positions [39,40]. Each element in the delafossite structure forms the triangular lattice and stacks along the c-axis in the sequence B3+-O2−-A+-O2−-B3+. One of the key features delafossite structure has in common with other layered structured oxides is its extremely accommodating nature and flexibility to host many different elements. Another structure commonly adopted by the ABO2 compounds and related to delafossite is ordered rock salt. This structure too has a similar triangular lattice with same space group (R-3m), the only difference is in the stacking pattern of O2−-A+-O2−layers. While the delafossite structure has a straight stacking, the ordered rock salt structure has a zigzag one (Figure 1). In both cases the rhombohedral (ABCABC...) stacking is realized among B3+ layers, although the distance between them is much shorter in the latter case.
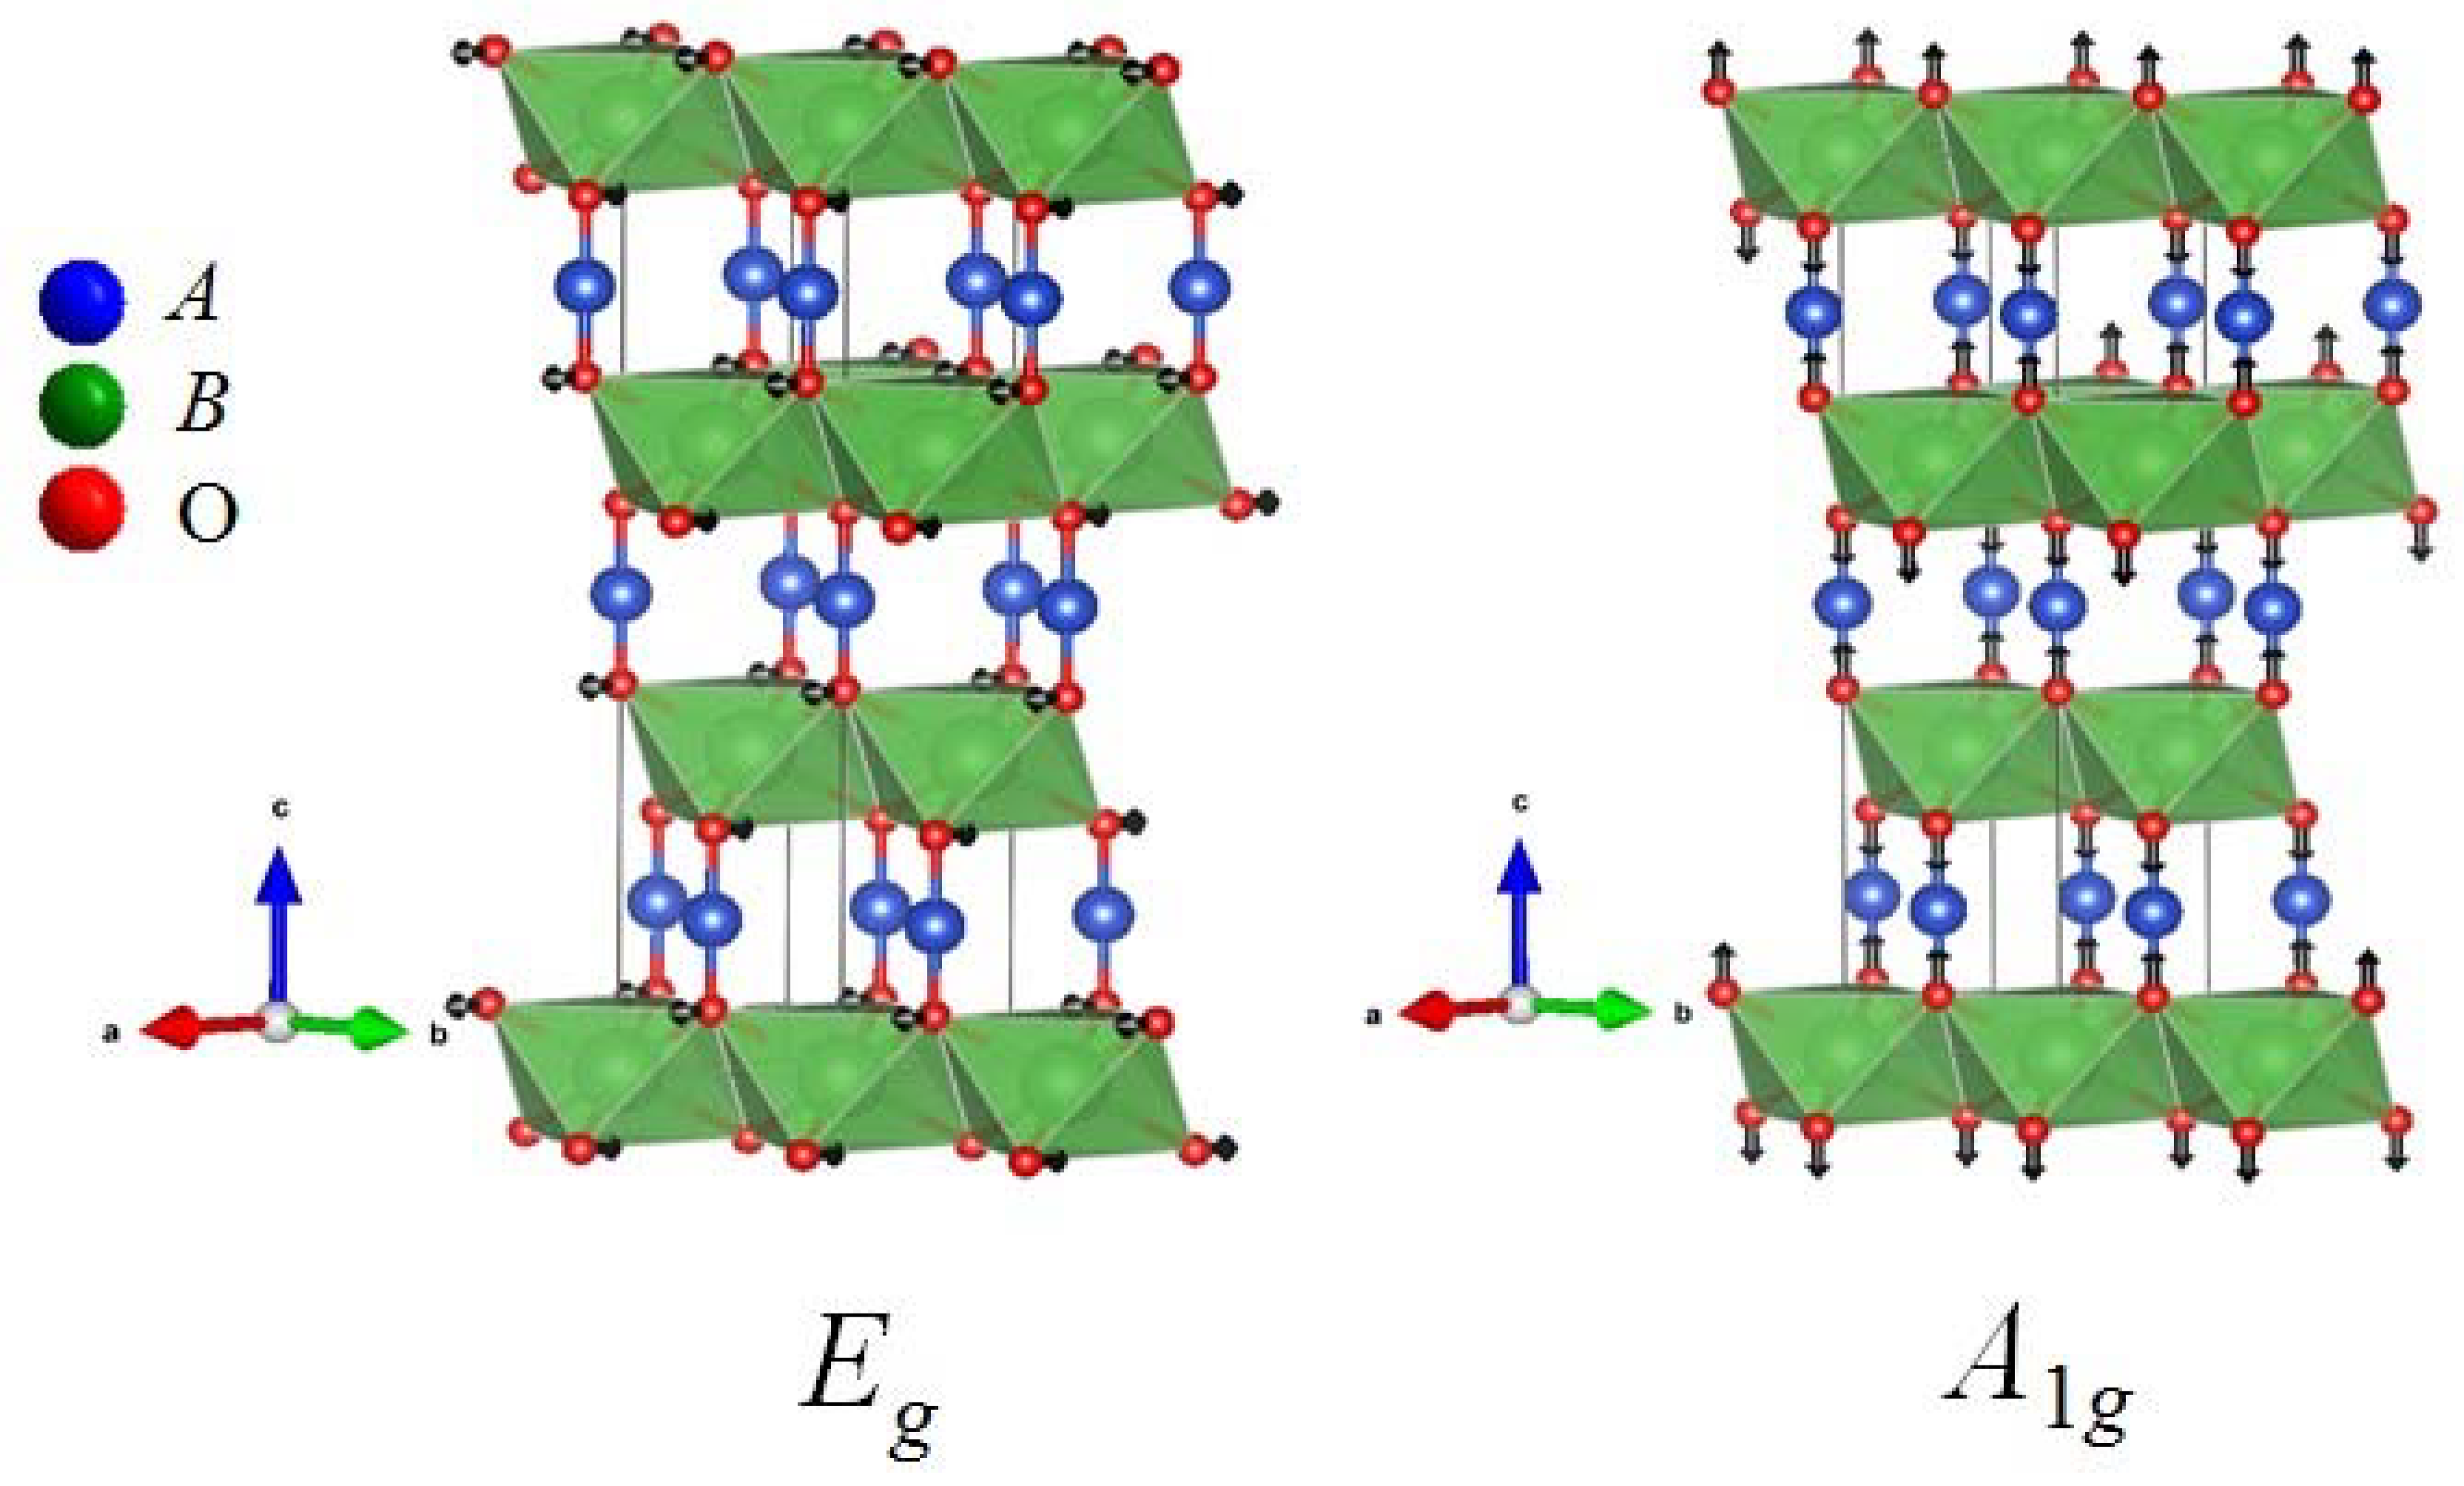
As has been mentioned earlier, ABO2 delafossites with rhombohedral structure (space group R-3m), consist of one formula unit of ABO2 per primitive cell with four atoms, resulting in twelve vibrational modes at the zone center, which transform as . Modes denoted by subscript g are Raman active modes and modes denoted by subscript u are infrared active which also includes acoustic modes A2u+Eu. In Figure 2, we show the pictorial representation of the two Raman active modes. Delafossites with hexagonal structure consist of two formula units of ABO2 per primitive cell with A at 2c, B at 2a and O at 4f position resulting in 24 modes of vibration at the zone center. Based on the structural information, using the nuclear site method [41], these vibrational modes are found to transform as . Out of these A1g, E1g, E2g and B1g are Raman active modes while A2u, E1u, E2u and B2u are infrared active modes. So, at ambient conditions, six distinct Raman modes are expected in hexagonal structure. Finally, in the ordered rock salt as the atoms occupy the same sites as in delafossite rhombohedral structure, the expected Raman modes are same in both structures. Table 1 shows the structural and vibrational details of the three structures.
3. High Pressure Studies
The first high pressure in-situ X-ray diffraction (HP-XRD) measurement was reported on copper iron oxide, the representative of the series by Zhao et al. [42] in the year 1996. The measurement was carried out on powdered sample up to 10 GPa. Authors found an increase in c/a ratio indicating lattice anisotropic compression; however the ambient phase was found to be stable in the studied pressure range. On fitting the pressure volume data to 3rd order Birch-Murnaghan equation of state (BM-EOS) [43], ambient pressure bulk modulus, B0, of the compound was reported to be 156 GPa, with its pressure derivative B0′ = 2.6. Nearly seven years later, Hasegawa et al. reported the HP-XRD measurements on metallic delafossite PdCoO2 up to 10 GPa [35]. Structurally this compound was also found to be stable with anisotropic compression of lattice -parameters and increase in c/a ratio. The reported value of bulk modulus for the compound based on 3rd order BM-EOS fitting of experimental pressure volume data is 224(2) GPa with pressure derivative of bulk modulus B0′ = 0.7(0.5). High value of bulk modulus and low value of B0’ indicates highly incompressible nature of the compound [43]. In both these measurements, methanol:ethanol in 4:1 ratio was used as pressure transmitting medium. Subsequently, with the availability of bright synchrotron sources, evolution in the diamond anvil cell (DAC) and detector technology, many of the delafossites have been investigated under high pressure with increased pressure range. Revisiting the compression behavior of CuFeO2 up to 30 GPa using XRD along with 57Fe Mössbauer and Fe & Cu K-edge X-ray absorption spectroscopy methods, reveal a sequence of electronic-magnetic pressure-induced transitions along with structural transition to more isotropic C2/c structure with onset of long range antiferromagnetic order at 18 GPa. Beyond 23 GPa, interionic valence exchange between Cu and Fe leads to a four-fold coordinated Cu, resulting in another crystallographic structure with space group P-3m. All the observed transitions are reversible with minimal hysteresis [44]. However, a neutron diffraction experiment on isotropically compressed CuFeO2 indicated suppression of long range magnetic ordering at around 7.9 GPa [45]. X-ray diffraction data on CuGaO2, collected up to 28.1 GPa, at two different temperatures, indicated pressure induced phase transition in the compound beyond 24 GPa [46]. As observed in CuFeO2 and PdCoO2, anisotropy in the axial compressibility was also observed in this compound. Though the transition was found to be irreversible, no details of the high pressure phase were provided in this article. A report on vibrational behavior up to 33.3 GPa on the same compound followed in the year 2005, which happens to be the first delafossite whose vibrational properties were investigated experimentally under high pressure [47]. Based on splitting of the Eg mode, authors reported a structural phase transition in the compound beyond 26 GPa. Raman measurements on single crystal of CuAlO2 up to 48 GPa indicated a pressure driven phase transition at around 34 (±2) GPa, which is completed by 37 (±2) GPa [48]. Raman data on the pressure cycled sample showed the presence of two modes as observed in the ambient sample, indicating the reversibility of the phase transition. Based on density functional theory, the phase transition is related to the dynamic instability in the compound [49]. High quality X-ray diffraction and X-ray absorption measurements on CuAlO2, also indicated the presence of phase transition around 35(±2) GPa [50]. However, first-principles calculations on CuAlO2 under high pressure showed transformation to a leaning delafossite structure at 60 GPa with an increased energy gap due to the enhanced covalency of Cu 3d and O 2p states [51]. Optical absorption measurements on thin films of CuAlO2 (indirect band gap) and CuScO2 (direct band gap) up to 20 GPa indicated two phase transitions in CuScO2 at 13 and 18 GPa [52], however the structures of high pressure phases have not been identified. High pressure behavior of CuInO2, which is the only copper based delafossite that can be doped with both n- and p-type ion [53], has not been investigated experimentally, however, its structural, elastic, mechanical and optical properties have been reported by first-principles density-functional theory [54]. The two polytypes of the compound with 3R and 2H phases become unstable beyond 9.3 and 8.7 GPa with the value of bulk modulus as 121 and 117 GPa which are nearly 20% less than the earlier reported values of 156 and 146 GPa respectively [55]. The dielectric, ferroelectric and ac calorimetric measurements on CuCrO2 have revealed the increase in magnetic transition temperature TN remarkably on pressurization. However, the magnitude of the dielectric anomaly at TN is suppressed by applying pressure and the magnitude of the spontaneous polarization below TN is abruptly suppressed at around 8 GPa [56]. We have investigated the high pressure behavior of CuCrO2 and CuLaO2 using synchrotron based X-ray diffraction and Raman spectroscopic technique on polycrystalline samples followed by Raman studies on single crystal of CuFeO2. For all these XRD measurements, Mao-Bell type of diamond anvil cell with stainless steel gasket pre-indented to a thickness of 40–80 μm and central hole of 100–200 μm was employed as the sample chamber. Methanol:ethanol in 4:1 ratio by volume was used as pressure transmitting medium and ruby fluorescence technique was employed for in-situ pressure calibration [57]. In X-ray diffraction measurements, equation of state data of standard like gold/copper was used for pressure calibration [58]. Rietveld/Lebail analysis of the XRD data was carried out using GSAS software [59]. All Raman spectroscopic measurements were carried out using a 532 nm laser in back scattering geometry. Polycrystalline samples of all these compounds were synthesized using conventional solid state route. Single crystals of CuFeO2 used in the present work were grown by the floating zone technique [60]. Readers can refer to earlier publications to get more detail about the sample synthesis and experimental details.
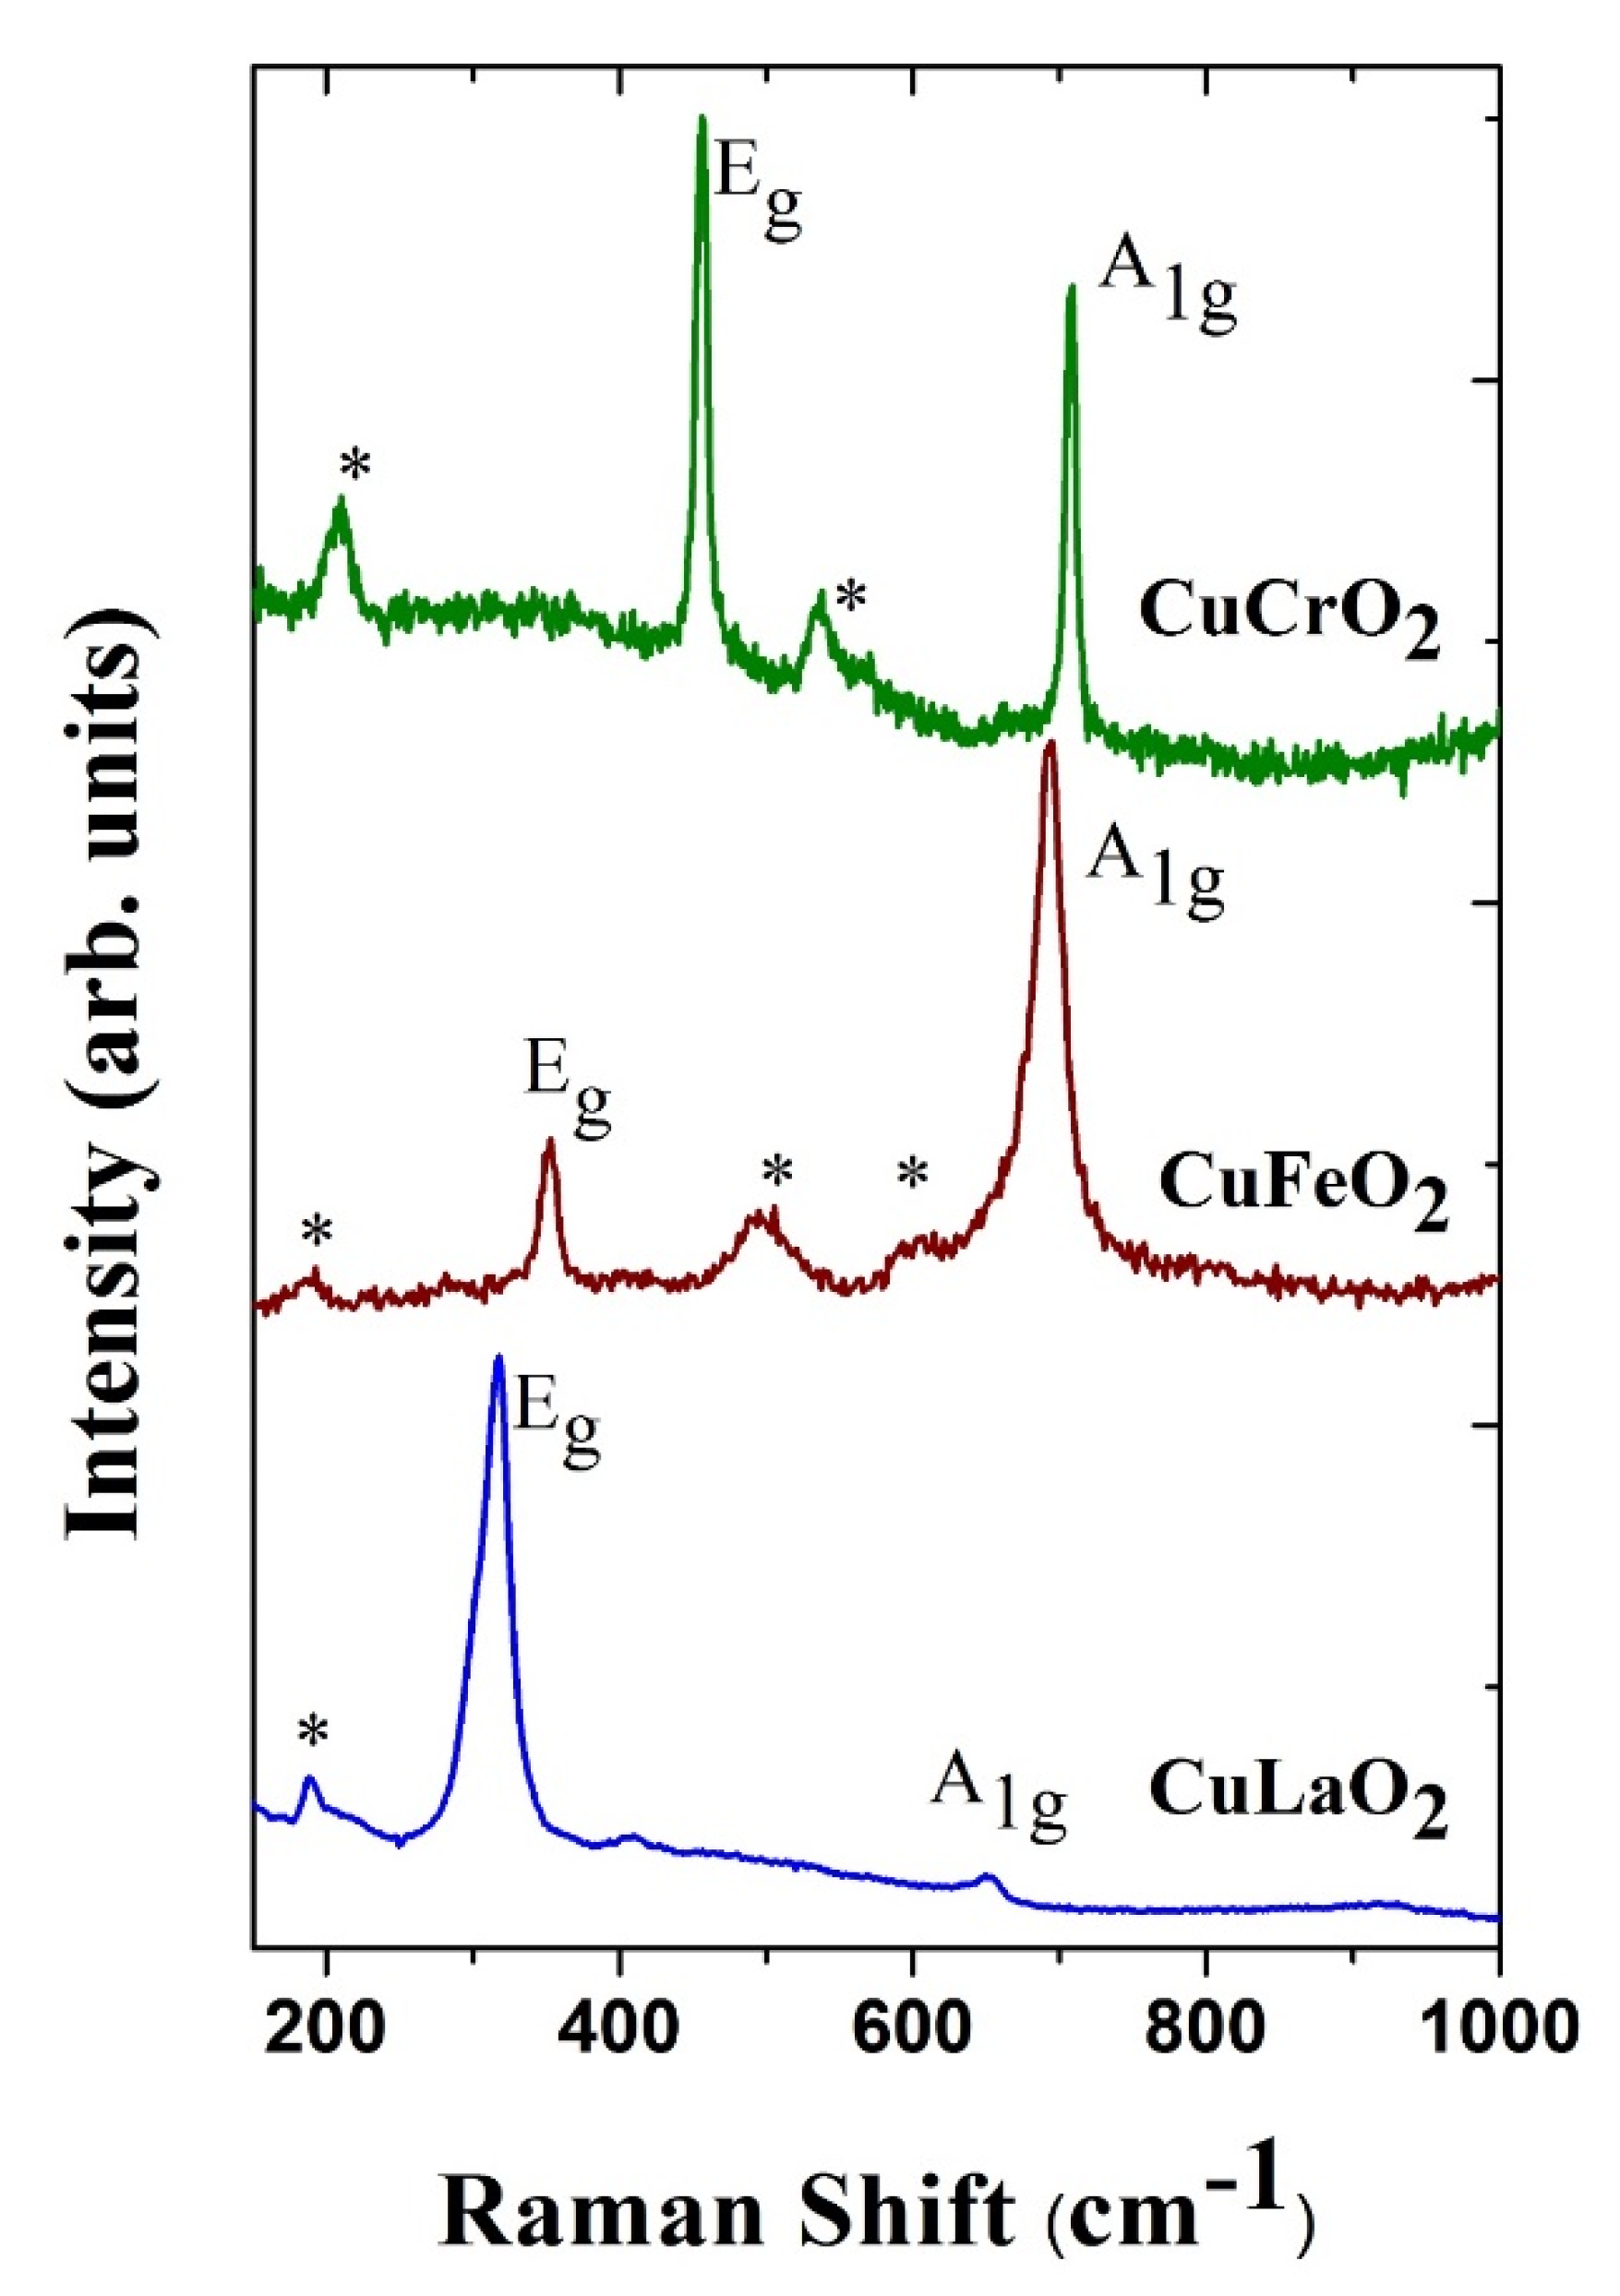
In Figure 3, we show the refined ambient XRD data on CuCrO2, CuFeO2 and CuLaO2 along with residuals while their Raman spectra are depicted in Figure 4. All the observed diffraction peaks could be fitted with rhombohedral symmetry, indicating the single phase formation of these compounds. Raman data of all three compounds have two prominent Raman modes along with a few disorder induced non-zone center modes. While the vibrations in the direction of Cu-O bonds along the c-axis are represented by A1g modes, vibrations in the direction perpendicular to c-axis correspond to Eg modes (Figure 2). As seen in Figure 4, both the frequencies in all three compounds shift to higher values as the ionic radii of trivalent cation decreases from La3+ to Cr3+ which is a consequence of lattice contraction due to decrease in B3+ ionic radii. Higher frequency modes are identified to be A1g and the lower frequency mode as Eg from ab-initio calculations [48] as well as polarized Raman measurements on single crystals [61]. In Table 2, we give ionic radii of various trivalent cations [62] along with lattice parameters and Raman frequencies of copper delafossites in rhombohedral symmetry [63,64,65,66,67]. There are various efforts to substitute trivalent cation and investigate the effect of chemical doping on structural and vibrational properties on delafossite systems. Depending on the ionic radii, there is a contraction or expansion of the lattice which results in increase/decrease in the frequency of the Raman modes, particularly the Eg modes which are highly sensitive to the ionic radii of the trivalent cation. In doped CuCrO2, the lattice parameters were found to vary according to Vegard’s law with broadening in the reflection due to local lattice distortion as a result of difference in ionic radii between Cr3+ and trivalent dopants [68]. The effect of scandium doping in CuCrO2 [69] and CuFeO2 [70] indicated the softening of both the modes. Temperature dependence of the two modes of CuFeO2 was found to decrease with increasing temperatures and the behavior was attributed to thermal expansion of the lattice and phonon–phonon interaction [71].
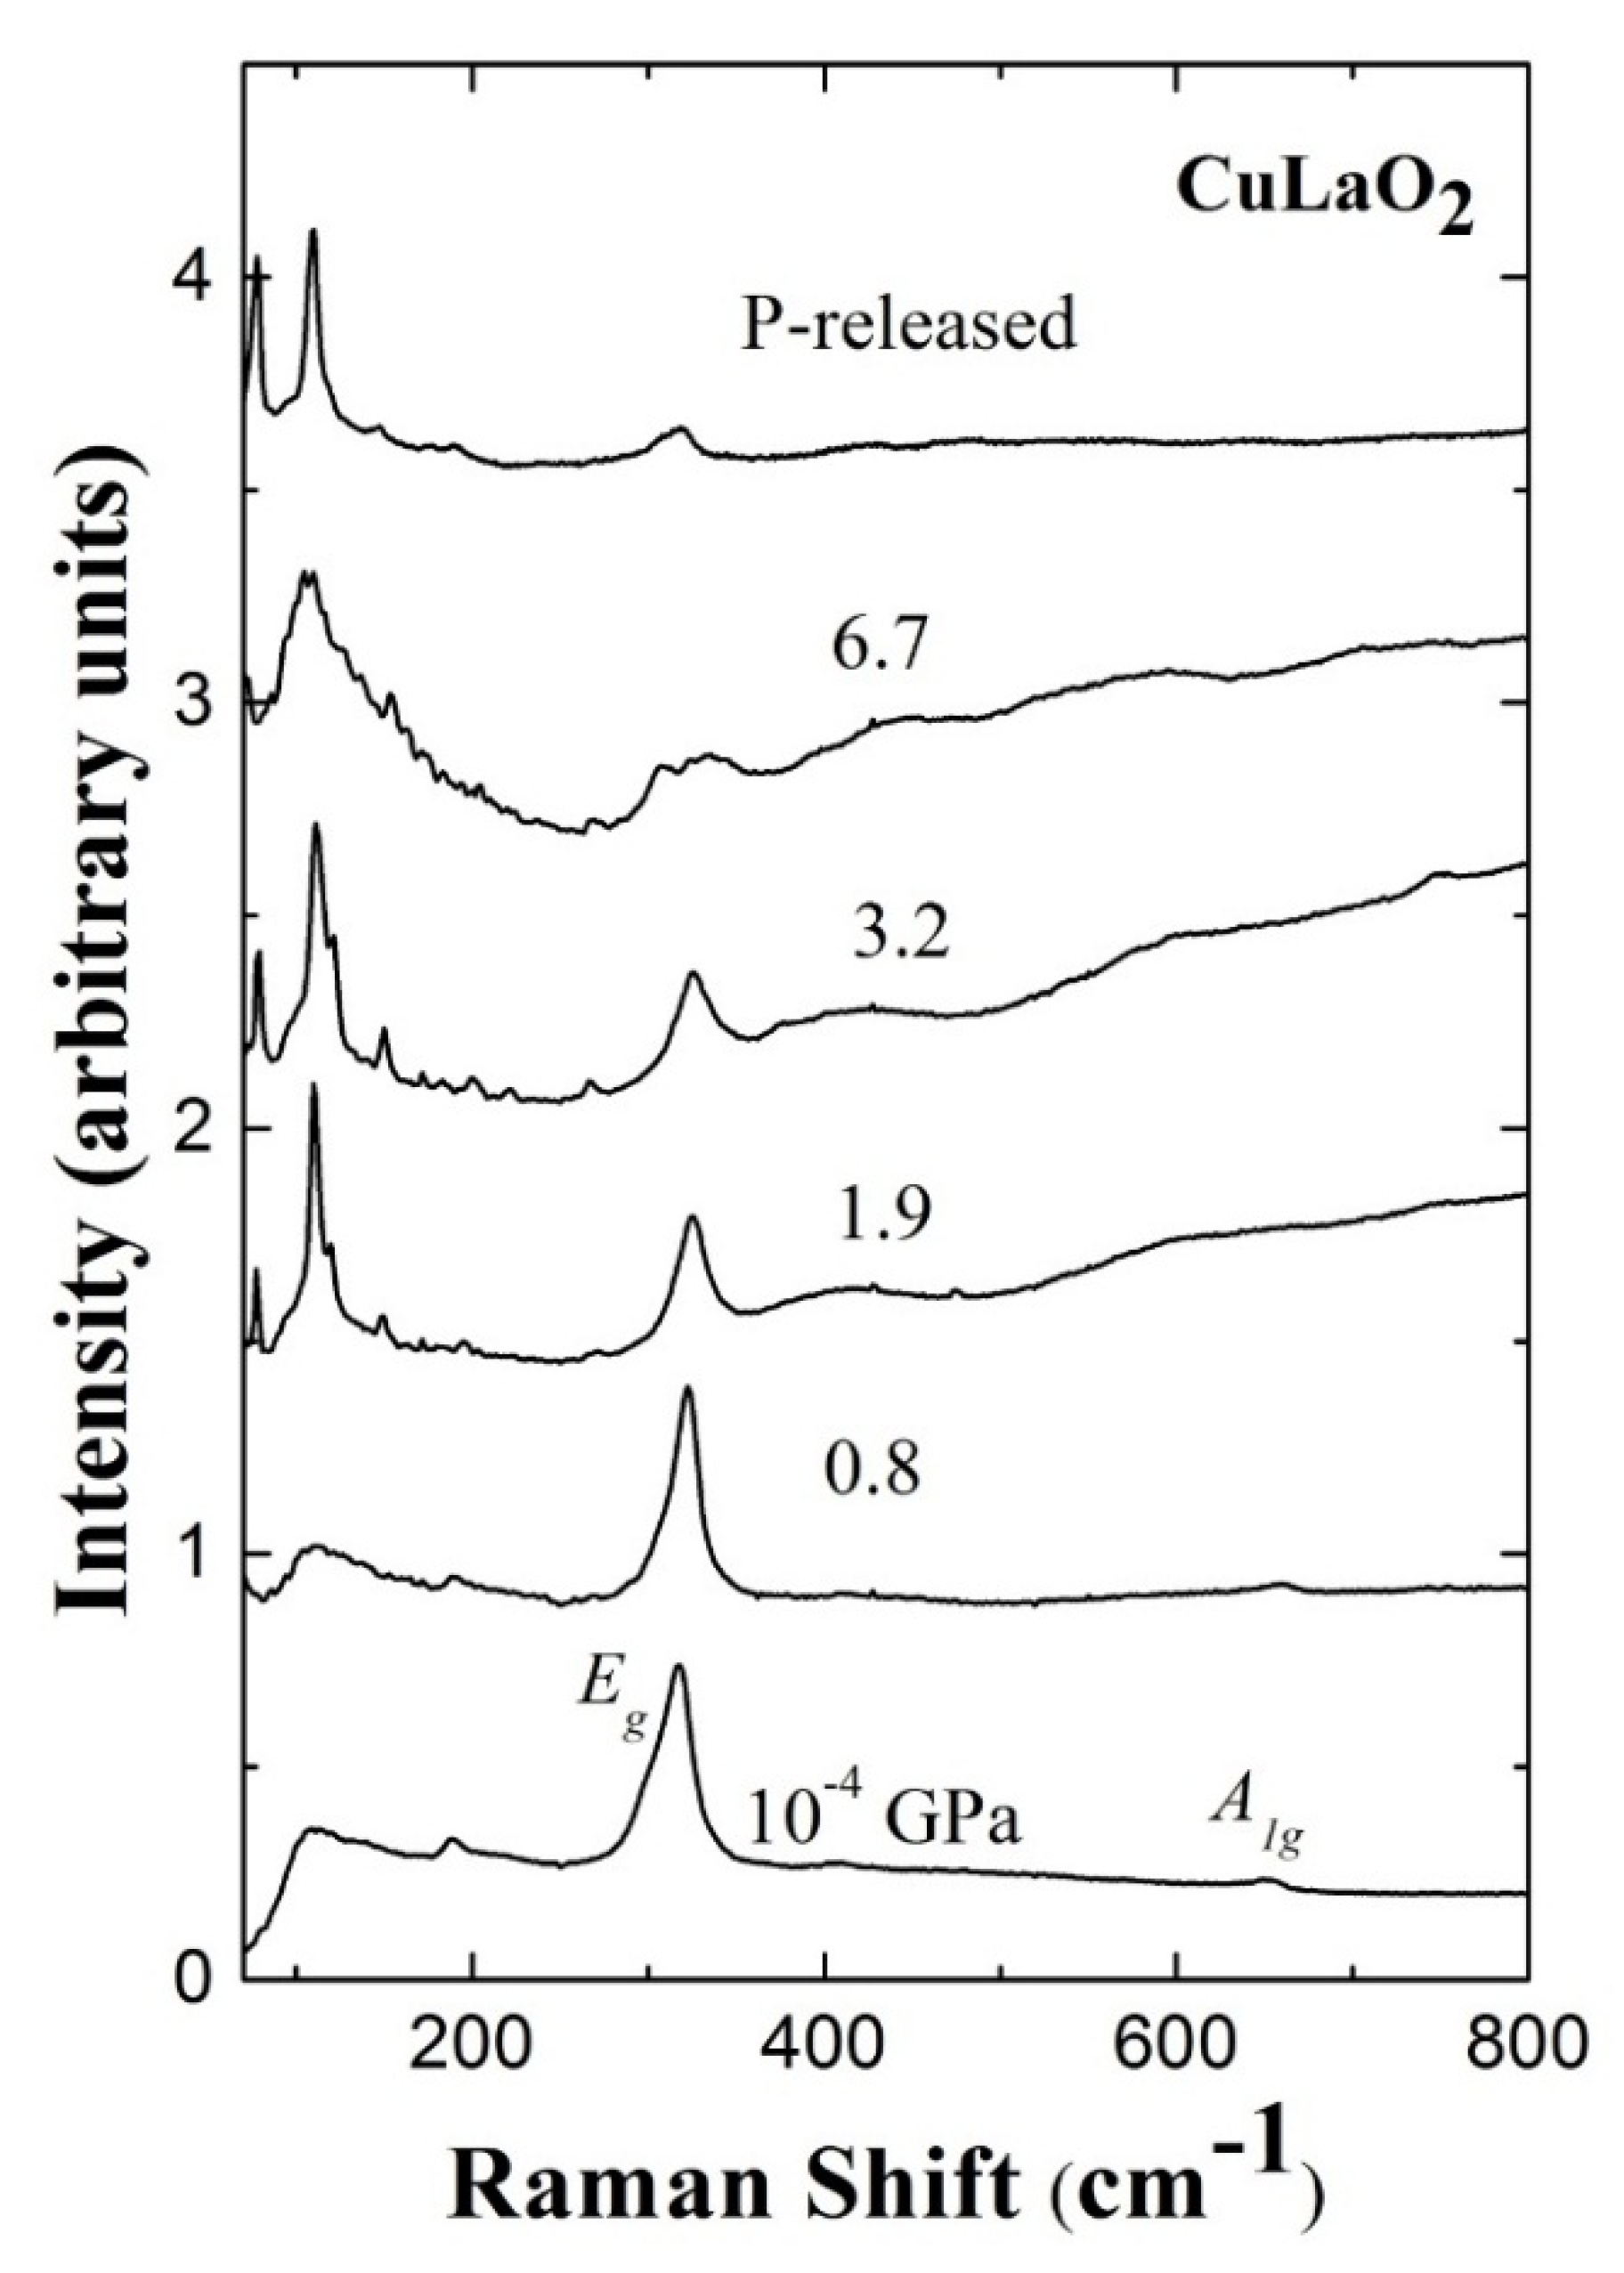
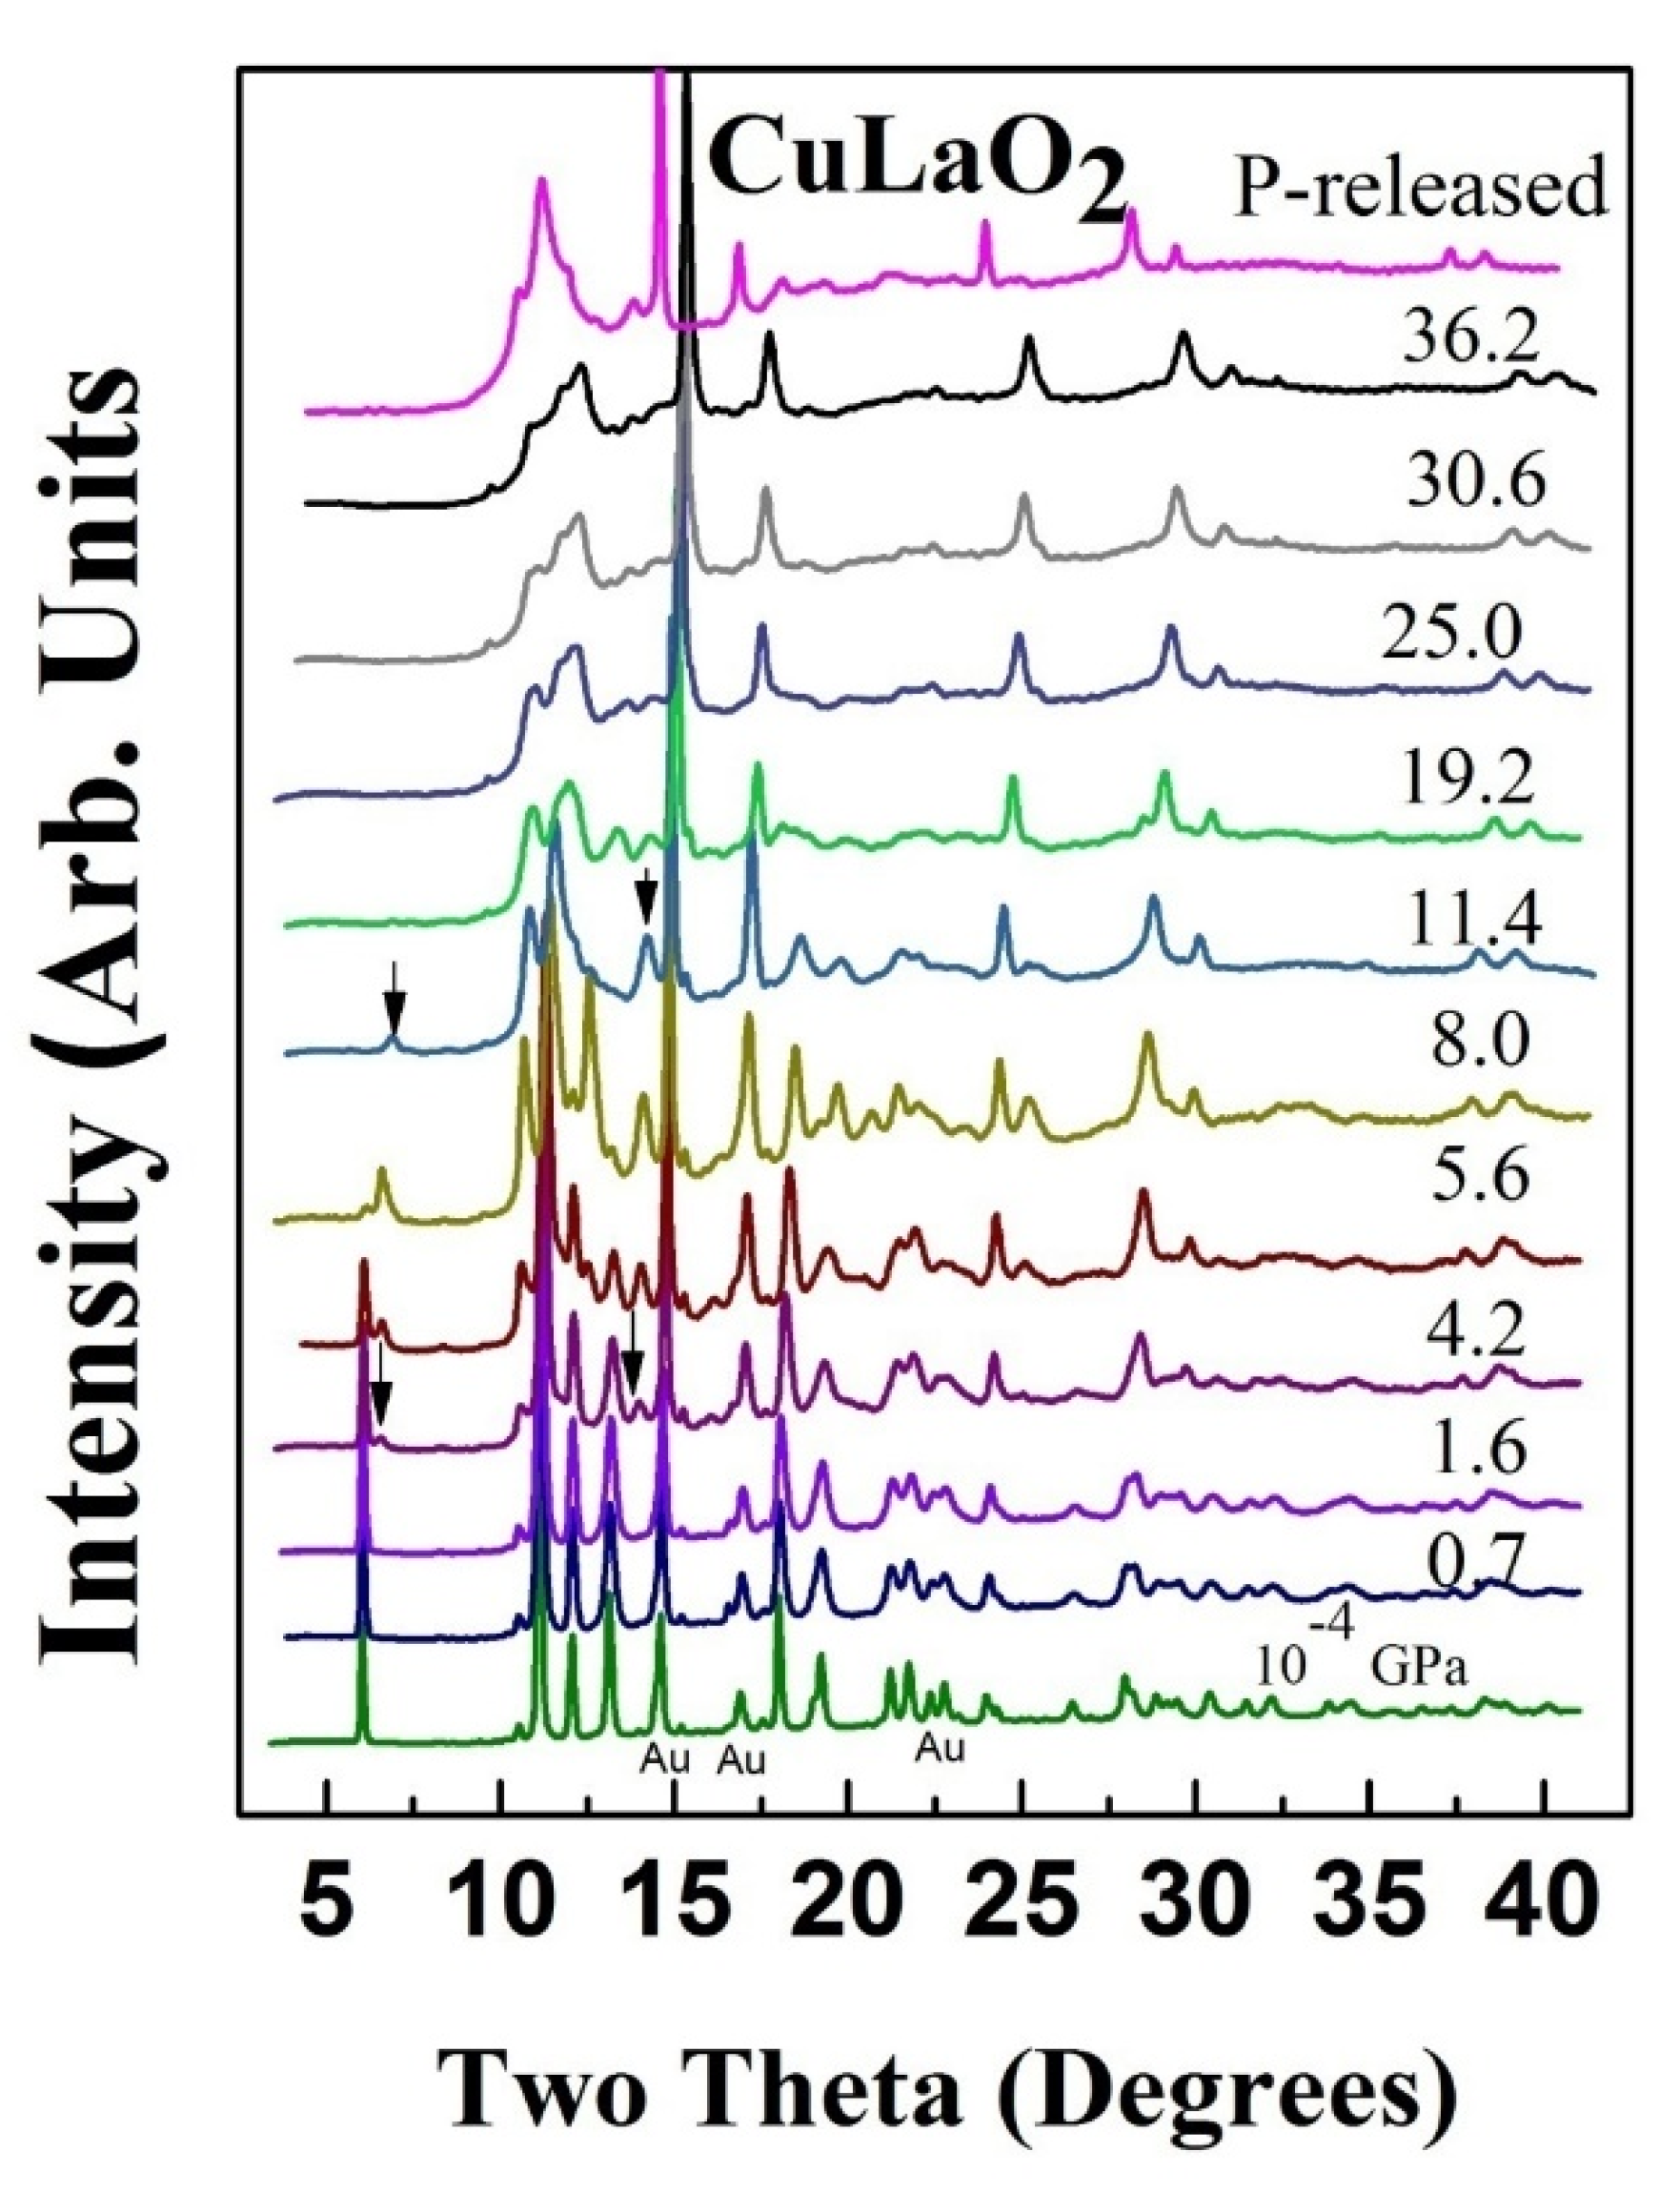
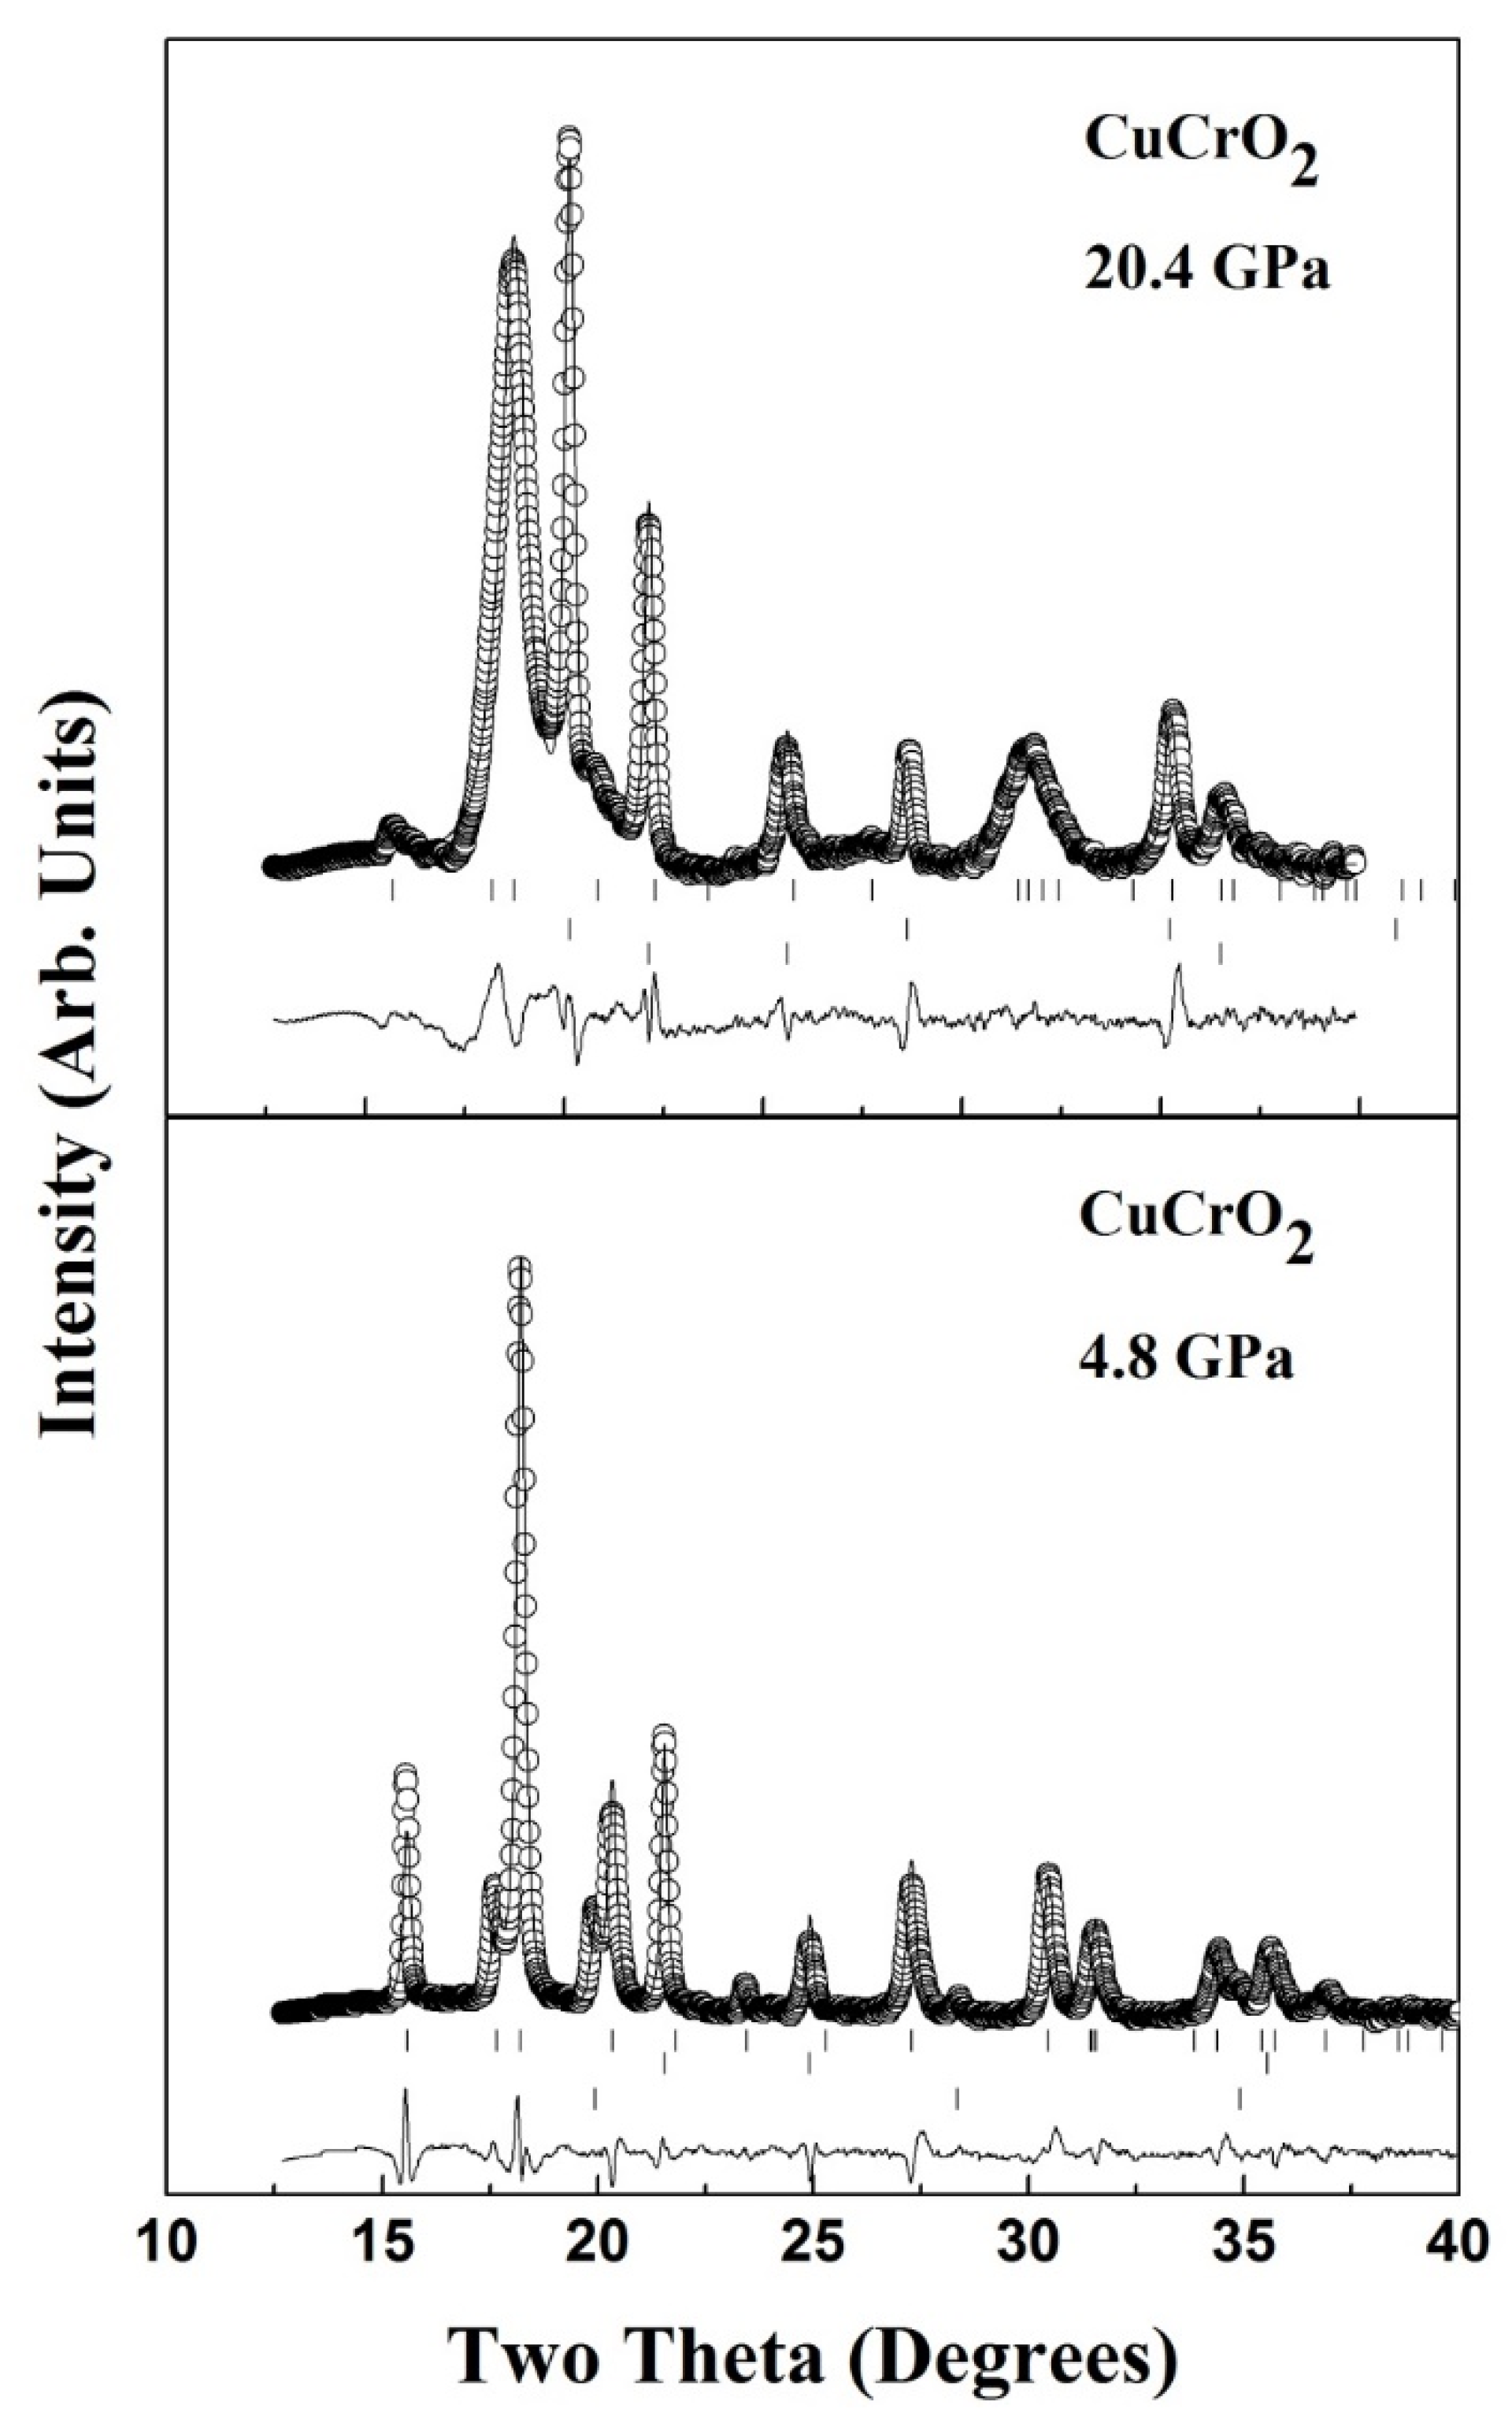
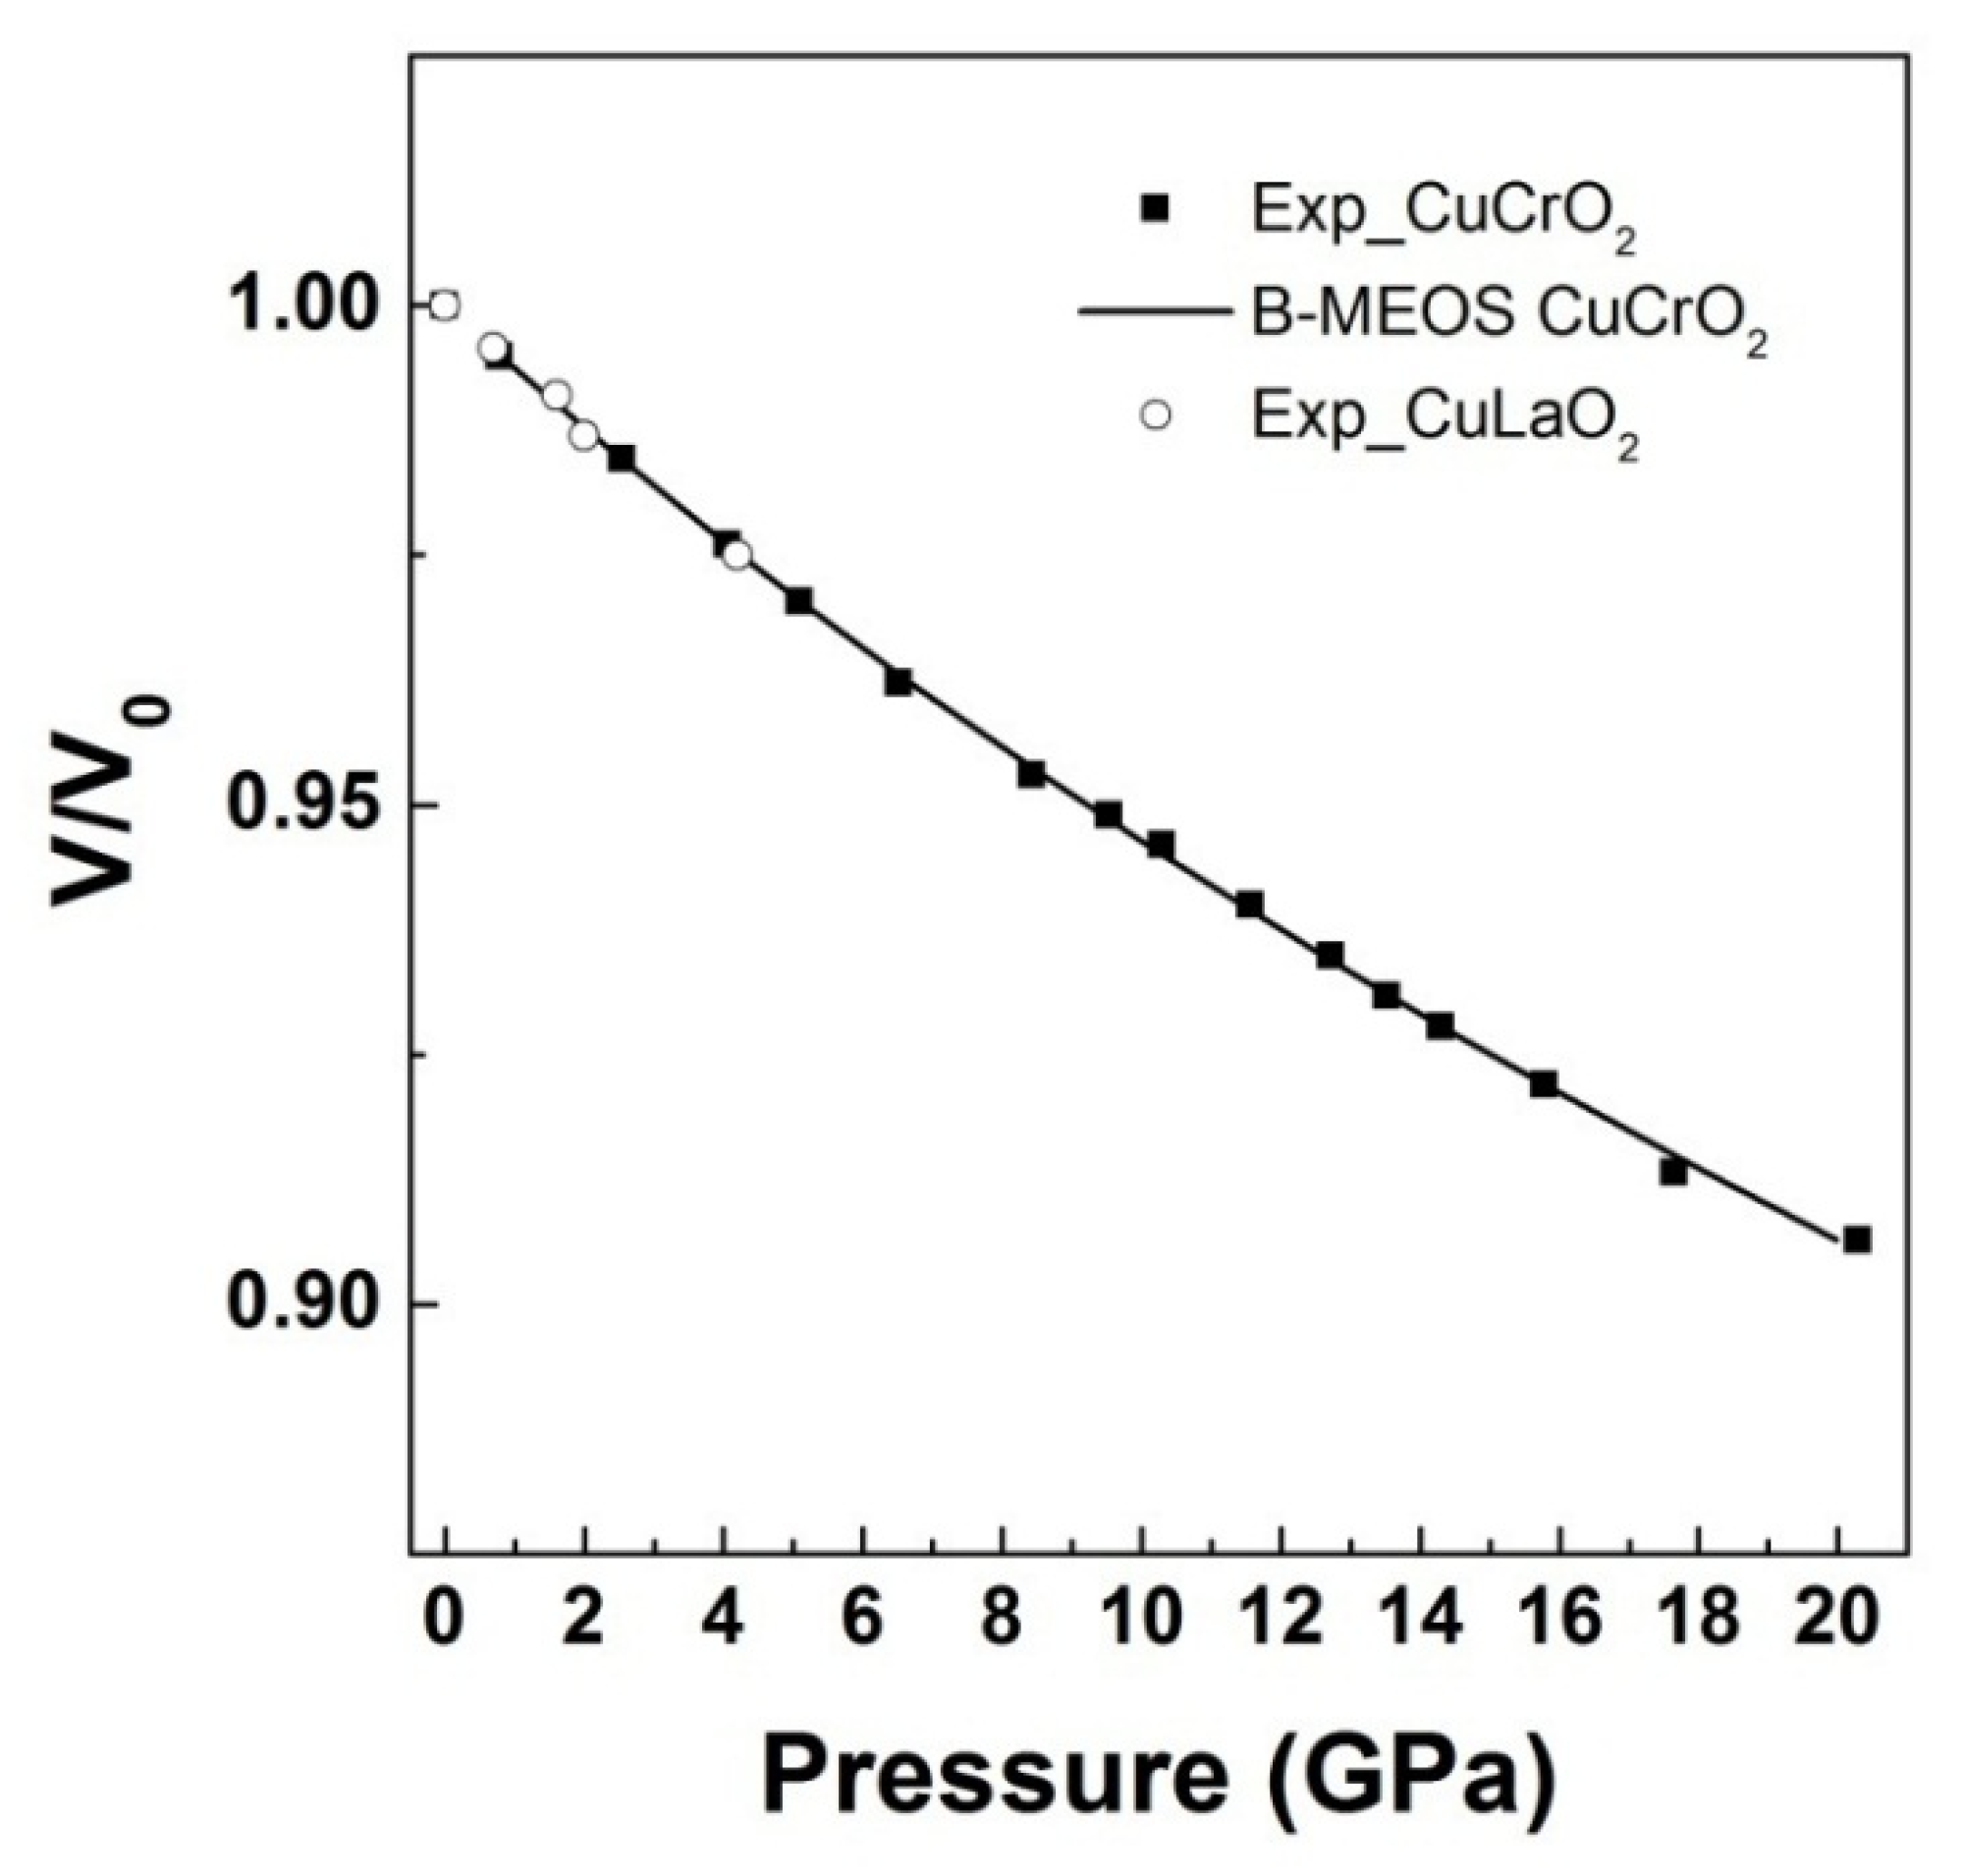
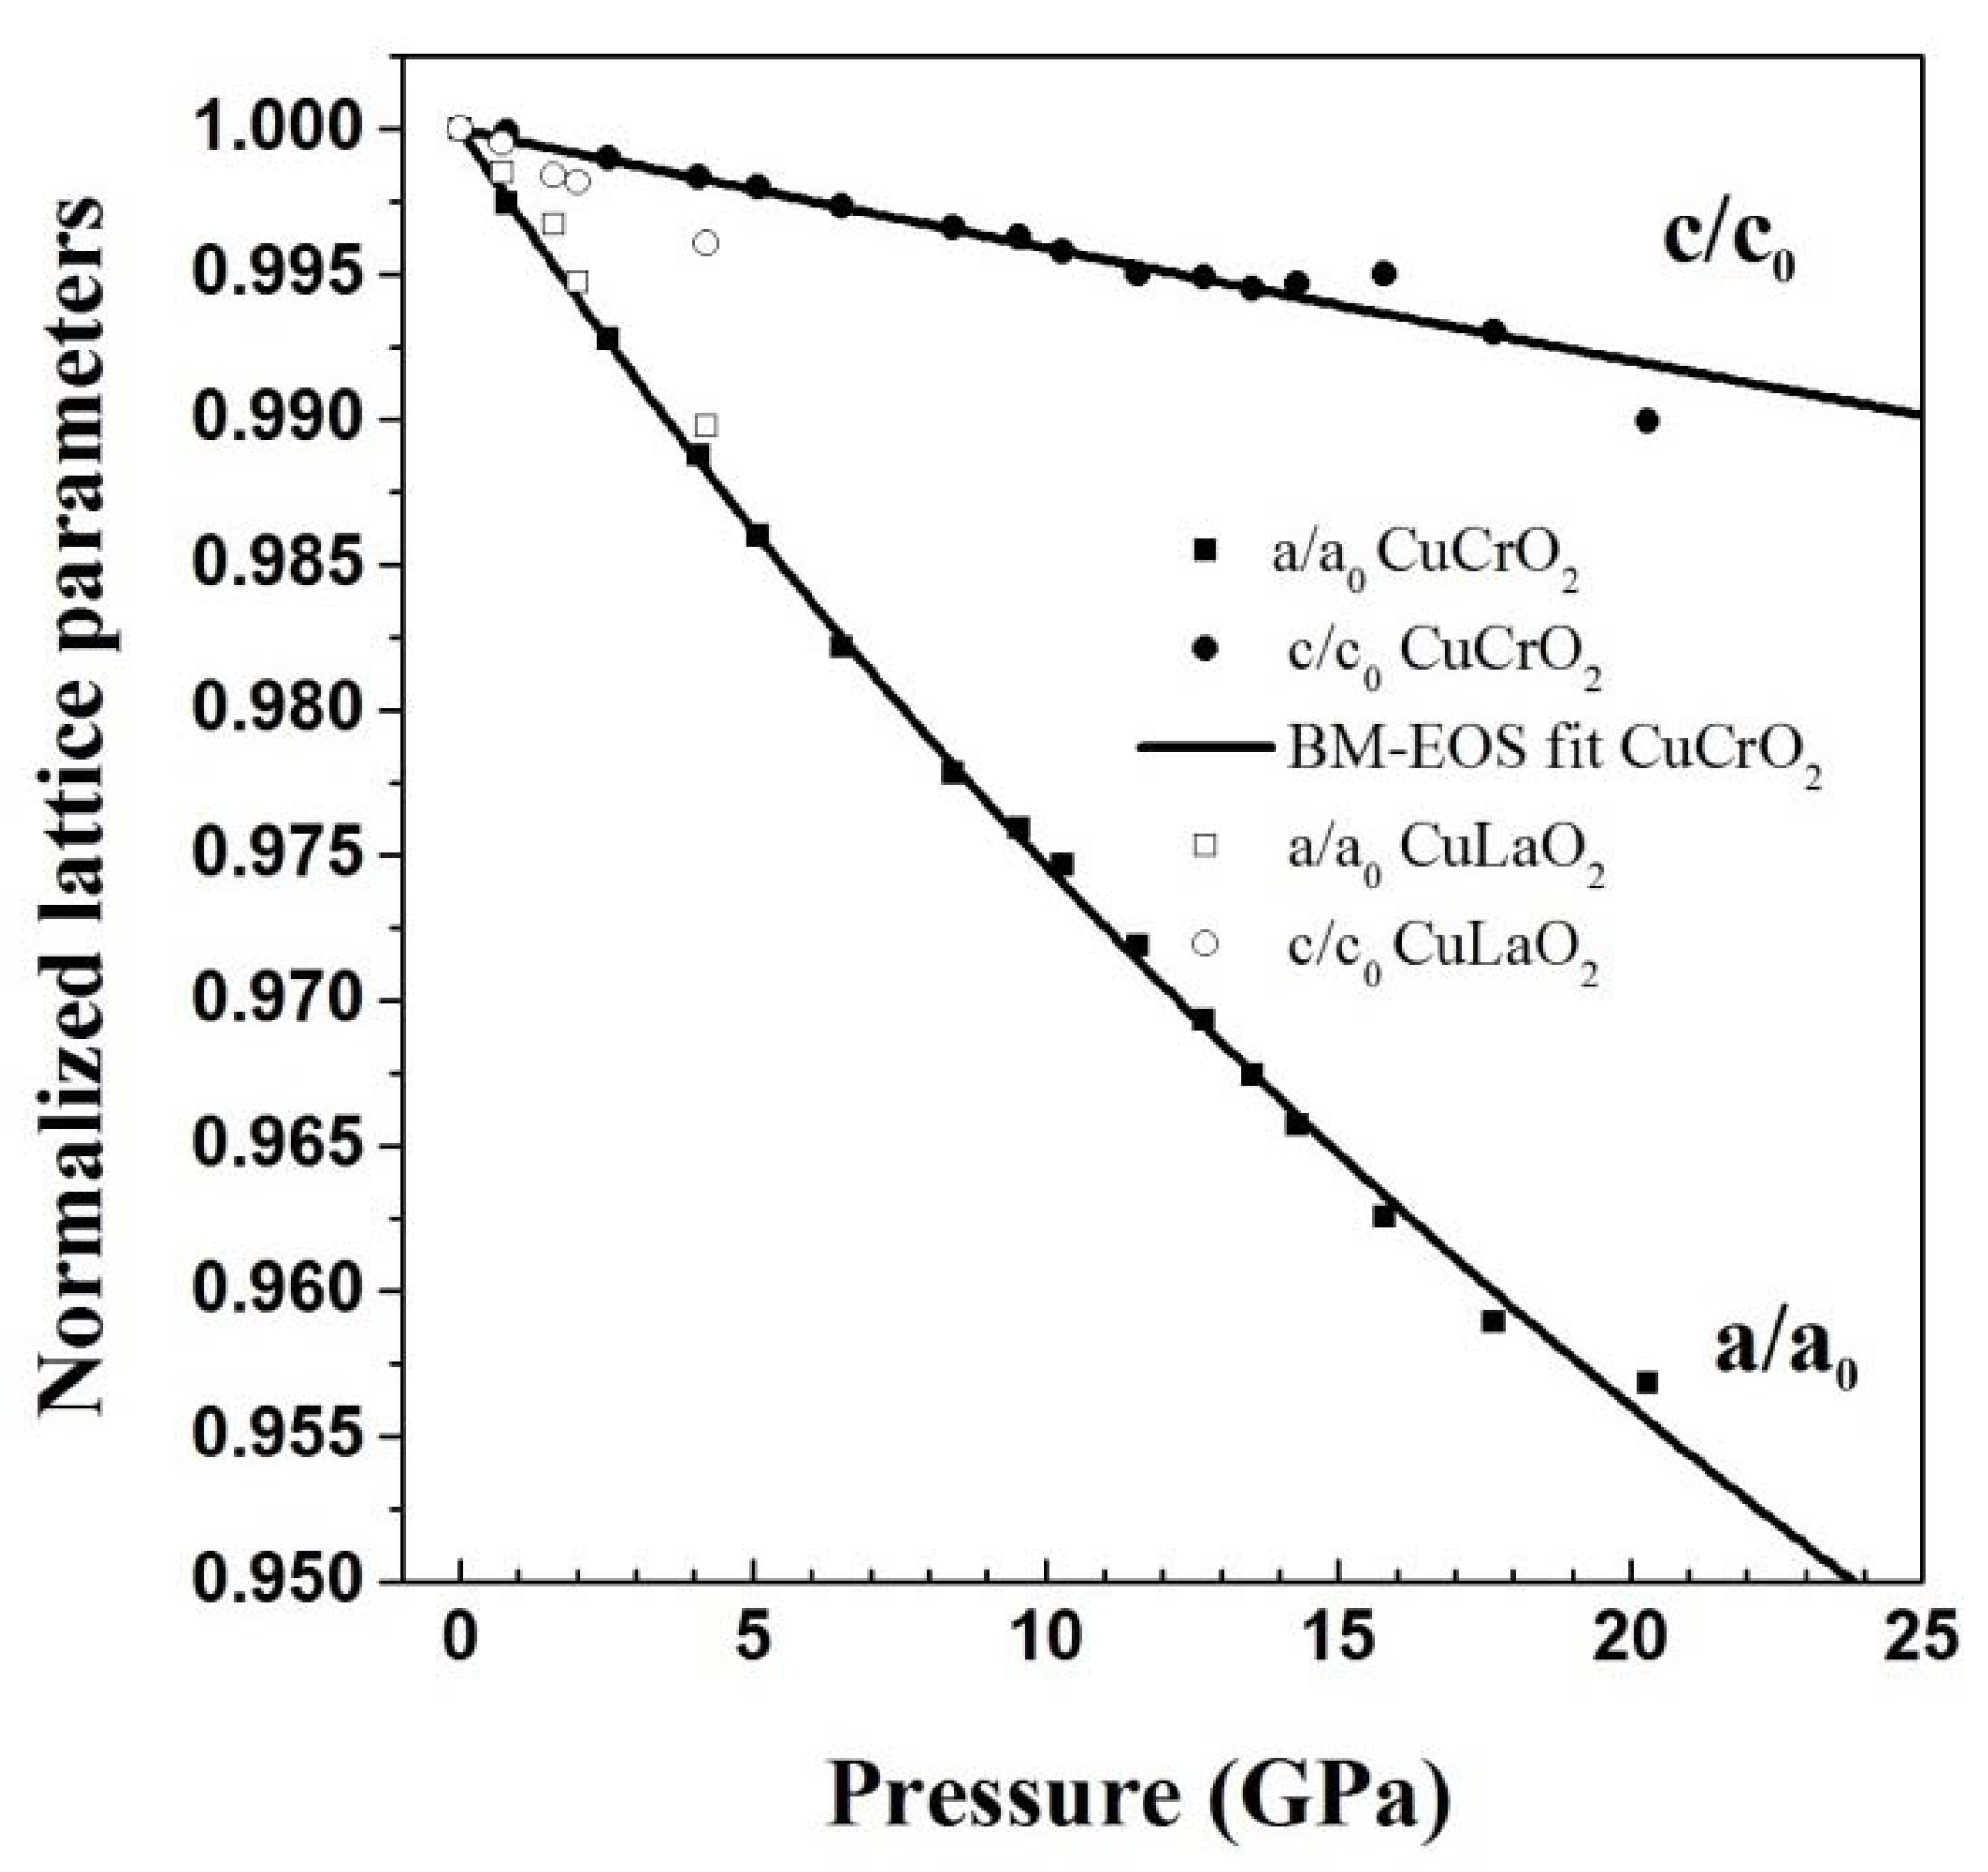
Figure 5 shows the high pressure Raman data on CuLaO2 which shows interesting sequence of phase transitions. Unlike other delafossites, structural transition in CuLaO2 takes place at a relatively low pressure of 1.8 GPa. Appearance of several new modes beyond 1.8 GPa indicates lower symmetry of the high-pressure phase. The nature of changes observed in the Raman spectra at 1.8 GPa are similar to CuAlO2 at 34 GPa [48]. Beyond 7 GPa, there is sudden loss of Raman intensity as the compound becomes opaque indicative of electronic/structure changes. The changes are irreversible from 8 GPa [72]. In Figure 6, pressure evolutions of XRD data of CuLaO2 up to 36 GPa are shown. Data at 0.7 and 1.6 GPa could be fitted with the ambient structure. However, data collected at 4.2 GPa shows appearance of a few peaks at 2θ = 6.6° and 13.8°. On further pressurization, these two peaks build up in intensity while the peak intensity from ambient structure reduces. Data collected beyond 8 GPa, shows disappearance of the peaks corresponding to the first HP phase along with clusters of new peaks with broadening. This is the same pressure region where there is a complete loss of Raman intensity. Possible reasons for loss of Raman intensity could be that the second high pressure phase is Raman inactive or the reduction in band gap across the transition which results in increase in absorption. Indeed, our electrical resistance measurements under high pressure show a considerable drop in the resistance, indicating a reduction in band gap [72]. Compressibility was found to be highly anisotropic and further investigation to identify the high pressure structure is in progress. Pressure evolution of XRD data on CuCrO2 (Figure 7) do not reveal any major changes in the data except for the shifting of diffraction peaks to higher angle, indicative of lattice compression. Refined pattern with residuals at two pressures are shown in Figure 8. Similar types of refinements were obtained for all the data points. High pressure Raman data on CuCrO2 shown in Figure 9 indicates usual pressure hardening of both modes up to 24.5 GPa however major changes are observed beyond 24.5 GPa with splitting of Eg mode and appearance of a new mode which softens with pressure and grows in intensity with further pressurization. At 31 GPa, the delafossite modes completely disappear with an intense broad mode at lower frequency [73]. The features in the Raman spectra are similar to that seen in lithium intercalated compound LiCoO2 [74] which crystallizes in closely related structure of layered rock salt. However, in our XRD measurements, we have not reached the pressures at which transition has been observed in Raman data. Experimental pressure volume data obtained by the Rietveld refinement [59] of XRD data for the low pressure phase when fitted to 3rd order Birch-Murnaghan equation of state results in ambient pressure bulk modulus as 154(25) and 156(2.8) GPa with their pressure derivative of bulk modulus as 4.8(0.5) and 5.3(0.5) for CuLaO2 and CuCrO2 respectively. It is to be noted here that bulk modulus and pressure derivative of bulk modulus are highly correlated [75]. In Figure 10 we show the normalized pressure volume data for CuCrO2 and CuLaO2. As one can see, the data of CuLaO2 almost overlaps with that of CuCrO2, indicating the similarity of bulk modulus of both compounds. Nearly same value of bulk modulus for the two compounds indicates that it is mainly the compression of Cu-O bonds which contribute to the overall compressibility of the compounds. Normalized a and c axis for CuCrO2 and CuLaO2 in the ambient pressure phase are plotted in Figure 11. One can clearly see an anisotropic compression of the axes in both the compounds. Interestingly, anisotropy in axial compressibility seems to be the only common feature of all the studied delafossites with a R-3m structure, which results in the regularization of oxygen octahedra around B atom which is slightly distorted at ambient conditions [54]. High pressure Raman measurements on single crystals of CuFeO2, shown in Figure 12a, could well reproduce the structural changes reported earlier [52]. While both the Raman modes harden under pressures up to 18 GPa, the first transition around 18 GPa to the reported monoclinic C2/c phase is indicated by splitting of the Eg mode. This is accompanied by softening of Ag mode thereafter [76]. Figure 12b shows the pressure dependence of mode frequencies. Rapid softening of the high frequency mode is understood as due to the change in Fe-O bond-length which ultimately results in change in copper coordination leading to the second high pressure phase transition above 23 GPa. Unlike in CuLaO2 and CuAlO2, there are no additional modes in the low frequency region (around 100 cm−1) in CuFeO2 across the transition. In Figure 13, we have summarized the bulk modulus of various copper delafossites where except for CuYO2 and CuInO2, the experimental values have been plotted. The high value of bulk modulus for CuAlO2 and CuGaO2 are expected because of the covalent nature of B-O bond in these compounds, however we need more accurate measurements on a few other compounds to establish an empirical relation for bulk modulus in ABO2 delafossites.
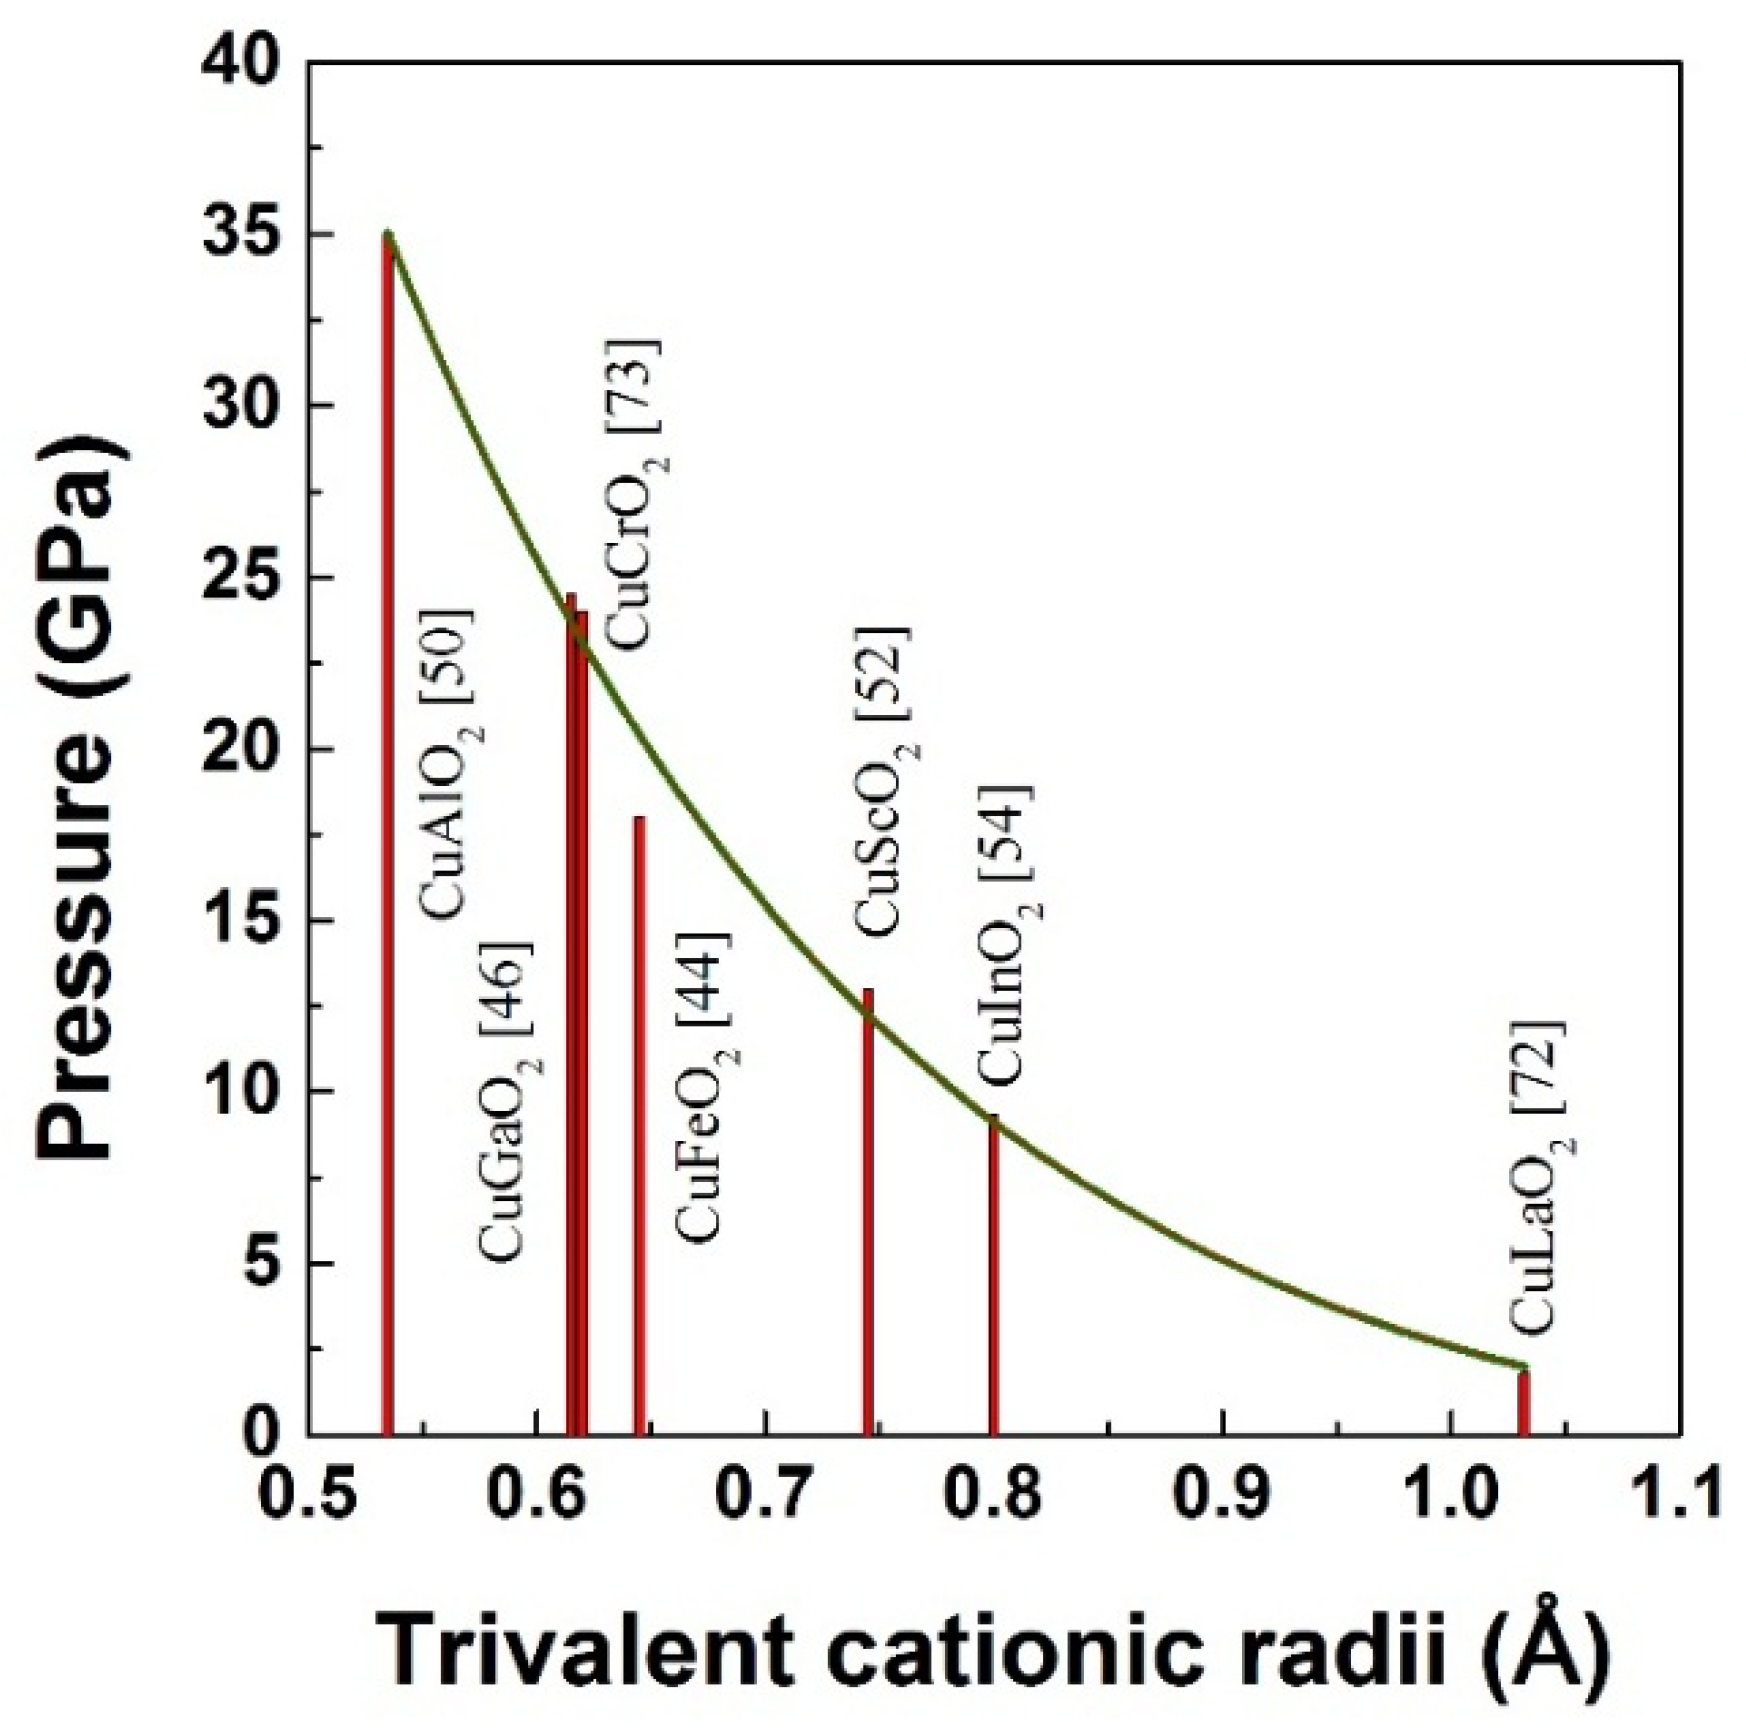
In Figure 14, we have plotted the trivalent ionic radii vs. transition pressure for available copper delafossites. Based on this data, we found following empirical relation between transition pressure and cationic radii.
where Y = transition pressure in GPa; Y0, A and R0 are constants with their numerical values as = −1.74, 430.73 and 4.6 respectively. X = trivalent cationic radii in Å. In spite of various elements at B site (transition metal, rare earth, group III), the transition pressure scaling systematically indicates that the size of the trivalent cation plays an important role in phase transition pressure in delafossites. Empirical relations have been proposed earlier in general for compounds containing different rare-earth ions with widely spaced radii [77] to predict transition pressures. In the present article, from the available data for delafossites, we have found a non-linear dependence of transition pressure with cationic radii, which is unusual. Only future high pressure studies on other delafossites can validate this empirical relationship.
Y = Y0 + A × exp(−R0 × X)
4. Summary
To summarize, we have reviewed the structural and vibrational properties of copper delafossites under high pressure. While there is a similarity between the high pressure vibrational behavior of CuGaO2, CuAlO2, CuLaO2 and CuFeO2, the high pressure behavior of CuCrO2 is quite different and unique, where an intense Raman mode appears in the high pressure phase which softens under pressure. Another feature common to all the delafossites investigated so far is the anisotropy in the compressibility of cell axes in the initial phase and the rapid increase in c/a ratio leading to structural phase transition. Surprisingly, in spite of having good quality synchrotron based XRD data, the structure of high pressure phase has only been reported for CuFeO2. Probably high quality single crystal X-ray diffraction data under high pressure may be helpful to get the structure of high pressure phase. Till now the high pressure studies are focused on copper based delafossites with rhombohedral symmetry, however delafossites with hexagonal symmetry have not yet been investigated, and hence systematic investigations on these compounds is required. Another area of research under high pressure is the effect of non-hydrostatic stresses [78] on the crystal structure and band gap of these materials which may result in synthesis of new metastable polymorph with improved properties. Doped delafossites with reduced band gap and increased conductivity can also be investigated under high pressure to obtain compounds with tailor made properties for specific applications.
Conflicts of Interest
The authors declare no conflicts of interest.
References
- Shannon, R.D.; Rogers, D.B.; Prewitt, C.T. Chemistry of noble metal oxides I. Syntheses and properties of ABO2 delafossite compounds. Inorg. Chem. 1971, 10, 713–718. [Google Scholar] [CrossRef]
- Dordor, P.; Chaminade, J.P.; Wichainchai, A.; Marquestaut, E.; Doumerc, J.P.; Pouchard, M.; Hagenmuller, P. Crystal growth and electrical properties of CuFeO2 single crystals. J. Solid State Chem. 1988, 75, 105–112. [Google Scholar] [CrossRef]
- Marquardt, M.A.; Ashmore, N.A.; Cann, D.P. Crystal chemistry and electrical properties of the delafossite structure. Thin Solid Films 2006, 496, 146–156. [Google Scholar] [CrossRef]
- Kawazoe, H.; Yasukawa, M.; Hyodo, H.; Kurita, M.; Yanagi, H.; Hosono, H. P-type electrical conduction in transparent thin films of CuAlO2. Nature 1997, 389, 939–942. [Google Scholar] [CrossRef]
- Mackenzie, A.P. The Properties of ultrapure delafossite metals. Rep. Prog. Phys. 2017, 80, 032501–032519. [Google Scholar] [CrossRef] [PubMed]
- Banerjee, A.N.; Chattopadhyay, K.K. Recent developments in the emerging field of crystalline p-type transparent conducting oxide thin films. Prog. Cryst. Growth Charact. Mater. 2005, 50, 52–105. [Google Scholar] [CrossRef]
- Walsh, A.; Da Silva, J.L.F.; Wei, S.-H. Multi-component transparent conducting oxides: Progress in materials modelling. J. Phys. Condens. Matter 2011, 23, 334210. [Google Scholar] [CrossRef] [PubMed]
- Sheng, S.; Fang, G.; Li, C.; Xu, S.; Zhao, X. P-type transparent conducting oxides. Phys. Status Solidi A 2006, 203, 1891–1900. [Google Scholar] [CrossRef]
- King, P.D.C.; Veal, T.D. Conductivity in transparent oxide semiconductors. J. Phys. Condens. Matter 2011, 23, 334214. [Google Scholar] [CrossRef] [PubMed] [Green Version]
- Yu, M.; Natu, G.; Ji, Z.; Wu, Y. P-type dye-sensitized solar cells based on delafossite CuGaO2 nanoplates with saturation photovoltages exceeding 460 mv. J. Phys. Chem. Lett. 2012, 3, 1074–1078. [Google Scholar] [CrossRef] [PubMed]
- Chae, G.J. A modified transparent conducting oxide for flat panel displays only. J. Appl. Phys. 2001, 40, 1282–1286. [Google Scholar] [CrossRef]
- Granqvist, C.G.; Azens, A.; Hjelm, A.; Kullman, L.; Niklasson, G.A.; Ronnow, D.; Mattsson, M.S.; Veszele, M.; Vaiva, G. Recent advances in electrochromics for smart windows applications. Sol. Energy 1998, 63, 199–276. [Google Scholar] [CrossRef]
- Diaz-Garcia, A.K.; Lana-Villarreal, T.; Gomez, R. Sol–gel copper chromium delafossite thin films as stable oxide photocathodes for water splitting. J. Mater. Chem. A 2015, 3, 19683–19687. [Google Scholar] [CrossRef] [Green Version]
- Gurunathan, K.; Baeg, J.O.; Lee, S.M.; Subramanian, E.; Moon, S.J.; Kong, K.J. Visible light assisted highly efficient hydrogen production from H2S decomposition by CuGaO2 and CuGa1−xInxO2 delafossite oxides bearing nanostructured co-catalysts. Catal. Commun. 2008, 9, 395–402. [Google Scholar] [CrossRef]
- Kykyneshi, R.; Nielsen, B.C.; Tate, J.; Li, J.; Sleight, A.W. Structural and transport properties of CuSc1−xMgxO2+ydelafossites. J. Appl. Phys. 2004, 96, 6188–6194. [Google Scholar] [CrossRef]
- Mazumder, N.; Sen, D.; Ghorai, U.K.; Roy, R.; Saha, S.; Das, N.S.; Chattopadhyay, K.K. Realizing direct gap, polytype, group IIIA delafossite: Ab initio forecast and experimental validation considering prototype CuAlO2. J. Phys. Chem. Lett. 2013, 4, 3539–3543. [Google Scholar] [CrossRef]
- Qiu, X.; Liu, M.; Sunada, K.; Miyauchi, M.; Hashimoto, K. A facile one-step hydrothermal synthesis of rhombohedral CuFeO2 crystals with antivirus property. Chem. Commun. 2012, 48, 7365–7367. [Google Scholar] [CrossRef] [PubMed]
- Dong, Y.; Cao, C.; Chui, Y.S.; Zapien, J.A. Facile hydrothermal synthesis of CuFeO2 hexagonal platelets/rings and graphene composites as anode materials for lithium ion batteries. Chem. Commun. 2014, 50, 10151–10154. [Google Scholar] [CrossRef] [PubMed]
- Patzsch, J.; Balog, I.; Krau, P.; Lehmann, C.W.; Schneider, J.J. Synthesis, characterization and p–n type gas sensing behaviour of CuFeO2delafossite type inorganic wires using Fe and Cu complexes as single source molecular precursors. RSC Adv. 2014, 4, 15348–15355. [Google Scholar] [CrossRef]
- Amrute, A.P.; Larrazabal, G.O.; Mondelli, C.; Perez-Ramirez, J. CuCrO2Delafossite: A stable copper catalyst for chlorine production. Angew. Chem. Int. Ed. 2013, 52, 9772–9775. [Google Scholar] [CrossRef] [PubMed]
- Ahmed, S.I.; Dalba, G.; Fornasini, P.; Vaccari, M.; Rocca, F.; Sanson, A.; Li, J.; Sleight, A.W. Negative thermal expansion in crystals with the delafossite structure: An extended X-ray absorption fine structure study of CuScO2 and CuLaO2. Phys. Rev. B 2009, 79, 104302. [Google Scholar] [CrossRef]
- Seki, S.; Onose, Y.; Tokura, Y. Spin-driven ferroelectricity in triangular lattice antiferromagnets ACrO2 (A = Cu, Ag, Li, or Na). Phys. Rev. Lett. 2008, 101, 067204. [Google Scholar] [CrossRef] [PubMed]
- Zhong, C.; Cao, H.; Fang, J.; Jiang, X.; Ji, X.; Dong, Z. Spin-lattice coupling and helical-spin driven ferroelectric polarization in multiferroic CuFeO2. Appl. Phys. Lett. 2010, 97, 094103. [Google Scholar] [CrossRef]
- Omata, T.; Nagatani, H.; Suzuki, I.; Kita, M.; Yanagi, H.; Ohashi, N. A new direct and narrow band gap oxide semiconductor applicable as a solar cell absorber. J. Am. Chem. Soc. 2014, 136, 3378–3381. [Google Scholar] [CrossRef] [PubMed]
- Liu, Y.; Gong, Y.; Mellott, N.P.; Wang, B.; Ye, H.; Wu, Y. Luminescence of delafossite-type CuAlO2 fibers with Eu substitution for Al cations. Sci. Technol. Adv. Mater. 2016, 17, 200–209. [Google Scholar] [CrossRef] [PubMed]
- Shi, L.; Wang, F.; Wang, Y.; Wang, D.; Zhao, B.; Zhang, L.; Zhao, D.; Shen, D. Photoluminescence and photocatalytic properties of rhombohedral CuGaO2 nanoplates. Sci. Rep. 2016, 6, 21135. [Google Scholar] [CrossRef] [PubMed]
- Yassin, O.A.; Alamri, S.N.; Joraid, A.A. Effect of particle size and laser power on the Raman spectra of CuAlO2 delafossite nanoparticles. J. Phys. D Appl. Phys. 2013, 46, 235301. [Google Scholar] [CrossRef]
- Ahmed, J.; Mao, Y. Delafossite CuAlO2 nanoparticles with electrocatalytic activity toward oxygen and hydrogen evolution reactions. In Nanomaterials for Sustainable Energy; ACS Symposium Series; American Chemical Society: Washington, DC, USA, 2015; Chapter 4; Volume 1213, pp. 57–72. [Google Scholar]
- Harada, T.; Fujiwara, K.; Tsukazaki, A. Highly conductive PdCoO2 ultrathin films for transparent electrodes. APL Mater. 2018, 6, 046107. [Google Scholar] [CrossRef]
- Deng, Z.; Fang, X.; Wu, S.; Dong, W.; Shao, J.; Wang, S.; Lei, M. The morphologies and optoelectronic properties of delafossite CuFeO2 thin films prepared by PEG assisted. J. Sol-Gel Sci. Technol. 2014, 71, 297–302. [Google Scholar] [CrossRef]
- Sinnarasa, I.; Thimont, Y.; Presmanes, L.; Barnabé, A.; Tailhades, P. Thermoelectric and transport properties of delafossite CuCrO2:Mg thin films prepared by RF magnetron sputtering. Nanomaterials 2017, 7, 157. [Google Scholar] [CrossRef] [PubMed]
- Barnabe, A.; Thimont, Y.; Lalanne, M.; Presmanes, L.; Tailhades, P. P-type conducting transparent characteristics of delafossite Mg-doped CuCrO2 thin films prepared by RF-sputtering. J. Mater. Chem. C 2015, 3, 6012–6024. [Google Scholar] [CrossRef] [Green Version]
- Errandonea, D. Exploring the properties of MTO4 compounds using high-pressure powder X-ray diffraction. Cryst. Res. Technol. 2015, 50, 729–736. [Google Scholar] [CrossRef]
- Errandonea, D.; Ruiz-Fuertes, A. Brief review of the effects of pressure on wolframite-type oxides. Crystals 2018, 8, 71. [Google Scholar] [CrossRef]
- Hasegawa, M.; Tanaka, M.; Yagi, T.; Takei, H.; Inoue, A. Compression behavior of the delafossite-type metallic oxide PdCoO2 below 10 GPa. Solid State Commun. 2003, 128, 303–307. [Google Scholar] [CrossRef]
- Sheets, W.C.; Mugnier, E.; Barnabe, A.; Marks, T.J.; Poeppelmeier, K.R. Hydrothermal synthesis of delafossite-type oxides. Chem. Mater. 2006, 18, 7–20. [Google Scholar] [CrossRef]
- Kumar, S.; Miclau, M.; Christine, M. Hydrothermal synthesis of AgCrO2 delafossite in supercritical water: A new single-step process. Chem. Mater. 2013, 25, 2083–2088. [Google Scholar] [CrossRef]
- Jin, Y.; Chuamanov, G. Solution synthesis of pure 2H CuFeO2 at low temperatures. RSC Adv. 2016, 6, 26392–26397. [Google Scholar] [CrossRef]
- Effenberger, H. Structure of Hexagonal Copper(I) Ferrite. Acta Crystallogr. Sect. C Cryst. Struct. Commun. 1991, 47, 2644–2646. [Google Scholar] [CrossRef]
- Godinho, K.G.; Morgan, B.J.; Allen, J.P.; Scanlon, D.O.; Watson, G.W. Chemical bonding in copper-based transparent conducting oxides: CuMO2 (M = In, Ga, Sc). J. Phys. Condens. Matter 2011, 23, 334201. [Google Scholar] [CrossRef] [PubMed]
- Rousseau, D.L.; Bauman, R.P.; Porto, S.P.S. Normal mode determination in crystals. J. Raman Spectrosc. 1981, 10, 253–290. [Google Scholar] [CrossRef]
- Zhao, T.R. X-ray diffraction study of copper iron oxide [CuFeO2] under pressures up to 10 GPa. Mater. Res. Bull. 1997, 32, 151–157. [Google Scholar] [CrossRef]
- Birch, F. Finite strain isotherm and velocities for single-crystal and polycrystalline NaCl at high pressures and 300° K. J. Geophys. Res. Solid Earth 1978, 83, 1257–1268. [Google Scholar] [CrossRef]
- Xu, W.M.; Rozenberg, G.K.; Pasternak, M.P.; Kertzer, M.; Kurnosov, A.; Dubrovinsky, L.S.; Pascarelli, S.; Munoz, M.; Vaccari, M.; Hanfland, M.; et al. Pressure-induced Fe-Cu cationic valence exchange and its structural consequences: High-pressure studies of delafossite CuFeO2. Phys. Rev. B 2010, 81, 104110. [Google Scholar] [CrossRef]
- Terada, N.; Osakabe, T.; Kitazawa, H. High-pressure suppression of long range magnetic order in the triangular lattice antiferromagnet CuFeO2. Phys. Rev. B 2010, 83, 020403. [Google Scholar] [CrossRef]
- Pellicer-Porres, J.; Segura, A.; Ferrer-Roca, C.; MartıiNez-Garcıi, A.D.; Sans, J.A.; MartıiNez, E.; Itie, J.P.; Polian, A.; Baudelet, F.; Munoz, A.; et al. Structural evolution of the CuGaO2 delafossite under high pressure. Phys. Rev. B 2004, 69, 024109. [Google Scholar] [CrossRef]
- Pellicer-Porres, J.; Segura, A.; Martínez, E.; Saitta, A.M.; Polian, A.; Chervin, J.C.; Canny, B. Vibrational properties of delafossite CuGaO2 at ambient and high pressure. Phys. Rev. B 2005, 72, 064301. [Google Scholar] [CrossRef]
- Pellicer-Porres, J.; Martínez-García, D.; Segura, A.; Rodríguez-Hernández, P.; Muñoz, A.; Chervin, J.C.; Garro, N.; Kim, D. Pressure and temperature dependence of the lattice dynamics of CuAlO2 investigated by Raman scattering experiments and ab initiocalculations. Phys. Rev. B 2006, 74, 184301. [Google Scholar] [CrossRef]
- Liu, Q.J.; Liu, Z.T.; Feng, L.P.; Tian, H.; Liu, W.T.; Yan, F. Density functional theory study of 3r–and 2h–CuAlO2 under pressure. Appl. Phys. Lett. 2010, 97, 141917. [Google Scholar] [CrossRef]
- Pellicer-Porres, J.; Segura, A.; Ferrer-Roca, C.; Polian, A.; Munsch, P.; Kim, D. XRD and XAS structural study of CuAlO2 under high pressure. J. Phys. Condens. Matter 2013, 25, 115406. [Google Scholar] [CrossRef] [PubMed]
- Nakanishi, A.; Katayama-Yoshida, H. Pressure-induced structural transition and enhancement of energy gap of CuAlO2. J. Phys. Soc. Jpn. 2011, 80, 024706. [Google Scholar] [CrossRef]
- Gilliland, S.; Pellicer-Porres, J.; Segura, A.; Muñoz, A.; Rodríguez-Hernández, P.; Kim, D.; Lee, M.S.; Kim, T.Y. Electronic structure of CuAlO2 and CuScO2delafossites under pressure. Phys. Status Solidi B 2007, 244, 309–314. [Google Scholar] [CrossRef]
- Nie, X.; Su-Huai, W.; Zhang, S.B. Bipolar doping and band-gap anomalies in delafossite transparent conductive oxides. Phys. Rev. Lett. 2002, 88, 066405. [Google Scholar] [CrossRef] [PubMed]
- Liu, W.; Liu, Q.; Liu, Z.-T. First principles studies of structural, mechanical, electronic, optical properties and pressure-induced phase transition of CuInO2 polymorph. Physica B 2012, 407, 4665–4670. [Google Scholar] [CrossRef]
- Jayalakshmi, V.; Murugan, R.; Palanivel, B. Electronic and structural properties of CuMO2 (M = Al, Ga, In). J. Alloy. Compd. 2005, 388, 19–22. [Google Scholar] [CrossRef]
- Aoyama, T.; Miyake, A.; Kagayama, T.; Shimizu, K.; Tsuyoshi, K. Pressure effects on the magnetoelectric properties of a multiferroic triangular-lattice antiferromagnet CuCrO2. Phys. Rev. B 2013, 87, 094401. [Google Scholar] [CrossRef]
- Piermarini, G.J.; Block, S.; Barnett, J.D. Hydrostatic limits in liquids and solids to 100 kbar. J. Appl. Phys. 1973, 44, 5377–5382. [Google Scholar] [CrossRef]
- Carter, W.T.; Marsh, S.P.; Fritz, J.N.; McQueen, R.G. Accurate Characterization of the High Pressure Environment; Lloyd, E.C., Ed.; NBS Special Pub.: Washington, DC, USA, 1971; Volume 326, p. 147. [Google Scholar]
- Larson, A.C.; Von Dreele, R.B. GSAS: General Structure Analysis System; Report LAUR 86-748; Los Alamos National Laboratory: Los Alamos, NM, USA, 2000. [Google Scholar]
- Petrenko, O.A.; Balakrishnan, G.; Lees, M.R.; Paul, D.M.; Hoser, A. High-magnetic-field behavior of the triangular-lattice antiferromagnet CuFeO2. Phys. Rev. B 2000, 62, 8983. [Google Scholar] [CrossRef]
- Aktas, O.; Truong, K.D.; Otani, T.; Balakrishnan, G.; Clouter, M.J.; Kimura, T.; Quirion, G. Raman scattering study of delafossite magnetoelectric multiferroic compounds: CuFeO2 and CuCrO2. J. Phys. Condens. Matter. 2012, 24, 036003. [Google Scholar] [CrossRef] [PubMed]
- Shannon, R.D. Revised effective ionic radii and systematic studies of interatomic distances in halides and chalcogenides. Acta Cryst. A 1976, 32, 751–767. [Google Scholar] [CrossRef] [Green Version]
- Miyasaka, N.; Doi, Y.; Hinatsu, Y. Synthesis and magnetic properties of ALnO2 (A =Cu or Ag; Ln = rare earths) with the delafossite structure. J. Solid State Chem. 2009, 182, 2104–2110. [Google Scholar] [CrossRef]
- Cheng, C.; Lv, Z.L.; Cheng, Y.; Ji, G.F. Structural, elastic and electronic properties of CuYO2 from first-principles study. J. Alloy. Compd. 2014, 603, 183–189. [Google Scholar] [CrossRef]
- Shimode, M.; Sasaki, M.; Mukaida, K. Synthesis of the delafossite-type CuInO2. J. Solid State Chem. 2000, 151, 16–20. [Google Scholar] [CrossRef]
- Li, J.; Yokochi, A.F.T.; Sleight, A.W. Oxygen intercalation of two polymorphs of CuScO2. Solid State Sci. 2004, 6, 831–839. [Google Scholar] [CrossRef]
- Poienar, M.; Hardy, V.; Kundys, B.; Singh, K.; Maignan, A.; Damay, F.; Martin, C. Revisiting the properties of delafossite CuCrO2: A single crystal study. J. Solid State Chem. 2012, 185, 56–61. [Google Scholar] [CrossRef]
- Elkhouni, T.; Amami, M.; Hlil, E.K.; Salah, A.B. The structural, anisotropic magnetization, and spectroscopic study of delafossite CuCr1−xMxO2 systems. J. Supercond. Nov. Magn. 2015, 28, 1895–1903. [Google Scholar] [CrossRef]
- Elkhouni, T.; Amami, M.; Strobel, P.; Salah, A.B. Structural and magnetic properties of substituted delafossite-type oxides CuCr1−xScxO2. World J. Condens. Matter Phys. 2013, 3, 1–8. [Google Scholar] [CrossRef]
- Elkhoun, T.; Amami, M.; Hlil, E.K.; Salah, A.B. Effect of Spin dilution on the magnetic state of delafossite CuFeO2 with an S = 5/2 antiferromagnetic triangular sublattice. J. Supercond. Novel Magn. 2015, 28, 1439–1447. [Google Scholar] [CrossRef]
- Pavunny, S.P.; Kumar, A.; Katiyar, R.S. Raman spectroscopy and field emission characterization of delafossite CuFeO2. J. Appl. Phys. 2010, 107, 013522. [Google Scholar] [CrossRef]
- Salke, N.P.; Garg, A.B.; Rao, R.; Achary, S.N.; Gupta, M.K.; Mittal, R.; Tyagi, A.K. Phase transitions in delafossite CuLaO2 at high pressures. J. Appl. Phys. 2014, 115, 133507. [Google Scholar] [CrossRef]
- Garg, A.B.; Mishra, A.K.; Pandey, K.K.; Sharma, S.M. Multiferroic CuCrO2under high pressure: In situ X-ray diffraction and Raman spectroscopic studies. J. Appl. Phys. 2014, 116, 133514. [Google Scholar] [CrossRef]
- Inaba, M.; Iriyama, Y.; Ogumi, Z.; Todzuka, Y.; Tasaka, A. Raman study of layered rock-salt LiCoO2 and its electrochemical lithium deintercalation. J. Raman Spectrosc. 1997, 28, 613–617. [Google Scholar] [CrossRef]
- Gomis, O.; Lavina, B.; Rodríguez-Hernández, P.; Muñoz, A.; Errandonea, R.; Errandonea, D.; Bettinelli, M. High-pressure structural, elastic, and thermodynamic properties of zircon-type HoPO4 and TmPO4. J. Phys. Condens. Matter 2017, 29, 095401. [Google Scholar] [CrossRef] [PubMed]
- Salke, N.P.; Kamali, K.; Ravindran, T.R.; Balakrishnan, G.; Rao, R. Raman spectroscopic studies of CuFeO2 at high pressures. Vib. Spectrosc. 2015, 81, 112–118. [Google Scholar] [CrossRef]
- Mota, D.A.; Almeida, A.; Rodrigues, V.H.; Costa, M.M.R.; Tavares, P.; Bouvier, P.; Guennou, M.; Kreisel, J.; Moreira, J.A. Dynamic and structural properties of orthorhombic rare-earth manganites under high pressure. Phys. Rev. B 2014, 90, 054104. [Google Scholar] [CrossRef]
- Garg, A.B.; Errandonea, D.; Rodríguez-Hernández, P.; Muñoz, A. ScVO4 under non-hydrostatic compression: A new metastable polymorph. J. Phys. Condens. Matter 2017, 29, 055401. [Google Scholar] [CrossRef] [PubMed]
Figure 1.
Various crystal structures adopted by ABO2 layered compounds. Rhombohedral and hexagonal polytypes adopted by delafossites have linear A-O bonding while in ordered rock salt structure, octahedra is formed around both A and B atoms.
Figure 1.
Various crystal structures adopted by ABO2 layered compounds. Rhombohedral and hexagonal polytypes adopted by delafossites have linear A-O bonding while in ordered rock salt structure, octahedra is formed around both A and B atoms.

Figure 2.
Eigen vectors for Eg and A1g modes of vibration in ABO2 delafossite compounds.

Figure 3.
Rietveld refined ambient pressure and temperature X-ray diffraction patterns of as-synthesized CuLaO2, CuFeO2 and CuCrO2 showing single phase formation of the compound in rhombohedral structure. Difference plot is also plotted. Vertical tick marks represent allowed reflection of delafossite structure with R-3m space group.

Figure 4.
Raman spectra of as-synthesized CuLaO2, CuFeO2 and CuCrO2,showing two allowed Raman modes, a few weak modes shown by asterisks are disorder induced non-zone centre modes.
Figure 4.
Raman spectra of as-synthesized CuLaO2, CuFeO2 and CuCrO2,showing two allowed Raman modes, a few weak modes shown by asterisks are disorder induced non-zone centre modes.

Figure 5.
Raman spectra of CuLaO2 at various pressures. Note the appearance of new modes above 2 GPa.
Figure 5.
Raman spectra of CuLaO2 at various pressures. Note the appearance of new modes above 2 GPa.

Figure 6.
X-ray diffraction data for CuLaO2 at a few selected pressures. Arrow indicates appearance of new peaks indicating instability in the ambient phase. Diffraction peaks from gold, used as insitupressure marker is indicated with Au.
Figure 6.
X-ray diffraction data for CuLaO2 at a few selected pressures. Arrow indicates appearance of new peaks indicating instability in the ambient phase. Diffraction peaks from gold, used as insitupressure marker is indicated with Au.

Figure 7.
X-ray diffraction data at a few selected pressures for CuCrO2 along with the released data. Diffraction peaks from in-situ pressure calibrant (Cu) are also indicated. Numbers denote the pressure in GPa.
Figure 7.
X-ray diffraction data at a few selected pressures for CuCrO2 along with the released data. Diffraction peaks from in-situ pressure calibrant (Cu) are also indicated. Numbers denote the pressure in GPa.
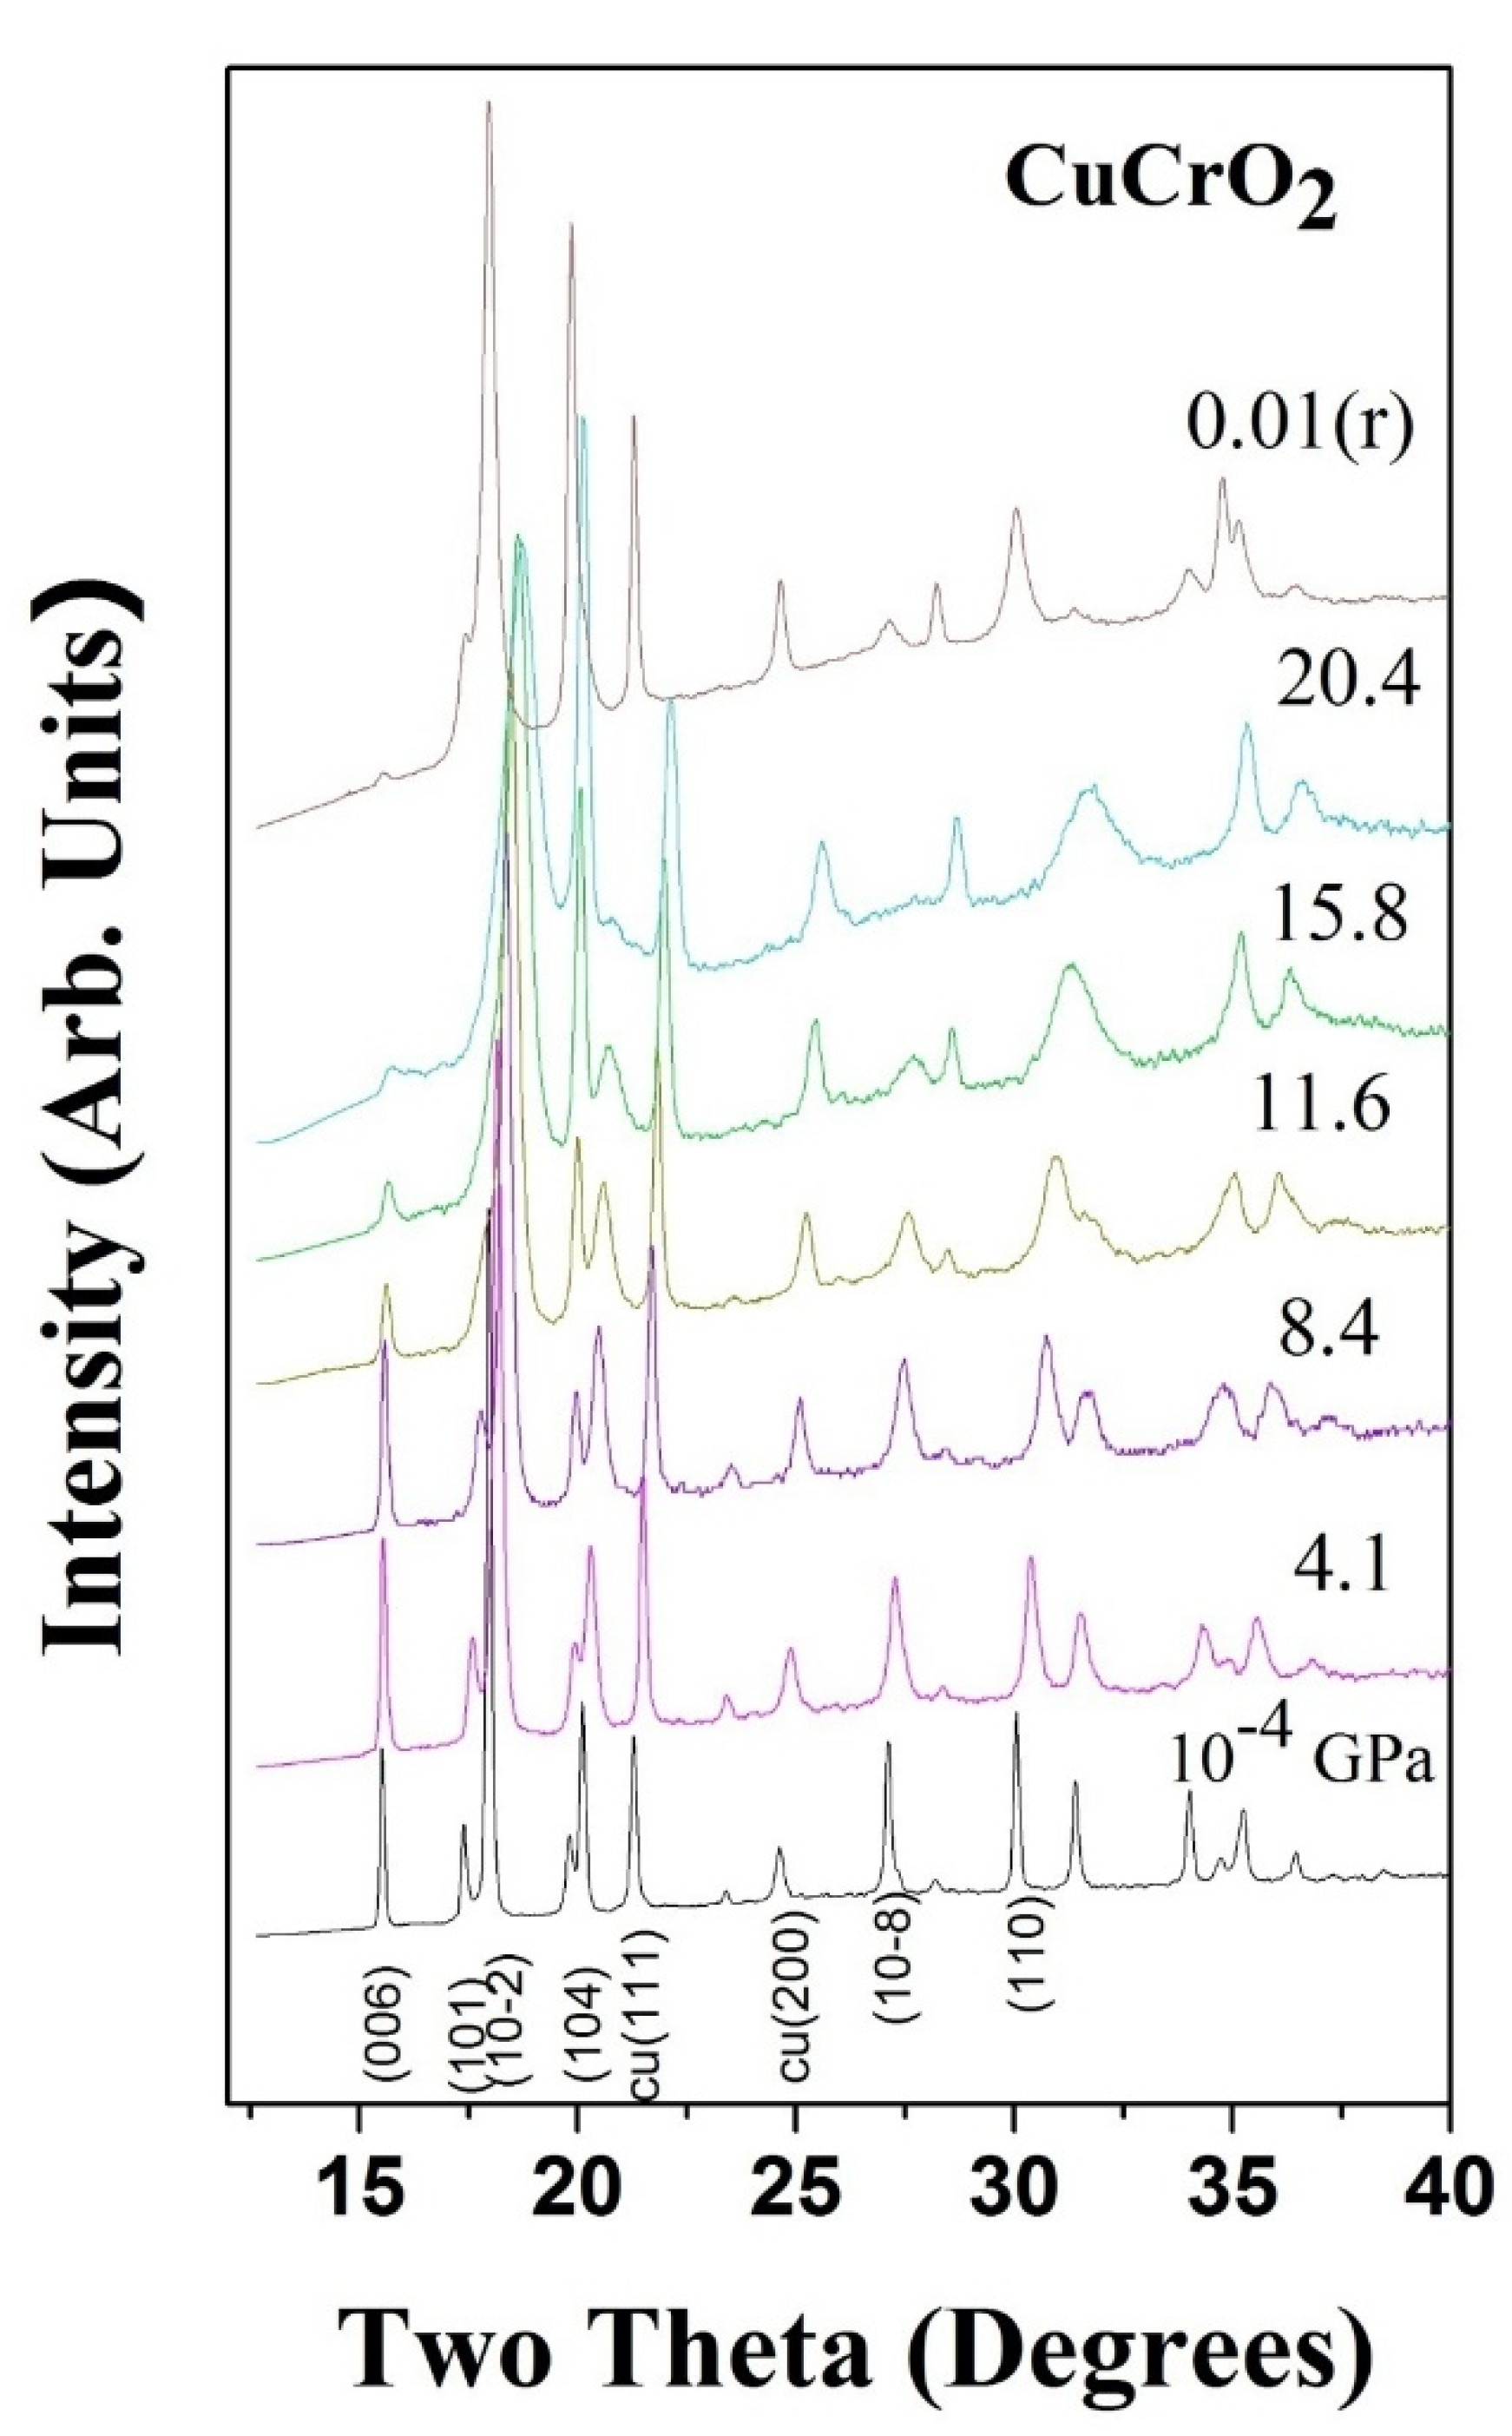
Figure 8.
Observed, calculated and difference plot of X-ray powder patterns for CuCrO2 at 4.8 GPa, at 20.4 GPa. Top, middle and bottom vertical marks indicate Bragg reflections from the sample, pressure calibrant (Cu) and sample chamber (W) respectively. The difference between fitted and observed data is also plotted.

Figure 9.
Pressure evolution of Raman spectra of CuCrO2 at a few selected pressures. Arrow indicates the splitting of Eg mode and appearance of new modes at higher frequency which soften with pressure.
Figure 9.
Pressure evolution of Raman spectra of CuCrO2 at a few selected pressures. Arrow indicates the splitting of Eg mode and appearance of new modes at higher frequency which soften with pressure.
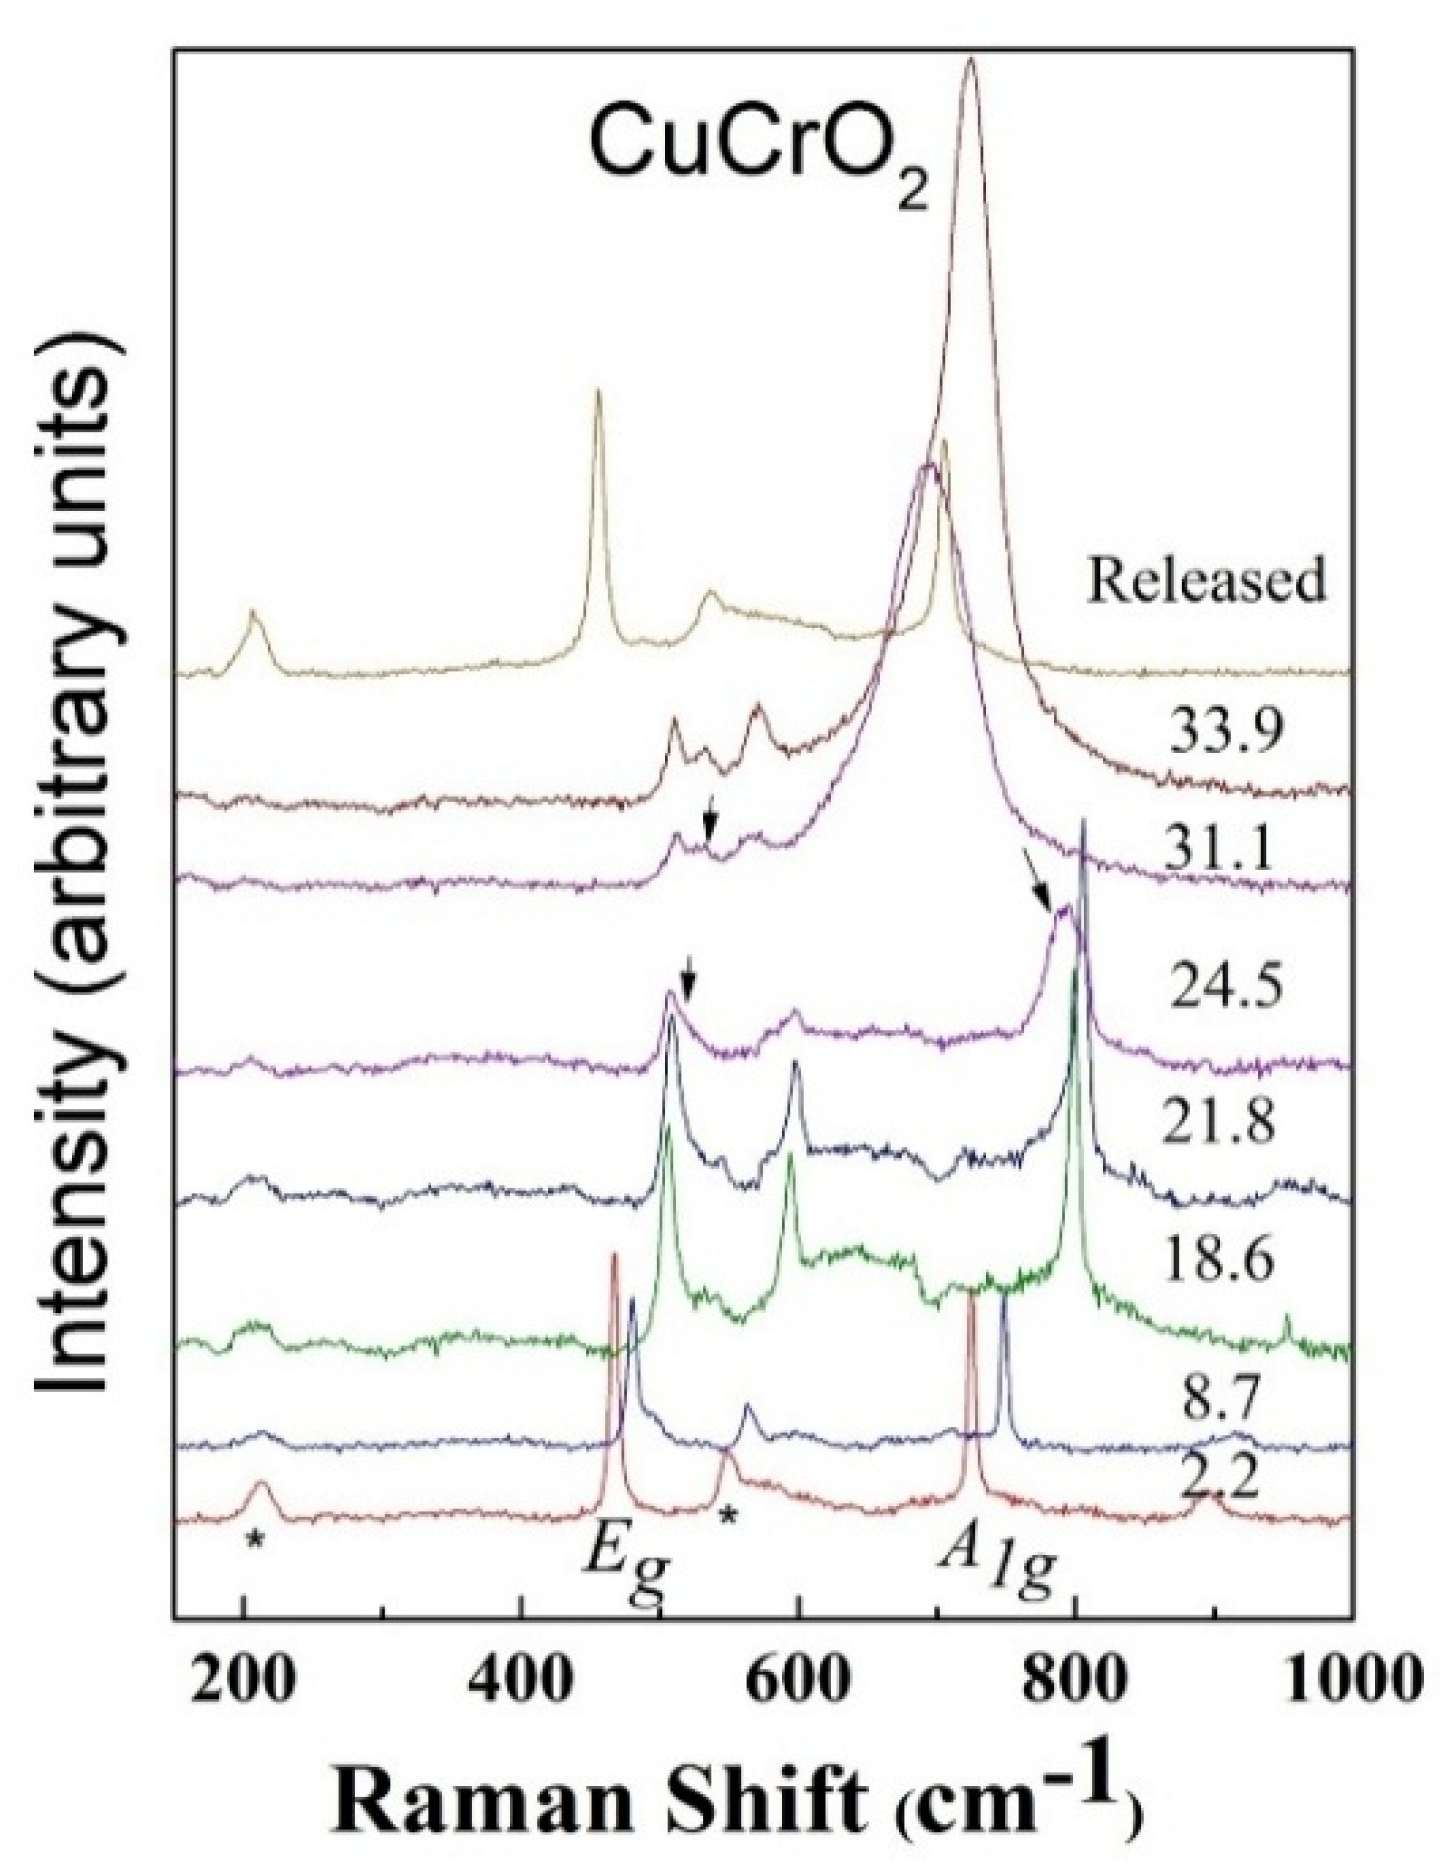
Figure 10.
Normalized pressure–volume data for CuCrO2 and CuLaO2. Symbols are explained in the figure.
Figure 10.
Normalized pressure–volume data for CuCrO2 and CuLaO2. Symbols are explained in the figure.

Figure 11.
Normalized cell parameters of CuCrO2 and CuLaO2. Both the samples show anisotropic compression. Symbol are explained in the figure.
Figure 11.
Normalized cell parameters of CuCrO2 and CuLaO2. Both the samples show anisotropic compression. Symbol are explained in the figure.

Figure 12.
Evolution of Raman modes with pressure for CuFeO2 (a), Mode frequency vs. Pressure (b). Arrow in (a) shows splitting of Eg mode indicating the transition. Figures after Reference [76].
Figure 12.
Evolution of Raman modes with pressure for CuFeO2 (a), Mode frequency vs. Pressure (b). Arrow in (a) shows splitting of Eg mode indicating the transition. Figures after Reference [76].
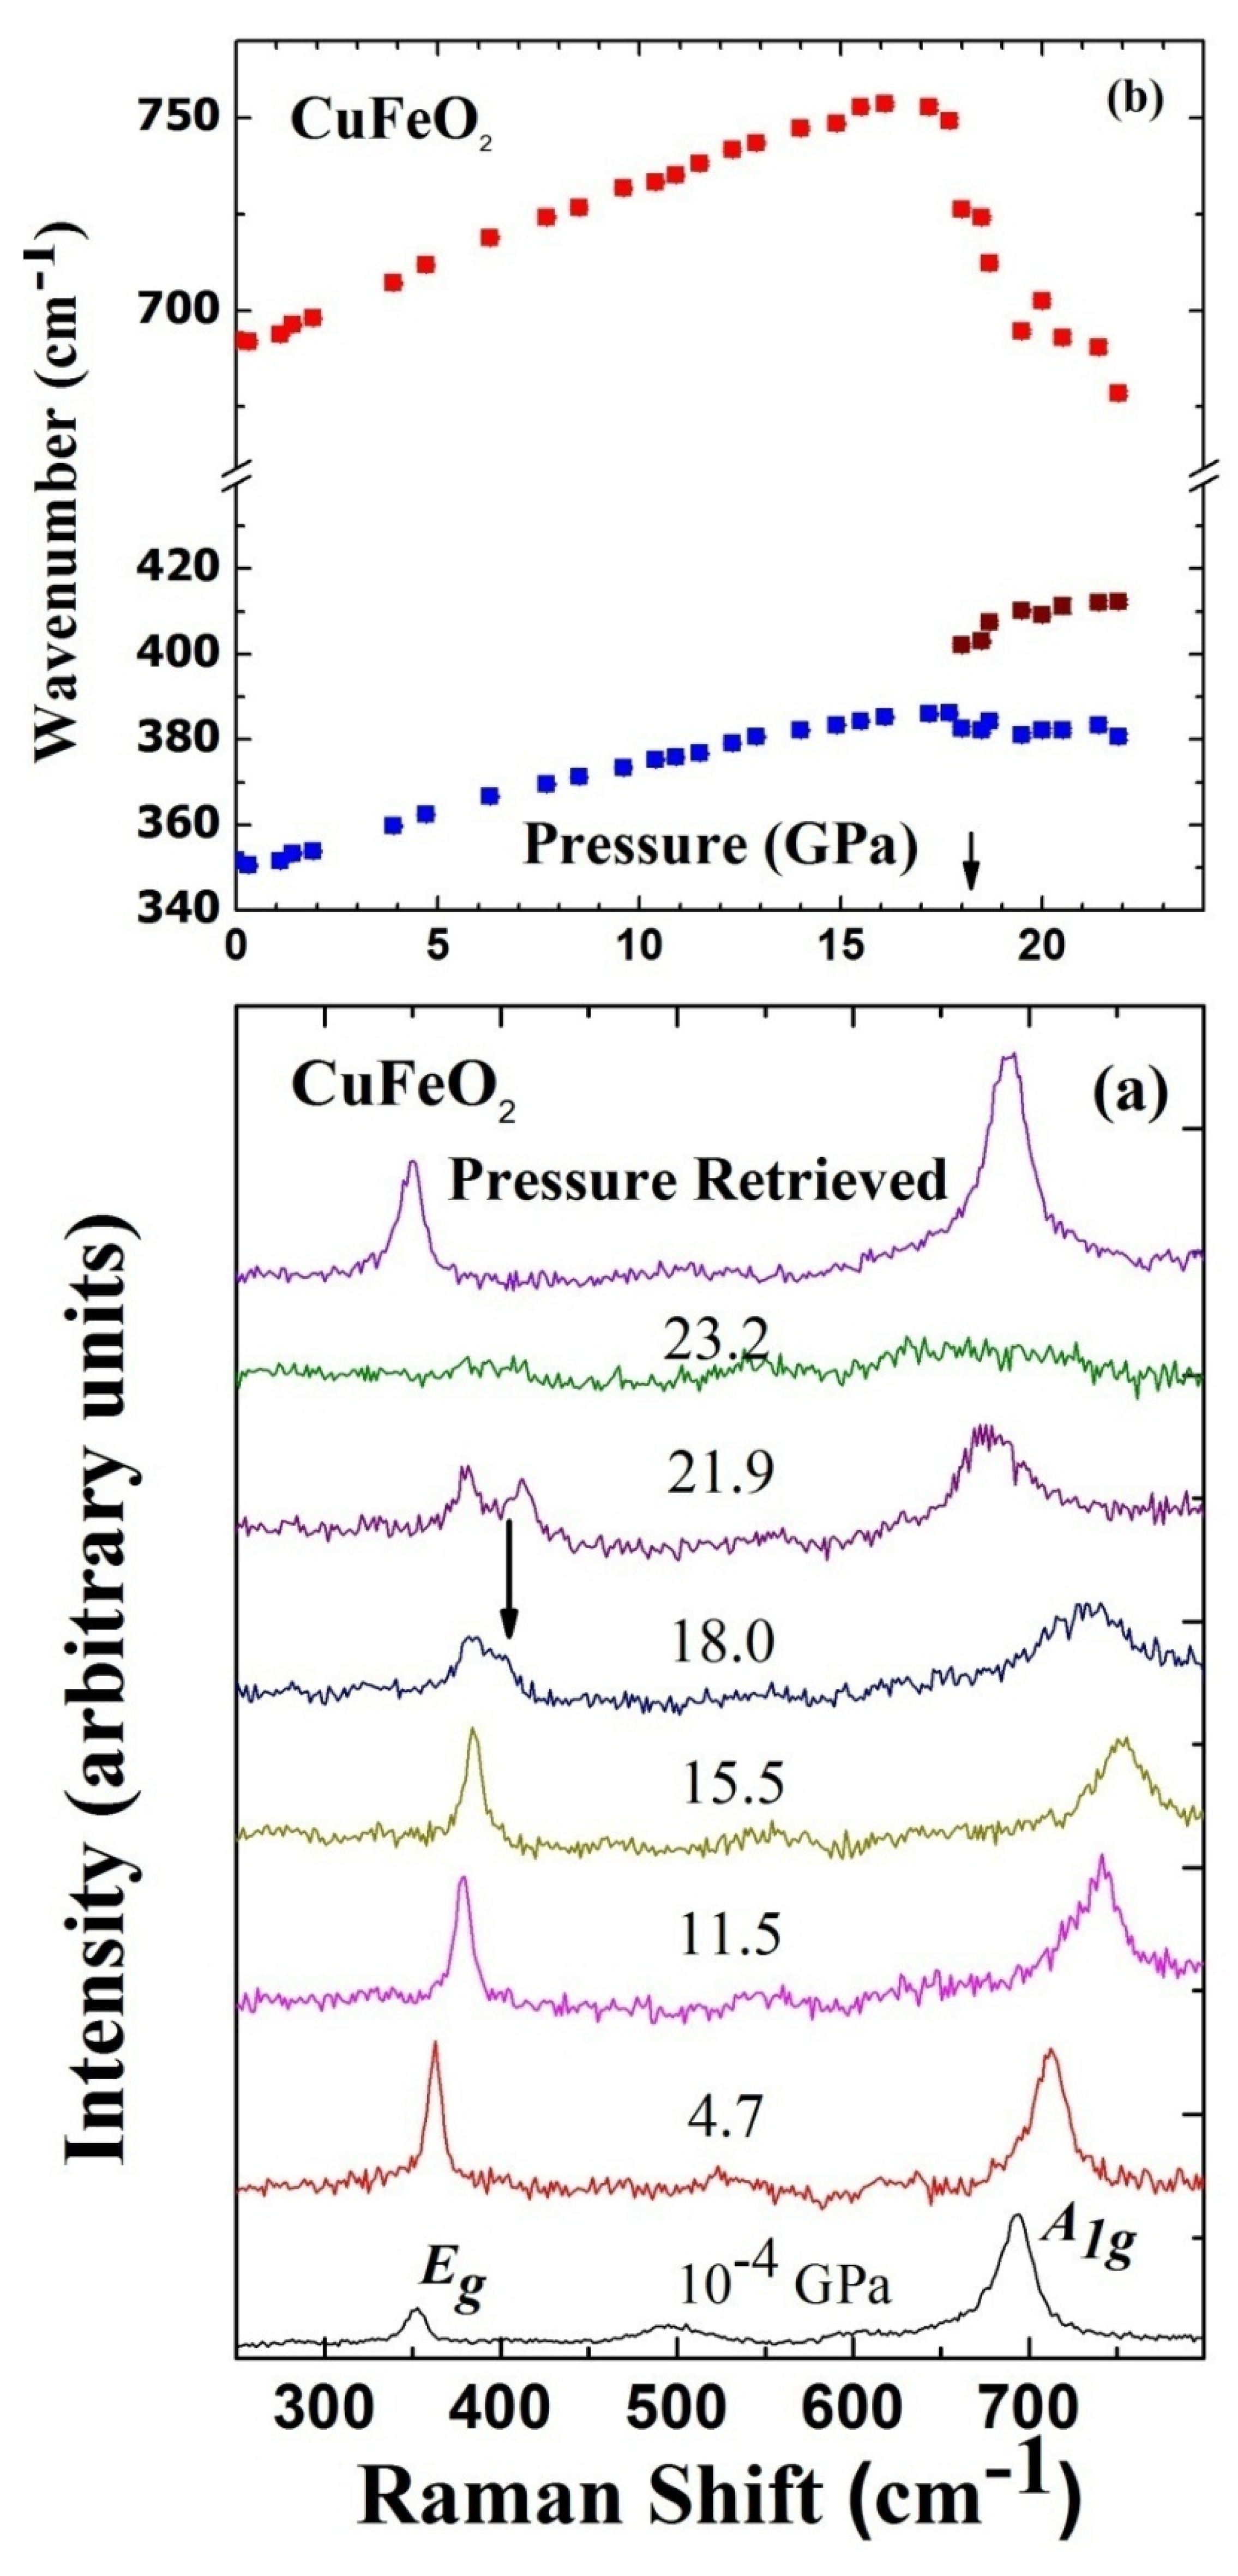
Figure 13.
Landscape of bulk modulus of various copper delafossites as a function of trivalent cationic radii. Numbers in the bracket indicate the references.
Figure 13.
Landscape of bulk modulus of various copper delafossites as a function of trivalent cationic radii. Numbers in the bracket indicate the references.
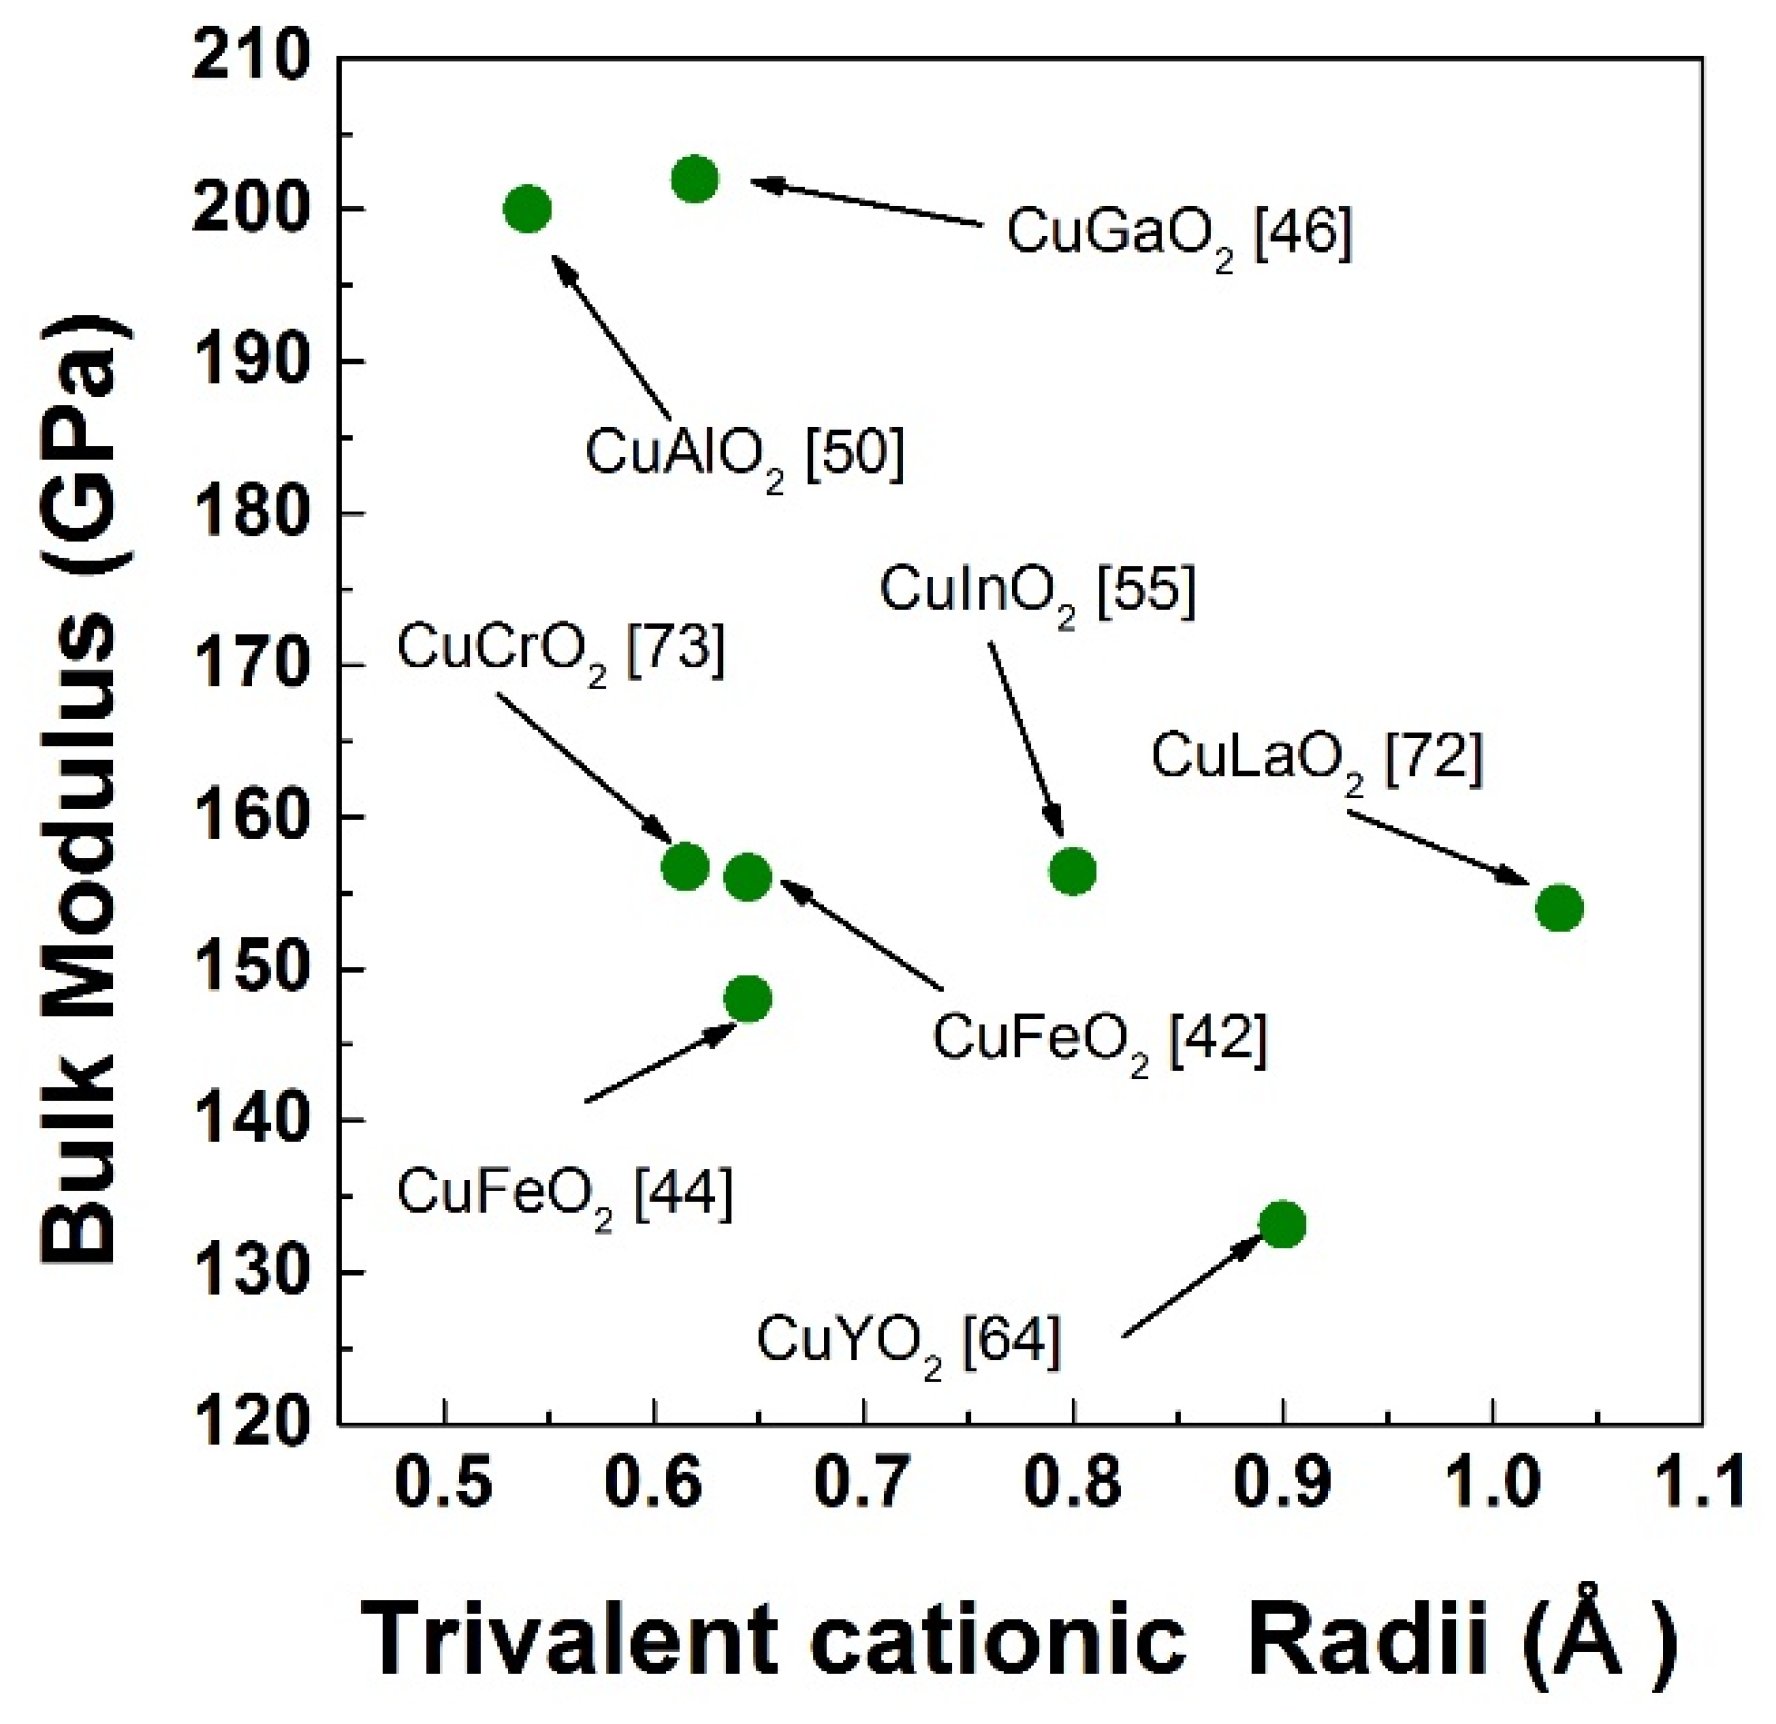
Figure 14.
Transition pressure of various copper delafossites as a function of trivalent cationic radii. Green line is a fitted exponential function showing decrease in the transition pressure with the increase in trivalent cationic radii. Numbers in the bracket indicate the references.
Figure 14.
Transition pressure of various copper delafossites as a function of trivalent cationic radii. Green line is a fitted exponential function showing decrease in the transition pressure with the increase in trivalent cationic radii. Numbers in the bracket indicate the references.

Table 1.
Structural and vibrational details of ABO2 type compounds.
| Hexagonal P63/mmc, Z = 2 | Atomic coordinates | Vibrations at the zone centre | |||||||||
| Wyckoff position | x | y | z | A1g | E1g | E2g | B1g | A2u | E1u | E2u | B2u |
| Monovalent cation A at 2c | 1/3 | 2/3 | 1/4 | - | - | 1 | 1 | 1 | 1 | - | - |
| Trivalent cation B at 2a | 0 | 0 | 0 | - | - | - | - | 1 | 1 | 1 | 1 |
| Oxygen at 4f | 1/3 | 2/3 | 0.0892 | 1 | 1 | 1 | 1 | 1 | 1 | 1 | 1 |
| Rhombohedral R-3m, Z = 1 | Atomic co-ordinate | Vibrations at the zone centre | |||||||||
| Wyckoff position | x | y | z | A1g | Eg | A2u | Eu | ||||
| Monovalent cation A at 3b | 0 | 0 | 0 | - | - | 1 | 1 | ||||
| Trivalent cation B at 3a | 0 | 0 | 1/2 | - | - | 1 | 1 | ||||
| Oxygen at 6c | 0 | 0 | 0.108 | 1 | 1 | 1 | 1 | ||||
| Ordered rock salt R-3m, Z = 1 | Atomic co-ordinate | Vibrations at the zone centre | |||||||||
| Wyckoff position | x | y | z | A1g | Eg | A2u | Eu | ||||
| Monovalent cation A at 3a | 0 | 0 | 1/2 | - | - | 1 | 1 | ||||
| Trivalent cation B at 3b | 0 | 0 | 0 | - | - | 1 | 1 | ||||
| Oxygen at 6c | 0 | 0 | 0.743 | 1 | 1 | 1 | 1 | ||||
Table 2.
Ionic radii, Raman mode frequencies, lattice parameters and bond-lengths for various copper delafossite compounds.
Table 2.
Ionic radii, Raman mode frequencies, lattice parameters and bond-lengths for various copper delafossite compounds.
| Delafossite | Ionic Radii of Trivalent Cation (Å) [62] | Raman Mode Frequency | Lattice Parameter | Bond-Length | Ref. | |||
|---|---|---|---|---|---|---|---|---|
| Eg (cm−1) | A1g (cm−1) | a (Å) | c (Å) | Cu-O (Å) | M-O (Å) | |||
| CuLaO2 | 1.032 | 318 | 652 | 3.8326 | 17.092 | 1.760 | 2.466 | [63] |
| CuPrO2 | 0.99 | 3.7518 | 17.086 | 1.789 | 2.411 | [63] | ||
| CuNdO2 | 0.983 | 3.7119 | 17.085 | 1.836 | 2.370 | [63] | ||
| CuSmO2 | 0.958 | 3.6628 | 17.078 | 1.880 | 2.325 | [63] | ||
| CuEuO2 | 0.947 | 3.6316 | 17.074 | 1.895 | 2.302 | [63] | ||
| CuYO2 | 0.90 | 3.5330 | 17.136 | 1.827 | 2.285 | [64] | ||
| CuInO2 | 0.8 | 378 | 678 | 3.2922 | 17.388 | 1.845 | 2.172 | [65] |
| CuScO2 | 0.745 | 3.2204 | 17.099 | 1.831 | 2.121 | [66] | ||
| CuFeO2 | 0.645 | 352 | 692 | 3.0351 | 17.166 | 1.835 | 2.033 | [61] |
| CuGaO2 | 0.62 | 368 | 729 | 2.9770 | 17.171 | 1.848 | 1.996 | [46] |
| CuCrO2 | 0.615 | 454 | 703 | 2.9767 | 17.111 | 1.8455 | 1.989 | [67] |
| CuAlO2 | 0.535 | 418 | 767 | 2.8584 | 16.958 | 1.8617 | 1.912 | [50] |
© 2018 by the author. Licensee MDPI, Basel, Switzerland. This article is an open access article distributed under the terms and conditions of the Creative Commons Attribution (CC BY) license (http://creativecommons.org/licenses/by/4.0/).
Share and Cite
MDPI and ACS Style
Garg, A.B.; Rao, R. Copper Delafossites under High Pressure—A Brief Review of XRD and Raman Spectroscopic Studies. Crystals 2018, 8, 255. https://doi.org/10.3390/cryst8060255
AMA Style
Garg AB, Rao R. Copper Delafossites under High Pressure—A Brief Review of XRD and Raman Spectroscopic Studies. Crystals. 2018; 8(6):255. https://doi.org/10.3390/cryst8060255
Chicago/Turabian StyleGarg, Alka B., and Rekha Rao. 2018. "Copper Delafossites under High Pressure—A Brief Review of XRD and Raman Spectroscopic Studies" Crystals 8, no. 6: 255. https://doi.org/10.3390/cryst8060255
Note that from the first issue of 2016, this journal uses article numbers instead of page numbers. See further details here.