Multifunctional Molecular Magnets: Magnetocaloric Effect in Octacyanometallates


Institute of Nuclear Physics Polish Academy of Sciences, Radzikowskiego 152, 31-342 Krakow, Poland
*
Author to whom correspondence should be addressed.
Crystals 2019, 9(1), 9; https://doi.org/10.3390/cryst9010009
Submission received: 23 November 2018
/
Revised: 17 December 2018
/
Accepted: 18 December 2018
/
Published: 22 December 2018
(This article belongs to the Special Issue Molecular Magnets)
Abstract
:Octacyanometallate-based compounds displaying a rich pallet of interesting physical and chemical properties, are key materials in the field of molecular magnetism. The [M(CN)8]n− complexes, (M = WV, MoV, NbIV), are universal building blocks as they lead to various spatial structures, depending on the surrounding ligands and the choice of the metal ion. One of the functionalities of the octacyanometallate-based coordination polymers or clusters is the magnetocaloric effect (MCE), consisting in a change of the material temperature upon the application of a magnetic field. In this review, we focus on different approaches to MCE investigation. We present examples of magnetic entropy change ΔSm and adiabatic temperature change ΔTad, determined using calorimetric measurements supplemented with the algebraic extrapolation of the data down to 0 K. At the field change of 5T, the compound built of high spin clusters Ni9[W(CN)8]6 showed a maximum value of −ΔSm equal to 18.38 J·K−1 mol−1 at 4.3 K, while the corresponding maximum ΔTad = 4.6 K was attained at 2.2 K. These values revealed that this molecular material may be treated as a possible candidate for cryogenic magnetic cooling. Values obtained for ferrimagnetic polymers at temperatures close to their magnetic ordering temperatures, Tc, were lower, i.e., −ΔSm = 6.83 J·K−1 mol−1 (ΔTad = 1.42 K) and −ΔSm = 4.9 J·K−1 mol−1 (ΔTad = 2 K) for {[MnII(pyrazole)4]2[NbIV(CN)8]·4H2O}n and{[FeII(pyrazole)4]2[NbIV(CN)8]·4H2O}n, respectively. MCE results have been obtained also for other -[Nb(CN)8]-based manganese polymers, showing significant Tc dependence on pressure or the remarkable magnetic sponge behaviour. Using the data obtained for compounds with different Tc, due to dissimilar ligands or other phase of the material, the ΔSm ~ Tc−2/3 relation stemming from the molecular field theory was confirmed. The characteristic index n in the ΔSm ~ ΔHn dependence, and the critical exponents, related to n, were determined, pointing to the 3D Heisenberg model as the most adequate for the description of these particular compounds. At last, results of the rotating magnetocaloric effect (RMCE), which is a new technique efficient in the case of layered magnetic systems, are presented. Data have been obtained and discussed for single crystals of two 2D molecular magnets: ferrimagnetic {MnII(R-mpm)2]2[NbIV(CN)8]}∙4H2O (mpm = α-methyl-2-pyridinemethanol) and a strongly anisotropic (tetren)Cu4[W(CN)8]4 bilayered magnet showing the topological Berezinskii-Kosterlitz-Thouless transition.

1. Introduction
In the quest for novel materials which could be used in modern technologies, molecular substances play an important role, as they may show properties not available in conventional materials. Molecule-based compounds attract much attention as they combine interesting magnetic, electronic, and optical properties together with low weight, transparency, and chemical sensitivity. Molecular magnets represent a vast and still growing family of compounds based on molecular buildings blocks, where organic groups mediate magnetic interactions between metal ions or may also carry their own magnetic moment. Research into molecule-based materials is motivated by their potential functionality due to the properties of the molecular building blocks or the specific character of the resulting molecular network. Thanks to the rational design and advanced chemical syntheses, it is possible to obtain systems with different magnetic dimensionalities: molecular ferro-, ferri-, or antiferromagnets with the substantial ordering temperature Tc, magnetic molecular layers, magnetic molecular chains, or magnetic molecular clusters, the latter two regarded as molecular nanomagnets. In many cases, properties of the systems, like Tc, coercive field, magnetic moment, and colour, may be changed and even controlled with different factors, such as temperature, irradiation with light, external pressure, or sorption of guest molecules. Molecular magnets which show spin crossover transition, photomagnetism, magnetic sponge behaviour, or optical activity are potential candidates for efficient sensors and switches. On the other hand, superparamagnetic character, slow relaxation, and quantum tunneling in anisotropic high-spin clusters, may be used in high-density magnetic storage, spintronics, or quantum computing. Results of extensive studies on molecular magnetism have been reviewed in books and monographies [1,2,3,4].
The relatively later explored functionality of molecular magnets has been the magnetocaloric effect (MCE), consisting in change of the material temperature when a magnetic field is applied or removed. MCE is an intrinsic thermodynamic property of all magnetic solids: it occurs in paramagnets, ferro-, and ferrimagnets [5] but also in antiferromagnets at the metamagnetic transition [6]. Investigations of MCE are significant also for the basic reason that its dependence on the magnetic field is related to the critical behaviour of the material. The microscopic description of MCE has been presented in [7,8,9,10]. Of particular interest are “magnetic coolers”, i.e., substances for which an adiabatic demagnetization provokes the substantial temperature decrease. The value of the effect depends on the temperature derivative of magnetization, thus for paramagnets it is strongest at the lowest temperatures, while for ordered magnets it achieves maximum at the magnetic ordering temperature Tc. The aim is to replace standard, non-ecological refrigeration techniques, studies on magnetocaloric effect in conventional magnetic solids are concentrated on cooling in the room temperature range.
The most suitable candidates for magnetic refrigeration are here systems like Gd5Si2Ge2, Tb5Si2Ge2, MnAs, or Ni-Mn-In Heusler alloys [11]. Materials with first order magnetic transitions at Tc may be considered as most suitable for large MCE but thermal and magnetic losses appearing in transitions of this type may impede the practical applications. Consequently, materials showing the second order magnetic phase transition are also taken into account. Interest in the magnetocaloric effect in molecular materials and “chilling with magnetic molecules” [12] started about a decade ago. At first, it has been investigated for slowly relaxing molecular nanomagnets with large spin, Single Molecule Magnets (SMM) [2]. Because of the large ground-state spin S of SMM, the entropy associated with the magnetic degrees of freedom, Sm = Rln(2S+1) (R is the gas constant) should be sizeable. However, molecular anisotropy, which is essential in SMMs as it decides on long relaxation time and blocking temperature, delays magnetization and demagnetization of the system, thus brings about weak MCE. As stated by Evangelisti and Brechin, the ideal molecular refrigerant should have large spin, negligible magnetic anisotropy, prevailing ferromagnetic coupling, and large magnetic density [13]. These conditions are fulfilled in metal–organic frameworks with densely packed magnetic ions, like [Gd(HCOO)3] [14]. Large values of MCE observed in frameworks are not related to transition at Tc as these systems remain paramagnetic or show the long-range order only in the sub-Kelvin range. MCE originates here from the Schottky anomaly consequent on splitting of the energy levels in the field. Very large MCE values have been also observed in the ferromagnetic acetate tetrahydrate Gd3+ dimer [15], in the high nuclearity Gd42Co10 cluster [16], and in a 24-Gd capsule-like cluster at temperature 2.5 K [17]. An interesting increase in the magnetocaloric effect in MnII glycolate on transition between the three-dimensional coordination polymer and discrete mononuclear phase induced by water molecules was reported in [18]. It follows that MCE in molecular clusters will play an important role in cooling in the sub-Kelvin temperature range. Advances in the design of magnetic molecules for use as cryogenic magnetic coolants were reviewed in [19].
This paper presents investigations on the magnetocaloric effect performed by us for molecular magnets based on octacyanidometallates. As it has been known from long-lasting studies of Prussian blue analogs, MAII[MBIII(CN)6]2/3·zH2O or AIMAII[MBIII(CN)6] (MAII and MBIII are 3d metal ions and AI is the alkali ion), as well as of other hexacyanidometallates, the cyanobridge is able to mediate strong antiferromagnetic or ferromagnetic interactions between the metal moments [20]. Besides high temperatures of magnetic order reaching room temperature, Prussian blue analogs (PBAs) may show many fascinating properties, like light- and pressure switchable magnetism, magneto-optical effects, or chemically controlled growth of nanosized systems [21]. Unlike the hexacyano- [M(CN)6] blocks of octahedral symmetry, which set up the cubic structure of PBAs, bimetallic octacyanometallates are based on more flexible building blocks offering eight CN-bridges to link the M and M’ metal ions. Most often used [M(CN)8] blocks are 5d [WV(CN)8] or 4d [NbIV(CN)8] and [MoV(CN)8] complexes, all of spin S = 1/2. Eight possible coordination sites, the proper choice of other metal M’ and of additional organic ligands resulted in a variety of obtained structures and magnetic properties [22,23,24]. Among octacyanometallates one can find slowly relaxing systems [25,26,27], guest-molecule absorptive porous networks [28,29], photomagnets [30,31], and magneto-optically active compounds [32], as well as molecular sponges, which change, in a reversible way, the ordering temperature Tc and the coercive field Hc upon hydration/dehydration process [33] and other functional materials [34].
Below, we discuss the magneto-thermal properties of the octacyanometallates showing the different types of crystal architecture. The most numerous group is the family of 3D octacyanoniobate-based networks with different nonmagnetic organic ligands which significantly affect the structure and overall behaviour of the material. Another subject under study is the high-spin dodecanuclear cluster compound Ni9[W(CN)8]6, a possible candidate for cryogenic magnetic cooling. Two experimental methods for measuring the MCE data, i.e., calorimetry and/or magnetometry were used. Moreover, the new approach, consisting in measuring MCE for two perpendicular sample orientations (so called Rotating Magnetocaloric Effect RMCE), is reported for a low anisotropy 2D {MnII(R-mpm)2]2[NbIV(CN)8]}∙4H2O ferrimagnet, as well as for an anisotropic bilayered 2D Cu4[W(CN)8]4 molecular crystal showing the topological phase transition. Conclusions regarding the scaling and critical behaviour in some systems under study are also included.
2. Deriving Magnetocaloric Effect from Calorimetric Data
2.1. Thermodynamic Setup
The magnetocaloric effect (MCE) is quantified either by the isothermal entropy change ΔSm or the adiabatic temperature change ΔTad due to the external field change Hi→Hf. While the former quantity may be derived from magnetometric data by using the integral version of the Maxwell relation , the latter one can be obtained solely from calorimetric data. In this way, the heat capacity measurements performed without an external magnetic field as well as in a nonzero field represent a more complete set of characteristics allowing one to arrive at both MCE quantities. The step of pivotal importance in such a derivation is the determination of the temperature and field dependence of the entropy thermodynamic function S(T,H). Then, the isothermal entropy change ΔSm is obtained by a simple subtraction:
while the calculation of the adiabatic temperature change ΔTad is based on the formula:
which requires the inversion of the S(T,H) dependence with respect to variable T. However, the above procedure is not as straightforward as it might seem. The problem lies in the experimental limitations where we can measure the heat capacity Cp(T,H) down to a possibly small but finite temperature TL never reaching the limit of 0 K, while for the correct determination of the S(T,H) function one needs to know the Cp(T,H) function from zero absolute temperature: . A natural way to solve the problem is using a plausible extrapolation scheme. In what follows we will present two such schemes employed in the investigations of molecular magnets. The first scheme is more complete and involves the determination of the so called baseline incorporating the lattice contribution to the heat capacity. Having the baseline, one can extract the magnetic excess heat capacity ΔCp and extrapolate it down to 0 K by assuming a two parameter algebraic function which is believed (there are no theoretical accounts of that) to work well for the nonzero-field case as it is well-known to do in the zero-field case (the Bloch law for ferromagnets). The extrapolation scheme consists in two independent steps. Firstly, the algebraic function is fitted to the magnetic excess heat capacity data ΔCp in the narrow temperature range [TL,Tmax] for the different applied field values. Next, the resultant fits are complemented with the extrapolated baseline to yield the final form of the sought-for low temperature extrapolation of Cp(T,H). The other scheme is a simplified one as it obviates the need to determine the normal heat capacity (baseline). However, it does require the extrapolation of the Cp data down to 0 K. The extrapolation is performed assuming again a two parameter function , where the first term corresponds to the lattice contribution, while the second term represents the Bloch law for the magnonic contribution.
The above schemes will be exemplified by three compounds belonging to the class of molecular magnets. The first compound (1) with the chemical formula {Ni[Ni(4,4′dtbpy)(H2O)]8[W(CN)8]6}∙17H2O (4,4′dtby − 4-4-di-tert-butyl-2,2′-bipyridine, C20H24N2O4) (Ni9[W(CN)8]6 in short) consists of unique clusters. The main component of the compound is a fifteen-center cyanido-bridged Ni(II)9W(V)6 molecule forming a cube-like framework to which the spacious tert-butyl substituted bipyridine ligands are connected. The spin carried by the W(V) ion is SW = 1/2, while that of the Ni(II) ion is SNi = 1. This allows one to calculate the maximal molar magnetic entropy of the cluster as equal to 116.79 J·K−1∙mol−1, which makes one anticipate a considerable magnetocaloric response. However, the spins constituting the cluster are ferromagnetically coupled through the cyanide linkages giving rise to a relatively high spin S = 12 [35], which leads to the entropy content amounting to . It is this reduced value that sets the order of magnitude of MCE at low temperatures, where the intracluster interactions are at play. The detailed study of MCE for this compound was reported in [36]. The second compound (2) is a bimetallic molecular magnet {[MnII(pyrazole)4]2[NbIV(CN)8]·4H2O}n (pyrazole is a five membered ring ligand C3H4N2) [37].The MnII ions carry the spin of SMn = 5/2, while the NbIV ions possess the spin of SNb = ½, which implies that the maximal molar magnetic entropy of the system is 35.56 J·K−1 mol−1. This, together with the fact that the compound exhibits the second-order phase transition, makes one anticipate a considerable magnetocaloric response. Yet, an antiferromagnetic coupling between the MnII and NbIV ions was suggested by the analysis of the magnetometric data [37], which implies that a more representative spin value per formula unit (at least in the magnetic fields below the decoupling threshold) is S = 2SMn − SNb = 9/2. The corresponding entropy content is reduced down to 19.14 J·K−1 mol−1 but still substantial. The detailed analysis of MCE for 2 was reported in [38]. The third compound (3) is a bimetallic coordination polymer {[FeII(pyrazole)4]2[NbIV(CN)8]·4H2O}n, isostructural with 2 [37]. The spin of the FeII ion is SFe = 2, while the spin carried by the NbIV ion is SNb = ½, which sets the maximal molar magnetic entropy of the system as equal to 32.53 J·K−1 mol−1. The compound is known to display the second-order phase transition and thus a considerable magnetocaloric effect may be anticipated. On the other hand, the preliminary analysis of the magnetometric data implied an antiferromagnetic coupling between the constituent ions [37], which suggests that the total spin of S = 2SFe − SNb = 7/2 is a more representative spin value per formula unit, at least in the low temperature and low field regime. The entropy content associated with this spin value amounts to 17.29 J·K−1 mol−1, which is reduced by half but still substantial. The detailed report of MCE for this compound is given in [39].
2.2. Cluster Compound Ni9[W(CN)8]6
The compound crystallizes in a triclinic system, space group . The unit cell comprises one centrosymmetric cluster, the structure of which is shown in Figure 1. Due to the relatively large size of the tert-butyl substituted bpy (bpy = 2,2′-bipyridine = C10H8N2) the distances between the cluster centers exceed 20 Ǻ and the π–π interactions in the system are practically absent. Hence the inter-cluster superexchange interactions may be completely neglected in the studied temperature range of 2–300 K.
Heat capacity of the compound was detected on cooling with the PPMS instrument without a field and for an array of applied field values in the temperature intervals 0.4–20 K with the 3He probe and 1.8–100 K with the standard probe cooled with liquid 4He. Due to the different sensitivities of the probes in different temperature regimes, we used the data provided by the former system below 15 K and those provided by the latter system above 15 K. In the zero applied field a broad anomaly of width about 2 K with a very flat maximum around 1.9 K was revealed, see Figure 2. An increasing applied field is apparent to gradually suppress the anomaly leaving no trace of it for the maximal field value of 9T.
The zero-field heat capacity of 1 is depicted in Figure 3 in the range of 0.4–100 K. To construct the baseline an approximate approach was employed. The observed Cp values within the specific range 30–63 K above the anomaly, which we shall elucidate in what follows, are assumed to comprise two separate contributions. The first contribution involves the lattice degrees of freedom Cp(lattice) and the second contribution Cmag(H,T) is due to the Schottky-like anomaly anticipated for spin clusters coupled via the exchange interactions. While a polynomial approximation involving cubic and higher-order terms is employed to describe the former, the latter is introduced with the term proportional to . Thus the experimental heat capacity values are assumed to be represented within the range of 30–63 K by the following formula:
Fitting Equation (3) with m = 6 to the experimental heat capacity values yielded a3 = 6.07(7) × 10−2 J·K−4 mol−1, a4 = −2.08(4) × 10−3 J·K−5 mol−1, a5 = 2.76(9) × 10−5 J·K−6 mol−1, a6 = −1.33(6) × 10−7 J·K−7 mol−1, and b = 45,355.9(1) J∙K∙mol−1. The baseline is defined by Cp(lattice) thus determined and extrapolated down to 0 K (green solid curve in Figure 3). The subtraction of the baseline from the detected heat capacity values yields the magnetic excess heat capacity ΔCp, see Figure 4.
To calculate the entropy content associated with the excess heat capacity ΔCp in zero field the low temperature behaviour of ΔCp was additionally analyzed. A function was fitted to the magnetic excess heat capacity in the narrow range of 0.41−0.62 K (10 experimental points). The best fit yielded f = 11.1(2) J∙K−(1+μ)mol−1 and μ = 1.04(2) (see Inset of Figure 3). The low-temperature algebraic best-fit function was next used to estimate the entropy contribution in the temperature range 0–0.62 K. The entropic contribution in the temperature range 0.62–63 K was obtained by numerical integration of the area under the excess heat capacity signal . Finally, the high temperature excess heat capacity was used to estimate the entropic contribution above 63 K. The total entropy content amounts to 116.97 J·K−1·mol−1 and is slightly higher than the value of Smax,1 = 116.79 J·K−1·mol−1. Such a good level of agreement of the calculated magnetic entropy with the theoretically predicted value is not accidental. The particular choice of the temperature interval used to determine the baseline (30–63 K) was made so as to reproduce the total magnetic entropy associated with the reported spin cluster. The above procedure was automatized within a specially designed notebook of the Mathematica 8.0 environment.
Equations (1) and (2) were used to determine temperature dependences of ΔSm and ΔTad. The entropy thermodynamic function S(T,H) was calculated upon the algebraic extrapolation of the magnetic excess heat capacity ΔCp down to 0 K using the data in the interval 0.40–0.63 K (10 experimental points) for each field value. The resultant extrapolating functions were next appended with the baseline to yield the final forms of Cp(T,H).
Temperature dependence of ΔSm for several indicated field change values (μ0ΔH = μ0(H-0) = μ0H) is depicted in Figure 5. The −ΔSm vs. T curves display maxima placed in the range 2.4−6.5 K in addition to becoming broader and higher with increasing field change values. The peak values of |ΔSm| and positions are given in Table 1. for μ0ΔH = 5 T of other magnetic molecules was reported to range from 25 to 45 J∙K−1∙kg−1 [19] which is considerably higher than = 3.36 J∙K−1∙kg−1 (18.38 J∙K−1∙mol−1) recorded for 1. This is most probably due to the relatively higher molecular weight of 1. On the other hand, the observed values lie close to the low temperature physical threshold defined by J∙K−1∙mol−1 with S = 12. In the whole experimental range, the −ΔSM values remain positive exceeding 3 J∙K−1∙mol−1, although it is apparent they steeply drop below their peaks.
One usually looks at the parameter n () conveniently quantifying the local sensitivity of the isothermal entropy change ΔSm to the external field amplitude (). The value of n means that in the vicinity of a given thermodynamic point (T,H) the entropy change is approximately given by the power function . At high temperatures, where the magnetization is directly proportional to the field (the Curie–Weiss law), the integral version of the Maxwell relation implies a quadratic field dependence of ΔSm, giving rise to n = 2. Figure 6 shows the temperature dependence of the field-averaged value of parameter n for 1. The field-variation of n differs in intensity at different temperatures, which is reflected by the size of the error bars. The behaviour of n is consistent with the above high-temperature paradigm, showing a steady increase with temperature and approaching the limiting value of 2. At the experimental low-temperature threshold parameter n attains a value as low as 0.16.
In Figure 7 the adiabatic temperature change ΔTad is depicted. All the ΔTad(T) curves can be seen to display well-defined peaks. The peak amplitudes of ΔTad and the corresponding peak positions are listed in Table 1. The value of for μ0ΔH = 1, 3, 5, 7 and 9 T amounts to 1.6, 3.6, 4.6, 5.2, and 5.6 K, respectively. The record beating Gd3+ dimer with 3.5, 9.0, 12.7 K for μ0ΔH = 1, 3, and 7 T, respectively [40], exceeds the values of 1 more than twice. However, they fall closer to those reported for the Mn32 cluster ( 2.2, 4.5, 6.7 K for μ0ΔH = 1, 3, and 7 T, respectively) [41]. The values of reported for the compound {[NiII(pyrazole)4]2 [NbIV(CN)8]∙4H2O}n, 2.0 K for μ0ΔH = 5 T, and 2.9 K for μ0ΔH = 9 T [42], are significantly lower than for 1. The still lower value was recorded for molecular magnet Mn2-pyridazine-[Nb(CN)8] (1.5 K for μ0ΔH = 5 T), but this is probably due to the relatively higher transition temperature of 43 K [43].
2.3. Coordination Polymer {[MnII(pyrazole)4]2[NbIV(CN)8]·4H2O}n
Compound 2 crystallizes in the tetragonal space group I41/a [37]. Its unique structure consists of a 3D skeleton, where each MnII center is bridged to only two NbIV ions through the cyanido linkages MnII-NC-NbIV, while each NbIV centre is linked to four MnII ions. The remaining part of the pseudooctahedral coordination sphere of MnII is substituted with pyrazole molecules, while four further terminal cyanide ligands are linked with the NbIV ion. It is an interesting and unique structural feature that a three-dimensional (3D) extended network should emerge from such low connectivity indices. Figure 8 shows the crystal structure of the compound for instant reference.
The magnetic data imply that at Tc ≈ 23.8 K compound 1 undergoes a phase transition to the long-range magnetically ordered state [37]. The mean-field approach was employed to analyze the isothermal magnetization and the dc susceptibility, revealing the antiferromagnetic character of the coupling between the MnII and NbIV centers, which gives rise to an overall ferromagnetic behaviour. The coupling constant was estimated to amount to −6.8 cm−1 (−9.8K) [37].
The relaxation calorimetry technique implemented in the PPMS Quantum Design instrument was used to measure the heat capacity of 1. The zero-field measurements carried out in the temperature range of 1.9‒101 K revealed a well-defined λ-shaped anomaly at 22.8 K (slightly lower than the magnetometric counterpart) providing evidence of the presence of a magnetic continuous transition, see Figure 9. Additionally, the sample was measured in the applied field of μ0H = 0.1, 0.2, 0.5, 1, 2, 3, 4, 5, 7, and 9T in the range of 1.9–40.4 K in the cooling direction. To estimate the normal heat capacity (baseline), the observed Cp values within the specially selected range 31–55 K above the transition temperature (justified in what follows) were considered to involve two independent contributions. The first contribution originates from the lattice degrees of freedom Cp(lattice) and the second contribution is magnetic and due to the short-range order Cmag (short-range order). While the latter is introduced by the term proportional to T−2, a polynomial approximation with cubic and higher order terms is used to model the former. Thus the experimental values of the heat capacity within the range of 31−55 K are assumed to be given by the formula:
Fitting Equation (4) with n = 6 to the experimental heat capacity values yielded a3 = 1.8674 × 10⁻² J·K−4·mol−1, a4 = −7.0801 × 10⁻⁴ J·K−5·mol−1, a5 = 1.0546 × 10⁻⁵ J·K−6·mol−1, a6 = −5.7808 × 10⁻⁸ J·K−7·mol−1, and b = 8345.94 J·K mol−1. The lattice heat capacity Cp(lattice) thus determined extrapolated down to 0 K defines the baseline (solid curve in Figure 9).
The subtraction of the lattice heat capacity from the detected heat capacity values yields the magnetic excess heat capacity ΔCp, see Figure 10. Increasing magnetic field is apparent to suppress the anomaly peak. Moreover, consistently with a system with dominating antiferromagnetic coupling it slightly moves the anomaly toward lower temperatures. The calculation of the entropy associated with zero-field ΔCp proceeded in three separate steps. Firstly, the contribution to the entropy above 55 K was estimated by considering the high temperature excess heat capacity bT−2. Secondly, the contribution in the temperature range 1.9–55 K was calculated using the formula . And finally, to obtain the low temperature contribution function fTμ was fitted to ΔCp in the range of 1.9–3.0 K, yielding f = 0.45(1) J·K−(1+μ) mol−1and μ = 1.45(3) (see Inset of Figure 9). Next, the fitted function was logarithmically integrated in the interval 0–1.9 K. The total magnetic entropy is received by summing the above three contributions giving 35.31 J·K−1 mol−1. This value compares perfectly well with Smax,2 = 35.56 J·K−1·mol−1, which is attributable to the specific choice of the temperature interval (31–55 K) used to determine the baseline.
Similarly as for 1 using Equations (1) and (2), the isothermal entropy change ΔSm and the adiabatic temperature change ΔTad were determined. The entropy thermodynamic function S(T,H) was calculated using the baseline and the algebraic extrapolation of ΔCp based on the data in the temperature range of 1.9–3.0 K. Figure 11 shows the temperature dependence of ΔSm for μ0ΔH = 0.1, 0.2, 0.5, 1, 2, 3, 4, 5, 7 and 9T (Hi = H, Hf = 0). It is apparent that the corresponding curves display a peak. In Table 2 the peak values of ΔSm together with the peak positions are provided. In addition to the ΔSm data inferred from the calorimetric measurements Figure 11 shows also the ΔSm values obtained by using the Maxwell relation from the magnetometric data [42]. Except for the two highest field change values (4 and 5 T), where the magnetometric data are slightly scattered around the smoother calorimetric data, both sets agree strikingly well. The lack of smoothness is probably a consequence of the problems of the particular instrument with temperature stabilization.
The value of = 6.83 J·K−1·mol−1 detected for μ0ΔH = 5T slightly exceeds that reported in [42] (6.7 J·K−1·mol−1). The isostructural compound {NiII(pyrazole)4]2[NbIV(CN)8]·4H2O}n reveals at the same time the lower entropy change of 6.1 J·K−1·mol−1 [42], which most probably can be attributed to the smaller spin value of the NiII ion (SNi = 1). Figure 12 shows the thermal dependence of the field-averaged exponent n for 2. On heating parameter n it is apparent that it smoothly decreases down to the minimal value of 0.62 attained at 23.6 K (slightly above the transition temperature), and subsequently increases toward the high temperature value of 2. At the transition temperature TN = 22.8 K parameter n takes on the value of 0.64. It can be compared to that calculated using the relationship: [8,44]. The value of 0.6424(4), obtained with the above equation and the theoretical estimates of β = 0.3689(3) and γ = 1.3960(9) for the 3D Heisenberg universality class [45], is very close to that obtained for 2.
The ΔTad(T) curves are shown in Figure 13. A two-peak structure of the curves is apparent. In addition to the expected peak located near the transition temperature they reveal the second peak at the lowest experimentally accessible temperatures. In Table 2 the primary peak values of ΔTad are provided. The positions of the primary peaks are practically independent of the applied field change. Moreover, there is their slight shift off the transition temperature toward higher temperatures. By contrast, the increasing magnetic field change seems to move the secondary peaks toward lower temperatures. The isostructural compound {NiII(pyrazole)4]2[NbIV(CN)8]·4H2O}n revealed higher values of ΔTad, i.e., 2.0 K for μ0ΔH = 5 T, and 2.9 K for μ0ΔH = 9 T [42]. The amplitudes of ΔTad reported for Mn2-pyridazine-[Nb(CN)8] (1.5 K for μ0ΔH = 5 T) [43] and hexacyanochromate Prussian blue analogues (1.2 K for μ0ΔH = 7 T) [46] are at the same time comparable to those for 2.
The occurrence of the secondary peaks in the ΔTad(T) signal around 2 K points to the possibility that beyond the experimentally accessible temperature range an additional magnetic transition is concealed. This conjecture is neither confirmed by the shape of the ΔSm(T) signal nor it was confirmed by additional heat capacity measurements in the temperature range 0.8–10 K [38]. Therefore it seems plausible that the reason for the presence of the secondary peaks is merely the proximity effect to the natural boundary of the temperature scale (T = 0 K). In order to shed some light onto that point a hypothetical paramagnetic medium was considered which consists of entities carrying the effective spins of S = 9/2 (2 SMn − SNb = 5/2 + 5/2 − 1/2). ΔTad of this medium may be found solving the following differential equation implied by the Maxwell thermodynamic relation:
where M(H,T) denotes the molar magnetization, CL stands for the lattice contribution to the total heat capacity, CH is the magnetic contribution. The baseline determined for 2 may serve as CL. The paramagnetic Hamiltonian corresponding to an isolated spin S subject to applied magnetic field provides the basis to calculate CH and . Let us note that in [38] an integral version of Equation (5) was used, which is incorrect due to the explicit T-dependence of its right-hand side. Solving Equation (5) with initial conditions T(Hi ≠ 0) = Ti in the field interval [Hi,Hf = 0] for several arbitrary values of the initial temperature Ti yields the system of adiabats shown in Figure 14 in the (H,T) plane.
Using Equation (5) the ΔTad signal was calculated for the magnetization processes Hi = 0 → Hf, with Hf assuming the integer field values, within the temperature interval 0 −55 K. The result is shown in Figure 15 together with the ΔTad signal of 2 (cf. Figure 13). Two points may be raised here. Firstly, the ΔTad(T) curves of the hypothetical medium are peaked at 0 K, which is the direct vicinity of the secondary peaks in the ΔTad signal of 2. Secondly, the magnitude of ΔTad of 2 is about four times smaller than that of the hypothetical medium. Strikingly enough, it may be concluded that the presence of a magnetic phase transition at some finite temperature has an adverse effect on MCE.
2.4. Coordination Polymer {[FeII(pyrazole)4]2[NbIV(CN)8]·4H2O}n
Compounds 2 and 3 share the crystallographic structure. The graphical representation of the crystal structure of 3 is shown in Figure 8 with the MnII ions replaced by the FeII ions. The magnetic data implied that the compound undergoes a transition to a long-range magnetically ordered state at Tc ≈ 7.8 K [3,16]. Moreover, the muon spin rotation spectroscopy (μSR) strongly suggested that the compound may be assigned to the universality class of the 3D Heisenberg model [40]. The calculations based on the mean field-model and the magnetometric data pointed to the antiferromagnetic character of the superexchange coupling between the FeII and NbIV centres [37].
The relaxation calorimetry technique implemented in the PPMS Quantum Design instrument was employed to measure the heat capacity of 3. The measurements were carried out both without applied field and in nonzero field in the range 0.36–20.2 K in the cooling direction. The temperature dependences of ΔSm and ΔTad were determined by employing Equations (1) and (2). In this case the entropy thermodynamic function S(T,H) was calculated without determining the normal heat capacity. However, the calculation required the extrapolation of Cp down to 0 K. Two independent contributions were considered in the extrapolation scheme involving two field-dependent parameters: . The first contribution accounts for the lattice degrees of freedom, whereas the second one is due to the magnonic excitations (the Bloch law).
Figure 16 shows the temperature dependence of ΔSm for μ0ΔH = 0.1, 0.2, 0.5, 1, 2, 5, and 9 T (Hi ≠ 0, Hf = 0). Table 3 lists the values of ΔSm attained at the maximum. The isostructural compounds {[MII(pyrazole)4]2[NbIV(CN)8]·4H2O}n with M = Ni and M = Mn reveal for μ0ΔH = 5 T equal to 6.1 J·K−1·mol−1 and 6.7 J·K−1·mol−1, respectively, which is higher than the value of 4.9 J·K−1·mol−1 detected for 3 [42]. It is surprising that it should be so for the Ni congener as the NiII ion carries lower spin (SNi = 1 < SFe = 2). However, it is consistent with the ferromagnetic superexchange present in the Ni compound [37] and the relatively stronger anisotropy of the FeII centre [13].
The field-averaged exponent n of 3 vs. temperature is depicted in Figure 17. Its estimation drew on the data in Figure 16. The n vs. T curve reveals a minimum of 0.63 slightly above Tc = 8.3 K (implied by the peak in the zero-field heat capacity). On further increase of temperature, it increases toward the value of 2, consistent with the fact that in the paramagnetic phase the susceptibility is independent of field (the Curie-Weiss law). At Tc parameter n takes on the value of 0.64, which, like in the case of 2, indicates that 3 belongs to the universality class of the 3D Heisenberg model.
Temperature dependence of ΔTad of 3 calculated using Equation (2) is shown in Figure 18. All the ΔTad vs. T curves reveal peaks in the vicinity of Tc. The peak values together with the peak positions are listed in Table 3 which indicates that the peak positions are slightly moved off Tc toward higher temperatures and are practically independent of the applied field change value. The presence of a field induced effect is suggested by the occurrence of an inflection point at about 4 K (most apparent for higher fields) followed by a sharp drop. The values of ΔTad are comparable to those reported for its Ni congener (2.0 K for μ0ΔH = 5 T, and 2.9 K for μ0ΔH = 9 T) [42], and larger than those found for Mn2-pyridazine-[Nb(CN)8] (1.5 K for μ0ΔH = 5 T) [43], hexacyanochromate Prussian blue analogues (1.2 K for μ0ΔH = 7 T) [45], and the Mn congener (1.42 K for μ0ΔH = 5 T, and 1.97 K for μ0ΔH = 9 T) [38]. The last case might seem surprising as the Mn ion carries the maximal spin value (SMn = 5/2) among the 3d ions. However, the Mn congener (2) displays the transition to the magnetically ordered phase at the temperature (22.8 K) which is more than twice as high than for 3, and the ratio of the magnetic excess heat capacity to the lattice heat capacity is expected to decrease with temperature. Thus the magnetic entropy for 2 may be admittedly higher than for 3, but it is faced with a relatively higher heat capacity at the transition temperature, which suppresses the magnitude of ΔTad.
2.5. Final Remarks of Section 2
In this Section we have demonstrated how one can employ the calorimetric data to determine two main characteristics of the magnetocaloric effect, i.e., the isothermal entropy change ΔSm and the adiabatic temperature change ΔTad. The pivotal step in the corresponding procedure is the calculation of the entropy thermodynamic function S(T,H) in the temperature interval starting from 0 K and for the given applied field values. Due to the experimental limitations, where the heat capacity measurements go down to a possibly small but finite temperature TL never reaching the limit of 0 K, the procedure is out of necessity only approximate. The approximation consists in the extrapolation of the low-temperature Cp(T,H) values from TL down to 0 K by using the heuristic algebraic function. Two approaches were considered, the simplified approach obviating the need to determine the normal heat capacity (baseline) and the more comprehensive approach, where the baseline is constructed using the polynomial approximation. Both approaches were exemplified by three instances of molecular magnets, the cluster compound involving 15 ferromagnetically coupled spins (1) and two isostructural 3D coordination polymers 2 and 3 including MnII and FeII ions, respectively. While 2 and 3 display the transitions to the magnetically long-range ordered phases, compound 1 does not order magnetically above 0.4 K. For the sake of comparison of the MCE signals of the studied compounds Figure 19 shows the temperature dependences of the isothermal entropy change ΔSm and the adiabatic temperature change ΔTad corresponding to the field change μ0ΔH = 5 T. It is apparent that at the lowest temperatures the cluster compound 1 substantially exceeds 2 and 3 in terms of the ΔSm and ΔTad signals. The peak values of the ΔSm quantity seem to monotonically depend on the constituent spin value with that for 1 being the highest (S = 12), that for 2 being intermediate (SMn = 5/2) and that for 3 being the smallest (SFe = 2). This hierarchy breaks down for the ΔTad peak values with the peak value of 3 exceeding that of 2, which can be rationalized by remembering that higher temperatures involve higher heat capacity values and a concomitantly lower heating or cooling effect. Compounds 2 and 3 can compete with 1 in terms of the ΔTad signal only in the intermediate temperature range. One can thus conclude that in order to optimize the MCE parameters one should strive to organize separate spin carriers in ferromagnetically coupled clusters rather than in 3D extended networks.
3. Magnetocaloric Properties and Critical Behaviour in Magnetically Ordered Compounds Investigated by Magnetometry
3.1. {[MII(H2O)2]2[NbIV(CN)8]·4H2O}n(M = Fe, Mn) Molecular Compounds
{[MnII(H2O)2]2[NbIV(CN)8]·4H2O}n (4) and {[FeII(H2O)2]2[NbIV(CN)8]·4H2O}n (5) are isostructural molecular magnets, which crystallize in tetragonal space group I4/m. Despite the same structure these compounds show different types of magnetic moments order. Mn-based compound (4) is a ferrimagnet with the coercive field equal to 0 Oe and critical temperature Tc equal to 50 K. Fe-based analogue (5) is an example of a ferromagnet with the coercive field equal to 145 Oe and Tc equal to 43 K [47,48]. For both compounds the magnetocaloric effect was determined using an indirect method involving the measurements of a series of isothermal magnetization curves as a function of external magnetic field M(H) in a wide temperature range: above and below the critical temperature (Figure 20a). The magnetic entropy change |ΔS| was calculated based on the integrated Maxwell’s relation given by the equation:
As expected, a maximum ΔS value occurs at temperatures corresponding to Tc, and |ΔS| increases with ΔH. The replacement of Fe by Mn in isostructural {[MII(H2O)2]2[NbIV(CN)8]·4H2O}n network causes an increase of |ΔS|max as well as the temperature at which the maximum value of the entropy change occurs [49]. The maximum values of |ΔS| are equal to 4.82 J mol−1K−1 (8.65 J kg−1K−1) and 5.07 J mol−1K−1 (9.09 J kg−1K−1) for the field change of 0–5 T for 5 and 4, respectively. Slightly higher values of the magnetic entropy change observed for 4 may be related to the spin value of the MnII ion (SMn = 5/2), being higher than that of the FeII ion (SFe = 2) and the typically soft magnetic character.
A useful parameter describing the efficiency of a magnetocaloric material is the relative cooling power (RCP) defined as , where δFWHM is the full width at half maximum of the magnetic entropy change curve. The RCP measured for an applied magnetic field of 5 T is equal to 118.40 and 125.43 J mol−1 (212.61 and 225.59 J kg−1) for 4 and 5, respectively. These values of RCP make about 50% of that of pure gadolinium-prototype magnetocaloric material.
An important aspect of the analysis of MCE is the construction of a universal curve of magnetic entropy change, a so-called master curve. Franco et al. [44,50] proposed that such universal entropy curve can be successfully used for determination of phase transition order. For the substances undergoing the second order phase transition, the temperature dependences of the magnetic entropy changes obtained at different applied magnetic fields may overlap after rescaling. The phenomenological universal curve can be constructed by normalizing all the ΔS(T) curves using their maximum value ΔSmax and, subsequently, re-scaling the temperature axis according to the following expression:
The values of reference temperatures Tr1, Tr2 were calculated based on , where h is a reference level with value from the range 0–1. For both studied materials: 4 and 5, the rescaled ΔS(T)curves, create one master curve in a wide temperature range, and thus the type of the magnetic order does not affect their construction. Figure 21 shows the comparison of universal entropy curves obtained for samples 4 and 5.
3.2. {[MII(pyrazole)4]2[NbIV(CN)8]3∙4H2O}n(M = Ni, Mn) Molecular Compounds
{[MnII(pyrazole)4]2[NbIV(CN)8]3∙4H2O}n (6) and [NiII(pyrazole)4]2[NbIV(CN)8]3∙4H2O}n (7) are subsequent examples of isostructural bimetallic compounds, where pyrazole is the five membered C3H4N2 ring. MCE results for 6 determined by calorimetry, including both the entropy change and the adiabatic temperature change, have been already discussed in paragraph 2.3. Below, we proceed the study to compare the effect in the Mn-based compound with that in the Ni-based compound. Both substances show a sharp phase transition, from a high- temperature paramagnetic to a low-temperature ordered state and while 6 is a ferrimagnet with critical temperature equal to 23.8 K, 7 is a ferromagnet with Tc = 13.4 K [37]. The higher values of the magnetic entropy change were observed for sample 6, despite the ferrimagnetic coupling between magnetic ions (see Figure 22) [42]. The higher value of magnetic entropy change observed for 6 may be related to the spin value of the MnII ion (SMn=5/2) being higher than that of the NiII ion (SNi = 1). For Ni-based compound, the magnetic entropy change was also determined by means of the heat capacity measurements. Obtained result is in good agreement with the previous estimation inferred from M(H, T) data. The similar reasonable agreement of the magnetically and thermally determined values of the magnetic entropy change was previously observed for some inorganic alloys [51]. Based on the heat capacity data for 7, we estimate the maximum value of the adiabatic temperature change ΔTad upon the applied magnetic field change of 9 T was equal to 2.9 K [42].
3.3. {MnII2(imH)2(H2O)4[NbIV(CN)8]∙4H2O}nMolecular Magnetic Sponge
{MnII2(imH)2(H2O)4[NbIV(CN)8]∙4H2O}n (8) is a molecular magnet, where imidazole is a bridging ligand. This compound is an example of magnetic sponge, because it allows an easy and reproducible control of the amount of water molecules absorbed in this material. During one-step dehydration, one new CN−bridge is formed in this material. The changes in the compound structure generated by the loss of water molecules cause the shift of the magnetic ordering temperature from 25 K (8) to 68 K (8deh) [52]. The dehydration process is responsible for the change of magnetocaloric properties of the system: the maximum value of magnetic entropy change determined for 8deh is 40% lower than for the as-synthesized compound 8 [53] (see Figure 23). Using the molecular field approximation (MFA) an attempt was made to explain the origin of the magnetic entropy changes in the system, for both forms 8 and 8deh. As shown in Figure 23, in comparison to the experimental MCE results, the calculated entropy change is underestimated above the transition temperature, which can be attributed to the fact that MFA does not account for the short-range correlations. However, below the critical temperature, the calculated entropy change is overestimated in relation to the experimental data [53]. This furthermore, may be attributed to the lack of thermal and quantum fluctuations in the mean field model. These fluctuations impede the magnetic moments reorientation caused by the change of magnetic field, thus the magnetic susceptibility is higher than in normal paramagnets.
3.4. [{[MnII(pydz)(H2O)2][MnII(H2O)2][NbIV(CN)8]}∙2H2O]nTwo-Step Molecular Magnetic Sponge
[{[MnII(pydz)(H2O)2][MnII(H2O)2][NbIV(CN)8]}∙2H2O]n(9) is an example of multifunctional molecular magnet, where a pyridazine,C4H4N2, was chosen as a bridging ligand. One of the unique properties of this compound is related to its two-step switchable magnetic sponge behaviour [33]. Within 6 h of dehydration of 9, the loss of four water molecules is observed, and 9 is transformed into dehydrated form—9deh. This process is responsible for destabilization of hydrogen bonds and causes intraskeletal molecular rearrangement: formation of a new Nb–CN–Mn bond as well as migration of the pyridazine ligand between two Mn centres. The structural changes occurring during the dehydration induce a significant increase of critical temperature from 43 K, observed for 9, to 68 K recorded for 9deh. In the second step of dehydration (of about 24 h) two remaining water molecules are removed and new stable, anhydrous phase 9anh is formed. During this process the material structure does not change but some bonds are shortened. The critical temperature of anhydrous sample is equal to 98 K. The transformation from the initial, as synthesized 9 to the anhydrous form 9anh is reversible [33].
As depicted in Figure 24, for all three forms of the compound: 9, 9deh, and 9anh, a maximum ΔS value occurs at temperatures corresponding to consecutive Tc, and |ΔS| increases with ΔH. The highest value of magnetic entropy change is revealed for 9. For dehydrated and anhydrous samples values of magnetic entropy change are similar—lower by 40% than that observed for the as-synthetized material. This result is perfectly correlated with AC susceptibility data: the decrease in ΔS by a factor of 0.6 for 9deh and 9anh relative to 9 corresponds to the same reduction in the χ’(T) magnitude of 9deh and 9anh [43].
For the as-synthesized sample 9 the heat capacity measurements were performed, first at zero applied field and then at 0.2, 0.5, and 1 T. The data obtained from this experiment were used for the evaluation of magnetocaloric effect based on the magnetothermal method. The values of the magnetic entropy change calculated based on the heat capacity and magnetic data are in very good agreement. Furthermore, it was also possible to estimate, from the heat capacity data, the adiabatic entropy change associated with the change of magnetic entropy. The maximum value of the adiabatic temperature change determined for 9, corresponding to the change of magnetic field from 0 to 1 T, is equal to 1.5 K [43].
3.5. [{[MnII(pydz)(H2O)2][MnII(H2O)2][NbIV(CN)8]}∙2H2O]nMolecular Compound under Pressure
The uniqueness of compound 9 is also related to the possibility of the change of the magnetic properties by the application of hydrostatic pressure [54]. The application of hydrostatic pressure of 1.8 GPa results in the compression of the unit cell (ca. 7.6% in total volume) and a noticeable bending of the Mn-NC-Nb linkages. These structural modifications are accompanied by the change in magnetic properties of examined compound. The increase of the applied pressure increases the ordering temperature up to 48 K, 50.5 K and 52.5 K for pressure of 0.27 GPa, 0.57 GPa and 1.19 GPa, respectively. The shift of Tc towards higher temperatures due to application of mechanical stress is the result of the strengthening of Mn- and Nb-sublattice coupling due to the enhanced overlap of magnetic orbitals. The analysis of MCE for sample under pressure of 1.19 GPa (9HP) showed the reduction of |ΔS|max value in relation to as-synthesized compound 9 by 13.6% (see Figure 25) [55]. The summary of the magnetocaloric properties of all forms of molecular magnet 9 as well as results obtained for other octacyanoniobate- based compounds are presented in Table 4.
3.6. Tc−2/3 Dependence of the Maximum Entropy Change
Oesterreicher and Parker predicted that the maximum value of magnetic entropy change is proportional to Tc−2/3 [7]. This relation has been proved for the series of intermetallic samples [9]. Taking into account that in the compounds based on manganese and octacyanoniobate, the structural changes caused by the external stimuli or selection of a bridging ligand did not affect magnetic moment of Mn and Nb sublattices, while the critical temperature was changed, it was possible to verify the relation: |ΔS|max~Tc−2/3.
Figure 26a shows the comparison of the temperature dependences of magnetic entropy upon changing the magnetic field from 0 to 3 T, measured for samples: 9, 9deh, 9anh, 9HP, 8, 8deh, 4 and 6. The clear reduction of the height of the ΔS(T) peak with the increase of the critical temperature is observed. The slight deviation from this behaviour occurs for 9deh, because the maximum value of magnetic entropy change is smaller than expected. It can be explained by instability of partially dehydrated sample. Figure 26b presents the values of magnetic entropy change as a function of Tc−2/3 in all Mn-Nb based compounds under study obtained at the change of magnetic field from 0 to 1 T, 3 T and 5 T. The linear character of all determined relations confirms the proportionality of |ΔS|max to Tc−2/3.
3.7. The Critical Behaviour of the 3 D Octacyanoniobate- Based Compounds
The MCE is an intrinsic thermodynamic characteristic and in the vicinity of the ferro- and ferrimagnetic transition reflects the critical behaviour of the system. Thus, the critical exponents can be extracted by use of the isothermal magnetization curves measured with the aim to determine the magnetic entropy change. According to the scaling hypothesis, the spontaneous magnetization Ms below Tc, the inverse initial susceptibility χ0 above Tc, and the magnetization dependence on magnetic field M(H) measured at temperature Tc are characterized by the set of critical exponents β, γ and δ. These exponents are defined by the following relations:
where ε is a reduced temperature defined as
According to the mean field theory, which predicts in the vicinity of critical temperature Tc, β = 0.5 and γ = 1, the isotherms M2(H/M), so called Arrot plots, should consist of series of parallel straight lines, and the isotherm measured at Tc should pass through the origin of coordinate system. Arrot plots can be used for the determination of the order of phase transition occurring in the material under study. According to the Banerjee criterion [56], a positive slope of the M2(H/M) indicates a magnetic phase transition of the second order, while a negative slope corresponds to the first order phase transition. For all the octacyanoniobate-based samples the positive slope of M2(H/M) plots was observed, indicating the second order of the magnetic phase transition. The non-linear shape of M2(H/M) Arrot for all discussed samples plots indicates that mean field approach does not describes properly the critical properties of these materials.
The critical exponents β and γ were determined by using the Kouvel–Fisher method [57]. In the Kouvel–Fisher method two new variables X and Y are defined as
X(T) and Y(T) are the linear functions of temperature with slope of 1/γ and 1/β, respectively. The intercepts of X(T) and Y(T) with the temperature axis correspond to the critical temperatures. Figure 27a shows an exemplary result obtained for sample 4 with the Kouvel–Fisher method, which next was used for the determination of the critical exponents β and γ for samples 9, 9deh, 9anh, 9HP, 8, 8deh, 4, and 6 [42,43,53,55,58]. The obtained results are presented in Table 5.
The value of critical exponent δ was estimated using the M(H) isotherm measured at temperature Tc. The magnetization curve measured at Tc presented in log–log plot is expected to be a straight line with a slope 1/δ. The example result of the analysis of the critical isotherm measured for 4 is shown in Figure 27c.
In the materials undergoing the second order phase transition, the magnetic entropy change is related to the change of the external magnetic field by the relation: where n is a successive critical exponent. The mean field theory predicts the exponent n = 1 for the temperatures well below Tc, and n = 2 well above Tc. At critical temperature n is equal to 2/3. The analysis of temperature dependence of exponent n shows that for all octacyanoniobate-based compounds, shapes of the n(T) plot are very similar and the values of n at Tc are very close to 2/3. The example of dependence n(T) obtained for 4 is presented in Figure 27d.
Thus, having the values of the critical exponents β and γ obtained with the Kouvel–Fisher method, the value of the critical exponent n can be estimated. For all octacyanoniobate-based samples we obtained a very good agreement between the values of critical exponent n determined using Equation (13) (in Table 5 denoted as ntheor) with the experimentally determined values based on MCE data (in Table 5 denoted as nMCE).
The analysis of the critical exponents determined for the series of octacyanoniobate-based samples showed that except sample (7), all the examined compounds can be assigned to the universality class of the 3D Heisenberg model. It means that neither structural change due to the insertion of bridging ligands into the structure nor the influence of the external stimuli significantly affect the critical behaviour of the octacyanometallates-based materials. The result obtained for sample 7 is more consistent with XY model.
We have also compared the described above values of the critical exponents with the values predicted from the scaling hypothesis. In critical region, the magnetic equation of state can be written as:
where f± is the scaling function: f+ for T > Tc, f− for T < Tc. Equation (14) suggests, that M |ε|−β plotted as a function of H·|ε |−(β+γ) should give two different curves: one corresponding to the temperatures below the ordering temperature, and the other for temperatures above Tc. For all the studied samples for which the critical exponent β and γ were determined with Kouvel–Fisher method, M |ε|−β vs. H·|ε |−(β+γ) plots exhibit two independent branches, indicating that the values of the critical exponents are reasonably accurate. Figure 27b presents the example of logarithmic scaling plot of M |ε|−β vs. H·|ε |−(β+γ) obtained for sample 4.
3.8. Final Remarks of Section 3
In this section we have investigated the magnetocaloric effect and critical behaviour in molecular magnets showing long-range magnetic order. The most important issue of this study was the test of the influence of bridging ligands and external stimuli on magnetocaloric properties of examined samples.
We have demonstrated that for the manganese octacyanoniobate-based samples with different brigding ligand—pyridazine, pyrazole, imidazole, for which the magnetocaloric effect was determined for as-synthetized samples and modified by external stimuli—the maximum value of magnetic entropy change ΔSmax is proportional to Tc−2/3.
We have also proved, that 3D Heisenberg model is the most adequate for the description of critical behaviour of octacyanoniobate-based molecular magnets. The analysis of critical exponents β, γ, δ, and n showed that neither structural changes due to the insertion of bridging ligands into the structure nor the influence of external stimuli such as hydrostatic pressure and dehydration/hydration process do not significantly affect the critical behaviour of octacyanometallate- based materials. Moreover, the value of critical exponent n describing the field dependence of MCE according to is consistent with other critical exponents obtained from the magnetization data.
4. Rotating Magnetocaloric Effect in Anisotropic Two-Dimensional Molecular Magnets
The rotating magnetocaloric effect (RMCE) is a new issue in the magnetic cooling research. In contrast to conventional magnetocaloric effect, in RMCE the change of entropy is obtained not by changing the external magnetic field, but with rotation of a single crystal in a constant magnetic field [59,60,61,62]. If the compound reveals a substantial magnetic anisotropy, then the magnetic entropy will depend on the crystal orientation in the magnetic field. The rotation is changing the crystal orientation with respect to the applied field direction, therefore a change of magnetic entropy is observed and can be used in cooling cycle. Recently, Balli et al. [63,64] have introduced a realization of refrigerator based on RMCE. This approach has several advantages: simple construction, high efficiency [63,64,65] (cycles in higher frequency than the conventional MCE), or working in constant field (lower power consumption, possibility of use permanent magnets).
Most of the research concerning rotating magnetocaloric effect deals with inorganic materials [59,60,61,63,64,66,67,68] and there are only few examples related to molecular magnets [69]. In our research we have focused on two-dimensional molecular compounds which reveal magnetic anisotropy and transition to long-range ordered phase. Single crystal studies allowed us to explore the anisotropy of MCE. The dependence of MCE on the orientation was used to study the RMCE in case of low (MnII(R-mpm)2]2[NbIV(CN)8]}∙4H2O) [70] and high ({(tetren)H5)0.8CuII4[WV(CN)8]4·7.2H2O}n) [71] magnetic anisotropy. In particular, we have shown that inverse magnetocaloric effect can be used to enhance the RMCE up to 51% in respect to conventional MCE.
4.1. Low Anisotropy Case: {MnII(R-mpm)2]2[NbIV(CN)8]}∙4H2OCrystal
{MnII(R-mpm)2]2[NbIV(CN)8]}∙4H2O (10), where mpm = α-methyl-2-pyridinemethanol, is a two-dimensional coordination ferrimagnet [70]. The separation between layers of square grid topology is 7.5 Å. Nevertheless, the compound reveals a phase transition to 3D long-range magnetic ordered state at Tc = 23.5 K due to intermolecular dipole-dipole interactions. The magnetic single crystal measurements of 10 showed an easy-plane type anisotropy within the layers, whereas the perpendicular direction was a hard axis [72]. The observed anisotropy was not significant, since above 0.35 T applied field both orientations was magnetically undistinguishable. The magnetocaloric effect was obtained by the indirect method from magnetization measurements in two orientations: bc||H (easy plane) and a*||H (hard axis).
In high magnetic fields (above 1.0 T) the difference between magnetic entropy change in both orientations is modest (Figure 28a), as a consequence of low magnetic anisotropy. In lower fields the value of −ΔSm is small, but the relative change between easy plane and hard direction is more significant (Figure 28b). Moreover, in the hard axis orientation an inverse magnetocaloric effect can be noticed. The magnetic entropy change related to rotation (ΔSRMCE) by 90° from hard direction (a*||H, hard axis) to easy axis (bc||H) can be calculated by
where ΔSeasy and ΔShard stands for magnetic entropy change in easy plane and hard axis orientations, respectively. Figure 28 and Figure 29 show the obtained values of −ΔSRMCE. In high magnetic fields (Figure 28a) both conventional MCE, for hard axis and easy plane, are greater than the RMCE in whole temperature range. The situation is changing in lower fields μ0H < 0.2 T (Figure 28b), for which the RMCE can have higher output even than the MCE for easy plane. This excess is a consequence of rotation from hard axis (higher entropy) to easy plane (lower entropy) orientation and the inverse MCE in hard axis. Figure 30 shows the ratio between the entropy change from RMCE and conventional MCE. Depending on the applied field and the temperature, the RMCE can be more efficient than MCE in an easy plane up to 51%.
4.2. High Anisotropy Case: (tetren)Cu4[W(CN)8]4 Crystal
The high anisotropy case was studied [71] with (tetren)Cu4[W(CN))8]4 (11)(full formula: {(tetren)H5)0.8CuII4[WV(CN)8]4·7.2H2O}n, tetren = tetraethylenepentamine), a 2D cyanido-bridged network with significant 2D XY magnetic anisotropy (ac is the easy plane, b is the hard axis) and the Berezinskii-Kosterlitz-Thouless [73] topological phase transition at TBKT ≈ 33 K [74,75]. The anisotropy for 11 is so high, that even μ0H = 7.0 T magnetic field is too weak to merge magnetization curves of two orientations at 2.0 K [71]. The conventional and rotating magnetocaloric effects were studied in a similar procedure to the low anisotropy case (10). However, in this case the difference between magnetic entropy change for hard and easy orientations was relevant up to the highest measured field μ0H = 7.0 T (Figure 31). Therefore, the absolute values of −ΔSRMCE for the RMCE were one order of magnitude higher than for 10 (Figure 32). The temperature dependences of ΔSRMCE for 11 have peculiar shapes with two peaks for fields below 7.0 T and a single peak for the highest field. The double peaks are related to different dependences of ΔS maxima for easy and hard orientation. The study also showed that it is possible to obtain an inverse RMCE (Figure 31 and Figure 32), as a consequence of temperature region where the −ΔSm for hard axis is higher than for the easy plane.
Figure 33 shows the ratio between the conventional and rotating MCE for 11. Similar to the low anisotropy case of 10, there is a region where ΔSRMCE is more efficient than the MCE for easy plane. However, the ΔSRMCE/ΔSeasy ratio shows also negative values for lower fields (μ0H < 3.0 T) and temperatures around 30 K. These negative values correspond to the conditions, where the sign of the ΔSRMCE is negative, in other words, where the inverse RMCE occurs.
4.3. Final Remarks of Section 4
The rotational magnetocaloric effect is an alternative method for magnetic cooling. In our works we were studying 2D molecular magnets with low and high anisotropy. We have proven that the RMCE can be, in specific circumstances, more efficient than the conventional MCE and that the inverse RMCE is also possible. In our opinion, the rotating magnetocaloric effect in molecular magnets has potential application as cryogenic refrigerator. However, to compete with other types of low temperature refrigerators (e.g., He-3 type), the good candidate for a molecular RMCE refrigerant should be characterized by the following features [71]: (1) strong magnetic anisotropy, (2) Tc around 2 K, (3) large magnetic moments with ferromagnetic interactions, (4) easy plane anisotropy to achieve the RMCE enhancement due to the inverse MCE.
5. Final Conclusions
In this review, the magneto-thermal properties of octacyanometallate-based molecular magnets showing the different types of crystal architecture have been discussed. The investigation of magnetocaloric effect has been performed by two experimental methods: calorimetry and magnetometry. The highest value of magnetic entropy change and the change of adiabatic temperature was observed for the high-spin dodecanuclear cluster Ni9[W(CN)8]6 making this compound a suitable candidate for application in cryogenic magnetic cooling. The systematic study of magnetocaloric effect in the ligand tunable coordination compounds is based on manganese and octacyanoniobate, showing the wide temperature range in which Tc occurs, allowing us to confirm the ΔSm ~ Tc−2/3 relation stemming from the molecular field theory. The set of critical exponents obtained for these compounds series belong to the 3D Heisenberg universality class. Finally, we have presented the study of rotating magnetocaloric effect (RMCE) in two 2D molecular magnets: ferromagnetic {MnII(R-mpm)2]2[NbIV(CN)8]}∙4H2O and strongly anisotropic (tetren)Cu4[W(CN)8]4 bilayered magnet showing the topological Berezinskii- Kosterlitz-Thouless transition.
Author Contributions
Funding
This research was funded by the Polish National Science Centre within the frame of Project No. DEC-2013/11/N/ST8/01267 and UMO-2011/03/D/ST5/05400.
Conflicts of Interest
The authors declare no conflict of interest.
References
- Kahn, O. Molecular Magnetism; VCH Weinheim: Weinheim, Germany, 1993. [Google Scholar]
- Gatteschi, D.; Sessoli, R.; Villain, J. Molecular Nanomagnets; Oxford University Press: Oxford, UK, 2003. [Google Scholar]
- Bartolomé, J.; Luis, F.; Fernández, J.F. Molecular Magnets—Physics and Applications; Springer: Berlin/Heidelberg, Germany, 2014. [Google Scholar]
- Sieklucka, B.; Pinkowicz, D. Molecular Magnetic Materials—Concepts and Applications; VCH Weinheim: Weinheim, Germany, 2017. [Google Scholar]
- Zhang, Q.; Li, B.; Zhao, X.G.; Zhang, Z.D. Magnetic and reversible magnetocaloric properties of (Gd1−xDyx)4Co3 ferrimagnets. J. Appl. Phys. 2009, 105, 053902. [Google Scholar] [CrossRef]
- Samanta, T.; Das, I.; Banerjee, S. Giant magnetocaloric effect in antiferromagnetic ErRu2Si2 compound. Appl. Phys. Lett. 2007, 91, 152506. [Google Scholar] [CrossRef]
- Oesterreicher, H.; Parker, F.T. Magnetic cooling near Curie temperatures above 300 K. J. Appl. Phys. 1984, 55, 4334. [Google Scholar] [CrossRef]
- Franco, V.; Blázquez, J.S.; Conde, A. Field dependence of the magnetocaloric effect in materials with a second order phase transition: A muster curve for the magnetic entropy change. Appl. Phys. Lett. 2006, 89, 222512. [Google Scholar] [CrossRef]
- Belo, J.H.; Amaral, J.S.; Pereira, A.M.; Amaral, V.S.; Araújo, J.P. On the Curie temperature dependency of the magnetocaloric effect. Appl. Phys. Lett. 2012, 100, 242407. [Google Scholar] [CrossRef]
- Von Ranke, P.J.; Gama, S.; Coelho, A.A.; De Campos, A.; Magnus, A.; Carvalho, G.; Gandra, F.C.; de Oliveira, N.A. Theoretical description of the colossal entropic magnetocaloric effect: Application to MnAs. Phys. Rev. B 2006, 73, 014415. [Google Scholar] [CrossRef]
- Gutfleisch, O.; Willard, M.A.; Brück, E.; Chen, C.H.; Sankar, S.G.; Liu, J.P. Magnetic Materials and Devices for the 21st Century: Stronger, Lighter, and More Energy Efficient. Adv. Mater. 2011, 23, 821. [Google Scholar] [CrossRef]
- Sessoli, R. Chilling with Magnetic Molecules. Angew. Chem. Int. Ed. 2012, 51, 43. [Google Scholar] [CrossRef]
- Evangelisti, M.; Brechin, E.K. Recipes for enhanced molecular cooling. Dalton Trans. 2010, 39, 4672–4676. [Google Scholar] [CrossRef]
- Sibille, R.; Mazet, T.; Malaman, B.; François, M. A Metal–Organic Framework as Attractive Cryogenic Magnetorefrigerant. Chem. Eur. J. 2012, 18, 12970. [Google Scholar] [CrossRef]
- Evangelisti, M.; Roubeau, O.; Palacios, E.; Camón, A.; Hooper, T.N.; Brechin, E.K.; Alonso, J.J. Cryogenic magnetocaloric effect in a ferromagnetic molecular dimer. Angew. Chem. Int. Ed. 2011, 50, 6606–6609. [Google Scholar] [CrossRef] [PubMed]
- Peng, J.B.; Zhang, Q.C.; Kong, X.J.; Zheng, Y.Z.; Ren, Y.P.; Long, L.S.; Huang, R.B.; Zheng, L.S.; Zheng, Z. High-Nuclearity 3d–4f Clusters as Enhanced Magnetic Coolers and Molecular Magnets. J. Am. Chem. Soc. 2012, 134, 3314–3317. [Google Scholar] [CrossRef] [PubMed]
- Chang, L.X.; Xiong, G.; Wang, L.; Cheng, P.; Zhao, B.A. 24-Gd nanocapsule with a large magnetocaloric effect. Chem. Commun. 2013, 49, 1055. [Google Scholar] [CrossRef] [PubMed]
- Chen, Y.C.; Guo, F.S.; Liu, J.-L.; Leng, J.-D.; Vrábel, P.; Orendáč, M.; Prokleška, J.; Sechovský, V.; Tong, M.L. Switching of the Magnetocaloric Effect of MnII Glycolate by Water Molecules. Chem. Eur. J. 2014, 20, 3029. [Google Scholar] [CrossRef]
- Liu, J.-L.; Chen, Y.-C.; Guo, F.-S.; Tong, M.-L. Recent advances in the design of magnetic molecules for use as cryogenic magnetic coolants. Coord. Chem. Rev. 2014, 281, 26. [Google Scholar] [CrossRef]
- Entley, W.R.; Girolami, G.S. High-Temperature Molecular Magnets Based on Cyanovanadate Building Blocks: Spontaneous Magnetization at 230 K. Science 1995, 268, 397–400. [Google Scholar] [CrossRef]
- Verdaguer, M.; Girolami, G. Magnetic Prussian Blue Analogs. In Magnetism: Molecules to Materials V; Miller, J.S., Drillon, M., Eds.; Wiley-VCH Verlag GmbH: Weinheim, Germany, 2001; pp. 283–347. [Google Scholar]
- Sieklucka, B.; Podgajny, R.; Pinkowicz, D.; Nowicka, B.; Korzeniak, T.; Bałanda, M.; Wasiutyński, T.; Pełka, R.; Makarewicz, M.; Czapla, M.; et al. Towards high Tc octacyanometalate-based networks. CrystEngComm 2009, 11, 2032. [Google Scholar] [CrossRef]
- Sieklucka, B.; Podgajny, R.; Korzeniak, T.; Nowicka, B.; Pinkowicz, D.; Kozieł, M. A decade of octacyanides in polynuclear molecular materials. Eur. J. Inorg. Chem. 2011, 3, 305. [Google Scholar] [CrossRef]
- Nowicka, B.; Korzeniak, T.; Stefańczyk, O.; Pinkowicz, D.; Chorąży, S.; Podgajny, R.; Sieklucka, B. The impact of ligands upon topology and functionality of octacyanidometallate-based assemblies. Coord.Chem.Rev. 2012, 256, 1946. [Google Scholar] [CrossRef]
- Song, Y.; Zhang, P.; Ren, X.-M.; Shen, X.-F.; Li, Y.-Z.; You, X.-Z. Octacyanometalate-based single-molecule magnets: CoII9MV6 (M = W, Mo). J. Am. Chem. Soc. 2005, 127, 3708. [Google Scholar] [CrossRef]
- Yoo, H.S.; Ko, H.H.; Ryu, D.W.; Lee, J.W.; Yoon, J.H.; Lee, W.R.; Kim, H.C.; Koh, E.K.; Hong, C.S. Octacyanometalate-Based Ferrimagnetic MVMnIII (M = Mo, W) bimetallic chain racemates with slow magnetic relaxations. Inorg. Chem. 2009, 48, 5617. [Google Scholar] [CrossRef] [PubMed]
- Chorazy, S.; Stanek, J.; Nogas, W.; Majcher, A.M.; Rams, M.; Kozieł, M.; Juszyńska-Gałązka, E.; Nakabayashi, K.; Ohkoshi, S.; Sieklucka, B.; et al. Tuning of charge transfer assisted phase transition and slow magnetic relaxation functionalities in {Fe9−xCox[W(CN)8]6} (x = 0–9) molecular solid solution. J. Am. Chem. Soc. 2016, 138, 1635. [Google Scholar] [CrossRef] [PubMed]
- Nowicka, B.; Rams, M.; Stadnicka, K.; Sieklucka, B. Reversible Guest-Induced Magnetic and Structural Single-Crystal-to-Single-Crystal Transformation in Microporous Coordination Network {[Ni(cyclam)]3 [W(CN)8]2}n. Inorg. Chem. 2007, 46, 8123. [Google Scholar] [CrossRef] [PubMed]
- Nowicka, B.; Reczyński, M.; Rams, M.; Nitek, W.; Kozieł, M.; Sieklucka, B. Larger pores and higher TC: {[Ni(cyclam)]3[W(CN)8]2·solv}n—A new member of the largest family of pseudo-polymorphic isomers among octacyanometallate-based assemblies. CrystEngComm 2015, 17, 3526. [Google Scholar] [CrossRef]
- Ohkoshi, S.; Tokoro, H.; Hozumi, T.; Zhang, Y.; Hashimoto, K.; Mathonière, C.; Bord, I.; Rombaut, G.; Verelst, M.; Moulin, C.C.D.; et al. Photoinduced Magnetization in Copper Octacyanomolybdate. J. Am. Chem. Soc. 2006, 128, 270. [Google Scholar] [CrossRef] [PubMed]
- Ohkoshi, S.; Tokoro, H. Photomagnetism in Cyano-Bridged Bimetal Assemblies. Acc. Chem. Res. 2012, 45, 1749. [Google Scholar] [CrossRef] [PubMed]
- Pinkowicz, D.; Podgajny, R.; Nitek, W.; Rams, M.; Majcher, A.M.; Nuida, T.; Ohkoshi, S.; Sieklucka, B. Multifunctional Magnetic Molecular {[MnII(urea)2(H2O)]2[NbIV(CN)8]}n System: Magnetization-Induced SHG in the Chiral Polymorph. Chem. Mater. 2011, 23, 21. [Google Scholar] [CrossRef]
- Pinkowicz, D.; Podgajny, R.; Gaweł, B.; Nitek, W.; Łasocha, W.; Oszajca, M.; Czapla, M.; Makarewicz, M.; Bałanda, M.; Sieklucka, B. Double Switching of a Magnetic Coordination Framework through Intraskeletal Molecular Rearrangement. Angew. Chem. Int. Ed. 2011, 50, 3973. [Google Scholar] [CrossRef]
- Arczyński, M.; Rams, M.; Stanek, J.; Fitta, M.; Sieklucka, B.; Dunbar, K.R.; Pinkowicz, D. A Family of Octahedral Magnetic Molecules Based on [NbIV(CN)8]4−. Inorg. Chem. 2017, 56, 4021. [Google Scholar] [CrossRef]
- Nowicka, B.; Stadnicka, K.; Nitek, W.; Rams, M.; Sieklucka, B. Geometrical isomerism in pentadecanuclear high-spin Ni9W6 clusters with symmetrical bidentate ligands detected. CrystEngComm 2012, 14, 6559. [Google Scholar] [CrossRef]
- Gajewski, M.; Pełka, R.; Fitta, M.; Miyazaki, Y.; Nakazawa, Y.; Bałanda, M.; Reczyński, M.; Nowicka, B.; Sieklucka, B. Magnetocaloric effect of high spin cluster with Ni9W6 core. J. Magn. Magn. Mater. 2016, 414, 25. [Google Scholar] [CrossRef]
- Pinkowicz, D.; Pełka, R.; Drath, O.; Nitek, W.; Bałanda, M.; Majcher, A.M.; Poneti, G.; Sieklucka, B. Nature of magnetic interactions in 3D {[MII(pyrazole)4]2[NbIV(CN)8]·4H2O}n (M = Mn, Fe, Co, Ni) molecular magnets. Inorg. Chem. 2010, 49, 7565. [Google Scholar] [CrossRef]
- Pełka, R.; Gajewski, M.; Miyazaki, Y.; Yamashita, S.; Nakazawa, Y.; Fitta, M.; Pinkowicz, D.; Sieklucka, B. Magnetocaloric effect in Mn2-pyrazole-[Nb(CN)8] molecular magnet by relaxation calorimetry. J. Magn. Magn. Mater. 2016, 419, 435. [Google Scholar] [CrossRef]
- Pełka, R.; Konieczny, P.; Zieliński, P.M.; Wasiutyński, T.; Miyazaki, Y.; Inaba, A.; Pinkowicz, D.; Sieklcuka, B. Magnetocaloric effect in {[Fe(pyrazole)4]2[Nb(CN)8]·4H2O}n molecular magnet. J. Magn. Magn. Mater. 2014, 354, 359. [Google Scholar] [CrossRef]
- Konieczny, P.; Pełka, R.; Zieliński, P.M.; Pratt, F.L.; Pinkowicz, D.; Sieklucka, B.; Wasiutyński, T. Scaling analysis of [Fe(pyrazole)4]2[Nb(CN)8] molecular magnet. J. Magn. Magn. Mater. 2013, 344, 105. [Google Scholar] [CrossRef]
- Evangelisti, M.; Candini, A.; Affronte, M.; Pasca, E.; de Jongh, L.J.; Scott, R.T.W.; Brechin, E.K. Magnetocaloric effect in spin degenerated molecular nanomagnets. Phys. Rev. B 2009, 79, 104414. [Google Scholar] [CrossRef]
- Fitta, M.; Bałanda, M.; Mihalik, M.; Pełka, R.; Pinkowicz, D.; Sieklucka, B.; Zentková, M. Magnetocaloric effect in M-pyrazole-[Nb(CN)8] molecular compounds. J. Phys.Condens. Matter. 2012, 24, 506002. [Google Scholar] [CrossRef] [PubMed]
- Fitta, M.; Pełka, R.; Bałanda, M.; Czapla, M.; Mihalik, M.; Pinkowicz, D.; Sieklucka, B.; Wasiutyński, T.; Zentková, M. Magnetocaloric effect in Mn2-pyridazine-[Nb(CN)8] molecular magnetic sponge. Eur. J. Inorg. Chem. 2012, 2012, 3830. [Google Scholar] [CrossRef]
- Franco, V.; Conde, A.; Romero-Enrique, J.M.; Blázquez, J.S. A universal curve for the magnetocaloric effect: An analysis based on scaling relations. J. Phys. Condens. Matter 2008, 20, 285207. [Google Scholar] [CrossRef]
- Campostrini, M.; Hasenbusch, M.; Palissetto, A.; Rossi, P.; Vicari, E. Critical exponents and equation of state of the three-dimensional Heisenberg universality class. Phys. Rev. B 2002, 65, 144520. [Google Scholar] [CrossRef] [Green Version]
- Manuel, E.; Evangelisti, M.; Affronte, M.; Okubo, M.; Train, C.; Verdaguer, M. Magnetocaloric effect in hexacyanochromate Prussian blue analogs. Phys. Rev. B 2006, 73, 172406. [Google Scholar] [CrossRef]
- Herrera, J.M.; Franz, P.; Podgajny, R.; Pilkington, M.; Biner, M.; Decurtins, S.; Stoeckli-Evans, H.; Neels, A.; Garde, R.; Dromzee, Y.; et al. Three-dimensional bimetallic octacyanidometalates [MIV{(µ-CN)4MnII(H2O)2}2∙4H2O]n (M= Nb, Mo, W): Synthesis, single-crystal X-ray diffraction and magnetism. C. R. Chim. 2008, 11, 1192. [Google Scholar] [CrossRef]
- Pinkowicz, D.; Podgajny, R.; Pelka, R.; Nitek, W.; Balanda, M.; Makarewicz, M.; Czapla, M.; Zukrowski, J.; Kapusta, C.; Zajac, D.; et al. Iron(II)-octacyanoniobate(IV) ferromagnet with TC 43 K. Dalton Trans. 2009, 7771. [Google Scholar] [CrossRef] [PubMed]
- Fitta, M.; Pełka, R.; Sas, W.; Pinkowicz, D.; Sieklucka, B. Dinuclear molecular magnets with unblocked magnetic connectivity: Magnetocaloric effect. RSC Adv. 2018, 8, 14640. [Google Scholar] [CrossRef]
- Franco, V.; Caballero-Flores, R.; Conde, A.; Knipling, K.E.; Willard, M.A. Magnetocaloric effect and critical exponents of Fe77Co5.5Ni5.5Zr7B4Cu1: A detailed study. J. Appl. Phys. 2011, 109, 07A905. [Google Scholar] [CrossRef]
- Foldeaki, M.; Schnelle, W.; Gmelin, E.; Benard, P.; Koszegi, B.; Giguere, A.; Chahine, R.; Boseet, T.K. Comparison of magnetocaloric properties from magnetic and thermal measurements. J. Appl. Phys. 1997, 82, 309. [Google Scholar] [CrossRef]
- Pinkowicz, D.; Podgajny, R.; Bałanda, M.; Makarewicz, M.; Gaweł, B.; Łasocha, W.; Sieklucka, B. Magnetic Spongelike Behavior of 3D Ferrimagnetic {[MnII(imH)]2[NbIV(CN)8]}n with Tc = 62 K. Inorg. Chem. 2008, 47, 9745. [Google Scholar] [CrossRef] [PubMed]
- Fitta, M.; Pełka, R.; Gajewski, M.; Mihalik, M.; Zentkova, M.; Pinkowicz, D.; Sieklucka, B.; Bałanda, M. Magnetocaloric effect and critical behavior in Mn2-imidazole-[Nb(CN)8] molecular magnetic sponge. J. Magn. Magn. Mater. 2015, 396. [Google Scholar] [CrossRef]
- Pinkowicz, D.; Kurpiewska, K.; Lewiński, K.; Bałanda, M.; Mihalik, M.; Zentkova, M.; Sieklucka, B. High-pressure single-crystal XRD and magnetic study of aoctacyanoniobate-based magnetic sponge. CrystEngComm 2012, 14, 5224. [Google Scholar] [CrossRef]
- Fitta, M.; Bałanda, M.; Pełka, R.; Konieczny, P.; Pinkowicz, D.; Sieklucka, B. Magnetocaloric effect and critical behaviour in Mn2-pyridazine-[Nb(CN)8] molecular compound under pressure. J. Phys. Condens. Matter 2013, 25, 496012. [Google Scholar] [CrossRef]
- Banerjee, S.K. On a generalised approach to first and second order magnetic transitions. Phys. Lett. 1964, 12, 16. [Google Scholar] [CrossRef]
- Kouvel, J.S.; Fisher, M.E. Detailed Magnetic Behavior of Nickel Near its Curie Point. Phys. Rev. 1964, 136, A1626. [Google Scholar] [CrossRef]
- Pełka, R.; Pinkowicz, D.; Sieklucka, B.; Fitta, M. Molecular realizations of 3D Heisenberg magnet: Critical scaling. J. Alloys Compd. 2018, 765, 520. [Google Scholar] [CrossRef]
- Nikitin, S.A.; Skokov, K.P.; Koshkid’ko, Y.S.; Pastushenkov, Y.G.; Ivanova, T.I. Giant Rotating Magnetocaloric Effect in the Region of Spin-Reorientation Transition in the NdCo5 Single Crystal. Phys. Rev. Lett. 2010, 105, 137205. [Google Scholar] [CrossRef] [PubMed]
- Orendáč, M.; Gabáni, S.; Gažo, E.; Pristáš, G.; Shitsevalova, N.; Siemensmeyer, K.; Flachbart, K. Rotating Magnetocaloric Effect and Unusual Magnetic Features in Metallic Strongly Anisotropic Geometrically Frustrated TmB4. Sci. Rep. 2018, 8, 10933. [Google Scholar] [CrossRef] [PubMed]
- Zhang, H.; Li, Y.; Liu, E.; Ke, Y.; Jin, J.; Long, Y.; Shen, B. Giant Rotating Magnetocaloric Effect Induced by Highly Texturing in Polycrystalline DyNiSi Compound. Sci. Rep. 2015, 5. [Google Scholar] [CrossRef]
- Jin, J.-L.; Zhang, X.-Q.; Ge, H.; Cheng, Z.-H. Rotating Field Entropy Change in Hexagonal TmMnO3 Single Crystal with Anisotropic Paramagnetic Response. Phys. Rev. B 2012, 85, 214426. [Google Scholar] [CrossRef]
- Balli, M.; Jandl, S.; Fournier, P.; Dimitrov, D.Z. Giant Rotating Magnetocaloric Effect at Low Magnetic Fields in Multiferroic TbMn2O5 Single Crystals. Appl. Phys. Lett. 2016, 108, 102401. [Google Scholar] [CrossRef]
- Balli, M.; Jandl, S.; Fournier, P.; Gospodinov, M.M. Anisotropy-Enhanced Giant Reversible Rotating Magnetocaloric Effect in HoMn2O5 Single Crystals. Appl. Phys. Lett. 2014, 104. [Google Scholar] [CrossRef]
- Engelbrecht, K.; Eriksen, D.; Bahl, C.R.H.; Bjørk, R.; Geyti, J.; Lozano, J.A.; Nielsen, K.K.; Saxild, F.; Smith, A.; Pryds, N. Experimental Results for a Novel Rotary Active Magnetic Regenerator. Int. J. Refrig. 2012, 35, 1498. [Google Scholar] [CrossRef]
- Tkáč, V.; Orendáčová, A.; Čižmár, E.; Orendáč, M.; Feher, A.; Anders, A.G. Giant Reversible Rotating Cryomagnetocaloric Effect in KEr(MoO4)2 Induced by a Crystal-Field Anisotropy. Phys. Rev. B 2015, 92, 24406. [Google Scholar] [CrossRef]
- Caro Patiño, J.; de Oliveira, N.A. Rotating Magnetocaloric Effect in HoAl2 Single Crystal. Intermetallics 2015, 64, 59. [Google Scholar] [CrossRef]
- Balli, M.; Mansouri, S.; Jandl, S.; Fournier, P.; Dimitrov, D.Z. Large Rotating Magnetocaloric Effect in the Orthorhombic DyMnO3 Single Crystal. Solid State Commun. 2016, 239, 9. [Google Scholar] [CrossRef]
- Lorusso, G.; Roubeau, O.; Evangelisti, M. Rotating Magnetocaloric Effect in an Anisotropic Molecular Dimer. Angew. Chem. Int. Ed. 2016, 55, 3360–3363. [Google Scholar] [CrossRef] [PubMed] [Green Version]
- Chorazy, S.; Podgajny, R.; Nitek, W.; Fic, T.; Görlich, E.; Rams, M.; Sieklucka, B. Natural and Magnetic Optical Activity of 2-D Chiral Cyanido-Bridged MnII–NbIV Molecular Ferrimagnets. Chem. Commun. 2013, 49, 6731. [Google Scholar] [CrossRef] [PubMed]
- Konieczny, P.; Pełka, R.; Czernia, D.; Podgajny, R. Rotating Magnetocaloric Effect in an Anisotropic Two-Dimensional CuII[WV(CN)8]3– Molecular Magnet with Topological Phase Transition: Experiment and Theory. Inorg. Chem. 2017, 56, 11971. [Google Scholar] [CrossRef] [PubMed]
- Konieczny, P.; Michalski, Ł.; Podgajny, R.; Chorazy, S.; Pełka, R.; Czernia, D.; Buda, S.; Mlynarski, J.; Sieklucka, B.; Wasiutyński, T. Self-Enhancement of Rotating Magnetocaloric Effect in Anisotropic Two-Dimensional (2D) Cyanido-Bridged MnII–NbIV Molecular Ferrimagnet. Inorg. Chem. 2017, 56, 2777. [Google Scholar] [CrossRef] [PubMed]
- Baranová, L.; Orendáčová, A.; Čižmár, E.; Tarasenko, R.; Tkáč, V.; Orendáč, M.; Feher, A. Fingerprints of Field-Induced Berezinskii–Kosterlitz–Thouless Transition in Quasi-Two-Dimensional S = 1/2 Heisenberg Magnets Cu(en)(H2O)2SO4 and Cu(tn)Cl2. J. Magn. Magn. Mater. 2016, 404, 53. [Google Scholar] [CrossRef]
- Bałanda, M.; Pełka, R.; Wasiutyński, T.; Rams, M.; Nakazawa, Y.; Miyazaki, Y.; Sorai, M.; Podgajny, R.; Korzeniak, T.; Sieklucka, B. Magnetic Ordering in the Double-Layered Molecular Magnet Cu(tetren)[W(CN)8]: Single-Crystal Study. Phys. Rev. B 2008, 78, 174409. [Google Scholar] [CrossRef]
- Czapla, M.; Pełka, R.; Zieliński, P.M.; Budziak, A.; Bałanda, M.; Makarewicz, M.; Pacyna, A.; Wasiutyński, T.; Miyazaki, Y.; Nakazawa, Y.; et al. Critical Behavior of Two Molecular Magnets Probed by Complementary Experiments. Phys. Rev. B 2010, 82, 94446. [Google Scholar] [CrossRef]
Figure 1.
Core of the Ni9W6 clusters: W—magenta; Ni—cyan; N—blue; C—black. The relative sizes of the balls correspond to the atomic radii of the respective atoms.
Figure 1.
Core of the Ni9W6 clusters: W—magenta; Ni—cyan; N—blue; C—black. The relative sizes of the balls correspond to the atomic radii of the respective atoms.
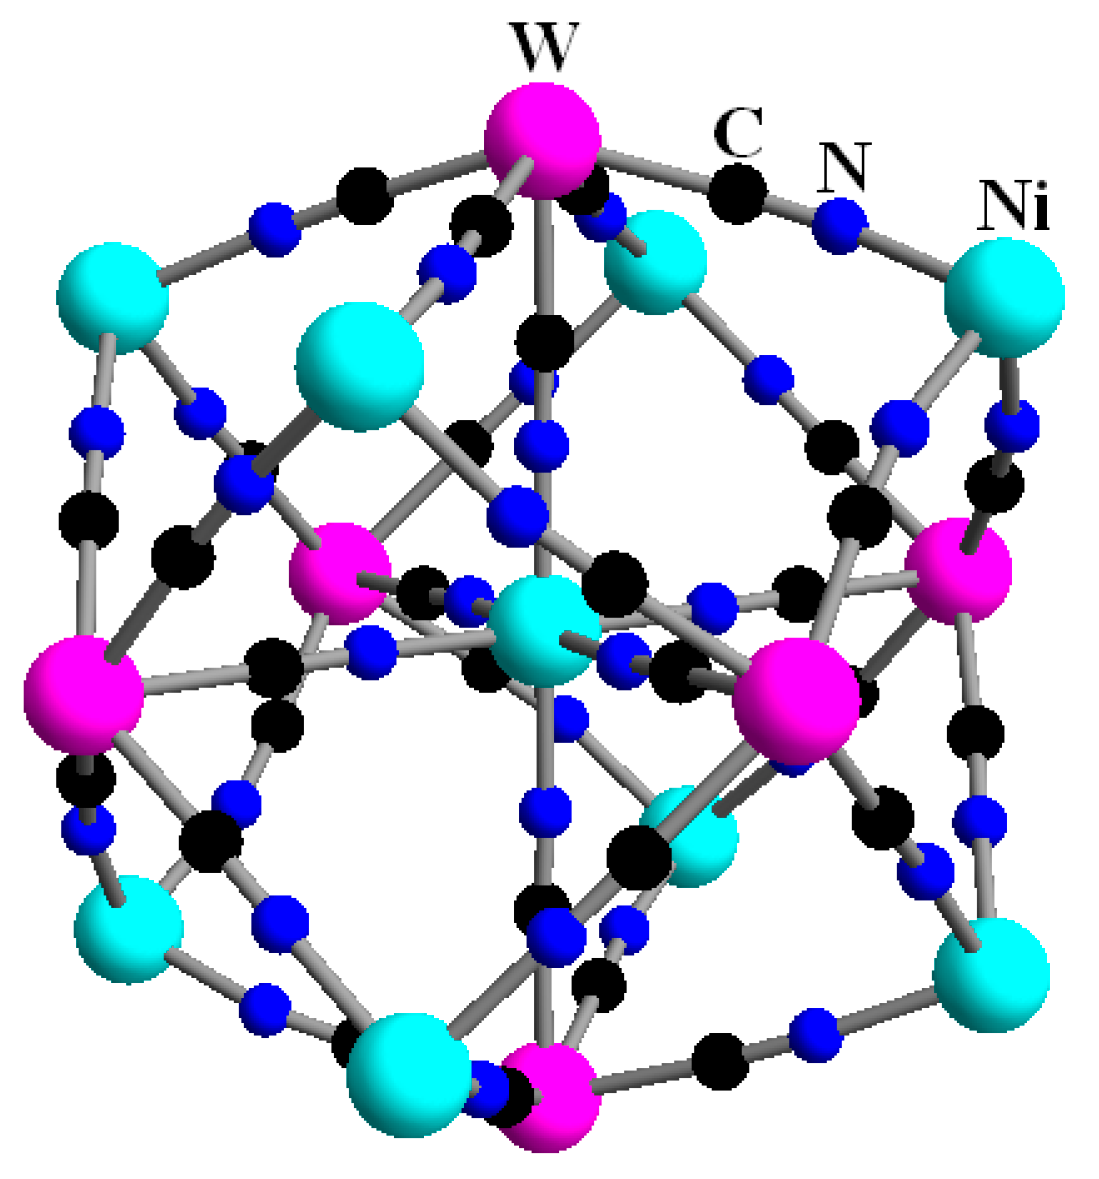
Figure 2.
Heat capacity of the compound in the low temperature range. There is a broad anomaly with a flat maximum at about 1.9 K gradually suppressed by the increasing magnetic field.
Figure 2.
Heat capacity of the compound in the low temperature range. There is a broad anomaly with a flat maximum at about 1.9 K gradually suppressed by the increasing magnetic field.

Figure 3.
Heat capacity of 1 (symbols) together with the baseline (solid line). Inset: Zero-field excess heat capacity in the low temperature range (symbols) with the algebraic fit (solid line).
Figure 3.
Heat capacity of 1 (symbols) together with the baseline (solid line). Inset: Zero-field excess heat capacity in the low temperature range (symbols) with the algebraic fit (solid line).

Figure 4.
Temperature dependence of the magnetic excess heat capacity of 1.

Figure 5.
Isothermal entropy change ΔSm as a function of temperature for 1 (symbols) inferred from the calorimetric data
Figure 5.
Isothermal entropy change ΔSm as a function of temperature for 1 (symbols) inferred from the calorimetric data

Figure 6.
Temperature dependence of exponent n determined for 1.

Figure 7.
Temperature dependence of the adiabatic temperature change ΔTad for 1.

Figure 8.
Structure of 2. (a) View of the structure along the c (a) and b (b) crystallographic axes. For clarity the water molecules, the hydrogen atoms, and all nonbridging cyanido ligands have been removed.
Figure 8.
Structure of 2. (a) View of the structure along the c (a) and b (b) crystallographic axes. For clarity the water molecules, the hydrogen atoms, and all nonbridging cyanido ligands have been removed.

Figure 9.
Zero-field total heat capacity of 2 (symbols) with the baseline (solid line). Inset: Zero-field magnetic excess heat capacity in the log-log plot (symbols) with the linear fit in the low temperature regime (solid line).
Figure 9.
Zero-field total heat capacity of 2 (symbols) with the baseline (solid line). Inset: Zero-field magnetic excess heat capacity in the log-log plot (symbols) with the linear fit in the low temperature regime (solid line).

Figure 10.
Magnetic excess heat capacity of 2.

Figure 11.
Temperature dependence of the isothermal entropy change ΔSm of 2 inferred from the heat capacity measurements (spheres) or from the isothermal magnetization measurements (stars).
Figure 11.
Temperature dependence of the isothermal entropy change ΔSm of 2 inferred from the heat capacity measurements (spheres) or from the isothermal magnetization measurements (stars).

Figure 12.
Temperature dependence of exponent n for 2.
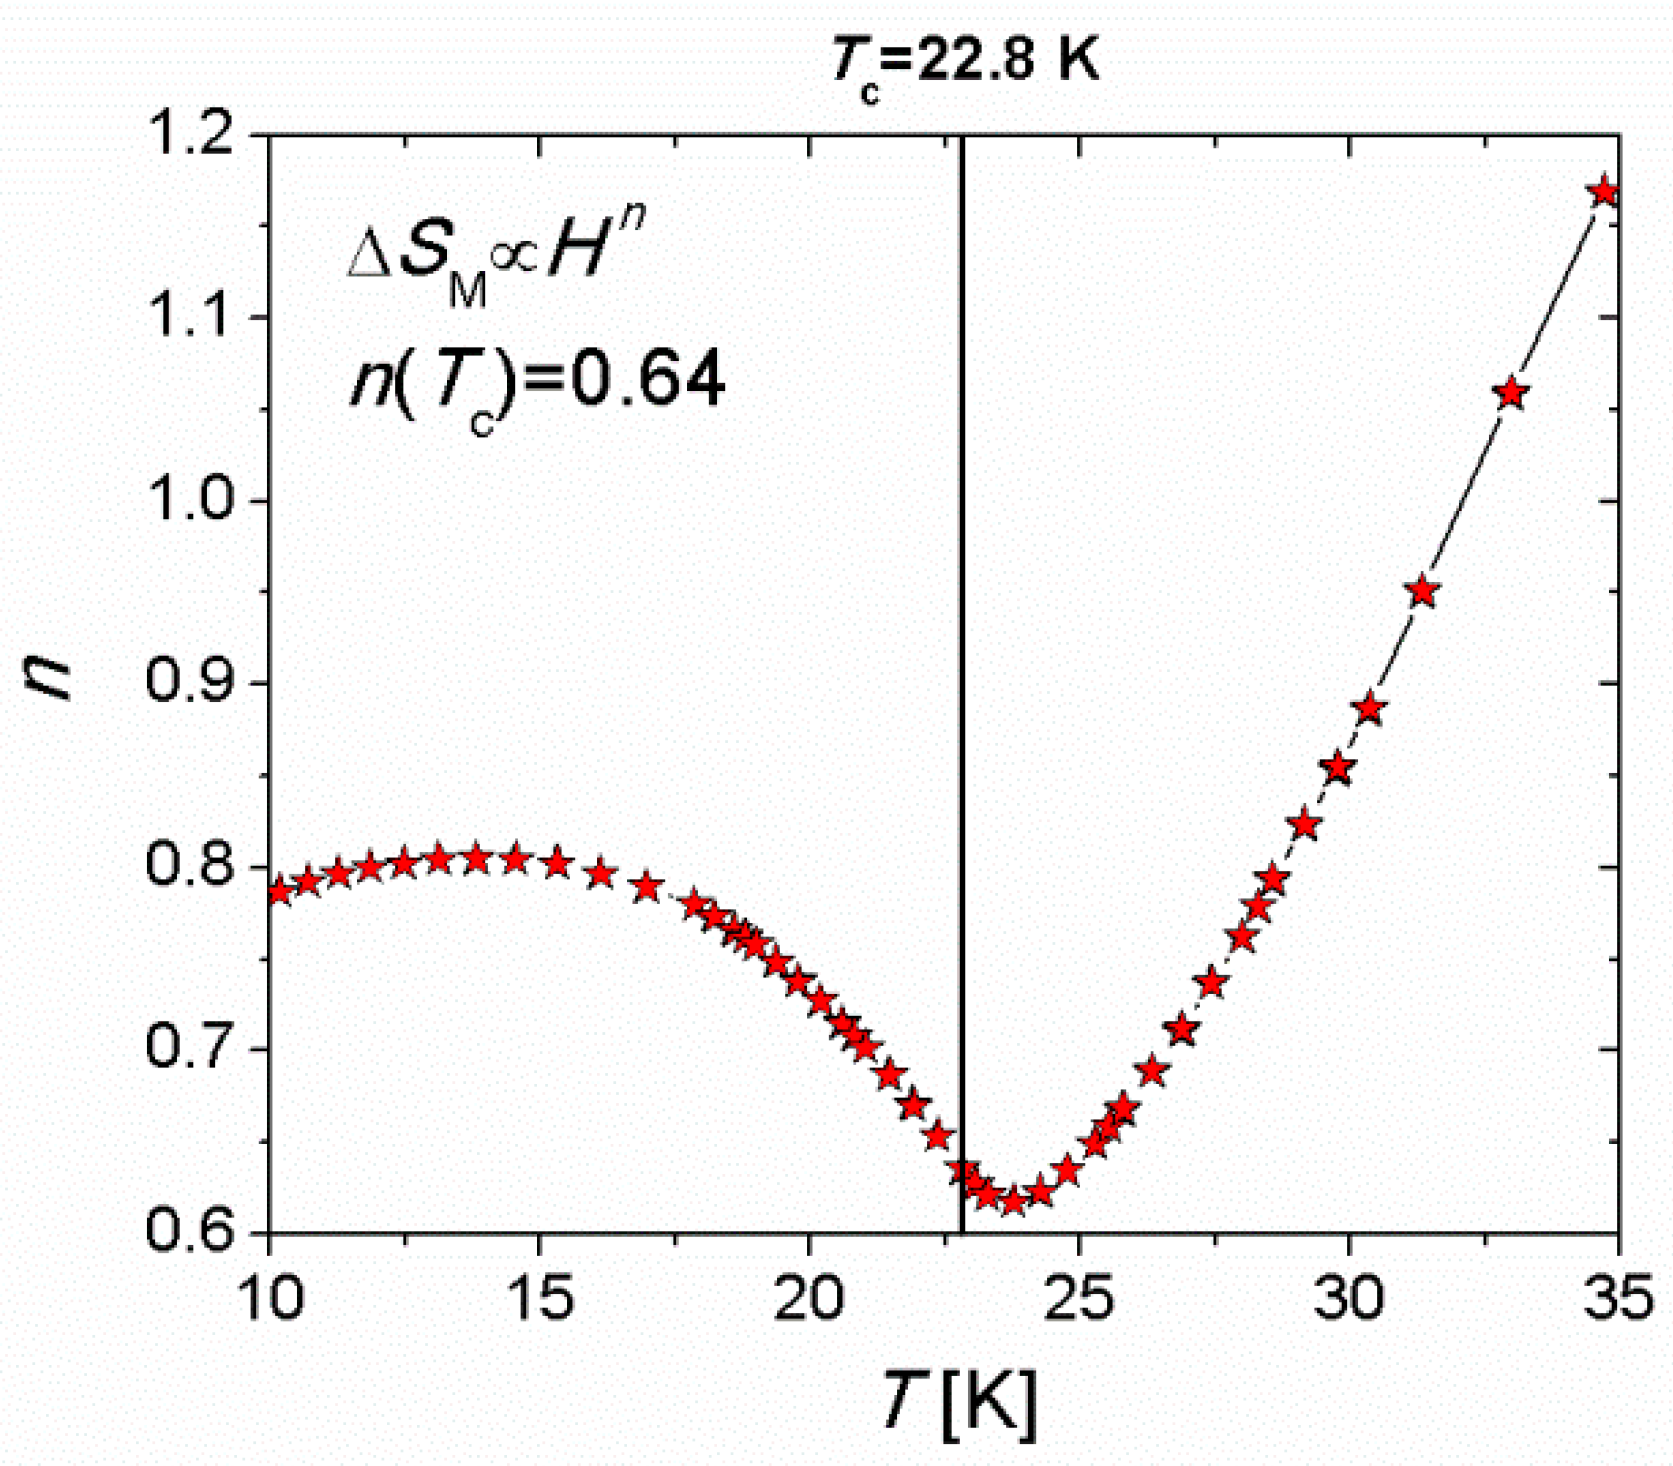
Figure 13.
Temperature dependence of ΔTad of 2.

Figure 14.
Adiabats obtained by solving Equation (5) with different initial conditions. Two adiabats are highlighted: the adiabat corresponding to the demagnetization process starting from 5 K and 9 T (blue), the adiabat corresponding to the magnetization process starting at 5 K and 0 T continued up to 9 T (red). The arrows show the amplitudes of the corresponding adiabatic temperature changes ΔTad.
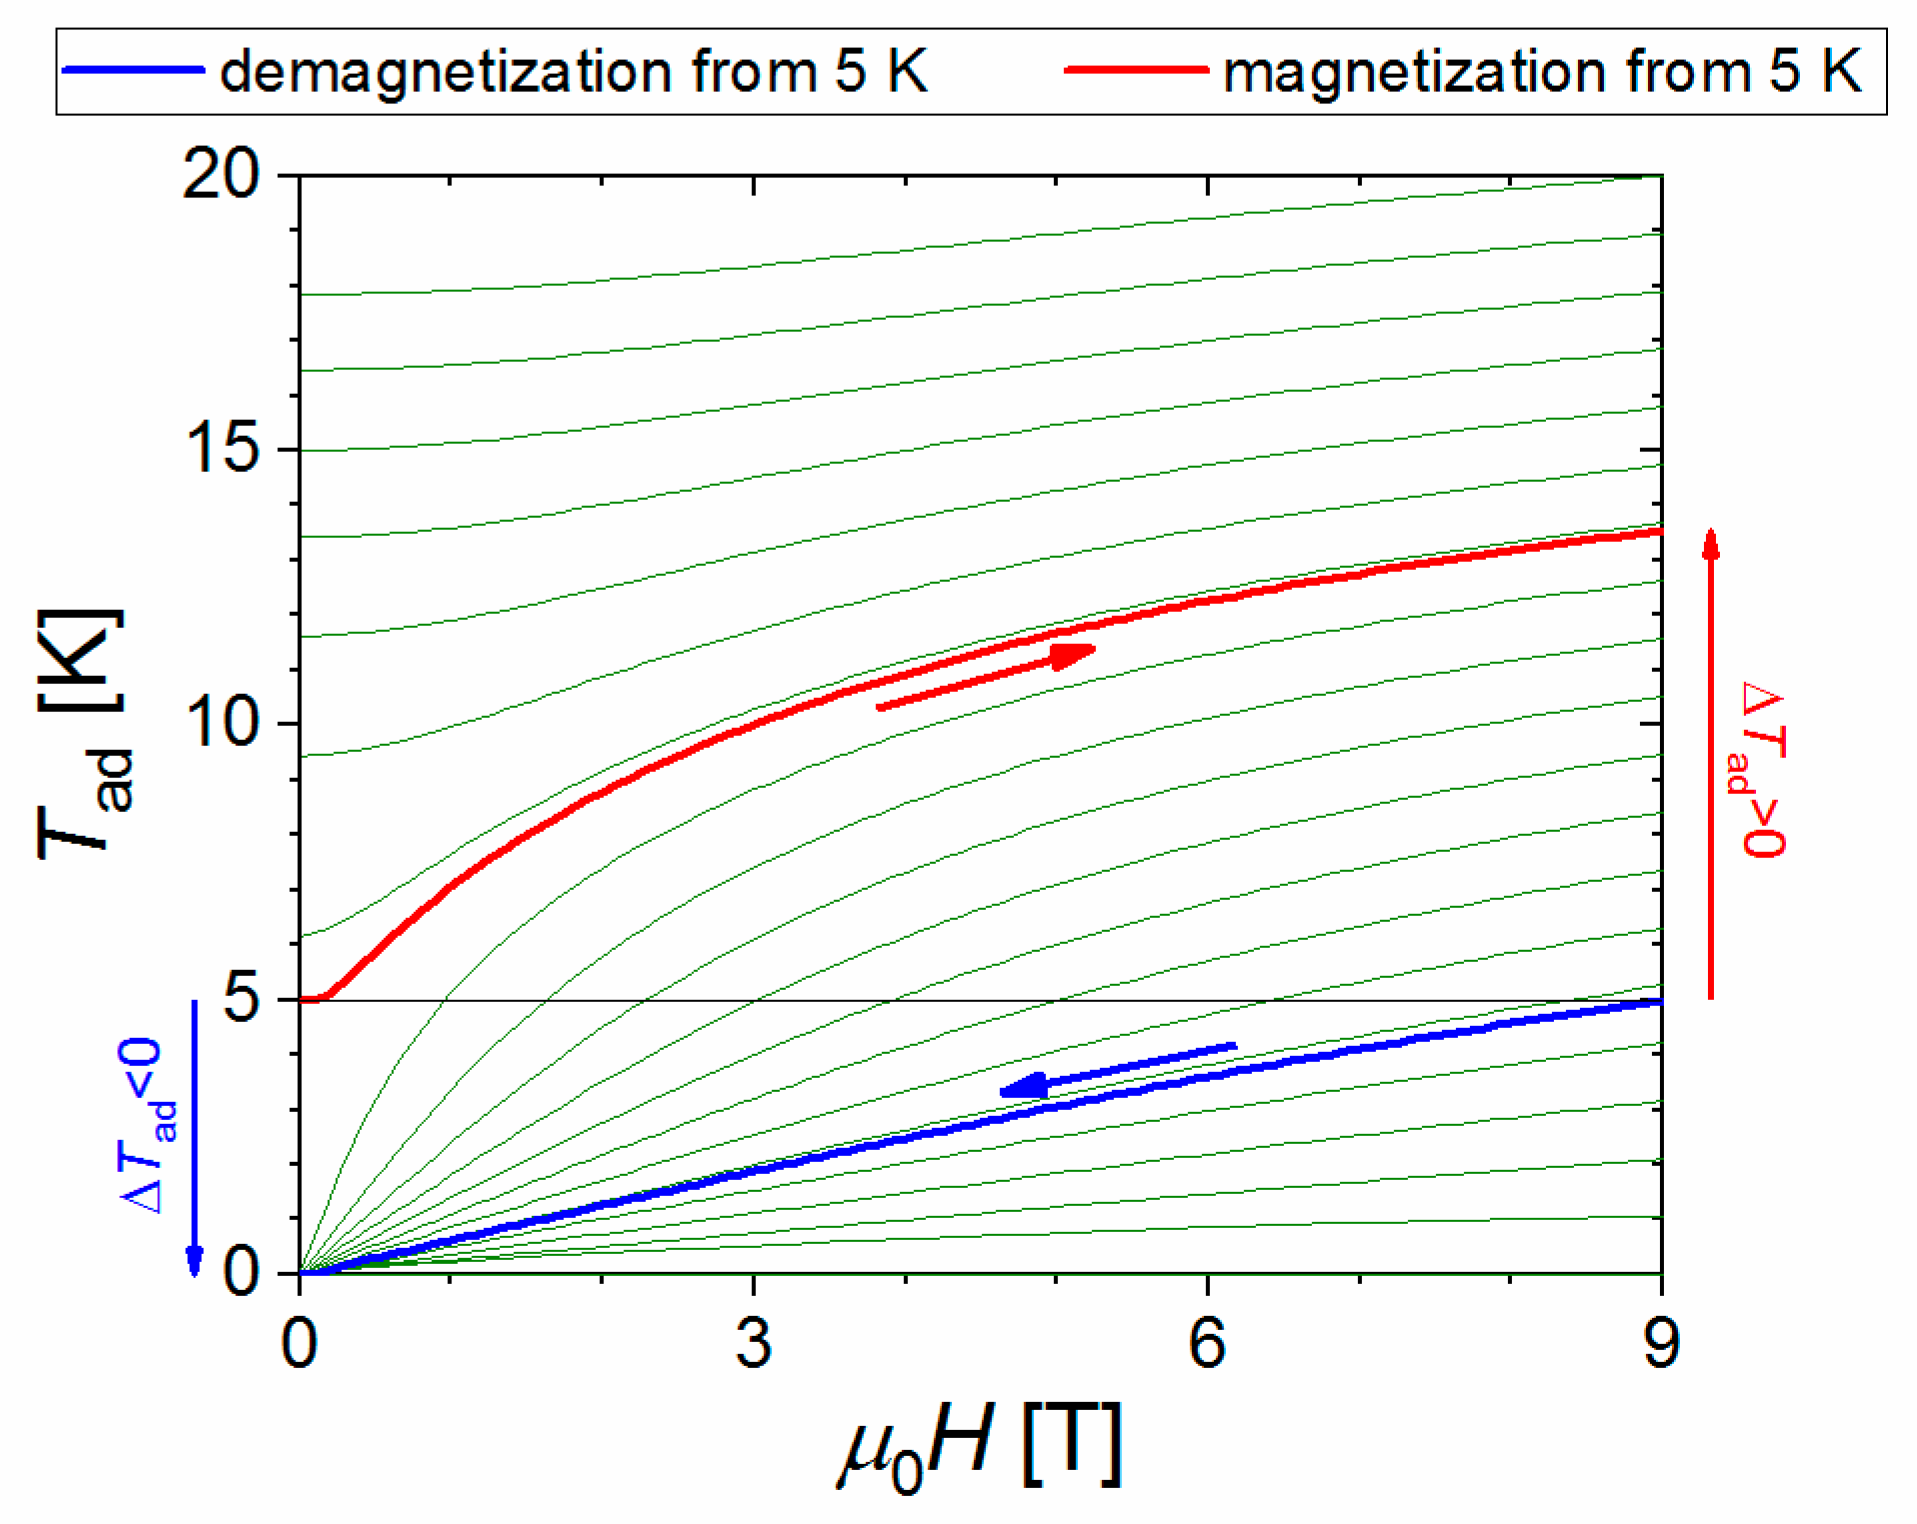
Figure 15.
ΔTad of the hypothetical paramagnetic medium sharing with 2 the same spin content and the lattice heat capacity (solid lines). For the sake of comparison ΔTad of the studied compound has been also shown (symbols).
Figure 15.
ΔTad of the hypothetical paramagnetic medium sharing with 2 the same spin content and the lattice heat capacity (solid lines). For the sake of comparison ΔTad of the studied compound has been also shown (symbols).

Figure 16.
Temperature dependence of the isothermal entropy change ΔSm.

Figure 17.
Temperature dependence of exponent n for 3.

Figure 18.
Temperature dependence of ΔTad for 3.

Figure 19.
Temperature dependences of the isothermal entropy change ΔSm and the adiabatic temperature change ΔTad corresponding to the applied field change of μ0ΔH = 5 T for the three studied compounds.
Figure 19.
Temperature dependences of the isothermal entropy change ΔSm and the adiabatic temperature change ΔTad corresponding to the applied field change of μ0ΔH = 5 T for the three studied compounds.

Figure 20.
(a) Magnetization vs field isotherms measured in the vicinity of Tc for {[MnII(H2O)2]2[NbIV(CN)8]·4H2O}n (4) and (b) temperature dependence of magnetic entropy change recorded in various magnetic fields for (4) and {[FeII(H2O)2]2[NbIV(CN)8]·4H2O}n(5).
Figure 20.
(a) Magnetization vs field isotherms measured in the vicinity of Tc for {[MnII(H2O)2]2[NbIV(CN)8]·4H2O}n (4) and (b) temperature dependence of magnetic entropy change recorded in various magnetic fields for (4) and {[FeII(H2O)2]2[NbIV(CN)8]·4H2O}n(5).

Figure 21.
Universal curves of ferrimagnetic {[MnII(H2O)2]2[NbIV(CN)8]·4H2O}n (4) (a) and ferromagnetic {[FeII(H2O)2]2[NbIV(CN)8]·4H2O}n (6) (b) compounds.
Figure 21.
Universal curves of ferrimagnetic {[MnII(H2O)2]2[NbIV(CN)8]·4H2O}n (4) (a) and ferromagnetic {[FeII(H2O)2]2[NbIV(CN)8]·4H2O}n (6) (b) compounds.

Figure 22.
The plot of magnetic entropy change vs temperature corresponding to µ0ΔH = 1, 5 T measured for {[MnII(pyrazole)4]2[NbIV(CN)8]3∙4H2O}n and [FeII(pyrazole)4]2[NbIV(CN)8]3∙4H2O}n.
Figure 22.
The plot of magnetic entropy change vs temperature corresponding to µ0ΔH = 1, 5 T measured for {[MnII(pyrazole)4]2[NbIV(CN)8]3∙4H2O}n and [FeII(pyrazole)4]2[NbIV(CN)8]3∙4H2O}n.

Figure 23.
Isothermal entropy change extracted from the experiment (symbols) and calculated within the framework of the molecular field approximation (solid lines) for {MnII2(imH)2(H2O)4[NbIV(CN)8]∙4H2O}n and its dehydrated form {MnII2(imH)2[NbIV(CN)8]}n.
Figure 23.
Isothermal entropy change extracted from the experiment (symbols) and calculated within the framework of the molecular field approximation (solid lines) for {MnII2(imH)2(H2O)4[NbIV(CN)8]∙4H2O}n and its dehydrated form {MnII2(imH)2[NbIV(CN)8]}n.

Figure 24.
The comparison of temperature dependences of the magnetic entropy change measured for μ0ΔH = 1, 3, and 5 T (symbols) and real component of AC susceptibility for 9, 9deh, and 9anh (lines).
Figure 24.
The comparison of temperature dependences of the magnetic entropy change measured for μ0ΔH = 1, 3, and 5 T (symbols) and real component of AC susceptibility for 9, 9deh, and 9anh (lines).

Figure 25.
Temperature dependence of the magnetic entropy change of as-synthetized sample 9 (p = 0 GPa) (empty symbols) and 9 under pressure p = 1.19 GPa (filled symbols) determined for µ0ΔH = 1, 3 and 5 T.
Figure 25.
Temperature dependence of the magnetic entropy change of as-synthetized sample 9 (p = 0 GPa) (empty symbols) and 9 under pressure p = 1.19 GPa (filled symbols) determined for µ0ΔH = 1, 3 and 5 T.
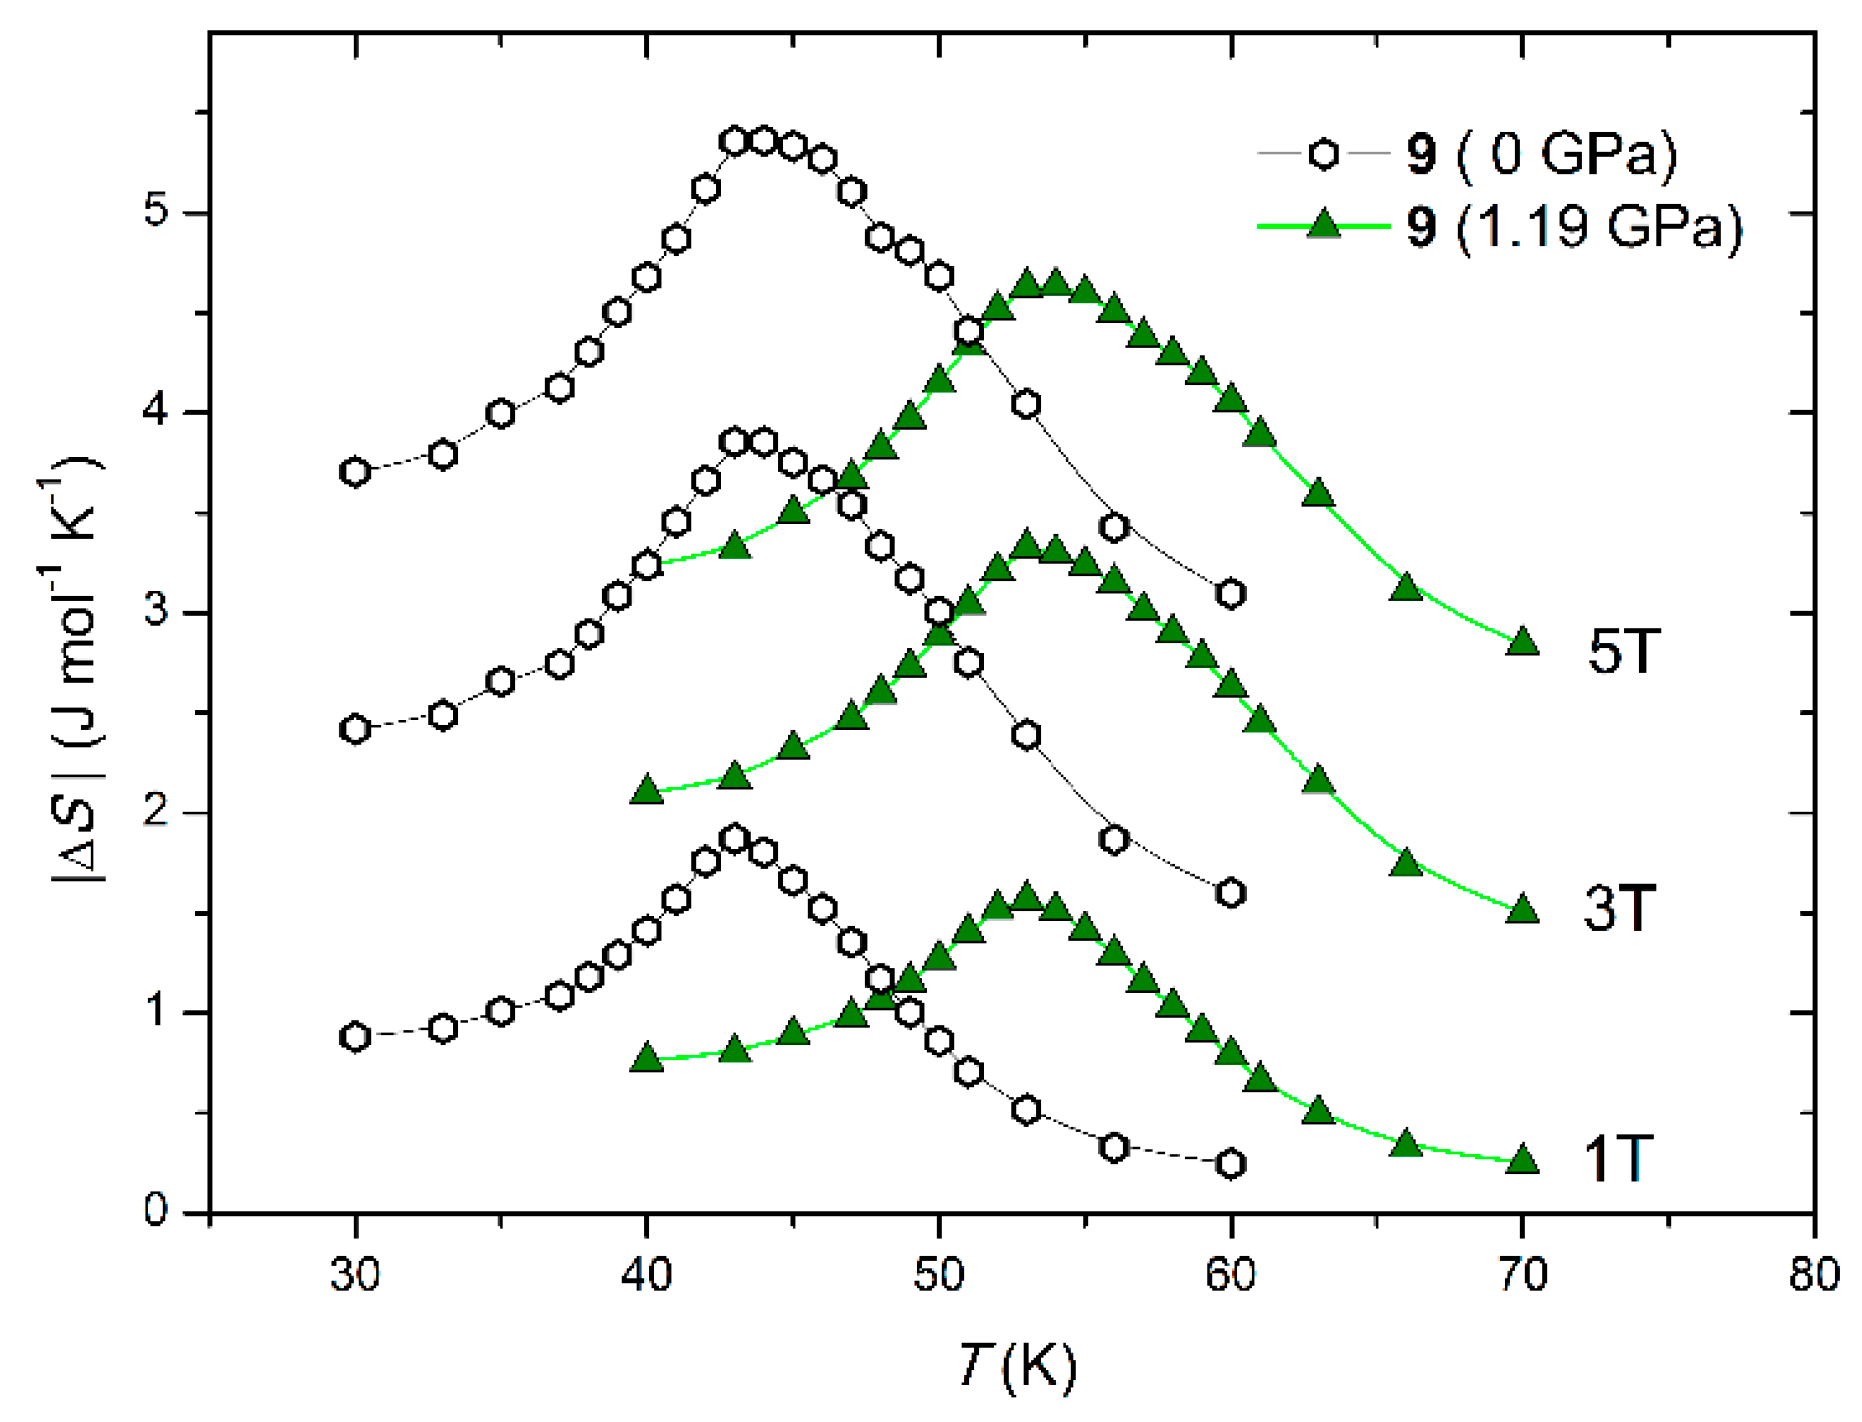
Figure 26.
(a) The comparison of temperature dependences of magnetic entropy change determined for the manganese octacyanoniobate-based samples with different ligands: pyridazine for samples 9, 9deh, 9anh, and 9HP, imidazole for 8 and 8deh,pyrazole for 4 and ligand-free 6. (b) The maximum values of magnetic entropy change |ΔS|max obtained for 9, 9deh, 9anh, 9HP, 8, 8deh, 4, and 6 at the change of magnetic field μ0ΔH = 1, 3 and 5 T as a function of Tc−2/3.

Figure 27.
(a) Determination of the critical exponents and the critical temperature for 4 using the Kouvel–Fisher method, (b) logarithmic scaling plot of M |ε|−β vs. H·|ε|−(β + γ) for 4 evidences the validity Kouvel–Fisher method, (c) magnetization vs. magnetic field measured for M(H) obtained for 4 at temperature T = 49 K; inset shows the same M(H) plots in the log–log scale, which was used for determination of critical exponent δ, (d) temperature dependence of exponent n obtained for 4.

Figure 28.
The magnetic entropy change for 10 due to application of the magnetic field 0-μ0H (black-easy plane, red -hard axis) and by rotating the crystals in constant field μ0H. (a) μ0H = 1.0 T, (b) μ0H = 0.14 T.
Figure 28.
The magnetic entropy change for 10 due to application of the magnetic field 0-μ0H (black-easy plane, red -hard axis) and by rotating the crystals in constant field μ0H. (a) μ0H = 1.0 T, (b) μ0H = 0.14 T.

Figure 29.
The magnetic entropy change with RMCE for 10. Solid lines are guides for the eyes. Adapted with permission from Reference [72]. Copyright 2017 American Chemical Society.
Figure 29.
The magnetic entropy change with RMCE for 10. Solid lines are guides for the eyes. Adapted with permission from Reference [72]. Copyright 2017 American Chemical Society.
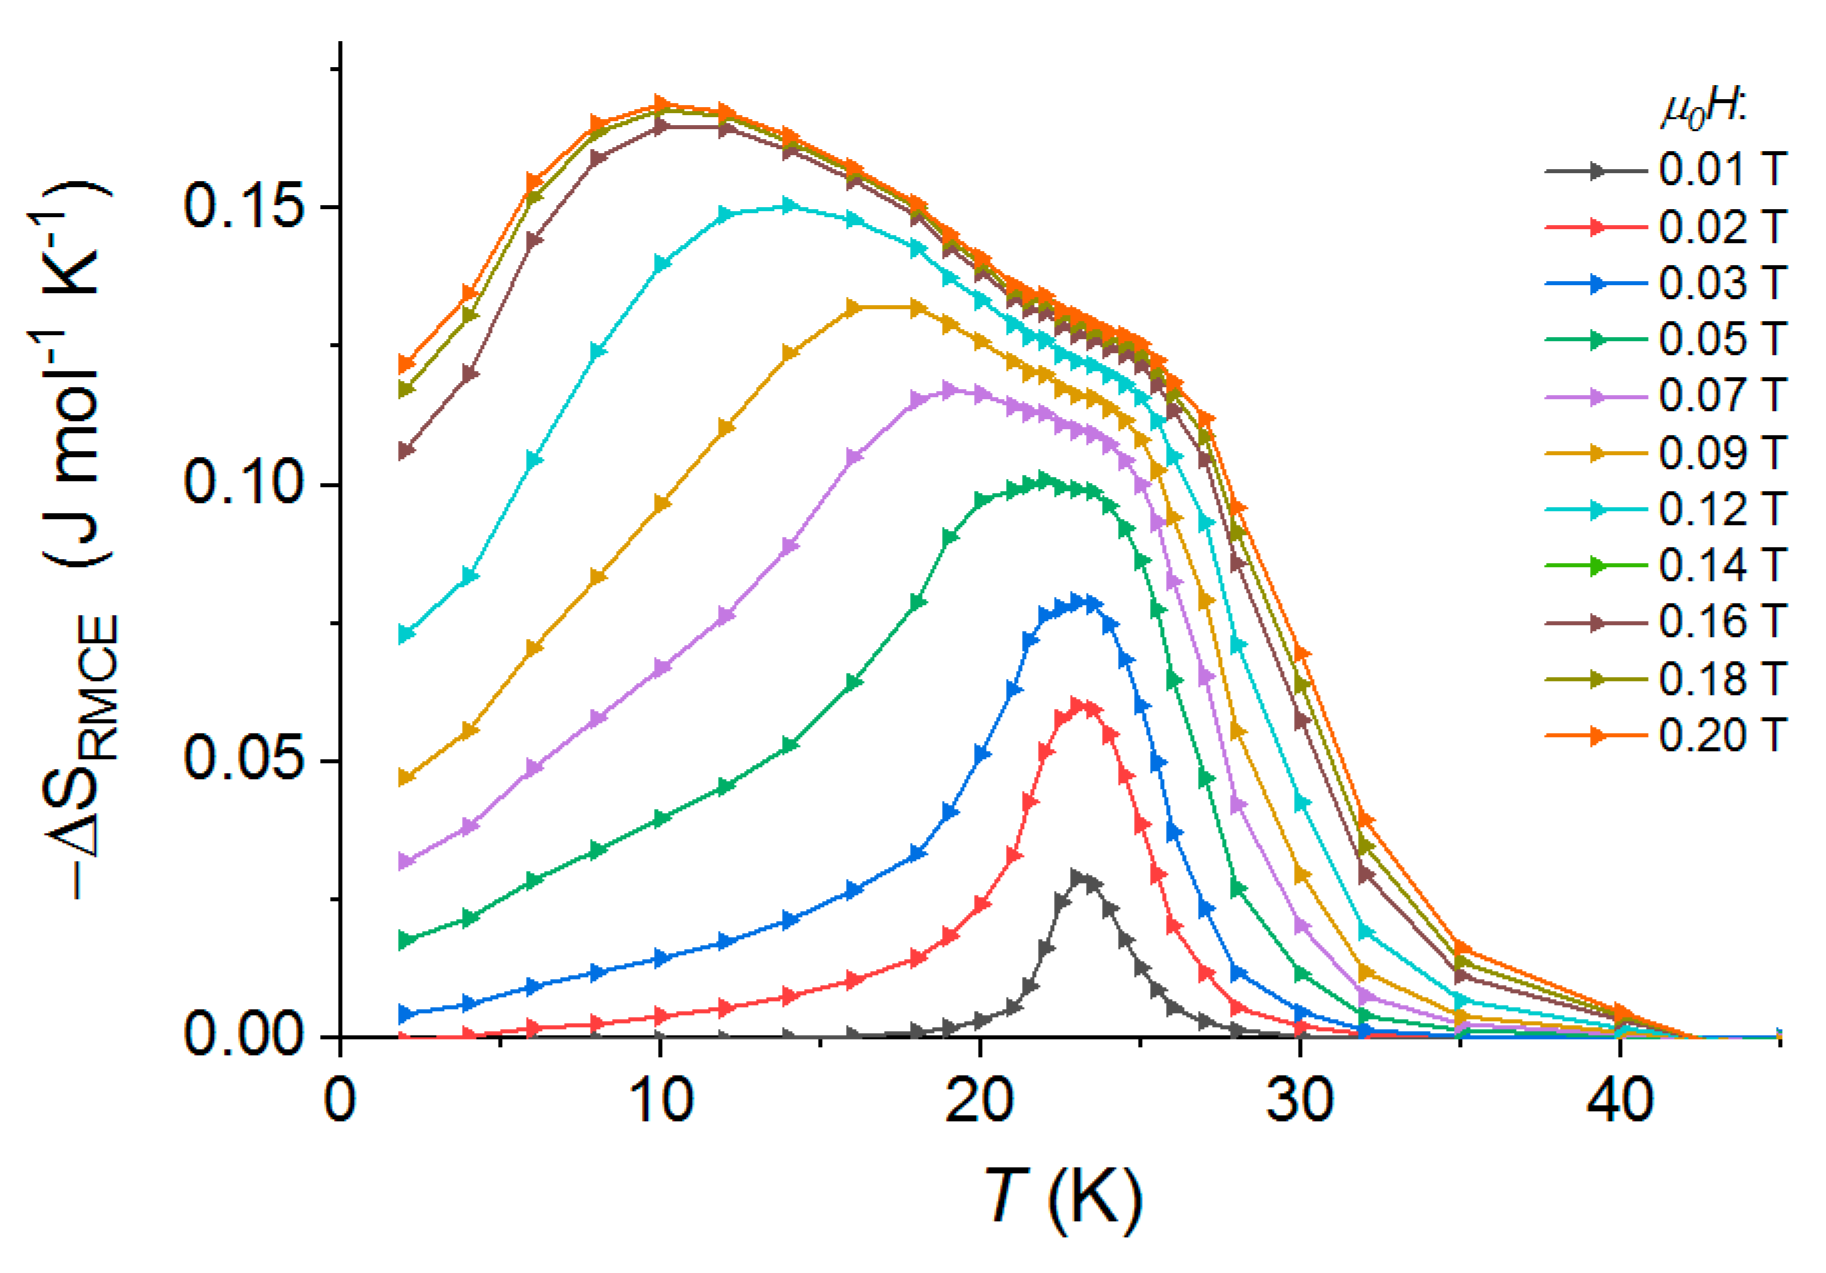
Figure 30.
Temperature dependence of percentage ratio between ΔSRMCE and ΔSeasy (easy plane) for 10 for different fields. Adapted with permission from Reference [72]. Copyright 2017 American Chemical Society.
Figure 30.
Temperature dependence of percentage ratio between ΔSRMCE and ΔSeasy (easy plane) for 10 for different fields. Adapted with permission from Reference [72]. Copyright 2017 American Chemical Society.

Figure 31.
The magnetic entropy change for 11 due to application of the magnetic field 0- μ0H (black-easy plane, red -hard axis) and by rotating the crystals in constant field μ0H. (a) μ0H = 7.0 T, (b) μ0H = 1.0 T.
Figure 31.
The magnetic entropy change for 11 due to application of the magnetic field 0- μ0H (black-easy plane, red -hard axis) and by rotating the crystals in constant field μ0H. (a) μ0H = 7.0 T, (b) μ0H = 1.0 T.

Figure 32.
The temperature dependence of magnetic entropy change due to single crystals rotation in the constant field for 11. Adapted with permission from Reference [71] Copyright 2017 American Chemical Society.
Figure 32.
The temperature dependence of magnetic entropy change due to single crystals rotation in the constant field for 11. Adapted with permission from Reference [71] Copyright 2017 American Chemical Society.

Figure 33.
Percentage ratio between ΔSRMCE and ΔSeasy (easy plane) for 11 as a function of temperature for different fields. Adapted with permission from Reference [71] Copyright 2017 American Chemical Society.
Figure 33.
Percentage ratio between ΔSRMCE and ΔSeasy (easy plane) for 11 as a function of temperature for different fields. Adapted with permission from Reference [71] Copyright 2017 American Chemical Society.


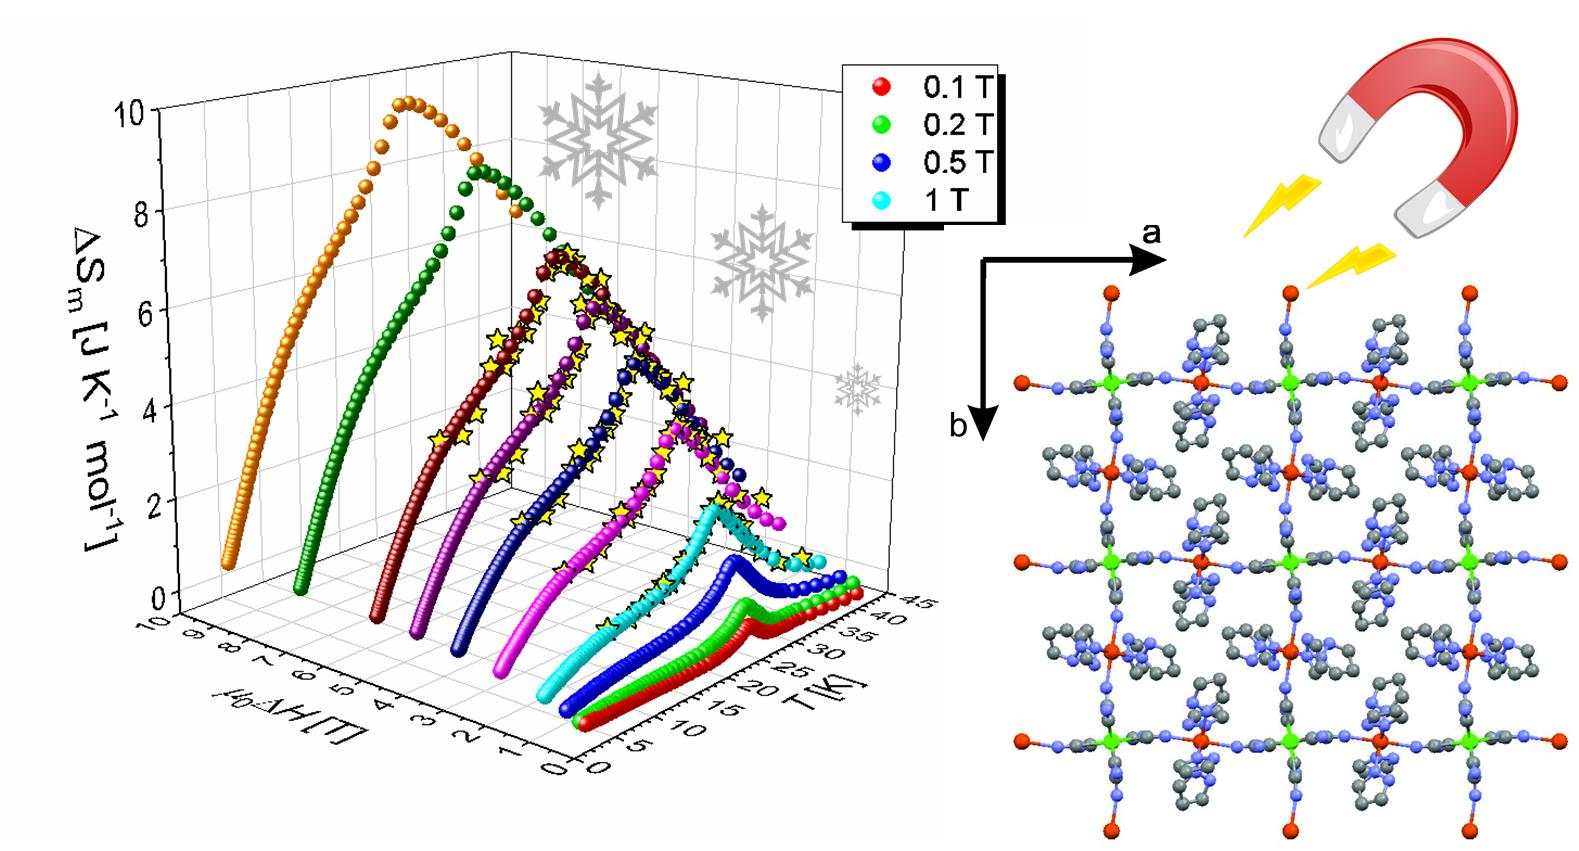
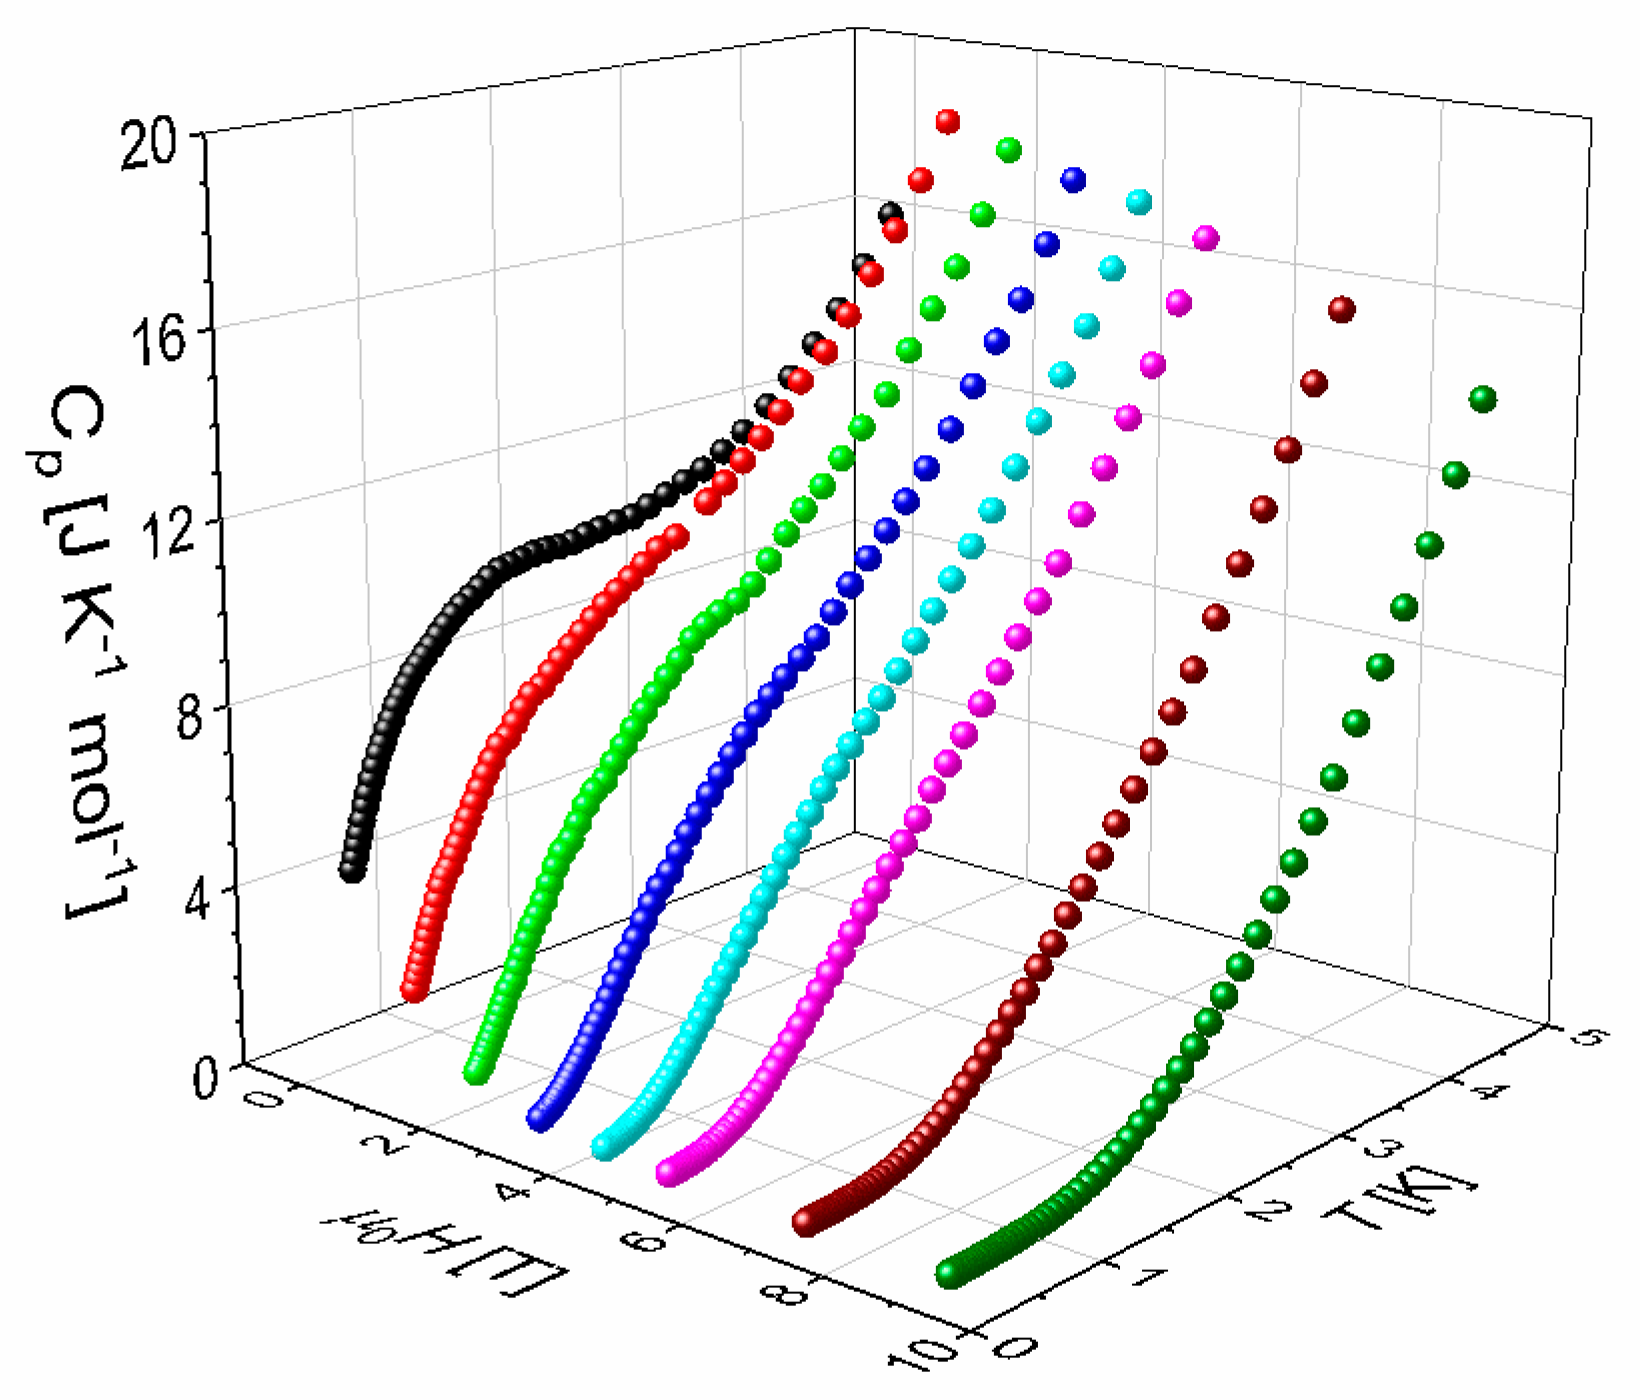
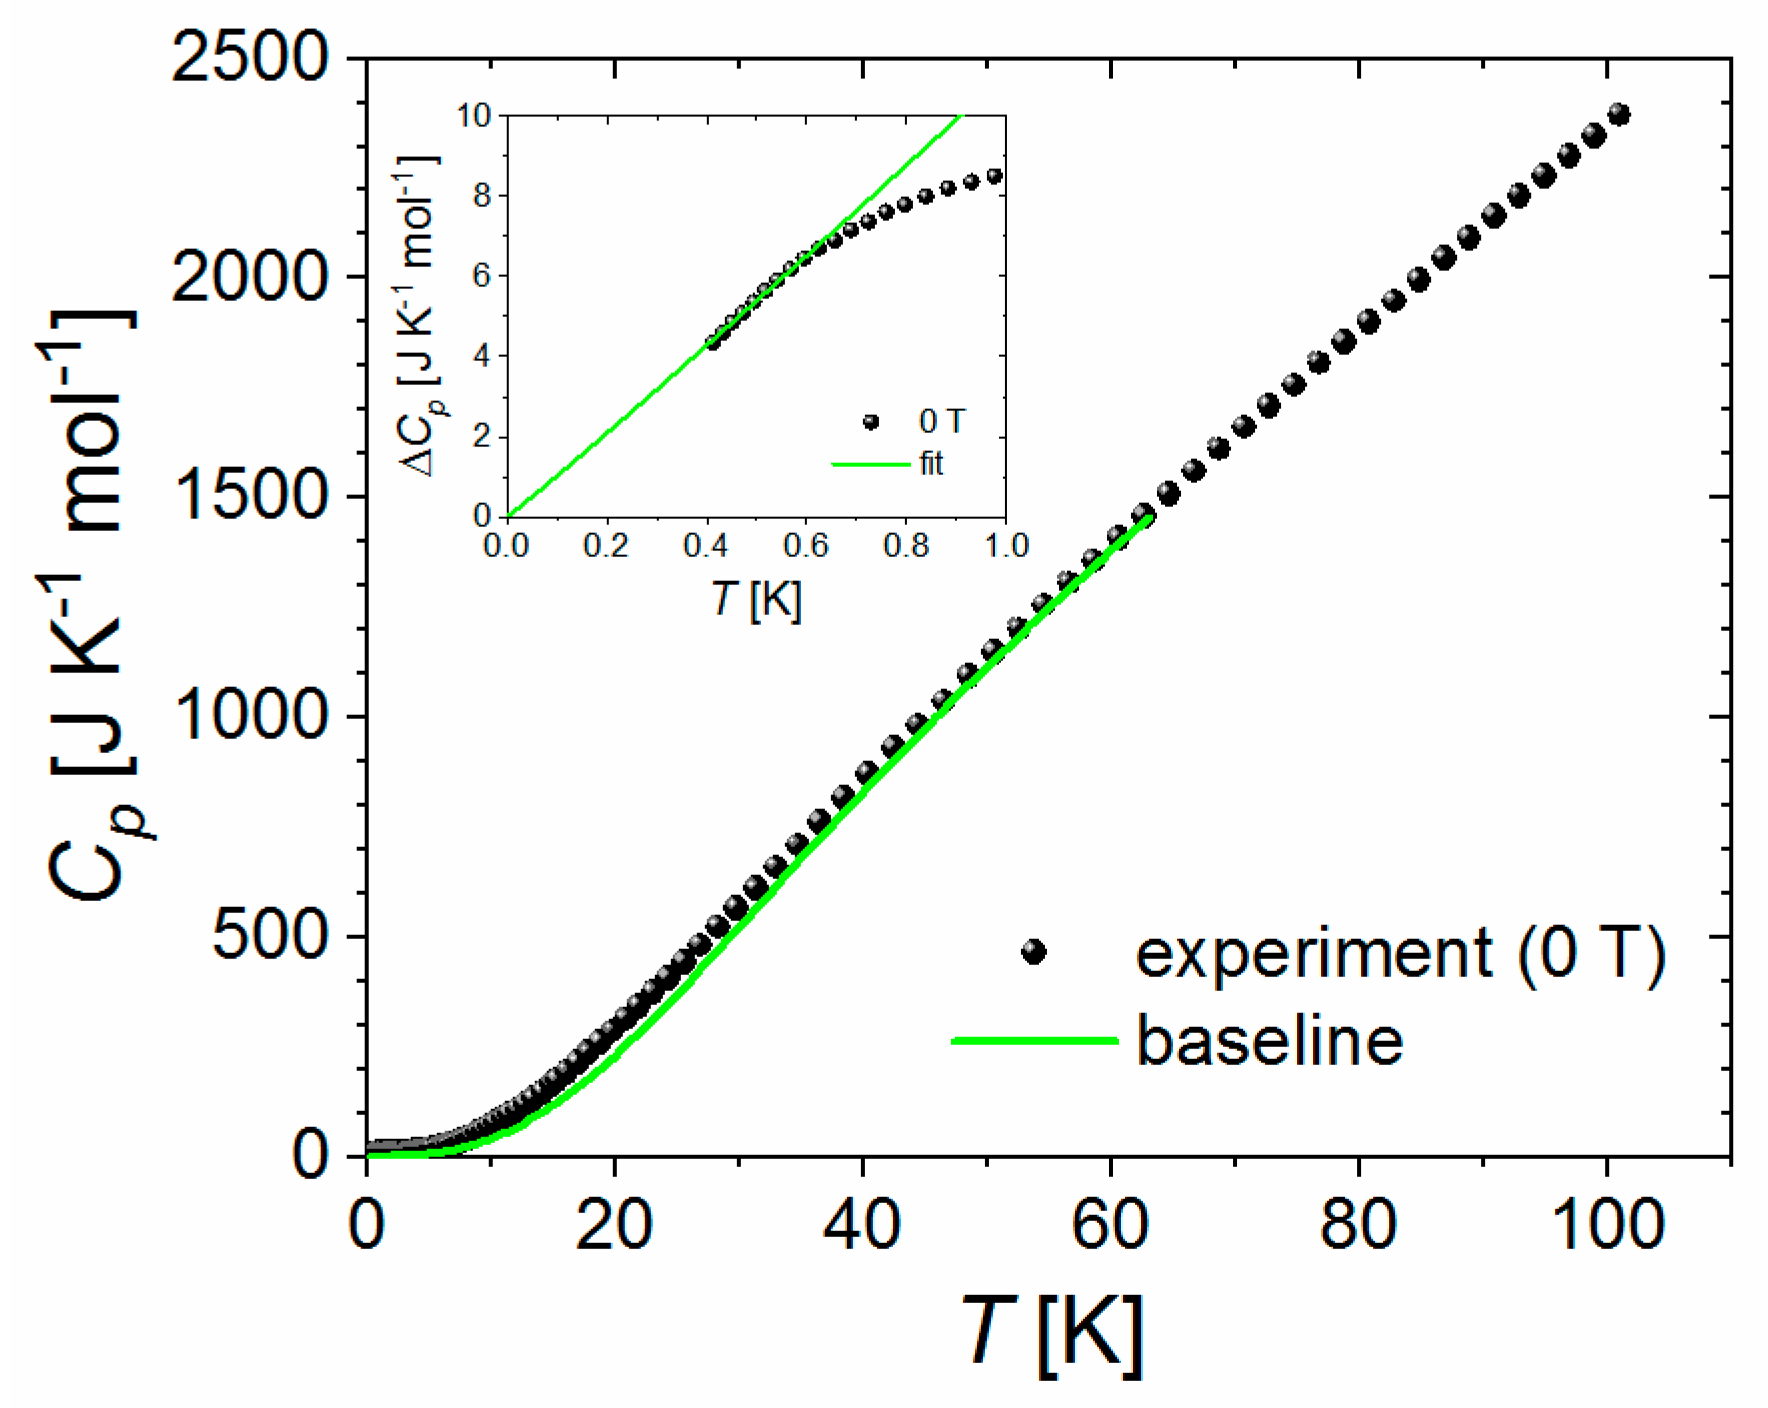
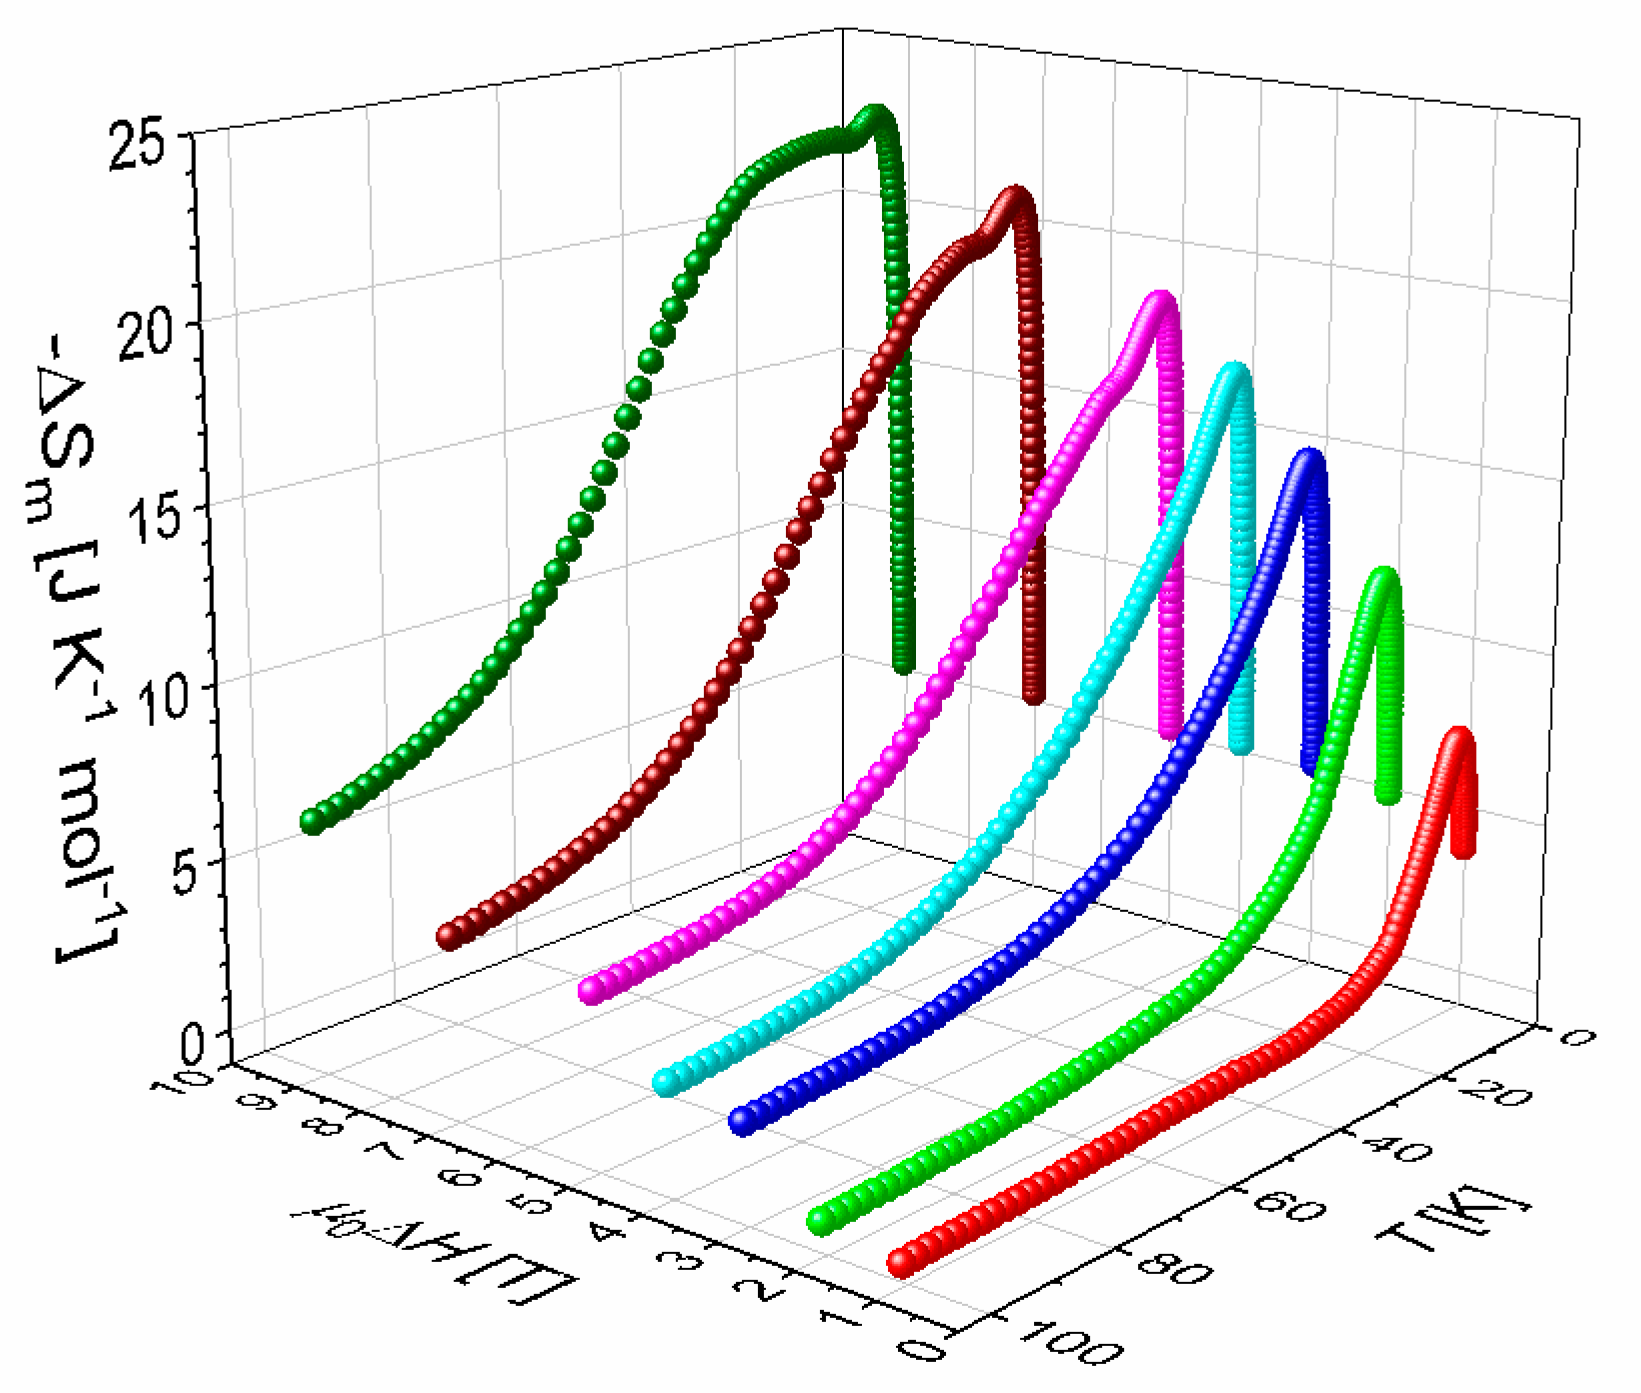
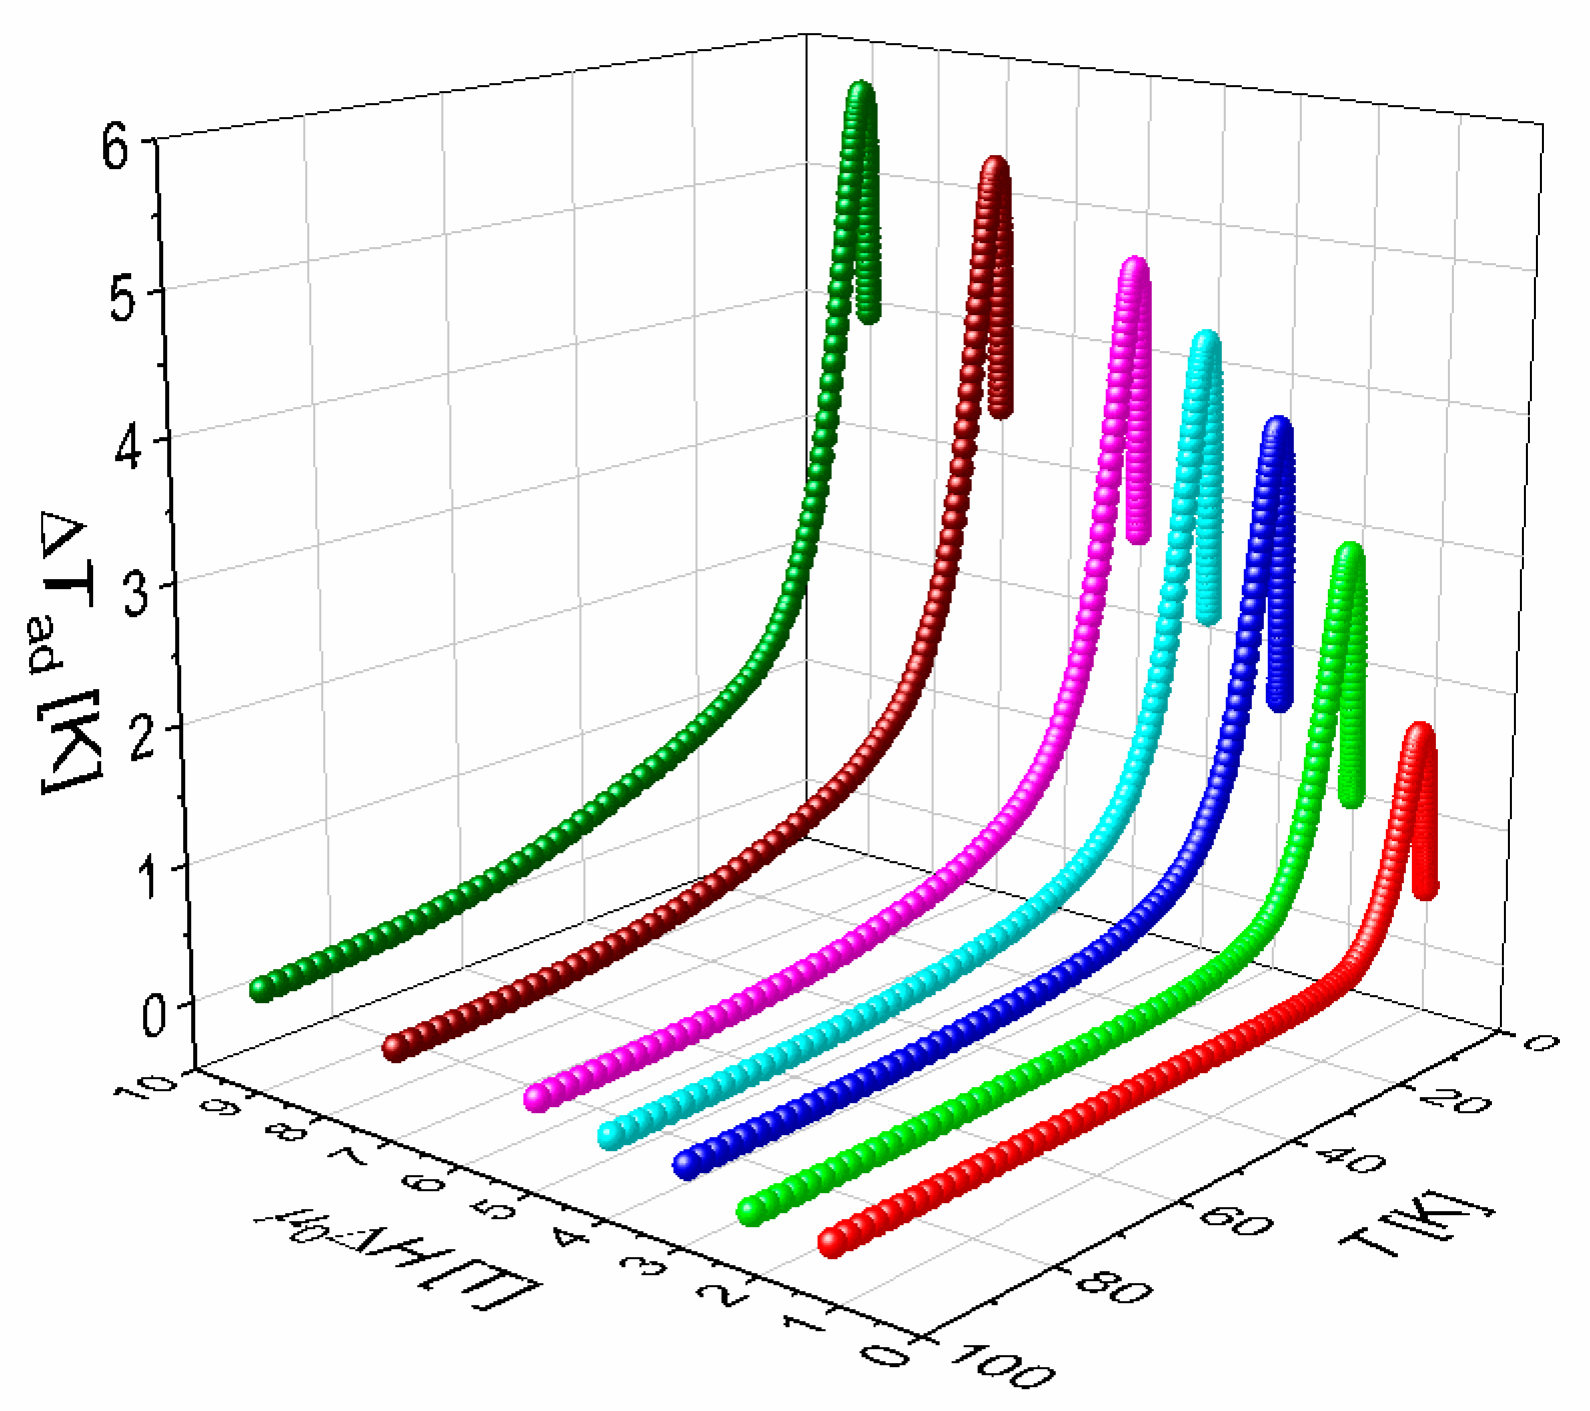
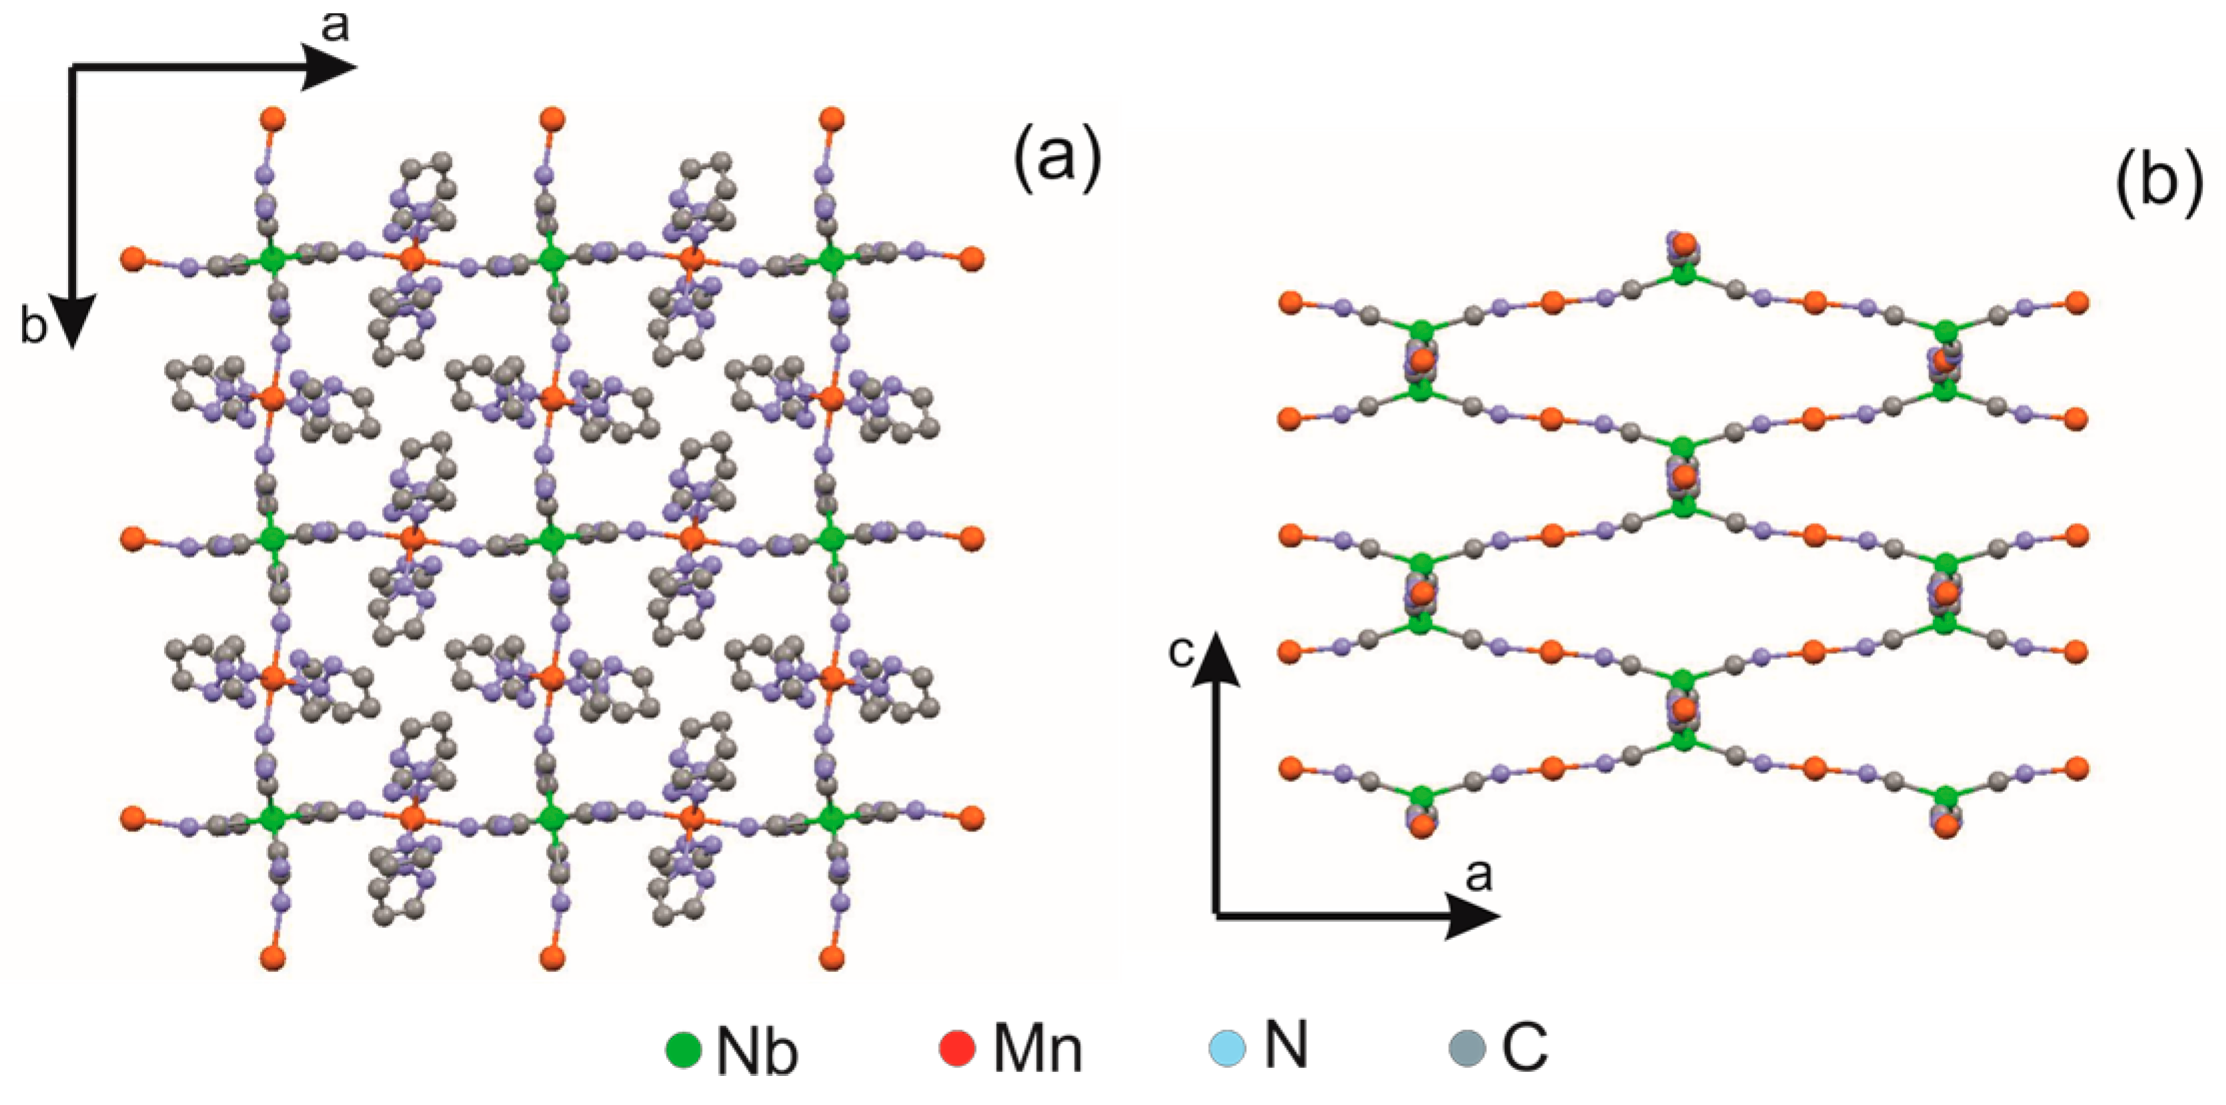
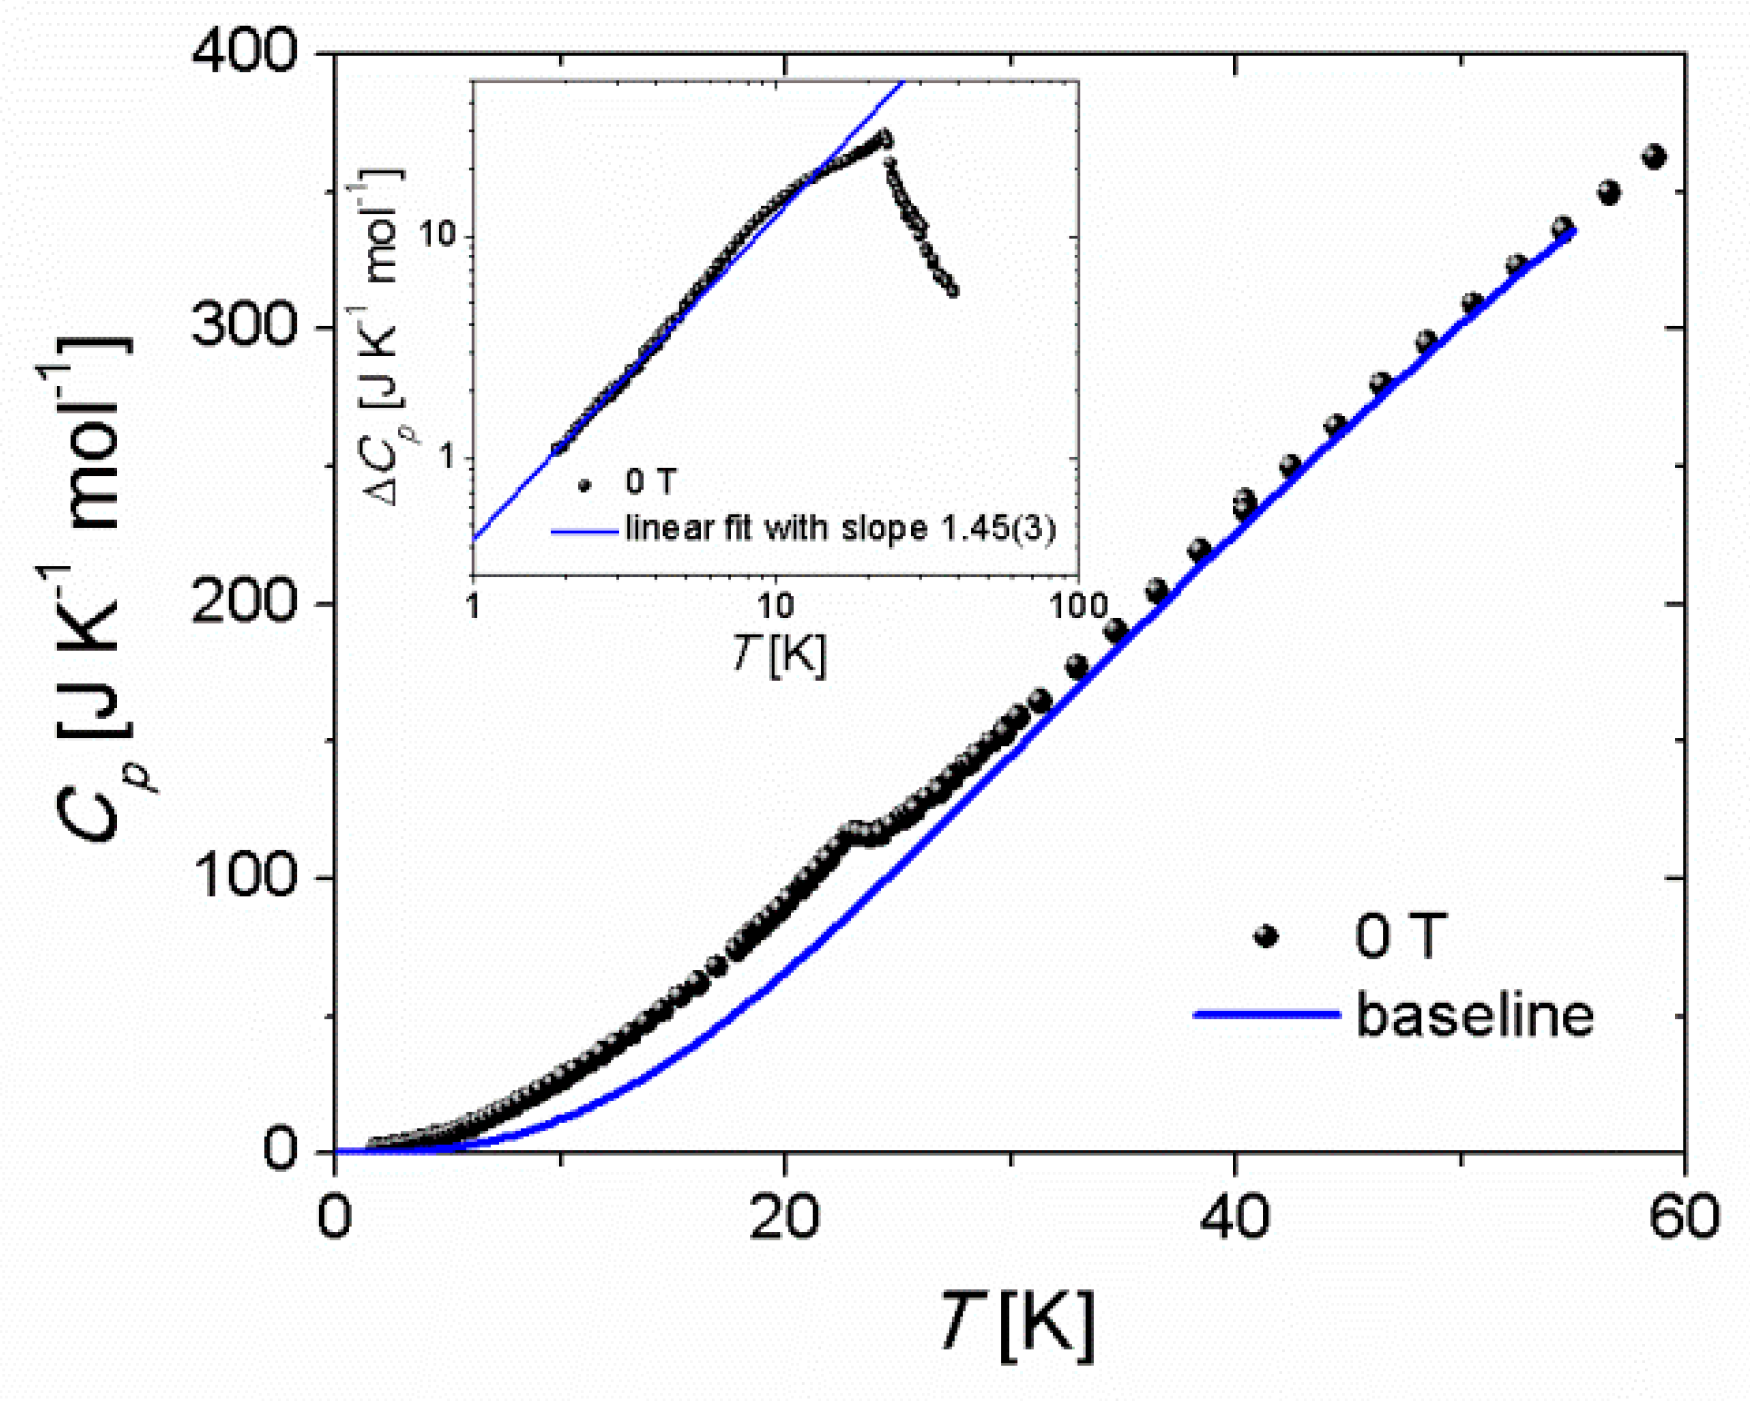
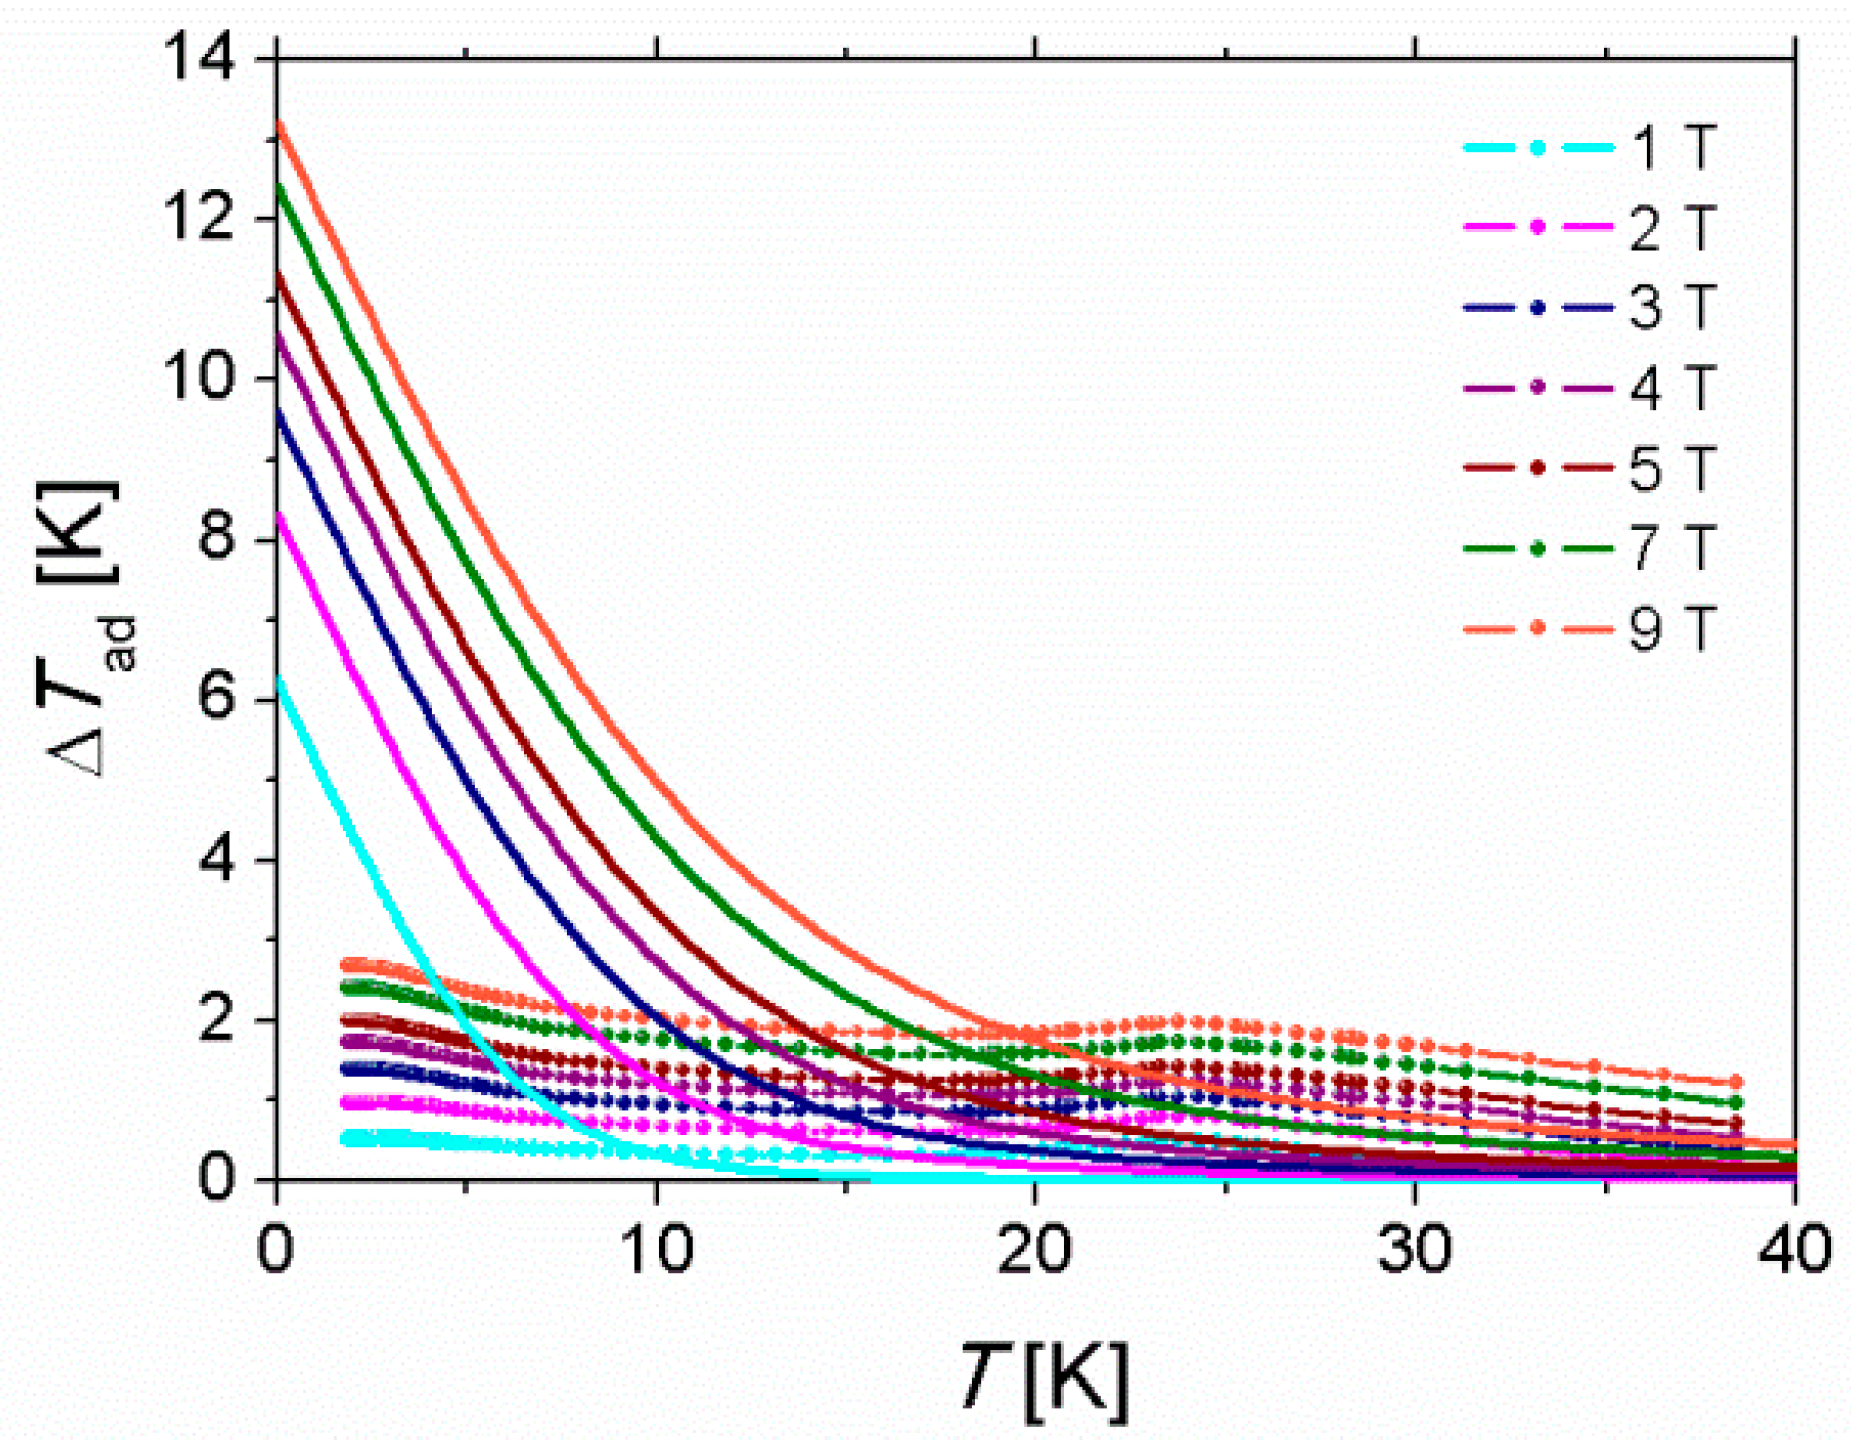
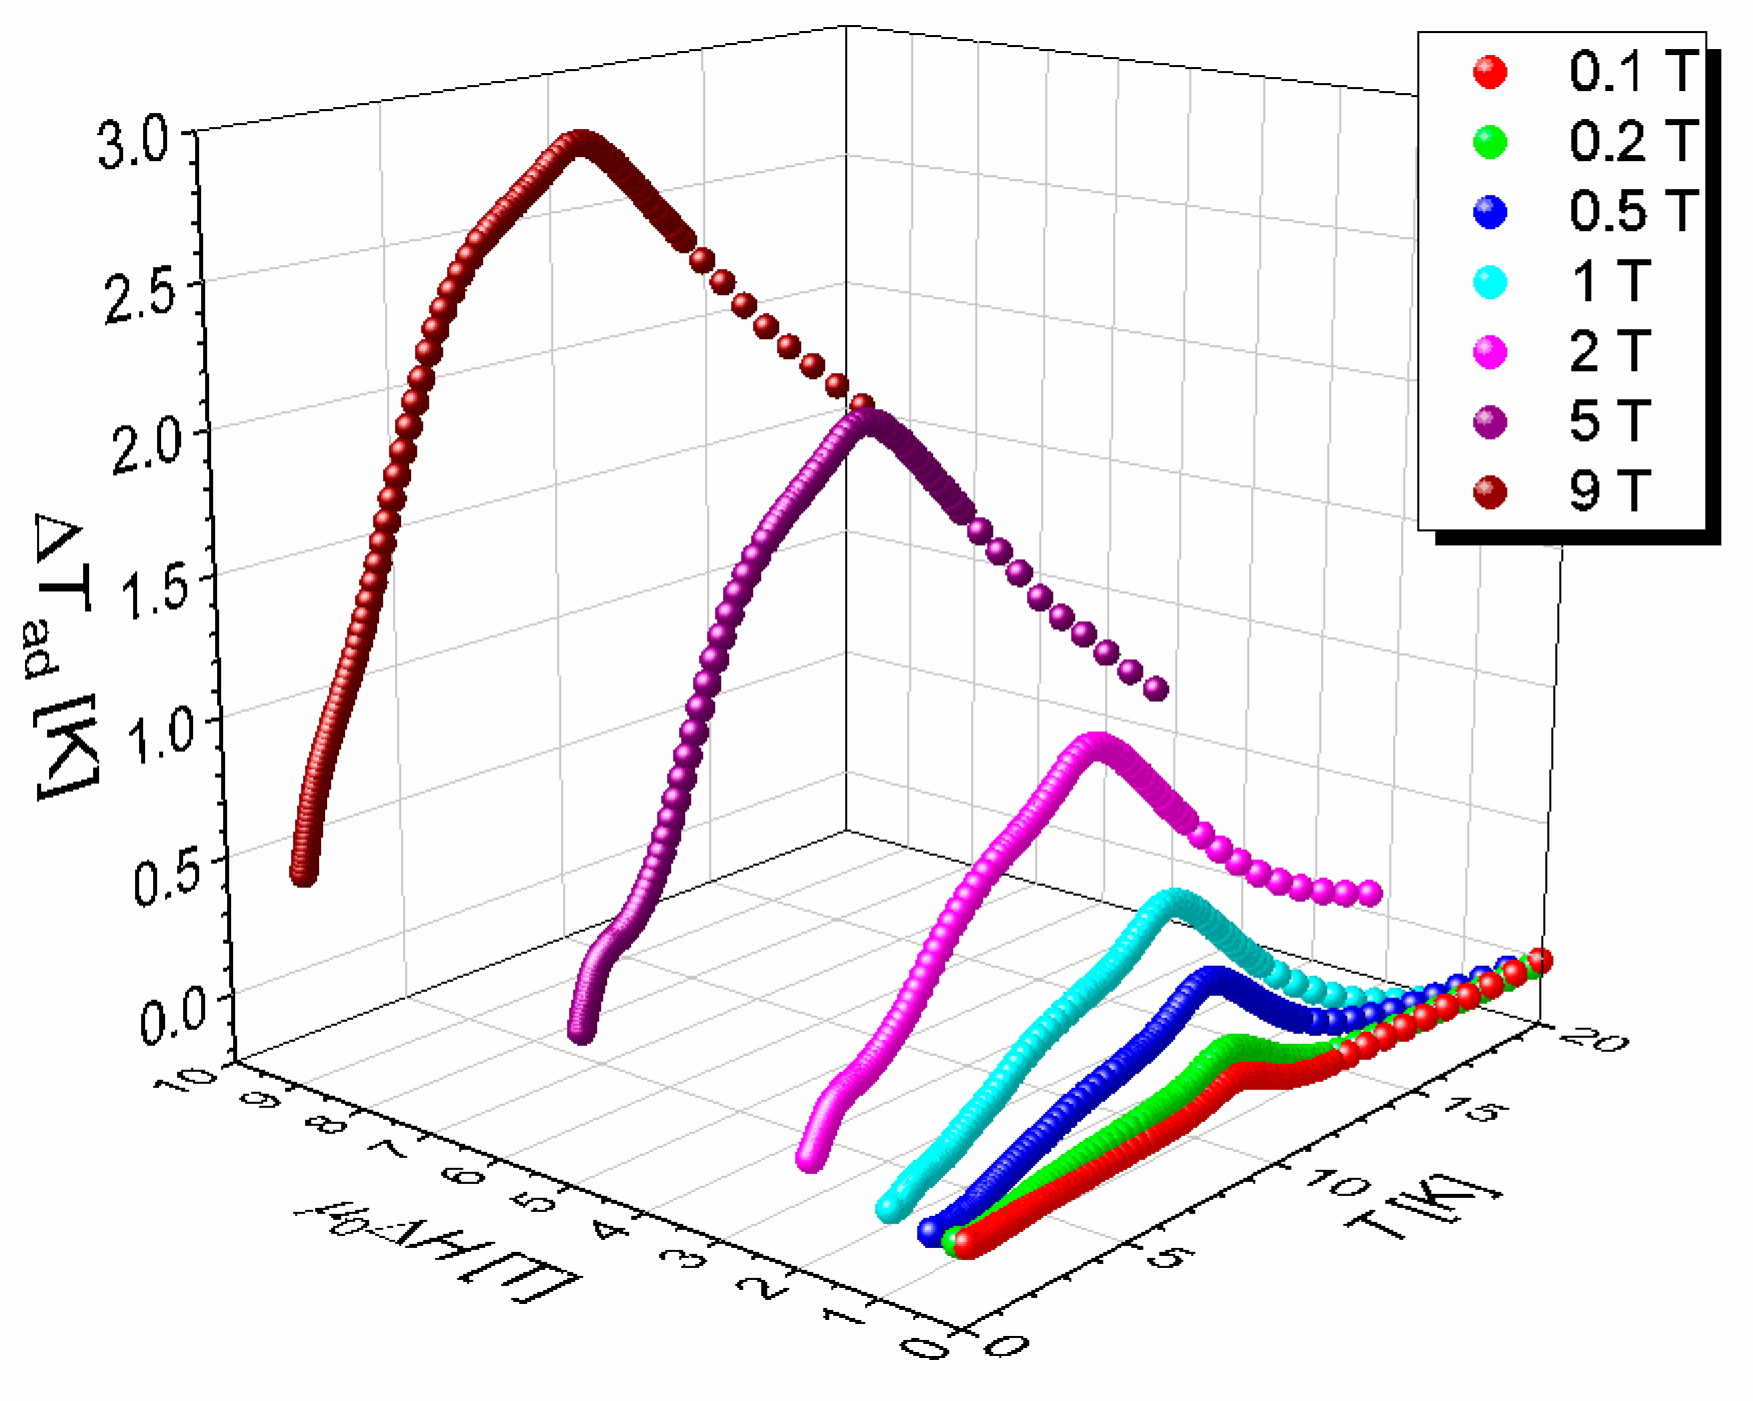
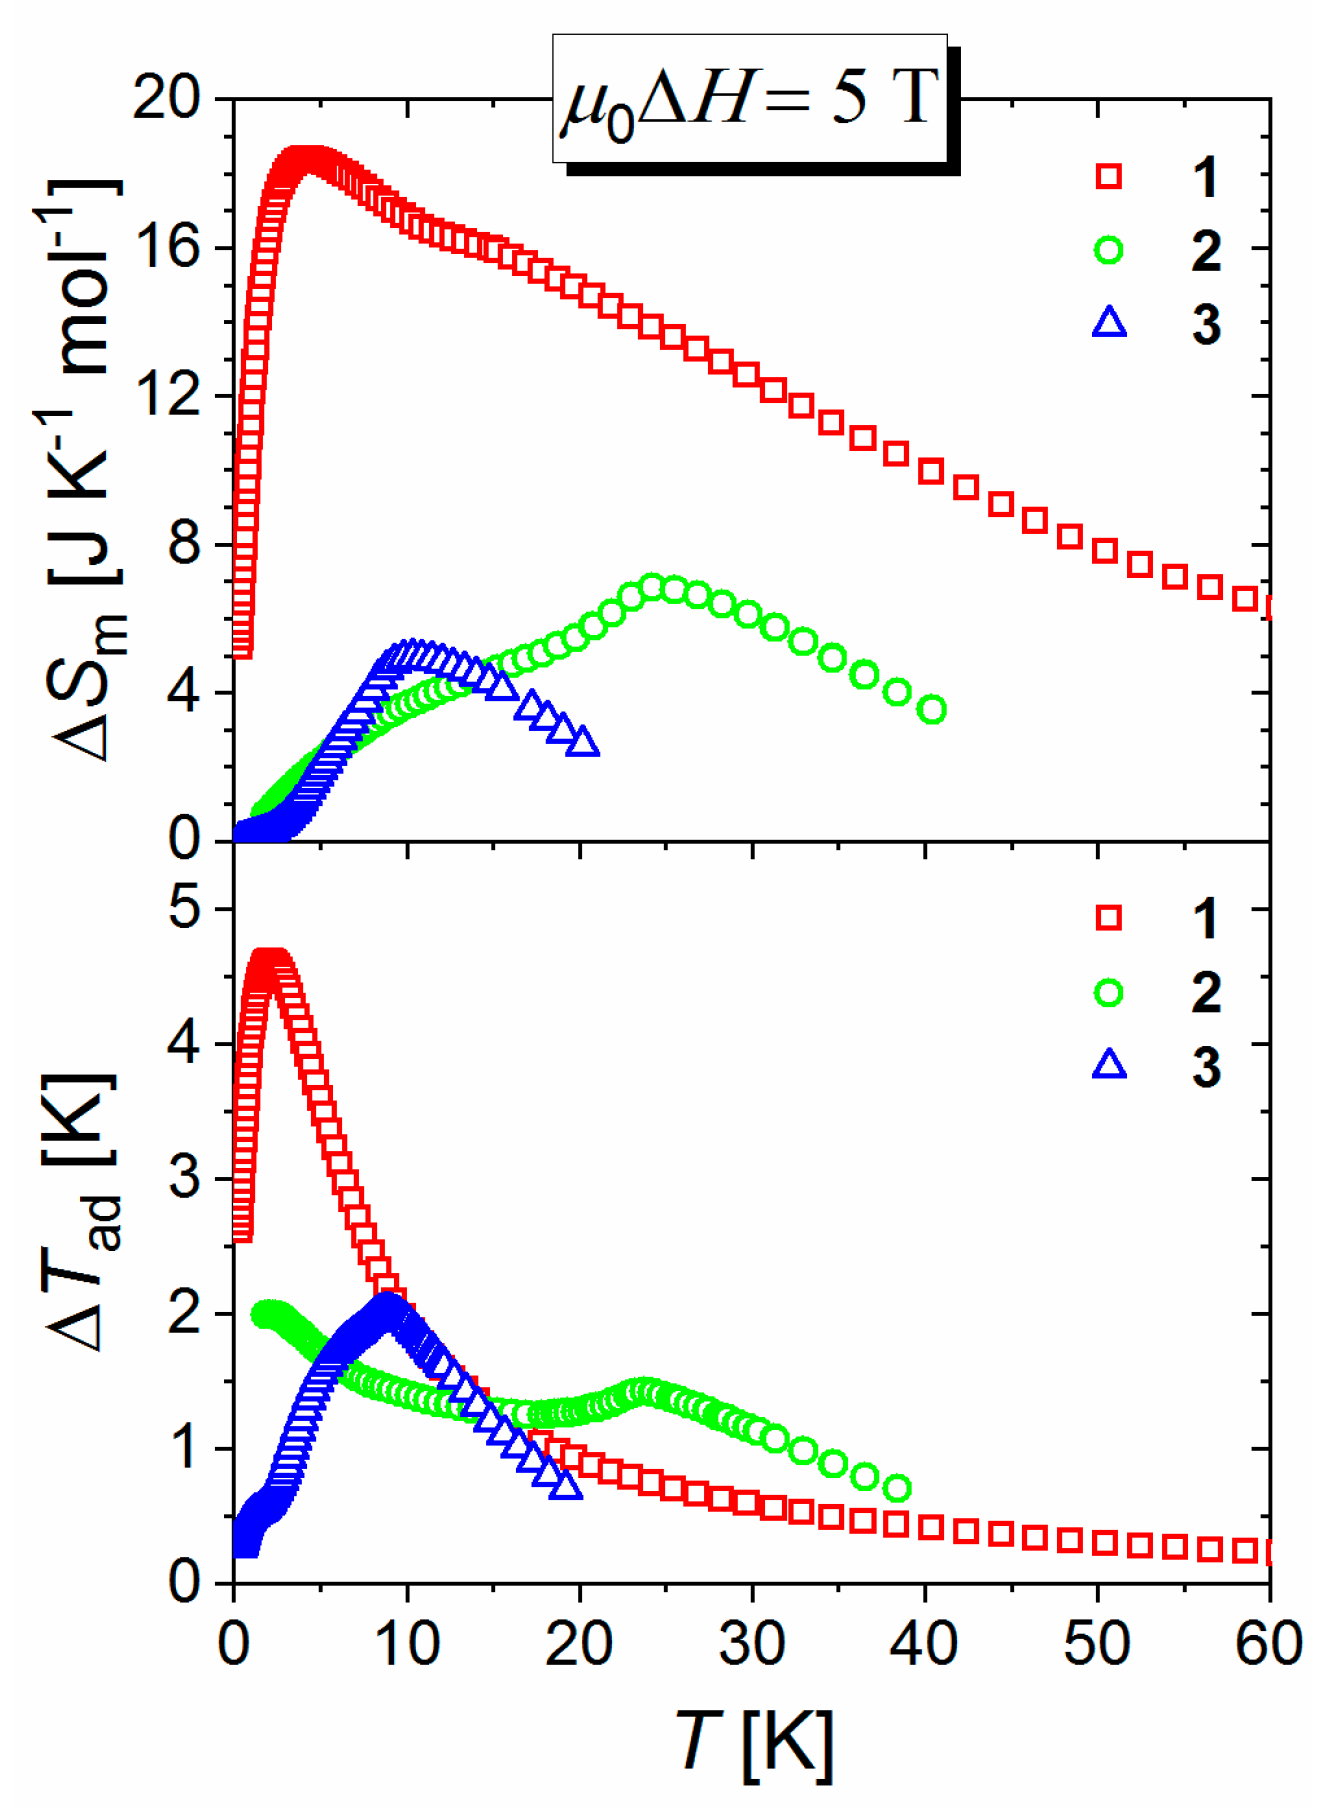
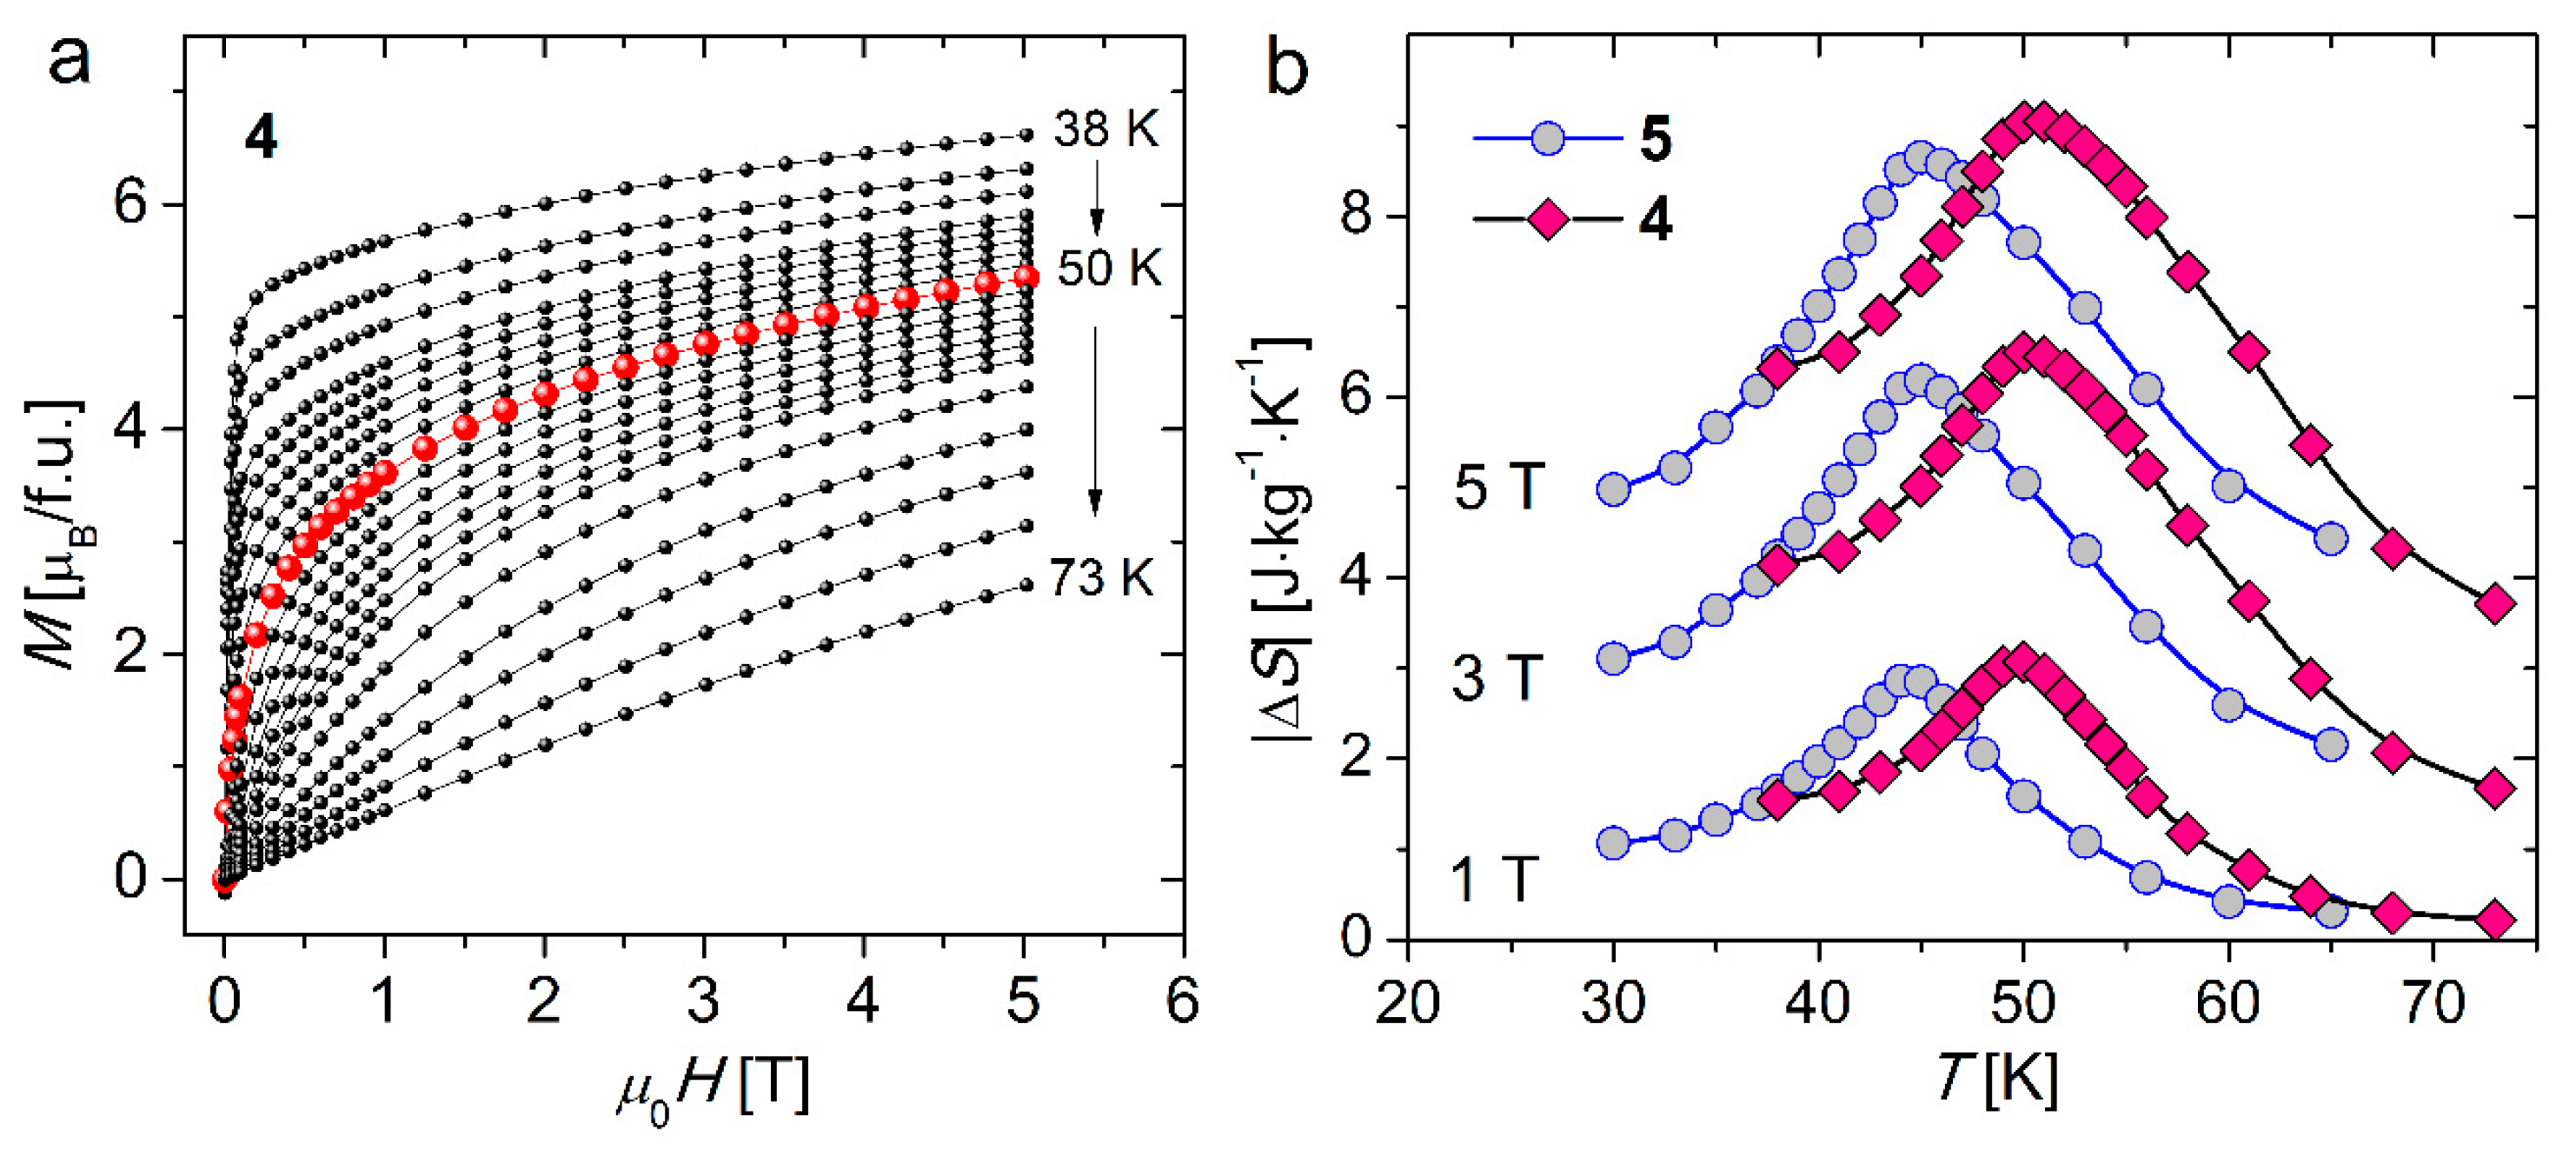
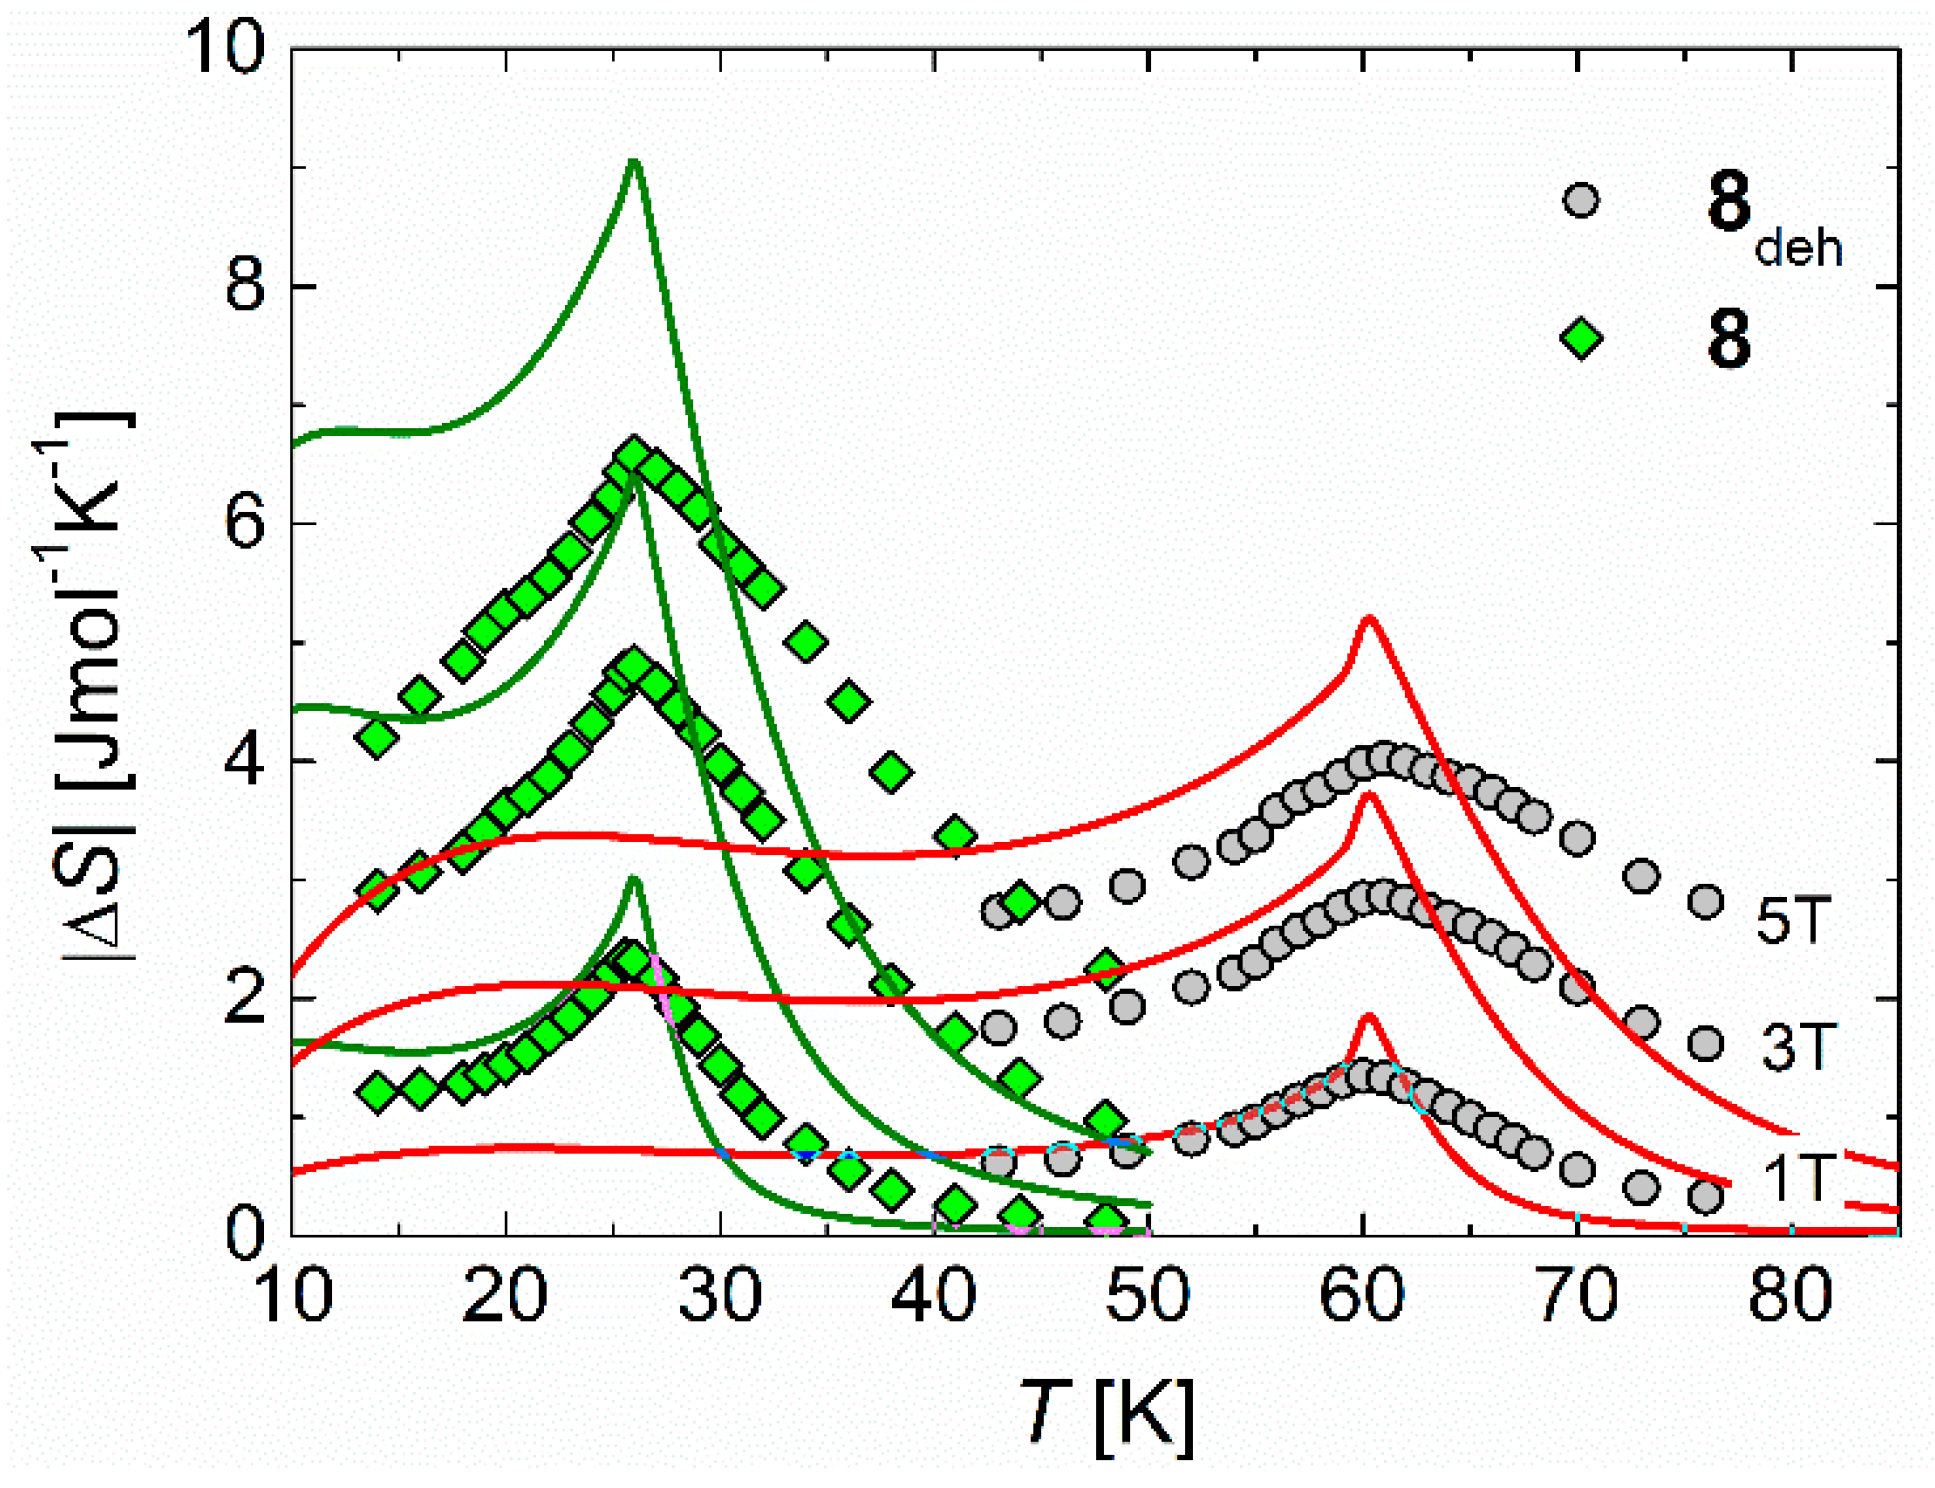
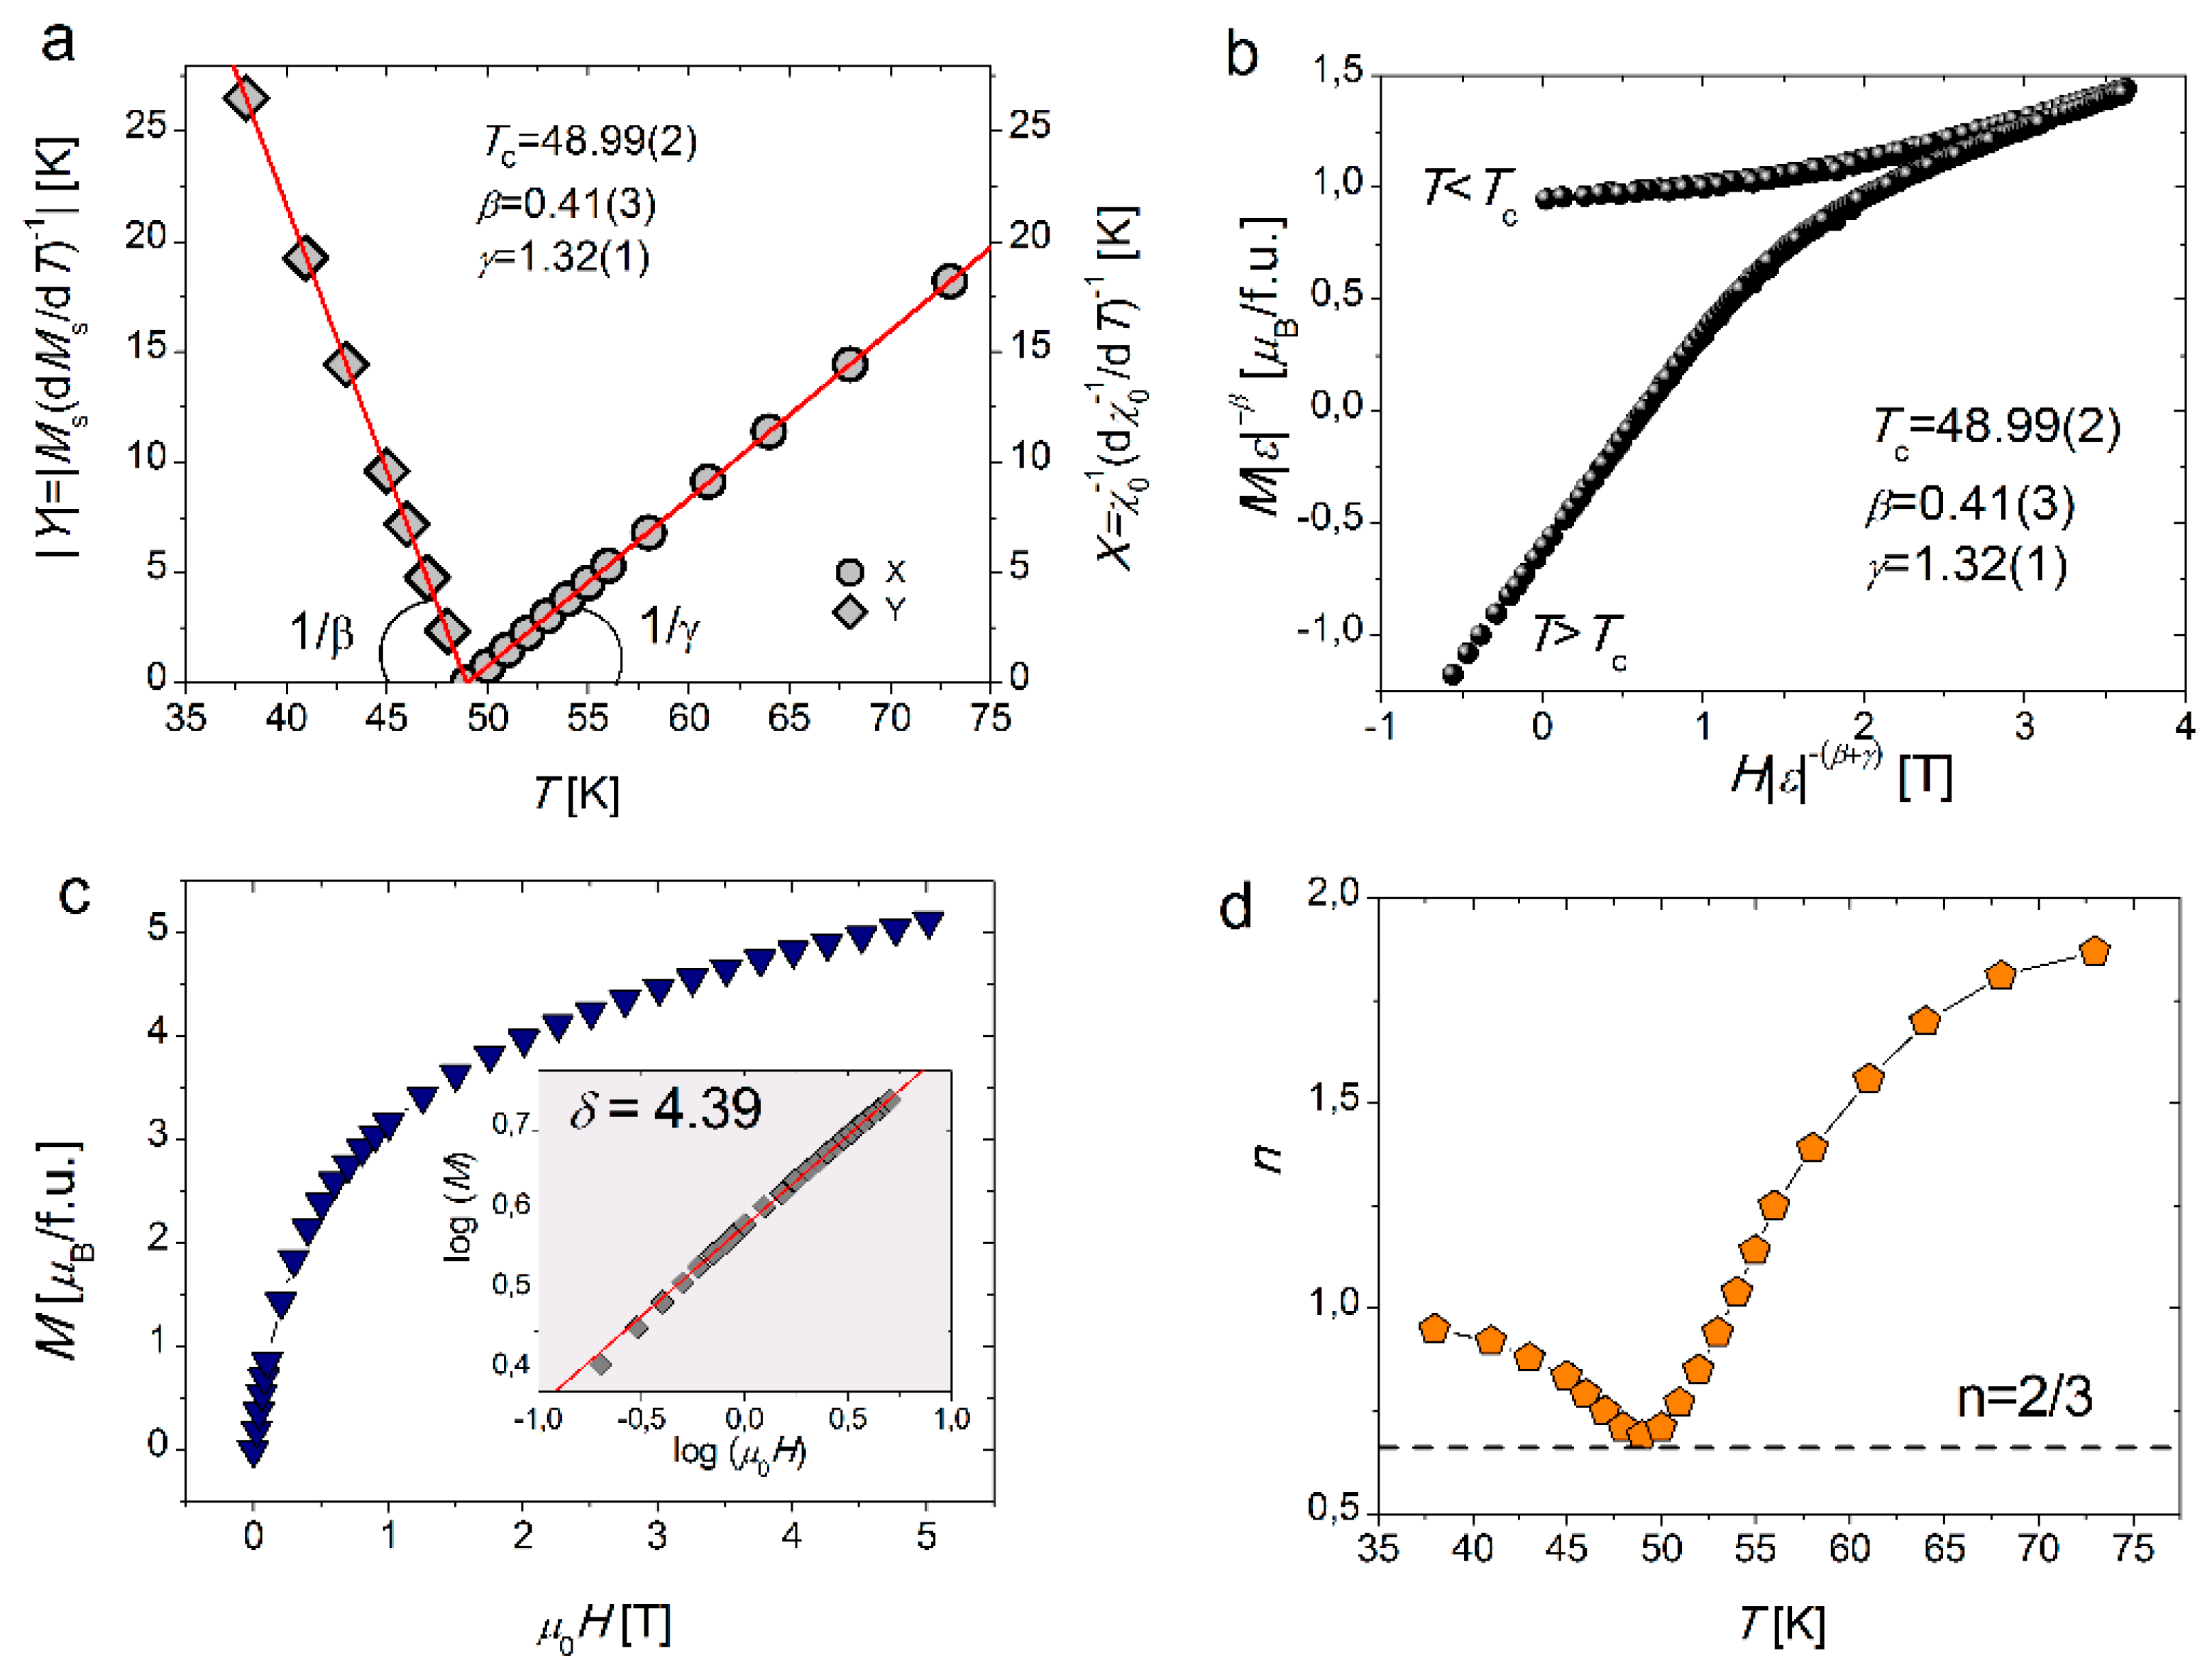
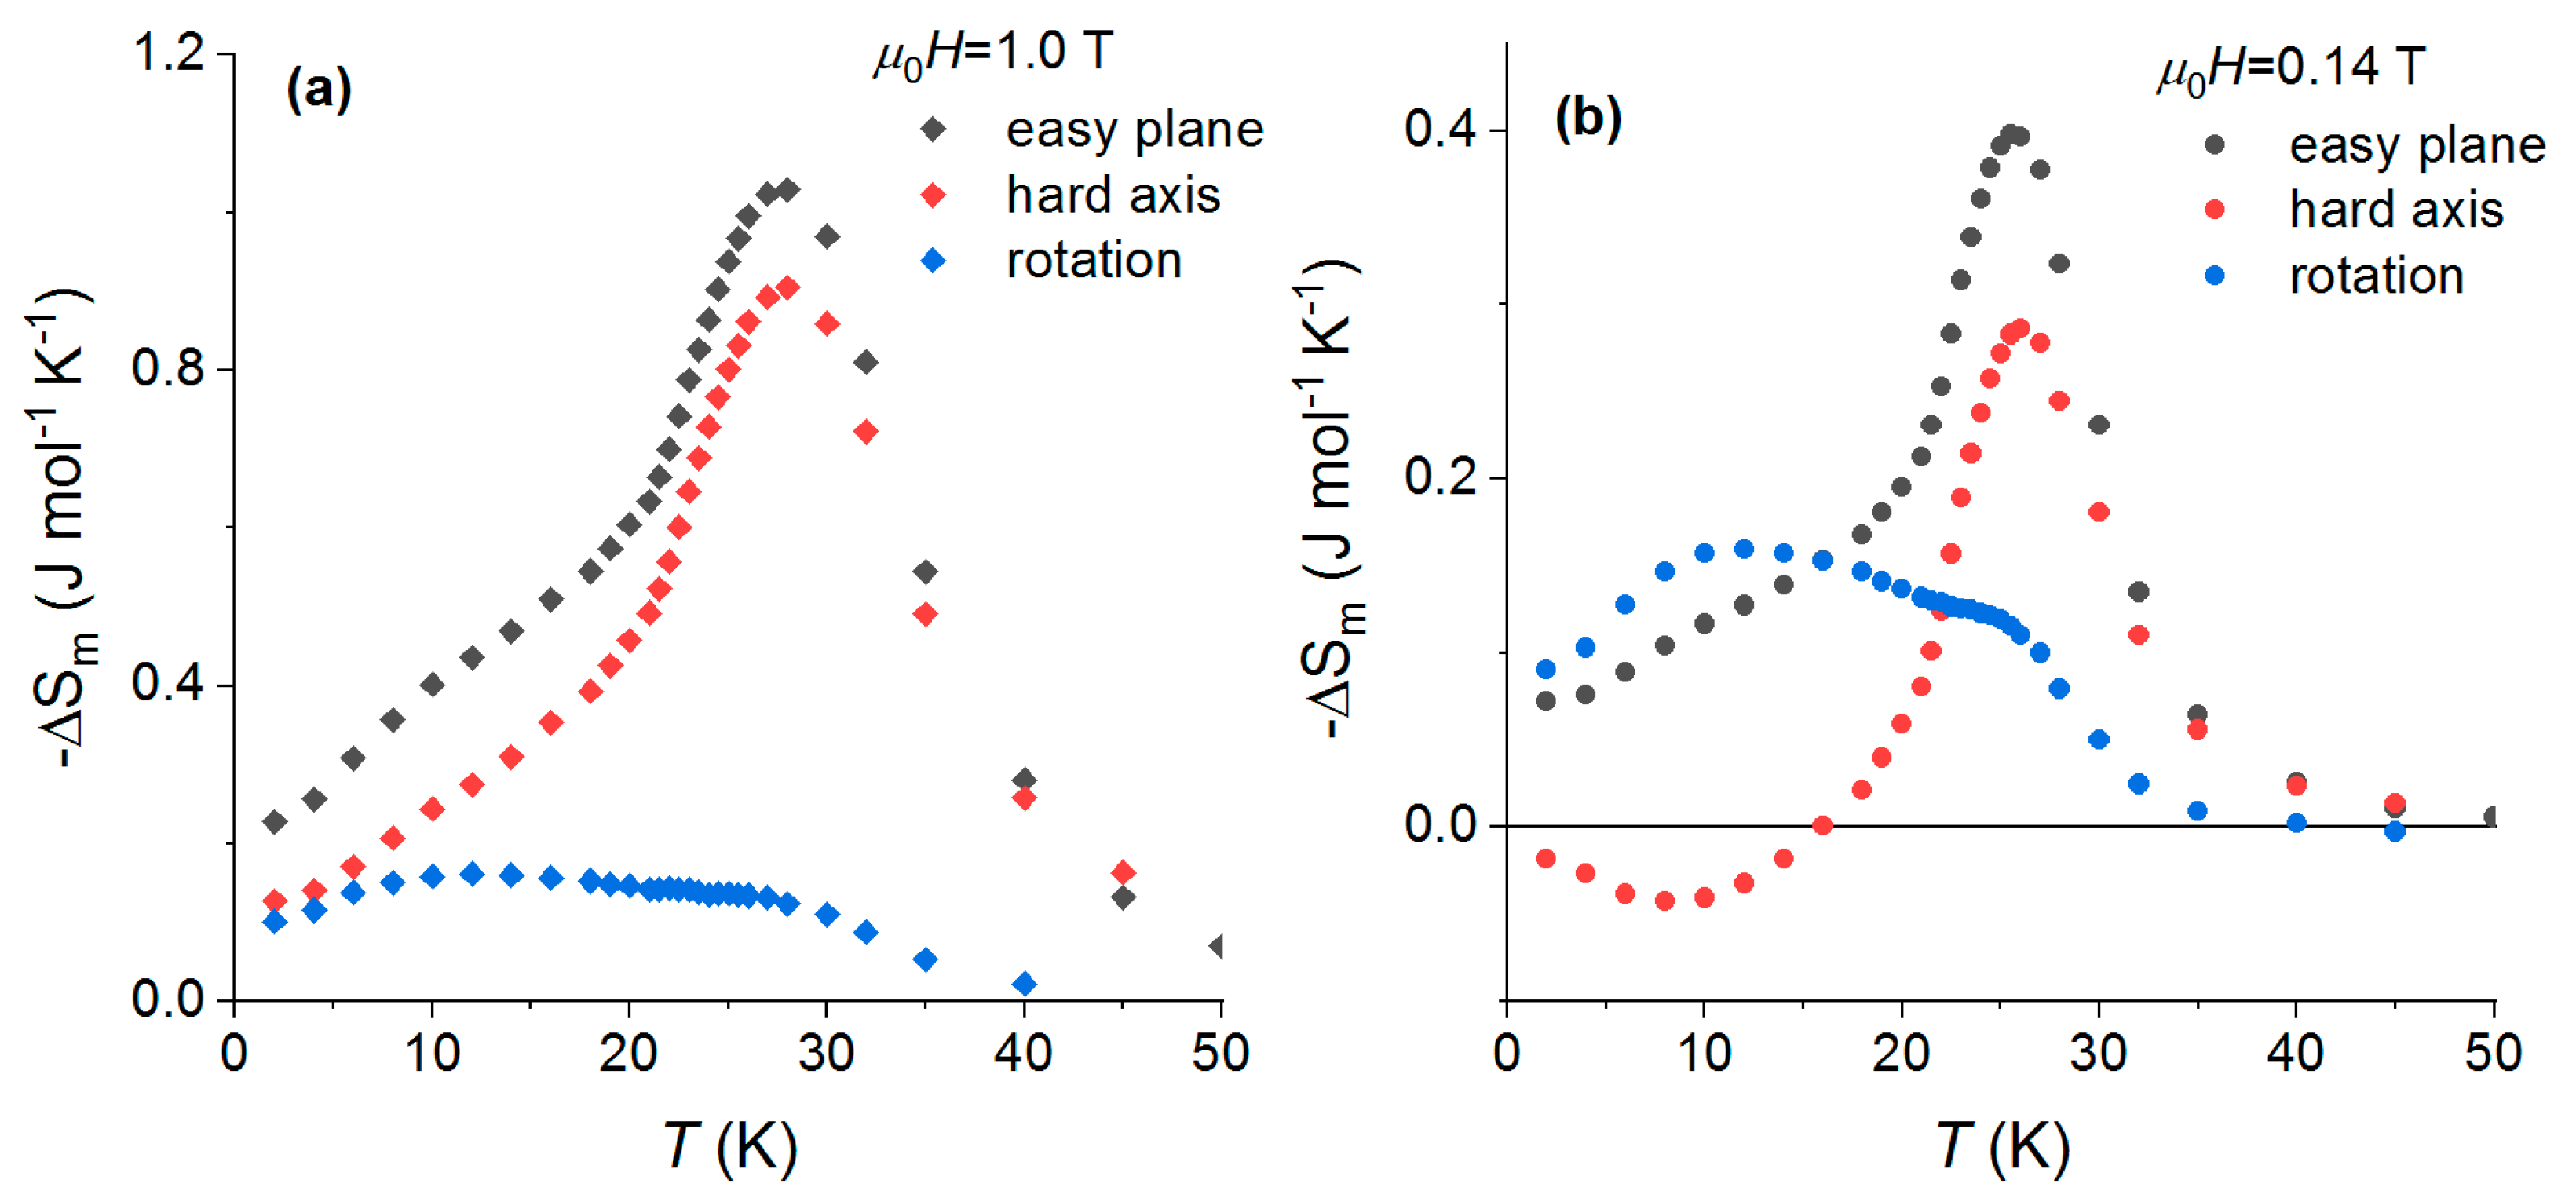
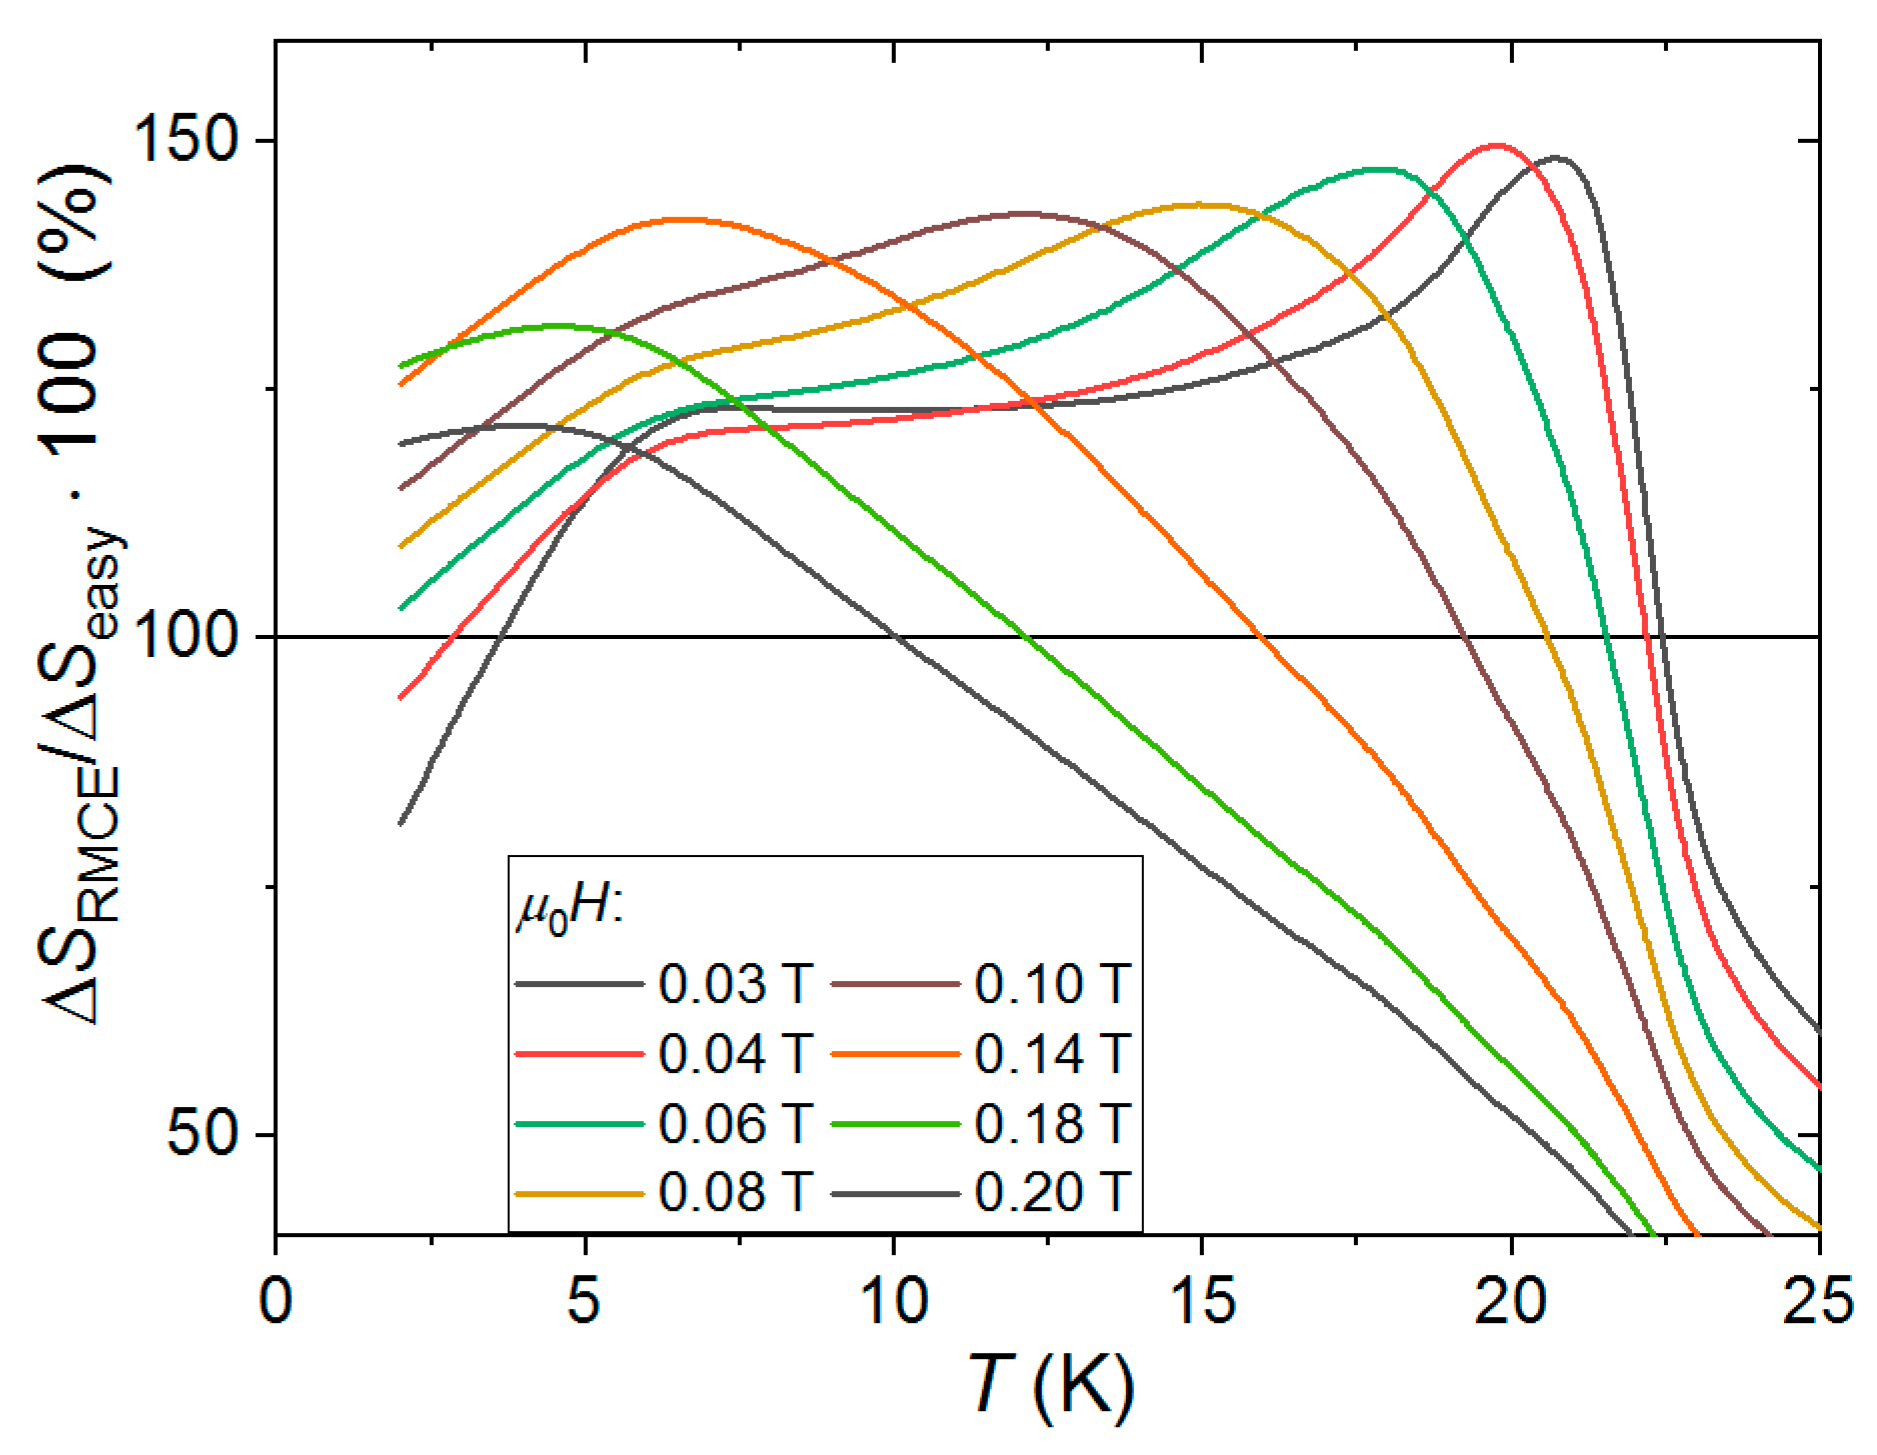
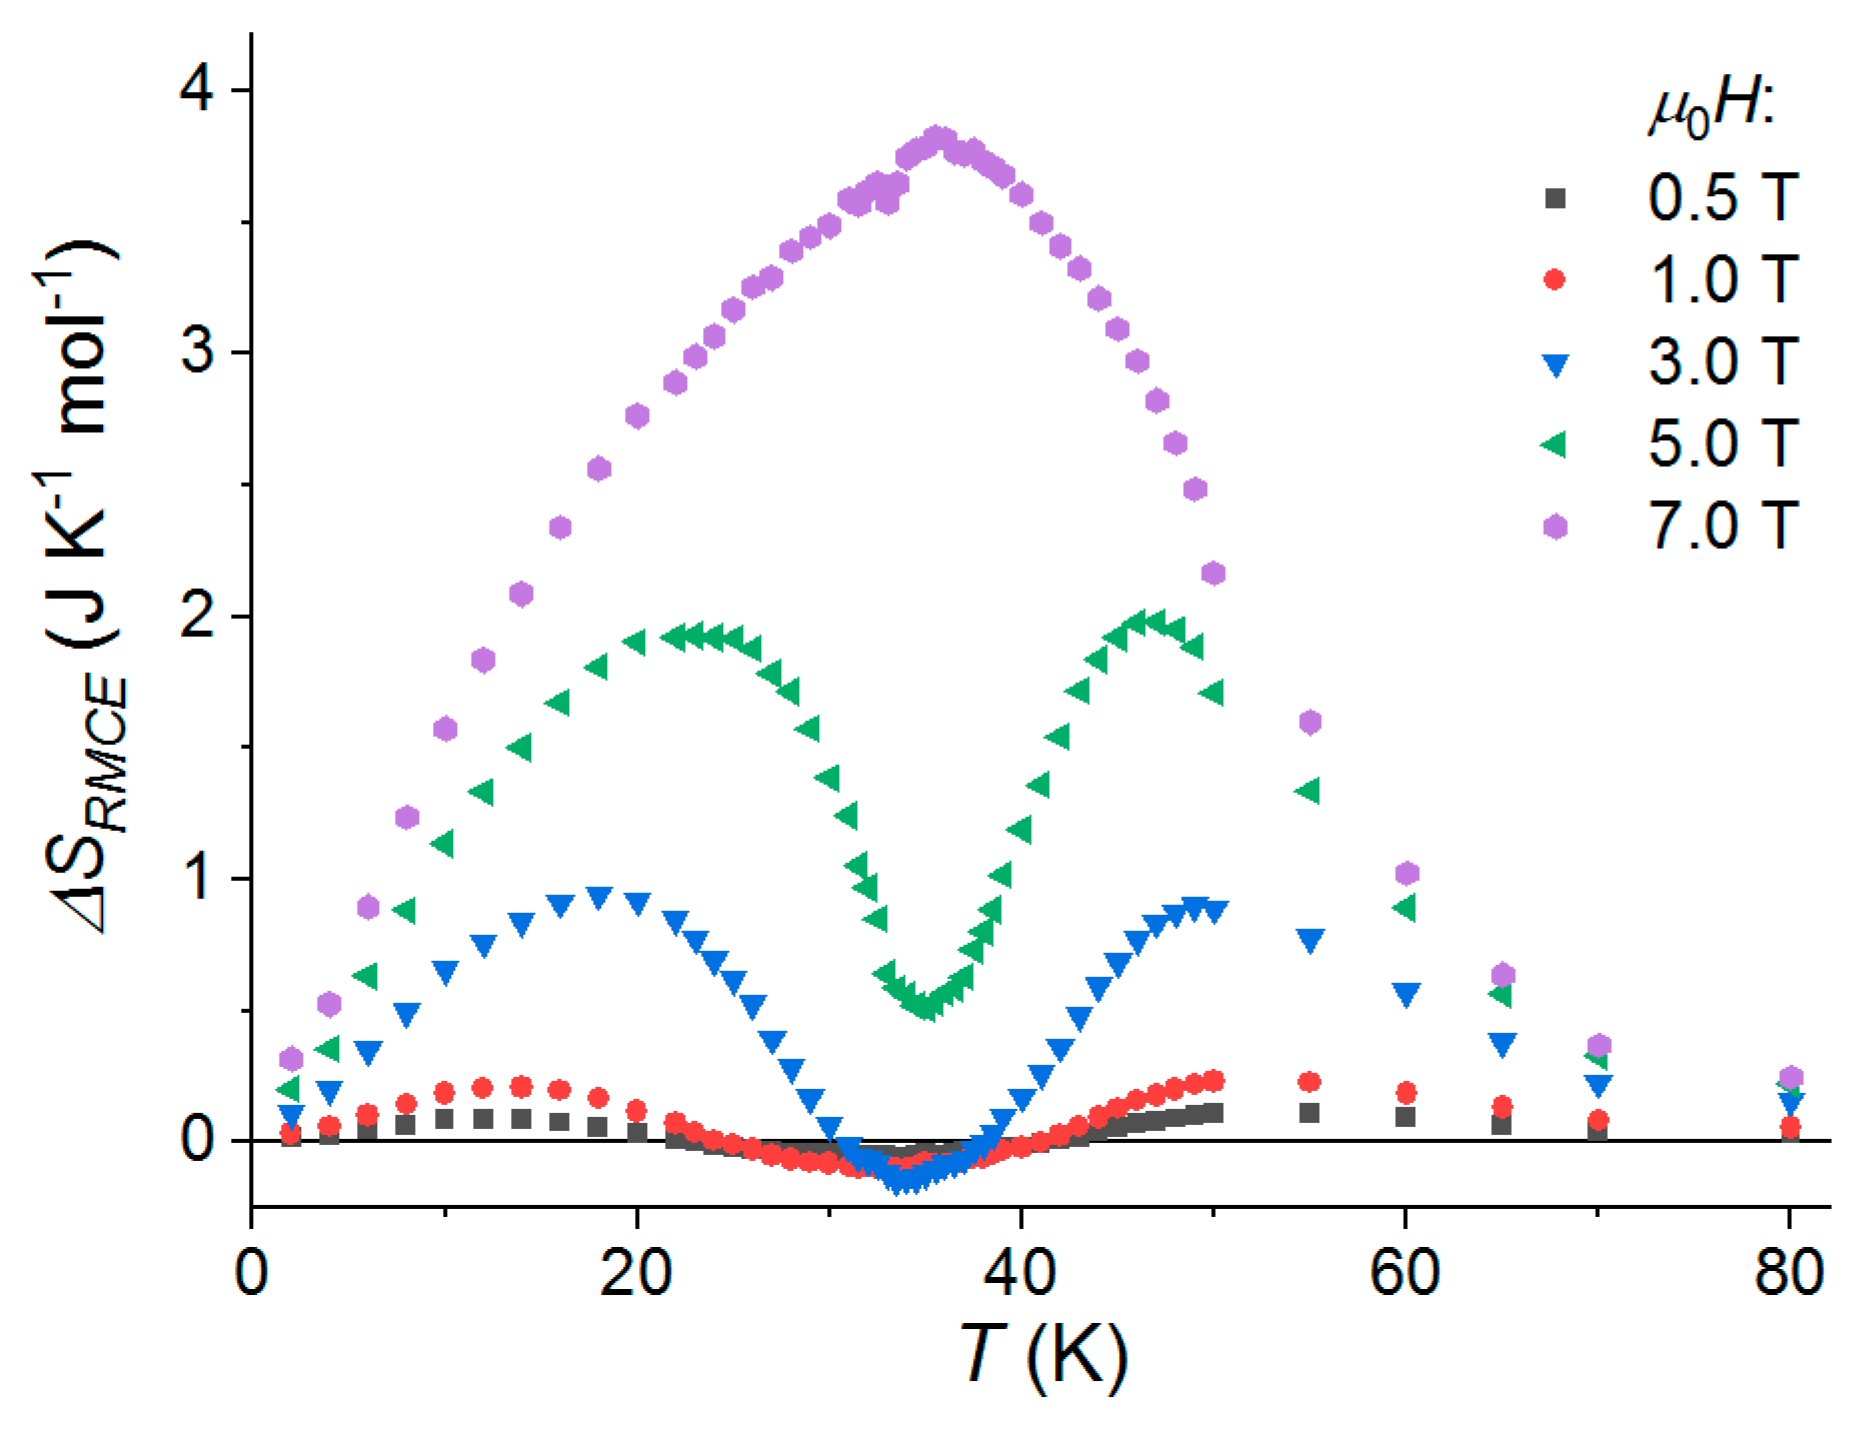
Table 1.
Peak values of ΔSm and ΔTad of 1.
| μ0ΔH (T) | Tpeak (K) | Tpeak (K) | ||
|---|---|---|---|---|
| 1 | 2.4 | 7.18 | 2.9 | 1.6 |
| 2 | 3.0 | 11.42 | 2.6 | 2.8 |
| 3 | 3.5 | 14.48 | 2.4 | 3.6 |
| 4 | 3.9 | 16.62 | 2.3 | 4.2 |
| 5 | 4.3 | 18.38 | 2.2 | 4.6 |
| 7 | 5.3 | 20.86 | 2.0 | 5.2 |
| 9 | 6.5 | 22.77 | 2.0 | 5.6 |
Table 2.
Peak values of ΔSm and ΔTad of 2.
| μ0ΔH (T) | Tpeak (K) | Tpeak (K) | ||
|---|---|---|---|---|
| 0.1 | 23.3 | 0.29 | 23.3 | 0.06 |
| 0.2 | 23.8 | 0.68 | 23.3 | 0.14 |
| 0.5 | 23.8 | 1.50 | 23.8 | 0.30 |
| 1 | 23.8 | 2.44 | 23.8 | 0.50 |
| 2 | 24.3 | 3.85 | 23.8 | 0.80 |
| 3 | 24.3 | 4.99 | 23.8 | 1.04 |
| 4 | 24.3 | 5.97 | 23.8 | 1.24 |
| 5 | 24.3 | 6.83 | 23.8 | 1.42 |
| 7 | 24.3 | 8.30 | 23.8 | 1.73 |
| 9 | 25.5 | 9.49 | 23.8 | 1.97 |
Table 3.
Peak values of ΔSm and ΔTad of 3.
| μ0ΔH (T) | Tpeak (K) | Tpeak (K) | ||
|---|---|---|---|---|
| 0.1 | 8.9 | 0.3 | 8.8 | 0.1 |
| 0.2 | 8.9 | 0.5 | 8.8 | 0.2 |
| 0.5 | 8.9 | 1.0 | 8.9 | 0.4 |
| 1 | 9.3 | 1.6 | 8.8 | 0.6 |
| 2 | 9.3 | 2.7 | 8.8 | 1.1 |
| 5 | 10.3 | 4.9 | 8.9 | 2.0 |
| 9 | 6.9 | 6.9 | 8.8 | 2.8 |
Table 4.
Comparison of MCE data obtained for samples discussed in Section 3. |ΔS|max and RCP were determined for µ0ΔH = 5 T; MCE: magnetocaloric effect; RCP: relative cooling power
Table 4.
Comparison of MCE data obtained for samples discussed in Section 3. |ΔS|max and RCP were determined for µ0ΔH = 5 T; MCE: magnetocaloric effect; RCP: relative cooling power
| Sample | Tc (K) | |ΔS|max (J mol−1 K−1) | |ΔS|max (J kg−1 K−1) | RCP (J mol−1 K−1) | RCP (J kg−1 K−1) |
|---|---|---|---|---|---|
| 4 | 50.0 | 5.07 | 9.09 | 118.40 | 212.61 |
| 5 | 43.0 | 4.82 | 8.65 | 125.43 | 225.59 |
| 6 | 23.8 | 6.70 | 6.50 | 136.9 | 132.9 |
| 7 | 13.4 | 6.10 | 5.90 | 75.6 | 73.1 |
| 8 | 25.0 | 6.70 | 8.95 | 186.2 | 248.9 |
| 8deh | 60.0 | 4.02 | 7.73 | 152.8 | 293.8 |
| 9 | 43.0 | 5.36 | 8.95 | 160.8 | 268.0 |
| 9deh | 68 | 3.33 | 5.82 | 109.9 | 192.1 |
| 9anh | 98 | 3.38 | 6.88 | 101.4 | 206.5 |
| 9HP | 52.5 | 4.63 | 7.73 | 138.9 | 231.8 |
Table 5.
Comparison of the critical exponents determined for samples discussed in Section 3 and for the mean field and 3D Heisenberg, 3D Ising, and 3D XY model. nMCE—the critical exponent n determined based on the MCE data, ntheor—the critical exponents n determined based on Equation (13).
Table 5.
Comparison of the critical exponents determined for samples discussed in Section 3 and for the mean field and 3D Heisenberg, 3D Ising, and 3D XY model. nMCE—the critical exponent n determined based on the MCE data, ntheor—the critical exponents n determined based on Equation (13).
| Sample | β | γ | δ | nMCE | ntheor |
|---|---|---|---|---|---|
| 4 | 0.41 | 1.32 | 4.39 | 0.69 | 0.66 |
| 5 | 0.37 | 1.33 | 4.37 | 0.67 | 0.63 |
| 6 | 0.64 | ||||
| 7 | 0.59 | ||||
| 8 | 0.37 | 1.35 | 4.48 | 0.65 | 0.63 |
| 8deh | 0.37 | 1.40 | 4.95 | 0.67 | 0.64 |
| 9 | 0.38 | 1.35 | 4.69 | 0.66 | 0.64 |
| 9deh | 0.43 | 1.38 | 4.23 | 0.68 | 0.69 |
| 9anh | 0.39 | 1.37 | 4.49 | 0.69 | 0.65 |
| 9HP | 0.37 | 1.40 | 4.48 | 0.67 | 0.64 |
| Mean field model | 0.500 | 1 | 3 | 0.66 | |
| Heisenberg model | 0.365 | 1.385 | 4.8 | 0.64 | |
| Ising model | 0.325 | 1.24 | 4.82 | 0.61 | |
| XY model | 0.346 | 1.316 | 4.81 | 0.57 |
© 2018 by the authors. Licensee MDPI, Basel, Switzerland. This article is an open access article distributed under the terms and conditions of the Creative Commons Attribution (CC BY) license (http://creativecommons.org/licenses/by/4.0/).
Share and Cite
MDPI and ACS Style
Fitta, M.; Pełka, R.; Konieczny, P.; Bałanda, M. Multifunctional Molecular Magnets: Magnetocaloric Effect in Octacyanometallates. Crystals 2019, 9, 9. https://doi.org/10.3390/cryst9010009
AMA Style
Fitta M, Pełka R, Konieczny P, Bałanda M. Multifunctional Molecular Magnets: Magnetocaloric Effect in Octacyanometallates. Crystals. 2019; 9(1):9. https://doi.org/10.3390/cryst9010009
Chicago/Turabian StyleFitta, Magdalena, Robert Pełka, Piotr Konieczny, and Maria Bałanda. 2019. "Multifunctional Molecular Magnets: Magnetocaloric Effect in Octacyanometallates" Crystals 9, no. 1: 9. https://doi.org/10.3390/cryst9010009
Note that from the first issue of 2016, this journal uses article numbers instead of page numbers. See further details here.