Abstract
Synthetic chalcomenite-type cupric selenite CuSeO3∙2H2O has been studied at room temperature under compression up to pressures of 8 GPa by means of single-crystal X-ray diffraction, Raman spectroscopy, and density-functional theory. According to X-ray diffraction, the orthorhombic phase undergoes an isostructural phase transition at 4.0(5) GPa with the thermodynamic character being first-order. This conclusion is supported by Raman spectroscopy studies that have detected the phase transition at 4.5(2) GPa and by the first-principles computing simulations. The structure solution at different pressures has provided information on the change with pressure of unit–cell parameters as well as on the bond and polyhedral compressibility. A Birch–Murnaghan equation of state has been fitted to the unit–cell volume data. We found that chalcomenite is highly compressible with a bulk modulus of 42–49 GPa. The possible mechanism driving changes in the crystal structure is discussed, being the behavior of CuSeO3∙2H2O mainly dominated by the large compressibility of the coordination polyhedron of Cu. On top of that, an assignation of Raman modes is proposed based upon density-functional theory and the pressure dependence of Raman modes discussed. Finally, the pressure dependence of phonon frequencies experimentally determined is also reported.
1. Introduction
Compounds containing divalent copper (Cu2+) have very interesting physical properties that are mainly related to the typical low-symmetry distortion around the Cu2+ ion [1]. On the other hand, selenite compounds are fascinating materials because they contain cations with lone pairs of electrons that give them particular characteristics [2]. Chalcomenite-type cupric selenite CuSeO3∙2H2O matches these two conditions, being therefore a quite attractive compound. On top of that, it has the additional interest of containing water molecules [3] that is known to influence the chemical and physical properties of materials [4].
CuSeO3∙2H2O has an orthorhombic crystal structure (space group P212121) [5] that is shown in Figure 1. It is formed by cross-linked chains of Cu and Se coordination polyhedra. The SeO3 units alternate with CuO5 group in square pyramidal coordination forming chains parallel to the b-axis. The adjacent chains are connected by H atoms weakly bonded to O atoms (not belonging to water) by a bridge contact, which is very weak in comparison with the strong (covalent) H-O bond within the water molecule. Another interesting feature of the crystal structure is the existence of empty cavities in the structure (see Figure 1c), which are related to presence of Se lone pair of electrons.
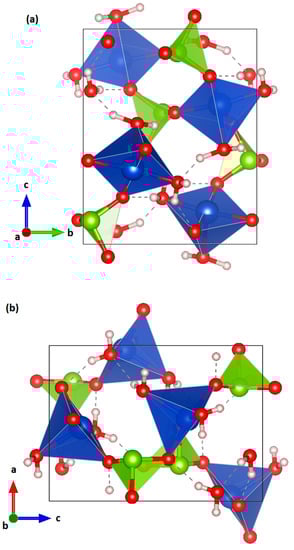
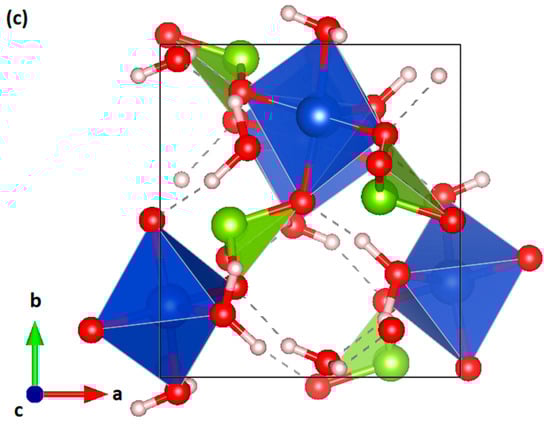
Figure 1.
Different projections of the crystal structure of CuSeO3∙2H2O at ambient conditions. (a) Along [100]; (b) along [010]; and (c) along [001]. The coordination polyhedra of Cu and Se and the water molecules are shown. Cu, Se, O, and H atoms are represented in blue, green, red, and pink color, respectively. The weak O-H bonds described in the text are shown with dashed lines. The presence of open channels can be seen in (c).
After the accurate determination of the crystal structure, most studies of chalcomenite have been focused on its lattice vibrations [6,7] and thermophysical and thermochemical properties [8,9]. All of these studies have been carried out at ambient pressure. However, it is known that high pressure (HP) could lead to interesting phenomena in minerals, including pressure-driven phase transitions [10]. In particular, HP studies have been performed in hydrated minerals related to chalcomenite, like FeSO4∙H2O and MgSO4∙H2O, leading to results relevant for Earth and Planetary Sciences [11,12]. However, nothing is known of the effects of HP in chalcomenite.
We report here a systematic study of the HP behavior of CuSeO3∙2H2O up to 8 GPa. The effects of pressure on the crystal structure and phonons have been studied by a combination of single-crystal X-ray diffraction (SC-XRD) and Raman experiments with density-functional theory (DFT) calculations. Such approach has proven to be successful for understanding the HP behavior of oxides [13]. In the present case, we have found evidence of the existence of a first-order isostructural phase transition and determined the influence of pressure on crystal-structure parameters and phonon frequencies. The changes observed have been related to modifications induced by pressure in the different polyhedral units.
2. Materials and Methods
2.1. Sample Preparation
A stock solution of Cu(NO3)2∙3H2O with a concentration of 1 mole per liter was prepared in water. A second stock solution of SeO2 dissolved in water was prepared separately with also a 1 mole/liter concentration. An agar gel of 1.5% in weight was prepared containing Cu(NO3)2∙3H2O solution. Prior to the gel formation, the pH of the solution was adjusted to pH = 2 using concentrated HNO3 acid. Once the gel was settled, 5 mL of the SeO2 stock solution was poured on top of the gel for diffusion. After a few days, single crystals of CuSeO3∙2H2O started to appear and were handpicked for a single crystal diffraction experiment. The nature and the purity of the as-grown was confirmed by the Rietveld refinement of a powder X-ray diffraction pattern acquired using a diffractometer from PANalytical (PaNalytical, Almelo, The Netherlands). The data were collected at room temperature (and pressure) on a fine powder obtained from crushed single crystals using a Cu Kα wavelength. The collected pattern of the as-synthetized sample and the corresponding Rietveld refinement are shown in Figure 2 together with the residuals. The refinement was carried out using the HighScore suite (HighScore Plus, PANalytical, Almelo, The Netherlands) [14]. All of the observed peaks can be accounted for by the known crystal structure [5], which leads to small residuals. The resulting cell parameters were a = 6.6719(2) Å, b = 7.3710(2) Å, and c = 9.1718(2) Å.
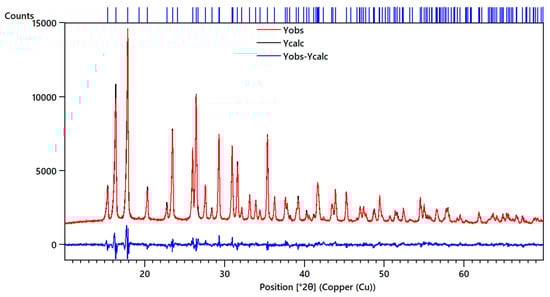
Figure 2.
Powder X-ray diffraction pattern of synthetic chalcomenite collected at room conditions (black). The refinement is shown in red and the residuals in blue. Ticks indicate the positions of Bragg peaks.
2.2. Experimental Details
All SC-XRD measurements were made at room temperature using an Agilent SuperNOVA diffractometer (Agilent, Yarnton, Oxfordshire, United Kingdom) equipped with an EOS Charged Coupled Device (CCD) detector and Mo Kα radiation micro-source. All measurements were processed with the CrysAlisPro software (Rigaku Corporation, Oxford, United Kingdom) [15]. Numerical absorption correction based on Gaussian integration over a multifaceted crystal model was applied using the ABSORB program [16]. For high-pressure measurements, we have employed a Mini-Bragg diamond anvil cell (DAC) from Almax-EasyLab (Diksmuide, Belgium), with an opening angle of 90° and equipped with anvil culets of 500 μm diameter, fitted with a stainless gasket pre-indented to a 75 μm thickness, and containing a centered hole of 200 μm diameter. A methanol–ethanol mixture (4:1) was used as a pressure-transmitting medium, which remains hydrostatic in the range of pressure used in our experiments [17]. The sample was placed on one of the diamonds anvils (diffracted side) together with a small ruby sphere used as pressure sensor [18]. Pressure was determined with an accuracy of 0.04 GPa. Special attention was taken to avoid sample bridging between the two diamond anvils [19].
The crystal structure was refined, for each pressure, using previous results as a starting point, on F2 by full-matrix least-squares refinement with the SHELXL program [20]. Due to limitations of the opening angle of our DAC, it is only possible to collect about 60–70% of the reflections present in a full dataset at ambient conditions. In general, the atoms were refined anisotropically, with the exception of some oxygen atoms because, in some cases, it was only possible to do it in isotropic thermal parameters. No restraints were used during this process.
Raman experiments were performed with the same DAC setup used in the SC-XRD experiments and the same pressure medium and scale. Raman spectra were acquired employing a commercial scanning confocal Raman instrument (Renishaw InVia, Wotton-under-Edge, Gloucestershire, United Kingdom) exciting with a continuous-wave operation diode laser at 532 nm and detecting with a thermo-electric cooled CCD detector achieving a spectral resolution of 0.5 cm−1 with an 1800 l/mm grating. A 20× long working distance objective was used to achieve on the sample a laser-spot diameter of less than 5 µm. The laser power on the sample was smaller than 20 mW.
2.3. Density-Functional Theory Calculations
We have performed DFT ab initio total-energy simulations of the properties of chalcomenite. The Vienna ab initio simulation package (VASP) [21] was employed with the projector-augmented wave pseudopotential and the plane–wave method [22]. The exchange–correlation energy was described by the generalized-gradient approximation with the Perdew–Burke–Ernzerhof for solids (PBEsol) prescription [23]. Van der Waals interactions were not included in these calculations. For comparison, we also carried out simulations using PBE pseudopotentials and including Van der Waals interactions [24]. In both types of computational simulations, plane wave kinetic energy cutoffs of 530 eV and dense meshes of special k-points generated with the Monkhorst–Pack scheme [25] were employed. For the considered structure, full optimizations of all the structural parameters were performed at different selected volumes. In the final optimized configurations, the atomic forces on the atoms were lower than 0.005 eV/Å, and the differences between diagonal components of the stress tensor less than 0.1 GPa. The equation of state was derived from the energy–pressure–volume (E, V, P) data obtained at each of the selected volumes [26]. Temperature and zero-point motion effects were not included in the present simulations.
Lattice vibrations were simulated to study the phonons at the zone center (Γ point) of the Brillouin zone with the direct force–constant approach [27]. The symmetry, polarization vectors, and phonon frequencies as well as the irreducible representation and the character of all the phonons of chalcomenite at Γ were provided by the diagonalization of the dynamical matrix. We have performed accurate calculations of the forces on the atoms when fixed small displacements from the equilibrium configuration are considered, in order to obtain this dynamical matrix. The crystal symmetry was used to reduce the number of independent displacements needed.
3. Results and Discussion
3.1. Structural Analysis
Our SC-XRD experiments at ambient conditions confirmed that CuSeO3∙2H2O crystallizes in the orthorhombic space group P212121 (Number 19). The determined unit–cell parameters agree well with those we determined from powder XRD. As described by Robinson et al. [5] and shown in Figure 1, the structure is composed of chains containing polyhedra with Cu in square pyramidal coordination alternating with SeO3 units. Within each chain, all the Cu pyramids point in the same general direction. In addition, every chain is surrounded by four chains with Cu pyramids oriented in the opposite direction. The results of the experiment made at ambient conditions, which served as reference for HP experiments, are summarized in Table 1.

Table 1.
Crystal data and refinement structural parameters for CuSeO3∙2H2O at ambient conditions.
The primary crystallographic data of the HP experiments have been deposited in the form of cif files at the Inorganic Crystal Structure Database (Deposition Numbers 1969406-1969418). From experiments under HP conditions, we have obtained the pressure dependence of unit–cell parameters. In Figure 3, we show our experimental results (from two independent experiments) together with the results from our computer simulations. From the calculations, we found that the inclusion of weak van der Waals interactions leads to a less accurate description of the unit–cell volume at ambient pressure. In particular, it is underestimated by 3%. In addition, calculations neglecting these interactions provide a better description of the effects of pressure in the crystal structure. This can be seen in Figure 3. The calculations not considering the van der Waals interactions are those shown in solid blue symbols (while those including these interactions are the empty blue symbols). They are the ones that better agree with our experiments. The differences between these calculations and experiments are comparable to those observed for other compounds [26]. All these facts suggest that van der Waals interactions are not accurately described in computing simulations [28] of the HP behavior of chalcomenite.
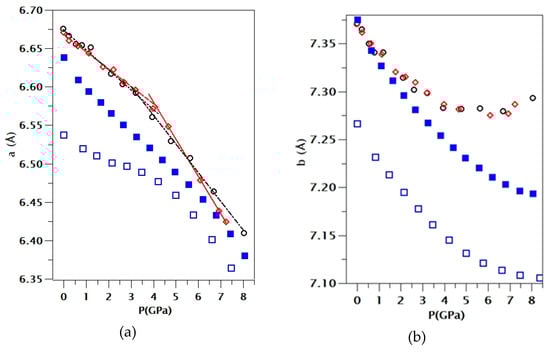
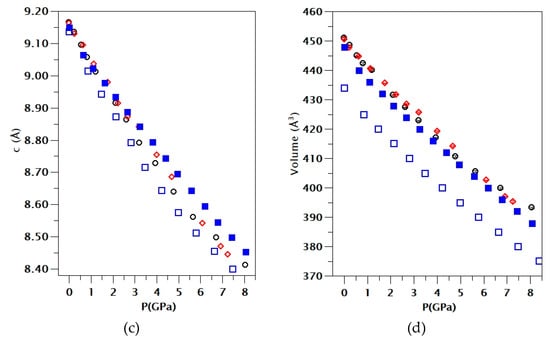
Figure 3.
Pressure dependence of unit–cell parameters and volume of CuSeO3∙2H2O. Panels (a), (b), and (c) show the lattice parameters indicated in the vertical axis and (d) the unit-cell volume. Error bars are comparable to symbol sizes. Black and red symbols are from different experiments (runs 1 and 2, respectively). Solid blue squares are from PBEsol calculations (without van der Waals interactions) and empty blue squares are from calculations including van der Waals interactions. In the plot of the a-axis, we have included solid lines to highlight the slope change of the pressure dependence observed around 3.5 GPa in run 1 and 4 GPa in run 2.
For the pressure–dependence of the c-axis, we observe a nearly linear pressure evolution, with experiments and calculations in qualitative agreement. For the a- and b-axes, a nonlinear pressure dependence has been found. In particular, in the a-axis, there is a slope change observed at a critical pressure of around 3.5 GPa in run 1 and at 4 GPa in the second experiment. This fact is highlighted by solid lines in Figure 3, which represent the pressure dependence in the a-axis below and above the critical pressure. Calculations show a slightly different pressure behavior of the a-axis but also found a kink at 4 GPa. On the other hand, in the b-axis, we found a decrease with pressure up to 4.4 GPa where a minimum value is reached, and, beyond this pressure, this unit–cell parameter increases with pressure. Again, calculations showed a qualitative similar behavior but with the minimum close to 8 GPa. The above described changes are typical of pressure-driven isostructural phase transitions [29]. Since changes were observed at 3.5 and 4.4 GPa in the different axes, we estimate the transition pressure to be 4.0(5) GPa. Interestingly, the transition will cause a collapse of the empty cavities present in the structure of chalcomenite (see Figure 1). This collapse will favor a faster decrease of the a-axis after the transition and the expansion of the b-axis, as we found in our experiments.
The existence of a phase transition is confirmed by Raman experiments (to be discussed below) which found evidence of the transition at 4.5(2) GPa. The proposed transition is isostructural since, at all pressures, XRD diffraction patterns can be identified with the space group P212121. The phase transition could be characterized as a second-order transition [30] because the pressure evolution of unit–cell parameters is continuous, but there is a discontinuity in the compressibility. However, as we will discuss next, discontinuous changes observed in bond distances indicate that the observed isostructural transition is a first-order transition. Interestingly, the change in the pressure dependency of unit–cell parameters does not affect the volume compressibility as can be seen in Figure 3. This behavior resembles the HP behavior of related hydrated minerals, like FeSO4∙H2O and MgSO4∙H2O [11,12], which also undergo phase transitions at similar pressures. A similar behavior has been recently observed in the minerals danburite and paracelsian [31,32].
In order to understand the changes that occur in the crystal structure at the phase transition, we have analyzed what happened with the different polyhedral units. Geometrics dependences with pressure have been calculated from run 1. Results from the second run are similar. The results are shown in Figure 4. From these results, we can conclude some general aspects: (1) The triangular pyramid SeO3 is more rigid than the squared pyramid CuO5. This conclusion is consistent with the HP behavior of different selenites [33,34]. As a consequence, the HP behavior of CuO5 will dominate the axial and volume compressibility of the studied compound. (2) The compression of the CuO5 polyhedron undergoes a sudden decrease at 4 GPa, which is the transition pressure. This indicates that the transition is related to a reorganization of oxygen atoms around Cu. In fact, we have noticed that, under compression, there is a sixth oxygen atom, with a Cu-O distance of 3.15 Å at ambient pressure, which rapidly approaches Cu atoms under compression. This is shown in Figure 5 where we present the six shorter Cu-O distances obtained from run 1. Beyond the transition pressure, it can be considered that Cu is no longer five coordinated but six coordinated. In particular, at 4.8 GPa, the length of the sixth Cu-O bond is 2.80 Å: i.e., only 27% larger than the fifth Cu-O bond. This behavior of the Cu-O bonds is very similar to the behavior observed in danburite and parcelsian [31,32], which also undergo isostructural phase transitions under compression. (3) Cu···Cu distances decreases around 8% (along c-axis) and most of the hydrogen bonds have directions parallel to a- and b-axes. We consider that H···H interactions could be in part responsible for the observed phase transition. Below 4 GPa, there are two H···H bond distances, which are mainly oriented along the b-axis, decreasing very rapidly with pressure. The distance is between hydrogen atoms, which belong to different H2O molecules connected Cu atoms of different CuO5 polyhedra. At ambient pressure, there is an empty cavity in between these two hydrogens (as we described before). However, as under compression, the H···H distance becomes considerably shorter, at some point (transition pressure), the electrostatic repulsion between hydrogens make the H···H distance stop decreasing, impeding the compression along the b-axis (in fact, the expansion of this axis is favored). In particular, we found that the average H···H distance decreases from 2.45 Å at ambient pressure to 2.20 Å at 4 GPa to then start increasing, reaching a value of 2.25 Å at 8 GPa. Thus, the fact that the H···H contact becomes stiff with increasing pressure would make that the crystal prefers to compress along the a-axis instead of the b-axis (as it does below the transition pressure) changing the compressibility of both axes and favoring the structural reorganization associated with the phase transition observed in CuSeO3∙2H2O. In summary, all the evidence described above points towards a purely displacive transition, where the SeO3 groups remain unchanged in their topology, and the formation of an additional Cu-O bond and the changes in H···H interactions modify the mechanical properties of chalcomenite. This transformation mechanism should be confirmed by future studies. In particular, HP neutron studies in deuterated samples could be very useful for studying hydrogen bonds.
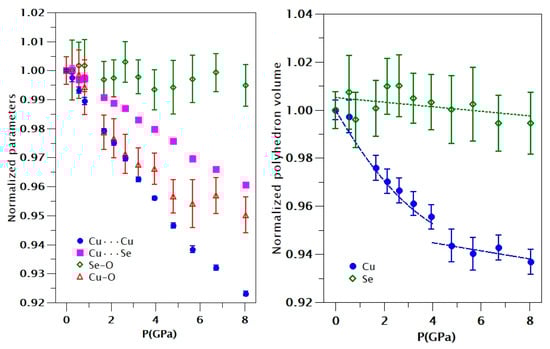
Figure 4.
(Left) Pressure dependence of Cu···Cu, Cu-···Se, Se-O, and Cu-O interatomic distances. Error bars for Cu···Cu and Cu-···Se distances are smaller than the symbols. (Right) Pressure dependence of the SeO3 and CuO5 polyhedra.
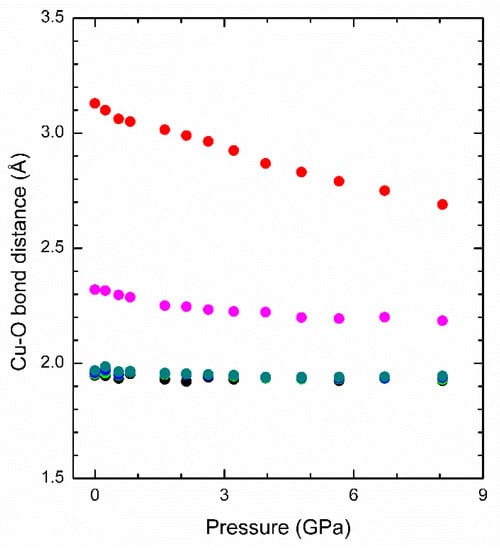
Figure 5.
Pressure dependence of Cu-O bond distances. The results have been obtained from run 1. Different colors have been used for different bonds. Error bars are comparable to size of the symbols.
3.2. Equation of States
We have analyzed the results obtained for the pressure dependence of the volume employing a Birch–Murnaghan equation of state (EOS) [35] using the EoSFit software [36]. The results are shown in Figure 6. We have found that for run 2 our results can be properly described by a third-order EOS. We got V0 = 451.0(3) Å3, K0 = 42(1) GPa, and K0’ = 4.6(4). For run 1, we found that a fourth-order EOS is needed. We got V0 = 450.54(5) Å3, K0 = 49(2) GPa, K0’ = 5(2), and K0” = −1.4(9). From DFT calculations, we got V0 = 436.7 Å3, K0 = 49.3 GPa, and K0’ = 2.6 when van der Waals interactions are included and V0 = 450.4 Å3, K0 = 50.0 GPa, and K0’ = 2.2 when they are not included. All the results for the bulk modulus agree within 10% showing that chalcomenite is highly compressible. Calculations tend to slightly overestimate K0 and underestimate K0’.
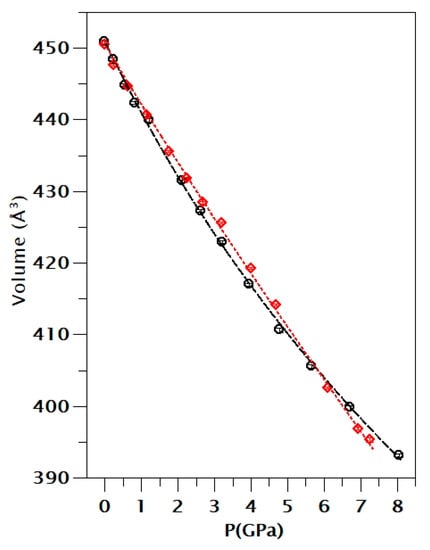
Figure 6.
EOS fit of the pressure–volume results of the two runs. Black: run 1. Red: run 2. The solid lines are the fits and the symbols are the experimental results.
We will compare now the compressibility of chalcomenite with related hydrated oxides. The obtained bulk modulus is similar to that of FeSO4∙H2O (45 GPa) [12], MgSO4·9H2O (50 GPa) [37], and CaSO4∙2H2O (44 GPa) [38]. It is known that hydrated oxides are more compressible than their dehydrated counterparts [39]. In particular, the presence of H2O could dramatically influence the properties of minerals related to chalcomenite [40]. Two examples of it are Gypsum (CaSO4∙2H2O, K0 = 44 GPa) [38], with a bulk modulus which is around 70% the bulk modulus of anhydrite (CaSO4, K0 = 64 GPa) [41], and MgSO4 hydrate (K0 = 50 GPa), with a bulk modulus, which is around 80% of the bulk modulus of MgSO4 (K0 = 62 GPa) [42]. Thus, our study on CuSeO3∙2H2O is putting a constraint on the bulk modulus of CuSeO3, which has not been experimentally studied yet. This parameter should be larger than 42 GPa (our lowest limit value). This suggests that the bulk modulus of 37 GPa obtained for CaSeO3, via DFT calculations, and reported in the Materials Project Website [43], is probably underestimated. On the other hand, the comparison of the present results with the bulk modulus of other hydrated oxides suggests that related compounds to chalcomenite like CuTeO3∙2H2O [44] and ZnSeO3∙2H2O [45] are expected to have a similar bulk modulus in the range of 40–50 GPa.
3.3. Raman Spectroscopy
Group theory classifies the lattice vibrations of chalcomenite as follows: Γ = 33A + 33B1 + 33B2 + 33B3. One B1, one B2, and one B3 modes are the acoustic modes. The rest 129 modes are Raman active, with the B modes also being infrared active. Out of these modes, a total of twenty-seven (twenty-one) Raman modes have been measured in different samples of synthetic (natural) chalcomenite [6,7] for frequencies smaller than 1000 cm−1. In addition, four broad bands have been measured above 2870 cm−1 [6,7] and two phonons are reported near 1600 cm−1 [6] (see Table 2). The low-frequency modes can be assigned to internal vibrations of the SeO3 and CuO5 polyhedra. The high-frequency modes correspond to water vibrations [6,7]. Our calculations confirm this interpretation. They have been performed without including van der Waals interaction because this method gives a more accurate description of the pressure dependence of the unit–cell volume as discussed previously. In addition, the calculations show that stretching vibrations of SeO3 are mostly at frequencies larger than 600 cm−1, while bending vibrations of SeO3 are located at 400–500 cm−1 in agreement with the literature [6,7]. On the other hand, CuO5 vibrations are at lower frequencies. This is because the force constant associated with Se-O vibrations is smaller than the force constant of Cu-O vibrations since Se-O bonds (1.703 Å in average) are shorter than Cu-O bonds (2.035 Å in average).
Table 2.
Experimental and theoretical Raman frequencies at ambient pressure (ω0). The pressure dependence is described by a quadratic function: where P is in GPa. The parameters α1 and α2 are included in the table. Results from the literature obtained from synthetic [6] and natural [7] samples.
In our HP experiments, we have been focused on the low-frequency region that provides more information on the structural transition we have observed by XRD. In Figure 7, we show Raman spectra measured under compression up to approximately 6.1 GPa. At low pressure, we have observed twenty-two modes. They agree well with previous reported frequencies from different samples [6,7]. They also agree with our calculated frequencies, which are also in agreement with infrared experiments [46,47]. A comparison of experiments and theory can be seen in Table 2 where all measured and calculated mode frequencies are reported. Raman mode assignment has been done by correlating the measured frequencies with calculations, which give the symmetry of all modes. Calculations have been used for mode assignment. Notice that, according to calculations, sixteen modes are predicted to have frequencies higher than 2680 cm−1 and another sixteen are predicted to be in the 1000–1625 cm−1 frequency region. This region has never been experimentally explored; thus, our calculations provide information useful for future studies. Our study in addition to the previous study [6,7] only see part of the remaining ninety-seven modes predicted for frequencies smaller than 1000 cm−1. This is because some modes are very weak and many of them overlap in frequency (see calculations in Table 2).
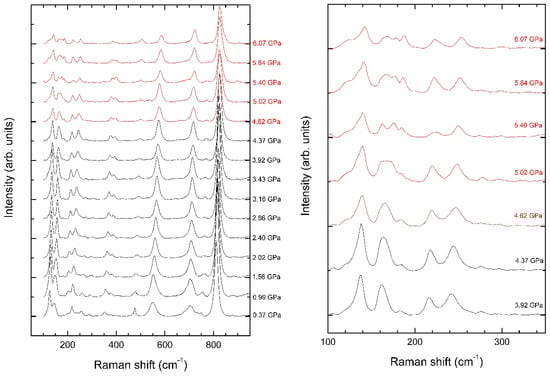
Figure 7.
(Left) Raman spectra of chalcomenite measured at different pressures. (Right) Zoom of the low-frequency region to facilitate the identification of pressure-induced changes above 4.37 GPa. Pressures are indicated in the figure.
If attention is paid to the low-frequency part of the spectra in Figure 6, it can be seen that there are changes in the Raman spectrum from 4.37 to 4.62 GPa, which clearly show the occurrence of the phase transition, with a transition pressure of 4.5(2) GPa. The main changes are the splitting of modes and changes in the intensity of some modes. The changes are more noticeable in the low-frequency region (<300 cm−1), which is magnified in the right panel of Figure 6. The observed changes are consistent with the changes we observed in the CuO5 polyhedron and its gradual transformation into a CuO6 polyhedron. Regarding the pressure evolution of modes, it is strongly nonlinear as a consequence of the changes of the compressibility already described. An evidence of it is the fact that the modes follow a quadratic pressure dependence and many of them have a negative quadratic coefficient (see Table 2). In addition, modes with similar frequencies have in many cases very different pressure dependences as can be seen in Table 2. This favors the splitting of modes we have observed in the experiments. Analytical expressions describing the pressure dependence of Raman frequencies are given in Table 2. We have found that all Raman modes with ω < 1000 cm−1 harden under compression. There is slight tendency of calculations for overestimating the pressure coefficient, but the agreement with experiments is still good. Regarding the high-frequency modes (ω > 1000 cm−1), calculations also predict a nonlinear behavior, which indicates changes in the hydrogen bonding as concluded from XRD experiments. In addition, there are many high-frequency modes which soften under compression. The presence of such modes is usually associated with the existence of an instability that tends to make the crystal structure unstable [48,49]. This fact is consistent with the finding of a displacive phase transition in our XRD experiments. The fact that there is no detectable volume change at the transition suggests that the transition can be second-order, but the fact that there are discontinuities in bond distances supports a first-order transition [50].
4. Conclusions
By means of HP single-crystal XRD and Raman spectroscopy combined with DFT calculations, we have explored the HP behavior of synthetic chalcomenite CuSeO3∙2H2O up to 8 GPa. We have found evidence for an isostructural phase transition at 4.0(5) GPa by XRD and at 4.5(2) GPa by Raman spectroscopy. We have also determined the polyhedral and volume compressibility. In particular, the pressure–volume equation of state has been determined at room temperature. In addition, we have found that the HP behavior is governed by the compressibility and pressure induced changes in the coordination polyhedron of Cu. We also propose that H···H interactions could play a role in the observed phase transition. The reported transition is related to changes in the coordination polyhedron of Cu. These alterations induce notable modifications in the low-frequency Raman active modes. DFT calculations have helped for the assignment of Raman modes and provide information on modes not yet observed experimentally.
Author Contributions
Conceptualization, J.G.-P. and D.E.; XRD experiments, J.G.-P.; Raman experiments, U.R.R.-M. Sample preparation, G.N.; Formal analysis, J.G.-P. and D.E.; Computer simulations: P.R.-H. and A.M.; Writing—Review and Editing, all the authors.
Funding
This work was supported by the Spanish Ministry of Science, Innovation and Universities under grant MAT2016-75586-C4-1/3/4-P and by Generalitat Valenciana under grant Prometeo/2018/123 (EFIMAT).
Conflicts of Interest
The authors declare no conflict of interest.
References
- Ruiz-Fuertes, J.; Segura, A.; Rodrıguez, F.; Errandonea, D.; Sanz-Ortiz, N.M. Anomalous high-pressure Jahn-Teller behavior in CuWO4. Phys. Rev. Let. 2012, 108, 166402. [Google Scholar] [CrossRef] [PubMed]
- Eklund, L.; Persson, I. Structure and hydrogen bonding of the hydrated selenite and selenate ions in aqueous solution. Dalton Trans. 2014, 43, 6315–6321. [Google Scholar] [CrossRef] [PubMed]
- Vchirawongkwin, V.; Rode, B.M.; Persson, I. Structure and dynamics of sulfate ion in aqueous solution: An ab initio QMCF MD simulation and large angle X-ray scattering study. J. Phys. Chem. B 2007, 111, 4150–4155. [Google Scholar] [CrossRef] [PubMed]
- Bandiello, E.; Errandonea, D.; Ferrari, S.; Pellicer-Porres, J.; Martínez-García, D.; Achary, S.N.; Tyagi, A.K.; Popescu, C. Pressure-induced hexagonal to monoclinic phase transition of partially hydrated CePO4. Inorg. Chem. 2019, 58, 4480–4490. [Google Scholar] [CrossRef]
- Robinson, P.D.; Gupta, P.K.S.; Swihart, S.H.; Houk, L. Crystal structure, H positions, and the Se lone pair of synthetic chalcomenite, Cu(H2O)2[SeO3]. Am. Mineral. 1992, 77, 834–838. [Google Scholar]
- Bocharov, V.N.; Charykova, M.V.; Krivovichev, V.G. Raman spectroscopic characterization of the copper, cobalt, and nickel selenites: Synthetic analogs of chalcomenite, cobaltomenite, and ahlfeldite. Spect. Let. 2017, 50, 539–544. [Google Scholar] [CrossRef]
- Frost, R.L.; Keeffe, E.C. Raman spectroscopic study of the selenite minerals–chalcomenite CuSeO3·2H2O, clinochalcomenite and cobaltomenite. J. Raman Spectrosc. 2008, 39, 1789–1793. [Google Scholar] [CrossRef]
- Krivovichev, V.G.; Charykova, M.V.; Vishnevsky, A.V. The thermodynamics of selenium minerals in near-surface environments. Minerals 2017, 7, 188. [Google Scholar] [CrossRef]
- Charykova, M.V.; Lelet, M.I.; Krivovichev, V.G.; Ivanova, N.M.; Suleimanov, E.V. A calorimetric and thermodynamic investigation of the synthetic analogue of chalcomenite, CuSeO3∙2H2O. Eur. J. Miner. 2017, 29, 269–277. [Google Scholar] [CrossRef]
- Errandonea, D.; Ruiz-Fuertes, J. A brief review of the effects of pressure on wolframite-type oxides. Crystals 2018, 8, 71. [Google Scholar] [CrossRef]
- Grasset, O.; Sotin, C.; Mousis, O.; Loic, M. High Pressure Experiments in the System MgSO4-H2O: Implications for Europa. Lunar. Planet. Sci. Conf. 2000, 31, 1386. [Google Scholar]
- Meusburger, J.M.; Ende, M.; Talla, D.; Wildner, M.; Miletich, R. Transformation mechanism of the pressure-induced C2/c-to-P1 transition in ferrous sulfate monohydrate single crystals. J. Sol. State Chem. 2019, 277, 240–252. [Google Scholar] [CrossRef]
- Gonzalez-Platas, J.; Muñoz, A.; Rodríguez-Hernández, P.; Errandonea, D. High-pressure single-crystal X-ray diffraction of lead chromate: Structural determination and reinterpretation of electronic and vibrational properties. Inorg. Chem. 2019, 58, 5966–5979. [Google Scholar] [CrossRef] [PubMed]
- Degen, T.; Sadki, M.; Bron, E.; Konig, U.; Nénert, G. The HighScore suite. Powder Diffr. 2014, 29, 13–18. [Google Scholar] [CrossRef]
- Rigaku Oxford Diffraction. CrysAlisPro Software System, version 1.171.40.53; Rigaku Corporation: Oxford, UK, 2016. [Google Scholar]
- Angel, R.J. Absorption corrections for diamond-anvil pressure cells implemented in the software package Absorb6.0. J. Appl. Crystallogr. 2004, 37, 486–492. [Google Scholar] [CrossRef]
- Angel, R.J.; Bujak, M.; Zhao, J.; Gatta, G.D.; Jacobsen, S.D. Effective hydrostatic limits of pressure media for high-pressure crystallographic studies. J. Appl. Crystallogr. 2007, 40, 26–32. [Google Scholar] [CrossRef]
- Mao, H.K.; Xu, J.; Bell, P.M. Calibration of the ruby pressure gauge to 800 kbar under quasi-hydrostatic conditions. J. Geophys. Res. 1986, 91, 4673–4676. [Google Scholar] [CrossRef]
- Errandonea, D.; Muñoz, A.; Gonzalez-Platas, J. Comment on “High-pressure x-ray diffraction study of YBO3/Eu3+, GdBO3, and EuBO3: Pressure-induced amorphization in GdBO3”. J. Appl. Phys. 2014, 115, 216101. [Google Scholar] [CrossRef]
- Sheldrick, G.M. A short history of SHELX. Acta Cryst. A 2008, 64, 112–122. [Google Scholar] [CrossRef]
- Kresse, G.; Furthmuller, J. Efficient iterative schemes for ab initio total-energy calculations using a plane-wave basis set. J. Phys. Rev. B 1996, 54, 11169–11186. [Google Scholar] [CrossRef]
- Kresse, G.; Joubert, D. From ultrasoft pseudopotentials to the projector augmented-wave method. Phys. Rev. B 1999, 59, 1758–1775. [Google Scholar] [CrossRef]
- Perdew, J.P.; Ruzsinszky, A.; Csonka, G.I.; Vydrow, O.A.; Scuseria, G.E.; Constantin, L.A.; Zhou, X.; Burke, K. Restoring the Density-Gradient Expansion for Exchange in Solids and Surfaces. Phys. Rev. Lett. 2008, 100, 136406. [Google Scholar] [CrossRef] [PubMed]
- Dion, M.; Rydberg, H.; Schröder, E.; Langreth, D.C.; Lundqvist, B.I. Van der Waals density functional for general geometries. Phys. Rev. Lett. 2004, 92, 246401. [Google Scholar] [CrossRef] [PubMed]
- Monkhorst, H.J.; Pack, J.D. Special points for Brillouin-zone integrations. Phys. Rev. B 1976, 13, 5188–5192. [Google Scholar] [CrossRef]
- Mujica, A.R.; Muñoz; Needs, R.J. High-pressure phases of group-IV, III–V, and II–VI compounds. Rev. Mod. Phys. 2003, 75, 863–912. [Google Scholar] [CrossRef]
- Parlinski, K. Computer Code PHONON. Available online: http://wolf.ifj.edu.pl/phonon/ (accessed on 4 December 2019).
- Cazorla, C.; Errandonea, D.; Sola, E. High-pressure phases, vibrational properties, and electronic structure of Ne(He)2 and Ar(He)2: A first-principles study. Phys. Rev. B 2009, 80, 064105. [Google Scholar] [CrossRef]
- Errandonea, D.; Santamaria-Perez, D.; Achary, S.N.; Tyagi, A.K. P Experimental evidence for pressure-driven isostructural and symmetry-breaking phase transitions on Bi14CrO24. Solid State Commun. 2014, 182, 50–54. [Google Scholar] [CrossRef]
- Errandonea, D. Landau theory applied to phase transitions in calcium orthotungstate and isostructural compounds. EPL 2007, 77, 56001. [Google Scholar] [CrossRef]
- Pakhomova, A.; Bykova, E.; Bykov, M.; Glazyrin, K.; Gasharova, B.; Liermann, H.-P.; Mezouar, M.; Gorelova, L.; Krivovichev, S.; Dubrovinsky, L. A closer look into close packing: Pentacoordinated silicon in a high-pressure polymorph of danburite. IUCrJ 2017, 4, 671–677. [Google Scholar] [CrossRef]
- Gorelova, L.A.; Pakhomova, A.S.; Krivovichev, S.V.; Dubrovinsky, L.S.; Kasatkin, A.V. High pressure phase transitions of paracelsian BaAl2Si2O8. Sci. Rep. 2019, 9, 12652. [Google Scholar] [CrossRef]
- Errandonea, D.; Muñoz, A.; Rodríguez-Hernández, P.; Proctor, J.E.; Sapiña, F.; Bettinelli, M. Theoretical and experimental study of the crystal structures, lattice vibrations, and band structures of monazite-type PbCrO4, PbSeO4, SrCrO4, and SrSeO4. Inorg. Chem. 2015, 54, 7524–7535. [Google Scholar] [CrossRef] [PubMed]
- López-Moreno, S.; Errandonea, D.; Rodríguez-Hernández, P.; Muñoz, A. Polymorphs of CaSeO4 under pressure: A first-principles study of structural, electronic, and vibrational properties. Inorg. Chem. 2015, 54, 1765–1777. [Google Scholar] [CrossRef] [PubMed]
- Birch, F. Finite elastic strain of cubic crystals. Phys. Rev. 1947, 71, 809–824. [Google Scholar] [CrossRef]
- Gonzalez-Platas, J.; Alvaro, M.; Nestola, F.; Angel, R.J. EosFit7-GUI: A new GUI tool for equation of state calculations, analyses and teaching. J. Appl. Crystallogr. 2016, 49, 1377–1382. [Google Scholar] [CrossRef]
- Fortes, A.D.; Knight, K.S.; Wood, I.G. Structure, thermal expansion and incompressibility of MgSO4·9H2O, its relationship to meridianiite (MgSO4·11H2O) and possible natural occurrences. Acta Cryst. B 2017, 73, 47–64. [Google Scholar] [CrossRef]
- Fu, J.; Lin, W. Elastic constants and homogenized moduli of gypsum structure based on density functional theory. Adv. Eng. Res. 2018, 120, 390–395. [Google Scholar]
- Errandonea, D.; Gomis, O.; Santamaría-Perez, D.; García-Domene, B.; Muñoz, A.; Rodríguez-Hernández, P.; Achary, S.N.; Tyagi, A.K.; Popescu, C. Exploring the high-pressure behavior of the three known polymorphs of BiPO4: Discovery of a new polymorph. J. Appl. Phys. 2017, 117, 105902. [Google Scholar] [CrossRef]
- Frost, D.J. The stability of dense hydrous magnesium silicates in Earth’s transition zone and lower mantle. Mantle Petrol. Field Obs. High Press. Exp. 1999, 6, 283–296. [Google Scholar]
- Gracia, L.; Beltrán, A.; Errandonea, D.; Andrés, J. CaSO4 and its pressure-induced phase transitions: A density functional theory study. Inorg. Chem. 2012, 51, 1751–1759. [Google Scholar] [CrossRef]
- Benmakhlouf, A.; Errandonea, D.; Bouchenafa, M.; Maabed, S.; Bouhemadoud, A.; Bentabete, A. New pressure-induced polymorphic transitions of anhydrous magnesium sulfate. Dalton Trans. 2017, 46, 5058–5068. [Google Scholar] [CrossRef]
- See The Materials Project. Available online: https://materialsproject.org/materials/mp-22414/ (accessed on 4 December 2019).
- Effenberg, H. Verfeinerung der Kristall struktur von syntetischem Teinem CuTeO3∙2H2O. Tschermaks Minelarogische Petrologische Mittelungen 1977, 24, 287. [Google Scholar] [CrossRef]
- Gladkova, V.F.; Kondrashev, Y.D. Cyrstal structure of ZnSeO3∙2H2O. Sov. Phys. Crystallogr. 1964, 9, 149. [Google Scholar]
- Sathianandan, K.; McCory, L.D.; Margrave, J.L. Infrared absorption spectra of inorganic solids—III selenates and selenites. Spectrochim. Acta 1964, 20, 957–963. [Google Scholar] [CrossRef]
- Makatun, V.N.; Pechkovskii, V.V.; Mel’nikova, R.Y.; Gusev, S.S. Infrared spectra of copper selenites. Zhur. Prikl. Spektrosk. 1970, 12, 497–503. [Google Scholar] [CrossRef]
- Errandonea, D.; Pellicer-Porres, J.; Pujol, M.C.; Carvajal, J.J.; Aguiló, M. Room-temperature vibrational properties of potassium gadolinium double tungstate under compression up to 32 GPa. J. Alloys Compd. 2015, 638, 14–20. [Google Scholar] [CrossRef]
- Dove, M.T. Theory of displacive phase transitions in minerals. Am. Mineral. 1997, 82, 213–244. [Google Scholar] [CrossRef]
- Santamaria-Perez, D.; Errandonea, D.; Rodriguez-Hernandez, P.; Muñoz, A.; Lacomba-Perales, R.; Polian, A.; Meng, Y. Polymorphism in strontium tungstate SrWO4 under quasi-hydrostatic compression. Inorg. Chem. 2016, 55, 10406–10414. [Google Scholar] [CrossRef]
© 2019 by the authors. Licensee MDPI, Basel, Switzerland. This article is an open access article distributed under the terms and conditions of the Creative Commons Attribution (CC BY) license (http://creativecommons.org/licenses/by/4.0/).