Collective Transformation of Water between Hyperactive Antifreeze Proteins: RiAFPs


1
Institute for Fiber Engineering, Shinshu University, Ueda 386-8567, Japan
2
Department of Chemistry and Materials, Faculty of Textile Science and Technology, Ueda 386-8567, Japan
3
Research Institute for Interdisciplinary Science, Okayama University, Okayama 700-8530, Japan
*
Author to whom correspondence should be addressed.
Crystals 2019, 9(4), 188; https://doi.org/10.3390/cryst9040188
Submission received: 7 March 2019
/
Revised: 27 March 2019
/
Accepted: 27 March 2019
/
Published: 1 April 2019
(This article belongs to the Special Issue Ice Crystals)
Abstract
:We demonstrate, by molecular dynamics simulations, that water confined between a pair of insect hyperactive antifreeze proteins from the longhorn beetle Rhagium inquisitor is discontinuously expelled as the two proteins approach each other at a certain distance. The extensive striped hydrophobic–hydrophilic pattern on the surface, comprising arrays of threonine residues, enables water to form three independent ice channels through the assistance of hydroxyl groups, even at 300 K. The transformation is reminiscent of a freezing–melting transition rather than a drying transition and governs the stable protein–protein separation in the evaluation of the potential of mean force. The collectivity of water penetration or expulsion and the hysteresis in the time scale of ten nanoseconds predict a potential first-order phase transition at the limit of infinite size and provide a new framework for the water-mediated interaction between solutes.

1. Introduction
Water confined in nanopores exhibits anomalous behaviors dissimilar to those of bulk water, e.g., the transition to low-dimensional ices [1,2] and solid-liquid critical points [3,4]. The dewetting (drying) transition is one such intriguing behavior; when two large-scale strongly hydrophobic solutes approach each other at a critical distance, water molecules are expelled from the intersolute region, leading to hydrophobic collapse [5,6,7,8,9]. Hydrophobicity is believed to play a key role in the self-assembly of macromolecules [10,11,12,13,14], and hydrophobic dewetting is observed in the formation of protein complexes [15,16,17,18,19,20]. On the other hand, most protein–protein interfaces are enriched in polar residues rather than nonpolar ones [21] and water molecules are involved in the association of hydrophilic surfaces [22,23,24]. As a small portion of hydrophilic moieties prevents the occurrence of the dewetting transition [25,26], the thermodynamic properties of interfacial water are significantly sensitive to the local geometry and chemical patterning of solutes [27,28]. The precise control of surface heterogeneity would provide design principles for the alignment and separation of macromolecules in aqueous solutions [29].
Hydrophobicity is characteristic of the ice-binding surface (IBS) of antifreeze proteins (AFPs) [30,31,32]. AFPs have evolved in a variety of organisms, e.g., fish, insects, bacteria, and plants that survive in sub-zero-temperature environments [30]. Although AFPs have a remarkable diversity in structure, they possess the same function of adsorption to ice [33]. This adsorption to ice results in thermal hysteresis (TH), a gap between the depressed freezing- and promoted melting-temperatures of ice, through the Gibbs–Thomson (Kelvin) effect [34,35]. Insect AFPs are categorized as “hyperactive” in TH and are more than 10 times effective compared with moderately active AFPs, on the basis of concentration [36]. In particular, RiAFP from the longhorn beetle Rhagium inquisitor, which can supercool to below −25 °C [37], exhibits the most potent TH activity among the currently known AFPs [38].
RiAFP has an exceptionally flat and wide IBS comprising four parallel arrays of threonine (T or Thr) residues, which is referred to as the T-X-T-X-T-X-T motif, with X being a nonconserved amino acid. Although the flat IBS with T-X-T motif is also observed in the other hyperactive insect AFPs from Tenebrio molitor (TmAFP) [39] and Choristoneura fumiferana (CfAFP) [40], the 420 Å2 IBS in RiAFP is significantly larger than that of TmAFP (150 Å2) and CfAFP (190 Å2) [41]. On the IBS of RiAFP, the side chains of the Thr residues exhibit the same orientation, and water molecules are buried between the arrays of Thr [41]. Hence, the IBS of RiAFP has an extensive striped pattern comprising CH3, OH groups, and crystallographic water.
In the present study, we performed molecular dynamics (MD) simulations for a pair of RiAFPs dissolved in water and examined the phase behavior of water in the interprotein region. Our analyses for hysteresis between the association and dissociation processes and the discontinuous change in confined water molecules reveal a collective structural transformation of the confined water, dissimilar to the drying transition [5,6,7,8,9]. Furthermore, we computed the potential of mean force (PMF) as a function of the interprotein distance and found that three independent ice channels are formed in the deepest PMF minimum.
2. Methods
2.1. Molecular Dynamics Simulation
MD simulations were conducted using the GROMACS 2018.3 package [42]. The equations of motion were integrated with the leap-frog algorithm using a time step of 2 fs. The temperature T for production runs was controlled using the Nose–Hoover thermostat [43,44] with damping constants of 1.0 ps, whereas the Berendsen algorithm [45] was used for equilibration. The pressure p is isotropically controlled using the Berendsen algorithm [45] with damping constants of 2.0 ps. All the bonds were constrained using the LINCS algorithm. Periodic boundary conditions were applied in all three directions.
RiAFP was modelled with full atomistic detail using CHARMM27 (CHARMM22 plus CMAP correction) [46,47]. Water was modelled with TIP4P/2005 [48]. Intermolecular interactions were truncated at 0.85 nm. The Lennard-Jones parameters of cross-interactions were obtained using the Lorentz–Berthelot combining rules. Long-range Coulombic interactions were evaluated using the particle-mesh Ewald algorithm (Fourier spacing of 0.10 nm), and dispersion corrections were implemented for the energy and pressure evaluations.
The crystallographic structure of the RiAFP dimer was taken from the protein data bank (PDB code 4DT5) [41]. In the dimer, the IBS of two chains of the protein face each other. These two chains of the protein have different sizes and consist of 143 and 138 residues, respectively. We cut five residues at the end of the longer protein to make it identical to the shorter one, and we capped the proteins with N-terminal acetyl and C-terminal methyl (CH3) groups. It should be noted that the five cut residues were not involved in the IBS. The PDB file also included crystallographic water molecules between two chains of the protein. The RiAFP dimer with these adhered water molecules was immersed into a rectangular box of bulk water. The total number of water molecules was 10,800 and twelve chloride ions were added to neutralize the system charge. We arranged the IBS of the protein to be parallel to the yz-plane, as shown in Figure 1. The system was firstly relaxed using the steepest-descent method. To relax the solvent structure, we performed a 100 ps MD simulation in the canonical (NVT) ensemble at 300 K with freezing the proteins. Then, a 100 ps MD simulation in the isobaric isothermal (NpT) ensemble at 300 K and 10 MPa was followed by a 100 ps NpT-MD simulation at 300 K and 0.1 MPa to equilibrate the volume. During these NpT-MD simulations, the positions of all the alpha carbon (CA) atoms were harmonically restrained at their original positions with a force constant of 1000 kJ∙mol−1·nm−2. The resulting configuration with box dimensions of 9.93 × 5.96 × 5.96 nm3 was used as the initial configuration for the subsequent NVT-MD simulations.
2.2. Potential of Mean Force
To compute the PMF between two chains of RiAFPs, a set of NVT-MD simulations were performed. To keep the mutual orientation parallel, the x, y, and z positions of all the CA atoms in one protein, as shown on the left in Figure 1, and the y and z positions of the CA atoms in the other protein were harmonically restrained at their original positions with a force constant of 1000 kJ·mol−1·nm−2. The controlled interprotein distance d is parallel to the x-axis and is between the centers of mass of two chains of the protein. The RiAFP dimer taken from the PDB shows d = 1.50 nm. To observe the dissociation process, d was increased in stages up to 2.50 nm, in increments of 0.02 nm. Then, d was decreased from 2.00 to 1.50 nm for the association process. At a given d, an NVT-MD simulation was performed for 10 ns at 300 K. Data analysis was performed based on the last 4 ns of the simulation runs. We recorded the force acting on each protein every 10 ps and obtained the average force F(d) over time and over two chains of the protein [49]. The PMF between two chains of RiAFPs w(d) was computed by an integration
where is a reference separation and is an arbitrary constant. The average PMF values between d = 2.30 and 2.40 nm was set to zero.
2.3. Water Molecules Confined Between Two Chains of RiAFPs
The interprotein region is defined as a rectangular box spanning the CA atoms of Thr on the IBS; x ranges from the CA of Thr41 of the left protein to the CA of Thr109 of the right protein; y ranges from the CA of Thr109 of the right protein to the CA of Thr47 of the left protein; z ranges from the CA of Thr41 to the CA of Thr109 of the right protein. The position of the oxygen atom of a water molecule was used to judge whether the molecule was included in the above box.
3. Results and Discussion
3.1. Hysteresis Between Association and Dissociation of RiAFP Dimer Without Rotation
We firstly investigated how the number of water molecules (Nw) between two RiAFPs changes during the association and dissociation processes. The IBSs of the two proteins face each other and the interprotein distance perpendicular to the surface (d) varies while preserving a parallel orientation. At d = 1.50 nm, the CH3 groups of the two proteins are in contact distance. However, the crystallographic water molecules remain adhered on the protein surface even after an MD run of 10 ns, giving an average Nw, <Nw>, of 25, as shown in Figure 2A. The penetration of additional water molecules was not observed up to d = 1.60 nm. <Nw> increases gradually from d = 1.62 to 1.72 nm; at d = 1.74 nm, we observed a distinct increase in <Nw> from 38 to 52. The time evolution of Nw at d = 1.74 nm demonstrates that the penetration of water molecules takes ~5 ns, as shown in Figure 2B. At d > 1.74 nm, <Nw> monotonically increases with the interprotein distance. We also computed <Nw> during the backward association process, as shown by the blue line in Figure 2A. Except for the distances between 1.68 and 1.72 nm, <Nw> during the association process is almost identical to the values in the dissociation process, indicating that <Nw> is independent of the history. In contrast, at d = 1.68, 1.70, and 1.72 nm, <Nw> differs for the inverse processes. For example, 48 water molecules remain in the interprotein region as the two proteins approach d = 1.70 nm, whereas only 33 molecules are included in the same volume as the two proteins separate. Furthermore, at d = 1.66 nm during the association process, several water molecules are simultaneously expelled from the interprotein region, which takes ~6 ns, as shown in Figure 2C. Although d was further decreased to 1.50 nm, complete drying did not occur. The observed discontinuous change in <Nw> and hysteresis implies a collective structural transformation, which may lead a first-order phase transition at the infinite limit of surface size, in both the association and dissociation processes.
3.2. Potential of Mean Force
The PMF, w(r), for a pair of RiAFPs was computed as a function of the separation d, as shown in Figure 3A. For each of the association and dissociation processes, we firstly estimated two PMFs in the regions before and after the distinct jump of <Nw>. Then, we assumed that the two PMFs were connected at d = 1.70 nm, which is the middle of hysteresis. The PMFs at 1.70 < d < 2.00 nm well agree for these inverse processes. On the other hand, the depth of the PMF minimum at around d = 1.52 nm depends on the history. Although <Nw>s in the two processes were almost identical at d < 1.66 nm, as shown in Figure 2A, the water structure in the interprotein region during the dissociation was more ordered than the association. More specifically, the water hexamers in the interprotein region were more disrupted by defects during the association than those during the dissociation. If much longer simulations were performed at each d during the association, the water structure and the resulting free energy would be identical to that observed for the dissociation. We claim that the PMFs computed for the association and dissociation were qualitatively the same. In the following analyses, we use the conformations sampled during the dissociation.
The deepest minimum in the PMF was at d = 1.52 nm. Figure 3B depicts the density profile of water molecules in the interprotein region at this minimum. Two strong peaks arise from the water molecules localized between arrays of Thr residues. The second-deepest minimum was located at d = 1.86 nm. The water density profile shows three symmetric intervening water layers at this separation, as shown in Figure 3C. Two side peaks from the water molecules on the IBSs broaden at this separation, indicating that these molecules were less localized than those at the deepest minimum. The remaining large peak at the center arises from one water layer spread over the interprotein region. These results indicate that the free energy barrier separating these minima at d = 1.52 and 1.86 nm were associated with the penetration or expulsion of a single water layer in the confined space. The activation free energy from the second minimum to the first one was approximately 45 kJ/mol, corresponding to 18 kBT, with kB being the Boltzmann constant. This significantly high barrier to form a dimer may pertain to the experimental observation that RiAFPs exist as monomers in solution [41].
A further increase in d leads to the penetration of one more water layer between two chains of the protein and the formation of a shallow PMF minimum at d = 2.20 nm, with four symmetric water layers, as shown in Figure 3D. The separation between the first and second minima and between the second and third minima was 0.34 nm, consistent with the size of water molecules computed from the radial distribution function [48]. Therefore, as observed for the water between hydrophobic plates [49,50], the distinct number of water layers stabilizes the protein–protein separation, leading to the minima in PMF. Furthermore, the penetration or expulsion of one water layer results in the free energy barriers between these minima.
3.3. Three Ice Channels
To characterize the collective transformation, we observed the molecular structures comprising of the caught water molecules and hydroxyl (OH) groups of Thr in the interprotein region. At distances between 1.50 and 1.60 nm, we found that three independent ice channels were formed, as shown in Figure 4A. A hexamer consists of three water molecules and three OH groups, and the neighboring three or four hexamers make one channel. The arrays of CH3 groups assist these channels to be independent, by separating the interprotein space. The chair-form hexagonal ring is one of the most stable conformations for water molecules in terms of potential energy and is observed in hexagonal ice (ice Ih). Indeed, we found that the average potential energy of −76.4 kJ/mol for the confined water molecules at d = 1.52 nm was significantly lower than −66.2 kJ/mol at d = 1.86 nm. According to the hexagonal conformations and the stabilized potential energy, the water structure at small ds can be considered as an “ice” phase. As d becomes greater than 1.60 nm, additional water molecules begin to penetrate the interprotein region and disturb the ordered ice structures. Figure 4B shows the snapshot at d = 1.70 nm during the dissociation, just before the distinct <Nw> jump happens. The penetrated molecules connect the middle and bottom channels, shown by the red lines in Figure 4B. However, some hexagonal rings, indicated by orange arrows, are retained. Furthermore, the top channel is still isolated and has an ordered structure, although the distance between the OH group of one protein and the water molecules on the other protein is extended. Figure 3A shows that this structure is still in the same PMF minimum as the three ice channels. Hence, the conformation with d between 1.60 and 1.70 nm can be considered as a defective ice phase. When d is further increased, the network in the interprotein region percolates and the structure looks disordered, analogous to liquid water, as shown in Figure 4C. These conformational analyses, along with the PMF, suggest that the collective water transformation observed in the RiAFP dimerization is similar to the freezing–melting transitions of water.
3.4. Ice Channels between Unrestrained Proteins
To confirm the formation of ice channels in a realistic condition, we performed an NVT-MD simulation of unrestrained RiAFPs for 10 ns. The initial configuration was the dimer with d = 1.52 nm, obtained in the trajectory for restrained RiAFPs, as shown in Figure 4A. Figure 5 shows that the parallel dimer configuration was preserved over 10 ns although the dimer itself migrates. The three independent ice channels were also preserved over 10 ns, which can be seen as hexagonal rings in Figure 5B. We found that among 26 water molecules between two chains of RiAFP in the initial configuration, 20 water molecules were arrested at the same position in the interprotein region at the final time step. Hence, these confined water molecules migrate together with the proteins. These results indicate that the parallel dimer structure of RiAFP with ice channels was stable, at least in the order of tens of nanoseconds, even under the realistic condition.
4. Conclusions
In summary, our MD simulations present that the approach of RiAFPs induces the spontaneous formation of ordered hydrogen bond networks in the interprotein region, named ice channels, even at room temperature. The collective structural transformation into chair-form hexamers, comprising water and OH groups, resembles the crystallization of liquid water, and not the drying transition observed between large hydrophobic solutes. The discontinuous penetration or expulsion of confined water and the hysteresis between the association and dissociation of these proteins imply a potential first-order phase transition at the limit of infinite size.
This unique transition certainly arises from the extensive striped hydrophobic–hydrophilic pattern on the RiAFP surface, called the T-X-T motif. This T-X-T motif is also present in the other insect hyperactive AFPs. Similar to RiAFP, these AFPs form multimers with their T-X-T motifs facing each other in the crystallographic structure [39,40,51,52]. Hence, the collective transformation to ice channels may be a common feature in their dimerizations. Furthermore, AFPs with the T-X-T motif are known to be hyperactive in the TH measurement [30], and they bind to ice through an anchored clathrate [53]. The water molecules between arrays of Thr on the IBS and the OH groups of Thr are involved in the anchored clathrate. Hence, the molecular basis to facilitate the ice channels between two RiAFPs and the anchored clathrate between RiAFP and ice surface can be considered to be the same. On the other hand, the formation of an ice-like ordered structure is not necessary for the discontinuous water penetration or expulsion, because, in the case of graphene plates, the PMF and the amount of confined water change smoothly, regardless of the formation of defective bilayer ice [49]. Although a concrete understanding of the surface chemistry and geometry required to induce the collective transformation of confined water requires further studies, our finding provides a new framework for water-mediated solute–solute interactions, which may play a role in the self-organization of soluble molecules.
Author Contributions
Analysis and revision, M.M. Conceptualization, analysis and writing, K.M.
Funding
We acknowledge support from the Japan Society for the Promotion of Science (KAKENHI 18K19060, 15H05474 and 16K05658).
Acknowledgments
K.M. thanks Koji Umezawa for insightful discussions. Most calculations were performed at the Research Center for Computational Science in Okazaki, Japan.
Conflicts of Interest
The authors declare no conflict of interest.
References
- Koga, K.; Gao, G.T.; Tanaka, H.; Zeng, X.C. Formation of ordered ice nanotubes inside carbon nanotubes. Nature 2001, 412, 802–805. [Google Scholar] [CrossRef] [PubMed] [Green Version]
- Koga, K.; Zeng, X.C.; Tanaka, H. Freezing of confined water: A bilayer ice phase in hydrophobic nanopores. Phys. Rev. Lett. 1997, 79, 5262–5265. [Google Scholar] [CrossRef]
- Mochizuki, K.; Koga, K. Solid-liquid critical behavior of water in nanopores. Proc. Natl. Acad. Sci. USA 2015, 112, 8221–8226. [Google Scholar] [CrossRef]
- Han, S.; Choi, M.Y.; Kumar, P.; Eugene Stanley, H. Phase transitions in confined water nanofilms. Nat. Phys. 2010, 6, 685–689. [Google Scholar] [CrossRef]
- Berne, B.J.; Weeks, J.D.; Zhou, R. Dewetting and hydrophobic interaction in physical and biological systems. Annu. Rev. Phys. Chem. 2009, 60, 85–103. [Google Scholar] [CrossRef] [PubMed]
- Wallqvist, A.; Berne, B.J. Computer simulation of hydrophobic hydration forces on stacked plates at short range. J. Phys. Chem. 1995, 99, 2893–2899. [Google Scholar] [CrossRef]
- Lum, K.; Chandler, D.; Weeks, J.D. Hydrophobicity at small and large length scales. J. Phys. Chem. B 1999, 103, 4570–4577. [Google Scholar] [CrossRef]
- Lum, K.; Luzar, A. Pathway to surface-induced phase transition of a confined fluid. Phys. Rev. E 1997, 56, R6283–R6286. [Google Scholar] [CrossRef]
- Huang, X.; Margulis, C.J.; Berne, B.J. Dewetting-induced collapse of hydrophobic particles. Proc. Natl. Acad. Sci. USA 2003, 100, 11953–11958. [Google Scholar] [CrossRef] [Green Version]
- Zhou, R.; Huang, X.; Margulis, C.J.; Berne, B.J. Hydrophobic collapse in multidomain protein folding. Science 2004, 305, 1605–1609. [Google Scholar] [CrossRef] [PubMed]
- Ball, P. Water as an active constituent in cell biology. Chem. Rev. 2008, 108, 74–108. [Google Scholar] [CrossRef] [PubMed]
- Mochizuki, K.; Pattenaude, S.R.; Ben-Amotz, D. Influence of Cononsolvency on the Aggregation of Tertiary Butyl Alcohol in Methanol-Water Mixtures. J. Am. Chem. Soc. 2016, 138, 9045–9048. [Google Scholar] [CrossRef] [PubMed]
- Mochizuki, K.; Sumi, T.; Koga, K. Driving forces for the pressure-induced aggregation of poly(N-isopropylacrylamide) in water. Phys. Chem. Chem. Phys. 2016, 18, 4697–4703. [Google Scholar] [CrossRef] [PubMed]
- Mochizuki, K.; Ben-Amotz, D. Hydration-Shell Transformation of Thermosensitive Aqueous Polymers. J. Phys. Chem. Lett. 2017, 8, 1360–1364. [Google Scholar] [CrossRef] [PubMed]
- Dyson, H.J.; Wright, P.E.; Scheraga, H.A. The role of hydrophobic interactions in initiation and propagation of protein folding. Proc. Natl. Acad. Sci. USA 2006, 103, 13057–13061. [Google Scholar] [CrossRef] [PubMed] [Green Version]
- Liu, P.; Huang, X.; Zhou, R.; Berne, B.J. Observation of a dewetting transition in the collapse of the melittin tetramer. Nature 2005, 437, 159–162. [Google Scholar] [CrossRef]
- Chandler, D. Interfaces and the driving force of hydrophobic assembly. Nature 2005, 437, 640–647. [Google Scholar] [CrossRef]
- Ahmad, M.; Gu, W.; Helms, V. Mechanism of fast peptide recognition by SH3 domains. Angew. Chem. Int. Ed. Engl. 2008, 47, 7626–7630. [Google Scholar] [CrossRef]
- Hua, L.; Huang, X.; Liu, P.; Zhou, R.; Berne, B.J. Nanoscale dewetting transition in protein complex folding. J. Phys. Chem. B 2007, 111, 9069–9077. [Google Scholar] [CrossRef]
- Young, T.; Hua, L.; Huang, X.; Abel, R.; Friesner, R.; Berne, B.J. Dewetting transitions in protein cavities. Proteins 2010, 78, 1856–1869. [Google Scholar] [CrossRef]
- Ansari, S.; Helms, V. Statistical analysis of predominantly transient protein-protein interfaces. Proteins 2005, 61, 344–355. [Google Scholar] [CrossRef] [PubMed]
- Ahmad, M.; Gu, W.; Geyer, T.; Helms, V. Adhesive water networks facilitate binding of protein interfaces. Nat. Commun. 2011, 2, 261. [Google Scholar] [CrossRef] [PubMed] [Green Version]
- Ulucan, O.; Jaitly, T.; Helms, V. Energetics of Hydrophilic protein-protein association and the role of water. J. Chem. Theory Comput. 2014, 10, 3512–3524. [Google Scholar] [CrossRef] [PubMed]
- Galamba, N.; Pipolo, S. On the binding free energy and molecular origin of sickle cell hemoglobin aggregation. J. Phys. Chem. B 2018, 122, 7475–7483. [Google Scholar] [CrossRef] [PubMed]
- Hua, L.; Zangi, R.; Berne, B.J. Hydrophobic interactions and dewetting between plates with hydrophobic and hydrophilic domains. J. Phys. Chem. C 2009, 113, 5244–5253. [Google Scholar] [CrossRef]
- Giovambattista, N.; Debenedetti, P.G.; Rossky, P.J. Hydration behavior under confinement by nanoscale surfaces with patterned hydrophobicity and hydrophilicity. J. Phys. Chem. C 2006, 111, 1323–1332. [Google Scholar] [CrossRef]
- Xi, E.; Venkateshwaran, V.; Li, L.; Rego, N.; Patel, A.J.; Garde, S. Hydrophobicity of proteins and nanostructured solutes is governed by topographical and chemical context. Proc. Natl. Acad. Sci. USA 2017, 114, 13345–13350. [Google Scholar] [CrossRef]
- Acharya, H.; Vembanur, S.; Jamadagni, S.N.; Garde, S. Mapping hydrophobicity at the nanoscale: Applications to heterogeneous surfaces and proteins. Faraday Discuss. 2010, 146, 353. [Google Scholar] [CrossRef]
- Monroe, J.I.; Shell, M.S. Computational discovery of chemically patterned surfaces that effect unique hydration water dynamics. Proc. Natl. Acad. Sci. USA 2018, 115, 8093–8098. [Google Scholar] [CrossRef]
- Bar Dolev, M.; Dolev, M.B.; Braslavsky, I.; Davies, P.L. Ice-Binding Proteins and Their Function. Annu. Rev. Biochem. 2016, 85, 515–542. [Google Scholar] [CrossRef]
- Mochizuki, K.; Molinero, V. Antifreeze glycoproteins bind reversibly to ice via hydrophobic groups. J. Am. Chem. Soc. 2018, 140, 4803–4811. [Google Scholar] [CrossRef] [PubMed]
- Nada, H.; Furukawa, Y. growth inhibition mechanism of an ice–water interface by a mutant of winter flounder antifreeze protein: a molecular dynamics study. J. Phys. Chem. B 2008, 112, 7111–7119. [Google Scholar] [CrossRef] [PubMed]
- Davies, P.L. Ice-binding proteins: A remarkable diversity of structures for stopping and starting ice growth. Trends Biochem. Sci. 2014, 39, 548–555. [Google Scholar] [CrossRef] [PubMed]
- Knight, C.A. Adding to the antifreeze agenda. Nature 2000, 406, 249–251. [Google Scholar] [CrossRef]
- Celik, Y.; Graham, L.A.; Mok, Y.-F.; Bar, M.; Davies, P.L.; Braslavsky, I. Superheating of ice crystals in antifreeze protein solutions. Proc. Natl. Acad. Sci. USA 2010, 107, 5423–5428. [Google Scholar] [CrossRef] [Green Version]
- Scotter, A.J.; Marshall, C.B.; Graham, L.A.; Gilbert, J.A.; Garnham, C.P.; Davies, P.L. The basis for hyperactivity of antifreeze proteins. Cryobiology 2006, 53, 229–239. [Google Scholar] [CrossRef]
- Zachariassen, K.E.; Li, N.G.; Laugsand, A.E.; Kristiansen, E.; Pedersen, S.A. Is the strategy for cold hardiness in insects determined by their water balance? A study on two closely related families of beetles: Cerambycidae and Chrysomelidae. J. Comp. Physiol. B 2008, 178, 977–984. [Google Scholar] [CrossRef]
- Kristiansen, E.; Ramløv, H.; Højrup, P.; Pedersen, S.A.; Hagen, L.; Zachariassen, K.E. Structural characteristics of a novel antifreeze protein from the longhorn beetle Rhagium inquisitor. Insect Biochem. Mol. Biol. 2011, 41, 109–117. [Google Scholar] [CrossRef]
- Liou, Y.-C.; Tocilj, A.; Davies, P.L.; Jia, Z. Mimicry of ice structure by surface hydroxyls and water of a β-helix antifreeze protein. Nature 2000, 406, 322–324. [Google Scholar] [CrossRef]
- Leinala, E.K.; Davies, P.L.; Doucet, D.; Tyshenko, M.G.; Walker, V.K.; Jia, Z. A beta-helical antifreeze protein isoform with increased activity. Structural and functional insights. J. Biol. Chem. 2002, 277, 33349–33352. [Google Scholar] [CrossRef]
- Hakim, A.; Nguyen, J.B.; Basu, K.; Zhu, D.F.; Thakral, D.; Davies, P.L.; Isaacs, F.J.; Modis, Y.; Meng, W. Crystal structure of an insect antifreeze protein and its implications for ice binding. J. Biol. Chem. 2013, 288, 12295–12304. [Google Scholar] [CrossRef] [PubMed]
- Berendsen, H.J.C.; van der Spoel, D.; van Drunen, R. GROMACS: A message-passing parallel molecular dynamics implementation. Comput. Phys. Commun. 1995, 91, 43–56. [Google Scholar] [CrossRef] [Green Version]
- Hoover, W.G. Canonical dynamics: Equilibrium phase-space distributions. Phys. Rev. A Gen. Phys. 1985, 31, 1695–1697. [Google Scholar] [CrossRef] [PubMed]
- Nosé, S. A molecular dynamics method for simulations in the canonical ensemble. Mol. Phys. 1984, 52, 255–268. [Google Scholar] [CrossRef]
- Berendsen, H.J.C.; Postma, J.P.M.; van Gunsteren, W.F.; DiNola, A.; Haak, J.R. Molecular dynamics with coupling to an external bath. J. Chem. Phys. 1984, 81, 3684–3690. [Google Scholar] [CrossRef]
- MacKerell, A.D.; Bashford, D.; Bellott, M.; Dunbrack, R.L.; Evanseck, J.D.; Field, M.J.; Fischer, S.; Gao, J.; Guo, H.; Ha, S.; et al. All-atom empirical potential for molecular modeling and dynamics studies of proteins. J. Phys. Chem. B 1998, 102, 3586–3616. [Google Scholar] [CrossRef] [PubMed]
- MacKerell, A.D.; Wiorkiewicz-Kuczera, J.; Karplus, M. An all-atom empirical energy function for the simulation of nucleic acids. J. Am. Chem. Soc. 1995, 117, 11946–11975. [Google Scholar] [CrossRef]
- Abascal, J.L.F.; Vega, C. A general purpose model for the condensed phases of water: TIP4P/2005. J. Chem. Phys. 2005, 123, 234505. [Google Scholar] [CrossRef]
- Engstler, J.; Giovambattista, N. Temperature Effects on Water-Mediated Interactions at the Nanoscale. J. Phys. Chem. B 2018, 122, 8908–8920. [Google Scholar] [CrossRef]
- Choudhury, N.; Pettitt, B.M. On the mechanism of hydrophobic association of nanoscopic solutes. J. Am. Chem. Soc. 2005, 127, 3556–3567. [Google Scholar] [CrossRef] [PubMed]
- Pentelute, B.L.; Gates, Z.P.; Tereshko, V.; Dashnau, J.L.; Vanderkooi, J.M.; Kossiakoff, A.A.; Kent, S.B.H. X-ray structure of snow flea antifreeze protein determined by racemic crystallization of synthetic protein enantiomers. J. Am. Chem. Soc. 2008, 130, 9695–9701. [Google Scholar] [CrossRef] [PubMed]
- Leinala, E.K.; Davies, P.L.; Jia, Z. Crystal structure of β-helical antifreeze protein points to a general ice binding model. Structure 2002, 10, 619–627. [Google Scholar] [CrossRef]
- Hudait, A.; Odendahl, N.; Qiu, Y.; Paesani, F.; Molinero, V. Ice-nucleating and antifreeze proteins recognize ice through a diversity of anchored clathrate and ice-like motifs. J. Am. Chem. Soc. 2018, 140, 4905–4912. [Google Scholar] [CrossRef] [PubMed]
Figure 1.
A dimer of RiAFP (Rhagium inquisitor antifreeze proteins) dissolved in water in the configurations: (A) end-on with the simulation box dimension (black lines) and (B) with 90° rotation. The Thr residues involved in the protein–protein contact are represented by sticks. Water molecules and ions are not shown. The two-way arrow indicates the distance d between the centers of mass of the RiAFPs parallel to the x-axis. d for this conformation is 1.50 nm.

Figure 2.
Number of water molecules Nw between two proteins; (A) the average, <Nw>, as a function of the intersolute distance d during the association (blue) and dissociation (red) processes, and the time evolution of Nw at (B) d = 1.74 nm during the dissociation, and (C) d = 1.66 nm during the association.

Figure 3.
(A) Potential of mean force w(d) between RiAFPs as a function of the separation d during the dissociation (blue) and association (red) processes. The dashed and solid lines represent third- and fourth-order polynomial fits, respectively. (B) Density profile of water confined between the two proteins at d = 1.52 nm, (C) 1.86 nm, and (D) 2.20 nm. In panels B–D, the center of the two proteins is set to x = 0.0. The typical error bars in the potential of mean force (PMF) are of the order of 5 kJ/mol.

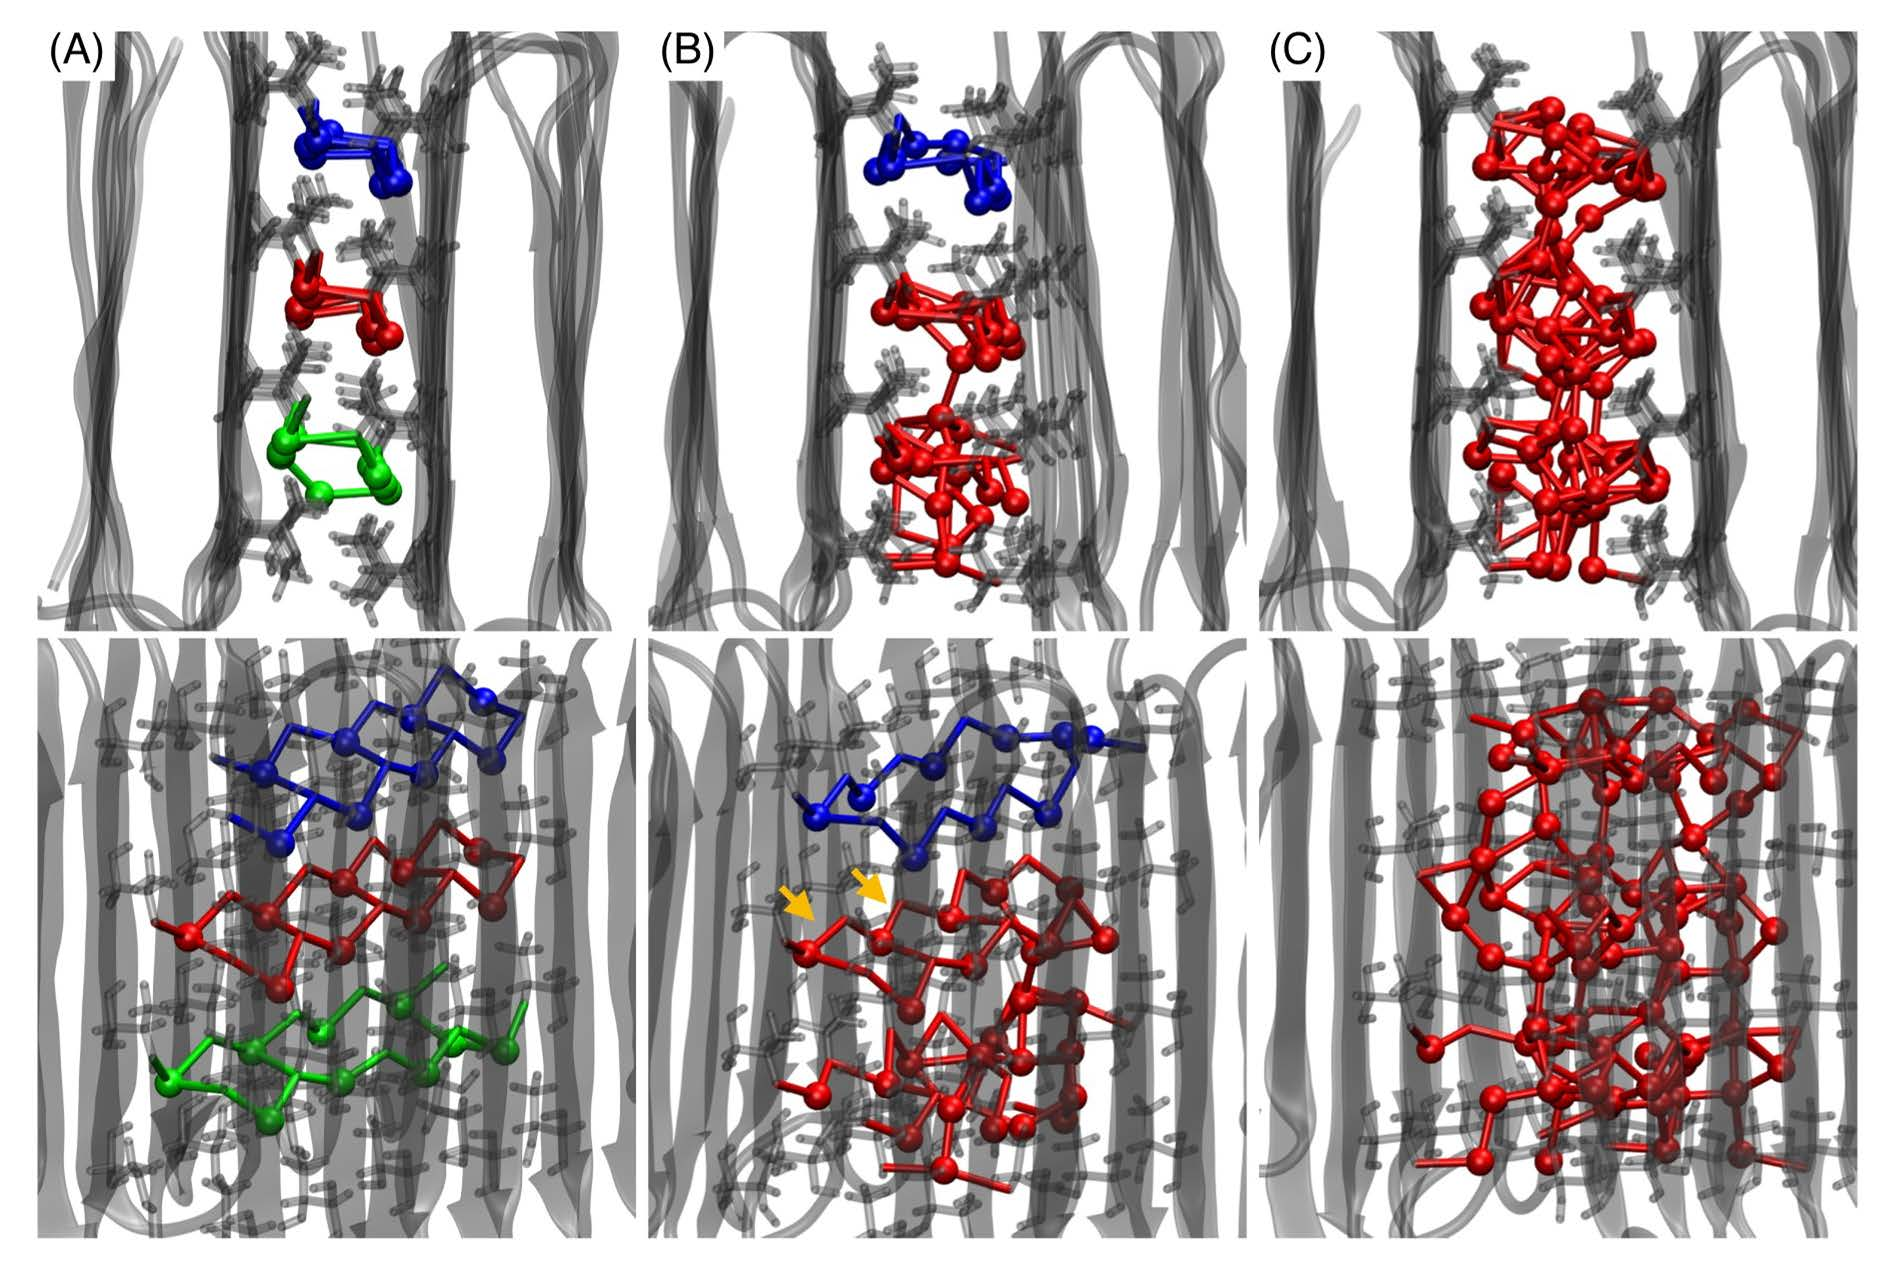
Figure 4.
Characteristic instantaneous structures comprising water molecules and OH groups in the interprotein region, observed at (A) d = 1.52, (B) 1.70, and (C) 1.86 nm during the dissociation. These ds correspond to the first minimum, first barrier, and second minimum in the PMF. At each d, two views from different angles are shown. The water molecule and the OH groups are connected by lines if their oxygen–oxygen distance is shorter than 0.34 nm, which is the first minimum of the oxygen–oxygen radial distribution function for bulk water [48]. Water molecules are represented by balls. The transparent gray shapes show proteins in cartoon representation and the sticks represent Thr residues on the ice-binding surfaces (IBSs). The orange arrows in panel B indicate the remaining hexamers.

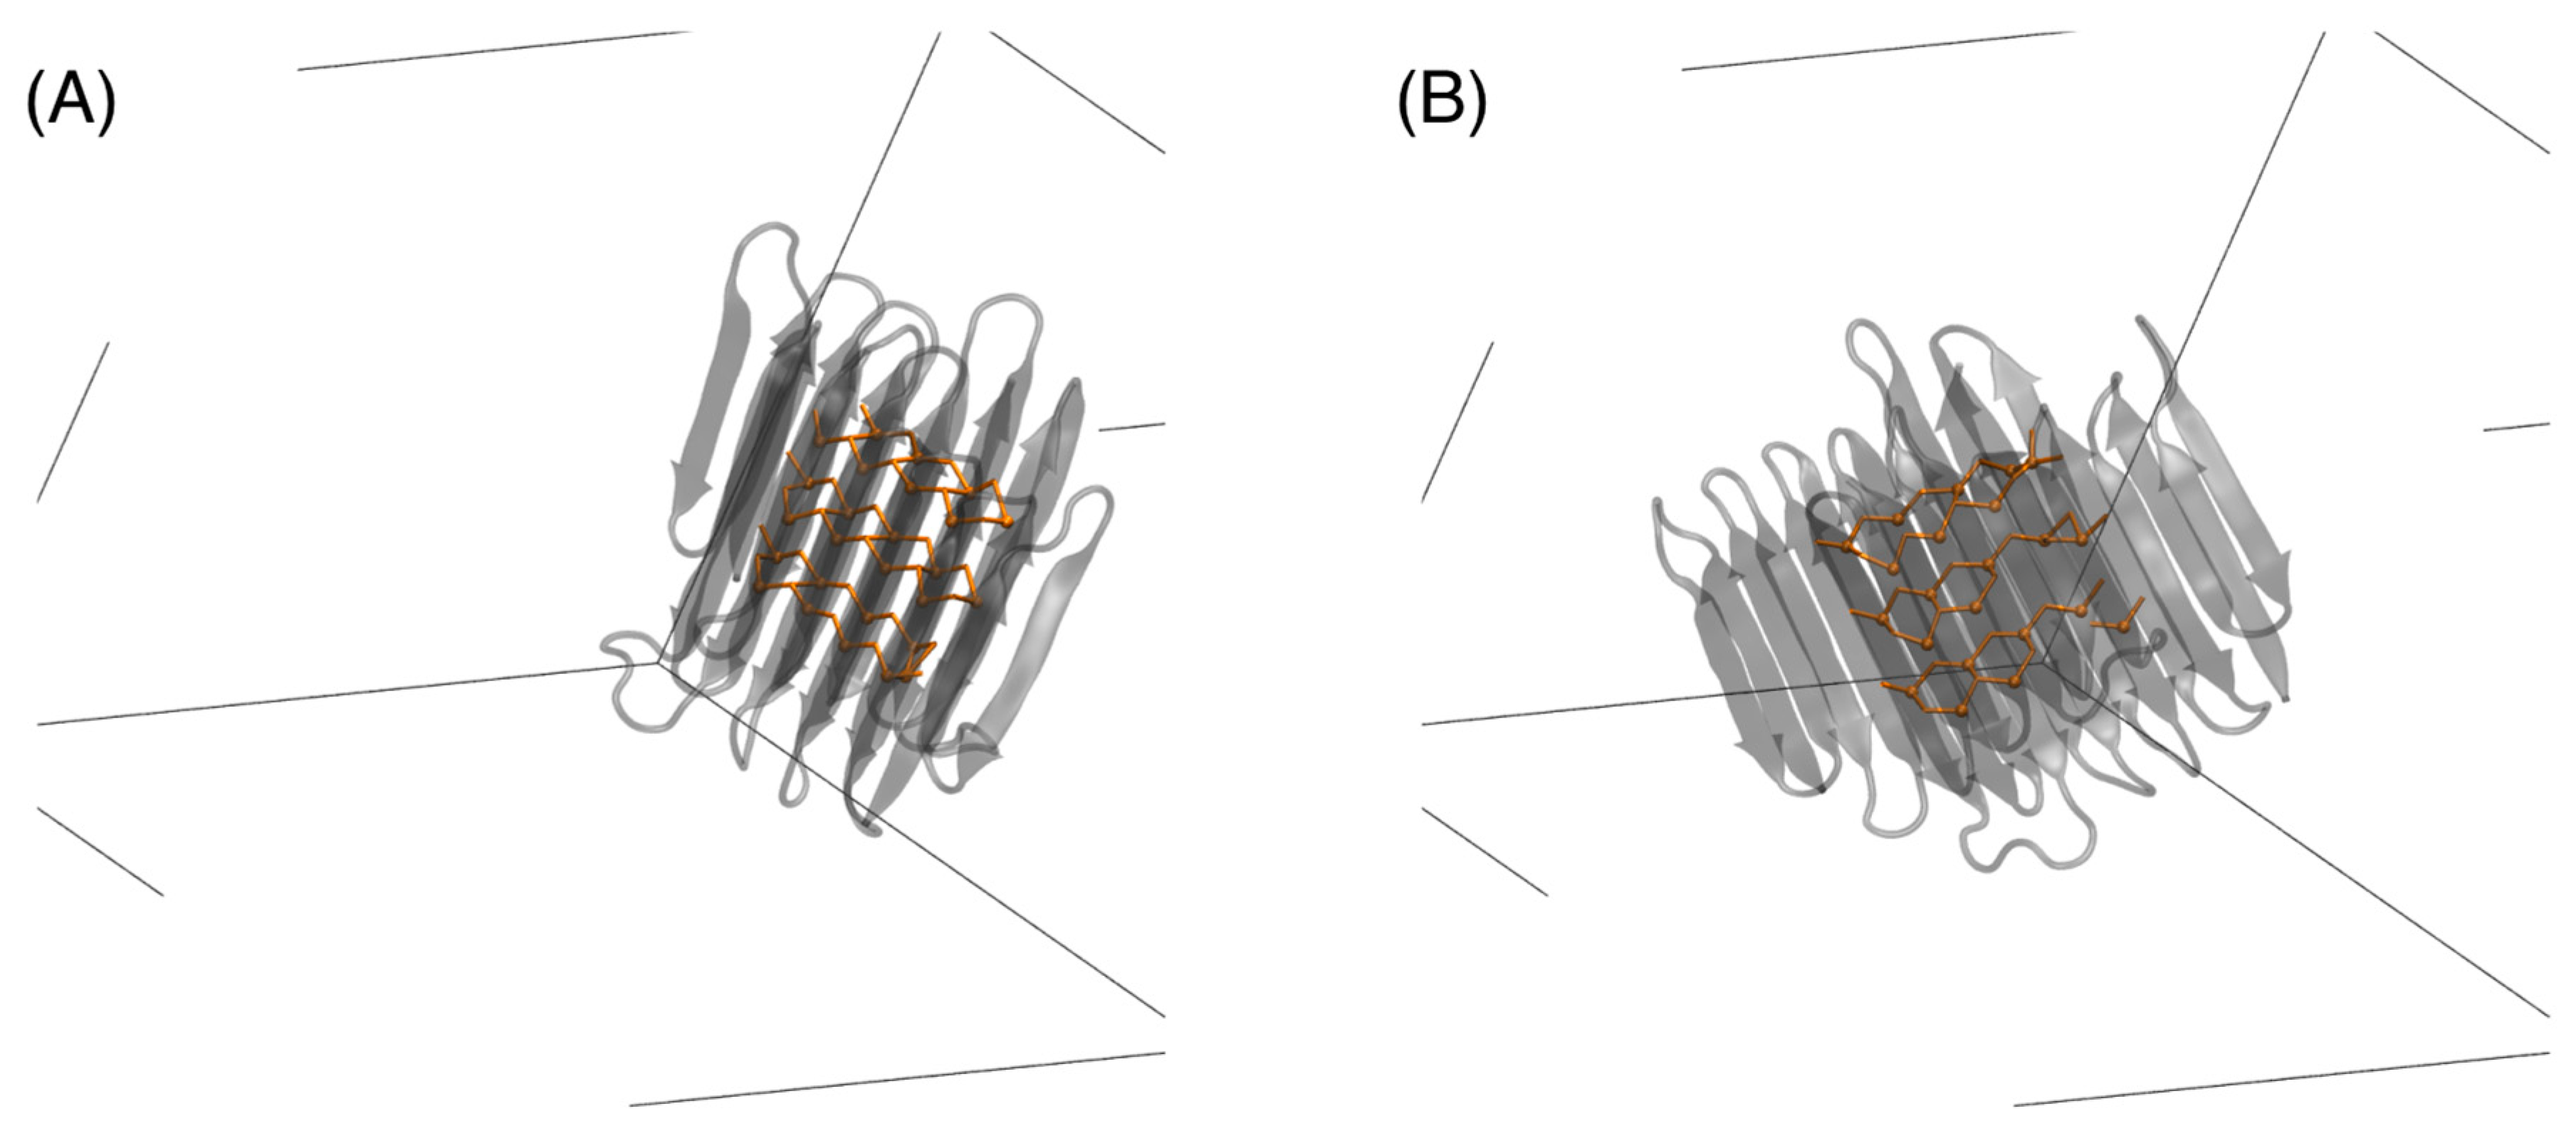
Figure 5.
Instantaneous structures of RiAFPs and water molecules between them, obtained at (A) the initial and (B) final steps of the 10 ns molecular dynamics (MD) simulation, for unrestrained proteins from the same viewpoints. A water molecule and an OH group of a Thr residue are connected by an orange line if their oxygen–oxygen distance is shorter than 0.34 nm. Gray lines represent the simulation box.

© 2019 by the authors. Licensee MDPI, Basel, Switzerland. This article is an open access article distributed under the terms and conditions of the Creative Commons Attribution (CC BY) license (http://creativecommons.org/licenses/by/4.0/).
Share and Cite
MDPI and ACS Style
Mochizuki, K.; Matsumoto, M. Collective Transformation of Water between Hyperactive Antifreeze Proteins: RiAFPs. Crystals 2019, 9, 188. https://doi.org/10.3390/cryst9040188
AMA Style
Mochizuki K, Matsumoto M. Collective Transformation of Water between Hyperactive Antifreeze Proteins: RiAFPs. Crystals. 2019; 9(4):188. https://doi.org/10.3390/cryst9040188
Chicago/Turabian StyleMochizuki, Kenji, and Masakazu Matsumoto. 2019. "Collective Transformation of Water between Hyperactive Antifreeze Proteins: RiAFPs" Crystals 9, no. 4: 188. https://doi.org/10.3390/cryst9040188
Note that from the first issue of 2016, this journal uses article numbers instead of page numbers. See further details here.