Article

Tris(2-Methoxyphenyl)Bismuthine Polymorphism Characterized by Nuclear Quadrupole Resonance Spectroscopy

1
Institute of Medical Engineering, Graz University of Technology, Stremayrgasse 16, 8010 Graz, Austria
2
Institute of Inorganic Chemistry, Graz University of Technology, Stremayrgasse 9, 8010 Graz, Austria
3
Institute of Organic Chemistry, Graz University of Technology, Stremayrgasse 9, 8010 Graz, Austria
*
Author to whom correspondence should be addressed.
Crystals 2019, 9(9), 446; https://doi.org/10.3390/cryst9090446
Submission received: 25 July 2019 / Revised: 22 August 2019 / Accepted: 24 August 2019 / Published: 28 August 2019
(This article belongs to the Special Issue NQR of Polymorphic Crystals)

Abstract

:
Based on the previous identification of metastable polymorphs in crystalline triphenylbismuth by nuclear quadrupole resonance spectroscopy (NQRS), the potential formation of similar phases was studied in Tris(2-Methoxyphenyl)Bismuthine. To this end, commercial samples with known NQRS properties were molten and re-crystallized at different speeds (shock freezing in different coolants versus slow cooling inside of a heater). In all recrystallization products we have identified a new crystal phase which has not been observed after synthesis from a solution. The new crystallographic structure has been confirmed by X-ray diffraction (XRD). The newly isolated polymorph crystallizes in the monoclinic space group P2(1)/c with only one molecule in the asymmetric unit and consequently only one 5/2-7/2 transition is observed at 88.75 MHz at 310 K. In contrast, the two transitions at 89.38 and 89.29 MHz for the well-known trigonal polymorph originate from two crystallographically distinct molecules of Tris(2-methoxy-Phenyl)Bismuthine in the asymmetric unit. Additional relaxometric NQRS shows distinctly different T2 relaxation times for the new polymorph when compared to the original samples. Additional phase transitions could not be observed during temperature sweeps between 153 K and 323 K.

Graphical Abstract

1. Introduction

Nuclear quadrupole resonance spectroscopy (NQRS) is an analytical method which, among others, is sensitive to the crystallographic state of compounds which contain quadrupolar nuclei (QN), that is, nuclei with a spin quantum number >1/2 which possess a non-spherical electrical charge distribution [1] and hence a quadrupolar moment Q. This quadrupolar moment can interact with inhomogeneous electric fields, in particular with the electric field gradient (EFG) at the nucleus generated by the surrounding electronic structure. This interaction exists independently of an external static magnetic field and leads to a set of (2I + 1) discrete energy levels with frequencies corresponding to the quadrupolar Hamiltonian:
H Q = e 2 q Q 4 I ( 2 I 1 ) [ 3 I z 2 I 2 + η I + 2 + I 2 2 ]
allowing for N = I − 1/2 observable single quantum spin transitions in case of half integer spins. The actual transition frequencies ωQ,i, I = 1 − N, can be calculated by diagonalizing the Hamiltonian in (1). e2qQ is the quadrupolar coupling constant, η the asymmetry parameter and the operators in the bracket denote the usual Pauli spin operators. The z-axis is oriented along the axis of the EFG-tensor which corresponds to its largest eigenvalue Vzz (principal axis system, PAS). As the EFG depends on the electronic structure of the chemical bonds, the spectrum of transition frequencies depends very sensitively on the crystallographic structure as described, for example, in References [2,3,4,5]. Due to the nuclear spin there exist additional interaction mechanisms with the magnetic field which on the one hand makes the transition frequencies also depend on the static magnetic flux density B0 (if present), giving rise to additional Zeeman splitting and to the possibility of exciting and detecting transitions with magnetic radiofrequency (RF) fields much the same way as in nuclear magnetic resonance (NMR). Of course, there exist other powerful methods for retrieving crystallographic information such as x-ray diffractometry (XRD) and electron microscopy. However, NQR can provide valuable complementary information and allows for real-time measurements in special cases where the other methods are too slow because the data acquisition is usually comparatively fast and temperature control of the sample is relatively easy. Different isotopes and crystallographically different sites can be distinguished readily. The transition frequencies are sensitive to temperature due to residual static perturbations of the Hamiltonian by molecular motion (especially torsional modes), which can give interesting additional information. In this context, NQRS without static B0 (so called zero-field NQRS) is particularly advantageous because the probeheads can be made simple, which allows for an easy combination with additional equipment such as thermo/cryostats.
NQRS has been suggested for the investigation of polymorphic powder samples in different application fields. As reviewed in References [6] and [7] the identification and selection of the right polymorphic form of the active compound of a drug can have significant impact on its stability and bioavailability and is this an important issue in the quality control of pharmaceutics. Typical quadrupolar target nuclei are 35Cl and 14N. The latter, however, is more difficult to measure with standard NQRS equipment due to its typically low transition frequencies and, consequently, low SNR which require advanced sampling techniques as presented in References [8,9]. In Reference [10] the authors applied NQRS for the monitoring of phase transitions in pharmaceutical preparations of chlorpropamide and diclofenac, using 35Cl as the quadrupolar nucleus (QN). They could clearly distinguish different polymorphs and emphasized the advantage of NQRS over other methods like X-ray diffraction, IR, Raman spectroscopy and NMR, because the signals are usually not perturbed by the presence of solid excipient or other substances. A similar investigation for the antidiabetic drug diabinese can be found in References [11]. In Reference [12] the authors show the clear distinguishability of differently hydrated species of diclofenac preparations and confirm the usefulness of NQRS for hydration monitoring of drug compounds containing quadrupolar nuclei. An application with high potential impact is the detection of explosives, as important compounds like Trinitrotoluene (TNT) and Cyclotrimethylenetrinitramine, commonly labelled as RDX, have very characteristic NQR fingerprints, see, for example, References [13,14]. In Reference [15] the authors have studied polymorphism in TNT samples using NQR patterns of 14N. Another area of application is related to crystallography, in particular related to compounds which have some importance in minery. Basic investigations concerning polymorphism in minerals can be found, for example, in References [16,17]. Practical implementations and applications for the identification and quantification of As compounds in processing pipelines of minery have been reported in Reference [18]. Several publications describe the application of NQRS for the investigation of phase transitions in crystalline samples, for example, References [19,20,21,22].
Recently quadrupolar nuclei have been suggested for new contrast mechanisms based on quadrupolar relaxation enhancement (QRE) in magnetic resonance imaging (MRI) [23,24,25]. QRE can occur selectively at very distinct frequencies where the proton Larmor frequency and one of the quadrupolar transition frequencies match, which allows for tuning the compounds so as to produce contrast only under certain conditions, for example, chemical bonding or slight shifts of the B0-field. The underlying mechanism is the strong sensitivity of the transition frequencies on the B0-field and on the EFG caused by the chemical bonding structure around the Bi-nucleus. As promising candidates for core-compounds in QRE-based contrast agents a family of 209Bi-Aryl compounds has been identified. For exact tuning of the compounds in this context, several representatives have been characterized comprehensively in terms of their chemical and physical properties, including extended studies of their NQR spectra and their quadrupolar relaxation behaviour. As potential polymorphisms and structural order play an important role for the exact location of the NQR transition frequencies, the respective characterizations are of high importance for the proper design of potential contrast agents and respective data have been published for Triphenyl-Bismuth [26]. It is also worth mentioning, that different polymorphic states exhibit different lattice and molecular dynamics which influence EFG fluctuations around the QN [27]. Thus, it is expected that polymorphic states will also differ in terms of their nuclear spin relaxation properties which can be measured by NQRS.
While investigating NQR properties of Tris(2-Methoxyphenyl)Bismuthine relevant for the abovementioned QRE effect, a yet unknown crystal structure has been found for this compound. This new structure emerges only upon recrystallization from a melt and cannot be observed in powders synthesized from the solution. During temperature changes within the solid sample, no phase transition is observed. This observation is studied closer by different sample preparation methods and monitoring over time by NQRS. Complementary methods like XRD are used to support the observation and closer determine the newfound structure. The study helps to address the question, what changes of NQR transition frequency can be expected from a similar molecule within different ordered structures. This question is of particular interest for the design of potential contrast agents based on highly ordered nanoparticles.
NOVELTY: A so-far undescribed crystal structure of Tris(2-Methoxyphenyl)Bismuthine has been identified after recrystallization of the commercially available powder (synthetized from solution) from the melt; the crystal structure has been identified by XRD and the NQR parameters Qcc, η and the T2 relaxation rate have been determined. While the known polymorph shows a strong and somewhat uncommon positive temperature coefficient of T2 on transition 7/2 → 9/2 between 77 and 310 K, the new polymorph has longer T2 times and shows the more frequently observed negative temperature coefficient. These significantly altered NQR parameters independently confirm the existence of the new crystal structure.

2. Materials and Methods

2.1. Sample Preparation

For our study, we distinguish samples of Tris(2-Methoxyphenyl)Bismuthine crystallized from solution directly after synthesis, labelled ‘CS’ and samples obtained by re-crystallization from a melt of the latter, labelled ‘RM.’ CS was a solid powder purchased from SIGMA Aldrich, Ref-Nr. 485276. For investigating the behaviour of the ‘RM’ samples we applied a modified version of the procedure described in Reference [26]. We expected similar effects as those observed in Triphenylbismuth, that is, the at least intermediate formation of alternative crystallization states and potentially an intermediate metastable state. As these states may depend on the dynamics of re-crystallization different procedures were applied. All samples were molten in standard NMR tubes with either 5 mm or 3 mm diameter filled up to a height of ca. 3 cm. The tubes were placed into fitting bores of a prismatic Al-block with the edge lengths 10 cm × 10 cm × 4 cm. The Al block was heated up with a heating plate (RCTbasic, type RCT-B, IKA Werke, Staufen, Germany). Temperature was measured continuously in an adjacent bore with a thermocouple type K connected to a multimeter MS8264, TE.Electronic. After reaching the melting temperature of ca. 165 °C, the temperature was still increased to 175 °C within 10 min so as to preserve the liquid state also for several tens of seconds after removal from the heater.
For a first preparation labelled ‘RM-S’, the melt was cooled down slowly within a 5 mm NMR tube with a slope of 2.5 °C per min until crystallization started. The latter occurred not earlier than below 130 °C. As in several repetitions of the experiment the end product did not always show the same NQR pattern, the sample was re-molten and re-crystallized up to 3 times.
Two other preparations were produced by shock-freezing the melt via immediate immersion in a coolant. For preparation ‘RM-SFW,’ the coolant was water at 300 K and the sample was prepared in a 5mm tube. For a second preparation ‘RM-SFLN,’ the coolant was liquid nitrogen (LN, 77 K) and the tube had a diameter of 3mm in order to guarantee fast thermal equilibration and thus solidification. Finally, we thus had three different end products which we classify qualitatively (i.e., without knowing the exact dynamics) as ‘slow’, ‘intermediate’ and ‘fast’ solidification.
The delay between removal from the heater and immersion was <7 s in all cases and the samples were left in the coolant until excessive boiling had stopped. For RM-SFLN the sample tube was inserted directly into the NQRS probe coil via a guiding glass-cylinder. The coil was already immersed in LN inside of the cryostat described in [28], thus placing for spectroscopy and shock-freezing simultaneously. In contrast RM-SFW was frozen in a 50 ml glass beaker filled with water and transferred to the probe coil in the cryostat after solidification.

2.2. Sample Characterization

2.2.1. General

All samples were characterized by zero-field NQRS. In addition, the crystallographic parameters were studied for CS and RM-SFW by x-ray diffraction. For single crystal X-ray diffractometry a suitable crystal was selected, mounted on a glass rod on a copper pin and placed in the cold N2 stream provided by an Oxford Cryosystems cryometer (T = 100 K). XRD data collection was performed on a Bruker APEX II diffractometer equipped with an IµS microsource with use of Mo Kα radiation (λ = 0.71073 Å) and a CCD area detector. Empirical absorption corrections were applied using SADABS [29,30]. The structure was solved with use of direct methods and refined by the full-matrix least-squares procedures in SHELXL [31]. The space group assignment and structural solutions were evaluated using PLATON [32].
To check for potential decomposition or related conversions of the tested substance during the melting as well as recrystallization procedure, NMR spectra of the sample CS and RM-SFW (30 mg compound, dissolved in 0.6 mL CDCl3) were recorded on a Bruker (Billerica, MA, USA) Ultrashield spectrometer at 300.36 and 75.53 MHz, respectively. Chemical shifts δ (in ppm) are given relative to TMS and the spectra were referenced to solvent residual signal(s).
NQRS consisted of four different experiments, that is,
  • determination of the peak transition frequencies and the full width at half maximum (FWHM) of the peaks for transition 7/2→5/2 of the Bi nucleus in all samples after reaching their final state
  • observation of the evolution of the NQR spectrum during a certain time after shock freezing the melt of RM-SFLN
  • the determination of the peak transition frequencies during a temperature sweep from 153 K to 325 K for the detection of potential phase transitions
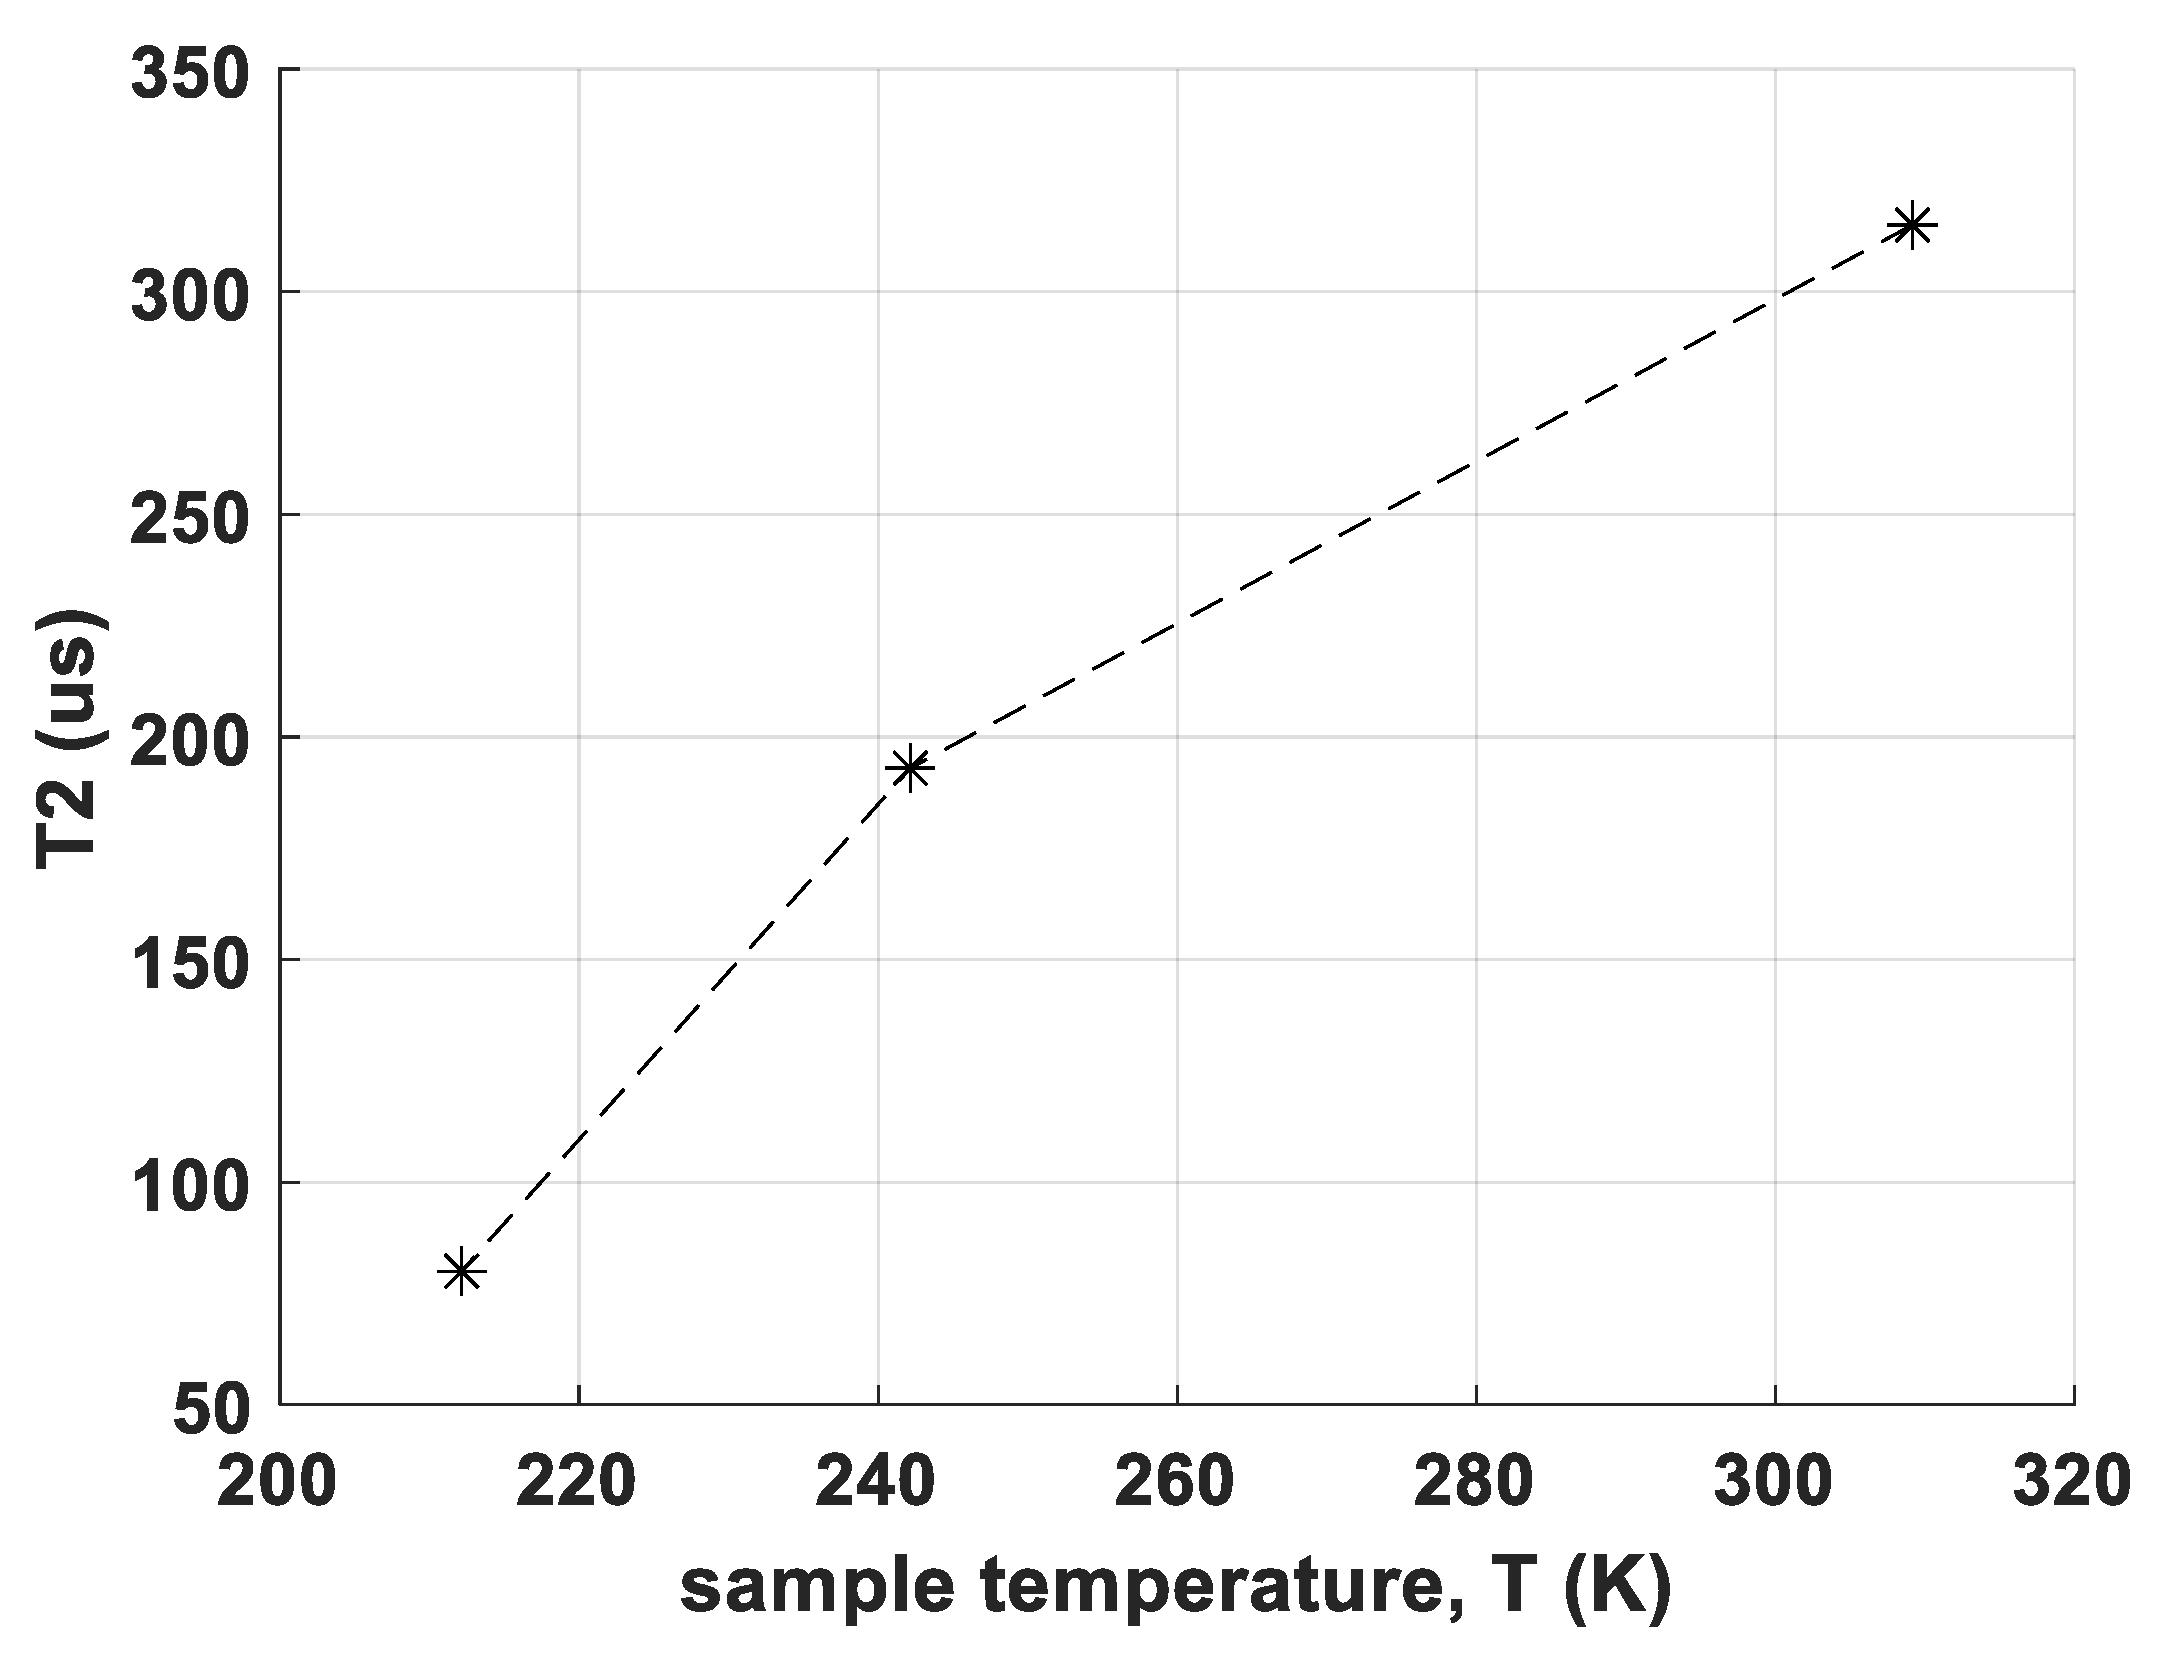
  • the determination of T2 relaxation times of CS and RM-SFW, partially at different temperatures
Experiments 1,2 and 3 were performed with a custom-built NQR spectrometer ‘CONCradle’ and a set of custom-built wideband probeheads as described in Reference [28]. The localization of the NQR transition frequencies was done with a standard spin echo sequence with the shortest reasonably applicable echo-time TE which allowed for the best SNR without noticeable ringdown-artefacts. For the detection of potential peaks apart from those already known for CS, wideband scans were carried out between 60 and 100 MHz using the fast interleaved sub-spectrum sampling method presented in [28]. For these ‘scout scans’ the intermediate frequency bandwidth (IFBW) was set to 50 kHz. After peak localization, the accurate characterization was done with a reduced scanning range within a band of 500 kHz centred at the peak frequency with the number of points set to 400, which yields a frequency spacing of 1.25 kHz. The IFBW was reduced to yield low spectral leakage when determining the FWHM. The concrete sequence parameters and IFBW values are given in respective descriptions of the individual experiments. Experiment 4 was carried out on the commercial pulse-type spectrometer “SCOUT” of Tecmag (TX, USA), which allows for a more advanced pulse sequence design than ‘CONCradle,’ which was necessary for accurate relaxometry.
For all NQR measurements, except those at 77 K, the probeheads were installed inside of a custom-built thermostatization unit consisting of a thermally well-isolated plastic tube, which contained an electrically powered heater (20 W). A thermocouple of type K was placed as closely as possible to the sample for temperature sensing. For thermostatization at setpoints >25 °C a continuous air stream of dry air was passed through the tube where it was heated up and then passed through the probehead. At the inlet the air was pre-heated to a constant temperature between 20 and 40 °C with a commercial peltier-thermostatization unit PTC 201301 (NMR Service, Erfurt, GE), so as to suppress inlet temperature fluctuations. For setpoints <0 °C the tube was placed inside of a brass cylinder which was plunged into liquid nitrogen inside of a commercial DEWAR vessel. LN was vaporized by a second heater unit in the DEWAR and the cold vapour was passed through the tube to cool the sample. The sample temperature was kept constant with a digital PID-controller implemented on a RaspberryPi which controlled the heater power in response to the temperature received from the sensor via a MAX 31855 thermocouple amplifier. Before use the sensor was calibrated with a mixture of ice and water (i.e., at 0 °C). After thermal equilibration of the probehead and the sample the target temperature could be kept with a deviation of max. +/−0.5 °C throughout all NQRS scans, respectively.

2.2.2. Experiment 1

NQRS was carried out with for all products at 77 K after thermal equilibration of the sample (ca. 5 min). After the measurements the probeheads together with the samples were thawed and measurements were repeated at 310 K after thermal equilibration (ca. 30 min). The sequence parameters were TP = 8 μs, TE = 100 μs, TR = 2000 μs. Peak locations and FWHM were determined by fitting standard Lorentzian lines into the peak(s) with the MATLAB optimization toolbox using the function ‘lsqnonlin.’ Confidence bounds of 95% were calculated both for the residuals as well as for the parameters. The IFBW was set to 5 kHz so as to recover the FWHM with a leakage error less than this value. The number of averages was chosen so as to reach an SNR >5 for the peak maximum in the respective experiment, typically up to 1000.

2.2.3. Experiment 2

For observing the time evolution of the spectra of RM-SFLN after shock freezing, two NQR spectra were taken in LN at times 26 and 46 min after solidification. Afterwards the probehead was removed from the cryostat, thawed and stored at room temperature (26 °C) for 60 min. Then the sample was re-immersed in LN and scanned 29 min later. Finally, the sample was again thawed and stored 17 h at room temperature before a final spectrum was acquired in LN. As extremely broadened peaks with low SNR were expected, 1000 wideband spectra with 20 MHz width were acquired with the fast interleaved technique and averaged for the first three datasets. Pulse parameters were the same as in Experiment 1 while the number of points was kept at 320 per spectrum. For the last dataset the band was narrowed to 2 MHz, taking 200 points after observing strong narrowing of the peaks. The IFBW was set to 10 kHz in order to get sufficient SNR. Peaks were fitted by Lorentzian lines in the same manner as in Experiment 1.

2.2.4. Experiment 3

The peak transition frequency of sample CS site A was observed at 10 different temperatures between 153 K and 323 K. For data interpretation a modified model of Bayer [33], including the Brown method [34], was fitted to the data with the MATLAB optimization toolbox using the function ‘lsqnonlin’. 95% confidence bounds were given both for the residuals as well as for the parameters. The model is based on the simulation of residual perturbations of the EFG by quantum-harmonic torsional oscillations of the molecule. The predicted transition frequency ωi(T) is:
ω i ( T ) = ω Q , i [ 1 3 h 8 π 2 A f T , 0 ( 1 g ( T T 0 ) ) ( 1 2 + 1 e h f T , 0 ( 1 g ( T T 0 ) ) k T 1 ) ]
where ωQ,i is the theoretical ith transition frequency of the unperturbed Hamiltonian (1) (vibrationless lattice). A denotes the moment of inertia of the molecule, fT,0 is the torsional resonance frequency of the molecule at reference temperature T0 (here 293.15 K) and g is the thermal coefficient of the torsional frequency determined by Brown’s method. k and h have their usual meaning as Boltzman’s and Planck’s constants, respectively.

2.2.5. Experiment 4

Relaxometry was included because a different polymorphic state of a crystal manifests itself not only in an altered NQR transition frequency but also spin relaxation properties of the contained nuclei are expected to change. Measurements of T2 of transition 7/2→5/2 were performed at 37°C using a spin echo pulse sequence with variable echo time. In CS the procedure was done for both crystallographic sites A and B reported in [23] and for the single peak found in the polymorphic phase of the RM samples. Afterwards a mono-exponential model was fitted to the data using the same procedure as described in [23]. In addition, temperature dependent measurements of T2 were performed for sample CS, site A, starting at 310 K and then decreasing temperature in several steps down to 213 K.

3. Results

3.1. Experiment 1

Significantly different spectra were found for samples CS and RM, as shown in Figure 1a,b, respectively. The occurrence of two crystallographically different sites in CS is visible in form of two distinct peaks.
Table 1 shows the exact peak frequencies in MHz of the final products for the transitions 7/2 → 5/2 at 310 K and 77 K (LN). The 95% confidence bonds of the fits at 310 K were within +/−1 kHz around the fitted value. The additional uncertainty of the temperature of +/−0.5 K leads to uncertainties of +/−5.1 kHz for the RM samples and +/−2.1 kHz for CS due to the thermal coefficients of the quadrupole coupling constant.
Table 2 shows the corresponding peak widths, given as full-width at half maximum (FWHM) in kHz. The 95% confidence bonds of the fits were less than +/−2 kHz around the fitted value for samples RM and less than +/−4 kHz for sample CS.
In addition, the peak of the 9/2 → 7/2 transition was measured for RM-SFW so that it was possible to determine the NQR parameters Qcc and η. The respective peak frequency was found at 118.37, leading to a Qcc of 710.5 MHz and an η of 0.05. (corresponding to Qcc = 715.2 and 714.3 MHz as well as η = 0 and 0 for CS site A and B, respectively, according to [23]).

3.2. Experiment 2

Table 3 shows the time evolution of the FWHM (measured in LN) of the NQRS peak of transition 7/2→5/2 of sample RM-SFLN after shock freezing. As can be seen there was an extremely broad peak (1.8 MHz) with very low SNR after 26 min. which narrowed down to 808 kHz after another 20 min, still within LN. After 1 h of storage at room temperature the peak narrowed significantly to 375 kHz, long storage throughout more than 18 h led to further narrowing to 264 kHz. Such extreme peak broadening was not observed for any of the other RM samples. However, the peak frequency was again found at 90.71 MHz as in all other RM samples.

3.3. Experiment 3

Figure 2 shows the dependence of the transition frequency for transition 7/2 → 5/2 of sample CS, site A on temperature. There is no pronounced jump in the curve which indicates the absence of phase transitions in this temperature range. The parameters of the model by Bayer as well as the thermal coefficient of the torsional frequency determined by Brown’s method are listed in Table 4.

3.4. Experiment 4

The results of relaxometry (performed at 310 K) are summarized in Table 5 for transition 7/2 → 5/2 and show a clear difference of the T2 relaxation times between the two phases as well as crystal sites. The relaxation times of CS, site A are rather slow compared to the relaxation times of CS, site B. The relaxation times of RS-SFW settle in between the values of the two sites.
In Figure 3, measured T2 values for CS site A at different temperatures are shown. T2 decreases from 315 μs at 310 K and 193 μs at 243 K to only 80 μs at 213 K, which leads already to poor signal/noise ratio SNR. Below 150 K, no reasonable measurement was possible in contrast to RM-SFW.

3.5. X-ray Crystallography

The newly isolated polymorph crystallizes in the monoclinic space group P2(1)/c (No. 14, a = 14.7365(5), b = 7.9764(3), c = 16.8250(6); α = 90, β = 101.918(2), γ = 90) with only one molecule in the asymmetric unit as compared to the two independent molecules per asymmetric unit in the previously reported polymorph R 3 ¯ (a = 23.160(3), b = 23.160(3), c = 25.418(5), α = β = 90, γ = 120) [35]. In contrast sample CS is a trigonal polymorph with two crystallographically distinct molecules of Tris(2-Methoxyphenyl)Bismuthine in the asymmetric unit. Of these, one is located on a general position while the other molecule is located on the three-fold axis. Despite the different packing in the solid state, the C-Bi distances and C-Bi-C angles are almost identical between the monoclinic and trigonal structures. For details see Table 6 as well as Figure 4 and Figure 5. More XRD details see Appendix A.
CCDC 1941426 contains the supplementary crystallographic data for this paper. These data can be obtained free of charge via www.ccdc.cam.ac.uk/data_request/cif or by emailing [email protected], or by contacting The Cambridge Crystallographic Data Centre, 12 Union Road, Cambridge CB2 1EZ, UK; fax: + 44 1223 336033.

4. Discussion

Using NQRS, we have identified a new crystal phase of Tris(2-methoxy-Phenyl)Bismuthine which does not show up after synthesis from a solution but only after solidification from a melt. The new crystallographic structure has been confirmed by XRD. For the newly isolated polymorph crystallizes in the monoclinic space group P2(1)/c (No. 14, a = 14.7365(5), b = 7.9764(3), c = 16.8250(6); α = 90, β = 101.918(2), γ = 90) with only one molecule in the asymmetric unit and consequently only one 5/2-7/2 transition is observed at 88.75 MHz @310 K. In contrast the two transitions at 89.38 and 89.29 MHz for the trigonal polymorph originate from two crystallographically distinct molecules of Tris(2-methoxy-Phenyl)Bismuthine in the asymmetric unit. While the C-Bi distances and C-Bi-C are almost identical between the monoclinic and trigonal structures, the bismuth oxygen distances show slight differences. 1H- and APT-NMR-spectra of samples CS and RM-SFW did not show any differences (shown in Supplementary Materials) and thus the chemical composition and purity of each sample was unambiguously confirmed. All our experiments made so far show that the new phase is stable over long time. Some RM samples which had been prepared already before this study have been stored at room temperature for more than 1 year and do not show any change of the peak frequencies nor of the FWHM. This is in contrast to Triphenyl-Bismuth (BiPh3) which, after shock-freezing in LN, shows such extreme peak broadening that no signal above the noise can be detected any more [26]. This could be a sign for extremely strong crystal defects or maybe even the presence of an amorphous state. This state, however, is extremely unstable at room temperature and leads to the formation of a super-cooled melt after thawing which then starts to crystallize within few minutes. The powder shows a clear, new NQR peak location thus suggesting a new crystal phase. However, in contrast to the RM samples presented here, this phase is metastable and recrystallizes to the original one within hours or at most days, depending on the storage conditions and the sample confinement inside the vessel. Physical stress like breakage of the vessel or grinding immediately leads to a return to the stable phase. In contrast the samples RM remain stable even after grinding with a mortar and do not show any change of the NQR spectra.
Experiment 1 shows that the formation of the new phase does not depend strongly on the dynamics of freezing. Cooling at different speeds leads to the same peak locations. The end products show essentially the same FWHM at the same temperature. Only in the case of very slow cooling (RM-S) in several repetitions of the experiments we observed that no detectable new peak showed up after the first cooling run. In some cases, no peak at all could be detected, and in one case, a pattern very similar to that of CS was observed with slightly changed peak morphology. After re-melting and a second cooling run the new phase usually developed. We also observed that solidification occurred significantly below the original melting point, that is, between 125 and 130 °C. In contrast re-crystallization of the melt at room temperature after taking the tube out of the heater block occurred within few seconds and always led to the new phase.
In the dynamic Experiment 2 RM-SFLN showed an extremely broad peak (>1.8 MHz) 26 min after shock freezing. From this finding we conclude that very fast solidification thanks to the use of a 3 mm tube leads to a very poor crystallization with many defects. The effect is less pronounced than in BiPh3 but clearly noticeable. The peak changes its FWHM even at low temperature, that is, 77 K, in contrast to BiPh3 which does not show any peak formation even during several hours in LN. Obviously the recrystallization process of a melt of Tris(2-methoxy-Phenyl)Bismuthine cannot be prevented by cooling to 77 K. Thawing and subsequent storage at room temperature leads to further narrowing of the peaks, suggesting ongoing recrystallization towards the final state which can be found in all RM samples with slower solidification dynamics. However, during the whole experiment the peak transition frequency remained the same, confirming the prevalence of the new crystal phase.
Experiment 3 yields a smooth temperature dependence of the transition frequency of sample CS site A in the temperature range 153 K and 323 K which could be fitted very well with an established model published by Bayer [33] and Brown et al. [34]. These data do not suggest any further phase transitions in the observed range. Observations beyond this temperature range were not possible with our equipment, because heating above 50 °C is not supported by the probeheads and because the NQR peaks of sample CS are virtually unmeasurable with our wideband probeheads below 150 K due to the strong T2-shortening. Some extension towards lower temperatures could be feasible when further optimizing the pulse protocols, exploring advanced concepts like in Reference [8].
An interpretation of the parameters of the model fitted to the data is beyond the scope of this paper, thus they should not be discussed in detail. However, this model was preferred for data fitting over arbitrary approaches, such as polynomials, because its goodness of fit confirms the consistency of the data with solid physical reasoning.
In Experiment 4 the change of the crystal structure is also reflected by the spin-spin (T2) relaxation time constant. It is well-known that T1 and T2 of a quadrupole nucleus like 209Bi in a molecular crystal is mainly governed by fluctuations of its EFG which can be described by a so-called spectral density J(ω) [27]. Simply speaking, a high spectral density at frequencies ω close to or at a spin transitions frequency has the potential to also lead to short spin relaxation times. In principle, all motions of the molecule and the crystal lattice that are coupled to binding electrons close to the quadrupole nucleus-and thus able to modulate the EFG-can contribute to this spectral density. In particular phonons play an important role in the temperature dependence of T1 relaxation in molecular crystals [36,37]. So, when the crystal lattice is changing to a different polymorphic state, it is also expected that the spin relaxation properties will be altered, even though the molecule is still the same. The results clearly show the impact of an altered environment on the dynamics of spin relaxation in case for T2 (Table 5). We will not attempt to analyse the relaxation times further here, as this requires proper application of relaxation theory [38] which is out of scope of this work.
However, relaxation measurements have given the explanation for another unexpected observation: Most NQR transition measurements by a pulse type spectrometer gain in SNR when cooled down, for example, from room temperature to the temperature of liquid nitrogen (for equal pulse parameters), examples see, for example, [23,27,39]. This is mainly due to three effects: First, the population difference between two energy levels becomes higher due to the Boltzmann distribution. Second, noise of the coil becomes less and, third, the T2 relaxation times usually become longer. The third effect has the consequence, that the transversal magnetization decays slower which means that for spin echoes, the signal will be higher at equal echo times. In sample CS, however, the observation was different—at room temperature, the transitions could be measured quite well, while at 77 K, both signals from site A and site B were not measurable anymore for any transitions. As shown in Figure 3, T2 for sample CS site A becomes shorter for decreasing temperature. From relaxation theory it is known, that J(ω) is temperature dependent due to the temperature dependence of molecular dynamics of the sample. The observed case is not excluded by this theory, as also for decreasing temperature the spectral density can shift in a way so it becomes smaller at the spin transition frequency. However, to our knowledge and experience, this is not observed quite often. In fact, the new phase is well-measurable in LN, thus showing the usually observed ‘normal’ behaviour of better SNR at lower temperatures.
From the XRD viewpoint it is interesting to compare Tris(2-methoxy-Phenyl)Bismuthine to BiPh3 which had been characterized in terms of NQRS in a previous paper [26]. The unit cell parameters of BiPh3 were studied crystallographically as early as 1942 [40]. While the original work claims a triclinic unit cell (space group P 1 ¯ , No. 2, a = 19.43, b = 17.72, c = 11.14; α = 80.15, β = 128.47, γ = 99.97), more recent studies [41,42] report a monoclinic C-centred cell (space group C2/c, No. 15, a = 27.4579(4), b = 5.7104(1,) c = 20.2360(5); α = 90, β = 114.286(2), γ = 90) or the equivalent I-centered cell (space group I2/a, No. 15, a = 26.5617(7), b = 5.7076(1), c = 20.2096(6); α = 90, β = 109.720(3), γ = 90) [43]. In addition, a recent CSD entry (CCDC 1029501) reports a monoclinic primitive polymorph (space group P2(1)/c, No. 14, a = 15.3458(2), b = 11.24205(12), c = 18.4304(2); α = 90, β = 110.6431(14), γ = 90) with two independent molecules in the asymmetric unit. In [26] we observed a 7/2 → 5/2 NQR transition for the monoclinic, C-centred polymorph at 83.5 MHz at room temperature, which is in agreement with known literature data. However, when heated above the melting point followed by shock-freezing in LN we observed a closely spaced NQR double peak at 82,26 and 82,36 MHz, which we ascribe to a hitherto crystallographically uncharacterized second polymorph. Unfortunately, XRD characterization of this compound was impossible due to the quick re-crystallization to the original stable phase.

5. Conclusions

Using NQRS and XRD we have identified a new crystal phase of Tris(2-methoxy-Phenyl)Bismuthine which does not show up after synthesis from a solution but only after solidification from a melt. We can summarize the important data of the newly isolated polymorph as follows:
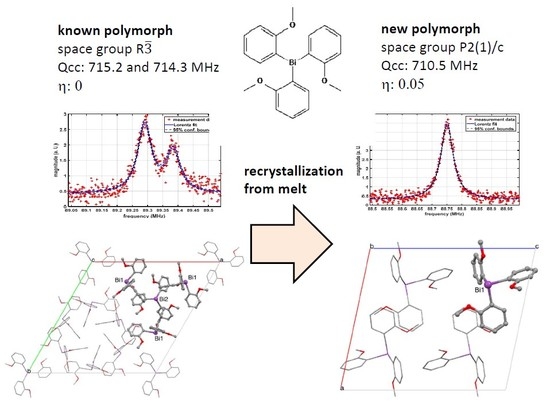
  • Crystallization in the monoclinic space group P2(1)/c with only one molecule Tris(2-Methoxyphenyl)Bismuthine in the asymmetric unit
  • Consequently, only a single 5/2-7/2 transition is observed at 88.75 MHz @310 K in contrast to the two transitions at 89.38 and 89.29 MHz for the trigonal polymorph which contains two crystallographically distinct molecules of Tris(2-methoxy-Phenyl)Bismuthine in the asymmetric unit.
  • The NQR parameters Qcc and η of the new polymorph are 710.5 MHz and 0.05, respectively.
  • Relaxometric data for the T2 time constant show a negative temperature coefficient for the new polymorph in contrast to a positive temperature coefficient (not very typical for the so far investigated Bi-Aryl-compounds [23]) of the reference polymorph in CS. This observation suggests clear differences in molecular dynamics.
  • The NQR data of the new phase does not depend noticeably on the dynamics of freezing. The end products also show essentially the same FWHM at the same temperature, except for extremely fast freezing, which yields extremely broad (FWHM 1.8 MHz) peaks immediately after solidification. In the further time course, the peaks narrow considerably, even during storage at 77 K.
XRD characterization could not be performed for the dynamic experiment because the repetition of the same quick cooling procedure was not possible with standard XRD equipment. In contrast NQRS allowed for quick and simple scanning while thermally manipulating the samples. Thus, NQRS clearly represents a valuable complementary analytic tool for the study of rapid phase changes in polymorphic samples. In turn NQRS does not allow for identifying and assigning lattice parameters.

Supplementary Materials

The following are available online at https://www.mdpi.com/2073-4352/9/9/446/s1, Figure S1: Overlay of obtained 1H-NMR spectra from various sources respectively: (a) CS (b) CS synthesized in the own lab for control and (c) RM-SF; Figure S2: Overlay of APT-NMR spectra from various sources respectively: (a) CS (b) CS synthesized in the own lab for control and (c) RM-SFW.

Author Contributions

Conceptualization, H.S. and C.G.; XRD measurements and data analysis R.F., M.T.; NMR analysis: M.T.; Experiment 1 and data analysis/fitting, H.S.; Experiment 2 and data analysis/fitting: P.K.; Experiment 3 and data analysis/fitting P.K. and F.T.; Experiment 4 and data analysis/fitting (Relaxometry): C.G.; Writing—original draft preparation, H.S., R.F., P.K., M.T., C.G.; writing—review and editing, H.S..; Visualization, all authors.; Supervision, H.S.; Project administration, H.S.; Funding acquisition, H.S.

Funding

This project has received funding from the European Union’s Horizon 2020 research and innovation programme under grant agreement No 665172

Acknowledgments

Supported by TU Graz Open Access Publishing Fund.

Conflicts of Interest

The authors declare no conflict of interest.

Appendix A

Crystallographic Data for Tris(2-Methoxyphenyl)Bismuthine, Space Group P2(1)/c.
Empirical formula C21 H21 Bi O3
CCDC 1941426
Formula weight 530.36
Temperature 100(2) K
Wavelength 0.71073 Å
Crystal system Monoclinic
Space group P2(1)/c
Unit cell dimensionsa = 14.7365(5) Åa = 90°.
b = 7.9764(3) Åb = 101.918(2)°.
c = 16.8250(6) Åg = 90°.
Volume1935.05(12) Å3
Z4
Density (calculated)1.820 Mg/m3
Absorption coefficient9.127 mm−1
F(000)1016
Crystal size0.250 × 0.170 × 0.130 mm3
Theta range for data collection1.412 to 30.000°.
Index ranges−20 ≤ h ≤ 20, −11 ≤ k ≤ 11, −23 ≤ l ≤ 23
Absorption Correctionmulti-scan/ SADABS
Reflections collected57633
Independent reflections5575 [R(int) = 0.0693]
Completeness to theta = 30.000°98.8 %
Refinement methodFull-matrix least-squares on F2
Data / restraints / parameters5575 / 0 / 229
Goodness-of-fit on F21.072
Final R indices [I > 2sigma(I)]R1 = 0.0300, wR2 = 0.0848
R indices (all data)R1 = 0.0343, wR2 = 0.0912
Extinction coefficientn/a
Largest diff. peak and hole1.989 and -3.389 e.Å−3

References

  1. Suits, B.H. Nuclear quadrupole resonance spectroscopy. In Handbook of Applied Solid State Spectroscopy; Vij, D.R., Ed.; Springer: New York, NY, USA, 2006. [Google Scholar]
  2. Das, T.P.; Hahn, E.L. Solid state physics. Supplement 1, nuclear quadrupole resonance spectroscopy. In Solid State Physics, 1st ed.; Academic Press Inc.: Cambridge, MA, USA, 1958; p. 223. [Google Scholar]
  3. Pen’kov, I.N.; Sofin, I.A. Application of nuclear quadrupole resonance in study of minerals. Int. Geol. Rev. 1967, 9, 793–801. [Google Scholar] [CrossRef]
  4. Volkoff, G.M. Second order nuclear quadrupole effects in single crystals: part I. theoretical. Can. J. Phys. 1953, 31, 820–836. [Google Scholar] [CrossRef]
  5. Seliger, J.; Žagar, V.; Asaji, T. NQR investigation and characterization of cocrystals and crystal polymorphs. Hyperfine Interact. 2013, 222, 1–13. [Google Scholar] [CrossRef]
  6. Balchin, E.; Malcolme-Lawes, D.J.; Poplett, I.J.F.; Rowe, M.D.; Smith, J.A.S.; Pearce, G.E.S.; Wren, S.A.C. Potential of nuclear quadrupole resonance in pharmaceutical analysis. Anal. Chem. 2015, 77, 3925–3930. [Google Scholar]
  7. Latosinńska, J.N. Applications of nuclear quadrupole resonance spectroscopy in drug development. Expert Opin. Drug Discov. 2007, 2, 225–248. [Google Scholar] [CrossRef]
  8. Barras, J.; Althoefer, K.; Rowe, M.D.; Poplett, I.J.; Smith, J.A.S. The Emerging Field of Medicines Authentication by Nuclear Quadrupole Resonance Spectroscopy. Appl. Magn. Reson. 2012, 43, 511–529. [Google Scholar] [CrossRef]
  9. Somasundaram, S.D.; Jakobsson, A.; Rowe, M.D.; Smith, J.A.S.; Butt, N.R.; Althoefer, K. Robust detection of stochastic nuclear quadrupole resonance signals. IEEE Trans. Signal Process. 2008, 56, 4221–4229. [Google Scholar] [CrossRef]
  10. Pérez, S.C.; Cerioni, L.; Wolfenson, A.E.; Faudone, S.; Cuffini, L.S. Utilization of pure nuclear quadrupole resonance spectroscopy for the study of pharmaceutical crystal forms. Int. J. Pharm. 2005, 298, 143–152. [Google Scholar] [CrossRef]
  11. Tate, E.; Althoefer, K.; Barras, J.; Rowe, M.D.; Smith, J.A.; Pearce, G.E.; Wren, S.A. Quantitative 35Cl nuclear quadrupole resonance in tablets of the antidiabetic medicine diabinese. Anal. Chem. 2009, 81, 5574–5576. [Google Scholar] [CrossRef]
  12. Limandri, S.; Visñovezky, C.; Pérez, S.C.; Schurrer, C.A.; Wolfenson, A.E.; Ferro, M.; Cuffini, S.L.; de Souza, J.G.; Aguiar, F.A.; de Gaitani, C.M. Nuclear quadrupole resonance: A technique to control hydration processes in the pharmaceutical industry. Anal. Chem. 2011, 83, 1773–1776. [Google Scholar] [CrossRef]
  13. Nolte, M.; Privalov, A.; Altmann, J.; Anferov, V.; Fujara, F. 1H-14N cross-relaxation in trinitrotoluene-a step toward improved landmine detection. J. Phys. D Appl. Phys. 2002, 35, 939–942. [Google Scholar] [CrossRef]
  14. Rudakov, T.N.; Mikhaltsevich, V.T.; Selchikhin, O.P. The use of multi-pulse nuclear quadrupole resonance techniques for the detection of explosives containing RDX. J. Phys. D Appl. Phys. 1997, 30, 1377–1382. [Google Scholar] [CrossRef]
  15. Blinc, R.; Apih, T.; Seliger, J. Nuclear quadrupole double resonance techniques for the detection of explosives and drugs. Appl. Magn. Reson. 2004, 25, 523–534. [Google Scholar] [CrossRef]
  16. Bastow, T.J.; Lehmann-Horn, J.A.; Miljak, D.G. 121,123Sb and 75As {NMR} and {NQR} investigation of the tetrahedrite ({Cu}12Sb4S13)–{Tennantite} ({Cu}12As4S13) system and other metal arsenides. Solid State Nucl. Magn. Reson. 2015, 71, 55–60. [Google Scholar] [CrossRef]
  17. Bastow, T.J.; Whitfield, H.J. Crystal data and nuclear quadrupole resonance spectra of tetra-arsenic triselenide. J. Chem. Soc. Dalt. Trans. 1977, 10, 959–961. [Google Scholar] [CrossRef]
  18. Lehmann-Horn, J.A.; Miljak, D.G.; O’Dell, L.A.; Yong, R.; Bastow, T.J. Rapid detection of arsenic minerals using portable broadband NQR. Geophys. Res. Lett. 2014, 41, 6765–6771. [Google Scholar] [CrossRef] [Green Version]
  19. Whitfield, H.J. Polymorphism in skinnerite, Cu3SbS3. Solid State Commun. 1980, 33, 747–748. [Google Scholar] [CrossRef]
  20. Bastow, T.J.; Smith, M.E. 91 Zr NMR characterisation of phases in transformation toughened zirconia. Solid State Nucl. Magn. Reson. 1992, 1, 165–174. [Google Scholar] [CrossRef]
  21. Armstrong, R.L. Pure nuclear quadrupole resonance studies of structural phase transitions. J. Magn. Reson. 1975, 20, 214–231. [Google Scholar] [CrossRef]
  22. Panich, A.M.; Zemnukhova, L.A.; Davidovich, R.L. Nuclear quadrupole resonance study of phase transitions and incommensurability in K2SbF5. J. Phys. Condens. Matter. 2001, 13, 1609–1616. [Google Scholar] [CrossRef]
  23. Gösweiner, C.; Lantto, P.; Fischer, R.; Sampl, C.; Umut, E.; Westlund, P.; Kruk, D.; Bödenler, M.; Spirk, S.; Petrovič, A.; et al. Tuning Nuclear Quadrupole Resonance: A Novel Approach for the Design of Frequency-Selective MRI Contrast Agents. Phys. Rev. X 2018, 8, 021076. [Google Scholar] [CrossRef]
  24. Kruk, D.; Umut, E.; Masiewicz, E.; Sampl, C.; Fischer, R.; Spirk, S.; Goesweinerc, C.; Scharfetterc, H. 209 Bi quadrupole relaxation enhancement in solids as a step towards new contrast mechanisms in magnetic resonance imaging. Phys. Chem. Chem. Phys. 2018, 20, 12710–12718. [Google Scholar] [CrossRef] [PubMed]
  25. Kruk, D.; Masiewicz, E.; Umut, E.; Petrovic, A.; Kargl, R.; Scharfetter, H. Estimation of the magnitude of quadrupole relaxation enhancement in the context of magnetic resonance imaging contrast. J. Chem. Phys. 2019, 150, 184306. [Google Scholar] [CrossRef] [PubMed]
  26. Scharfetter, H.; Gösweiner, C.; Krassnig, P.J.; Sampl, C.; Thonhofer, M.; Fischer, R.; Spirk, S.; Kargl, R.; Stana-Kleinschek, K.; Umut, E.; et al. Aspects of structural order in 209 Bi-containing particles for potential MRI contrast agents based on quadrupole enhanced relaxation. Mol. Phys. 2019, 117, 935–943. [Google Scholar] [CrossRef]
  27. Woessner, D.E.; Gutowsky, H.S. Nuclear pure quadrupole relaxation and its temperature dependence in solids. J. Chem. Phys. 1963, 39, 440–456. [Google Scholar] [CrossRef]
  28. Scharfetter, H.; Bödenler, M.; Narnhofer, D. A cryostatic, fast scanning, wideband {NQR} spectrometer for the {VHF} range. J. Magn. Reson. 2018, 286, 148–157. [Google Scholar] [CrossRef]
  29. Blessing, R.H. An empirical correction for absorption anisotropy. Acta Crystallogr. Sect. A 1995, A51, 33–38. [Google Scholar] [CrossRef] [PubMed]
  30. Keng, T.C.; Lo, K.M.; Ng, S.W. SADABS. University of Göttingen: Göttingen, Germany, 2001. [Google Scholar]
  31. Sheldrick, G.M. A short history of SHELX. Acta Cryst. A 2008, 64, 112–122. [Google Scholar] [CrossRef]
  32. Spek, A.L. Single-crystal structure validation with the program PLATON. J. Appl. Crystallogr. 2003, 36, 7–13. [Google Scholar] [CrossRef]
  33. Bayer, H. Zur Theorie der Spin-Gitterrelaxation in Molekülkristallen. Z. Physik. 1951, 130, 227–238. [Google Scholar] [CrossRef]
  34. Brown, R.J.C. Temperature dependence of quadrupole resonance frequencies under constant pressure. J. Chem. Phys. 1960, 32, 116. [Google Scholar] [CrossRef]
  35. Schuster, O.; Schier, A.; Schmidbaur, H. The quest for complexes with a coordinative gold-bismuth bond. Organometallics 2003, 22, 4079–4083. [Google Scholar] [CrossRef]
  36. Van Kranendonk, J. Trolanheory of quadrupolar nuclear spin-lattice relaxation. Physica 1954, 20, 781–800. [Google Scholar] [CrossRef]
  37. Van Kranendonk, J.; Walker, M. Theory of quadrupolar nuclear spin-lattice relaxation due to anharmonic Raman phonon processes. Phys. Rev. Lett. 1967, 18, 701–703. [Google Scholar] [CrossRef]
  38. Kruk, D.; Goesweiner, C.; Masiewicz, E.; Umut, E.; Sampl, C.; Scharfetter, H. Model-free approach to quadrupole spin relaxation in solid 209Bi-aryl compounds. Phys. Chem. Chem. Phys. 2018, 20, 23414–23423. [Google Scholar] [CrossRef] [PubMed]
  39. Pirnat, J.; Lužnik, J.; Jazbinšek, V.; Žagar, V.; Seliger, J.; Klapötke, T.M.; Trontelj, Z. 14N NQR in the tetrazole family. Chem. Phys. 2009, 364, 98–104. [Google Scholar] [CrossRef]
  40. Wetzel, J. D 15. Kristallstrukturuntersuchungen an den Triphenylen des Wismuts, Arsens und Antimons. Z. Krist. Cryst. Mater. 1942, 104, 305–347. [Google Scholar] [CrossRef]
  41. Hawley, D.M.; Ferguson, G. The stereochemistry of some organic derivatives of Group VB elements. The crystal and molecular structure of triphenylbismuth.The crystal and molecular structure of triphenylbismuth. J. Chem. Soc. A Inorganic Phys. Theor. 1968. [Google Scholar] [CrossRef]
  42. Jones, P.G.; Blaschette, A.; Henschel, D.; Weitze, A. Redetermination of the crystal structure of triphenylbismuth, (C6H5)3Bi. Z. Krist. New Cryst. Struct. 1995, 210, 377–378. [Google Scholar] [CrossRef]
  43. Bučinský, L.; Jayatilaka, D.; Grabowsky, S. Importance of relativistic effects and electron correlation in structure factors and electron density of diphenyl mercury and triphenyl bismuth. J. Phys. Chem. A 2016, 120, 6650–6669. [Google Scholar] [CrossRef]
Figure 1. (a) Nuclear Quadrupole Resonance (NQR) Spectrum of sample CS, transition 7/2 → 5/2 @310 K, raw data and double Lorentz fit; (b) NQR Spectrum of sample RM-SFW, transition 7/2 → 5/2 @310 K, raw data and Lorentz fit.
Crystals 09 00446 g001
Figure 2. Temperature dependence of the transition frequency for sample CS, site A.
Crystals 09 00446 g002
Figure 3. Temperature dependence of the spin-spin relaxation time constant T2 for transition 7/2 → 5/2 of sample CS, site A. The dashed line serves as a guide to the eye.
Crystals 09 00446 g003
Figure 4. Packing of Tris(2-Methoxyphenyl)Bismuthine, in the solid state, (left): space group P2(1)/c, viewed along b-axis, one independent molecule per asymmetric unit, (right): space group R 3 ¯ , viewed along c-axis, two independent molecules per asymmetric unit, Bi2 is located on threefold axis.
Crystals 09 00446 g004
Figure 5. Solid state structure of Tris(2-Methoxyphenyl)Bismuthine, space group P2(1)/c. Hydrogen atoms omitted for clarity, ellipsoids at 50% probability level, distances in Å, angles in deg. Bi1-C1 2.247(3), Bi1-C8 2.250(2), Bi1-C15 2.251(4), Bi1-O1 3.106(5), Bi1-O2 3.059(5), Bi1-O3 3.140(5), C1-Bi1-C8 95.8(1), C8-Bi1-C15 93.4(1), C1-Bi1-C15 93.1(1).
Crystals 09 00446 g005
Table 1. Transition frequencies of the transition 7/2 → 5/2.
Temperature (K)CSRM-SFLNRM-SFWRM-S
310Site A: 89.384
Site B: 89.290
88.75488.75188.759
77not measurable90.71390.71090.704
Table 2. Full width at half maximum (FWHM) data (kHz) of the peaks in Table 1.
Temperature (K)CSRM-SFLNRM-SFWRM-S
310Site A: 55.3
Site B: 55.6
not measurable (poor SNR)50.151.2
77not measurable264107.1104.2
Table 3. Time evolution of FWHM data (kHz) of sample RM-SFLN.
Time (min)2646891098
FWHM (kHz)1844808375264
95% conf. bounds(826, 2863)(189, 1427)(219, 530)(195, 333)
Table 4. Parameters of the Bayer`s model and calculated g-parameter by Brown’s method.
ParameterAfT,0vQ3g@T0
10−48 kg m2THzMHz1/K
42.40615.84291.44018.12 × 10−4
Table 5. Spin-spin relaxation time constants T2 of transitions from Table 1 at 310 K.
TitleCS
Site A
CS
Site B
RM-SFW
T2 @Transition
7/2 → 5/2 (μs)
31567197
Table 6. Comparison of structural parameters for the polymorphs of Tris(2-Methoxyphenyl)Bismuthine.
Space GroupP2(1)/c
This work
R 3 ¯
Reference
Site A [35]
R 3 ¯
Reference
Site B [35]
Distances [Å]Bi1-C12.247(3)Bi1-C12.250(7)Bi2-C222.248(7)
Bi1-C82.250(2)Bi1-C82.268(8)
Bi1-C152.251(4)Bi1-C152.260(10)
Bi1-O13.106(5)Bi1-O13.079(9)Bi2-O43.097(9)
Bi1-O23.059(5)Bi1-O23.117(9)
Bi1-O33.140(5)Bi1-O33.103(8)
Angles [°]C1-Bi1-C895.8(1)C1-Bi1-C894.7(3)C22-Bi-C22A93.5(4)
C8-Bi1-C1593.4(1)C8-Bi1-C1595.3(3)
C1-Bi1-C1593.1(1)C1-Bi1-C1592.6(3)

